IAB & DDMA REPORT ON PAID SEARCH ADVERTISING...iab & ddma report on paid search advertising 4 Paid...
24
February 2017 IAB & DDMA REPORT ON PAID SEARCH ADVERTISING THE NETHERLANDS 2015-2016
Transcript of IAB & DDMA REPORT ON PAID SEARCH ADVERTISING...iab & ddma report on paid search advertising 4 Paid...
February 2017
IAB & DDMA REPORT ON PAID SEARCH ADVERTISING THE NETHERLANDS 2015-2016

© 2017 Deloitte The Netherlands
The following companies have participated in this study
Research members
IAB & DDMA REPORT ON PAID SEARCH ADVERTISING
© 2017 Deloitte The Netherlands
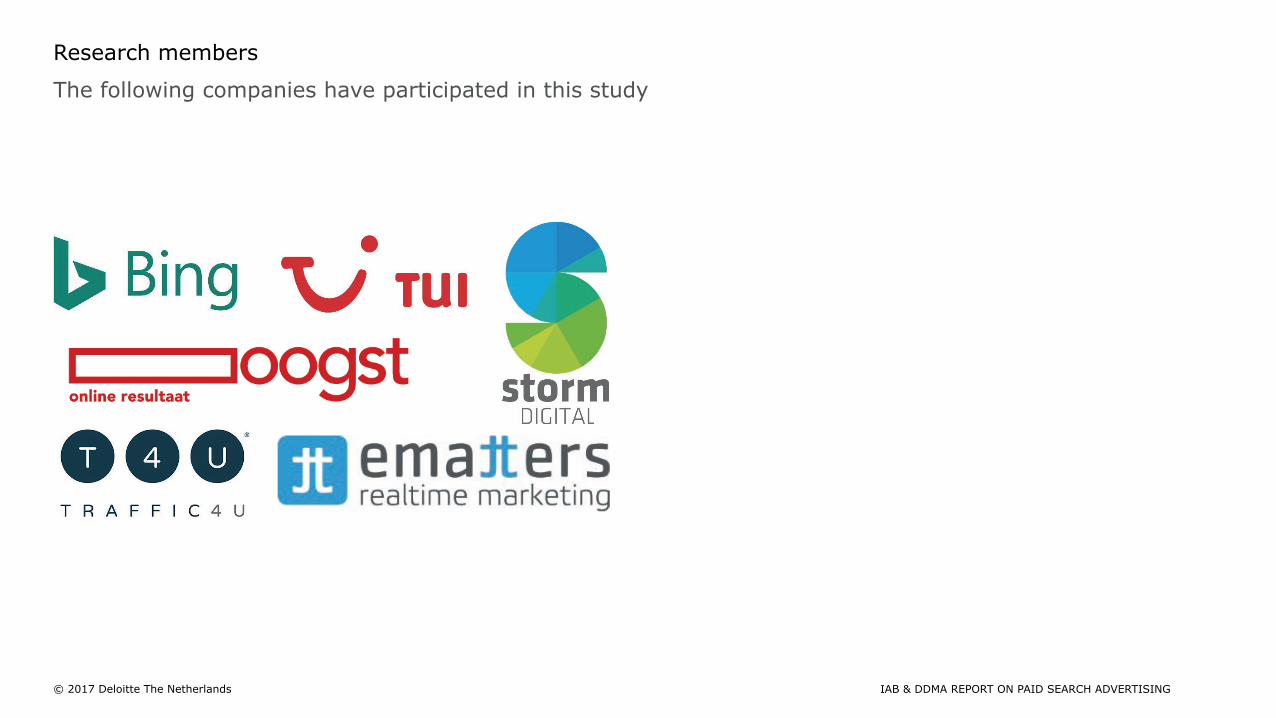
IAB and DDMA Report on Paid Search Advertising
Introduction
3 IAB & DDMA REPORT ON PAID SEARCH ADVERTISING
“You have in your hands the third edition of the Dutch National Search Study from IAB Netherlands and DDMA. The ambition of this study was to arm agencies and advertisers with the insights they need to make strategic decisions. We are blessed to be able to call upon so many experts in our region to share their learnings and experience, and give you a unique overview of the Dutch search market. We will cover a broad range of topics, including vertical trends of the last two years, key differences between the leading search engines Google and Bing, trends for desktop and mobile devices, branded and generic keyword trends, and the impact of new ad formats such as shopping ads across different networks. As the project lead, I am delighted with what we have collectively achieved in this study. This research would not have been possible without the determination and enthusiasm of the participating companies, and the assistance of IAB Taskforce member Bart Santing and Taskforce chairman Justus Wever, who ensured the highest standards of quality. I can say with confidence, that I’m looking forward to future editions of this study and the insights it will reveal. In a market where voice search and personal assistants like Cortana (Microsoft), Now (Google) and Siri (Apple) will likely change the landscape and continue to force us, marketers, to transform the way we think, plan and execute.” Roland van der Walle IAB Search Taskforce
Nathalie La Verge Deloitte “In recent studies published by IAB Netherlands, like the digital marketing innovation study, Search claims its position within the digital marketing ecosystem and continues to be on top of marketers’ agendas. With the amount of raw data we received from the participants of this study, we were able to extract detailed insights on search developments in the three sectors retail, travel and finance.”
Justus Wever Chairman Search Taskforce IAB Netherlands “The investments in search continue to grow and they probably will for a while. So is the amount of data that is being collected from all those investments. As one of the most mature online marketing channels there’s an opportunity to make more responsible use of that data. An opportunity to surprise customers with an experience that they can appreciate and share the data and learnings with other channels.”
Jaime Infante Ferreira DDMA Search Council “Last year was a year to remember in search. Some major changes in the appearance of the search advertising playground caused different insights compared to last year Marketers need to keep up with new developments in search and increase their knowledge. The aim of the DDMA Search Council is to help marketers to stay up-to-date in Search marketing. Independent research on Dutch search advertising provides useful strategic information.”
© 2017 Deloitte The Netherlands
Executive summary
4 IAB & DDMA REPORT ON PAID SEARCH ADVERTISING
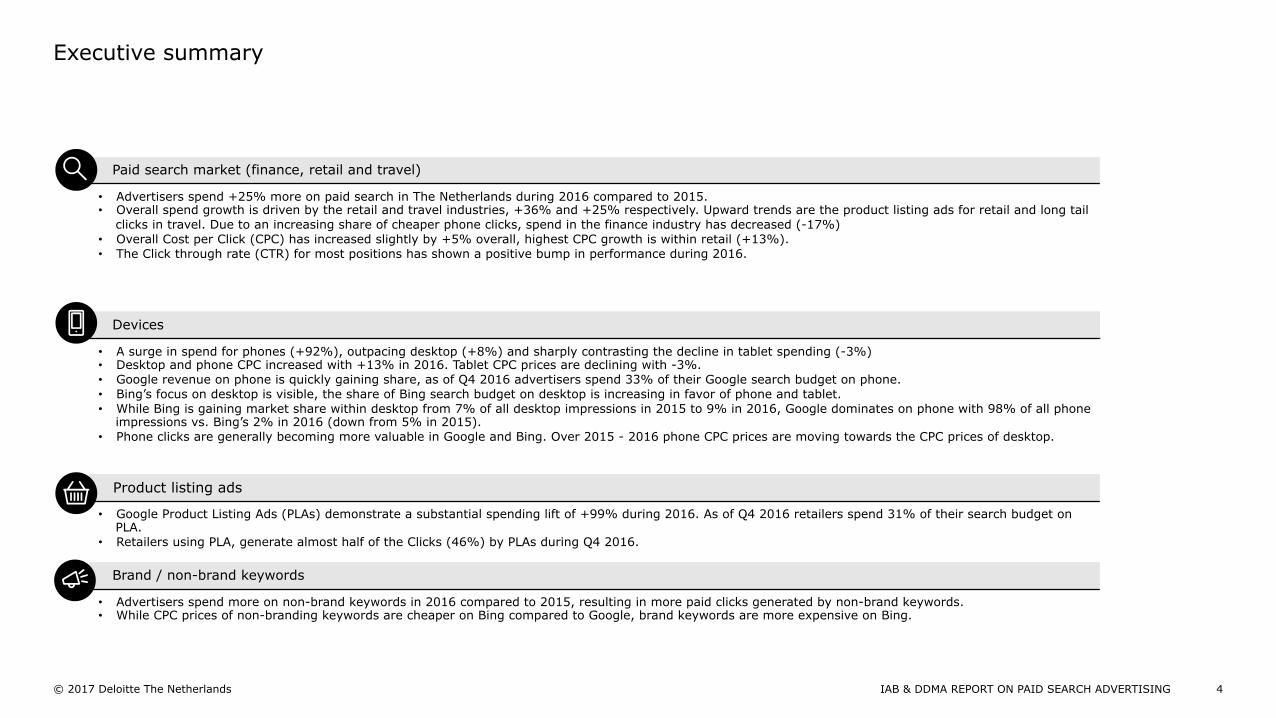
Paid search market (finance, retail and travel)
• Advertisers spend +25% more on paid search in The Netherlands during 2016 compared to 2015. • Overall spend growth is driven by the retail and travel industries, +36% and +25% respectively. Upward trends are the product listing ads for retail and long tail
clicks in travel. Due to an increasing share of cheaper phone clicks, spend in the finance industry has decreased (-17%) • Overall Cost per Click (CPC) has increased slightly by +5% overall, highest CPC growth is within retail (+13%). • The Click through rate (CTR) for most positions has shown a positive bump in performance during 2016.
Devices
• A surge in spend for phones (+92%), outpacing desktop (+8%) and sharply contrasting the decline in tablet spending (-3%) • Desktop and phone CPC increased with +13% in 2016. Tablet CPC prices are declining with -3%. • Google revenue on phone is quickly gaining share, as of Q4 2016 advertisers spend 33% of their Google search budget on phone. • Bing’s focus on desktop is visible, the share of Bing search budget on desktop is increasing in favor of phone and tablet. • While Bing is gaining market share within desktop from 7% of all desktop impressions in 2015 to 9% in 2016, Google dominates on phone with 98% of all phone
impressions vs. Bing’s 2% in 2016 (down from 5% in 2015). • Phone clicks are generally becoming more valuable in Google and Bing. Over 2015 - 2016 phone CPC prices are moving towards the CPC prices of desktop.
Product listing ads
• Google Product Listing Ads (PLAs) demonstrate a substantial spending lift of +99% during 2016. As of Q4 2016 retailers spend 31% of their search budget on PLA.
• Retailers using PLA, generate almost half of the Clicks (46%) by PLAs during Q4 2016.
Brand / non-brand keywords
• Advertisers spend more on non-brand keywords in 2016 compared to 2015, resulting in more paid clicks generated by non-brand keywords. • While CPC prices of non-branding keywords are cheaper on Bing compared to Google, brand keywords are more expensive on Bing.
© 2017 Deloitte The Netherlands
Paid Search in the Netherlands "Taking the Dutch market to the next level should be top of mind for the Dutch marketer. More spend, changing devices and changing consumer behavior. These elements are all part of a growing Dutch Market. In such a rapid changing environment as search, insights and data are invaluable.“ Bas van den Beld | Speaker & Online Marketing Strategist
5 IAB & DDMA REPORT ON PAID SEARCH ADVERTISING
© 2017 Deloitte The Netherlands
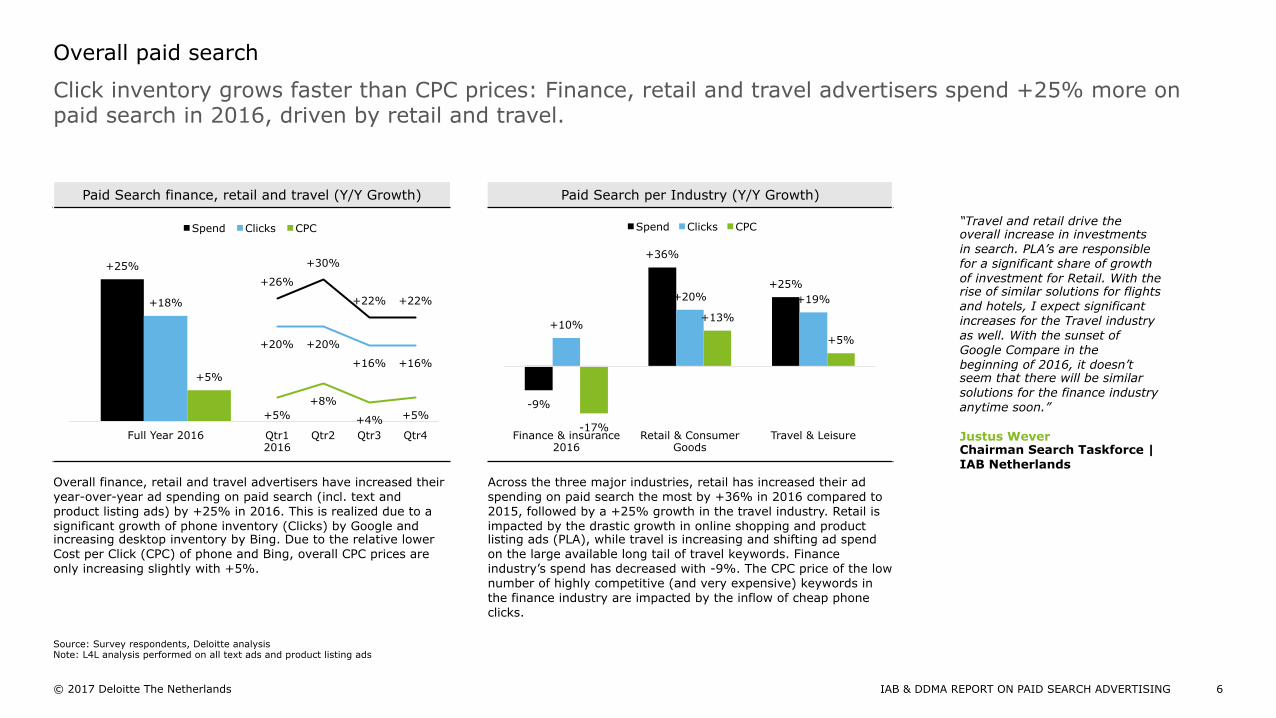
Paid Search finance, retail and travel (Y/Y Growth) Paid Search per Industry (Y/Y Growth)
Overall finance, retail and travel advertisers have increased their year-over-year ad spending on paid search (incl. text and product listing ads) by +25% in 2016. This is realized due to a significant growth of phone inventory (Clicks) by Google and increasing desktop inventory by Bing. Due to the relative lower Cost per Click (CPC) of phone and Bing, overall CPC prices are only increasing slightly with +5%.
Across the three major industries, retail has increased their ad spending on paid search the most by +36% in 2016 compared to 2015, followed by a +25% growth in the travel industry. Retail is impacted by the drastic growth in online shopping and product listing ads (PLA), while travel is increasing and shifting ad spend on the large available long tail of travel keywords. Finance industry’s spend has decreased with -9%. The CPC price of the low number of highly competitive (and very expensive) keywords in the finance industry are impacted by the inflow of cheap phone clicks.
+25%
+18%
+5%
Full Year 2016
Spend Clicks CPC
Click inventory grows faster than CPC prices: Finance, retail and travel advertisers spend +25% more on paid search in 2016, driven by retail and travel.
Overall paid search
6 IAB & DDMA REPORT ON PAID SEARCH ADVERTISING
-9%
+36%
+25%
+10%
+20% +19%
-17%
+13%
+5%
Finance & insurance 2016
Retail & Consumer Goods
Travel & Leisure
Spend Clicks CPC “Travel and retail drive the overall increase in investments in search. PLA’s are responsible for a significant share of growth of investment for Retail. With the rise of similar solutions for flights and hotels, I expect significant increases for the Travel industry as well. With the sunset of Google Compare in the beginning of 2016, it doesn’t seem that there will be similar solutions for the finance industry anytime soon.” Justus Wever Chairman Search Taskforce | IAB Netherlands
+26%
+30%
+22% +22%
+20% +20%
+16% +16%
+5% +8%
+4% +5%
Qtr1 2016
Qtr2
Qtr3
Qtr4
Source: Survey respondents, Deloitte analysis Note: L4L analysis performed on all text ads and product listing ads
© 2017 Deloitte The Netherlands
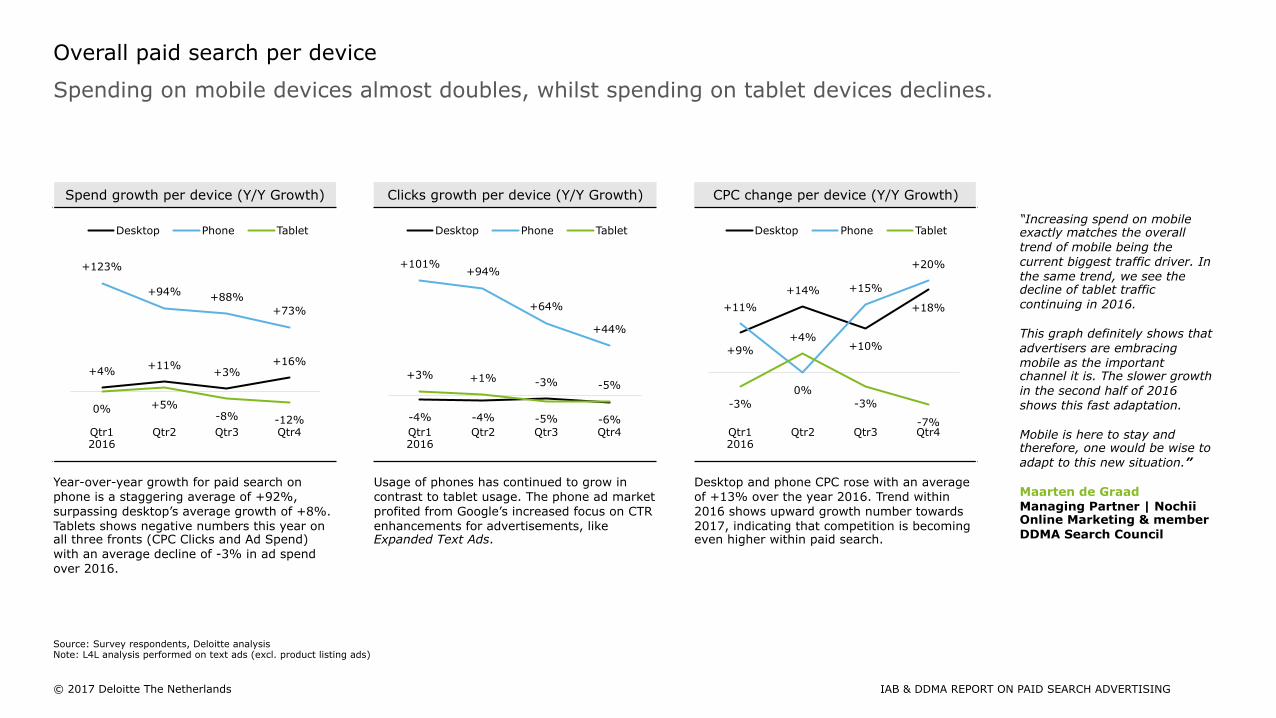
Spending on mobile devices almost doubles, whilst spending on tablet devices declines.
Overall paid search per device
Spend growth per device (Y/Y Growth) Clicks growth per device (Y/Y Growth) CPC change per device (Y/Y Growth)
Year-over-year growth for paid search on phone is a staggering average of +92%, surpassing desktop’s average growth of +8%. Tablets shows negative numbers this year on all three fronts (CPC Clicks and Ad Spend) with an average decline of -3% in ad spend over 2016.
Usage of phones has continued to grow in contrast to tablet usage. The phone ad market profited from Google’s increased focus on CTR enhancements for advertisements, like Expanded Text Ads.
Desktop and phone CPC rose with an average of +13% over the year 2016. Trend within 2016 shows upward growth number towards 2017, indicating that competition is becoming even higher within paid search.
+4% +11% +3% +16%
+123%
+94% +88% +73%
0% +5% -8% -12%
Qtr1 2016
Qtr2
Qtr3
Qtr4
Desktop Phone Tablet
-4% -4%
-3%
-6%
+101% +94%
+64%
+44%
+3% +1%
-5%
-5%
Qtr1 2016
Qtr2
Qtr3
Qtr4
Desktop Phone Tablet
+9%
+14%
+10%
+18% +11%
0%
+15%
+20%
-3%
+4%
-3%
-7% Qtr1 2016
Qtr2
Qtr3
Qtr4
Desktop Phone Tablet “Increasing spend on mobile exactly matches the overall trend of mobile being the current biggest traffic driver. In the same trend, we see the decline of tablet traffic continuing in 2016. This graph definitely shows that advertisers are embracing mobile as the important channel it is. The slower growth in the second half of 2016 shows this fast adaptation. Mobile is here to stay and therefore, one would be wise to adapt to this new situation.” Maarten de Graad Managing Partner | Nochii Online Marketing & member DDMA Search Council
IAB & DDMA REPORT ON PAID SEARCH ADVERTISING
Source: Survey respondents, Deloitte analysis Note: L4L analysis performed on text ads (excl. product listing ads)
© 2017 Deloitte The Netherlands
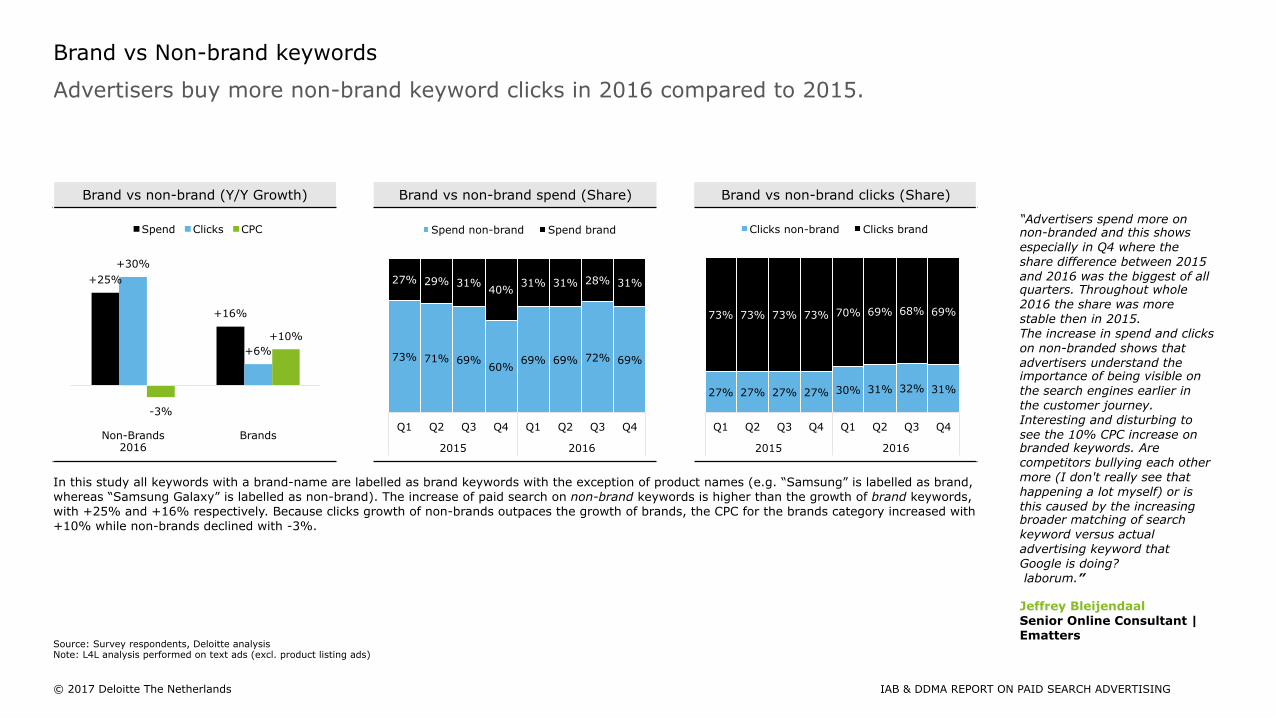
Advertisers buy more non-brand keyword clicks in 2016 compared to 2015.
Brand vs Non-brand keywords
Brand vs non-brand (Y/Y Growth) Brand vs non-brand spend (Share) Brand vs non-brand clicks (Share)
In this study all keywords with a brand-name are labelled as brand keywords with the exception of product names (e.g. “Samsung” is labelled as brand, whereas “Samsung Galaxy” is labelled as non-brand). The increase of paid search on non-brand keywords is higher than the growth of brand keywords, with +25% and +16% respectively. Because clicks growth of non-brands outpaces the growth of brands, the CPC for the brands category increased with +10% while non-brands declined with -3%.
“Advertisers spend more on non-branded and this shows especially in Q4 where the share difference between 2015 and 2016 was the biggest of all quarters. Throughout whole 2016 the share was more stable then in 2015. The increase in spend and clicks on non-branded shows that advertisers understand the importance of being visible on the search engines earlier in the customer journey. Interesting and disturbing to see the 10% CPC increase on branded keywords. Are competitors bullying each other more (I don't really see that happening a lot myself) or is this caused by the increasing broader matching of search keyword versus actual advertising keyword that Google is doing? laborum.” Jeffrey Bleijendaal Senior Online Consultant | Ematters
+25%
+16%
+30%
+6%
-3%
+10%
Non-Brands 2016
Brands
Spend Clicks CPC
27% 27% 27% 27% 30% 31% 32% 31%
73% 73% 73% 73% 70% 69% 68% 69%
Q1 Q2 Q3 Q4 Q1 Q2 Q3 Q4
2015 2016
Clicks non-brand Clicks brand
73% 71% 69% 60%
69% 69% 72% 69%
27% 29% 31% 40%
31% 31% 28% 31%
Q1 Q2 Q3 Q4 Q1 Q2 Q3 Q4
2015 2016
Spend non-brand Spend brand
IAB & DDMA REPORT ON PAID SEARCH ADVERTISING
Source: Survey respondents, Deloitte analysis Note: L4L analysis performed on text ads (excl. product listing ads)
© 2017 Deloitte The Netherlands
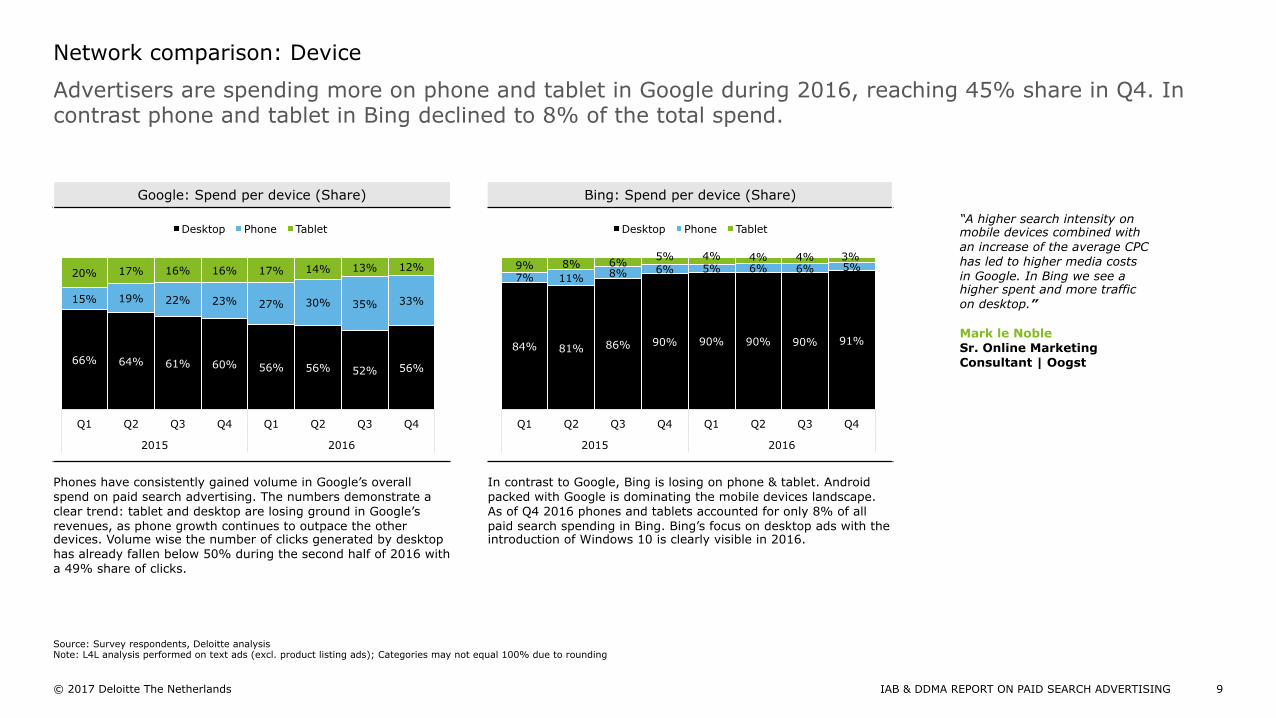
Google: Spend per device (Share) Bing: Spend per device (Share)
Phones have consistently gained volume in Google’s overall spend on paid search advertising. The numbers demonstrate a clear trend: tablet and desktop are losing ground in Google’s revenues, as phone growth continues to outpace the other devices. Volume wise the number of clicks generated by desktop has already fallen below 50% during the second half of 2016 with a 49% share of clicks.
In contrast to Google, Bing is losing on phone & tablet. Android packed with Google is dominating the mobile devices landscape. As of Q4 2016 phones and tablets accounted for only 8% of all paid search spending in Bing. Bing’s focus on desktop ads with the introduction of Windows 10 is clearly visible in 2016.
Advertisers are spending more on phone and tablet in Google during 2016, reaching 45% share in Q4. In contrast phone and tablet in Bing declined to 8% of the total spend.
Network comparison: Device
9 IAB & DDMA REPORT ON PAID SEARCH ADVERTISING
“A higher search intensity on mobile devices combined with an increase of the average CPC has led to higher media costs in Google. In Bing we see a higher spent and more traffic on desktop.” Mark le Noble Sr. Online Marketing Consultant | Oogst 66% 64% 61% 60% 56% 56% 52% 56%
15% 19% 22% 23% 27% 30% 35% 33%
20% 17% 16% 16% 17% 14% 13% 12%
Q1 Q2 Q3 Q4 Q1 Q2 Q3 Q4
2015 2016
Desktop Phone Tablet
84% 81% 86% 90% 90% 90% 90% 91%
7% 11% 8% 6% 5% 6% 6% 5% 9% 8% 6% 5% 4% 4% 4% 3%
Q1 Q2 Q3 Q4 Q1 Q2 Q3 Q4
2015 2016
Desktop Phone Tablet
Source: Survey respondents, Deloitte analysis Note: L4L analysis performed on text ads (excl. product listing ads); Categories may not equal 100% due to rounding
© 2017 Deloitte The Netherlands
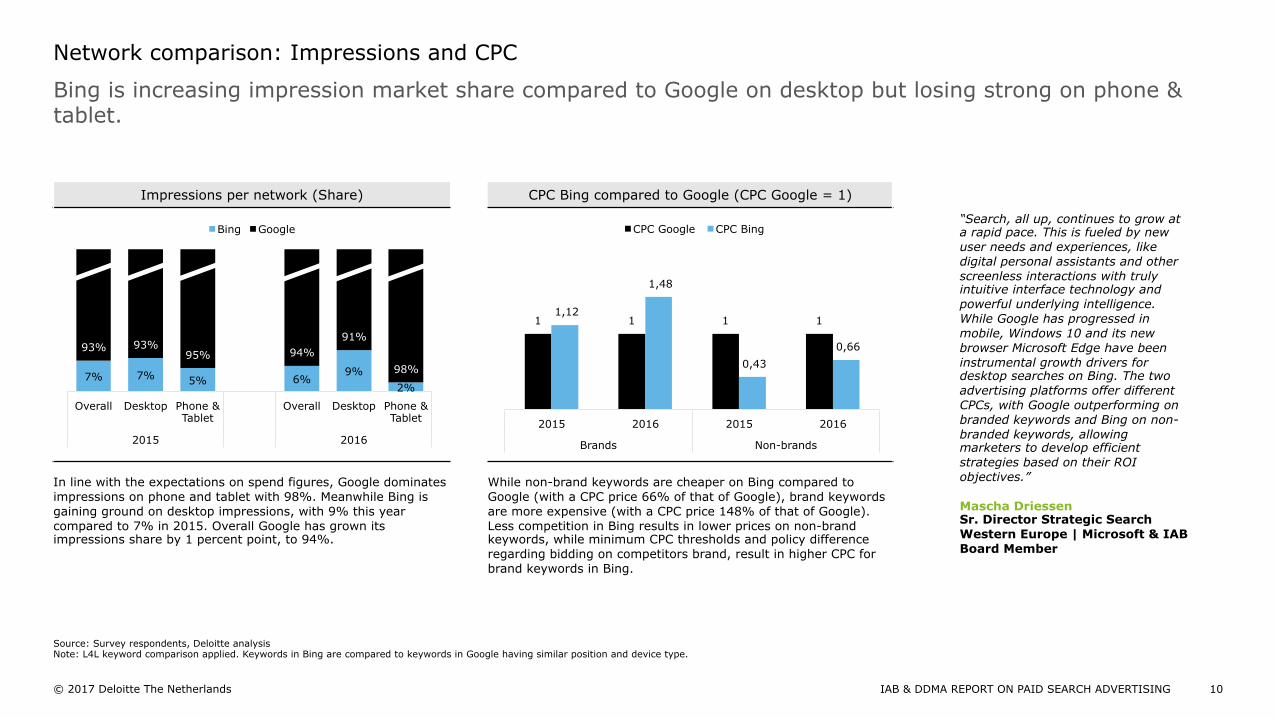
Impressions per network (Share) CPC Bing compared to Google (CPC Google = 1)
In line with the expectations on spend figures, Google dominates impressions on phone and tablet with 98%. Meanwhile Bing is gaining ground on desktop impressions, with 9% this year compared to 7% in 2015. Overall Google has grown its impressions share by 1 percent point, to 94%.
While non-brand keywords are cheaper on Bing compared to Google (with a CPC price 66% of that of Google), brand keywords are more expensive (with a CPC price 148% of that of Google). Less competition in Bing results in lower prices on non-brand keywords, while minimum CPC thresholds and policy difference regarding bidding on competitors brand, result in higher CPC for brand keywords in Bing.
Bing is increasing impression market share compared to Google on desktop but losing strong on phone & tablet.
Network comparison: Impressions and CPC
10 IAB & DDMA REPORT ON PAID SEARCH ADVERTISING
“Search, all up, continues to grow at a rapid pace. This is fueled by new user needs and experiences, like digital personal assistants and other screenless interactions with truly intuitive interface technology and powerful underlying intelligence. While Google has progressed in mobile, Windows 10 and its new browser Microsoft Edge have been instrumental growth drivers for desktop searches on Bing. The two advertising platforms offer different CPCs, with Google outperforming on branded keywords and Bing on non-branded keywords, allowing marketers to develop efficient strategies based on their ROI objectives.” Mascha Driessen Sr. Director Strategic Search Western Europe | Microsoft & IAB Board Member
7% 7% 5% 6% 9%
2%
93% 93% 95% 94%
91%
98%
Overall Desktop Phone & Tablet
Overall Desktop Phone & Tablet
2015 2016
Bing Google
1 1 1 1 1,12
1,48
0,43 0,66
2015 2016 2015 2016
Brands Non-brands
CPC Google CPC Bing
Source: Survey respondents, Deloitte analysis Note: L4L keyword comparison applied. Keywords in Bing are compared to keywords in Google having similar position and device type.
© 2017 Deloitte The Netherlands
Paid Search: Google
11 IAB & DDMA REPORT ON PAID SEARCH ADVERTISING
© 2017 Deloitte The Netherlands
Product listing ads growth (Y/Y Growth) Search budget spent on PLA by retailers (Share)
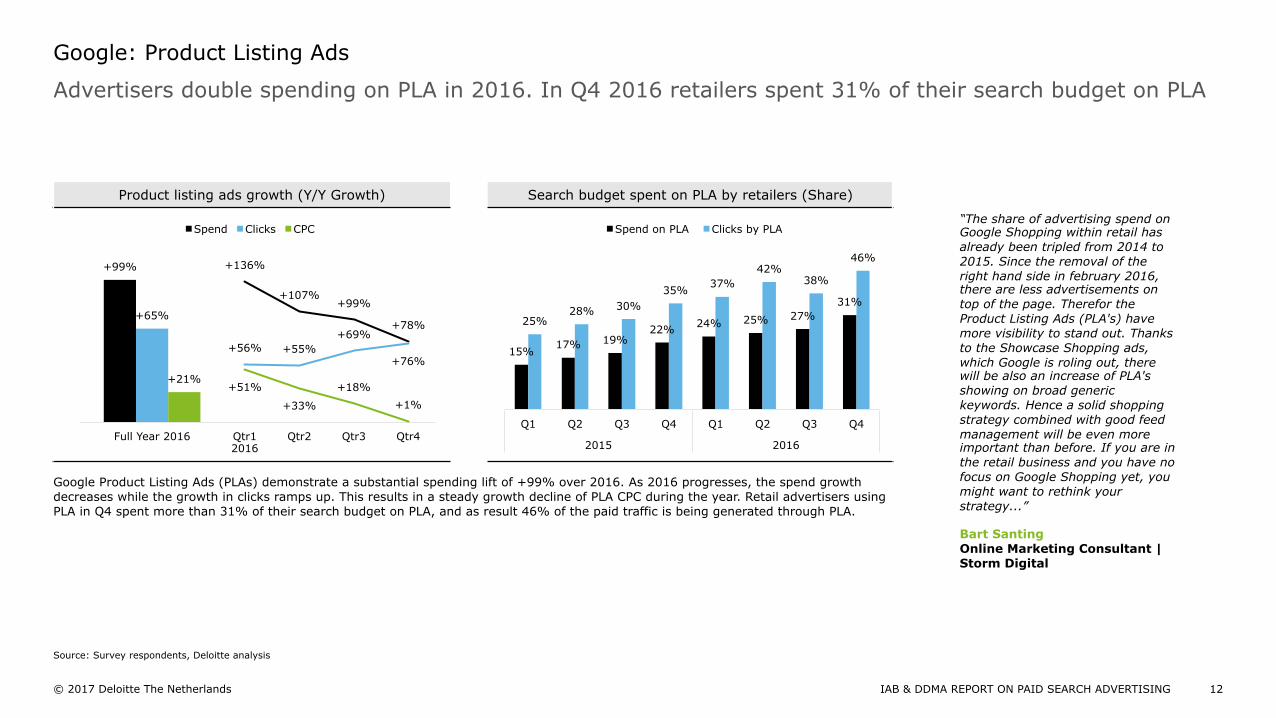
Google Product Listing Ads (PLAs) demonstrate a substantial spending lift of +99% over 2016. As 2016 progresses, the spend growth decreases while the growth in clicks ramps up. This results in a steady growth decline of PLA CPC during the year. Retail advertisers using PLA in Q4 spent more than 31% of their search budget on PLA, and as result 46% of the paid traffic is being generated through PLA.
Advertisers double spending on PLA in 2016. In Q4 2016 retailers spent 31% of their search budget on PLA
Google: Product Listing Ads
12 IAB & DDMA REPORT ON PAID SEARCH ADVERTISING
“The share of advertising spend on Google Shopping within retail has already been tripled from 2014 to 2015. Since the removal of the right hand side in february 2016, there are less advertisements on top of the page. Therefor the Product Listing Ads (PLA's) have more visibility to stand out. Thanks to the Showcase Shopping ads, which Google is roling out, there will be also an increase of PLA's showing on broad generic keywords. Hence a solid shopping strategy combined with good feed management will be even more important than before. If you are in the retail business and you have no focus on Google Shopping yet, you might want to rethink your strategy...” Bart Santing Online Marketing Consultant | Storm Digital
15% 17% 19%
22% 24% 25% 27% 31%
25% 28% 30%
35% 37% 42%
38%
46%
Q1 Q2 Q3 Q4 Q1 Q2 Q3 Q4
2015 2016
Spend on PLA Clicks by PLA
+136%
+107% +99%
+78%
+56% +55% +69%
+76%
+51%
+33%
+18%
+1%
Qtr1 2016
Qtr2
Qtr3
Qtr4
+99%
+65%
+21%
Full Year 2016
Spend Clicks CPC
Source: Survey respondents, Deloitte analysis
© 2017 Deloitte The Netherlands
Non-brand CPC phone relative to desktop (desktop = 1) Brand CPC phone relative to desktop (desktop = 1)
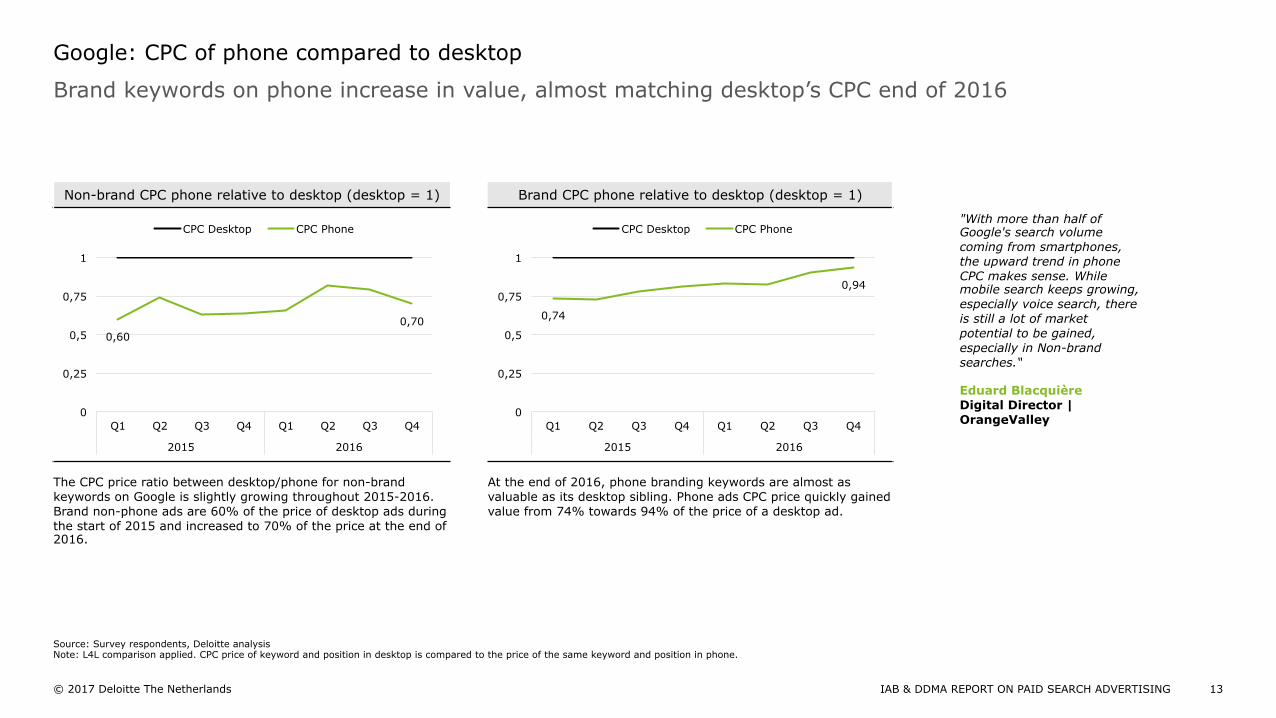
The CPC price ratio between desktop/phone for non-brand keywords on Google is slightly growing throughout 2015-2016. Brand non-phone ads are 60% of the price of desktop ads during the start of 2015 and increased to 70% of the price at the end of 2016.
At the end of 2016, phone branding keywords are almost as valuable as its desktop sibling. Phone ads CPC price quickly gained value from 74% towards 94% of the price of a desktop ad.
Brand keywords on phone increase in value, almost matching desktop’s CPC end of 2016
Google: CPC of phone compared to desktop
13 IAB & DDMA REPORT ON PAID SEARCH ADVERTISING
"With more than half of Google's search volume coming from smartphones, the upward trend in phone CPC makes sense. While mobile search keeps growing, especially voice search, there is still a lot of market potential to be gained, especially in Non-brand searches.“ Eduard Blacquière Digital Director | OrangeValley
0,60 0,70
0
0,25
0,5
0,75
1
Q1 Q2 Q3 Q4 Q1 Q2 Q3 Q4
2015 2016
CPC Desktop CPC Phone
0,74
0,94
0
0,25
0,5
0,75
1
Q1 Q2 Q3 Q4 Q1 Q2 Q3 Q4
2015 2016
CPC Desktop CPC Phone
Source: Survey respondents, Deloitte analysis Note: L4L comparison applied. CPC price of keyword and position in desktop is compared to the price of the same keyword and position in phone.
© 2017 Deloitte The Netherlands
CTR per position non-branding keywords (CTR %) CTR per position branding keywords (CTR %)
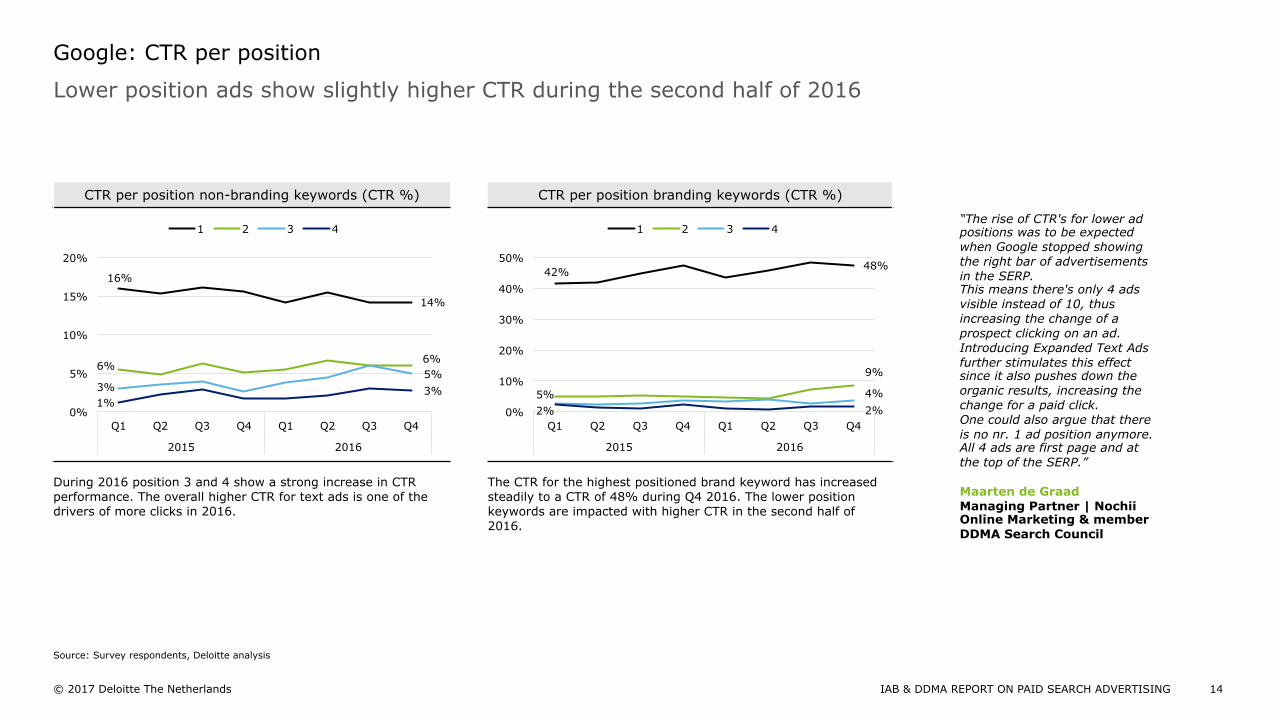
During 2016 position 3 and 4 show a strong increase in CTR performance. The overall higher CTR for text ads is one of the drivers of more clicks in 2016.
The CTR for the highest positioned brand keyword has increased steadily to a CTR of 48% during Q4 2016. The lower position keywords are impacted with higher CTR in the second half of 2016.
Lower position ads show slightly higher CTR during the second half of 2016
Google: CTR per position
14 IAB & DDMA REPORT ON PAID SEARCH ADVERTISING
“The rise of CTR's for lower ad positions was to be expected when Google stopped showing the right bar of advertisements in the SERP. This means there's only 4 ads visible instead of 10, thus increasing the change of a prospect clicking on an ad. Introducing Expanded Text Ads further stimulates this effect since it also pushes down the organic results, increasing the change for a paid click. One could also argue that there is no nr. 1 ad position anymore. All 4 ads are first page and at the top of the SERP.” Maarten de Graad Managing Partner | Nochii Online Marketing & member DDMA Search Council
16%
14%
6% 6%
3% 5%
1% 3%
0%
5%
10%
15%
20%
Q1 Q2 Q3 Q4 Q1 Q2 Q3 Q4
2015 2016
1 2 3 4
42% 48%
5%
9%
4%
2% 2% 0%
10%
20%
30%
40%
50%
Q1 Q2 Q3 Q4 Q1 Q2 Q3 Q4
2015 2016
1 2 3 4
Source: Survey respondents, Deloitte analysis

© 2017 Deloitte The Netherlands
Paid Search: Bing “The search landscape is growing increasingly complex which makes it more important than ever for marketers to stay ahead of the latest trends. As search ads get richer, more-actions focused and ever more relevant to the searcher’s intent through new targeting and marketplace capabilities, the higher the ad engagement, and potential ROI. With the coming of more pervasive, predictive and personalised search, marketers will have to evolve their optimisation strategies in order to drive differentiation and brand success.” Tor Thompson | EMEA Regional Director | Bing Ads
15 IAB & DDMA REPORT ON PAID SEARCH ADVERTISING
© 2017 Deloitte The Netherlands
Non-brand CPC phone relative to desktop (desktop = 1) Brand CPC phone relative to desktop (desktop = 1)
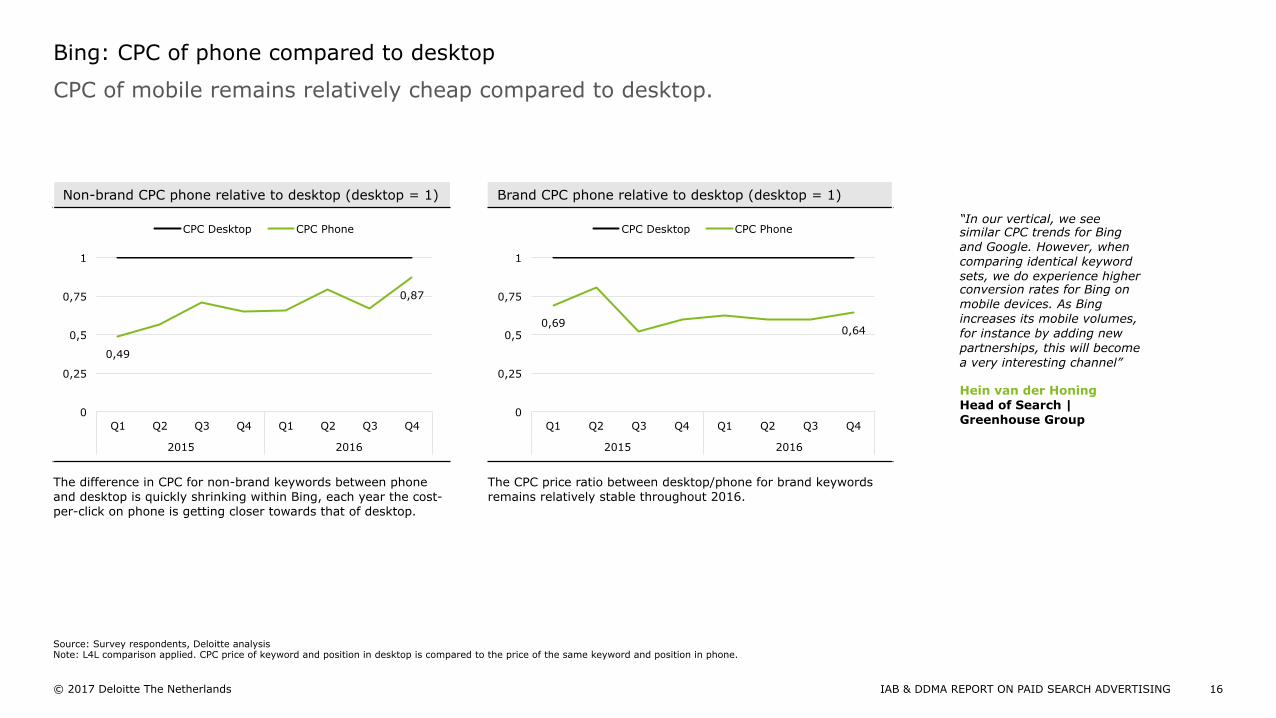
The difference in CPC for non-brand keywords between phone and desktop is quickly shrinking within Bing, each year the cost-per-click on phone is getting closer towards that of desktop.
The CPC price ratio between desktop/phone for brand keywords remains relatively stable throughout 2016.
CPC of mobile remains relatively cheap compared to desktop.
Bing: CPC of phone compared to desktop
16 IAB & DDMA REPORT ON PAID SEARCH ADVERTISING
“In our vertical, we see similar CPC trends for Bing and Google. However, when comparing identical keyword sets, we do experience higher conversion rates for Bing on mobile devices. As Bing increases its mobile volumes, for instance by adding new partnerships, this will become a very interesting channel” Hein van der Honing Head of Search | Greenhouse Group
0,49
0,87
0
0,25
0,5
0,75
1
Q1 Q2 Q3 Q4 Q1 Q2 Q3 Q4
2015 2016
CPC Desktop CPC Phone
0,69 0,64
0
0,25
0,5
0,75
1
Q1 Q2 Q3 Q4 Q1 Q2 Q3 Q4
2015 2016
CPC Desktop CPC Phone
Source: Survey respondents, Deloitte analysis Note: L4L comparison applied. CPC price of keyword and position in desktop is compared to the price of the same keyword and position in phone.
© 2017 Deloitte The Netherlands
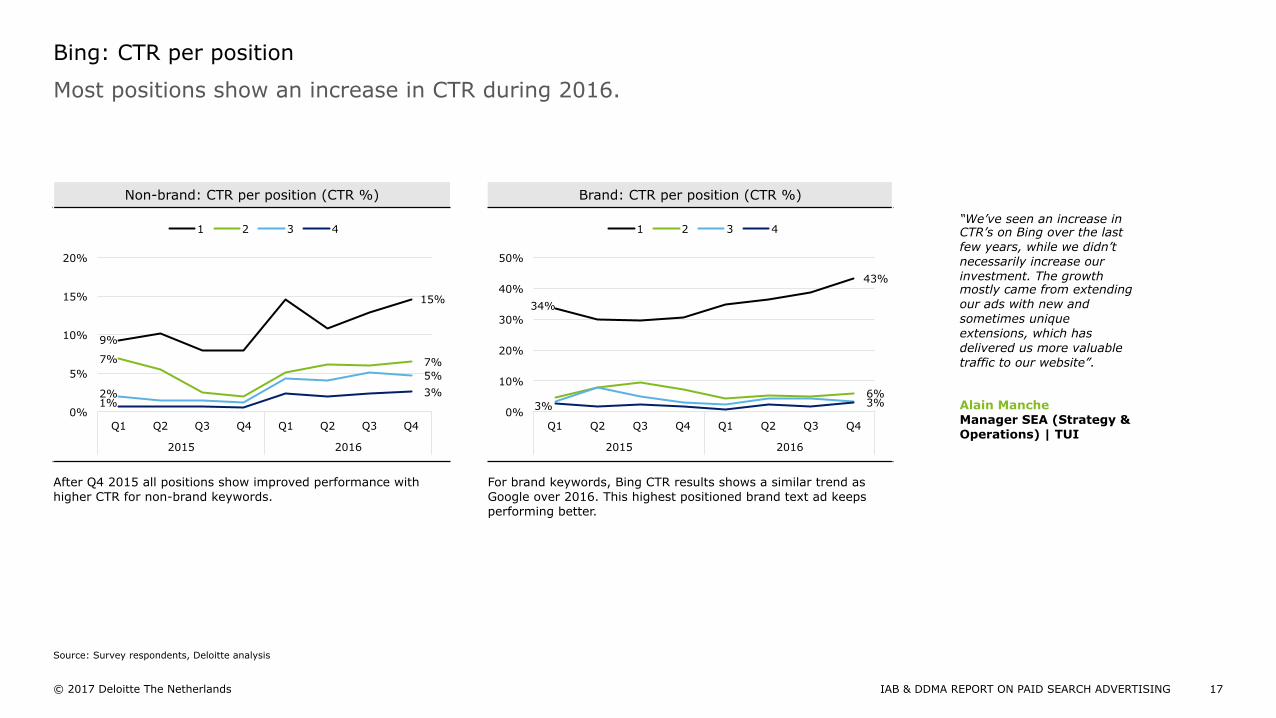
Non-brand: CTR per position (CTR %) Brand: CTR per position (CTR %)
After Q4 2015 all positions show improved performance with higher CTR for non-brand keywords.
For brand keywords, Bing CTR results shows a similar trend as Google over 2016. This highest positioned brand text ad keeps performing better.
Most positions show an increase in CTR during 2016.
Bing: CTR per position
17 IAB & DDMA REPORT ON PAID SEARCH ADVERTISING
“We’ve seen an increase in CTR’s on Bing over the last few years, while we didn’t necessarily increase our investment. The growth mostly came from extending our ads with new and sometimes unique extensions, which has delivered us more valuable traffic to our website”. Alain Manche Manager SEA (Strategy & Operations) | TUI
9%
15%
7% 7%
2%
5%
1% 3%
0%
5%
10%
15%
20%
Q1 Q2 Q3 Q4 Q1 Q2 Q3 Q4
2015 2016
1 2 3 4
Source: Survey respondents, Deloitte analysis
34%
43%
6% 3% 3%
0%
10%
20%
30%
40%
50%
Q1 Q2 Q3 Q4 Q1 Q2 Q3 Q4
2015 2016
1 2 3 4
© 2017 Deloitte The Netherlands
Methodology & Contact details
18 IAB & DDMA REPORT ON PAID SEARCH ADVERTISING
© 2017 Deloitte The Netherlands
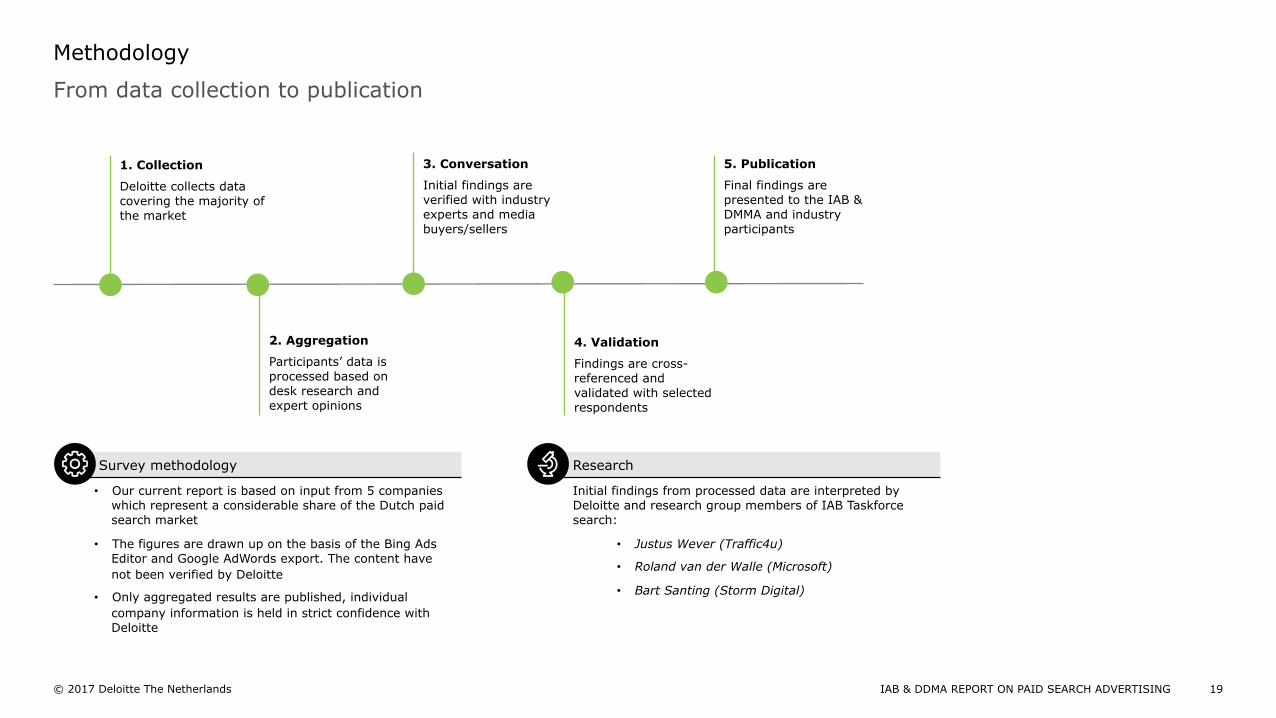
From data collection to publication
Methodology
19 IAB & DDMA REPORT ON PAID SEARCH ADVERTISING
Survey methodology Research
• Our current report is based on input from 5 companies which represent a considerable share of the Dutch paid search market
• The figures are drawn up on the basis of the Bing Ads Editor and Google AdWords export. The content have not been verified by Deloitte
• Only aggregated results are published, individual company information is held in strict confidence with Deloitte
Initial findings from processed data are interpreted by Deloitte and research group members of IAB Taskforce search:
• Justus Wever (Traffic4u)
• Roland van der Walle (Microsoft)
• Bart Santing (Storm Digital)
1. Collection
Deloitte collects data covering the majority of the market
2. Aggregation
Participants’ data is processed based on desk research and expert opinions
3. Conversation
Initial findings are verified with industry experts and media buyers/sellers
4. Validation
Findings are cross-referenced and validated with selected respondents
5. Publication
Final findings are presented to the IAB & DMMA and industry participants
© 2017 Deloitte The Netherlands
For questions regarding this research feel free to contact
20 IAB & DDMA REPORT ON PAID SEARCH ADVERTISING
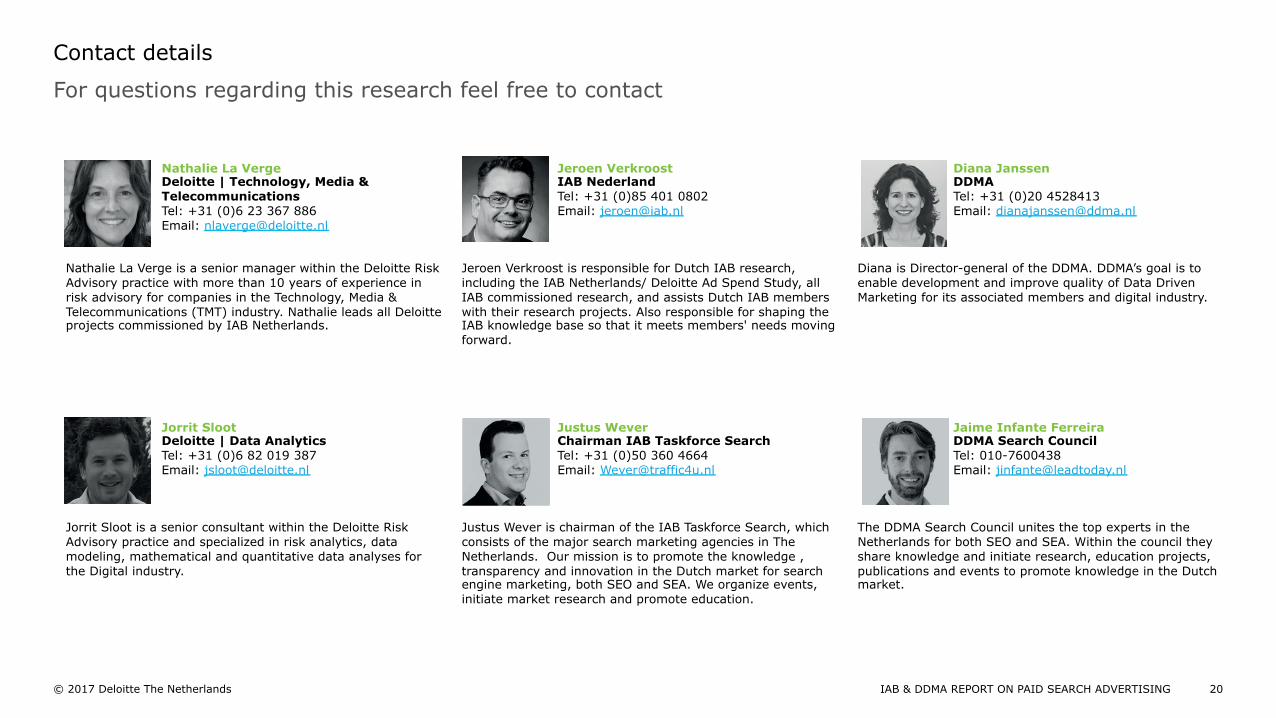
Contact details
Nathalie La Verge Deloitte | Technology, Media & Telecommunications Tel: +31 (0)6 23 367 886 Email: [email protected]
Nathalie La Verge is a senior manager within the Deloitte Risk Advisory practice with more than 10 years of experience in risk advisory for companies in the Technology, Media & Telecommunications (TMT) industry. Nathalie leads all Deloitte projects commissioned by IAB Netherlands.
Jeroen Verkroost IAB Nederland Tel: +31 (0)85 401 0802 Email: [email protected]
Jeroen Verkroost is responsible for Dutch IAB research, including the IAB Netherlands/ Deloitte Ad Spend Study, all IAB commissioned research, and assists Dutch IAB members with their research projects. Also responsible for shaping the IAB knowledge base so that it meets members' needs moving forward.
Diana Janssen DDMA Tel: +31 (0)20 4528413 Email: [email protected]
Diana is Director-general of the DDMA. DDMA’s goal is to enable development and improve quality of Data Driven Marketing for its associated members and digital industry.
Jorrit Sloot Deloitte | Data Analytics Tel: +31 (0)6 82 019 387 Email: [email protected]
Jorrit Sloot is a senior consultant within the Deloitte Risk Advisory practice and specialized in risk analytics, data modeling, mathematical and quantitative data analyses for the Digital industry.
Justus Wever Chairman IAB Taskforce Search Tel: +31 (0)50 360 4664 Email: [email protected]
Justus Wever is chairman of the IAB Taskforce Search, which consists of the major search marketing agencies in The Netherlands. Our mission is to promote the knowledge , transparency and innovation in the Dutch market for search engine marketing, both SEO and SEA. We organize events, initiate market research and promote education.
Jaime Infante Ferreira DDMA Search Council Tel: 010-7600438 Email: [email protected]
The DDMA Search Council unites the top experts in the Netherlands for both SEO and SEA. Within the council they share knowledge and initiate research, education projects, publications and events to promote knowledge in the Dutch market.


Deloitte refers to one or more of Deloitte Touche Tohmatsu Limited, a UK private company limited by guarantee (“DTTL”), its network of member firms, and their related entities. DTTL and each of its member firms are legally separate and independent entities. DTTL (also referred to as “Deloitte Global”) does not provide services to clients. Please see www.deloitte.nl/about to learn more about our global network of member firms.
Deloitte provides audit, consulting, financial advisory, risk advisory, tax and related services to public and private clients spanning multiple industries. Deloitte serves four out of five Fortune Global 500® companies through a globally connected network of member firms in more than 150 countries and territories bringing world-class capabilities, insights, and high-quality service to address clients’ most complex business challenges. To learn more about how Deloitte’s approximately 245,000 professionals make an impact that matters, please connect with us on Facebook, LinkedIn, or Twitter.
This communication contains general information only, and none of Deloitte Touche Tohmatsu Limited, its member firms, or their related entities (collectively, the “Deloitte Network”) is, by means of this communication, rendering professional advice or services. Before making any decision or taking any action that may affect your finances or your business, you should consult a qualified professional adviser. No entity in the Deloitte Network shall be responsible for any loss whatsoever sustained by any person who relies on this communication.
© 2017 Deloitte The Netherlands