I8'll - DTIC · with round head rivets. New series tests ..... " 35 Fig. 6a. Influence of the...
89
AD-AO 936 PISA UNIV (ITALY) INST OF AERONAUTICS pis RO/I I THE FATIGUE CRACK GROWTH UNDER VARIABLE A4PWLITUOE LOADING IN U-4CiolJ) NOV 79 A SALVEiTI. 6 CAVALLINIP L LAZZSRI OAlA-CRO-74--1 ? UNCLASSIFIED ML "I8'll
Transcript of I8'll - DTIC · with round head rivets. New series tests ..... " 35 Fig. 6a. Influence of the...

AD-AO 936 PISA UNIV (ITALY) INST OF AERONAUTICS pis RO/I ITHE FATIGUE CRACK GROWTH UNDER VARIABLE A4PWLITUOE LOADING IN U-4CiolJ)NOV 79 A SALVEiTI. 6 CAVALLINIP L LAZZSRI OAlA-CRO-74--1 ?
UNCLASSIFIED ML
"I8'll
111.0112.2
11111"----5IIII il16 140 112.
11111I25 lll.!...jj1.6
MICROCOPY RESOLUTION TEST CHART
NATIONAL BUREAU OF STANDARDS-1963-A

To FATIGUE CRACI GROWTH UNDEl VARIAIUAMPLITID LOADING IN BUILT.UP STRUCTI
Ist Annual Technical Report
c'I
By
0 A. SALVETTI - Principal Investigator
0. CAVALUNI and L. LAZZERI
November 1979
IUROPEAN RESEARCH OFFICE
United States Army
London England
GRANT NUMBER DA-ERO 78-0-107
i.tut d Aroauics
Approved for public release; distribution unlimited
80 5 28010

AD
THE FATIGUE CIIACl GROWTH UNDER VARIABLEAMPLITUDE LOADING IX BUILT-UP STRUCTURES
Ist Annual Technical Report
By
A. SALVETTI - Principal Investigator
G. CAVALLINI and L. LAZZERI
November 1979
EUROPEAN RESEAICH OFFICE
United States Army
London England
.GRANT NUMBER-DA-ERO 78-0-107
Istituto di Aeronautica
Universitt di Pia
Italy
Approved for public release; distribution unlimited
p/--..

UNCLASSIFIEDSECURITY CLASSIFICATION OF THIS PAGE (Mn?.t Date Ertg*,ed) R&D 2600 MC/AN
REPORT DOCUMENTATION PAGE BEFORE COMPLETING FORMI REPORT NUMBER 2 GOVT ACCESSION NO. 3 RECIPIENT'S CATALOG NUMBER
4. TITLE (end Subilul.~ 5 TyPFI OF REPORT & PERIOD CovEnEOV 1st nnual Tech. ReportT ie Fatigue Crack Growth.Ajnder variable Sept 78 - Oct 79Amplitude Loading in Built-up Structures* 6 PEFRMN ONG. REPORT NUMBER
* -PRFORMING ORGANIZATION NAME ANO ADDRESS 10 RGA LMN.P~ET, T ASK
AREA A WO
It. OtIS. LINLAOFFICE NTMENAOO 5G0AO4NGv ~ ~ ~ ~ ~ o 79-'t'USNOL~~pprveo for ubi Reas , istribution Unlimite
MOISTRINGTIGNNSTATEME(. .AOORESScI ifferent frBok20 aI fie)~ IS.m Repo IT) LS.(fti eot
IS. SUPPLEMENTARY NOTES
rack Growth (U) Stringer-sheet friction (U) fatigue crack (U) amplitude loads
U) crack propagation (U) fastener-flexibility (U)
2) AMiNAC? (riattm M M -ad Sh noeeeepy ME Ide~miil by block nfitba)Khe object of this investigation is the development of a reliable procedure forvaluating the growth of a crack In a built-up structure under realistic loacingconditions.
To this end tests have been conducted on stiffened and unstiffened paneli tomnitor the growth of a crack both under constant and variable amplitude tloads.
PTO
103 m~iwovuove~iosotgtI UNCLASSIFIEDEcumrie cLASSIFICATION Of TNIS PACE (When Doe. Entered,
4Ah/e /

UNCLASSI FIEDSECURITY CLAIFICATION OF THIS PAGE1hM Doe Ener.d)
The test data has been evaluated on the basis of a deep theoreticalanalysis which has allowed us to reach significant results on the followingmain topics:
- influence of the fastener flexibility and stringer-sheet frictionforces on fatigue crack propagation in stiffened panels,
- reliability of existing methods for predicting the growth of a crackunder loading conditions in plain sheets.
hit" I k
,al I or
t special
UNCLASS I FI EDSECURITY CLASSIFICATION OF THIS PIIAAlGRte Des Bntered)

- III -
SUMMARY
R, search aimed at developing reliable methods to predict the
growth of a crack in aircraft built-up structures under realistic
load conditions is current being carried out at the Institute
of Aeronautics of the University of Pisa under the three-year
research contract DA-ERO-78-G-107.
This paper presents the results obtained in the course of the
first year. Such results concern two main topics, namely
- prediction of crack growth in riveted stiffened panels under
constant amplitude loading
- prediction of crack growth in plain sheets under variable am-
plitude loading.
With regard to the first topic, the results concern mainly
the evaluation of rivet flexibility and friction forces between
the stringer and sheet cover. Such quantities have been obtained
by analysis of crack growth test data by means of a SKESA computer
program developed ad hoc, which establishes them by searching
for the best regression by correlating the crack rate with the
stress intensity factor.
As far as the second topic is concerned, a rationale has been
developed and implemented in a CADAV computer program to eval-
uate existing methods for computing crack growth under variable
amplitude loading. Attention has been focused on four methods,
namely: non-interactive, Wheeler, Bell-Eidinoff and Willenborg
methods.
Tests have been performed both atconstant and variable am-
plitude loading. Constant amplitude test data has been used to
obtain reference K-rate relationships. Variable amplitude test
data obtained utilizing a FALSTAFF spectrum, has been compared
with prediction by means of the CADAV which classifies the meth
ods on the basis of a statistical criterion.
- q p
. . . . . . . .- - .'-

-IV-
TABLE OF CONTENTS
SUMMARY.................................................... Page IIILIST OF LLU TRAT ONS ... ... .... ... ... .... ... ... it,
LIST OF IALUSRTI....................................... It V I
LIST OF SYMBOLS............................................ t IX
1. INTRODUCTION............................................ t 1
2. BRIEF STATEMENT OF THE BASIS OF THE RESEARCH 1...
3. CRACK GROWTH IN RIVETED STIFFENED PANELS UNDERCONSTANT AMPLITIDE LOADING............................." 4
3.1. THE INFLUENCE OF FASTENER FLEXIBILITY ANDFRICTION FORCES ON THE FATIGUE CRACK GROWTHPHENOMENON........................................." 4
3.2. FASTENER FLEXIBILITY AND FRICTION FORCESEVALUATION PROCEDURE.............................." 5
3.3. EXPERIMENTAL CRACK GROWTH DATA..................." 7
3.4. CRACK GROWTH DATA ANALYSIS........................" 8
3.5. LIMITS OF THE PRESENT ANALYSIS...................' 1
4. EVALUATION OF EXISTING METHODS FOR PREDICTING CRACKGROWTH UNDER VARIABLE AMPLITUDE LOADING..............." 13
4.1. THE RATIONALE OF THE PRESENT APPROACH............" 15
4.2. EXPERIMENTAL RESULTS AND ANALYSIS................" 17
4.2.1. CONSTANT AMPLITUDE............................" 17
4.2.2. VARIABLE AMPLITUDE LOADING..................." 18
5. CONCLUSIONS............................................." 20
REFERENCES..................................................' 23
APPENDIX 1.................................................... ..25
APPENDIX 2.................................................." 27
FIGURES.....................................................' 29
TABLES......................................................" 67
Ab _

LIST OF ILLUSTRATIONS
Figures
Fig. 1. Typical anomalies in K-rate relationships instiffened panels due to errors both in SIF andda/dn computation ............................. Page 29
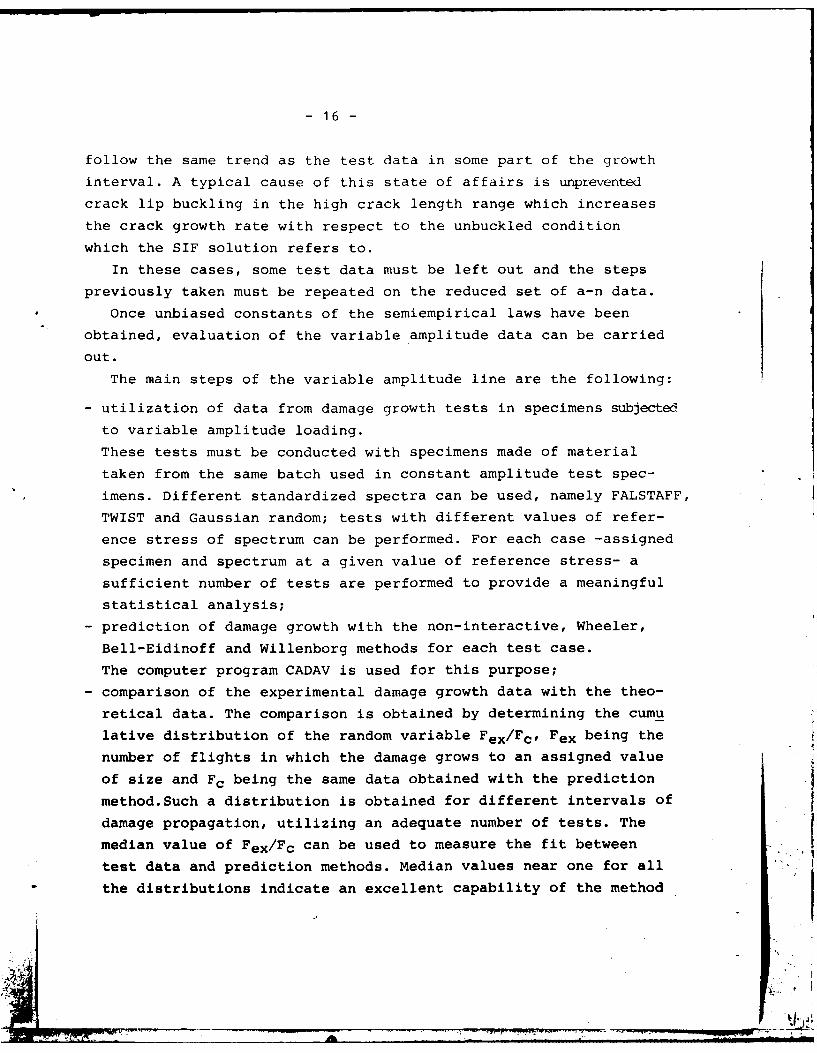
Fig. 2. Rationale for evaluating fastener flexibilityand friction forces from test data .............. .. 30
Fig. 3. Simplified method for predicting rivetflexibility ................................... " . 31
Fig. 4. Idealization of the friction forces by means offictitious rivets ............................. 32
Fig. 5a. Crack growth data for stiffened panels rivetedwith countersunk rivets. New series tests ..... 33
Fig. 5a. Continued ..................................... " 34
Fig. 5b. Crack growth data for stiffened panels rivetedwith round head rivets. New series tests ...... " 35
Fig. 6a. Influence of the friction forces on the stressintensity factor as computed by SKESA ......... 36
Fig. 6b. Influence of the rivet flexibility on the stressintensity factor as computed by SKESA ......... 37
Fig. 7a. Test CRIC-8: shape of da/dn vs.AK for differentvalues of and n. The dots correspond to couplesof values da/dn,AK as obtained by spline and Kmodules. The continuous line is the best-fitcurve ......................................... " . 38
Fig. 7a. Continued ..................................... 39
Fig. 7a. Continued ..................................... 40Fig. 7a. Continued ..................................... " 41Fig. 7a. Continued ..................................... 42
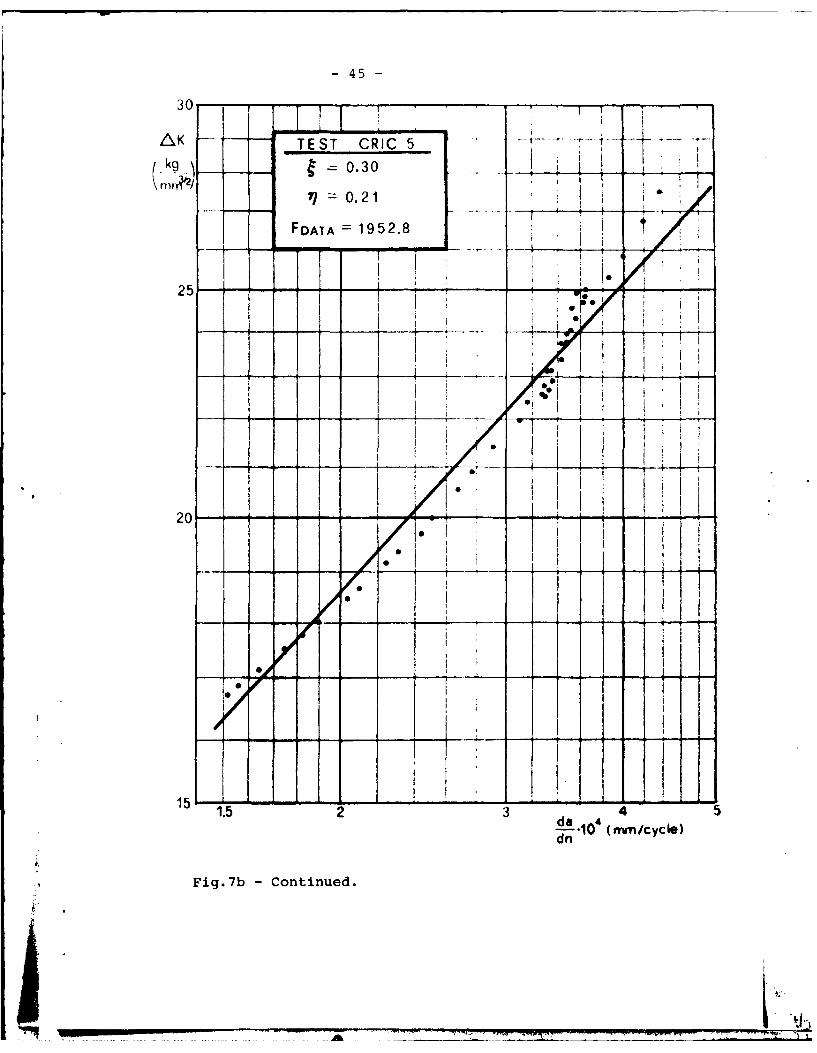
Fig. 7b. Test CRIC-5: da/dn vs.AK for different values of& and n, plotted as explained in Fig.7a. In thiscase small loop-type anomalies are present alsoat the higher values of FDATA .................... 43
Fig. 7b. Continued ..................................... " 44Fig. 7b. Continued ..................................... 45
Fig. 7b. Continued ..................................... " 46
Fig. 7b. Continued ..................................... 47
Fig. 7c. Test CRIC-1: da/dn vs.AK for different values ofE and n, plotted as explained in Fig.7a.In thiscase loop-type anomalies are present also at thehigher values of FDATA ...............................48

- VI -
Fig. 7c. Continued ................................... Page 49
Fig. 7c. Continued ................................... o 50
Fig. 7c. Continued ................................... t 51
Fig. 7c. Continued ................................... t 52
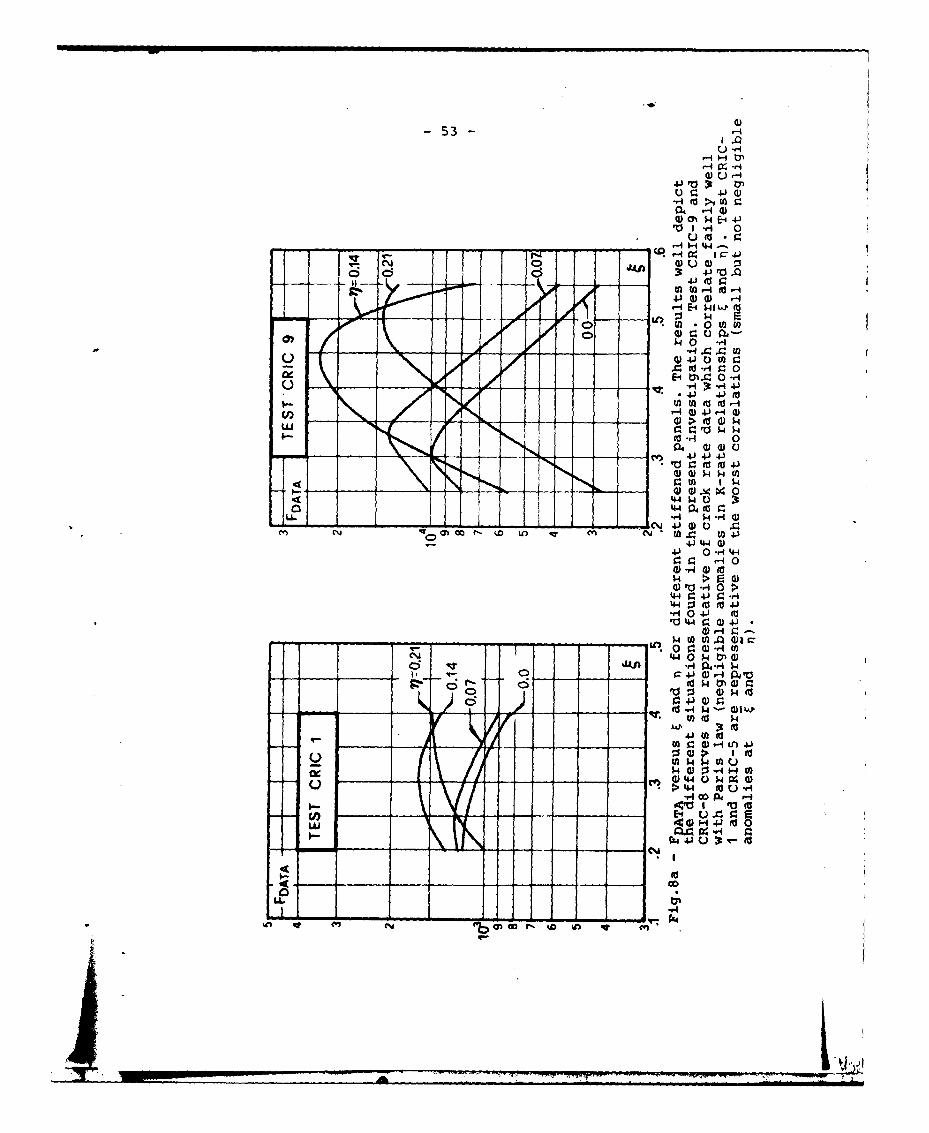
Fig. 8a. FDATA versus F and ,i for different stiffenedpanels.The results well depict the differentsituations found in the present investigation.Test CRIC-9 and CRIC-8 curves are representativeof crack rate data which correlate fairly wellwith Paris law (negligible anomalies in K-raterelationships T and n9). Test CRIC-1 and CRIC-5are representative of the worst correlations(small but not negligible anomalies at & and ,)" 53
Fig. 8a. Continued ................................... " . 54
Fig. 8b. Standard deviation o versus ,and nfor differentstiffened panels. The same considerations ofFig.8a can be applied ........................... 55
Fig. 8b. Continued ................................... " . 56
Fig. 9 Log I distribution.The curve A-is relevant ton = 0.14.The median value is C2= 0.49 ( f=0.686)and the standard deviation is 02=0.219 (of=0.307).The results indicate that the flexibilitiesfound with this approach are noteworthy lowerthan those predicted by Fig.3 or Douglas formula.The curve B has been obtained considering allthe & belonging to the same population irrespectiveof the values of n. .............................. 57
Fig. 10 Errors found in evaluation due to errors in thespline module. Within range of pratical interest0.2 2 0.8 the absolute error is lower than 0.06and the relative error is lower than 12% ....... 58
Fig. 11 Typical errors of the spline interpolationtechnique.The curve with equidistant points isrepresentative of the present approach. The curvewith thickened points qiven an idea of potentialimprovements that can be obtained b a modifiedtest technique which provides more informationin the neighbourhood of maximum and minimumpoints ....................................... " 59
Fig. 12 Fatigue crack propagation under spectrum loading.Approach Logic ............................... 60
Fig. 13 Regression analysis on experimental data forevaluating Forman's law .............................. 61
Fig. 14 Regression analysis on experimental data forevaluating Forman's law.Best-fit straigth linesfor data relevant to R=cost ...................." 62

- VII -
Fig. 15 Lognormal cumulative distributions of thevariable nex/nc for two ranges of damage growth Page 63
Fig. 16 Comparison of test data with prediction ....... 64
Fig. 17 Fatigue crack propagation under spectrumloading flat panel.FASLATFF spectrum .......... ". 65
Fig. 18 Fatigue crack propagation under spectrum loadingstiffened panels. FALSTAFF spectrum .............. 66
__ _ _ _ _ a

- VIII -
LIST OF TABLES
Tables
Tab.I Main characteristics of the stiffened panels.Old series tests ................................ Page 67
Tab.II Main characteristics of the stiffened panels.New series tests ................................ .68
Tab.III Results of new series tests ........................ to 69
Tab.III Continued ....................................... .70
Tab.III Continued ....................................... of 71Tab.III Continued ....................................... 72
Tab.III Continued ....................................... 73
Tab.III Continued ....................................... 74
Tab.IVa Optimum values of r and 9 for countersunk rivetstests ........................................... 75
Tab.IVb Optimum values of and 9 parameters for roundhead rivets tests ............................... 76

- IX -
LIST OF SYMBOLS
a - Half-crack length, mm.
Ar - Rivet shank cross sectional area, mm
da/dn - Crack growth rate, mm/cycle
d - Rivet diameter, mm.
Ec - Sheet Young's modulus, Kg/mm2
Er - Rivet Young's modulus, Kg/mm2
E s - Stiffener Young's modulus, Kg/mm-
FDATA - Statistical parameter of regression
K - Stress intensity factor, Kg/mm4
n - Number of load cycles
P - Rivet load, Kg.
Pf - Fictitious rivet friction load, Kg.
R - Stress ratio
SIF - Stress Intensity Factor, Kg/mm:
SMAX - Maximum stress of load cycle
SMIN - Minimum stress of load cycle
Sy - Yielding stress, Kg/mm2
tc - Sheet thickness, mm.
ts - Stiffener thickness, mm.
T) - Friction parameter
Ti - Optimum friction parameter
A - Rivet deflection, mm.
AK - Stress intensity factor range, Kg/mm;
- Flexibility parameter
- Optimum flexibility parameter
- Standard deviation
IXI-_

1 - INTRODUCTION
This paper presents the first year's results of an investigation
carried out at the Institute of Aeronautics, Pisa University,
under contract DA-ERO-78-G-107.
The objective of this investigation is the development of
reliable procedure for evalua: ng the growth of a crack in a
built-up structure under realistic loading conditions.
To this end tests have been conducted on stiffened and
unstiffened panels to monitor the growth of a crack both under
constant and variahle amplitude loads.
The test data has been evaluated on the basis of a deep theo
retical analysis which has allowed us to reach significant
results on the following main topics:
- influence of the fastener flexibility and stringer-sheet friction
forces on fatigue crack propagation in stiffened panels
- reliability of existing methods for predicting the growth of a
crack under loading conditions in plain sheets.
2 - BRIEF STATEMENT OF THE BASIS OF THE RESEARCH.
The need for investigation into crack growth in riveted built-
up structures under variable amplitude loading, springs from two
main causes, namely the uncertainty surrounding the computational
methods of the stress intensity factor and the complexity of the
crack growth interaction effects caused by load amplitude varia-
tions.
The uncertainty surrounding the K values has to be ascribed
mainly to the difficulty of assessing the actual values of the
mutual forces existing in the junction between the stringers and
the sheet cover, (junction forces).
For a given structure geometry, the junction forces depend on
such quantities as the rivet-hole deformation and the friction

-2-I
between stringer-skin contacting surfaces. Onl. rough approxima
tions are currently available for such quantities and therefore
the stress intensity values computed are affected by errors that
may be sufficiently large as far as the crack length, the struc-
ture geometry and load level are concerned.
As a consequence of the above, the basic problem of computing
the crack growth under constant amplitude loading also involves
uncertainty in the case of a stiffened structures.
To overcome the problem knowledge on the junction forces must
be improved to such an extent as to compute the stress intensity
factor with an accuracy comparable to that reached in the evalua
tion of K in plane sheets.
As far as the second cause is concerned, the role of the inter
action effects in fatigue crack growth problems is well documen-
ted, ref.111.
One such problem which can be taken as an example is the im-
plementation of reliable crack growth prediction methods, one of
the biggest problems in damage tolerant structure design.
The research effort in this area has given rise to very prom-
ising results Ind certain important prediction methods are cur-
* rently available,12,3,4,51.
However, the overall picture of damage accumulation during
crack growth under variable amplitude loading is still insuffi-
ciently clear and further investigation is required to improve
the reliability of crack growth prediction methods.
The production of experimental data on crack growth under load
sequences representative of airplane operations must be consider-
ed of particular significance in this respect.
Further, as all the existing methods derive their experimental
evidence mainly from tests performed on sheet specimens, there is
a need for crack growth data drawn from tests on representative
airplane structures under realistic loading conditions.
In conclusion, the success of the search for a reliable meth-
od to predict crack growth in stiffened structures under variable

-3-
amplitude loading depends upon the solution of two related prob
lems, namely,
- further insight into the problem of the evaluation of junction
forces to produce a reliable K computational approach and
- critical evaluation of the state-of-the-art crack growth pre-
diction methods for variable amplitude loading through the
comparison of a set of experimental crack growth data repre-
sentative of operational activity as far as load sequences and
specimen configurations are concerned.
In connection with the first problem mentioned above significant
results can be obtained by suitable analysis of constant amplitude
crack growth data.
The second problem can be conveniently dealt with in two
successive stages.
In the first stage, by keeping the specimens to be tested as
simple as possible (viz, plane sheets for which SIF solutions
are well known), the reliability of existing prediction methods
can be assessed against crack growth data obtained from different
load spectra.
In a second stage, the capability of the most promising pre-
diction methods is further exploited in relation to crack growth
data drawn from complex structures (built-up structures) under
spectrum loading representative of the operational activity.
In the present report the results obtained in the first year
of the research will be presented.
Such results refer to the following main topics:
a1 -constant amplitude fatigue tests on stiffened panels,
a2 - development and implementation of a rationale to obtain
information on the junction forces (fastener flexibility
and friction forces) from the crack growth data in stiffened
panels,
b- crack growth tests under variable amplitude loading in plain
sheets,
7-ilF, IOP. MRJ1 0 OM M OM7

-4-
b 2- development and implementation of a rationale to evaluate
the reliability of existing prediction methods of crack
growth under variable amplitude loading.
3 - CRACK GROWTH IN RIVETED STIFFENED PANELS UNDER CONSTANT
AMPLITUDE LOADING.
In the present section, attention will be focused on the
results obtained up to now concerning the improvement of fatigue
crack growth prediction techniques in riveted stiffened struc-
tures under constant amplitude loading.
Research in this area has been mainly devoted to assessing
the influences of fastener flexibility and stiffener sheet cover
friction forces on the SIF and to develop and substantiate a ra-
tionale to obtain a reliable evaluation of such quantities.
3.1 - THE INFLUENCE OF FASTENER FLEXIBILITY AND FRICTION FORCES
ON THE FATIGUE CRACK GROWTH PHENOMENON.
As explained above, to effectively predict fatigue crack growth
in a built-up structure, it is necessary to evaluate fastener
flexibility and the junction friction forces.
A lot of information on both the above mentioned points can
be deduced by comparing the expected K-rate relationship and the
relationship based on crack growth test data and K values computed
on the basis of selected fastener behaviour (elastic,or elastoplastic
behaviour with a selected value of flexibility) and given friction
forces.
Fig.1 gives a qualitative indication on the way the information
can be obtained from the said comparison. In the upper part of the
figure typical data obtained from a plain sheet test is shown.Here
both the crack rate da/dn and the stress intensity factor K are
increasing functions of the crack length a. Therefore, the rela-
tionship between da/dn and K is biunivocal and each point of the
curve corresponds to an single value of the crack length.

-5-
In the case of stiffened panels, both da/dn and K show maxima
and minima according to variations in the crack length, so that
the same point of the da/dn versus K curve may correspond to more
than one value of the crack length.
In these conditions, anomalies of the da/dn-K curve are pos-
sible due to errors or in the computational methods for K (cen-
tral part of the figure) or in the evaluation of da/dn (lower
part of the figure).
In all cases, the da/dn-K curve is no longer a single value
relationship and takes on the different shapes shown in a qual-
itative way in the central and lower part of Fig.1.
These anomalies in the da/dn-K curves can be profitably used
to gather information on junction forces (fastener and friction
forces), if a highly accurate procedure is available to compute
da/dn. In such conditions all the anomalies in da/dn-K curves
obtained by processing crack growth test data can be traced back
to errors in the SIF computational approach. Since the only
significant causes of error in the computation of the SIF can beascribed to an incorrect value selection of the fastener flexibil
ity and friction forces, it is possible in principle to establish
that the "best values" of both these quantities are those which
eliminate or minimize such anomalies.
A first application of this concept was shown in references
6 and 7, utilizing a very rough approximation for the computa-
tion of the stress intensity factor, namely a zero-friction,
rigid-fastener idealization.
The anomalies of the da/dn-AK curves so obtained allowed us
to establish a qualitative classification of the influences ofdifferent parameters (rivet types, stiffener types and materials)
on the fatigue crack growth in riveted stiffened structures.
3.2 - FASTENER FLEXIBILITY AND FRICTION FORCES EVALUATION PRO-
CEDURE.
To obtaina quantitative assessment of these influences the
Ll

-6-
following rationale (Fig.2) has been developed. Crack growth
data is obtained by testing stiffened panels under constant
amplitude. The da/dn fatigue crack propagation rate is then
calculated with a spline function interpolation method (Ap-
pendix 1). The stress intensity factor is computed using dis
placement compatibility methods obtained by modifiyng the
original Poe approach by taking fastener elastic flexibility
and plasticity into account and by allowing for the influence
of friction between sheet and stringer. Rivet flexibility in
the elastic range is taken into account by means of a parameter
C which is the ratio between the actual flexibility and a computed
value.
In the present research the computed values have been obtained
on the basis of the simplified theory as summarized in Fig.3 and
of the Swift formula, ref.181.
The fastener load which starts significant plastic deformation
is calculated on the basis of simple lap joint tests.
The friction forces have been simulated by a set of fictitious
rigid-perfectly plastic fasteners placed between the actual fast
eners.
The first fictitious fastener is placed half way between the
first and the second rivet, the second fictitious fastener between
the second and the third rivet and so on as shown in Fig.4. The
fastener load Pf, in correspondence with which sliding takes
place, is considered a variable to be determined.
For each couple of values E and Pf the stress intensity factor
is computed for all the crack lengths relevant to the test under
examination.
The da/dn crack rate computed by means of the spline approach
is correlated with AK obtained following the above mentioned
procedure. A best-fit analysis is then carried out utilizing a
Paris K-rate relationship. The best-fit is then evaluated through
such statistical quantities as the standard deviation, correlation
coefficient and F-data. The best values of & and Pf are then
determined when extremum conditions (minimum for standard devia-
tion and maximum for the other two quantities) are found.Obviously,
a -- ,.~~--.-

-7-
only one statistical quantity could be used to obtain the best
values of and Pf but redundant information is felt to be
useful.
This rationale has been implemented by means of the SKESA
computer program based on three main modules, namely the spline
module, the stress intensity module, and the best-fit statistical
evaluation module.
By means of such a computer ,t.gram the a-n test data is
processed until the best combin- ion of E and Pf is found.
3.3 - EXPERIMENTAL CRACK GROWTH DATA.
The rationale described in the previous section was applied by
means of the SKESA computer program to a set of a-n data obtained
by constant amplitude crack propagation tests.
The main characteristics of the stiffened panels are shown in
Tab.I and Tab.II. All the panels are stiffened by straps of the
same material as the sheet cover riveted with countersunk or round
head rivets. Both 2024-T3 and 7075-T6 aluminum alloys were used in
the panel construction.
The stiffened panels of Tab.I differ regarding the geometric
configuration, the type of rivet and the material. The panels of
Tab.II differ only as far as the type of rivet is concerned.
The panels of Tab.I were tested in the course of previous
research and the relevant test data has already been utilized for
preliminary analys s of the crack growth phenomenon as outlined
in ref.16,71.
The panels of Tab.II were tested in the course of the present
investigation to obtain further data. The tests were performed
with an improved testing technique (see Appendix 2) based on a
servo controlled loading machine and on measurement of the suc-
cessive crack tip positions obtained by means of a sliding micro
scope which allowed us an absolute error on the crack length no
4higher than .1 mm. and pratically no error on the number of cycles.
The results of such tests, which are given in Tab.III and plotted
Ah.

8
in figs 5a and 5b, can also be profitably used to check how
the accuracy of the crack length and load measurement can in-
fluence the scatter of the phenomenon.
3.4 - CRACK GROWTH DATA ANALYSIS.
All the a-n data relevant to the panels in Tab.I and II have
been analyzed utilizing the SKESA computer program.
The elastic flexibility of the rivets has been evaluated by
means of a parameter given by:
dP/dA - ErdEi =
Fi(Xi,jui)
where the first factor of the numerator is the actual flexibility
(see figs 2,3) and the denominator, part of the 1/Erd factor,is a
reference value of the flexibility function of the non dimensional
geometric ratios Xi and the Young moduli ratios pi.
Two different types of function Fi have been selected for the
purposes of the present analysis, namely the function F1 , defined
in the lower box of Fig.3 which corresponds to &,,and the function
Er d Er dF2= 5 + 0.8 - - + 0.8 - -
Es ts Ec tc
which corresponds to 2 obtained from ref. 8 and referred to hereafter
as the Douglas flexibility formula.
The plastic range of the load-displacement relationship is
accounted for by a very slow slope linear variation starting from
a load P which depends on the shape and dimensions of the rivets.
The fictitious rivets which simulate the friction forces have
been represented by the sliding force Pf (see Fig.2) by means of
the parameter
Pf
Sy Ar

-9-
where Sy is the yielding stress of the rivet material and Ar the
rivet shank cross section area.
Therefore,q embodies the scatter due to the variability both
in the normal force and in the friction coefficient.
To illustrate the type of data processing performed by means
of the SKESA computer program, some typical results are shown in
figs 6a to 8b.
Fig.6a shows the influence of the friction forces on the com-
puted values of the SIF. Fig.6b shows the influence of flexi-
bility on the same quantity.
Fig.7 describes how the shape of the da/dn- AK curve modifies
with varying and q.
Each plot shows da/dn (obtained by test data and the spline
module) as a function of AK (obtained by the SIF module for
selected values of & and n), toget-er with the best fit curve
computed forcing the da/dn-AK to conform to a Paris (1 ) type K-
rate relationship.
Lastly, figs 8a and 8b show typical plots of F-data and stand-
ard deviation,a, as a function of & and n; such plots are used to
obtain the best values of and n, namely the values T and n,which
maximize (minimize) F-data (the standard deviation).
To contain the computational efforts within acceptable limits,
only a relatively small number of values of the variables and n
were used to draw such plots.
The couple of values T,n which gives extremum conditions among
the values selected for & and n, was assumed to be the best values
of C and n without trying a better allocation of the extrema by
means of some extrapolation-interpolation technique.
In this way all the values which lie in a given range around
the selected values of & and n are considered equivalent.
(1) The Paris type K-rate relationshiv has been selected insteadof other types of relationships (Forman or Collipriest) sinceit works accurately in the AK range typical of the presenttest data.
AKO

- 10 -
This approach is felt to be adequate for present purposes
since E and ni, being random variables, can be characterized by
their statistic distributions. And, if one tries to determine
such distributions simply through histograms, he only needs to
know how many values of the random variable lie within each
interval selected to construct the histogram.
On the basis of such considerations, as far as n is concerned,
after preliminary trials the following values were considered sufficient:
n1=0, n2= 0.07, nl3= 0.014, n4= 0.021
which correspond to sliding forces of
Pf1 = 0, Pf2 = 20, Pf3 = 40, and Pft. = 60 Kg,
on the basis of a rivet diameter of 1/8 and Sy = 36 Kg/mm2 .
In this way each value ni can be considered to represent all
the values lying approximately in the interval
q- 0.035 < n <ni + 0.035
As far as the selection of the variables & is concerned, in a
first trial we worked with three values of , namely
&= 0.3 =0.7 93 = 1
By inspection of the diagram obtained with such values a pre-
liminary rough allocation of the maximum of F-data was obtained.
From such an inspection it was found that C is scattered within
an interval ranging approximately from 0.1 to 1.
As a consequence of the above, a knowledge of within a interval
t ±.05 was considered adequate for the purpose of the present
investigation.
Calculations were then carried out in the neighborhood of the
first approximation best value of C with the steps in which
KAO.Ah--- 5 -

allowed us to locate rwith the said approximation.
The results of the data processing is summarized in Tables IVa
and IVb.
Tab.IVa shows the best values 7~ and n obtained in the case of
stiffened panels with countersunk rivets; tab.IM gives the same
quantities for the stiffened panels with round head rivets.
As far as the countersunk rivet data is concerned, the scatter
in n is negligible and the vast majority of values fall in the
interval 0.105 < rl 0.175 and they have been assigned the value
nl = 0.14.
For such data it was possible to obtain the cumulative distri-
bution of E.Log-normal distribution of such a variable is given
in Fig.9.
As far as the data relevant to round head rivets is concerned,
a wider scatter in T1 has been found and the present data does not
allow us to drawn conclusions in term of the distribution of such
random variables.
Further data must be collected to obtain a clear picture of the
phenomenon.
3.5 - LIMITS OF THE PRESENT ANALYSIS.
The results summarized in the previous section have two limita-
tions. The first one, which is inherent in the data processing
system, stems from the accuracy with which the spline module works.
As already explained, the logic of the present approach is to
ascribe any anomaly in the K-rate relationship to K evaluation and
to determine the best values of flexibility and friction by minimizing
such anomalies. But, if anomalies in the K-rate relationships stem
from errors in da/dn computation procedure, the best-fit technique
tries to eliminate such anomalies by modifying & and n.
As a consequence of the above, it is necessary to guarantee neq
ligible errors in the output of the spline module.
However, it is difficult to quantify the accuracy of the method
and one must rely mainly on checks performed utilizing comparison
Ah WIN

- 12 -
with known functions.
As explained in appendix 1, this was the way used in the
evaluation of the spline method.
Good results were obtained by applying the spline module to
known functions which present the typical trend of a-n data
found in stiffened panels, and by comparing the spline derivatives
with the analytical ones.
However, examination of the results in terms of da/dn versus
K as in the examples in Fig.7, gave rise to some doubts with
respect to the method used to assess the accuracy of the spline
module.
It was decided to proceed to a further evaluation based on the
following methods.
A Paris K-rate relationship is numerically integrated utilizing
SIF solutions corresponding to stiffened panels with different
rivet flexibilities.
The a-n data so obtained is then utilized as input to the SKESA
computer program.
In such a way, since the actual value of the flexibility is
known and since the errors induced by the integration are neg-
ligible, the difference between the actual flexibility and that
computed by SKESA, can be used to quantify the error in the spline
module.
Fig.1O shows the results of such an investigation. As can be
observed, errors up to 10% in T are to be found; such errors are
always on the same side and the computed solution is stiffer than
the real one. Fig.11 shows a comparison between a typical da/dn-a
curve as computed by the spline module and the actual values of
such a function.
The spline module fails to reproduce da/dn accurately only in
the two zones of maximum and minimum predicting a lower rate in
the zone of the maximum and a higher rate in the zone of the min-
imum.
Improvement in the spline module output might be obtained by
thickening the points to be interpolated in the neighbourhood of
the points of extremum.
A 10 .... .. . - - - -' ' - ' .... .. ". . . . 1 '2

- 13 -
Preliminary results of such an approach,of which a typical
example can be seen in Fig.11, indicate that such a way is
practicable even if no well founded rule of thickening is at
present available.
The second limitation stems from the nature of the scatter in
the parameters E and n. Since flexibility and friction are random
variables, different fasteners in the same stiffened panel should
be assigned different values of and q in K computation.Obviously
such a point of view can hardly be implemented within the limits
of acceptable computer times.
The present approach which is based on constant values of
and n for a given panel, gives on the contrary weighted averages
of such quantities which can be effectively used to compute the
SIF and therefore the crack growth rate.
Notwithstanding such limitations, the approach implemented in
the SKESA computer program can be considered an effective device
for analysis of crack growth data in stiffened panels in order to
obtain an engineering evaluation of the fastener flexibility and
friction forces.
4 - EVALUATION OF EXISTING METHODS FOR PREDICTING CRACK GROWTH
UNDER VARIABLE AMPLITUDE LOADING.
As explained in section 2, the next step in the investigation
concerns evaluation of existing methods for predicting crack growth
under variable amplitude loading.
Attention has been centered mainly on the following methods,
namely the non-interactive, Wheeler, 131,Bell-Eidincff, 141, and
Willenborg, 121methods.
The growth of a crack under variable amplitude loading is a
complicated phenomenon not fully understood at present.
The prediction methods largely rely upon empiricism and their
ability to compare with test data. In such conditions any approach
for the evaluation of such methods must be founded on comparison
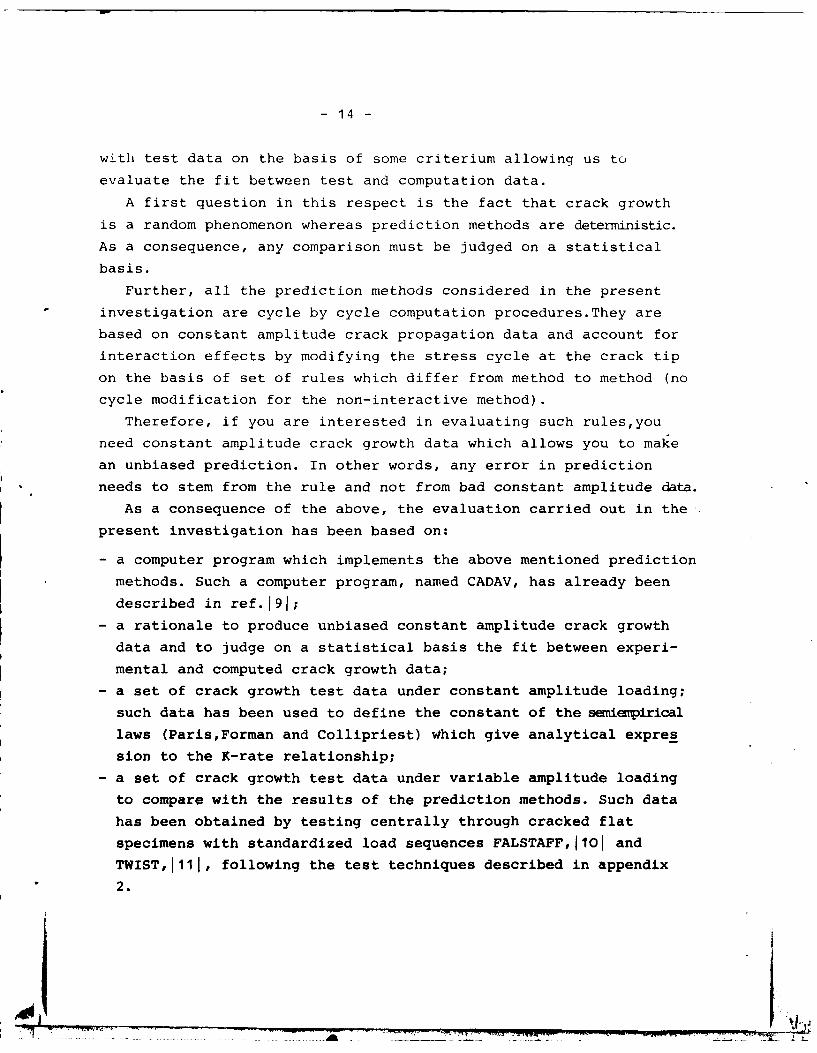
- 14 -
with test data on the basis of some criterium allowing us to
evaluate the fit between test and computation data.
A first question in this respect is the fact that crack growth
is a random phenomenon whereas prediction methods are deterministic.
As a consequence, any comparison must be judged on a statistical
basis.
Further, all the prediction methods considered in the present
investigation are cycle by cycle computation procedures.They are
based on constant amplitude crack propagation data and account for
interaction effects by modifying the stress cycle at the crack tip
on the basis of set of rules which differ from method to method (no
cycle modification for the non-interactive method).
Therefore, if you are interested in evaluating such rules,you
need constant amplitude crack growth data which allows you to make
an unbiased prediction. In other words, any error in prediction
needs to stem from the rule and not from bad constant amplitude data.
As a consequence of the above, the evaluation carried out in the
present investigation has been based on:
- a computer program which implements the above mentioned prediction
methods. Such a computer program, named CADAV, has already been
described in ref. 191;
- a rationale to produce unbiased constant amplitude crack growth
data and to judge on a statistical basis the fit between experi-
mental and computed crack growth data;
- a set of crack growth test data under constant amplitude loading;
such data has been used to define the constant of the semiempirical
laws (Paris,Forman and Collipriest) which give analytical expres
sion to the K-rate relationship;
- a set of crack growth test data under variable amplitude loading
to compare with the results of the prediction methods. Such data
has been obtained by testing centrally through cracked flat
specimens with standardized load sequences FALSTAFF,1101 and
TWIST,I111, following the test techniques described in appendix
2.
A01 t

- 15 -
4.1 - THE RATIONALE OF THE PRESENT APPROACH.
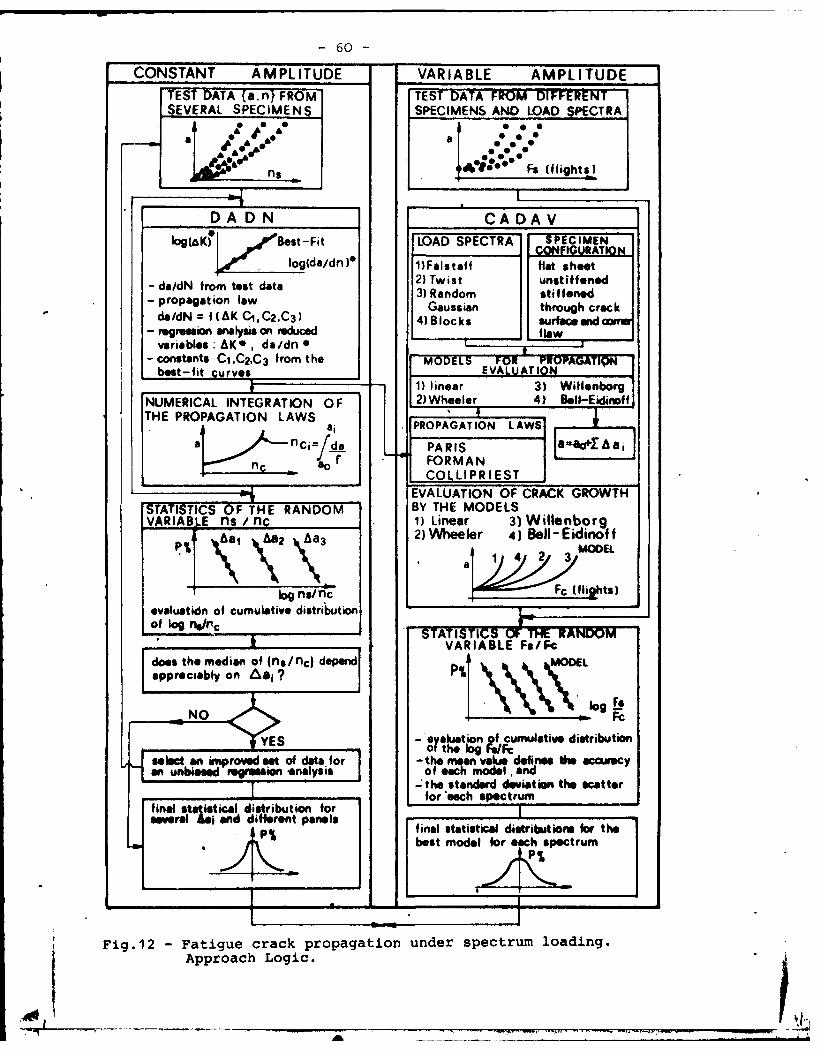
Fig.12 shows the main steps of the rationale.
It comprises two main lines which refer to constant amplitude
data generation and analysis and variable amplitude data generation
and analysis.
The objective of the first line is the determination of the
semiempirical laws (Paris,Forman,Collipriest-Walker) for the
material used in the variable amplitude tests with sufficient ac-
curacy to allow us to make an unbiased prediction of crack growth
under variable amplitude loading.
To this end starting from the crack growth data obtained with
the constant amplitude test program, (see sec.4.2), the following
main operations have been carried out:
- generation of K-rate relationships in the form given in the
Paris,Forman and Collipriest law by means of the SKESA computer
program. SKESA selects the constants which define such laws
through a regression analysis substantiated by the usual signif
icance tests;
- computation of the number of NC cycles necessary to reach a given
crack length by integration of the best fit curves defined in the
previous step;
- comparison of the experimental crack growth data with the data
computed by means of a statistical analysis of the random va-
riable nex/nc (nex being the test value of nc). Such an analysis
consists in the determination of the cumulative distributions of
nex/nc for different crack lengths with data coming from several
specimens.
The first attempt at best-fit gives an unbiased prediction only
if the medians of the distributions corresponding to different
crack lengths have, apart from small differences, always the same
value (nex/nc)M = 1.
If this is not so,it means that the semiempirical laws do not
- 16 -
follow the same trend as the test data in some part of the growth
interval. A typical cause of this state of affairs is unprevented
crack lip buckling in the high crack length range which increases
the crack growth rate with respect to the unbuckled condition
which the SIF solution refers to.
In these cases, some test data must be left out and the steps
previously taken must be repeated on the reduced set of a-n data.
Once unbiased constants of the semiempirical laws have been
obtained, evaluation of the variable amplitude data can be carried
out.
The main steps of the variable amplitude line are the following:
- utilization of data from damage growth tests in specimens subjected
to variable amplitude loading.
These tests must be conducted with specimens made of material
taken from the same batch used in constant amplitude test spec-
imens. Different standardized spectra can be used, namely FALSTAFF,
TWIST and Gaussian random; tests with different values of refer-
ence stress of spectrum can be performed. For each case -assigned
specimen and spectrum at a given value of reference stress- a
sufficient number of tests are performed to provide a meaningful
statistical analysis;
- prediction of damage growth with the non-interactive, Wheeler,
Bell-Eidinoff and Willenborg methods for each test case.
The computer program CADAV is used for this purpose;
- comparison of the experimental damage growth data with the theo-
retical data. The comparison is obtained by determining the cumu
lative distribution of the random variable Fex/Fc, Fex being the
number of flights in which the damage grows to an assigned value
of size and Fc being the same data obtained with the prediction
method.Such a distribution is obtained for different intervals of
damage propagation, utilizing an adequate number of tests. The
median value of Fex/Fc can be used to measure the fit between
test data and prediction methods. Median values near one for all
the distributions indicate an excellent capability of the method
Alk " 4

- 17 -
to predict crack growth under variable amplitude loading.
Scatter around the median value is another important piece
of information that can be obtained from inspection of the dis
tributions. In particular, comparison of scatter between constant
and variable amplitude data is of fundamental importance.
4.2 - EXPERIMENTAL RESULTS AND ANALYSIS.
4.2.1 - constant amplitude.
Following the rationale of the previous section, constant ampli
tude tests have been performed in order to obtain the expression of seim
iempirical laws.
Twelve flat specimens with central through crack made in 2024-T3
have been tested for various values of the ratio R=SMIN/SMAX. The
test apparatus and test procedures are shown in appendix 2.
A detailed explanation of data processing is given in ref.191.
Here the final results are reported as far as the Forman law
determination is concerned. Fig.13 shows data for all the tests and
the best-fit straight line as obtained by regression analysis,
together with the scatter band of 10%-90%. In the same figure, the
values of the typical constants of the law are also shown.
Fig.14 shows the best-fit straight line relevant for tests with
different values of parameter R. The three straight lines lie very
close to each other and demonstrate the effectiveness of Forman's
law to describe damage growth phenomenon at different values of R;
this is an important requirement for a law which must be used in
prediction methods for variable amplitude loading.
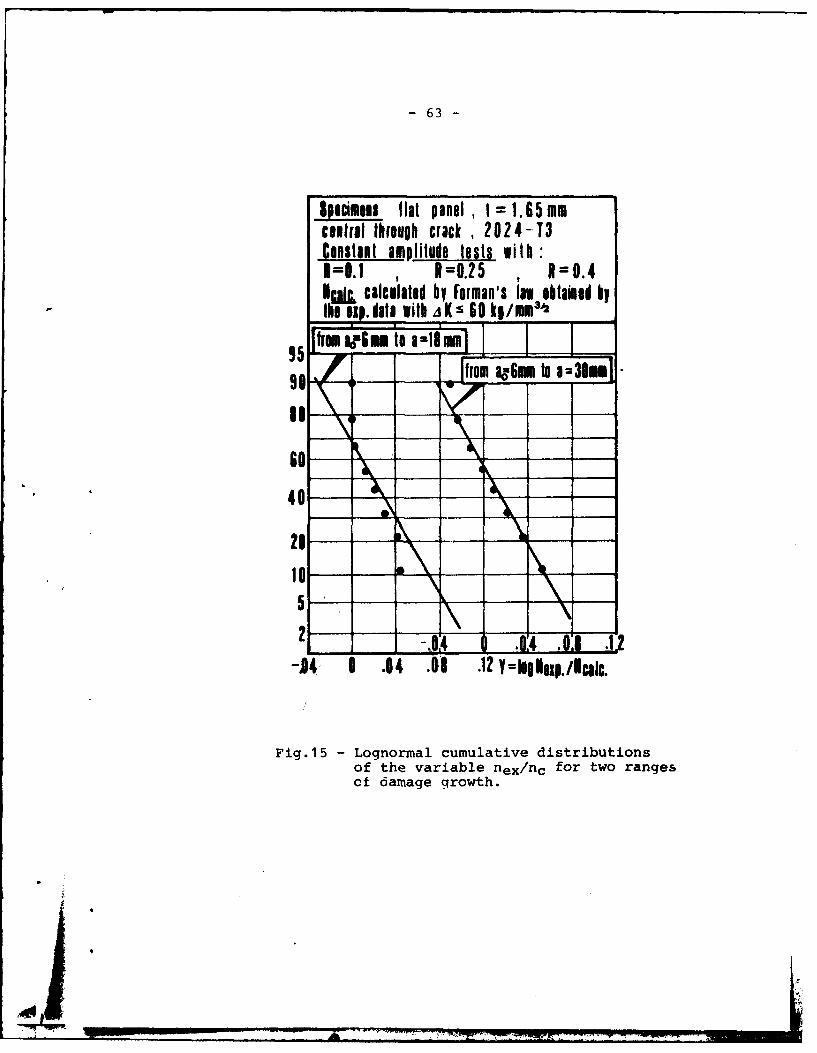
The Forman's law so obtained has been further analyzed with
respect to its capability to predict the number of cycles needed
to propagate the damage from the initial dimension to an assigned
dimension. The results are given in Fig.15a which shows the dis-
tribution on normal probability paper of the variable log(nex/nc)
for two intervals of cracks growth.
_ _ _ _ _ _ _ _ _";.

- 18 -
For the propagation from ao = 6 mm. to a = 30 mm., the distri
bution is normal with significant accuracy, and the median value
is very close to zero; it means that the Forman's law obtained
is fairly representative of the crack growth phenomenon in this
crack interval.
For the propagation from ao = 6 mm. to a 18 mm., the law does
not work so accurately as in the previous case.
This state of affairs may be ascribed to higher relative error
which affects the test data in the low crack length range since
the error in measuring crack dimension is constant. Nevertheless,
the prediction can still be considered satisfactory and the law
so determined has been used in the prediction methods for crack
propagation under variable amplitude loading.
4.2.2 - Variable amplitude loading.
For the second aspect of this research, seven tests have been
performed using FALSTAFF spectrum,101,( I ) with SMAx = 235 MPa on
flat panels centrally through cracked made with material 2024-T3,
drawn from the same batch used for specimens of constant amplitude
tests. The test apparatus and procedure are described in appendix
2.
The results of the analysis are shown in Fig.16 and Fig.17.
Fig.16 shows the crack length versus the number of flights as
obtained in the tests of the seven specimens and as predicted by
the non-interactive, Wheeler, Bell-Eidinoff and Willenborg meth-
ods.
Fig.17 shows the distribution on normal probability paper of
the variable log(Fex/Fc) for two intervals of crack damage.
Such a variable conforms to a normal distribution for the two
intervals. The scatter of phenomena, measured from the standard
deviation of the variable, is pratically the same as that found
(1) Preliminary tests using the TWIST spectrum have been also performd. The results are given in ref. 191.
A O. . . . .- -

- 19 -
in constant amplitude data. Such a conclusion seems to indicate
no particular effects of delay or acceleration effects due to
peak load on the scatter.
For each prediction method the median of the distribution (50%
value) provides a good indication of the correctness of the meth-
od.
The results are still limited and therefore no general conclu
sions can be drawn, but certain trends in the flat panels are
well established. The non-interactive method predicts life in the
safe side with a factor of about 6 in accordance with the pronounced
delay effects due to the high peak loads typical of the FALSTAFF
spectrum.
The Wheeler method, with an adequate selection of the value of
its plastic zone characteristics constant, m = 1.9, produces an
"exact"s prediction, namely the mean value of random variable log
(Fex/Fc) equal to zero.
The Willenborg method gives unconservative results with the
FALSTAFF spectrum, where the presence of high compressive loads
produces crack acceleration which is not taken into account by
this method.
The Bell-Eidinoff method does not tally satisfactorily with ex
perimental data. A possible cause of this state of affairs may be
ascribed to the fact that the values of the empirical constantswhich are taken from the existing literature and which are used
to characterize the delay and acceleration effects, might not work
very well with the material used in the present investigation. The
values of such a constant directly determined by ad-hoc teats might
improve the prediction.
The test program on stiffened panels under standardized spectra
is now in progress and in this case the experimental data obtained
so far shows a larger scatter, Fig. 18, with respect to the flat
panels.
The data of Fig. 18 is still preliminary and no comparison withthe calculation method has yet been made.
AOU

- 20 -
5 - CONCLUSIONS
An investigation on fatigue crack growth in aircraft structures
is currently being carried out at the Institute of Aeronautics of
the University of Pisa, Italy, under contract DA-ERO-78-G-107.
The final goal of the investigation is the development of a
reliable method to predict the growth of a crack in built-up
structures under operational load conditions.
The first year's results, presented in this paper, mainly
concern the two following topics, namely
- crack growth in riveted stiffened panels under constant amplitude
loading
- crack growth in plain sheets under variable amplitude loading.
As far as the first topic is concerned, the results are relevant
mainly to the evaluation of the rivet flexibility and friction
forces between stringer and sheet-cover. The results of crack
propagation tests of stiffened panels part of which are riveted
with countersunk rivets, the others with round heat rivets, have
been analysed with a SKESA computer program developed ad-hoc,which
allows us to obtain the average values of the rivet flexibility
and friction forces. SKESA computes such quantities by searching
for the best regression in correlating the da/dn crack rate with&\K.
It works with a good degree of accuracy,the errors in final
output being generally of the order of 5% and in each case not higher
than 10%. They depend mainly on the spline module which computes
da/dn from the test data a-n, and could be reduced by a rational
thickening of the points (a,n) to be interpolated in the neigh-
bourhood of the flex points in the a-n curves. This state of af-
fairs implies a modification in the test technique with a different
selection of the reading spacings in the measurement of the crack
length.
Notwithstanding such errors the SKESA computer program represents
a valuable device which allows us to obtain quantitative information

- 21 -
on flexibility and friction which can be then confidently used for
analysis purpose.
In particular, it has already been possible to obtain conclusive
results as far as countersunk rivets are concerned, by defining
the cumulative distribution of the flexibility parameter C, and
finding the range in which the friction parameter n lies. On the
contrary, in the case of round head rivets, the pattern is more
scattered and there is still not enough data available at present
for statistical analysis.
New research in this area will be carried out, in the continua
tion of the program, by improving, if possible, the spline module
and by producing further test data with stiffened panels construc-
ted with different types of fasteners.
As far as the second topic is concerned, four methods for com-
puting crack growth under variable amplitude loading have been
evaluated.
Such methods are the non-interactive, Wheeler, Bell-Eidinoff and
Willenborg methods.
Evaluation has been carried out firstly by producing constant
amplitude crack growth data to obtain unbiased semiempirical laws
(of the Paris, Forman and Collipriest type) and then performing
variable amplitude crack growth tests with the FALSTAFF spectrum
on specimens made with material coming from the same batch as the
constant amplitude test specimens. The numbers of flights necessary
to increase the crack in a given interval Fex as obtained by
testing different specimens, are compared with predictions Fc asobtained from the CADAV computer program, which implements the
above mentioned method by utilizing the previously determined
semiempirical laws. The comparison is made on a statistical basis
by finding the distribution of Log Fex/Fc for the different meth-
ods and for different crack growth ranges. The median of the
distribution is then used as measurement of the accuracy of each
method.
The results obtained up to now indicate that the Wheeler meth-
od can be confidently used at least with the FALSTAFF spectrum.

-22 -
An important conclusion of this analysis concerns the scatter
which has been found to be of the same order both in constant
and variable amplitude tests.
Further research in this area will be carried out by per-
forming tests both on plain specimens and stiffened panels util-
izing new loading spectra (TWIST and Gaussian random loads) and
increasing the test data obtained with the FALSTAFF spectrum.
Al1P"K

- 23 -
REFERENCES
1 - SCHIJVE J. - Observations on the Prediction of Fatigue
Crack Growth Propagation Under Variable Amplitude
Loading,in "Fatigue Crack Growth Under Spectrum
Loads", ASTM STP 595,American Society for Testing
and Materials, 197 6 ,pp.3-2 3 .
2 -WOOD H.A. - The Use of Fracture Mechanics Principles in
the Design and Analysis of Damage Tolerant Aircraft
Structures, in AGARD Lecture Series n.62 - "Fatigue
Life Prediction for Aircraft Structures and Materi
als", May 1973.
3 -WHEELER O.E. - Spectrum Loading and Crack Growth - J. of
Basic Eng., Trans. ASME, Series D, 1962, pp. 18 1-1 8 6 .
4 -EIDINOFF H.L.,BELL P.D. - Application of the Crack Closure
Concept to Aircraft Fatigue Crack Propagation Ana-
lysis - The 9th ICAF Symposium, May 1977.
5 -ELBER W. - Crack Growth Under Spectrum Loading, a Crack
Closure Model - NASA TM X-72708, National Aeronautics
and Space Administration, 1974.
6 - ANTONA E.,GIAVOTTO V.,SALVETTI A.,VALLERANI E. - Fracture
Mechanics Approaches in the Design of Aerospace
Vehicles. Proceedings of the 11th ICAS Congress,
Lisboa, 1978.
7 -SALVETTI A. - Fatigue Crack Propagation in Structures Stiff
ened with Riveted Stiffeners, Example Problem
3.4.2.8, in "Pratical Applications of Fracture
Mechanics", AGARDograph, Preprint.
8 - SWIFT T. - The Application of Fracture Mechanics in the
Development of the DC-10 Fuselage, in "Fracture
Mechanics of Aircraft Structures", AGARDograph 176,
1974, pp. 227-287.
K L ... ...r -... - ..... ..... - i''T :2

- 24 -
9 - CAVALLINI G. - Crack Growth Propagation under Variable
Amplitude Loading in Aerospace Structures,Conve
gno di Studi sulla Fatica nelle Strutture Aero-
spaziali, Torino-1978, ICAF Doc. n.1091.
10 - VAN DIJK G.M.,DE JONGE J.B. - Introduction to a Fighter
Aircraft Loading Standard for Fatigue Evaluation,
FALSTAFF-NLR MP 75017 U, 1975.
11 - DE JONGE J.B. et alii - Standardized Load Sequence for
Flight Simulation Test on Transport Aircraft Wing
Structures, NLR TR 73029 C, 1973.
12 - Mc.CARTNEY L.N.,COOPER P.M. - A Numerical Method of Pro-
cessing Fatigue Crack Propagation Data,Engineering
Fracture Mechanics, 1977, Vol.9,pp.265-272.Pergamon
Press.
i ,

- 25 -
APPENDIX 1 - SPLINE TECHNIQUE
One of the most difficult problems in analysing crack propa-
gation data is the definition of the crack rate, that is how to
"differentiate" the discrete raw data obtained in experiments.
The problem is of great importance, since the parameters of the
semi-empirical laws of crack propagation, which link the crack
rate da/dn with the AK stress intensity factor range, are
strongly influenced by the accuracy with which the derivatives
da/dn are computed.
In the past a common solution for the problem, especially for
data obtained from simple sheet panels, lying in this case on a
smooth curve, has been provided by techniques such as finite
difference methods. But the data points are subjected to a degree
of scatter which results in large errors of growth rate when
using this method. So the technique of fitting a continuous curve
to the data points using the least squares concept has been
developed, and the crack growth rate can be obtained simply by
differentiating the analytical expression of a (n).
At first, a method of fitting a cubic polynomial function was
adopted but, for the case of stiffened panels,it was decided to
make use of spline function (piece-wise continuous polynomial)
and a very good fitting was obtained.
The method adopted, explained in detail in 1121, consists in
fitting in the least square sense a curve of the type:
n = X - Y ln(a) - + (1)p=i
to the experimental data points (aj,nj). The first part of the
expression is a function of a class suggested by a cumulative
concept of damage, while the second is the spline function,with
polynomials of degree k connected at knots Kp. Following the
usual method of minimizing the sum of squares of residuals, a
computer program carries out the computations for selecting the
best-fit values of the parameters X,Y,Z,Xp of eq.(1).
I&. 77_77-777

- 26 -
Tests have been performed to choose proper values for the
number of knots and for the degree of the polynomials and the
results show that the values selected of 4 knots for long cracks
and 3 for short ones, together with 4 for the exponent, lead to
satisfactorily small errors.
Tests have also been carried out by monitoring the errors
made when comparing the derivatives of known functions (such
as polynomials, trigonometric functions, etc..) with their
approximations obtained by using the spline function method.
The results have been considered satisfactory and so the meth-
od has been adopted as a standard for getting crack growth rates
from experimental points.
Other comparisons have also been made with functions represent
ing propagation curves of ideal stiffened panels under constant
amplitude fatigue loading; the results have been discussed in the
text, paragraph 3.5.

- 27 -
APPENDIX 2 - TEST APPARATUS
The equipment prepared for the damage propagation tests is com
posed of two different load machines, of the load spectrum gener-
ation system (in variable amplitude loading tests) and the defect
growth measuring system.
The first piece of loading equipment is composed of a Servotest
hydraulic actuator, controlled in closed loop through a set of six
servovalves, capable of + 500 KN or + 100 KN (static and dynamic),
fed by a 125 HP power pack with an oil flow rate of 190 Lt./min.
For constant amplitude tests, the control unit of the machine
directly drives the execution of load; for variable amplitude
loading spectra an external input is available. The actuator is
mounted on a very stiff rig and the specimen is clamped to the rig
and to the load cell of the actuator with grips which hold the
specimen by friction. Moreover, anti-buckling guides are available
both for flat specimens and stiffened specimens.
The second piece of equipment is composed of a Servotest hydrau
lic actuator, controlled in closed loop through a set of two
servovalves, capable of + 250 KN or + 50 KN (static and dynamic).
This actuator is in every way similar to the first, is fed from
the same power pack and is mounted on a similar rig.
The electric signal, which drives the actuators in the case of
variable amplitude loading, is generated from a process computer
PDP 11/34. Preliminary tests for determining the maximum working
frequency are performed for each condition, loading spectrum and
flexibility of specimen.
The input signal in the actuator, representing the desired
spectrum, is compared by PDP 11/34 with the response of the ac-
tuator, namely the output of the load cell. The working frequency
selected is the highest one for which the difference between
input and output is not significant. During the tests the output
of load cell is also continuously fed to the PDP 11/34. In this
way, checks of coincidence of the two signals can be periodically
performed. Moreover, if the machine stops because the maximum and
-I*~

-28-
minimum load limits are surpassed or for other reasons, the PDP
11/34 commands the arrest of the input signal and prints the
number of flights at that moment.
The defect growth measuring system is formed essentially of
a 30 magnification telescope, whose position can be regulated,
with a movement parallel to the propagation direction, along
a bar, which has a millimetric scale; a vernier is applied to
the telescope bearing block, allowing the defect dimension measure
to be taken with a 0.1 mm. precision. The number of cycles, or
more exactly the number of flights in the "flight-by-flight"
spectra case, at which the defect has reached the measured
dimension, is written on a printer connected to a counter in
which the actuator load cell signal is fed: the printer is ac-
tivated directly by the operator who makes the observations. In
the case in which the spectrum is generated by the process com-
puter, the flight number is directly printed on the telescope type
when the operator sends a proper signal to the process computer
input. The whole measuring system allows us to take highly
accurate measurements, certainly adequate for the purposes of
this research.
LiO

- 29 -
unstiffened sheet K -RATE CURVE
Ka K K
da
dn
daI a 'ofdo
stiffened panels: K EVALUATION AND K-RATE CURVE(z-like curve)
da
SdIA Kcu RE
a dn X
K //\ '"'actunl ,,,-, li
.1<,, . *- - ',
'"~0 litd ...
stiffened 08s2 : in EVALUATION AND K-RATE CURVEdo [lo- like cmuil
a K
do K
K' tev 1 11
Fig.1 -Typical anomalies in K-rate relationships in stiffened panelsdue to errors both in Sir and da/di computation.
-30 -
EXPERIMENTAL APPROACHS TI F FEN ED PANE L SINGLE IOINT SPECIMEN
FASTENER FLEXIBILITY TESTS
*C rack propagation4 4 4 tests
- NUMERICAL APPROACHNUMERICAL EVALUATION OF FLEXIBILITY PARAMETERS
constant am pli -p'ystiffened panels L FvraLEXprm
_a-n CURVE __ibl _aai)
NUERIAL AK EVALUATION FLEXIBILITY AND FRICTION PARAMET.
"spline function, displacement compa- EXPERIM FLEXIBILITY FLE X..XAel /Pinterpolation methodi tibIlity method plus
dajoint flexibility plus F E!La friction forces FLEXIBILITY PARAM. FE
AK "OeFE DOUGLAS
aa FRICTION PARAM Pf
BEST- FIT A N ALY SI S SIMPLIFIED MODEL OF FICTITIOUSRIVET SIMULATING FRICTION FORCES
AK Statistical dataAK ~ determination:
FDATA~~ DfAilA/arouandta8t-Fi
Fig.2 Raonl f orrevlating atnrfeiiiyadfitoforcesfro f tes daieta 4

-31 -
IAS~I NCR ILVXlBILI I Y -- MHOR[TICAL APPROACH
AC.TUA I SI I (JAI ION
I A'af NLNI I iX ItBI II I V + uiLI b
ff01 t 01I Of ROUNDNE SS
t I M E ,i -^SHE
HYPOTHESIS H YPO0T H ES IS
I infinite plate 1 elastic displacements-- 2 elastic displacements 2 heads perfect restraints
.I plane stress distribution 3 p(t) constant in thickness
SIMPLIFIED MODEL SIMPLIFIED MODEL
P P(t)
P
SOLUTION
Icorrct sn I M085P L(tIltt?)3 t1%I1A SEPD ? d3 d 3~t
SHEEISliff. Eij' - -- 11EA.~
TOTAL DISPLACEMENTSHEAR BENDJING 0.0.R. SHEET 001511IFF.
[ t311+2 +0. t1 +t 3 +08t + MtL .W2-
Fig.3 -Simplified method for predicting rivet flexibility.
AO.

- 32-
Ile
A r 04 rC R A C K
/ ~~RIVET "J.
DEFLECTION
ACTUAL RIVEr FORCE
FRICTION FORCE OF FICTITIOUS RIVET
Fig.4 - Idealization of the friction forces by means offictitious rivets.
AOOI

"'0
Q)
c
a)
cn
z
_ -00 4J
a)
4
00
'0
4-)
'CO $.4
aL 44
04
'4
CD 0

-34 -
o do
Co)
C0
C/)~I
LAJ 0
:U,I-
0
_ - 0
AIO 8 R,

-35-
I -n
) E
c0 4-)CD a)
__I '>
0)-
(0(I O
0 )
Lfl U)
cv lLU 0
01-0
4-4w-444-)
v, 0'44
Z LU4-)
0 a. ldUU,
0N
C- Go -m
J& 7117U

-36
l Co E U
C)z
02
0
oo
0
'4J
o .4J
(n
4JJ(n
4n0
5-4
S 0.44
Go 0
C)-i
"4
4J
4-4
R6 oo VAk3

37-
Ln LnLA ~ -U)*i E
E U
C) :j
(FU
0
Go 0
00
(0D
00
C U
4i
4-,
t U)I r- w
0
*-P
.1-q
OD* 44)
-4)-H
I 4
U, 0
CM
'44
9E O ( CV r1
AIOA
4. R a

-38 -
45 , -1 1 1- -
I__
_ _ __ _ _ _ _
TEST CRIC 84K =0.60
kr )=0.07Of
FDATA 7892.5
Al4 I
* dn 14mm/cycle)Fig.7a -Test CRIC -8: shape of da/dn vs. AK for different
values of sand rn.The dots correspond to couples ofvalues da/dn,aK as obtained by spline and K modules.The continuous line is the best-fit curve.
AIO7
-

-39 -
45----
AK =0.60 __
(AMIV) '1=0.21FDATA -115 63.2
40 -- --
Fig7a- Cntnue n10 Imm/ycle)
Fig.7 Contnue.
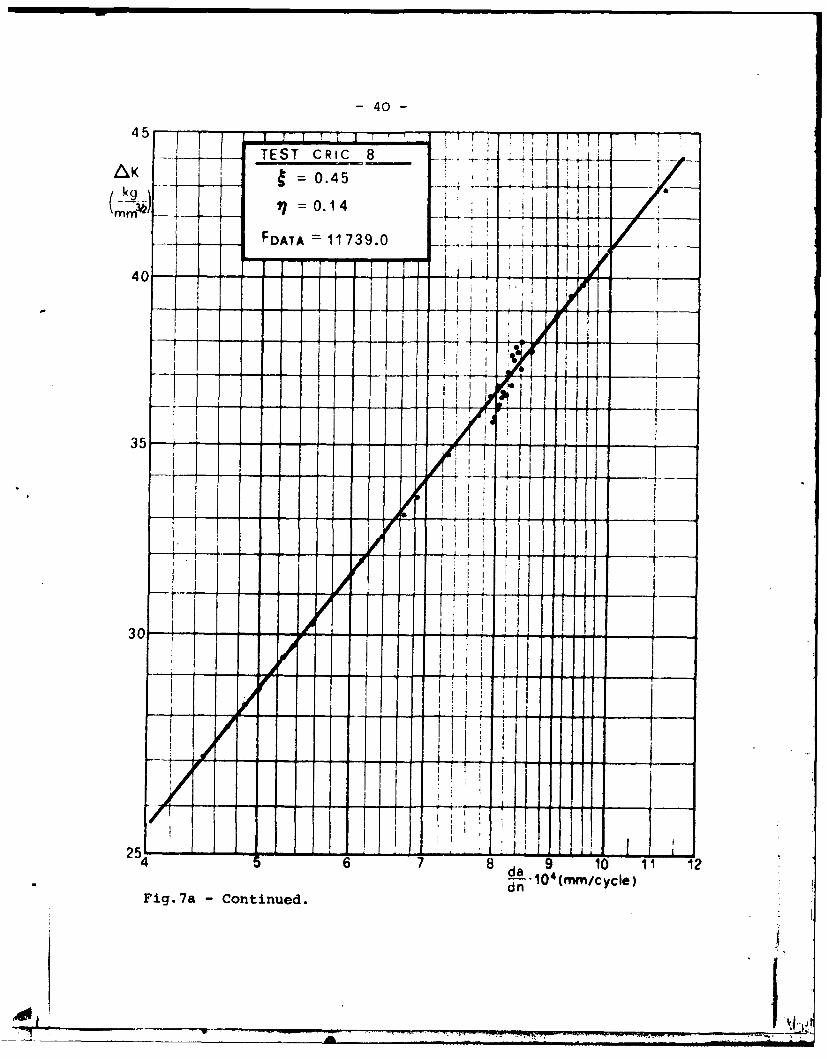
-40 -
'~ 7 - TEST C RIC 8 -- 4' V 7 TAK =0.45 i i
__ 1J = 0.14
40-
Fig. ~F 7a-Cotnu
3I5

- 41 -
TEST CRIC 8AkK ,=0.70
kg.M- '=0.14 .1
FDATA = 12499.0
40 - "
I yI1 I I_---- . -
,---o-,. , -i
30-
,2'E I I I 1 1 lI
dn1'(mm/cycle)
Fig. 7a Continued.
/ KA&i

-42
TEST CRIC 8 :I
Akk I = 0.60 --
mrvX 1) = 0.14 1 H~ I IIO
FDATA 31058.3 --
40 - ----
a n -14M/yl)
Fig.7a -Continued.

- 43 -
3 0 -I ,
AK -TEST CRIC 5 , -
k 0.20
11 0.14
FDATA = 1767.4 1 -
I T25 -, "- -" -4---4---
200
--_ -10
- -n- 4cy1le)~
ii lK
Fi.7 Tes CRC 5 a S Kfrdfeetvle
o2 In
Fig.7b s a et thIC hig5:rdalue s ofo diferntvaue
of~ ndnpoteda eplindi Fi.a Il
als a te igervaue of FDAT,

- 44 -
30 TI
AK TEST CRIC 5 - i-_V-__'
MU ~0.30 -
1) =0.07 * /
FDATA 1905.3
-I - - - - I : i '
25 - ---7------*
200
_ _ I.1T I
* I t
0, I 1 111
15 1. 2
_ _ I
i I
0.1 I'I cyleS I I
* I15 - - - - I , ;
1.5 2da104
dn 1 (mm/cycle)
Fig.7b - Continued.
V l
- 45-
30 '
AK TEST CRIC 5 j
FDATA = 1952.8 .
2st I t
I I -., -
--- '--I F
* I
01
20/ . , f
' I
- " *, I04
- I •
1.5 2 351.1a5310' (am/cycle)dn
Fig.7b - Continued.
-J .

- 46 -
30 T IIIAK TEST CRIC 5t ky -0.4 5. . . ____.,_ ,
7)= 0.14
FDATA = 1992.5
25 -I _ _, __.. . .
- --I -i- - -- , , --
T-
'' t1
-a104 (mm/cycle)
Fig.7b Continued. ' t9

- 47 -
30l TI .T
,LK ~TEST C R10 5
= 0.14 I
FDATA 2180.6
2- - -j
! L e IiicyleI.
II ,iI
20 .7 . .. ...nue,,.
/"f
Is
t: i ___ JI I
15 ,-- 2 " '' 3 4da-. (mmnlcycle)
Fig. 7b - Continued.

- 48 -
4 5 1 T: " I I I - '1 ' T L ., ITEST CRIC 1AK 0 .30
mr J. 11=0.07 .40 -
FDATA = 1168.3
400
35 4I A . IIIII I1 11 111
30
4 6/0r I
250 6 /"d 0 1 1
an llO(mm/cycle)
Fig.7c -Test CRIC -1: da/dn vs. Ax for different values of& and n, plotted as explained in Fig.7a. In this caseloop-type anomalies are present also at the highervalues of FDATA.
40l

-49 -
TEST CR10 1AK 0.20
m~ 0.14
FD'ATA =1319.0
400
30
678 da 9 11 12
Fig.7c C ontinued.

- 50 -
TEST CRIC I ± ,A K - - .. ... .t K 0.30 .... . ....(MV 6.21 V-
FDATA =13 71.5j
40-------- - -"
- - - -r'-* - *--_
- - -------.. - - i ;4 •1
YI I I
I i
, i _ __I
3 5- - - - - - - - - - ,~ I
IIII 1-4
300
00,
254~ - - - - - T .-104(mmn/cycle)
Fig.7c -Continued.
My, "UMT O Wm ma, 0 pp

- 51 -
45- -- IT.TEST C RIC 1 ..
AK O4 TT(E)
T 0.14
FDATA= 1384.5
40 - - -- - -- pI I I
.. 0
3O - --- - --------
! -
---- - - -
i-
-- -'--
-- 4~ 6 - 7 8 da 9 10 11 1Si (mm/cycle)
Fig.7c -Continued.

- 52 -
4 5 L I I , , T I I I il!
TEST CRIC 1 - 1 --4AK 0.30
(M) = 0.14 K__FDATA = 1638.4 -
40 L i--
35-
iS
I IA
300
0
25 6 7 8 da 9 10 11 12
n- 104 (mm/c Ycle)
Fig.7c -Continued.
-53-
-4 H tn
-d >4 ~U) C
-1-4
0)O i 4 E-4 44 . § 0~'-
f-4 g00C~j a) Q~ () 0 3 1
0 C5 AAA 3t04-)
o-4to 0
k~ 0 ----
r -i or.:-- -y r. 0 - - -
U) 4 4-1() 4-)~ 0
U. ) to t-d HPU4
w .co0-H .00
JZ4 10 4'-)
- l I
U- - k -r - -C*Q 4- Q) U. 4. '

-54 -
Cieo
L000 -v h cc - W -Ln m - -

-55 -
0-
0 0
I-H
'r1
(~) 0
LU 0I--
('"4-~~~~~~~ -I - -_ _ -
-~~~~~~ ~4 ---- - -. O
Too ~ r- ~ Ifl~ N oc~ r-.ID( -rzV4 w
____ ___ __> r.:

-56 -
Goo
I IN I I
U) -- It I- -V-
wA
LU
C-%I
a h o N-- - C- M ao - - - - - C
v-

- 57 -
99.9r ..
99.5 B
A
95 A
90--
0 80-00
90 -' 50 A..
-40
", 20-
10
5-
2-
0.5
0.05 0.1 02 03 0.5 10 20
2/ I -~ l
Al0.05 01 0.2 0.3 0.5 1.0 220
Fig.9 - Log Z distribution. The curve A is relevant to n = 0.14. The median value is [-= 0.49 (1 = 0.686) and the standard deviation is 02=0.219 (01 =0.307). The re-sults indicate that the flexibilities foundwith this approach are noteworthy lower thanthose predicted by Fig. 3 or Douglas formula.The curve B has been obtained considering allthe Z belonging to the same population irre-
,, spective of the values of n •
C

-58 -
! ca c.1.2 -_ __
1.0__/
0 2A.6 .8_ / .0
Fi.1 rrr fud n& vlutindu o ror n/h_ _ _n~mdue Wihnrne fpailitrs
0.420. h bslt erri lwrthn00
an4 th reaieerri oe/hn1%

- 59 -
da 1051 I
dn spline f. with thickened pointsmrm/cycle)
80 spline f. with eq. points
theoretical curve
70 !60
50-
40
30 a (rnm)20 40 60 80 100
Fig.11 - Typical errors of the spline interpolationtechnique. The curve with equidistant pointsin representative of the present approach.The curve with thickened points gives an ideaof potential improvements that can be obtainedby a modified test technique which provides moreinformation in the neighbourhood of maximum andminimum points.
- 60 -
CONSTANT AMPLITUDE VARIABLE AMPLITUDETEST DATA (a,n) FROM TEST DATA FROM DIFFERENTSEVERAL SPECIMENS SPECIMENS AND LOAD SPECTRA
a S o SF_ (flights)
DADN CA DA V
Iog(lK) IBest-Fit LOAD SPECTRA SPECIMENCONFIGURATION. Iog(da/dn)* 1)Falstaft flat sheet
- da/dN from test data 2) Twist unstiffenedpropagation low 3) Random stiffenedGaussian through crackdo/dN = f(AK CI,C2,C 3 ) 4) Blocks surfaceand andregression analysis an reduced flawvariables :• AK * , d /dn 0 # "
- constants C1,C2,C 3 from the M F 1ROPAGATIbest- fit c:u rves [ E VAT5 AT ION
- !1) linear 3) WillenborgNUMERICAL INTEGRATION OF 2) Wheeler 4) BelI-EidinoffTHE PROPAGATION LAWS 4 1
a PROPAGATION LAWS,a ncid a PARIS aao+A.r a ai
J~ ~ "'n c soa f FORMAN J
[ = COLLIPRIEST J
EVALUATION OF CRACK GROWTHSTATISTICS OF THE RANDOM BY THE MODELSVARIAB1E ns / flc 1) Linear 3) Willenborg
Aa1 2 3 2) Wheeler 4)Bell- Eidinof f4 MODEL
log no.n Fc (fnsft.)evaluation of cumulative distributionof log ne/rS* O AHL E ANDO
1_ VARIABLE Fs/Pcdoes the median of ins/ nc) depend MODELappreciably on Aa i ? P \
NO <F
Y E S e-eation of cumulative distributiono0 the log F*/Fc
selact an improved set of data for -the mean value defines the accuracyan unbiased regression analysis of each model, and
-:the standard deviatimn the ecatterfor *each spectrum
final statistical distribution for Iseverl l ind different panels final statistical distributions for the
e P best model for ech spectrum
Fig.12 - Fatigue crack propagation under spectrum loading.Approach Logic.
1 )_ _ _ _ _ _ _ _ _ _ _ _ _ _ _ _ _ _ _ _ _ _ _ _ _ _

- 61 -
specimens -lat pan . 1.60mm 9o%central through crack,2024-T3 50%Con-st amplitude tests with %I-0.1, R4O25 , R=0.4 %
:Formanil law r
I. , 0_L .OL248.10 (4K) - -!
dl U R1-R )Kc- K .
AIT
-2
1010 1
10Fig.13 - Regression analysis on experimental
data for evaluating Forman's law.
,,i ±

- 62 -
SSpecmn flat pane t=1.G5 mm ,- central tbrough crack,2024-T3- Co.st- i iide es with R".4
big R=.1 , 1=0.25 , R=0.4 -R=i.25Faman's law
- -j11 '.1248'O [AK) *S17
1 1 [[I-R]Kc-AK] - ] ""-Ol
Ca
1
1100 A K
Fig.14 Regression analysis on experimentaldata for evaluating Forman's law.Best-fit straigth lines for datarelevant to R=cost.
- 63 -
Specimen: flit panel, = 1.65mmceelril through crack , 2024-T3Constant amplitude lests with:3=3.1 , 31=0.25 , 1 = 0.4lI L calculated bv Furman's law obtained bythe ui data with AK - 60 kg/mm3'I
95~ ~ t 3fo li =13wIso Winm aglimm Wo a3=1
60
40
20
1052 -.04 0:4 L I .
14: 0 .04 .18 .12 Y=le1p./llcalc.
Fig.15 - Lognormal cumulative distributionsof the variable nex/nc for two rangesc damage growth.

-64-
(mm)42___
34 -- __ __ __
26
Il 0
1-'
10 1000D 2000 3000 4000 5000 6000
Specimens :flat panels I = 1.,65CenWa through crack ,2024-13Load spectrum : FALSTA FF Sinai 235 MPa (23.9 ke/ifMMf2I
eperin. data 9 Willenbo methodI ISPucMImuSi m= 1.8 5
o non-interactive method M i=1-8 LWheler methodBiDll's method *M=4 J.
Fig.16 - Comparison of test data with prediction.

- 65 -
Specimens : flat panels , t = 1.65Central thtouoh crack, 2024-T3Load spectrum : FALSTAFF Smai-235MPa (23.5kg/ia 2)
--- epetim. data * Willeoero milkd( 1 31631111 m=1.851
0 non-interactive method -1 8 rWkeelot mlked
* Bell's mil m=1.4 JCRACK PROPAGATION FROM 10 mm TO 20em
I0- - -it/ - -vI50 if r I ? 1
850-f #- -
5-I
20- ----
IIL=80 z .4,
=Y bi Il l.
-0 .2 .4 .6
0CRACK PROPAGATION FROM 10 mm TO FAILURI
8- 1 -, - - -
__ I IF.X
50--- T
=20-10-5
-. .2 .4 .
Fig.17 - Fatigu6 crack propagation under spectrumloading flat panel. FALSTAFF spectrum.
7 7

- 66-4Z - --- -/
a I
34
26
1l 3000 ag
SICimeRS : stiffened panels, I = 1.65MCentral through crack, 1015- T6Load spectrum FALSTAFF, SM11=23511Ps023.9 kg/mm?)-- eiperim. data (6 splcimnsn)
A crick prupagatiln from ao=llmi to .=15mmF , a0=11mm to 1=100M
" , a.=11mm to 0=30ii.A ,," aollmM t final failure
tto5 --
- , - I -, - - - if- -
..3.2 -. -.4 - -5 - -6 -.5363
(i ~Fig. 18 - Fatigue crack propagation under spectrum t .i;loading stiffened panels. FALSTAFF spectrum. *_ ;:

- 67 -
rivet type T T rivet type T S
aI 0]..i' IIIIm
crack pattern
TYPE a c U p s t I tc ac n panels1m 0mm mm m mm mm mm 2024- T3 7075 T6
C1 500 300 60 30 18.5 1.27 0.8 0.20 2 1
C2 N 21.4 1.6 0.45 10 10
ac = (tc s)/(b tt)
test panel material rivet crack Smax R 80 a3N type type pattern c kg/mm2 mm mm N0o N,.l
GSF1 C2 2024-T3 TT II 0.45 7.0 0.4 14. 59. 4.7 221.91
2 .... TS IS to 14.2 57.5 8.31 187.07
3 TT " " 14. 52. 5.81 194.83
4 IS.I.. 6.0 " 20.5 69.5 8.97 314.2
5 " " TS "" " 20.5 88.25 7.84 305.46 TT IS 6.5 ' 25. 60.5 8.03 203.377 " 7075-T6 0 " 14.2 89.71 4.865 159.27
8 C1 2024-T3 K 0.20 5.5 " 15.0 67.5 20.88 432.46
9 It IS " 6.0 25.2 67.9 23.42 318.9
10 " 7075-T6 " " " 6.0 " 14.0 63.25 3.96 117.48
11 C2 0 5' 0.45 6.5 " 14.2 51.5 4.26 119.67
12 I f TS " 1 6.5 14.2 71.0 2.79 59.88
13 IS to " 6.5 " 25. 78.0 1.225 49.54
GFP1 C2 2024-T3 " " " 7.0 " 14.2 61.0 17.52 200.92 IS " " " 6.5 5 20.5 76.4 9.28 90.243 " 7075-T6 " 6.5 79 .r 69.7 T.5 -7:-d
ALPI 5 5 TT n " 6.5 " 20. 65.9 6.86 57.462 " " " 5' 5.5 5 5 79.4 4.88 79.063 " 2024-T3 TS I S 5.5 74.0 17.27 244.304 IS " " 5.5 68.6 15.23 269.85
5 5 7075-T6 " 5' 5.0 5 " 78.7 12.29 111.24
* 6 5 " 4.5 5' 98.3 11.43 1.72.24
7 It 4.5 1 92.9 10.30 158.50
- Half-crack length when the central stiffener begins to be cracked.
- Number of cycles corresponding to a.
* Tab.I - Main characteristics of the stiffened panels. Old series tests.
k I

- 68 -
-q .. .. C .. .
_t tc T T TJ Y
+ + ++ r "
I. -
8 rivet type T T rivet type T S
0
+ + +0 0 000
crack pattern
TYPE a c bs t, tc , c n. panelsr MM mm IOMon mm mm - 2024-,T3 7075-T6
C3 500 400 0 30 21.4 1.27 1.60 0.45 0 16
,= (tc " s)/(b - tz)
test panel material rivet crack Smax a- - -N type type pattern ac k/mm2 IM mm N(;10 N-10
CRICI C3 7075-T6 TS II 0.45 6.5 0.4 20.7 89.3 8.50 90.02
2 " " " 21.1 92.1 9.02 93.10
3 ... " " " 18.1 92.0 4.76 96.52
4 " " " 20.6 106.4 4.39 104.685 " " 0.6 15.7 95.2 5.35 270.82
6 " ".a 15.0 74.5 4.55 222.83
7 a a a " " 0.4 17.4 85.4 4.26 99.45
8 " " " " a " a 22.7 97.1 5.48 96.23
9 a " a " a a " 15.6 82.5 5.53 100.92
10 a a a " a ' 0.6 16.9 102.6 7.52 259.08
11 " a TT a a 0.4 19.5 82.0 4.79 103.09
12 -a a a a 17.7 77.2 3.29 86.2313 -a U a " " " 16.6 89.4 5.70 91.22
14 1 a a " U S 6.5 71.5 6.91 88.97
1 s 5 a " " 15.9 74.3 6.82 110.39
16 " N " a H a 16.7 89.1 3.20 84.29
- Half-crack length when the central stiffener begins to be cracked.
- Number of cycles corresponding to a.
Tab.II - Main characteristics of the stiffened panels.New seriestests.
-- I -i

- 69 -
CRIC-1 CRIC-2 CRIC-3
a n a n a n
23.1 13255, 21.6 13010. 21.0 11260.25.0 17510. 23.8 17220. 21.6 13550.25.8 19315. 24.5 19030. 23.0 16755.27.3 22175. 25.8 22660. 24.5 20295.28.3 23745. 28.0 26950. 26.0 23765.29.8 26550. 29.9 28610. 27.4 26480.30.6 28698. 31.2 31100. 29.0 29305.33.2 33500. 32.7 33605. 30.6 32205.35.0 35480. 34.5 36605. 32.1 35025.38.2 39270. 36.3 38750. 33.8 37515.39.8 41035. 38.3 41000. 35.8 40410.42.0 43835. 40.8 44955. 37.5 42480.42.9 44850. 42.0 46000. 40.2 45390.44.3 46510. 44.9 49310. 41.3 46765.44.9 47360. 47.5 52345. 43.5 49300.46.2 48705. 49.3 '4625o 45.7 51620.47.7 50550. 51.9 57330. 47.7 53980.50.3 53425. 54.5 60105. 50.0 56150.
* 52.2 55515. 57.5 63020. 51.6 57905.53.0 56235. 58.5 64510. 53.0 59495.54.4 57815. 59.8 66080. 54.7 61205.55.2 58590. 60.7 67305. 55.8 62480.56.7 60230. 61.8 68710. 57.5 64190.57.6 61100. 63.3 70200. 59.2 66210,58.9 62910, 64.0 71275. 61.3 68705.60.3 64680. 65.7 73100. 63.3 71215.61.0 65295. 67.2 74825. 64.9 72980.63.1 67500. 67.8 76300, 66.6 74990.64*9 70355. 70.0 78750. 68.9 77815.65.6 71160. 71.1 80090. 71.3 80290.67.4 73390. 72.7 82035. 72.7 81760.68.4 74635. 73.9 83255. 75.0 84275.70.2 77365. 75.1 85125. 76.4 85755.71.9 79170. 77.4 87555. 78.6 88245.73.8 81335. 78.0 89750. 80.4 90190.75.4 83875. 8100 91190. 82.8 92600.79.0 87385. 83.3 93750. 84.2 93815.81.3 90050. 85.4 95805. 85.8 95635.83.8 92870* 87.2 980050 86.0 97590.85.8 94810. 89.5 100075. 89.5 99170.88.3 97340. 92.1 102125. 92.0 101280.89.3 98520. 93.1 103255, 95.4 104250.90.7 99580 95.9 105760, 96.9 105510.93.5 102000. 97*6 107020. 99.2 107205.96.8 10480. 100.3 108970. 101.2 108925.
Tab.III- Reeults of new series tests.-
a

- T7') -
CRIC-4 CRIC-5 CHIC-6
n a n a n
23./ 11855. 16.1 79:30, 16.4 17510,25.3 15435. 16.5 1:1950. 17.1 21305.26.9 18305. 17.5 19985. 18.1 29670.
28.3 21125. 18.1 25390. 19.5 38845.29.1 22680. 19.1 31600. 20.7 49420.30.5 25095. 19.7 34920. 21.5 53800.
32.3 27750, 20.1 37885. 22.8 60360.
33.7 30160. 21.0 45415. 23.5 66010.35.5 32790. 22.1 49070. 24.3 70120.37.1 35160. 23,0 55000. 25.7 77070.
39.1 37695. 23.13 58460. 27.5 85500.42.5 42135. 25.3 66020. 29.7 94450.45.2 45245. 25.9 69415. 30.5 98555.
47.8 48130. 27.4 76240. 31,5 102675.50.6 51325. 28.1 79135. 32,5 106825,
52.8 53525. 29.5 85440. 33.6 111260.
54.5 55475. 30.5 88990. 34.5 115705.57.0 58390. 32.2 96010. 36.0 120230.
58.6 60100. 33.6 101605. 36.8 123405.60.8 62460. 35.1 106700, 38.2 128000.
61.7 63610. 37.5 115010. 39.3 131640.
63.2 65165. 38.6 118535. 40.6 136750.
65.6 68065. 41.7 127960, 43.0 143500.
66.8 69605. 44.3 135295. 44.9 149650.
68.8 72145. 46.5 141605. 46.2 153070.
70.4 74125. 49.1 148595. 47.3 156160.73.1 77425. 49.8 150895. 49,4 161650.
75.0 79685. 52.9 159065. 50.4 164890.
78.9 g4100. 55.9 167390. 52.2 169065.
81.5 86840. 58.3 173900. 54.5 175105.
83o4 8835. 60.5 180450. 55.5 177775.
85.4 90770, 62.8 186890. 56.7 180840.
87.8 93140. 64.5 192625. 58.4 1844510.90.6 95795. 65.8 196335. 59.5 187805.
92.3 97415. 68.8 205510. 60.5 190655.
95.7 100425. 70.5 210720. 61.2 192200.
98.4 102660. 73.1 218535* 62.7 196485.
100.8 104675. 75.0 223920. 64.1 199945.
103.6 106965. 77.9 232495. 65.3 203185.
106.4 109075. 79.3 236495. 66.5 208520.
109.4 111280. 82.6 245590. 68.6 212015.
111.5 112750. 84.3 249965. 70.4 216985.86.2 255000. 71.3 219000.88.9 261935. 73.0 223625.
912 267085. 74.5 227300.
Tab.III- Continued.
17 I

11 -
Ck IC-7 CRIC-8 CRIC-9
a n a n a n
:i. .3 7100. 2.3. 3 6 /65. 16.4 7430.19.5 11000. 24. :-) 9210. 17.6 1O0131O.20.7 13730. 25.6 11430. 18.8 130:35.22.0 16870. 26.5 13215. 19.3 15820.24.0 20845. 27.9 16115. 20,4 18235.26.0 25820. 28.5 1714,5. 22.0 22005.28.0 29515. 29.8 19730. 23.0 23675.29.4 32830. .32.5 24915. 24.1 25950.32.0 36400. 33.2 26135. 25.9 28675.33.5 38885. 34.8 2a8105. 27.4 31760.34.5 40695. .36.3 30700. 28.4 33030.35.8 42540. 37.5 32180. 29.3 35260.3 .0 44705. 40.'J 36435. 30.4 37305.39.1 47030. 43.5 40615. 31.2 38910.40.6 49090. 44.9 42320. 32.7 41580.42.0 50885. 46.0 43705. 34.0 43635.44.0 53350. 49 .2 47620. 35.3 45895.46.7 56695. 50.5 49300. 36.8 48215.48.7 59160. 52.6 52850. 39.3 51610.50.0 60780. 56.4 56275. 41.0 54325.52.0 63020. 59.0 59255. 42.8 56780.53.7 64640. 60.3 60235, 44.4 58880.54.9 66005. 62.4 62845, 46.0 60995.56.2 67400. 63.2 64160. 47.5 62835.57.2 68600. 64.3 65705. 51.7 67740.58.1 69810. 66.3 68260. 53,5 69825.59.2 71255. 67.8 70205. 55.0 71785.60.5 72495. 70.5 73665. 57.2 74490.62.0 74645. 71.7 75160. 58.8 76045.63.3 77055. 74.3 78335. 60.3 77980.64.8 78255. 75.2 79430, 62.2 80130.65.7 79660, 77.0 81715. 63.7 82145.
66.8 80935. 78.7 83595. 65.1 84125.67.8 82160. 81.8 86796, 66.3 85590.69,1 83460. 83.2 88890. 68.1 88065.
70.5 86195. 84.3 91025. 69.7 90265.72.4 88510. 86.8 92180. 70.8 91775.75.6 92455. 91.8 95735, 71.9 93290.78.2 95625. 93.2 98755. 73.4 95380.80.7 98570. 94.3 99855. 75.3 97675.83.0 101125. 97.1 101710. 76.8 99585.85.4 103710. 102.6 105820. 78.4 101575.87.3 105720. 106.1 108570. 81.1 104865.88.9 107280. 82.5 106450.
90.6 108890. 84.7 108980.
Tab.III - Continued.

CM IC-10 CRIC-1 1 CRIC-1 2
a n a n a n
1/.6 13410. 20. 7645. 18.8 7000.18.5 18820. 21.15 11700. 20.5 10700.19.4 26740. 23.3 17115. 21.7 13485.20.6 34100. 24.1 18/45. 23.0 16135.22.0 41500. 25.4 21855. 24.8 19670.22.8 47320. 26.4 24670. 26.9 22910,24.1 53610. 28.0 26705. 28.3 25190.25.3 59420. 28.6 28135. 29.6 27365.26.8 66390. 29.5 31285. 30.9 29010.27.8 73780. 30.3 33000. 32.3 31175.:30.3 82500. 31.4 35100. 33.7 33380,31.7 89310. 32,8 38160. 35.4 35860.34.0 96650. 34.4 41095. 36.5 37390.36.8 103090. 36.5 44705. 37.8 39200.37.5 108510. 38.3 47610. 39.0 40805.39.8 115430. 39.8 50140. 41.2 43715.42.0 121020. 41.1 52105. 43.1 45980.43.1 125580. 42.3 54150. 44.2 47385.46.2 139070. 43.9 56480. 45.7 49160.48.8 140180. 46.2 59565. 47.7 51570.51.8 148810. 47.5 61595. 49.7 53590.54.0 155200. 49.3 63890. 51.7 5F890.56.7 162450. 52.1 67640. 53.4 57855.58.4 166630. 53.8 70010. 55.2 59945.60.3 171380. 56,0 72585. 57.3 62115.62.1 176210. 57.7 74855. 58.7 63665.63.6 180770. 59,5 77475. 60.2 65505.65.5 185040. 61.3 79880, 61.8 67000.67.3 190070. 63.3 82725. 63.3 69165.69.8 197030. 65.3 85505. 64.8 71080.71.0 200560. 66.9 87575. 65.9 72590.72.9 205540. 69.6 91420. 67.3 74695.74.8 210390. 71.2 94750. 68.3 76260,76.2 214000. 73.9 96975. 69.3 78045.77.7 217820. 75.3 99505. 71.0 80775.79.6 221610. 76.6 100895. 71.7 83245.81.4 226180. 77,9 102715. 73.4 84615.83.1 229740. 78.8 103865. 74.1 85810.84.9 233520. 79.9 105195. 75.8 87505.8609 238500. 82.0 107880. 77.2 89525.89*8 244490. 83.3 109680. 78.2 90920.92.6 250110. 85.0 111230. 79.1 92250.94.7 254880, 86,3 112830. 80.8 94550.97.2 259510. 87.3 113920. 82.8 96220.99.8 263590. 83.8 97265.
Tab.III- Continued.
AhI

('IC-13 CNIC-14 CRIC-15
n n a n18.1 10500. 16., 6915. 16.5 10715.1.9.9 15730. 115 J0695. 16.9 1387'.22. 21995. 18.9 14650. 17.5 17140.24 ._ 25915. 20.4 18830. 17.9 19455.25.8 29075. 21.6 211945, 18.5 21890.27 1 31285. .,5 24140. 19.5 25745.213.4 33420. 25,6 31375. 20.2 29570.30.4 36945. 27.1 34595. 20.9 32660.31.8 38990, 28.2 36605. 21.9 35565.34.5 42875. 29.5 39145, 22.7 38095.36.2 45015. 30.7 41230. 24.0 42625.37.6 46525. 31.7 43150. 25.3 46910.39.8 49015. 33,0 45265, 26.5 50915.42 5 51855. 33.8 46560. 27.5 54995.43.5 53090. 34.5 47860. 28.7 58595.45.5 55175. 36.8 51255. 29.6 61625.47.7 57355. 37.7 52715. 30.7 64615.49.6 59435. 39.3 55005. 32.3 67650.50.9 60805. 40.7 56890, 34.0 70970.52.9 62635, 42.5 59300, 35.6 73715.55.2 64775. 45.3 63000. 37.8 76895.56.9 66395. 48.0 66490. 41.3 81130.58.5 67690. 49.7 68500. 43,3 83965.60.4 69570, 51,1 70140. 45.8 86555,61.4 70570, 52.9 72280, 49o6 90810.63.3 72275. 54.3 73820, 52.4 93665.65.0 73805. 55.9 75720, 54.8 95895.66.6 75350, 58.2 78475, 56.7 97715.68.8 77665. 59.5 80190, 57.8 98875.69.7 78490. 61.3 82500, 59.3 100240.70.7 79415, 63.6 85425, 60.4 101230.71.9 80520. 65,2 87200. 61.6 102370.72,8 81505, 66.1 88720, 62.7 103365.74.2 82905, 67.6 90450. 64.1 104695,75.6 84065. 70.1 94130, 65,1 105600.76.8 85220o 71.5 95880* 66.9 107550,78.8 86675, 73.7 98705, 70.0 110770.80.4 88750. 75,3 100940, 72,3 113260,83.7 91765. 76,1 101870, 74.3 117215.85*9 93715. 78.4 119800,89.4 96920, 79.7 120945.97.9 103755. 80.5 121685.
81,2 122285.
83s2 124045.
Tab.III- Continued.

k IC -i (,
a i1
,20.0 I 1 4t,.21. 9? L,375.
23. 18915.6.2 23400.
28.4 26750.32.5 33175.35.0 36405.37.0 38700.40.9 43340.42,9 45525.45.3 47935.47.3 49910,50.3 52640.53.4 55675.55.4 ! J7585.56.7 :,8-345.58.7 60560.60.7 62355,64 .2 65300.65.9 67365.68.1 69395.68.8 /0125.70.0 71210.71*1 72175.72.1 :73060.73.3 74245.74.3 75165.76.2 76880.76.8 77630.77.3 78000.78.4 78830.79.4 79640.80.8 80855.82.'3 182030.85.4 84405.86.3 85075,87.8 86555,89.1 8/495.92.7 90030,94.6 91330.95.3 91765,95,9 92230.96.8 92755,97. 1 93415.
Tab.III- Continued.
----------- 1<

-75 -
TEST 2TEST 2l
CRIC-4 0.7 0.21 CRIC-9 0.45 0.14
CRIC-8 0.6 0.14 CRIC-5 0.3 0.14
CRIC-10 0.75 0.14 CRIC-6 1.0 0.14
CRIC-2 0.45 0.21 CRIC-I 0.3 0.14
CRIC-3 0.5 0.14 CRIC-7 0.4 0.14
GSF-13 0.6 0.14 GFP-3 0.3 0.14
ALP-6 0.5 0.21 ALP-5 0.25 0.21
GFP-2 0.9 0.21 ALP-3 0.65 0.14
ALP-4 0.5 0.14 GSF-12 0.3 0.14
ALP-7 0.9 0.14 GSF-2 0.4 0.07
GSF-5 0.45 0.14 GFP-I 0.95 0.07
C2 Flex./Flex. Douglas
n Pf/Ar-Sy Sy = 36 Kg/mmi~ 2
Tab.IVa -Optimum values of C and parameters for countersunkrivets tests.
ph

- 76 -
TEST C2 n TEST C2 nl
GSF-1 0.65 0.14 GSF-4 0.08 0.14
GSF-3 0.2 0.14 GSF-7 o.2 0.21
ALP-2 o.6 0.07 GFP-8 0.05 0.07
ALP-i 0.2 0.21 GSF-11 o.5 0.21
GSF-8 0.7 0.07 GSF-9 0.02 0.07
GSF-10 0.22 0.21 CRIC-11 0.6 0.14
CRIC-12 0. 0.21 CRIC-13 0.6 0.07
CRIC-14 0.4 0.14 CRIC-15 o.5 0.07
CRIC-16 0.7 0.07
2 = Flex./Flex. Douglas
f = Pf/Ar-Sy Sy = 36 Kg/mm 2
Tab.IVb - Optimum values of E and n parameters for round headrivets tests.
. .. ..... 4.