
I706.01(J) Spark Blaze Manual
222
Spark® Noise Dosimeters and Blaze® Software Technical Reference Manual FOR NOISE DOSIMETERS 703+, 705+, and 706RC
Transcript of I706.01(J) Spark Blaze Manual
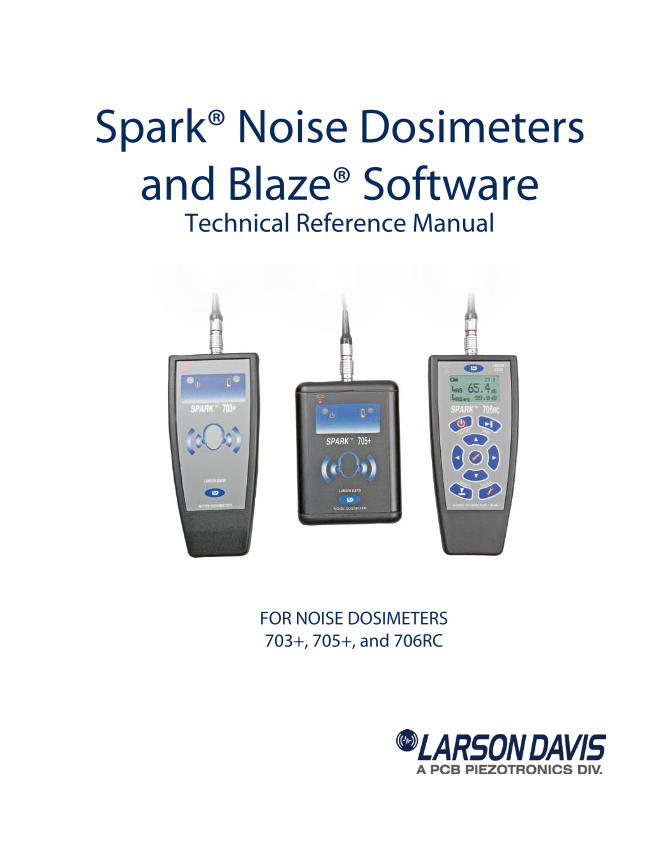
Spark® Noise Dosimetersand Blaze® Software
Technical Reference Manual
FOR NOISE DOSIMETERS703+, 705+, and 706RC

I706.01 Rev J
Larson Davis
Spark Noise Dosimeters and
Blaze Software Manual

Copyright
Copyright 2013 by PCB Piezotronics, Inc. This manual is copyrighted, with all rights reserved. Themanual may not be copied in whole or in part for any use without prior written consent of PCBPiezotronics, Inc.
Disclaimer
The following paragraph does not apply in any state or country where such statements are notagreeable with local law:
Even though PCB Piezotronics, Inc. has reviewed its documentation, PCB Piezotronics Inc. makes nowarranty or representation, either expressed or implied, with respect to this instrument anddocumentation, its quality, performance, merchantability, or fitness for a particular purpose. Thisdocumentation is subject to change without notice, and should not be construed as a commitment orrepresentation by PCB Piezotronics, Inc.
This publication may contain inaccuracies or typographical errors. PCB Piezotronics, Inc. willperiodically update the material for inclusion in new editions. Changes and improvements to theinformation described in this manual may be made at any time.
Product Warranty
The Larson Davis Limited Product Warranty is available on the Larson Davis web sitewww.larsondavis.com.
Recycling
PCB Piezotronics, Inc. is an environmentally friendly organization and encourages our customers tobe environmentally conscious. When this product reaches its end of life, please recycle the productthrough a local recycling center or return the product to:
PCB Piezotronics, Inc.Attn: Recycling Coordinator1681 West 820 NorthProvo, Utah, USA 84601-1341
where it will be accepted for disposal
Table of Contents
Chapter 1 Introduction 1-1Formatting Conventions .........................................................................................1-1
Spark Family Features ............................................................................................1-2
Spark 706RC RC Features .................................................................................1-2
Spark 703+/705+ Features .................................................................................1-3
Spark Instruments ...................................................................................................1-4
Getting Started ........................................................................................................1-5
Unpacking and Inspection..................................................................................1-6
Spark® Dosimeter Standard and Optional Accessories.....................................1-7
Assembling the Spark Dosimeter.......................................................................1-8
Installing Batteries in the 706RC, and 703+ ....................................................1-10
Installing Batteries in the 705+.............................................................................1-12
Using Rechargeable Batteries ..........................................................................1-15
Connecting the dosimeter to a PC....................................................................1-15
Data Retention..................................................................................................1-17
Installing the Blaze Software ...........................................................................1-17
703+/705+ Front Panel Indicators ........................................................................1-18
Chapter 2 Using Larson Davis Blaze Software 2-1Blaze Main Window ..........................................................................................2-2
Operating System....................................................................................................2-6
Selecting the Communication Method...............................................................2-6
Setting the Spark instrument clock ....................................................................2-9
Calibrating the Spark instrument ..........................................................................2-12
Calibration Information....................................................................................2-16
Setting the Spark instrument to Collect Data........................................................2-18
General Settings ...............................................................................................2-19
Modifying the General Settings .......................................................................2-20
S.E.A. Metric ...................................................................................................2-29
User Defined Configurations ...........................................................................2-31
Saving the Instrument Settings ........................................................................2-34
Setting the Auto-Timer .........................................................................................2-35
Timer Off .........................................................................................................2-36
Block Timer .....................................................................................................2-36
Repeat Once Daily ...........................................................................................2-39
Repeat Twice Daily.........................................................................................2-39
Set Timer..........................................................................................................2-40
Instrument Settings ..........................................................................................2-40
Default Settings................................................................................................2-41
Save as Default.................................................................................................2-41
Manual Control of the Spark instrument ..............................................................2-42
Setting the Lock Using Blaze...........................................................................2-48
Unlocking the Spark Instrument Using Blaze..................................................2-49
Downloading Data from the Spark Instrument to the PC.....................................2-52
Adding General Information During Download..............................................2-53
Measurement Summary ........................................................................................2-57
Selecting Display of Dose Data .......................................................................2-58
Viewing Other Data Records ...........................................................................2-60
General Information.........................................................................................2-63
Recalculating the Results .................................................................................2-64
Merging Records..............................................................................................2-67
Modifying the Time History Interval...............................................................2-71
Averaging Time Histories between Different Files .........................................2-73
Time History Graph ..............................................................................................2-74
Selection of Data Displayed.............................................................................2-78
Mode .....................................................................................................................2-79
Normal (Interaction) Mode ...................................................................................2-80
Zoom Mode...........................................................................................................2-81
Zoom In............................................................................................................2-81
Zoom Out/Zoom to Original ............................................................................2-82
Edit Mode .............................................................................................................2-83
Selecting a Data Block.....................................................................................2-84
Edit Data ..........................................................................................................2-85
Exclude Data ....................................................................................................2-86
Create New Record ..........................................................................................2-88
Restore Data .....................................................................................................2-89
Setting a Reference Line in a Time History Graph ..............................................2-89
Annotating Graph.............................................................................................2-91
Graph Multiple Records...................................................................................2-92
Ln Data.............................................................................................................2-96
The Statistics Graph..............................................................................................2-98
Graph Records from Different Files ..............................................................2-104
Printing Reports ..................................................................................................2-109
Export Data .........................................................................................................2-117
Searching the Blaze Database.............................................................................2-118
Troubleshooting Download Problems ...........................................................2-122
Chapter 3 Manual Operation of the Spark 706RC 3-1Overview.................................................................................................................3-1
User Interface..........................................................................................................3-2
Keypad Functions ..............................................................................................3-2
706RC Icon Descriptions ...................................................................................3-3
Powering up the 706RC..........................................................................................3-4
Navigating through the 706RC Displays ................................................................3-5
Tools .......................................................................................................................3-9
Remote Control of Remote unit............................................................................3-10
Controlling a Remote Device ...............................................................................3-11
Inversion Mode .....................................................................................................3-12
Record Transfer ....................................................................................................3-14
Calibration of the 706RC......................................................................................3-16
Using the Lock Feature.........................................................................................3-19
Activating the Lock..........................................................................................3-19
Deactivating the Lock ......................................................................................3-20
Setting up the 706RC............................................................................................3-21
Setting the 706RC Date and Time ...................................................................3-21
Tour Tools Menu .............................................................................................3-23
Changing the Gain ...........................................................................................3-24
Changing the Frequency Weighting ................................................................3-25
Changing the Peak Weighting..........................................................................3-26
Changing the Detector .....................................................................................3-27
Changing the Time History Period ..................................................................3-28
Changing the Dose Measurement Settings ......................................................3-28
Memory Settings ..............................................................................................3-31
About................................................................................................................3-33
The Power Menu..............................................................................................3-34
Timers ..............................................................................................................3-36
Display .............................................................................................................3-37
Appendix A Spark 706RC/705+/703+ Specifications A-1General Characteristics ..........................................................................................A-1
Appendix B Frequently Asked Questions B-1Measurements and Interfaces.................................................................................B-1
Connecting the IR Interface ...................................................................................B-2
Identifying the COM Port .................................................................................B-2
Connecting to a Spark Dosimeter in Blaze .......................................................B-4
Appendix C Glossary C-1
Appendix D 706RC/705+/703+ IR Communications Troubleshooting D-1The First Step ....................................................................................................D-1
Additional IR Connection Solutions .................................................................D-2
Blaze Check for COM Port....................................................................................D-3
Blaze Connection Wizard for IR Communications ...............................................D-3
Appendix E Intrinsic Safety Approvals E-1Back Panel Labels ............................................................................................. E-2
C H A P T E R
1 Introduction
Thank you for purchasing the Spark/Blaze noise dosimetrysystem. The Spark family instruments are among the small-est, most powerful noise dosimeters available for work placenoise measurement. Spark’s rugged construction will pro-vide you with years of trouble-free operation.
The 706RC is a full-featured dosimeter that can operateindependently under manual control (via keypad). The 703+and 705+ are similar in operation except that they have nokeypad or display, making them virtually tamper proof.Spark706RC, 705+, 703+ work integrally with the Blazesoftware.
Blaze provides a simple way to setup the Sparkinstruments,download and analyze the measured data. Blaze softwareruns on Windows XP, Windows Vista and Windows 7 (32and 64 bit).
We invite you to read this manual to achieve the best resultsfrom your Spark instrument and Blaze software.
Formatting Conventions
This manual uses the following formatting conventions:
In step-by-step directions, the process (what you do) isshown in the right column, and the rationale (why you do it)with other cautions and comments shown in the left column.Especially important information is shown in italics. Whereit is necessary to distinguish the operation of the differentSpark family instruments, it will be noted on the left columnand described on the right.
SPARK and BLAZE User Manual Introduction 1-1
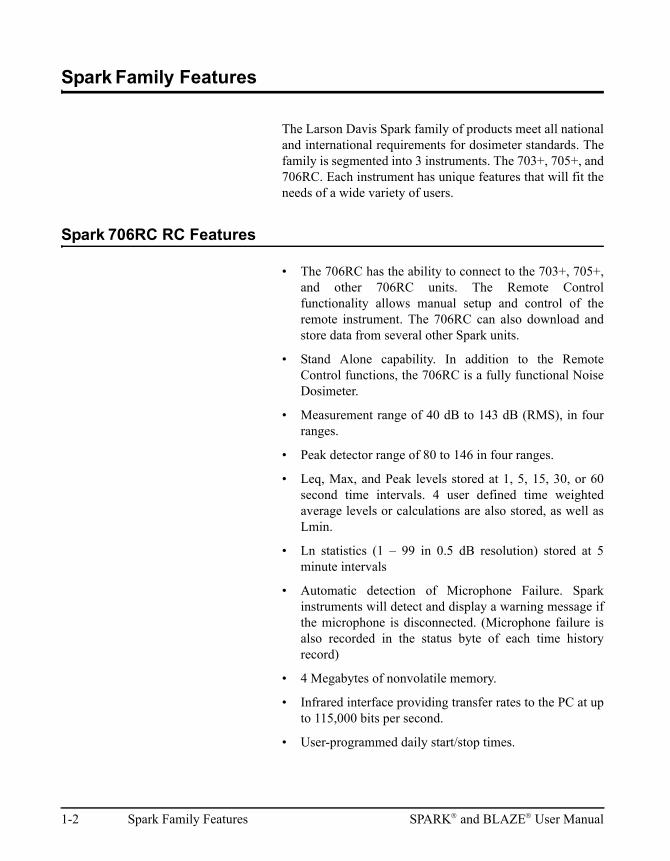
SparkFamily Features
The Larson Davis Spark family of products meet all nationaland international requirements for dosimeter standards. Thefamily is segmented into 3 instruments. The 703+, 705+, and706RC. Each instrument has unique features that will fit theneeds of a wide variety of users.
Spark706RC RC Features
• The 706RC has the ability to connect to the 703+, 705+,and other 706RC units. The Remote Controlfunctionality allows manual setup and control of theremote instrument. The 706RC can also download andstore data from several other Spark units.
• Stand Alone capability. In addition to the RemoteControl functions, the 706RC is a fully functional NoiseDosimeter.
• Measurement range of 40 dB to 143 dB (RMS), in fourranges.
• Peak detector range of 80 to 146 in four ranges.
• Leq, Max, and Peak levels stored at 1, 5, 15, 30, or 60second time intervals. 4 user defined time weightedaverage levels or calculations are also stored, as well asLmin.
• Ln statistics (1 – 99 in 0.5 dB resolution) stored at 5minute intervals
• Automatic detection of Microphone Failure. Sparkinstruments will detect and display a warning message ifthe microphone is disconnected. (Microphone failure isalso recorded in the status byte of each time historyrecord)
• 4 Megabytes of nonvolatile memory.
• Infrared interface providing transfer rates to the PC at upto 115,000 bits per second.
• User-programmed daily start/stop times.
1-2 Spark Family Features SPARK and BLAZE User Manual
• PC-based setup, dose calculation, report generation, andgraphics.
• Manual setup of instrument functions. (Timers can onlybe set from the Blaze software.)
• Slow or Fast RMS detection using A or C weighting.
• Calculation of noise exposure in percentage dose,projected dose, SE (Pa2 hours), and Pasques (Pa2
seconds) units using a variety of exchange rates,threshold, and criteria values.
• Continuous display of SPL level. The instrument willcontinue to display the current SPL level, even when theinstrument is not running. During this time theinstrument will not be logging data, the value is onlybeing displayed on the screen.
• Noise Floor typical of 35 dBA (A-weighted) Slow/Fast(using 30 dB gain).
• Frequency Response of A and C weighting meets ANSIand IEC Standards.
• Detector accuracy: True RMS; less than 0.7 dB errorfrom 40 to 143 dB.
• Two standard AA internal alkaline batteries providegreater than 100 hours of continuous battery life.
Spark703+/705+ Features
NOTE: The 703+ and 705+ are identicalin operation and features. The 705+offers an extruded metal housing andruns on a single AA battery. The 703+offers a tough but lightweight housingand runs on two AA batteries.
• Maximum security with full functionality in anextremely durable case. Faceless instrument providesindicators on face for Run Status and Battery life.
• Measurement range of 40 dB to 143 dB (RMS), in fourranges.
• Peak detector range of 80 to 146 in four ranges.
• Leq, Max, and Peak levels stored at 1, 5, 15, 30, or 60second time intervals. 4 user defined time weightedaverage levels or calculations are also stored, as well asLmin.
• Ln statistics (1 – 99 in 0.5 dB resolution) stored at 5minute intervals.
SPARK and BLAZE User Manual Introduction 1-3
• Automatic detection of Microphone Failure. Sparkinstruments will detect and display a warning message ifthe microphone is disconnected. (Microphone failure isalso recorded in the status byte of each time historyrecord).
• 4 Megabyte of nonvolatile memory.
• Infrared interface providing transfer rates to the PC at upto 115,000 bits per second.
• User-programmed daily start/stop times.
• PC-based setup, dose calculation, report generation, andgraphics.
• Manual setup possible with the 706RC.
• Slow or Fast RMS detection using A or C weighting.
• Calculation of noise exposure in percentage dose,projected dose, SE (Pa2 hours), and Pasques (Pa2
seconds) units using a variety of exchange rates,threshold, and criteria values.
• Noise Floor (typical) of 35 dBA (A-weighted) Slow/Fast(using 30 dB gain).
• Frequency Response of A and C weighting meets ANSIand IEC standards.
• Detector accuracy: True RMS; less than 0.7 dB errorfrom 40 to 143 dB.
• (703+ only) Two standard AA internal alkaline batteriesprovide greater than 100 hours of continuous battery life.
• (705+ only) One standard AA internal alkaline batteryprovides greater than 35 hours of continuous battery life.
SparkInstruments
NOTE: The 705+ and 703+ can also becontrolled by the 706RC.
The 706RC is a fully functional dosimeter that is controlledeither independently (via their own keypads and display) orby the Blaze software. The 705+, 703+ are programmed
1-4 Spark Instruments SPARK and BLAZE User Manual
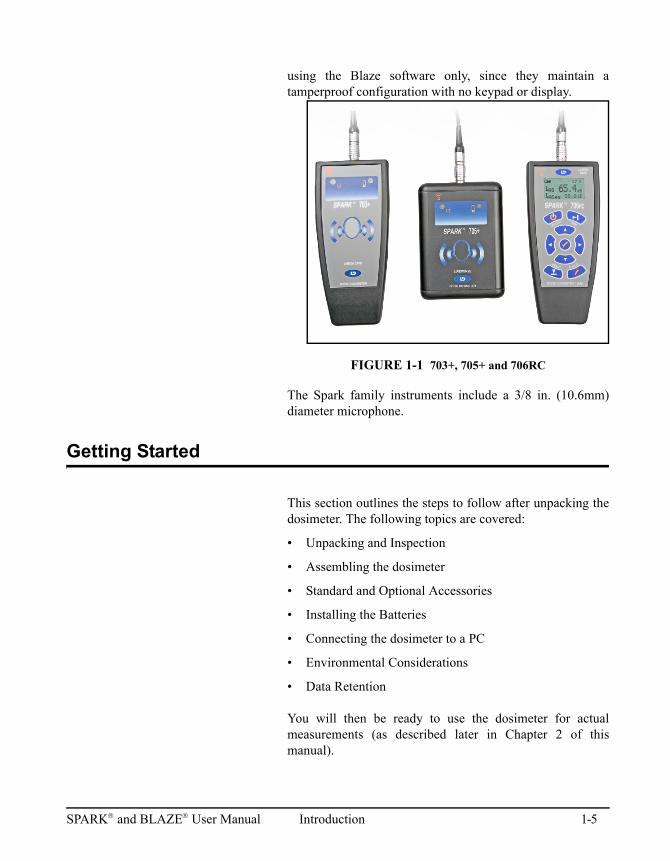
using the Blaze software only, since they maintain atamperproof configuration with no keypad or display.
FIGURE 1-1 703+, 705+ and 706RC
The Spark family instruments include a 3/8 in. (10.6mm)diameter microphone.
Getting Started
This section outlines the steps to follow after unpacking thedosimeter. The following topics are covered:
• Unpacking and Inspection
• Assembling the dosimeter
• Standard and Optional Accessories
• Installing the Batteries
• Connecting the dosimeter to a PC
• Environmental Considerations
• Data Retention
You will then be ready to use the dosimeter for actualmeasurements (as described later in Chapter 2 of thismanual).
SPARK and BLAZE User Manual Introduction 1-5
Unpacking and Inspection
Your Spark dosimeter has been shipped in protectivepackaging. Please verify the package contents with the listAccessories and Optional Equipment later in this chapter,and retain the product packaging for safe shipment at afuture date. Report any damage or shortage immediately toLarson Davis at (888)-258-3222. If you have not alreadydone so, please record your instrument’s serial number(located on the label on the back of the dosimeter) and thepurchase date at the beginning of this manual (see thecopyright page). You may be asked to give this informationin any future communications with Larson Davis.
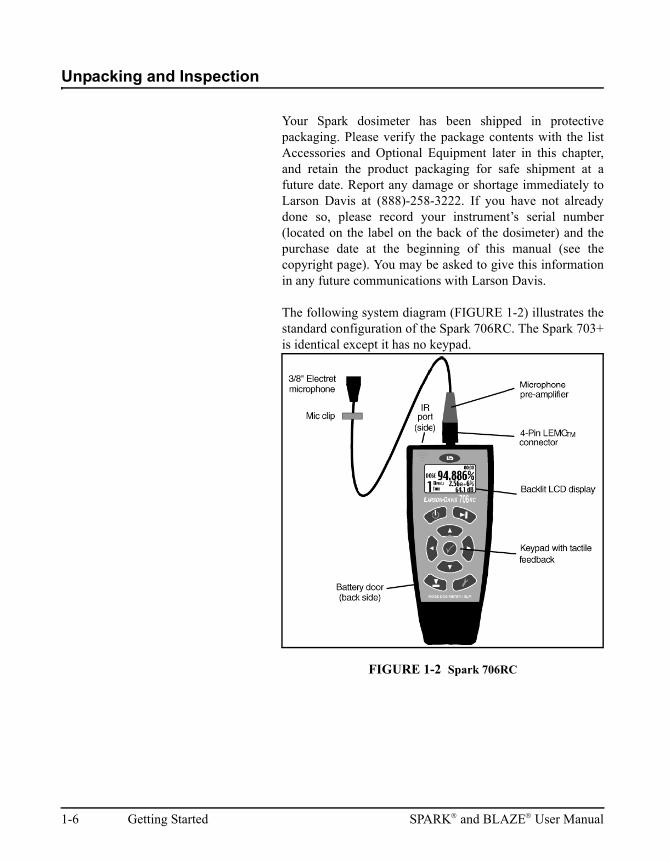
The following system diagram (FIGURE 1-2) illustrates thestandard configuration of the Spark 706RC. The Spark 703+is identical except it has no keypad.
FIGURE 1-2 Spark 706RC
1-6 Getting Started SPARK and BLAZE User Manual
Spark®Dosimeter Standard and Optional Accessories
Your Spark dosimeter was delivered with a number ofadditional items. Please make sure that you have receivedthe following equipment with your dosimeter:
• Sparkdosimeter
Standard Accessories • Detachable 3/8 in. (10.6 mm) microphone/preamp/andintegrated 3 ft. (1 m) cable (MPR001)
• AA alkaline batteries
• Windscreen
• CCS018 nylon pouch (706RC, 703+ only.)
• Microphone clip
Optional Accessories • Blaze software
• CAL150 Type 2 microphone calibrator
• DVX008A USB-to-DBM9 serial adapter
• DVX010 USB-to-IR interface module
• MPR002 3" cylindrical mast type preamp for use asSLM
If any of these items are missing, please contact your LarsonDavis sales representative, or contact Larson Davis directly.
SPARK and BLAZE User Manual Introduction 1-7
Assembling the SparkDosimeter
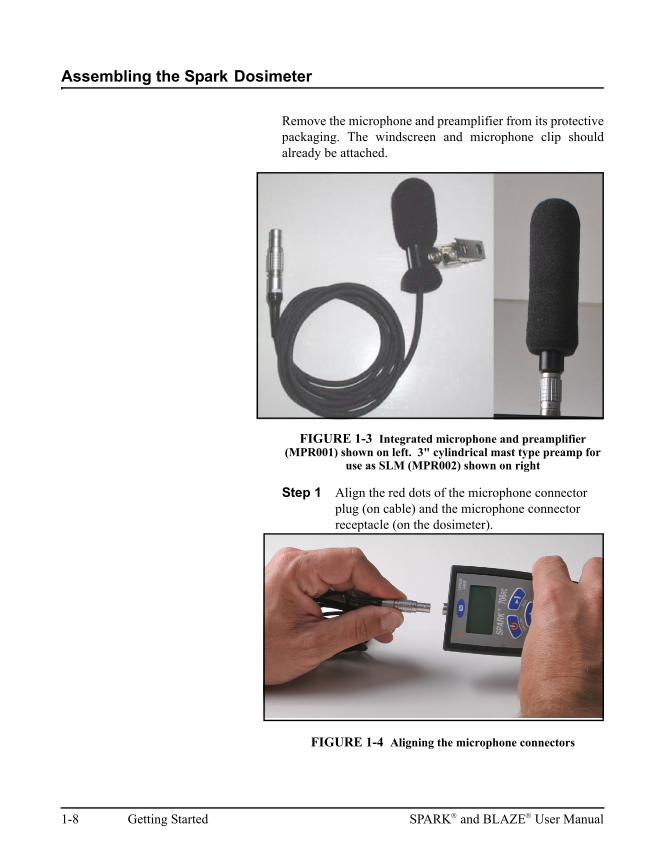
Remove the microphone and preamplifier from its protectivepackaging. The windscreen and microphone clip shouldalready be attached.
FIGURE 1-3 Integrated microphone and preamplifier (MPR001) shown on left. 3" cylindrical mast type preamp for
use as SLM (MPR002) shown on right
Step 1 Align the red dots of the microphone connector plug (on cable) and the microphone connector receptacle (on the dosimeter).
FIGURE 1-4 Aligning the microphone connectors
1-8 Getting Started SPARK and BLAZE User Manual
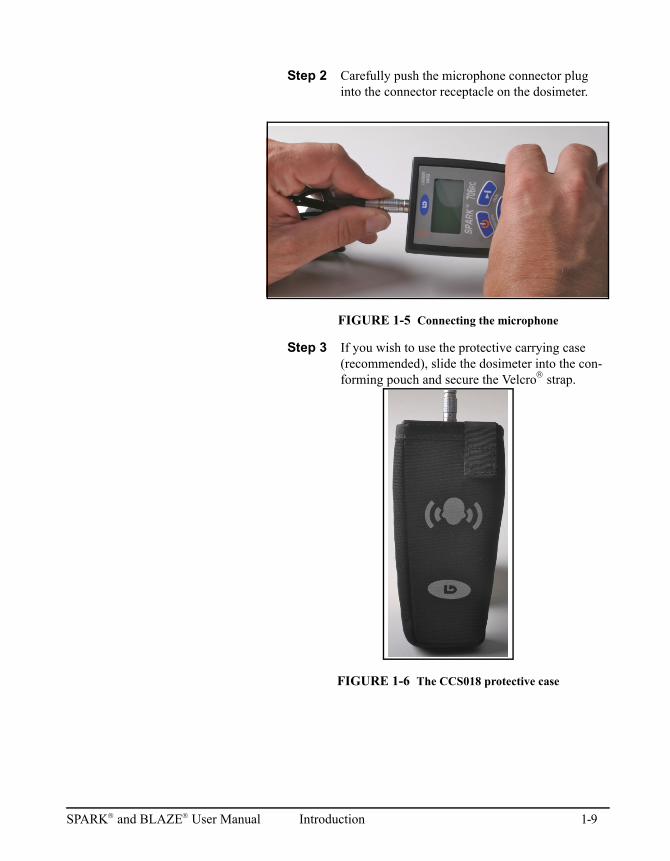
Step 2 Carefully push the microphone connector plug into the connector receptacle on the dosimeter.
FIGURE 1-5 Connecting the microphone
Step 3 If you wish to use the protective carrying case (recommended), slide the dosimeter into the con-forming pouch and secure the Velcro strap.
FIGURE 1-6 The CCS018 protective case
SPARK and BLAZE User Manual Introduction 1-9

Important: When removing thedosimeter from the pouch, do notpull microphone connector. This cancause damage. Instead, push thedosimeter at the bottom of the pouchwhile firmly holding the sides.
Installing Batteries in the 706RC, and 703+
NOTE: Only AA type batteries can beused in the Spark instruments.
To insert the two AA batteries in the dosimeter, remove thebattery cover on the back of the instrument.
WARNING! Do not replace the batteries in an explosive environment.
Step 1 Move the sliding tab towards the bottom (away from the microphone end) of the dosimeter.
FIGURE 1-7 Moving the battery door sliding tab
1-10 Getting Started SPARK and BLAZE User Manual
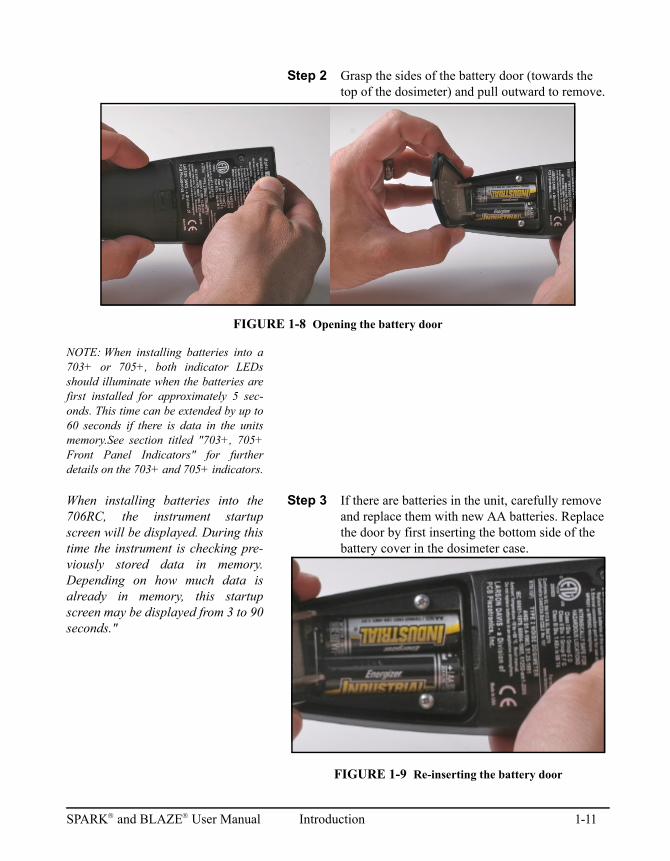
Step 2 Grasp the sides of the battery door (towards the top of the dosimeter) and pull outward to remove.
FIGURE 1-8 Opening the battery door
NOTE: When installing batteries into a703+ or 705+, both indicator LEDsshould illuminate when the batteries arefirst installed for approximately 5 sec-onds. This time can be extended by up to60 seconds if there is data in the unitsmemory.See section titled "703+, 705+Front Panel Indicators" for furtherdetails on the 703+ and 705+ indicators.
When installing batteries into the706RC, the instrument startupscreen will be displayed. During thistime the instrument is checking pre-viously stored data in memory.Depending on how much data isalready in memory, this startupscreen may be displayed from 3 to 90seconds."
Step 3 If there are batteries in the unit, carefully remove and replace them with new AA batteries. Replace the door by first inserting the bottom side of the battery cover in the dosimeter case.
FIGURE 1-9 Re-inserting the battery door
SPARK and BLAZE User Manual Introduction 1-11
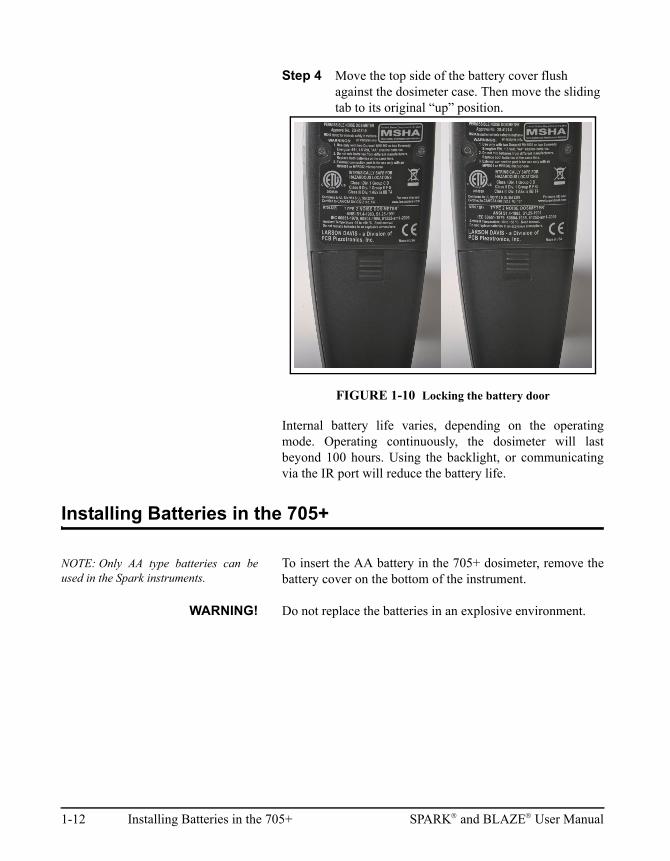
Step 4 Move the top side of the battery cover flush against the dosimeter case. Then move the sliding tab to its original “up” position.
FIGURE 1-10 Locking the battery door
Internal battery life varies, depending on the operatingmode. Operating continuously, the dosimeter will lastbeyond 100 hours. Using the backlight, or communicatingvia the IR port will reduce the battery life.
Installing Batteries in the 705+
NOTE: Only AA type batteries can beused in the Spark instruments.
To insert the AA battery in the 705+ dosimeter, remove thebattery cover on the bottom of the instrument.
WARNING! Do not replace the batteries in an explosive environment.
1-12 Installing Batteries in the 705+ SPARK and BLAZE User Manual
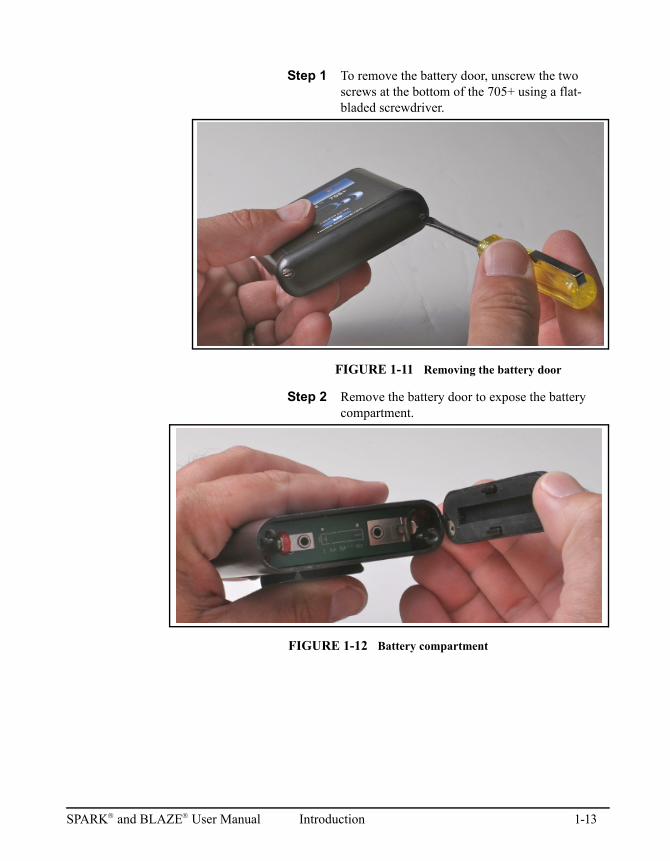
Step 1 To remove the battery door, unscrew the two screws at the bottom of the 705+ using a flat-bladed screwdriver.
FIGURE 1-11 Removing the battery door
Step 2 Remove the battery door to expose the battery compartment.
FIGURE 1-12 Battery compartment
SPARK and BLAZE User Manual Introduction 1-13
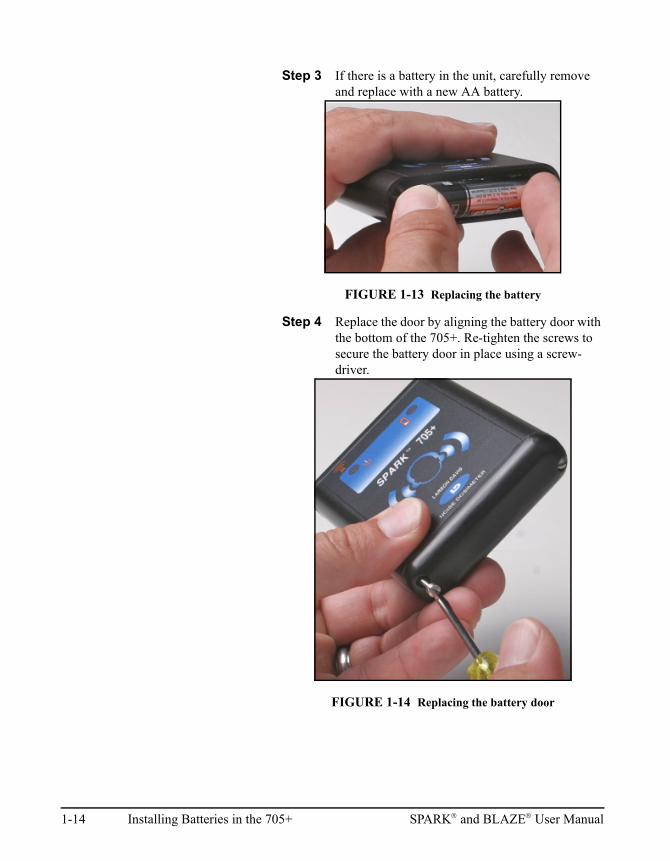
Step 3 If there is a battery in the unit, carefully remove and replace with a new AA battery.
FIGURE 1-13 Replacing the battery
Step 4 Replace the door by aligning the battery door with the bottom of the 705+. Re-tighten the screws to secure the battery door in place using a screw-driver.
FIGURE 1-14 Replacing the battery door
1-14 Installing Batteries in the 705+ SPARK and BLAZE User Manual
Using Rechargeable Batteries
NOTE: Only AA type batteries can beused in the Spark instruments.
Note: The instrument should not beoperated in an explosiveenvironment if using any batteriesother than those approved and listedin Intrinsic Safety Approvals on pageE-1.
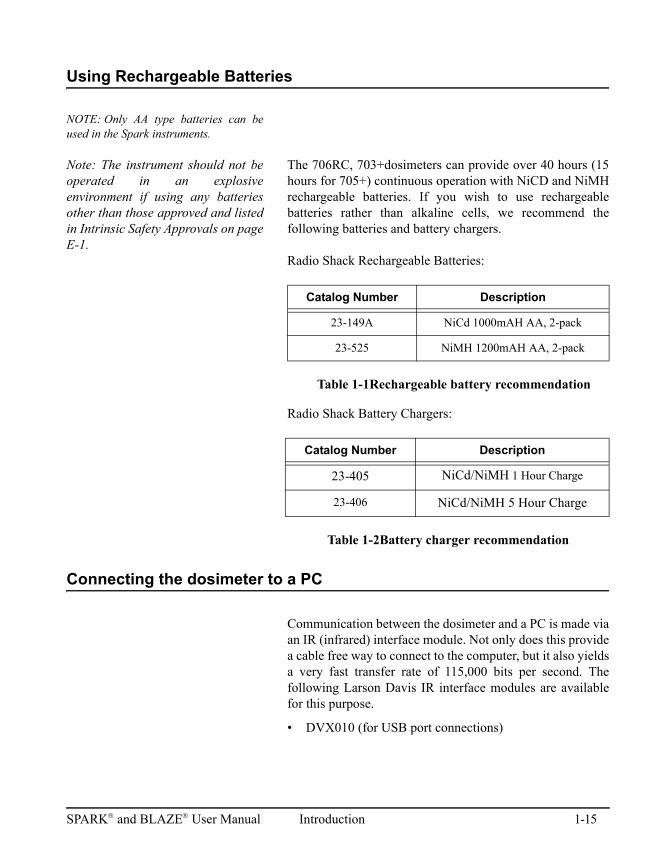
The 706RC, 703+dosimeters can provide over 40 hours (15hours for 705+) continuous operation with NiCD and NiMHrechargeable batteries. If you wish to use rechargeablebatteries rather than alkaline cells, we recommend thefollowing batteries and battery chargers.
Radio Shack Rechargeable Batteries:
Table 1-1Rechargeable battery recommendation
Radio Shack Battery Chargers:
Table 1-2Battery charger recommendation
Connecting the dosimeter to a PC
Communication between the dosimeter and a PC is made viaan IR (infrared) interface module. Not only does this providea cable free way to connect to the computer, but it also yieldsa very fast transfer rate of 115,000 bits per second. Thefollowing Larson Davis IR interface modules are availablefor this purpose.
• DVX010 (for USB port connections)
Catalog Number Description
23-149A NiCd 1000mAH AA, 2-pack
23-525 NiMH 1200mAH AA, 2-pack
Catalog Number Description
23-405 NiCd/NiMH 1 Hour Charge
23-406 NiCd/NiMH 5 Hour Charge
SPARK and BLAZE User Manual Introduction 1-15
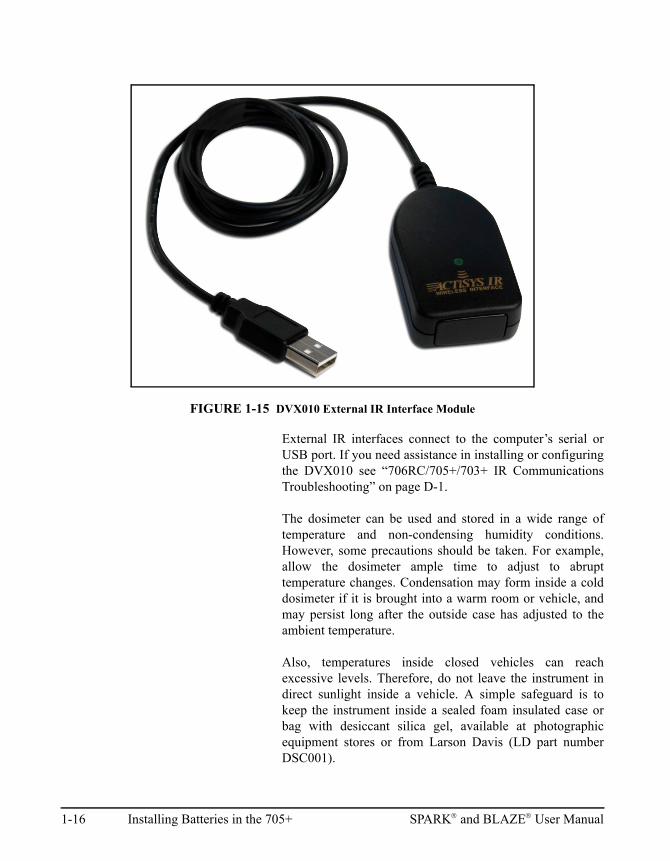
FIGURE 1-15 DVX010 External IR Interface Module
External IR interfaces connect to the computer’s serial orUSB port. If you need assistance in installing or configuringthe DVX010 see “706RC/705+/703+ IR CommunicationsTroubleshooting” on page D-1.
The dosimeter can be used and stored in a wide range oftemperature and non-condensing humidity conditions.However, some precautions should be taken. For example,allow the dosimeter ample time to adjust to abrupttemperature changes. Condensation may form inside a colddosimeter if it is brought into a warm room or vehicle, andmay persist long after the outside case has adjusted to theambient temperature.
Also, temperatures inside closed vehicles can reachexcessive levels. Therefore, do not leave the instrument indirect sunlight inside a vehicle. A simple safeguard is tokeep the instrument inside a sealed foam insulated case orbag with desiccant silica gel, available at photographicequipment stores or from Larson Davis (LD part numberDSC001).
1-16 Installing Batteries in the 705+ SPARK and BLAZE User Manual
See pages A-3 for further information regardingenvironmental considerations.
Data Retention
The measurement data gathered by the dosimeter is stored innon-volatile memory. Therefore, the data will not be lost ifthe batteries expire. However, the dosimeter will halt datagathering, and the built in clock will lose time and dateinformation should the batteries run out. In this case, theclock settings will need to be re-entered using the Blazesoftware. In order to avoid losing the clock settings andhaving the dosimeter stop during a measurement, datashould be downloaded and the batteries changed at the endof every 100 hours of continuous usage (35 hours ofcontinuous usage for the 705+). Good measurement practiceis to download data after every shift, and replace thebatteries when they are running low.
Installing the BlazeSoftware
If you downloaded Blaze in a com-pressed(zip) file, you must decom-press the file before running theinstall program.
Before installing the Blaze software, please write down theproduct serial number as found on the front of the CD.
Do not connect the DVX010 until theBlaze software has been installed.
Insert the Blaze CD into a computer to run the installprogram. Follow the installation wizard, entering the serialnumber when prompted.
You must agree to the License Agreement in order to installthe Blaze software.
The DVX010 drivers are needed for the IR-to-USB cableswhich can be used with the 703+, 705+, and 706RC noisedosimeters.
SPARK and BLAZE User Manual Introduction 1-17
703+/705+ Front Panel Indicators
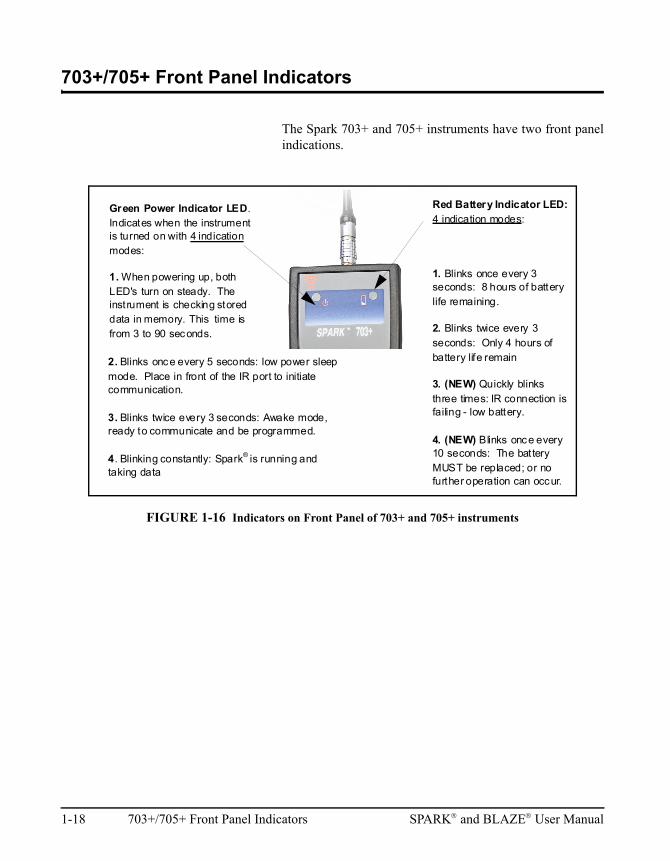
The Spark 703+ and 705+ instruments have two front panelindications.
FIGURE 1-16 Indicators on Front Panel of 703+ and 705+ instruments
Green Power Indicator LED. Indicates when the instrument is turned on with 4 indication modes:
1. When powering up, both LED's turn on steady. The instrument is checking stored data in memory. This time is from 3 to 90 seconds.
Red Battery Indicator LED: 4 indication modes:
1. Blinks once every 3 seconds: 8 hours of battery life remaining.
2. Blinks twice every 3 seconds: Only 4 hours of battery life remain
3. (NEW) Quickly blinks three times: IR connection is failing - low battery.
4. (NEW) Blinks once every 10 seconds: The battery MUST be replaced; or no further operation can occur.
2. Blinks once every 5 seconds: low power sleep mode. Place in front of the IR port to initiate communication.
3. Blinks twice every 3 seconds: Awake mode, ready to communicate and be programmed.
4. Blinking constantly: Spark® is running and taking data
1-18 703+/705+ Front Panel Indicators SPARK and BLAZE User Manual
C H A P T E R
2 Using Larson Davis Blaze
Software
Starting BlazeSoftware
To start the Blaze software in Windows:
Step 1 Click on the Start menu on the Task bar at the bottom of the Windows desktop.
Step 2 Go to the All Programs submenu.
Step 3 From the PCB Piezotronics submenu (or wherever the program was installed), select Blaze.
SPARK and BLAZE User Manual Using Larson Davis Blaze Software 2-1
BlazeMain Window
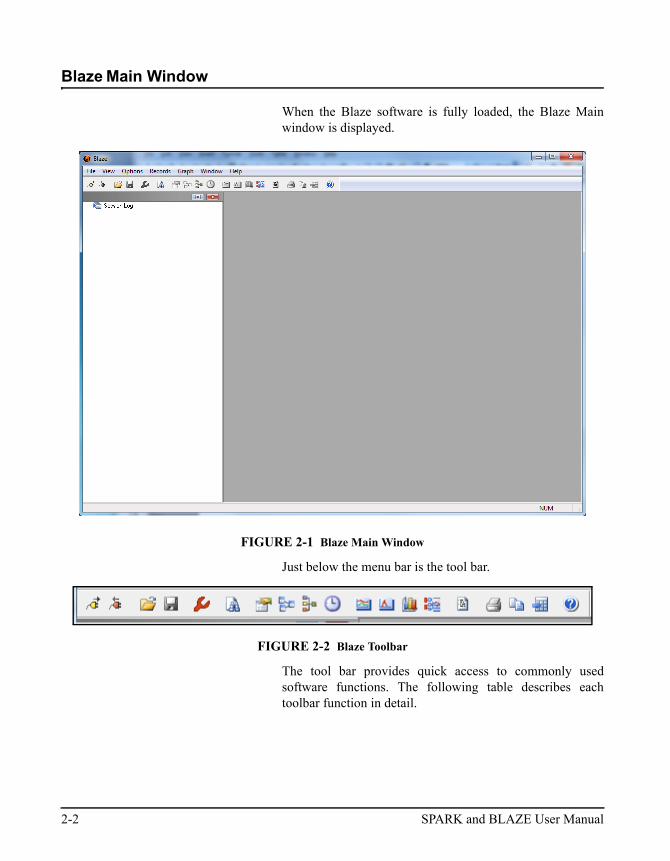
When the Blaze software is fully loaded, the Blaze Mainwindow is displayed.
FIGURE 2-1 Blaze Main Window
Just below the menu bar is the tool bar.
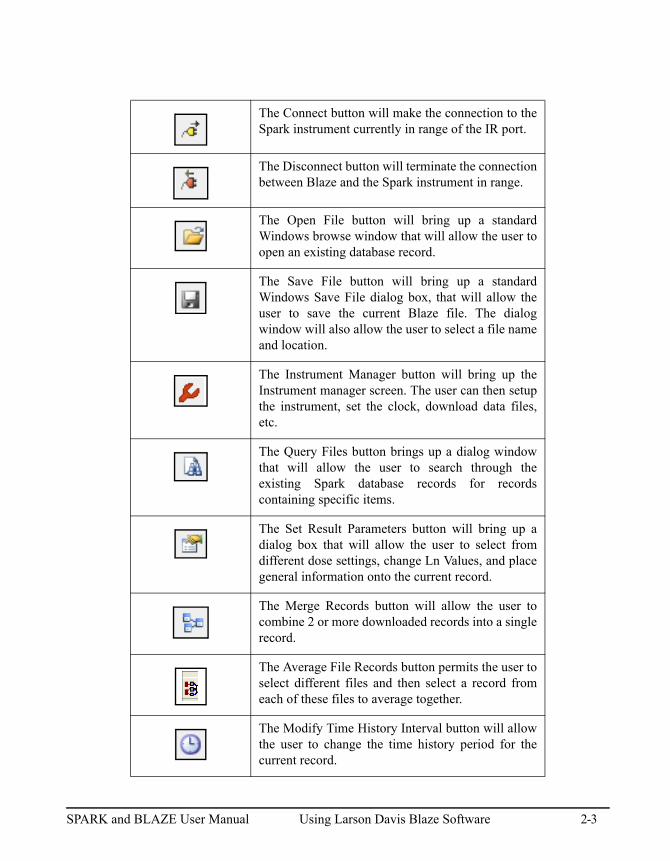
FIGURE 2-2 Blaze Toolbar
The tool bar provides quick access to commonly usedsoftware functions. The following table describes eachtoolbar function in detail.
2-2 SPARK and BLAZE User Manual
The Connect button will make the connection to theSpark instrument currently in range of the IR port.
The Disconnect button will terminate the connectionbetween Blaze and the Spark instrument in range.
The Open File button will bring up a standardWindows browse window that will allow the user toopen an existing database record.
The Save File button will bring up a standardWindows Save File dialog box, that will allow theuser to save the current Blaze file. The dialogwindow will also allow the user to select a file nameand location.
The Instrument Manager button will bring up theInstrument manager screen. The user can then setupthe instrument, set the clock, download data files,etc.
The Query Files button brings up a dialog windowthat will allow the user to search through theexisting Spark database records for recordscontaining specific items.
The Set Result Parameters button will bring up adialog box that will allow the user to select fromdifferent dose settings, change Ln Values, and placegeneral information onto the current record.
The Merge Records button will allow the user tocombine 2 or more downloaded records into a singlerecord.
The Average File Records button permits the user toselect different files and then select a record fromeach of these files to average together.
The Modify Time History Interval button will allowthe user to change the time history period for thecurrent record.
SPARK and BLAZE User Manual Using Larson Davis Blaze Software 2-3
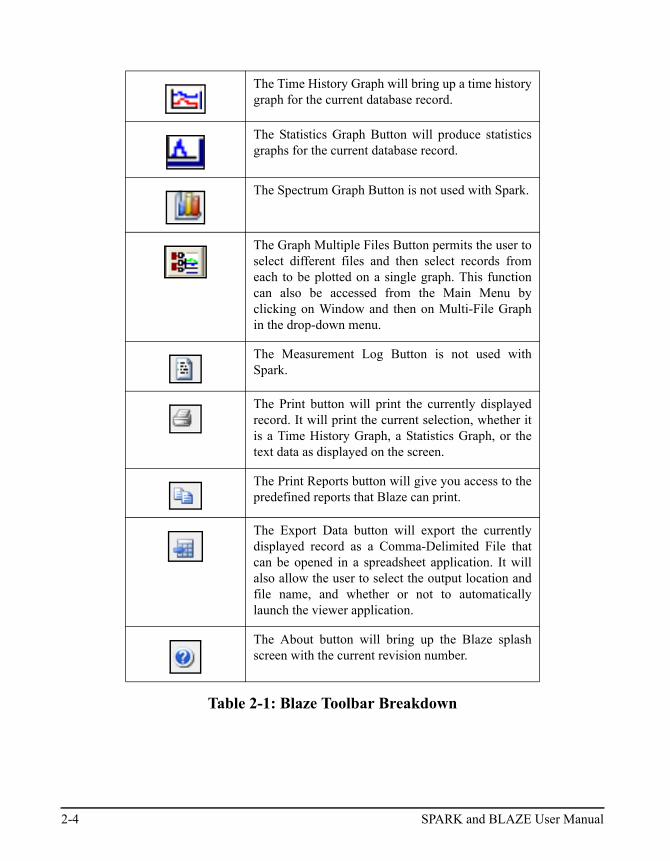
Table 2-1: Blaze Toolbar Breakdown
The Time History Graph will bring up a time historygraph for the current database record.
The Statistics Graph Button will produce statisticsgraphs for the current database record.
The Spectrum Graph Button is not used with Spark.
The Graph Multiple Files Button permits the user toselect different files and then select records fromeach to be plotted on a single graph. This functioncan also be accessed from the Main Menu byclicking on Window and then on Multi-File Graphin the drop-down menu.
The Measurement Log Button is not used withSpark.
The Print button will print the currently displayedrecord. It will print the current selection, whether itis a Time History Graph, a Statistics Graph, or thetext data as displayed on the screen.
The Print Reports button will give you access to thepredefined reports that Blaze can print.
The Export Data button will export the currentlydisplayed record as a Comma-Delimited File thatcan be opened in a spreadsheet application. It willalso allow the user to select the output location andfile name, and whether or not to automaticallylaunch the viewer application.
The About button will bring up the Blaze splashscreen with the current revision number.
2-4 SPARK and BLAZE User Manual
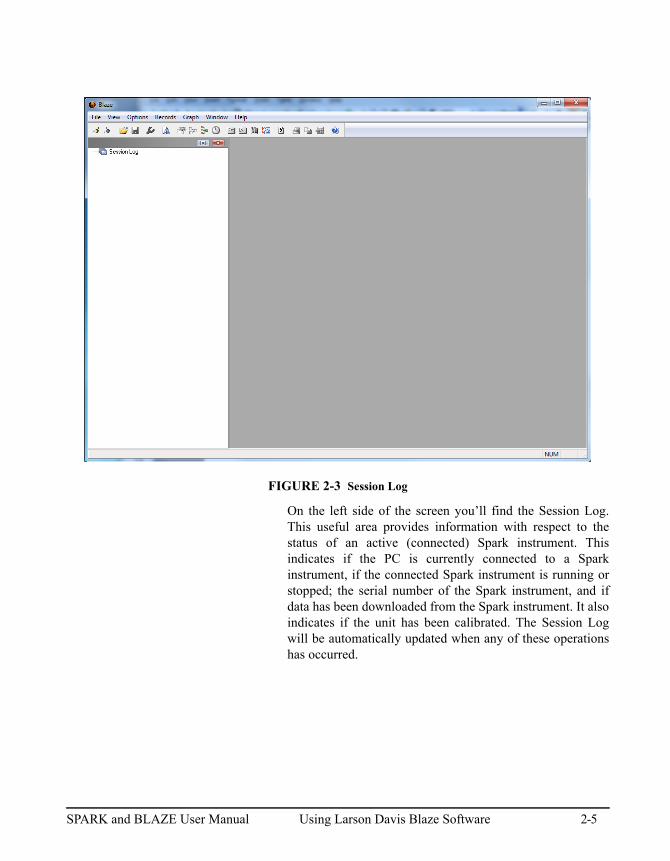
FIGURE 2-3 Session Log
On the left side of the screen you’ll find the Session Log.This useful area provides information with respect to thestatus of an active (connected) Spark instrument. Thisindicates if the PC is currently connected to a Sparkinstrument, if the connected Spark instrument is running orstopped; the serial number of the Spark instrument, and ifdata has been downloaded from the Spark instrument. It alsoindicates if the unit has been calibrated. The Session Logwill be automatically updated when any of these operationshas occurred.
SPARK and BLAZE User Manual Using Larson Davis Blaze Software 2-5
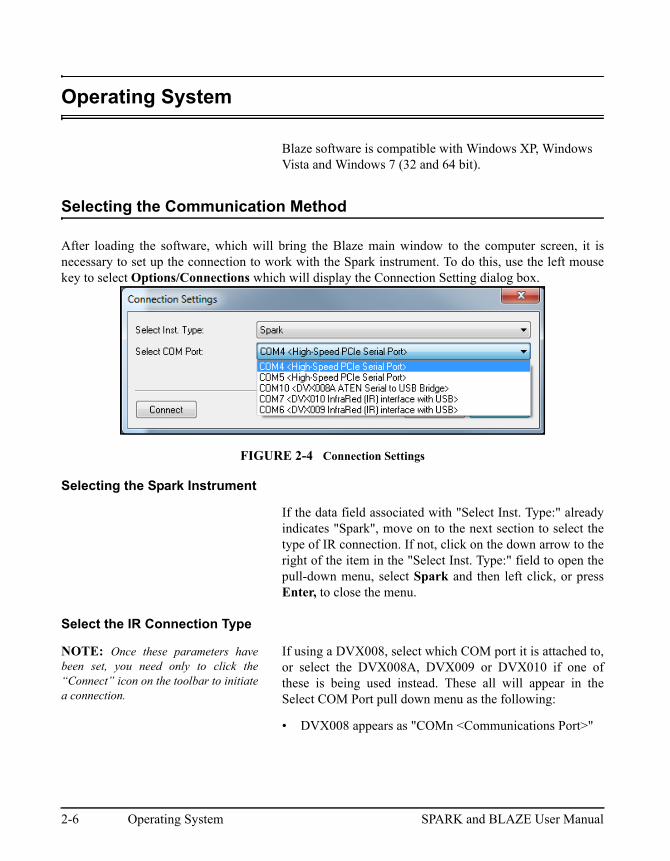
Operating System
Blaze software is compatible with Windows XP, Windows Vista and Windows 7 (32 and 64 bit).
Selecting the Communication Method
After loading the software, which will bring the Blaze main window to the computer screen, it isnecessary to set up the connection to work with the Spark instrument. To do this, use the left mousekey to select Options/Connections which will display the Connection Setting dialog box.
FIGURE 2-4 Connection Settings
Selecting the Spark Instrument
If the data field associated with "Select Inst. Type:" alreadyindicates "Spark", move on to the next section to select thetype of IR connection. If not, click on the down arrow to theright of the item in the "Select Inst. Type:" field to open thepull-down menu, select Spark and then left click, or pressEnter, to close the menu.
Select the IR Connection Type
NOTE: Once these parameters havebeen set, you need only to click the“Connect” icon on the toolbar to initiatea connection.
If using a DVX008, select which COM port it is attached to,or select the DVX008A, DVX009 or DVX010 if one ofthese is being used instead. These all will appear in theSelect COM Port pull down menu as the following:
• DVX008 appears as "COMn <Communications Port>"
2-6 Operating System SPARK and BLAZE User Manual
• DVX008A with DVX008 appears as "COMn<DVX008A ATEN Serial to USB Bridge withDVX008>""
• DVX009 appears as "COMn <DVX009 Infrared (IR)interface with USB>"
• DVX010 appears as "COMn <DVX010 Infrared (IR)interface with USB>"
Step 1 If connecting to a 706RC, press the ON key, v to power the unit up. The 703+ and 705+ will automatically turn on when it is placed in front of an active IR port.
Step 2 Aim the IR window on the top of the instrument toward the Larson Davis IR interface module.
Blaze can only communicate withone Spark instrument at a time.
For the first time setup of the computers IR port, the user canuse the Blaze Connection Wizard. The wizard can be startedby clicking on Options in the main menu and ConnectionWizard. For additional information regarding first time setupof the IR interface module, please refer to Appendix B ofthis manual.
Although distance and angle tolerance may very from PC toPC, for optimal data transfer performance it is recommendedthat the instrument be placed a distance between one andthree feet from the IR interface module.
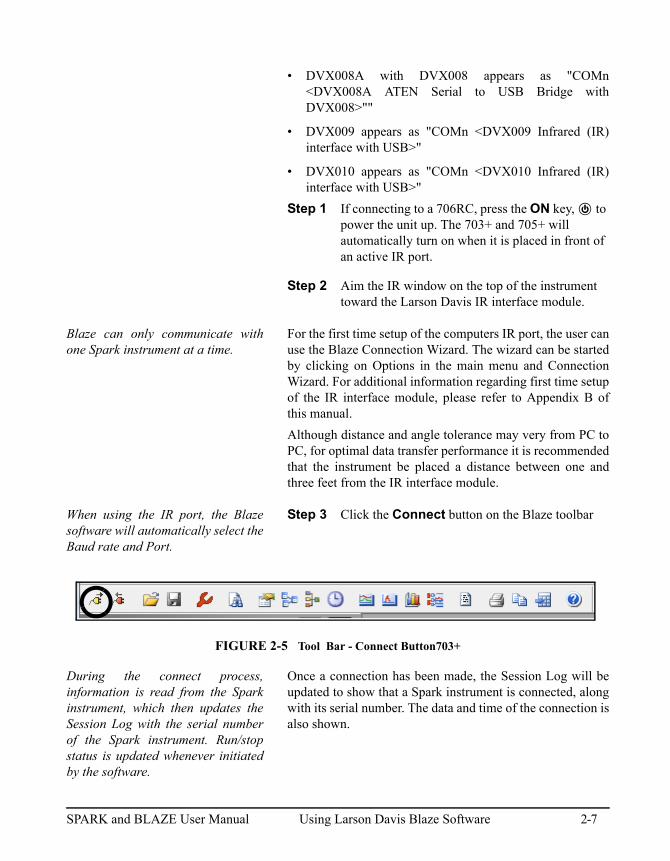
When using the IR port, the Blazesoftware will automatically select theBaud rate and Port.
Step 3 Click the Connect button on the Blaze toolbar
FIGURE 2-5 Tool Bar - Connect Button703+
During the connect process,information is read from the Sparkinstrument, which then updates theSession Log with the serial numberof the Spark instrument. Run/stopstatus is updated whenever initiatedby the software.
Once a connection has been made, the Session Log will beupdated to show that a Spark instrument is connected, alongwith its serial number. The data and time of the connection isalso shown.
SPARK and BLAZE User Manual Using Larson Davis Blaze Software 2-7
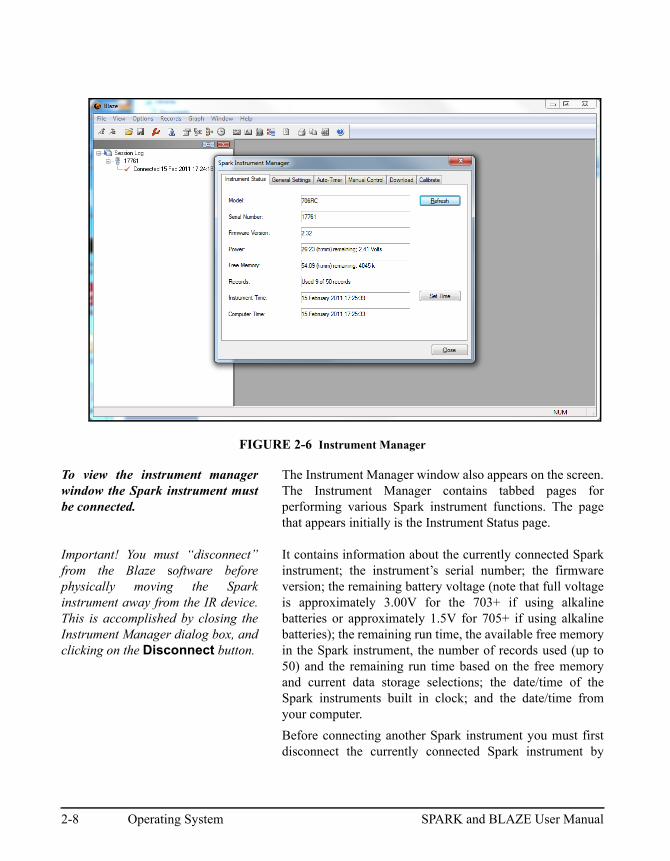
FIGURE 2-6 Instrument Manager
To view the instrument managerwindow the Spark instrument mustbe connected.
The Instrument Manager window also appears on the screen.The Instrument Manager contains tabbed pages forperforming various Spark instrument functions. The pagethat appears initially is the Instrument Status page.
Important! You must “disconnect”from the Blaze software beforephysically moving the Sparkinstrument away from the IR device.This is accomplished by closing theInstrument Manager dialog box, andclicking on the Disconnect button.
It contains information about the currently connected Sparkinstrument; the instrument’s serial number; the firmwareversion; the remaining battery voltage (note that full voltageis approximately 3.00V for the 703+ if using alkalinebatteries or approximately 1.5V for 705+ if using alkalinebatteries); the remaining run time, the available free memoryin the Spark instrument, the number of records used (up to50) and the remaining run time based on the free memoryand current data storage selections; the date/time of theSpark instruments built in clock; and the date/time fromyour computer.
Before connecting another Spark instrument you must firstdisconnect the currently connected Spark instrument by
2-8 Operating System SPARK and BLAZE User Manual
clicking on the Disconnect button before re-establishing anew connection.
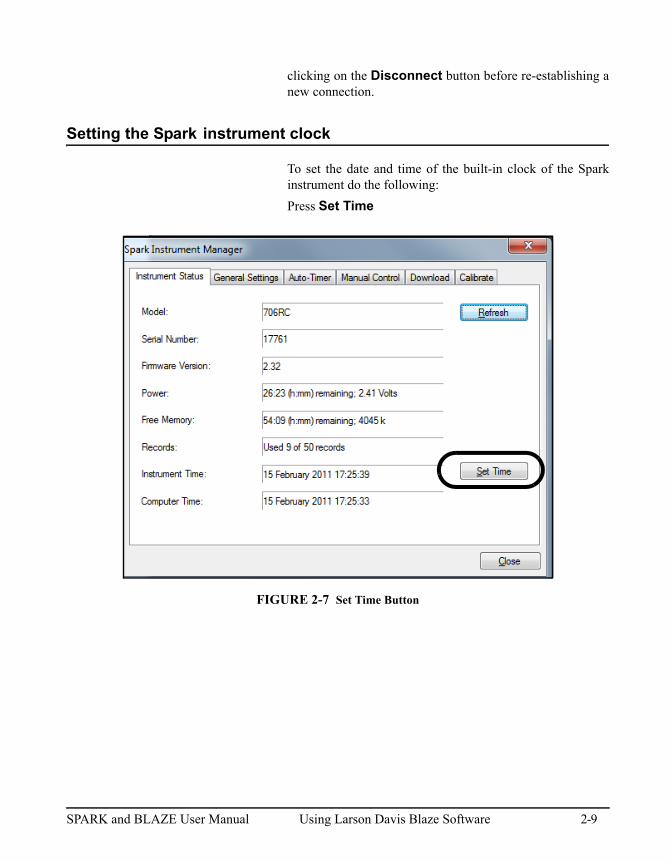
Setting the Sparkinstrument clock
To set the date and time of the built-in clock of the Sparkinstrument do the following:
Press Set Time
FIGURE 2-7 Set Time Button
SPARK and BLAZE User Manual Using Larson Davis Blaze Software 2-9
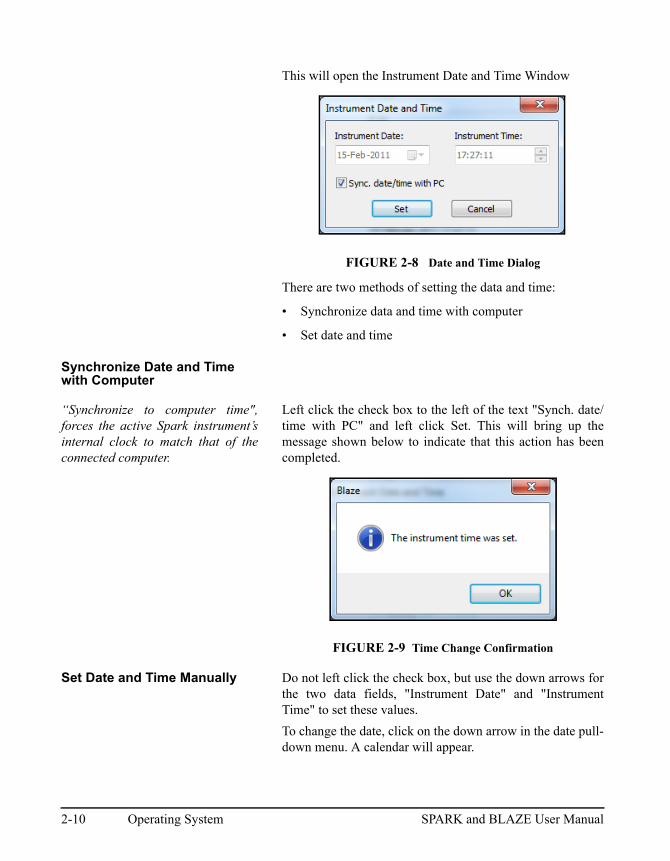
This will open the Instrument Date and Time Window
FIGURE 2-8 Date and Time Dialog
There are two methods of setting the data and time:
• Synchronize data and time with computer
• Set date and time
Synchronize Date and Time with Computer
“Synchronize to computer time",forces the active Spark instrument’sinternal clock to match that of theconnected computer.
Left click the check box to the left of the text "Synch. date/time with PC" and left click Set. This will bring up themessage shown below to indicate that this action has beencompleted.
FIGURE 2-9 Time Change Confirmation
Set Date and Time Manually Do not left click the check box, but use the down arrows forthe two data fields, "Instrument Date" and "InstrumentTime" to set these values.
To change the date, click on the down arrow in the date pull-down menu. A calendar will appear.
2-10 Operating System SPARK and BLAZE User Manual
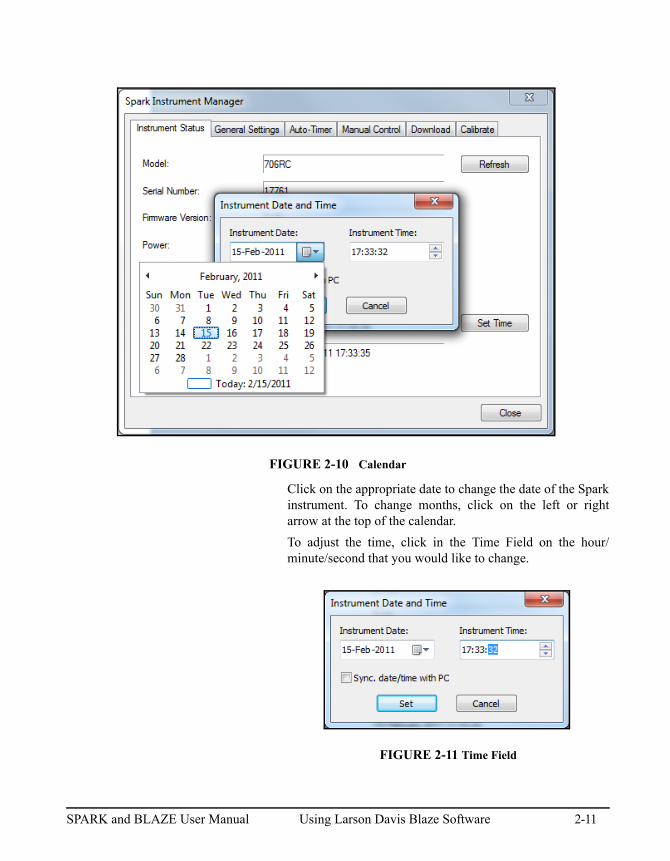
FIGURE 2-10 Calendar
Click on the appropriate date to change the date of the Sparkinstrument. To change months, click on the left or rightarrow at the top of the calendar.
To adjust the time, click in the Time Field on the hour/minute/second that you would like to change.
FIGURE 2-11 Time Field
SPARK and BLAZE User Manual Using Larson Davis Blaze Software 2-11
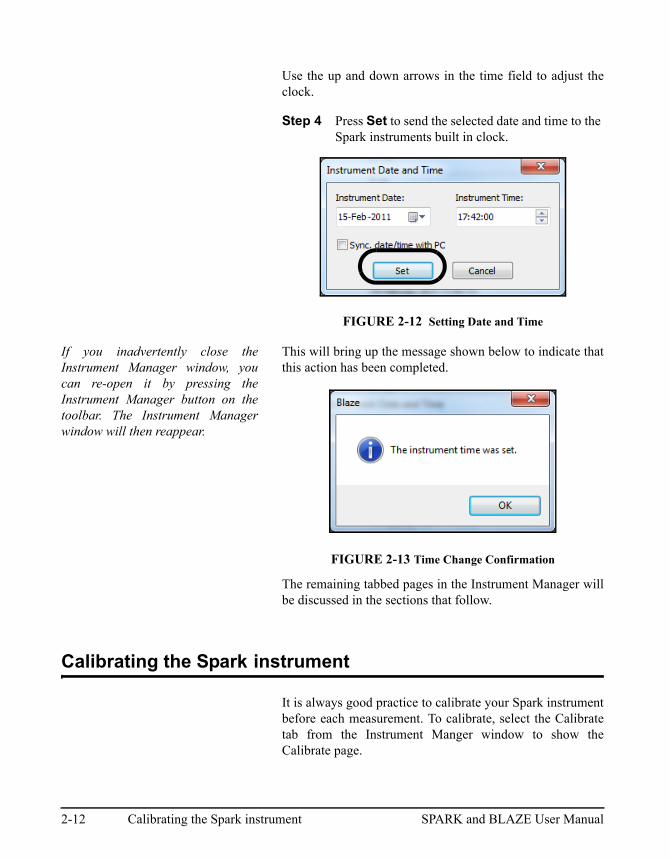
Use the up and down arrows in the time field to adjust theclock.
Step 4 Press Set to send the selected date and time to the Spark instruments built in clock.
FIGURE 2-12 Setting Date and Time
If you inadvertently close theInstrument Manager window, youcan re-open it by pressing theInstrument Manager button on thetoolbar. The Instrument Managerwindow will then reappear.
This will bring up the message shown below to indicate thatthis action has been completed.
FIGURE 2-13 Time Change Confirmation
The remaining tabbed pages in the Instrument Manager willbe discussed in the sections that follow.
Calibrating the Sparkinstrument
It is always good practice to calibrate your Spark instrumentbefore each measurement. To calibrate, select the Calibratetab from the Instrument Manger window to show theCalibrate page.
2-12 Calibrating the Spark instrument SPARK and BLAZE User Manual
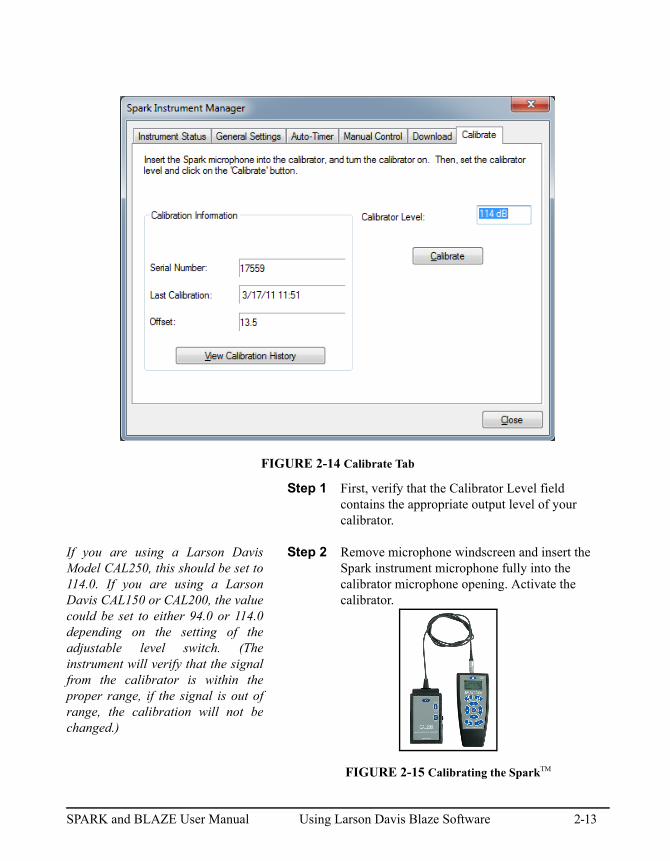
FIGURE 2-14 Calibrate Tab
Step 1 First, verify that the Calibrator Level field contains the appropriate output level of your calibrator.
If you are using a Larson DavisModel CAL250, this should be set to114.0. If you are using a LarsonDavis CAL150 or CAL200, the valuecould be set to either 94.0 or 114.0depending on the setting of theadjustable level switch. (Theinstrument will verify that the signalfrom the calibrator is within theproper range, if the signal is out ofrange, the calibration will not bechanged.)
Step 2 Remove microphone windscreen and insert the Spark instrument microphone fully into the calibrator microphone opening. Activate the calibrator.
FIGURE 2-15 Calibrating the SparkTM
SPARK and BLAZE User Manual Using Larson Davis Blaze Software 2-13
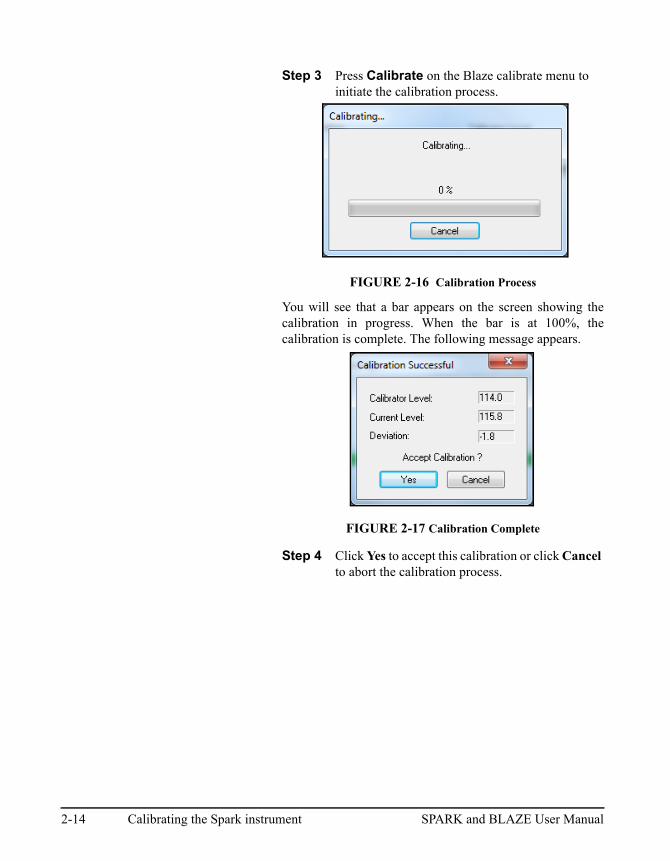
Step 3 Press Calibrate on the Blaze calibrate menu to initiate the calibration process.
FIGURE 2-16 Calibration Process
You will see that a bar appears on the screen showing thecalibration in progress. When the bar is at 100%, thecalibration is complete. The following message appears.
FIGURE 2-17 Calibration Complete
Step 4 Click Yes to accept this calibration or click Cancel to abort the calibration process.
2-14 Calibrating the Spark instrument SPARK and BLAZE User Manual
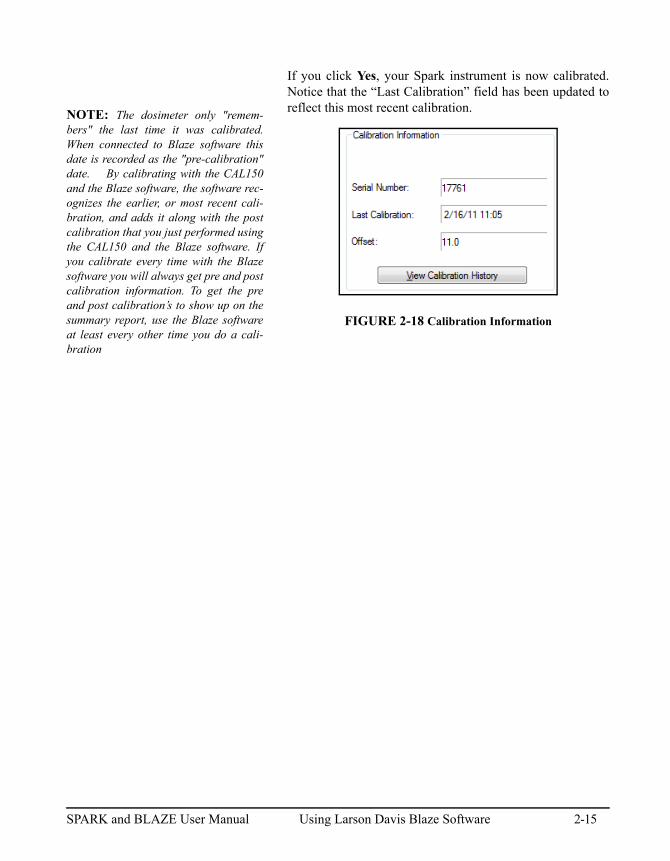
If you click Yes, your Spark instrument is now calibrated.Notice that the “Last Calibration” field has been updated toreflect this most recent calibration.NOTE: The dosimeter only "remem-
bers" the last time it was calibrated.When connected to Blaze software thisdate is recorded as the "pre-calibration"date. By calibrating with the CAL150and the Blaze software, the software rec-ognizes the earlier, or most recent cali-bration, and adds it along with the postcalibration that you just performed usingthe CAL150 and the Blaze software. Ifyou calibrate every time with the Blazesoftware you will always get pre and postcalibration information. To get the preand post calibration’s to show up on thesummary report, use the Blaze softwareat least every other time you do a cali-bration
FIGURE 2-18 Calibration Information
SPARK and BLAZE User Manual Using Larson Davis Blaze Software 2-15
Calibration Information
The Calibration Information area is located on the left sideof the screen, within the Calibration window. The LastCalibration field contains the date and time a calibration wasperformed on the connected Spark instrument. The serialnumber of the connected Spark instrument is shown in theSerial Number field.
Calibration Offset The offset field displays an "Offset number" each time acalibration is performed. The Offset number generatedbefore leaving the factory is entered into a log for the servicetechnicians to be able to track how the dosimeter hasadjusted or corrected itself over time to deal with varyingmicrophone sensitivities. This offset naturally changes frominstrument to instrument, depending on those variedmicrophone sensitivities.
The Deviation Field is very important as it can alert you toproblems with your Spark instrument, preamp, microphone,and/or calibrator. A calibration compares the dB level beingread by the Spark instrument with a known dB level comingfrom the calibrator. The difference between the two dBlevels becomes the calibration deviation for the Sparkinstrument which is added to the relative output of the Sparkinstrument. This is how the instrument "corrects" itself tocompensate for the "drift" that the instrument mayexperience during its lifetime, making adjustments internallyto compensate for varying microphone sensitivities due toenvironmental considerations like heat, cold, humidity,accidental abuse or neglect of the microphone
A significant change (over +/- 1.5 dB) in deviation aftercalibration may indicate an instrument error or drift. It canalso indicate an error in the calibration process, like havingthe calibrator switched to an incorrect output level, or aproblem with the microphone as described above. If youhappen to change the microphone, you could see a largerdifference in your offset and deviation as differentmicrophones have different sensitivities. Under thiscircumstance do not be alarmed by this large change inoffset and deviation, as the instrument will correct itself forthe new microphone sensitivity, and will function normally.
2-16 Calibrating the Spark instrument SPARK and BLAZE User Manual
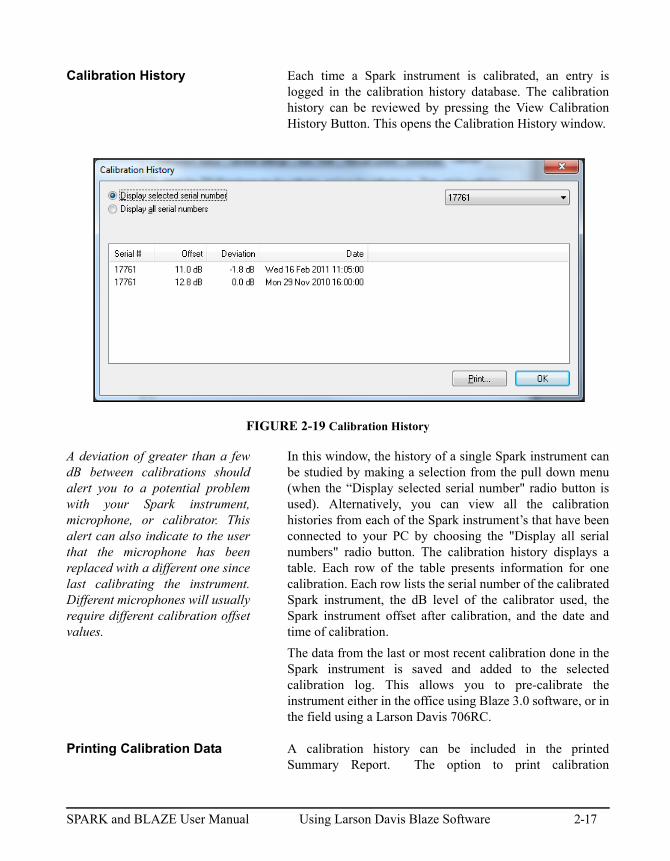
Calibration History Each time a Spark instrument is calibrated, an entry islogged in the calibration history database. The calibrationhistory can be reviewed by pressing the View CalibrationHistory Button. This opens the Calibration History window.
FIGURE 2-19 Calibration History
A deviation of greater than a fewdB between calibrations shouldalert you to a potential problemwith your Spark instrument,microphone, or calibrator. Thisalert can also indicate to the userthat the microphone has beenreplaced with a different one sincelast calibrating the instrument.Different microphones will usuallyrequire different calibration offsetvalues.
In this window, the history of a single Spark instrument canbe studied by making a selection from the pull down menu(when the “Display selected serial number" radio button isused). Alternatively, you can view all the calibrationhistories from each of the Spark instrument’s that have beenconnected to your PC by choosing the "Display all serialnumbers" radio button. The calibration history displays atable. Each row of the table presents information for onecalibration. Each row lists the serial number of the calibratedSpark instrument, the dB level of the calibrator used, theSpark instrument offset after calibration, and the date andtime of calibration.
The data from the last or most recent calibration done in theSpark instrument is saved and added to the selectedcalibration log. This allows you to pre-calibrate theinstrument either in the office using Blaze 3.0 software, or inthe field using a Larson Davis 706RC.
Printing Calibration Data A calibration history can be included in the printedSummary Report. The option to print calibration
SPARK and BLAZE User Manual Using Larson Davis Blaze Software 2-17
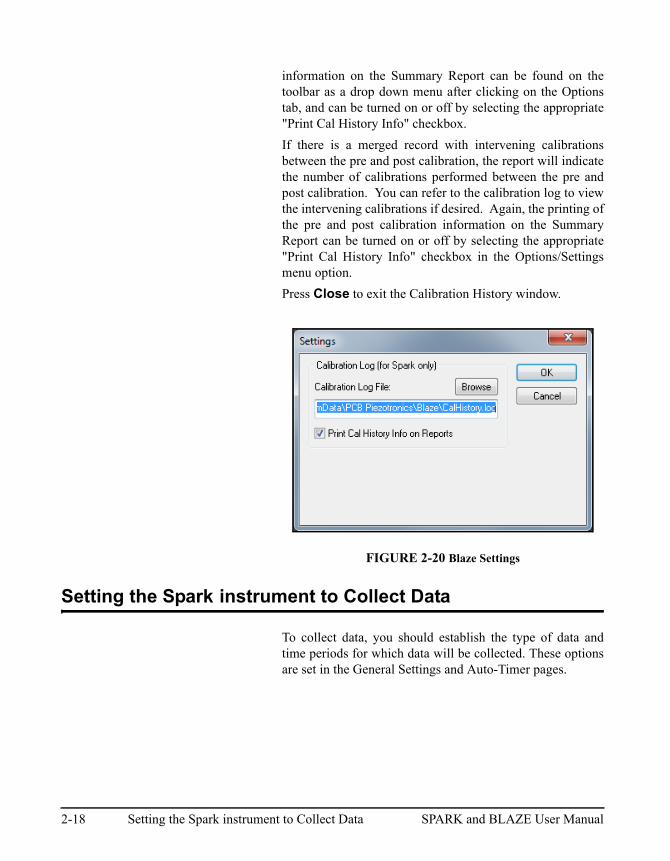
information on the Summary Report can be found on thetoolbar as a drop down menu after clicking on the Optionstab, and can be turned on or off by selecting the appropriate"Print Cal History Info" checkbox.
If there is a merged record with intervening calibrationsbetween the pre and post calibration, the report will indicatethe number of calibrations performed between the pre andpost calibration. You can refer to the calibration log to viewthe intervening calibrations if desired. Again, the printing ofthe pre and post calibration information on the SummaryReport can be turned on or off by selecting the appropriate"Print Cal History Info" checkbox in the Options/Settingsmenu option.
Press Close to exit the Calibration History window.
FIGURE 2-20 Blaze Settings
Setting the Sparkinstrument to Collect Data
To collect data, you should establish the type of data andtime periods for which data will be collected. These optionsare set in the General Settings and Auto-Timer pages.
2-18 Setting the Spark instrument to Collect Data SPARK and BLAZE User Manual
General Settings
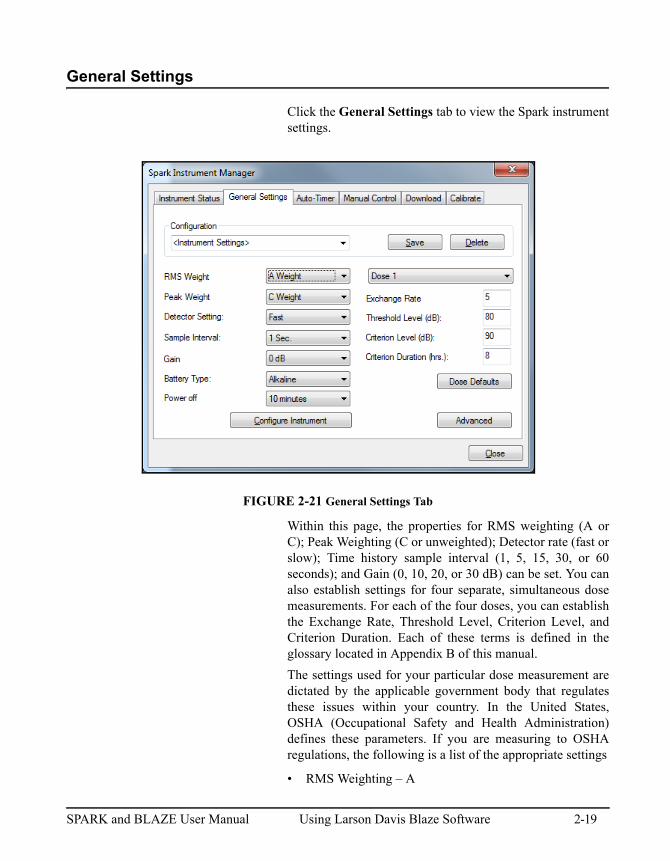
Click the General Settings tab to view the Spark instrumentsettings.
FIGURE 2-21 General Settings Tab
Within this page, the properties for RMS weighting (A orC); Peak Weighting (C or unweighted); Detector rate (fast orslow); Time history sample interval (1, 5, 15, 30, or 60seconds); and Gain (0, 10, 20, or 30 dB) can be set. You canalso establish settings for four separate, simultaneous dosemeasurements. For each of the four doses, you can establishthe Exchange Rate, Threshold Level, Criterion Level, andCriterion Duration. Each of these terms is defined in theglossary located in Appendix B of this manual.
The settings used for your particular dose measurement aredictated by the applicable government body that regulatesthese issues within your country. In the United States,OSHA (Occupational Safety and Health Administration)defines these parameters. If you are measuring to OSHAregulations, the following is a list of the appropriate settings
• RMS Weighting – A
SPARK and BLAZE User Manual Using Larson Davis Blaze Software 2-19
• Peak Weighting – Unweighted
• Detector Rate – Slow
• Exchange Rate – 5 dB
• Threshold Level – 80 dB
• Criterion Level – 90 dB
• Criterion Time – 8 hours
Modifying the General Settings
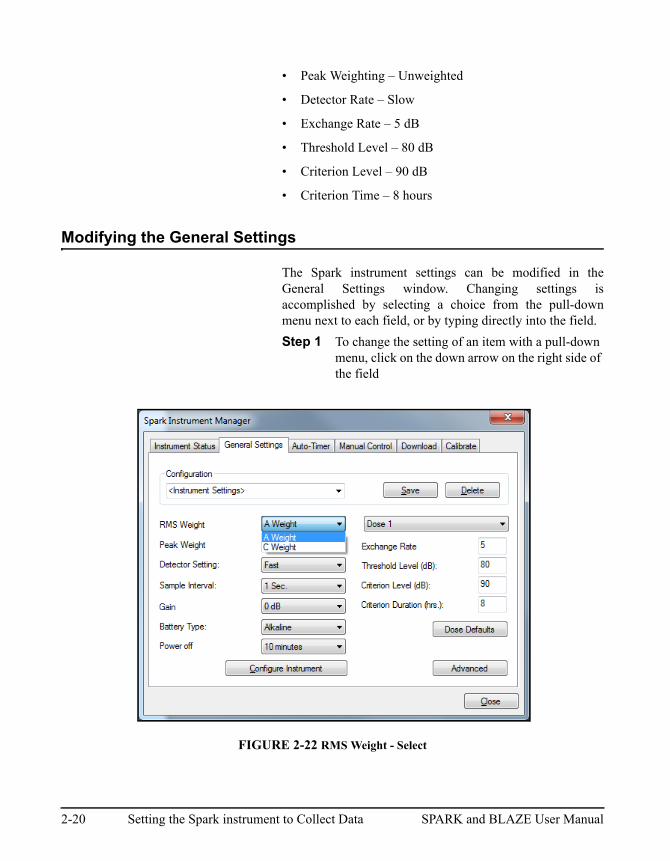
The Spark instrument settings can be modified in theGeneral Settings window. Changing settings isaccomplished by selecting a choice from the pull-downmenu next to each field, or by typing directly into the field.
Step 1 To change the setting of an item with a pull-down menu, click on the down arrow on the right side of the field
FIGURE 2-22 RMS Weight - Select
2-20 Setting the Spark instrument to Collect Data SPARK and BLAZE User Manual
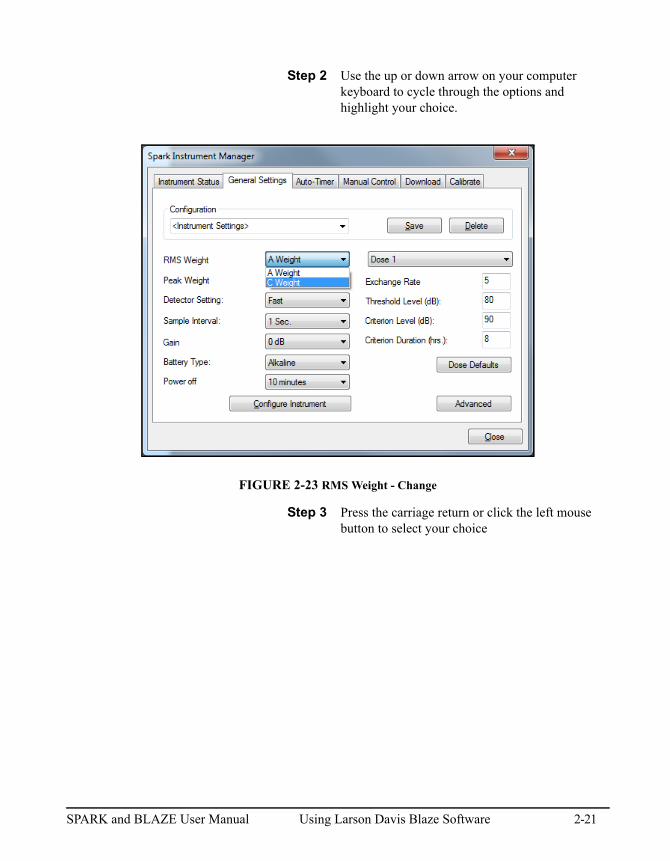
Step 2 Use the up or down arrow on your computer keyboard to cycle through the options and highlight your choice.
FIGURE 2-23 RMS Weight - Change
Step 3 Press the carriage return or click the left mouse button to select your choice
SPARK and BLAZE User Manual Using Larson Davis Blaze Software 2-21
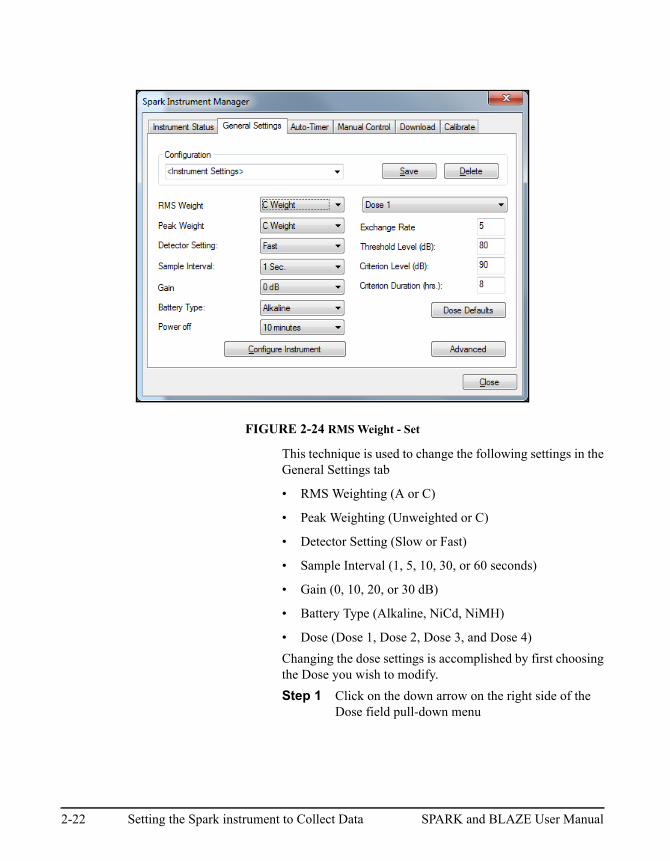
FIGURE 2-24 RMS Weight - Set
This technique is used to change the following settings in theGeneral Settings tab
• RMS Weighting (A or C)
• Peak Weighting (Unweighted or C)
• Detector Setting (Slow or Fast)
• Sample Interval (1, 5, 10, 30, or 60 seconds)
• Gain (0, 10, 20, or 30 dB)
• Battery Type (Alkaline, NiCd, NiMH)
• Dose (Dose 1, Dose 2, Dose 3, and Dose 4)
Changing the dose settings is accomplished by first choosingthe Dose you wish to modify.
Step 1 Click on the down arrow on the right side of the Dose field pull-down menu
2-22 Setting the Spark instrument to Collect Data SPARK and BLAZE User Manual
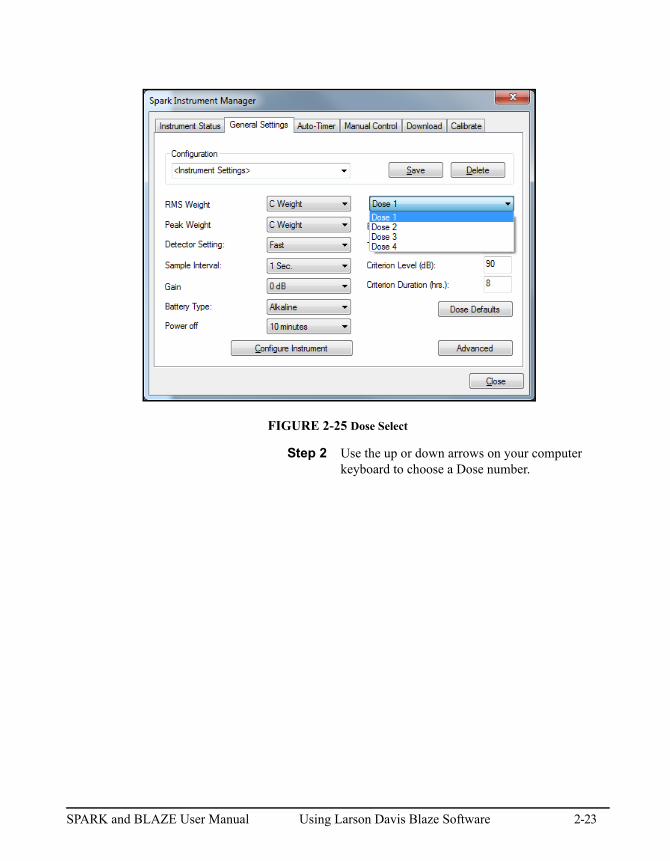
FIGURE 2-25 Dose Select
Step 2 Use the up or down arrows on your computer keyboard to choose a Dose number.
SPARK and BLAZE User Manual Using Larson Davis Blaze Software 2-23
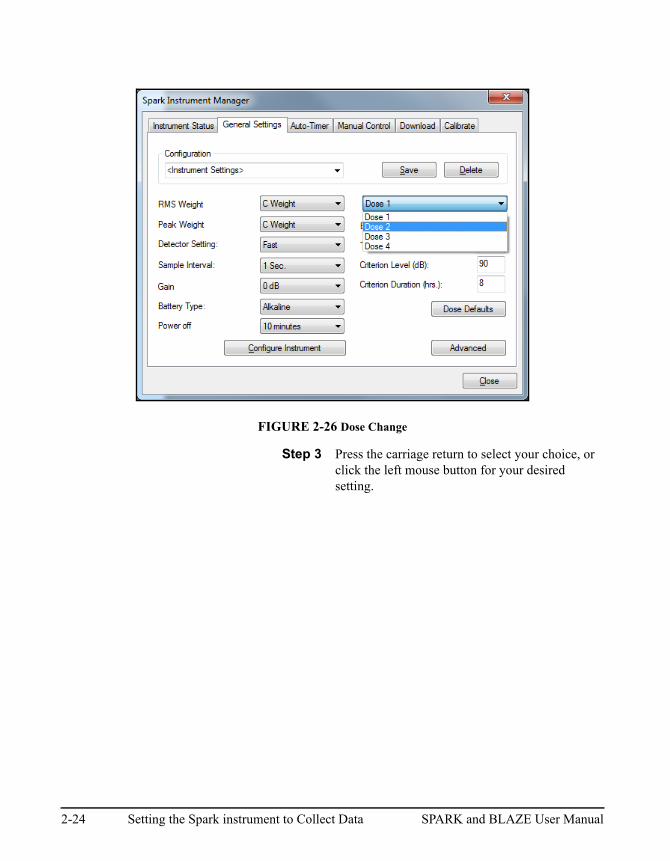
FIGURE 2-26 Dose Change
Step 3 Press the carriage return to select your choice, or click the left mouse button for your desired setting.
2-24 Setting the Spark instrument to Collect Data SPARK and BLAZE User Manual
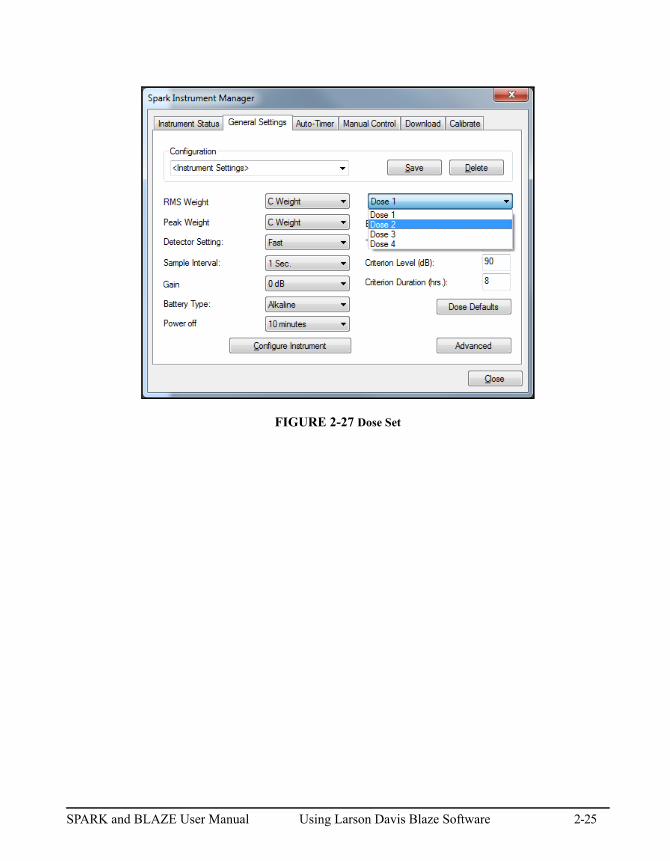
FIGURE 2-27 Dose Set
SPARK and BLAZE User Manual Using Larson Davis Blaze Software 2-25
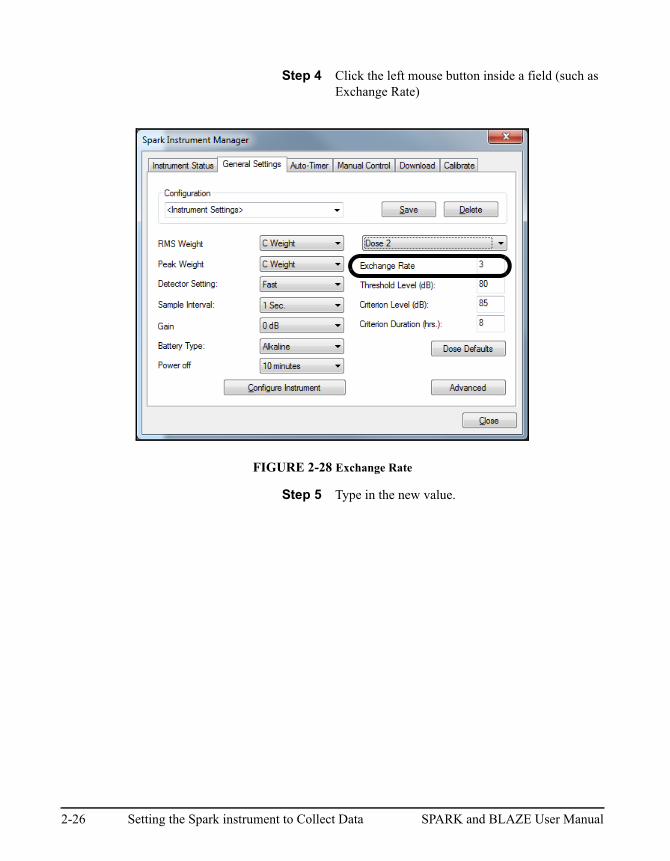
Step 4 Click the left mouse button inside a field (such as Exchange Rate)
FIGURE 2-28 Exchange Rate
Step 5 Type in the new value.
2-26 Setting the Spark instrument to Collect Data SPARK and BLAZE User Manual
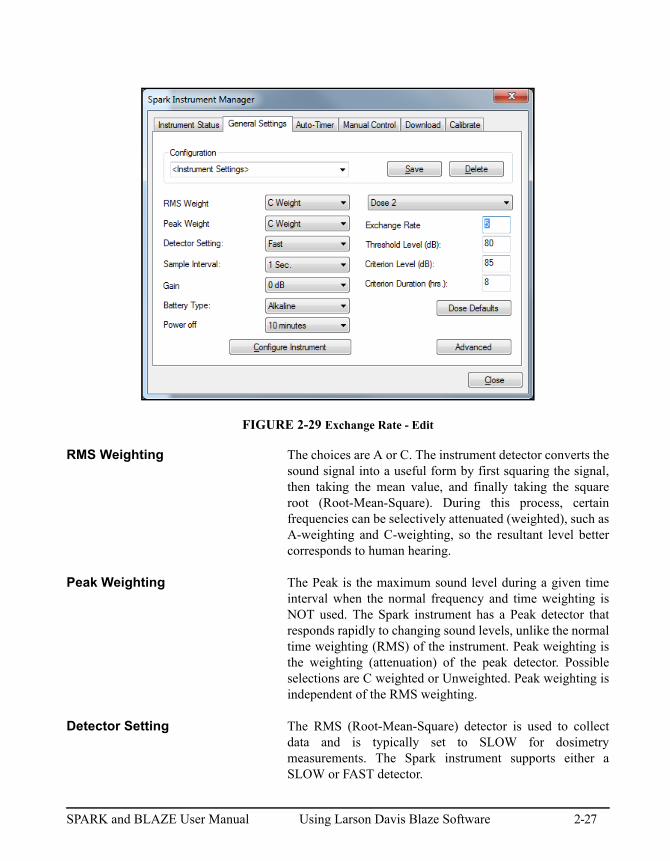
FIGURE 2-29 Exchange Rate - Edit
RMS Weighting The choices are A or C. The instrument detector converts thesound signal into a useful form by first squaring the signal,then taking the mean value, and finally taking the squareroot (Root-Mean-Square). During this process, certainfrequencies can be selectively attenuated (weighted), such asA-weighting and C-weighting, so the resultant level bettercorresponds to human hearing.
Peak Weighting The Peak is the maximum sound level during a given timeinterval when the normal frequency and time weighting isNOT used. The Spark instrument has a Peak detector thatresponds rapidly to changing sound levels, unlike the normaltime weighting (RMS) of the instrument. Peak weighting isthe weighting (attenuation) of the peak detector. Possibleselections are C weighted or Unweighted. Peak weighting isindependent of the RMS weighting.
Detector Setting The RMS (Root-Mean-Square) detector is used to collectdata and is typically set to SLOW for dosimetrymeasurements. The Spark instrument supports either aSLOW or FAST detector.
SPARK and BLAZE User Manual Using Larson Davis Blaze Software 2-27
Sample Interval The “Sample Interval of the Time History” determines howoften a sample is stored in the Spark instrument. TimeHistories are very helpful if you wish to see how the soundvaries during the measurement period. A short SampleInterval (1-second) will provide excellent resolution, butrequires more Spark instrument memory. A longer SampleInterval (1-minute) is normally sufficient for work noiseexposure surveys.
Gain For general dosimetry measurements, the gain should be setto 0 dB. Adding gain (using 10, 20, or 30 dB) will allow youto measure lower sound pressure levels. While this feature isvery useful for general sound level meter measurements, it isnot necessary or advisable for dose measurements.
Battery Type The battery type selection allows the user to select the typeof battery they wish to use. The three selections are,Alkaline, NiCD, and NiMH. The Alkaline battery selectionis the default selection, and alkaline’s are the factorysupplied batteries. The NiCD and NiMH batteries must beuser provided. It is important that this selection be accurateso that the remaining battery time indicator is accurate.
WARNING! In explosive environments, only approved alkaline batteries can be used in this instrument. (See page A-9 for approved batteries.)
Dose The Spark instrument is capable of measuring 4simultaneous noise dose measurements (Dose 1, Dose 2,Dose 3, and Dose 4). Each dose can have independently setdose parameters (exchange rates, threshold levels, criterionlevels, and criterion times). Blaze software allows you tosetup each of the dose parameters for each of the dosecalculations. Furthermore, Blaze is capable of partiallyrecomputing dose combination’s after the acquired data hasbeen downloaded into the software. The criterion level andcriterion time can be changed after the data is downloaded.
Dose Default Values Although the dose default values can be changes asdescribed below, the user can reset them all to the defaultvalues by pressing the Defaults Button.
Exchange Rate Exchange rate is defined in ANSI S1.25 as “the change insound level corresponding to a doubling or halving of theduration of sound level while a constant percentage of
2-28 Setting the Spark instrument to Collect Data SPARK and BLAZE User Manual
criterion exposure is maintained”. Possible values for thisfield are 3, 4, 5, or 6. The current OSHA exchange rate is 5.A value of 3 will produce Leq-like levels.
Threshold Level (dB) ANSI S1.25 defines threshold as “a sound level belowwhich the dosimeter produces little or no dose accumulationas specified in this standard.” Noise levels below thethreshold will not be included in the Spark instrument dosecomputation. The current OSHA threshold is 80 dB. Outsideof the U.S., the threshold level is typically set to 0 dB.
Criterion Level (dB) Criterion Level is the level of sound that will produce a doseof 100% if continually applied for the criterion time. Thecurrent OSHA criterion level is 90 dB.
Criterion Duration (hrs.) Criterion duration is the time required for a continuallyapplied sound of the selected criterion level to produce adose of 100%. Criterion duration is typically 8 hours.
S.E.A. Metric
This metric is the summation of the acoustical energy ofimpact measured in dB (Peak, unweighted) greater or equalto 120 dB. The formula used by Blaze is:
SEA = 10 log10[10lw/10] where lw is the unweighted Peakvalue exceeding or equal to 120 dB.
Because the metric is for impact peak data, the Spark musttake 1 second data even if the desired sample interval isgreater than one second. It also must set the Peak weightingto "Unweighted". When the "Store SEA data" check box ischecked, only the Unweighted option will be available in thePeak Weighting combo box. In order to satisfy bothrequirements of required 1 second data and the user's desirefor larger sample intervals, Blaze will download the 1second Peak data from the Spark and calculate the SEA.Blaze will then compress the 1 second data into the desiredtime intervals. The SEA data will be displayed in theSummary section of all reports if it is selected. Otherwise, itwill not be calculated and will not be displayed. Once a filehas been saved, SEA cannot be calculated if it was not doneat download time. To calculate and store the SEA data,connect to the spark, select the General Settings tab, andthen click on the "Advanced" button.
SPARK and BLAZE User Manual Using Larson Davis Blaze Software 2-29
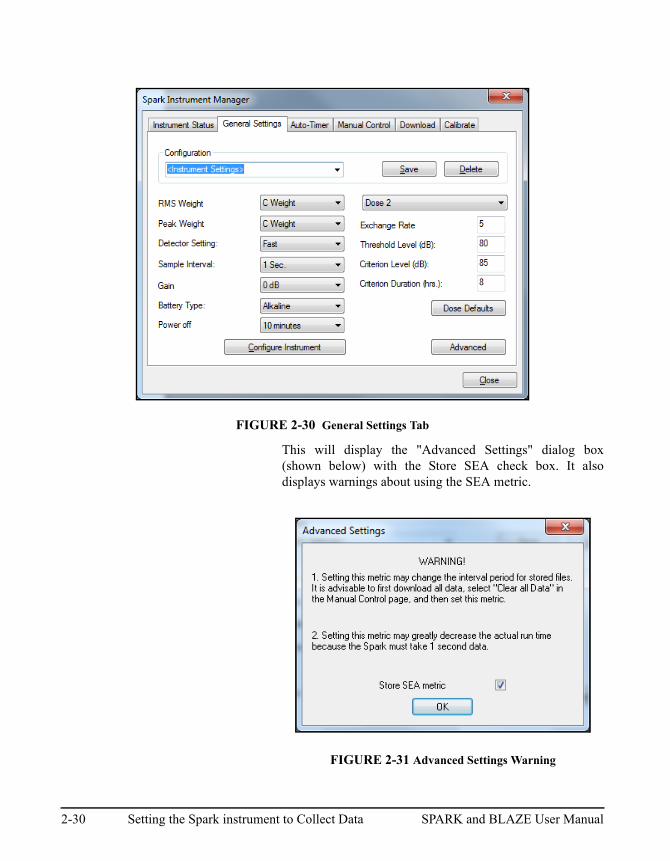
FIGURE 2-30 General Settings Tab
This will display the "Advanced Settings" dialog box(shown below) with the Store SEA check box. It alsodisplays warnings about using the SEA metric.
FIGURE 2-31 Advanced Settings Warning
2-30 Setting the Spark instrument to Collect Data SPARK and BLAZE User Manual
The first warning message indicates that if you have filesstored in the Spark that were generated before selecting the"Store SEA metric", the sample interval for the stored filesmay change when downloaded. This will happen if thestored file(s) was taken with 1 second time interval and thenthe user does the following steps:
• Selects Show SEA
• Sets the Sample Interval to other than 1 second
• Configures the instrument
• Downloads.
Blaze will compress the file into the new sample interval andthe 1 second data will be lost if you tell Blaze to delete thefiles after download.
The second warning is the result of forcing the Spark to take1 second data even though the user desires a higher sampleinterval. If the user desires 60 second data, the actual runtime will decrease by a factor of about 60 because it will useup almost 60 times more memory.
User Defined Configurations
Once you have selected the instrument settings for yourparticular measurement you can save them as the default oras a custom setup. This allows you to set up a library ofalternate instrument setting configurations as needed orrequired by the applicable governing body. This makes itpossible to set up the instrument configurations once, andsave them for quick and easy instrument configuration atany time in the future.
SPARK and BLAZE User Manual Using Larson Davis Blaze Software 2-31
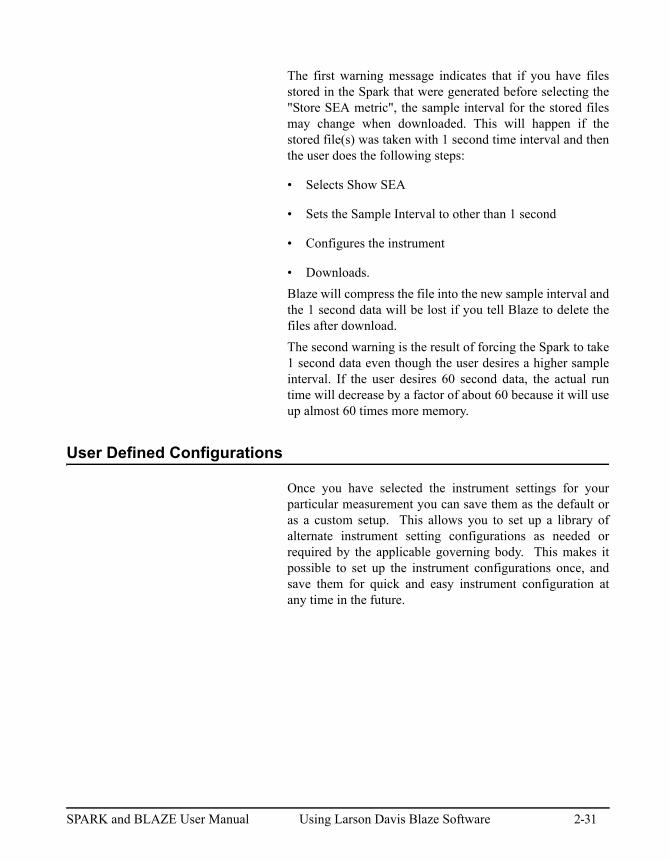
Step 1 To save the current parameters as a setup click on "Save". A window will appear to allow you to name the setup.
FIGURE 2-32 Save Configuration Dialog
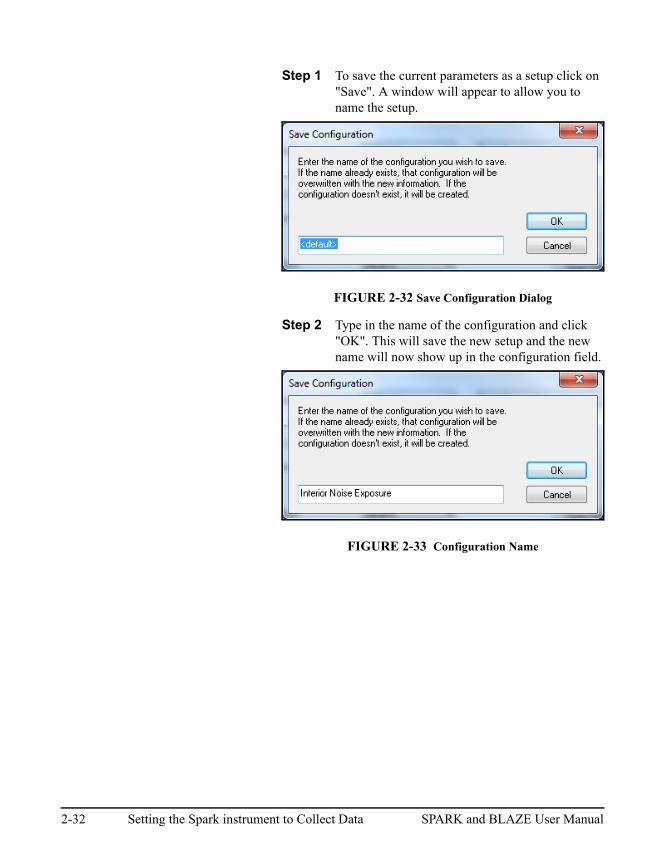
Step 2 Type in the name of the configuration and click "OK". This will save the new setup and the new name will now show up in the configuration field.
FIGURE 2-33 Configuration Name
2-32 Setting the Spark instrument to Collect Data SPARK and BLAZE User Manual
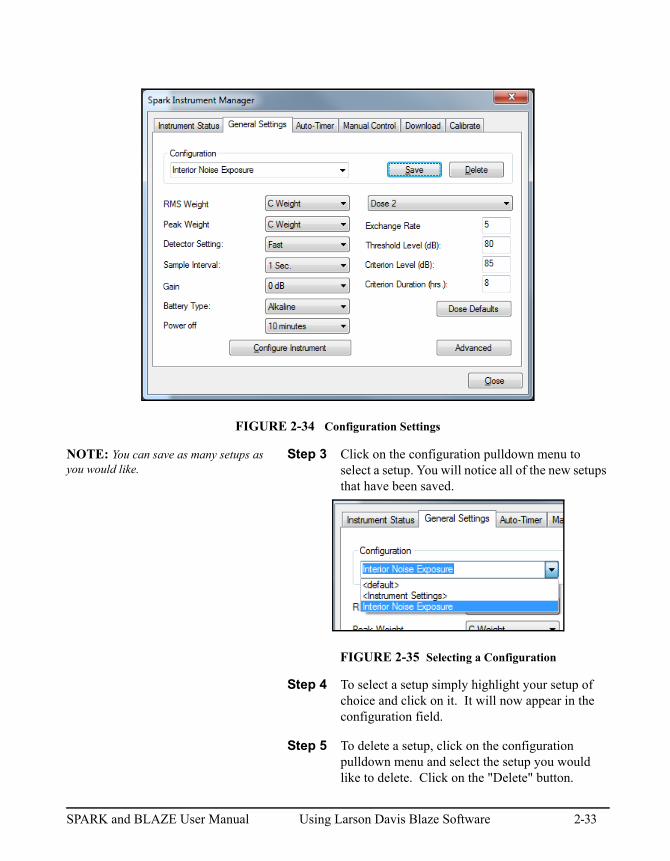
FIGURE 2-34 Configuration Settings
NOTE: You can save as many setups asyou would like.
Step 3 Click on the configuration pulldown menu to select a setup. You will notice all of the new setups that have been saved.
FIGURE 2-35 Selecting a Configuration
Step 4 To select a setup simply highlight your setup of choice and click on it. It will now appear in the configuration field.
Step 5 To delete a setup, click on the configuration pulldown menu and select the setup you would like to delete. Click on the "Delete" button.
SPARK and BLAZE User Manual Using Larson Davis Blaze Software 2-33
Saving the Instrument Settings
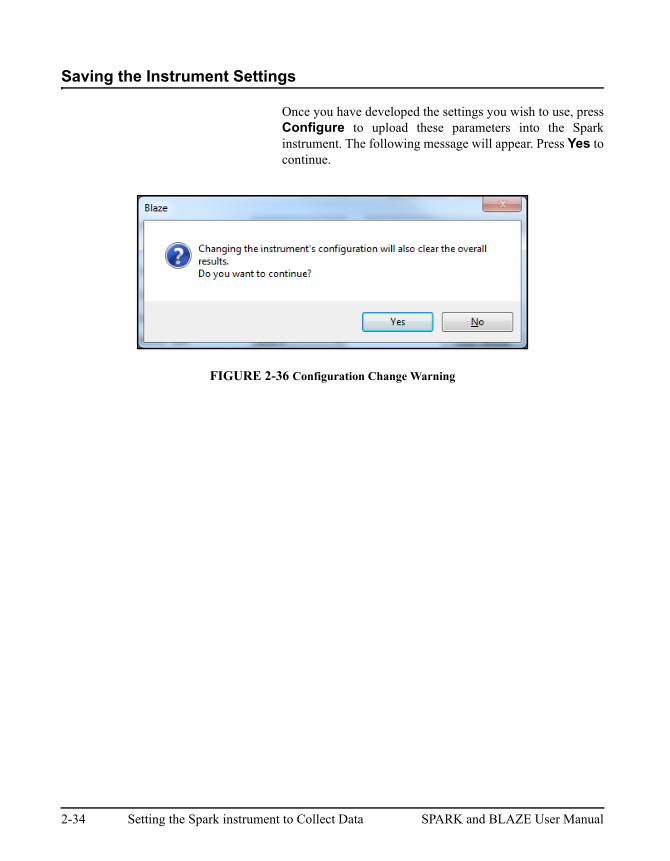
Once you have developed the settings you wish to use, pressConfigure to upload these parameters into the Sparkinstrument. The following message will appear. Press Yes tocontinue.
FIGURE 2-36 Configuration Change Warning
2-34 Setting the Spark instrument to Collect Data SPARK and BLAZE User Manual
Setting the Auto-Timer
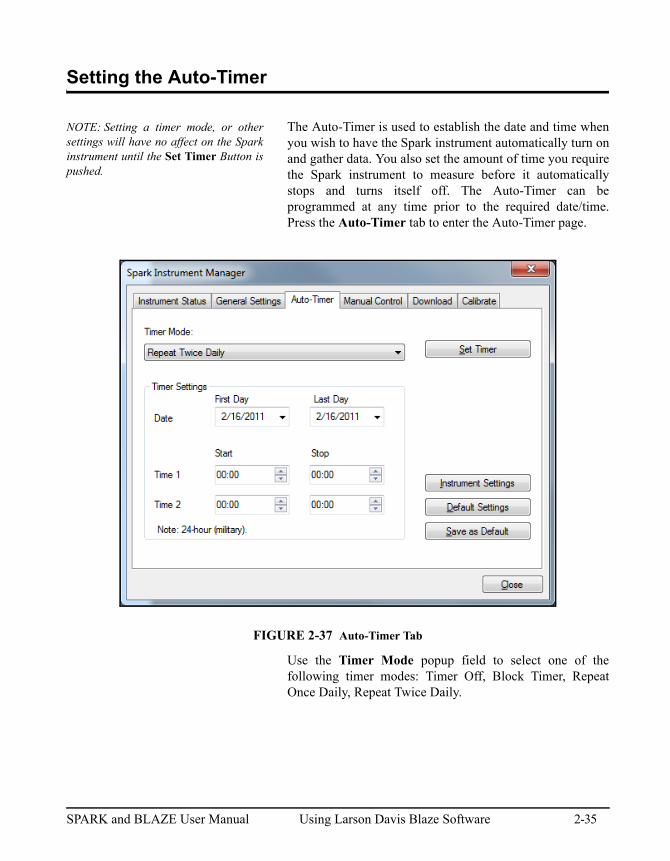
NOTE: Setting a timer mode, or othersettings will have no affect on the Sparkinstrument until the Set Timer Button ispushed.
The Auto-Timer is used to establish the date and time whenyou wish to have the Spark instrument automatically turn onand gather data. You also set the amount of time you requirethe Spark instrument to measure before it automaticallystops and turns itself off. The Auto-Timer can beprogrammed at any time prior to the required date/time.Press the Auto-Timer tab to enter the Auto-Timer page.
FIGURE 2-37 Auto-Timer Tab
Use the Timer Mode popup field to select one of thefollowing timer modes: Timer Off, Block Timer, RepeatOnce Daily, Repeat Twice Daily.
SPARK and BLAZE User Manual Using Larson Davis Blaze Software 2-35
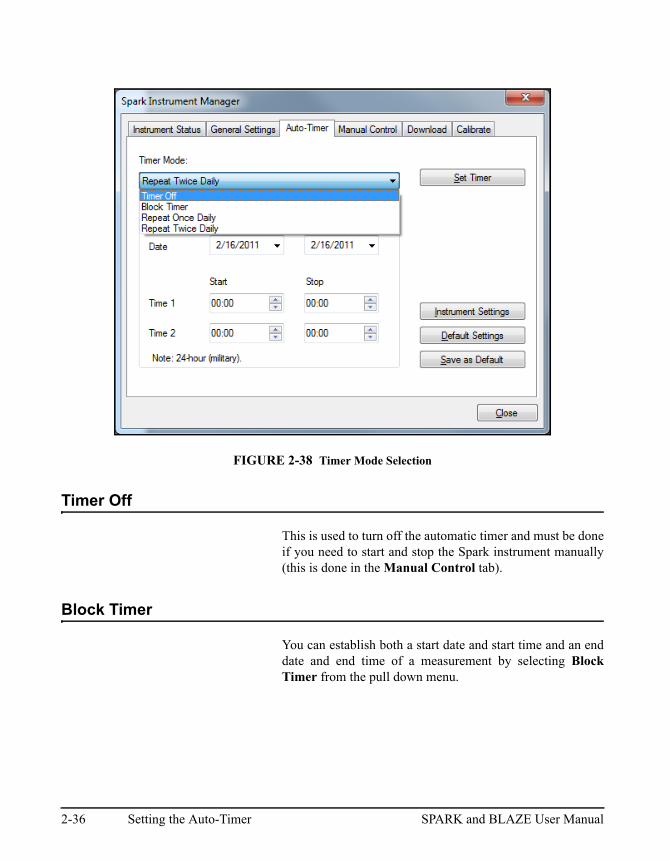
FIGURE 2-38 Timer Mode Selection
Timer Off
This is used to turn off the automatic timer and must be doneif you need to start and stop the Spark instrument manually(this is done in the Manual Control tab).
Block Timer
You can establish both a start date and start time and an enddate and end time of a measurement by selecting BlockTimer from the pull down menu.
2-36 Setting the Auto-Timer SPARK and BLAZE User Manual
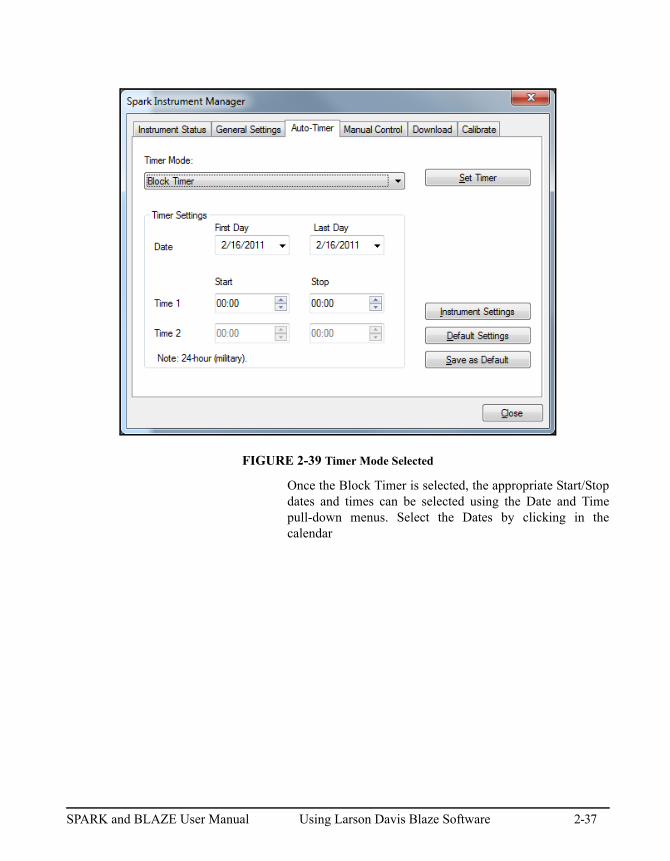
FIGURE 2-39 Timer Mode Selected
Once the Block Timer is selected, the appropriate Start/Stopdates and times can be selected using the Date and Timepull-down menus. Select the Dates by clicking in thecalendar
SPARK and BLAZE User Manual Using Larson Davis Blaze Software 2-37
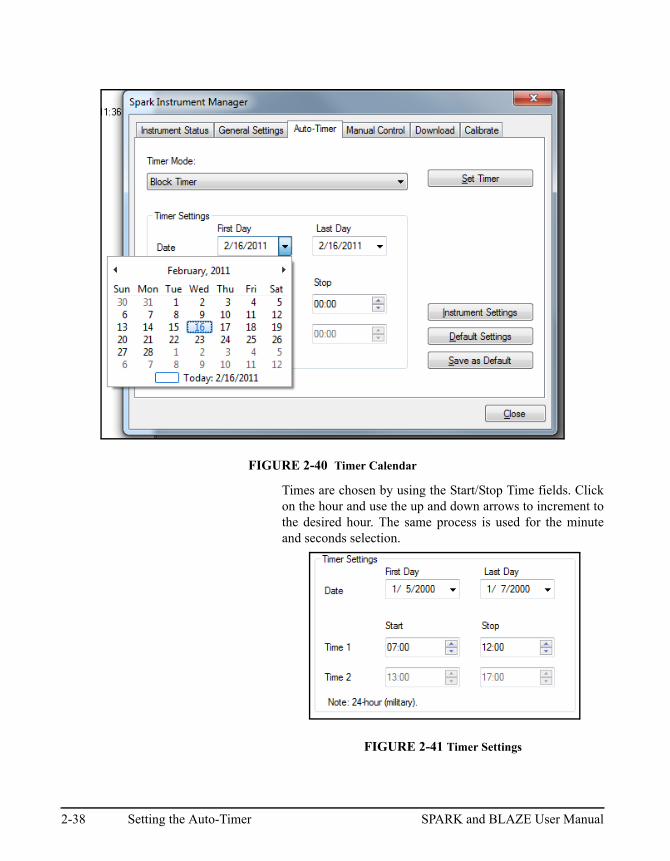
FIGURE 2-40 Timer Calendar
Times are chosen by using the Start/Stop Time fields. Clickon the hour and use the up and down arrows to increment tothe desired hour. The same process is used for the minuteand seconds selection.
FIGURE 2-41 Timer Settings
2-38 Setting the Auto-Timer SPARK and BLAZE User Manual
The Spark instrument will run continuously from the StartDate/Time to the Stop Date/Time. Setting the Repeat OnceDaily and Repeat Twice Daily Auto-Timers are handled inthe same way as the Block Timer.
Repeat Once Daily
Repeat Once Daily mode allows you to select a Start Time/Date and a Stop Time/Date that spans several days. Thismode is selected if you wish to turn on and off the Sparkinstrument automatically for a daily work shift such as 8:00A.M. to 5:00 P.M. every day between the start and stop datethe meter will turn on and off for this work shift.
While you can set the Spark instrument’s timer mode for anextended period of time, be certain there is enough batterylife to complete the test. You may need to change batteries inthe Spark instrument between shifts.
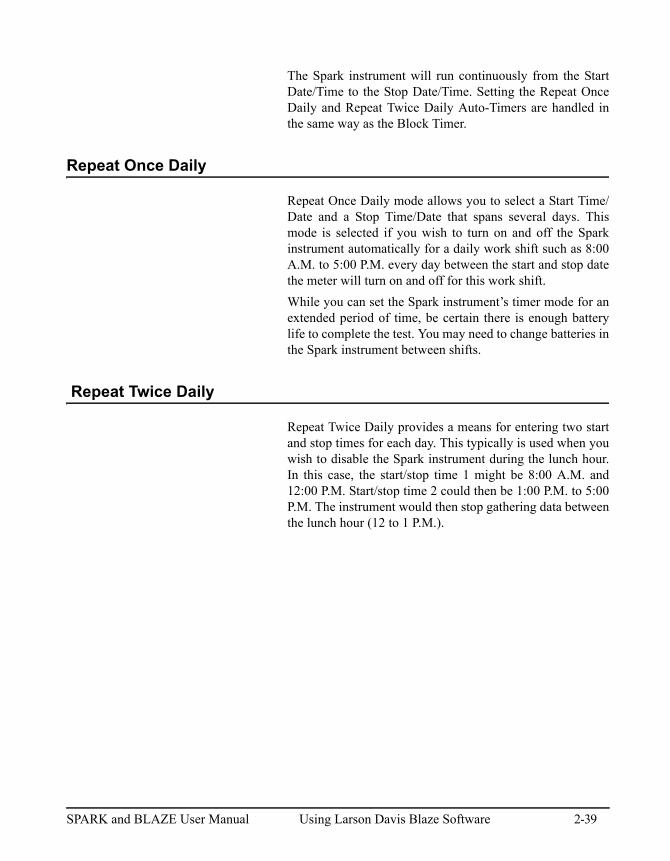
Repeat Twice Daily
Repeat Twice Daily provides a means for entering two startand stop times for each day. This typically is used when youwish to disable the Spark instrument during the lunch hour.In this case, the start/stop time 1 might be 8:00 A.M. and12:00 P.M. Start/stop time 2 could then be 1:00 P.M. to 5:00P.M. The instrument would then stop gathering data betweenthe lunch hour (12 to 1 P.M.).
SPARK and BLAZE User Manual Using Larson Davis Blaze Software 2-39
FIGURE 2-42 Repeat Twice Daily
Set Timer
The Set Timer button enables the connected Sparkinstrument’s automatic timer. This button sends all thesettings found in the Automatic Timer window to theconnected Spark instrument including the timer start andstop dates/times, and turns the timer on. At this point, youmay exit the Blaze software as the Spark instrument will beready to collect data.
Instrument Settings
Pressing Instrument Settings interrogates the connectedSpark instrument and downloads its Timer settings into theAuto-Timer page.
2-40 Setting the Auto-Timer SPARK and BLAZE User Manual
Default Settings
Default Settings recalls the previously saved Timer defaultsand brings them into the Auto-Timer page.
Save as Default
If you would like to establish these Auto-Timer settings tobe the “default” values, press Save as Default. These willnow be the Timer values shown when the "Default Settings"button is pressed.
SPARK and BLAZE User Manual Using Larson Davis Blaze Software 2-41
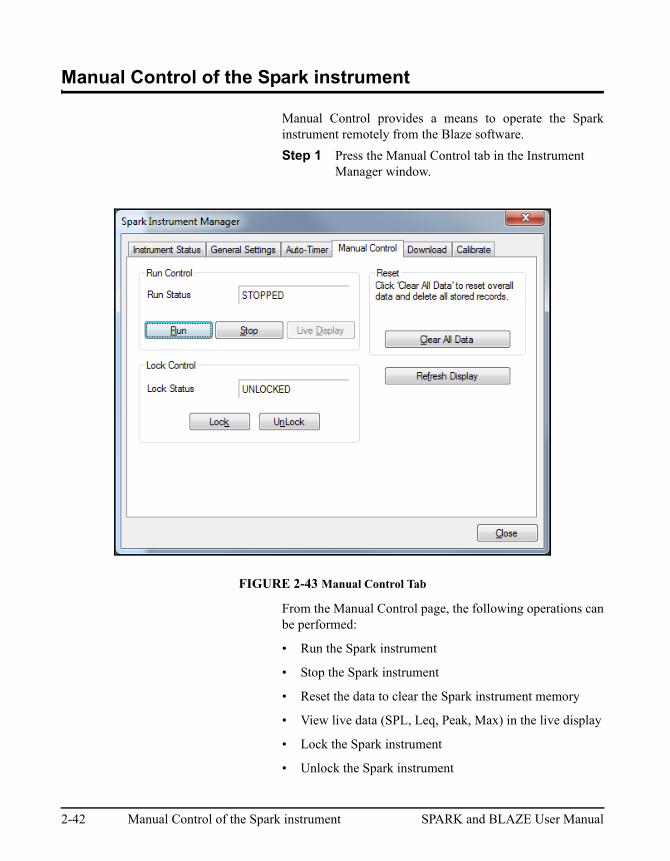
Manual Control of the Spark instrument
Manual Control provides a means to operate the Sparkinstrument remotely from the Blaze software.
Step 1 Press the Manual Control tab in the Instrument Manager window.
FIGURE 2-43 Manual Control Tab
From the Manual Control page, the following operations canbe performed:
• Run the Spark instrument
• Stop the Spark instrument
• Reset the data to clear the Spark instrument memory
• View live data (SPL, Leq, Peak, Max) in the live display
• Lock the Spark instrument
• Unlock the Spark instrument
2-42 Manual Control of the Spark instrument SPARK and BLAZE User Manual
• Refresh the Manual Control screen
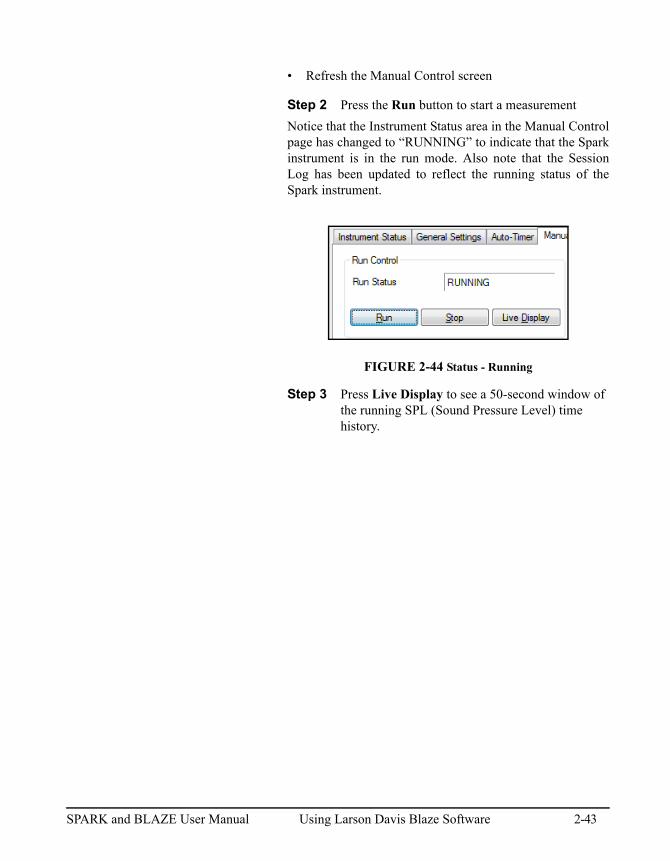
Step 2 Press the Run button to start a measurement
Notice that the Instrument Status area in the Manual Controlpage has changed to “RUNNING” to indicate that the Sparkinstrument is in the run mode. Also note that the SessionLog has been updated to reflect the running status of theSpark instrument.
FIGURE 2-44 Status - Running
Step 3 Press Live Display to see a 50-second window of the running SPL (Sound Pressure Level) time history.
SPARK and BLAZE User Manual Using Larson Davis Blaze Software 2-43
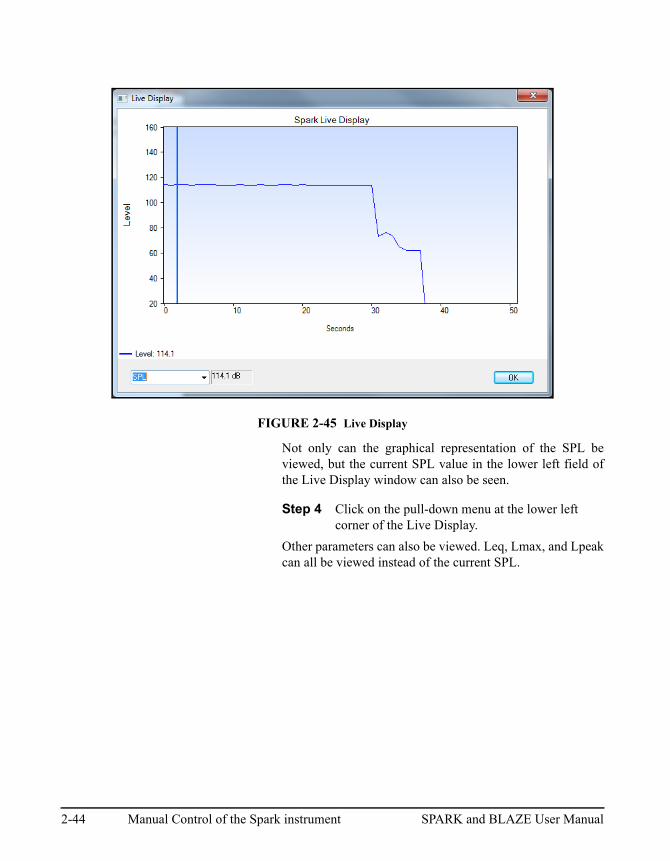
FIGURE 2-45 Live Display
Not only can the graphical representation of the SPL beviewed, but the current SPL value in the lower left field ofthe Live Display window can also be seen.
Step 4 Click on the pull-down menu at the lower left corner of the Live Display.
Other parameters can also be viewed. Leq, Lmax, and Lpeakcan all be viewed instead of the current SPL.
2-44 Manual Control of the Spark instrument SPARK and BLAZE User Manual
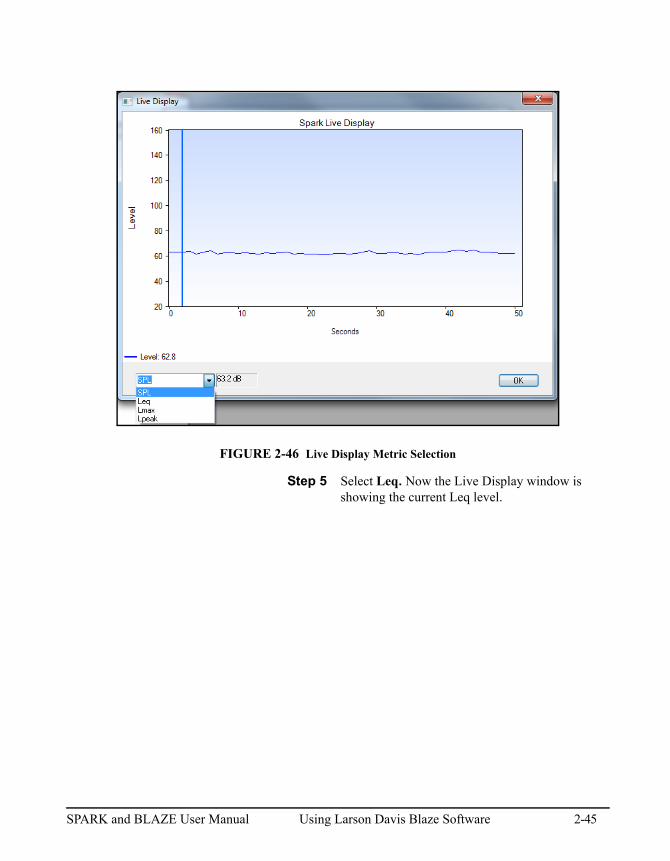
FIGURE 2-46 Live Display Metric Selection
Step 5 Select Leq. Now the Live Display window is showing the current Leq level.
SPARK and BLAZE User Manual Using Larson Davis Blaze Software 2-45
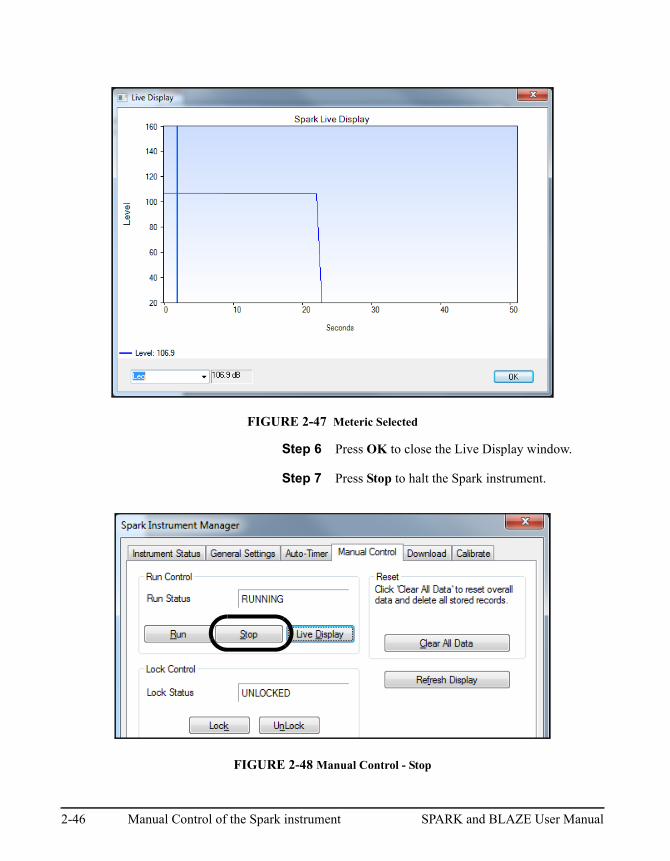
FIGURE 2-47 Meteric Selected
Step 6 Press OK to close the Live Display window.
Step 7 Press Stop to halt the Spark instrument.
FIGURE 2-48 Manual Control - Stop
2-46 Manual Control of the Spark instrument SPARK and BLAZE User Manual
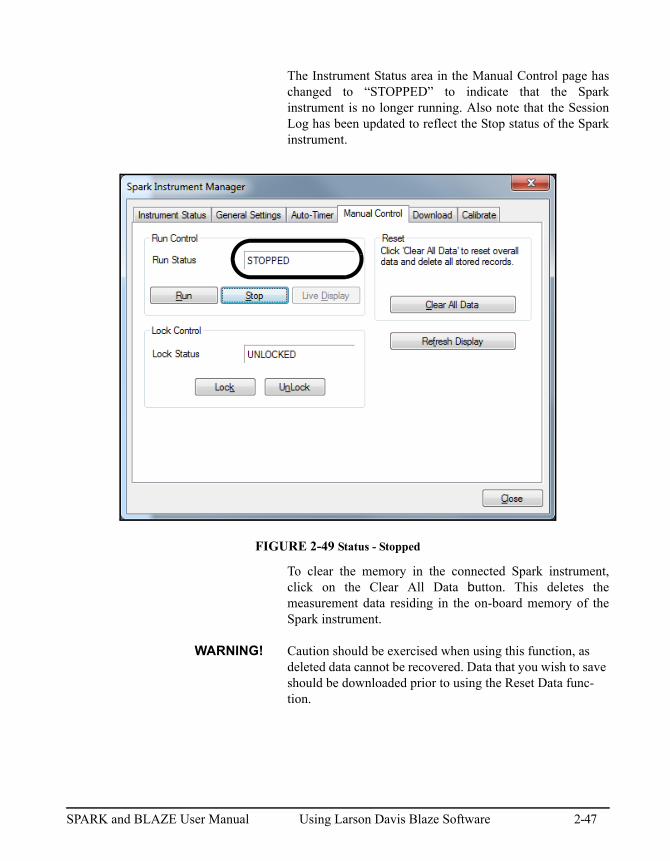
The Instrument Status area in the Manual Control page haschanged to “STOPPED” to indicate that the Sparkinstrument is no longer running. Also note that the SessionLog has been updated to reflect the Stop status of the Sparkinstrument.
FIGURE 2-49 Status - Stopped
To clear the memory in the connected Spark instrument,click on the Clear All Data button. This deletes themeasurement data residing in the on-board memory of theSpark instrument.
WARNING! Caution should be exercised when using this function, as deleted data cannot be recovered. Data that you wish to save should be downloaded prior to using the Reset Data func-tion.
SPARK and BLAZE User Manual Using Larson Davis Blaze Software 2-47
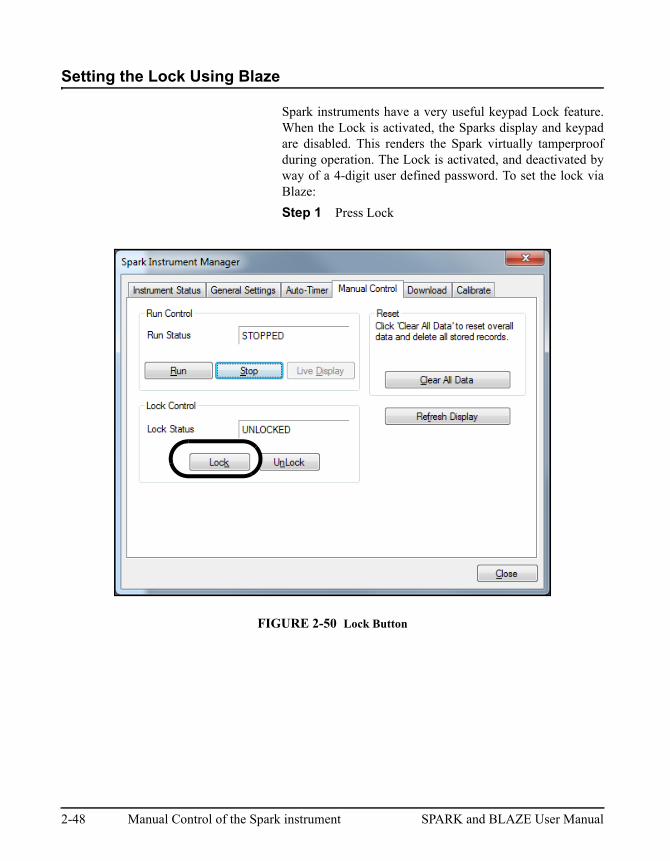
Setting the Lock Using Blaze
Spark instruments have a very useful keypad Lock feature.When the Lock is activated, the Sparks display and keypadare disabled. This renders the Spark virtually tamperproofduring operation. The Lock is activated, and deactivated byway of a 4-digit user defined password. To set the lock viaBlaze:
Step 1 Press Lock
FIGURE 2-50 Lock Button
2-48 Manual Control of the Spark instrument SPARK and BLAZE User Manual
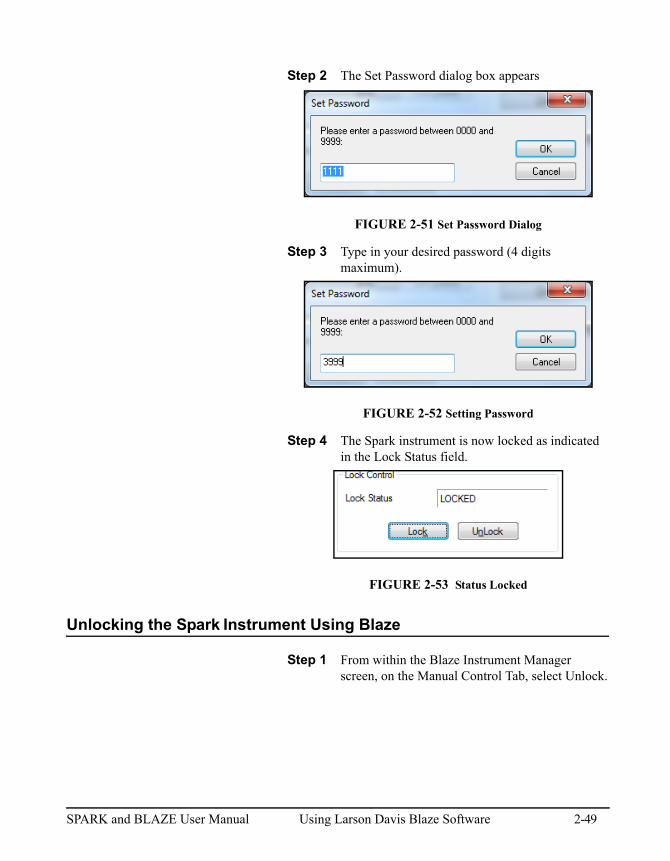
Step 2 The Set Password dialog box appears
FIGURE 2-51 Set Password Dialog
Step 3 Type in your desired password (4 digits maximum).
FIGURE 2-52 Setting Password
Step 4 The Spark instrument is now locked as indicated in the Lock Status field.
FIGURE 2-53 Status Locked
Unlocking the SparkInstrument Using Blaze
Step 1 From within the Blaze Instrument Manager screen, on the Manual Control Tab, select Unlock.
SPARK and BLAZE User Manual Using Larson Davis Blaze Software 2-49
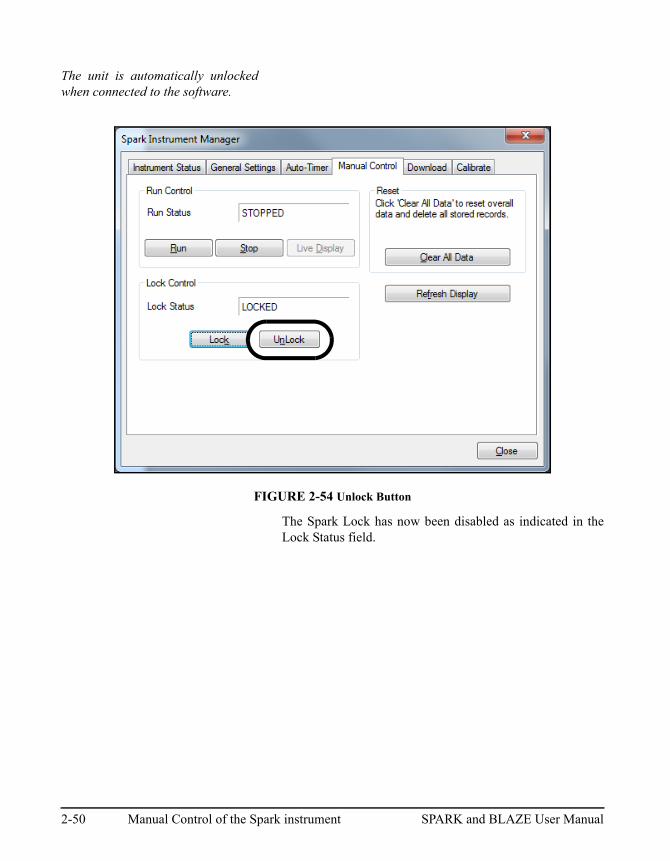
The unit is automatically unlockedwhen connected to the software.
FIGURE 2-54 Unlock Button
The Spark Lock has now been disabled as indicated in theLock Status field.
2-50 Manual Control of the Spark instrument SPARK and BLAZE User Manual
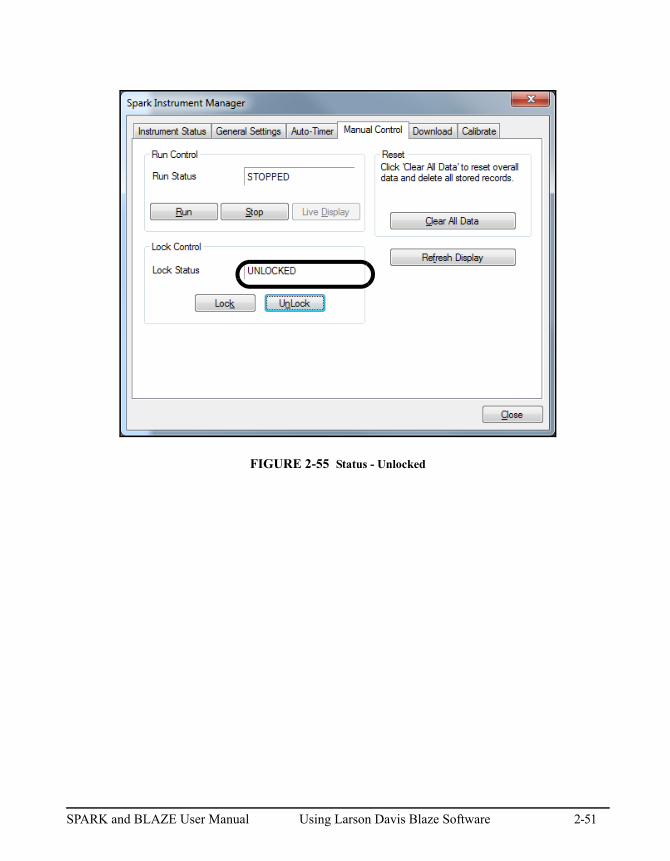
FIGURE 2-55 Status - Unlocked
SPARK and BLAZE User Manual Using Larson Davis Blaze Software 2-51
Downloading Data from the Sparkinstrument to the PC
If download fails, see“Troubleshooting DownloadProblems” on page -2-122
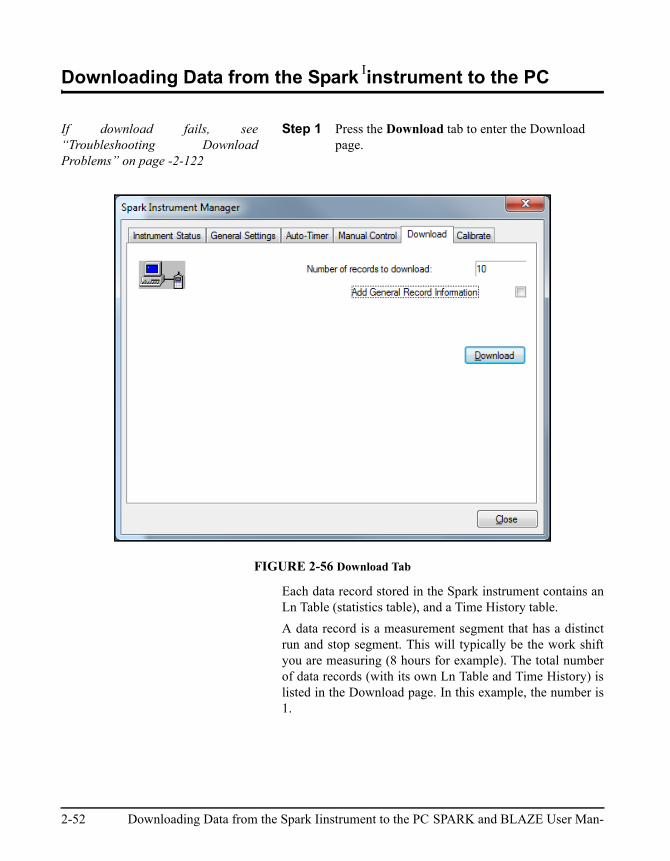
Step 1 Press the Download tab to enter the Download page.
FIGURE 2-56 Download Tab
Each data record stored in the Spark instrument contains anLn Table (statistics table), and a Time History table.
A data record is a measurement segment that has a distinctrun and stop segment. This will typically be the work shiftyou are measuring (8 hours for example). The total numberof data records (with its own Ln Table and Time History) islisted in the Download page. In this example, the number is1.
2-52 Downloading Data from the Spark Iinstrument to the PC SPARK and BLAZE User Man-
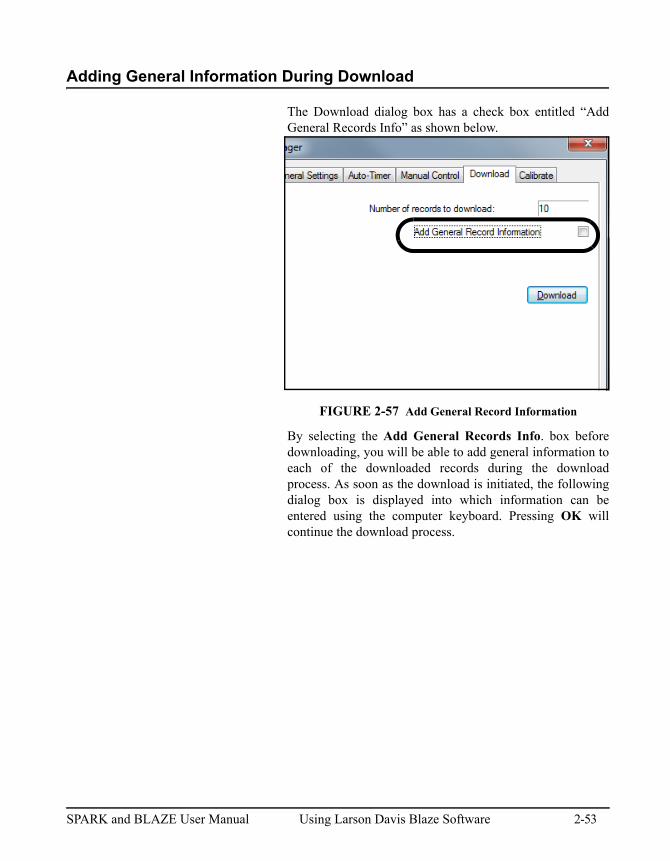
Adding General Information During Download
The Download dialog box has a check box entitled “AddGeneral Records Info” as shown below.
FIGURE 2-57 Add General Record Information
By selecting the Add General Records Info. box beforedownloading, you will be able to add general information toeach of the downloaded records during the downloadprocess. As soon as the download is initiated, the followingdialog box is displayed into which information can beentered using the computer keyboard. Pressing OK willcontinue the download process.
SPARK and BLAZE User Manual Using Larson Davis Blaze Software 2-53
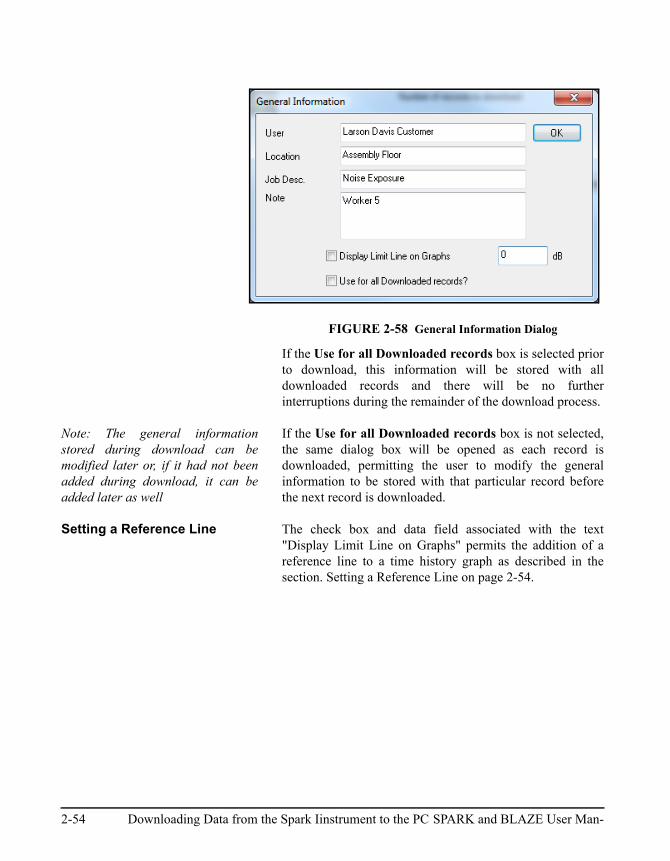
FIGURE 2-58 General Information Dialog
If the Use for all Downloaded records box is selected priorto download, this information will be stored with alldownloaded records and there will be no furtherinterruptions during the remainder of the download process.
Note: The general informationstored during download can bemodified later or, if it had not beenadded during download, it can beadded later as well
If the Use for all Downloaded records box is not selected,the same dialog box will be opened as each record isdownloaded, permitting the user to modify the generalinformation to be stored with that particular record beforethe next record is downloaded.
Setting a Reference Line The check box and data field associated with the text"Display Limit Line on Graphs" permits the addition of areference line to a time history graph as described in thesection. Setting a Reference Line on page 2-54.
2-54 Downloading Data from the Spark Iinstrument to the PC SPARK and BLAZE User Man-
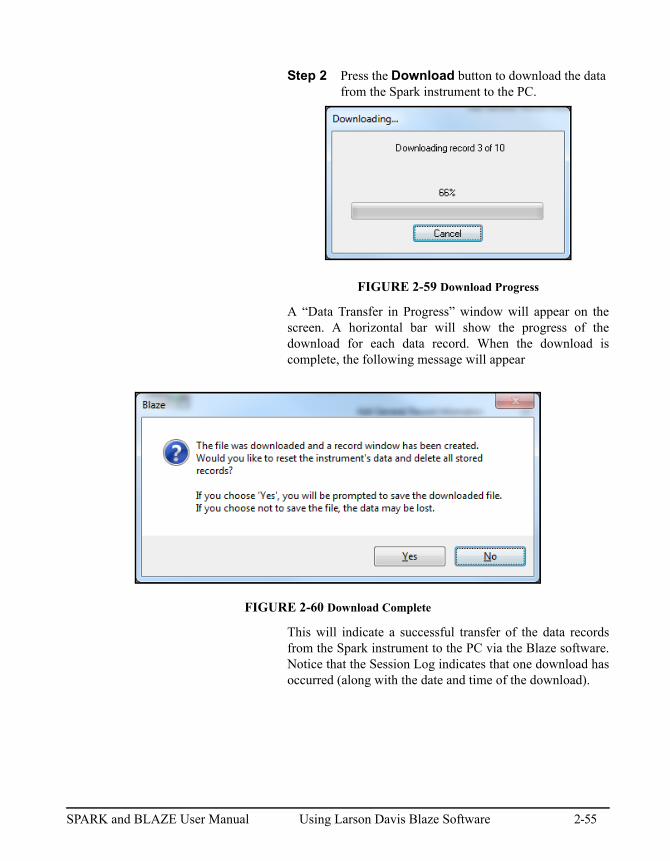
Step 2 Press the Download button to download the data from the Spark instrument to the PC.
FIGURE 2-59 Download Progress
A “Data Transfer in Progress” window will appear on thescreen. A horizontal bar will show the progress of thedownload for each data record. When the download iscomplete, the following message will appear
FIGURE 2-60 Download Complete
This will indicate a successful transfer of the data recordsfrom the Spark instrument to the PC via the Blaze software.Notice that the Session Log indicates that one download hasoccurred (along with the date and time of the download).
SPARK and BLAZE User Manual Using Larson Davis Blaze Software 2-55
If the Spark instrument is runningwhen Download is pressed, the unitwill stop running and the downloadwill occur.
You can view the summaryregardless of whether or not memoryhas been cleared.
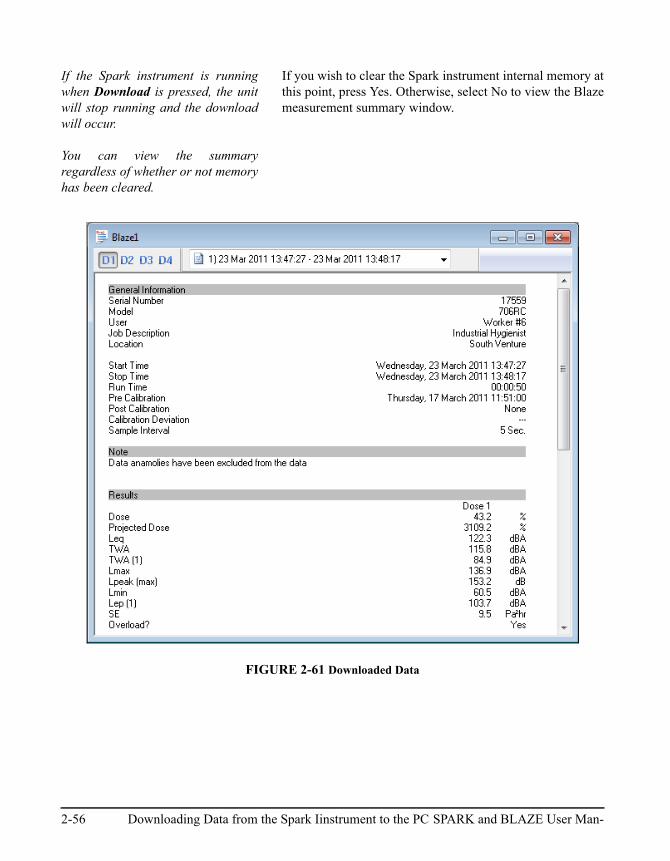
If you wish to clear the Spark instrument internal memory atthis point, press Yes. Otherwise, select No to view the Blazemeasurement summary window.
FIGURE 2-61 Downloaded Data
2-56 Downloading Data from the Spark Iinstrument to the PC SPARK and BLAZE User Man-
Measurement Summary
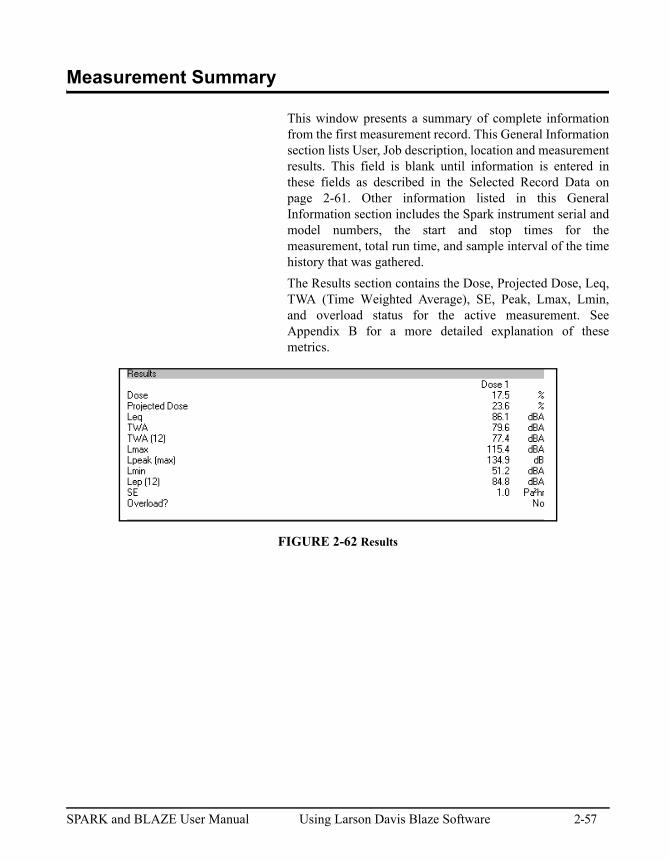
This window presents a summary of complete informationfrom the first measurement record. This General Informationsection lists User, Job description, location and measurementresults. This field is blank until information is entered inthese fields as described in the Selected Record Data onpage 2-61. Other information listed in this GeneralInformation section includes the Spark instrument serial andmodel numbers, the start and stop times for themeasurement, total run time, and sample interval of the timehistory that was gathered.
The Results section contains the Dose, Projected Dose, Leq,TWA (Time Weighted Average), SE, Peak, Lmax, Lmin,and overload status for the active measurement. SeeAppendix B for a more detailed explanation of thesemetrics.
FIGURE 2-62 Results
SPARK and BLAZE User Manual Using Larson Davis Blaze Software 2-57
Selecting Display of Dose Data
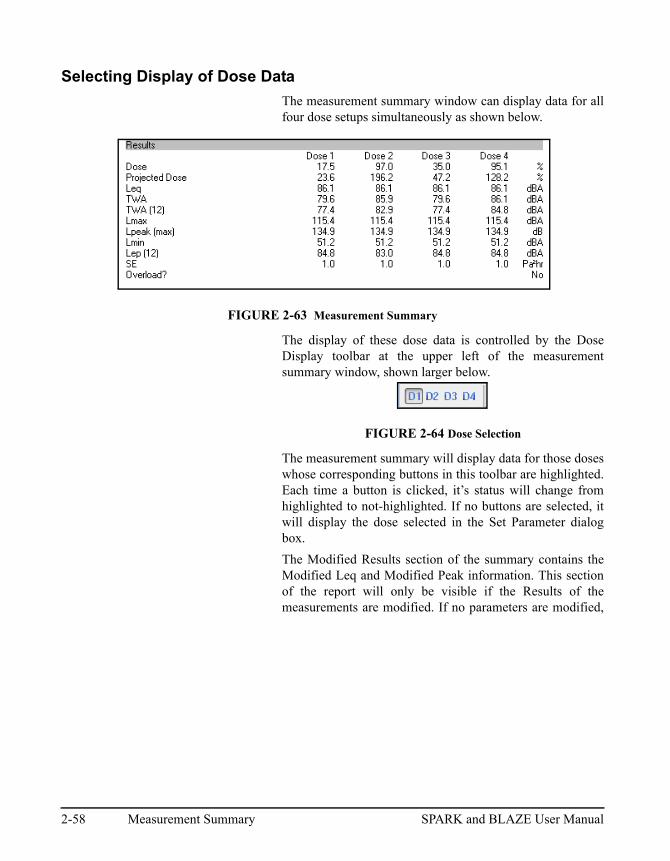
The measurement summary window can display data for allfour dose setups simultaneously as shown below.
FIGURE 2-63 Measurement Summary
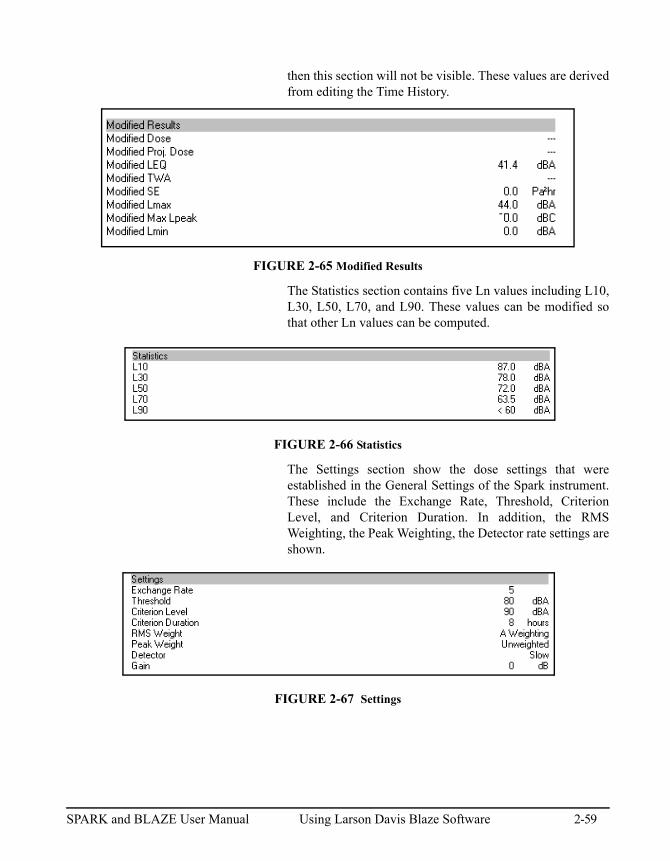
The display of these dose data is controlled by the DoseDisplay toolbar at the upper left of the measurementsummary window, shown larger below.
FIGURE 2-64 Dose Selection
The measurement summary will display data for those doseswhose corresponding buttons in this toolbar are highlighted.Each time a button is clicked, it’s status will change fromhighlighted to not-highlighted. If no buttons are selected, itwill display the dose selected in the Set Parameter dialogbox.
The Modified Results section of the summary contains theModified Leq and Modified Peak information. This sectionof the report will only be visible if the Results of themeasurements are modified. If no parameters are modified,
2-58 Measurement Summary SPARK and BLAZE User Manual
then this section will not be visible. These values are derivedfrom editing the Time History.
FIGURE 2-65 Modified Results
The Statistics section contains five Ln values including L10,L30, L50, L70, and L90. These values can be modified sothat other Ln values can be computed.
FIGURE 2-66 Statistics
The Settings section show the dose settings that wereestablished in the General Settings of the Spark instrument.These include the Exchange Rate, Threshold, CriterionLevel, and Criterion Duration. In addition, the RMSWeighting, the Peak Weighting, the Detector rate settings areshown.
FIGURE 2-67 Settings
SPARK and BLAZE User Manual Using Larson Davis Blaze Software 2-59
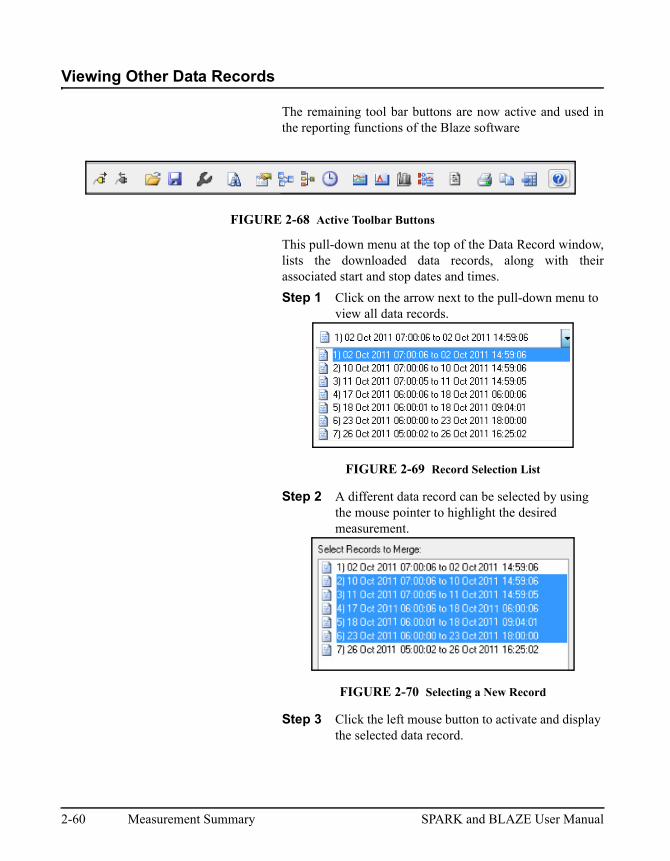
Viewing Other Data Records
The remaining tool bar buttons are now active and used inthe reporting functions of the Blaze software
FIGURE 2-68 Active Toolbar Buttons
This pull-down menu at the top of the Data Record window,lists the downloaded data records, along with theirassociated start and stop dates and times.
Step 1 Click on the arrow next to the pull-down menu to view all data records.
FIGURE 2-69 Record Selection List
Step 2 A different data record can be selected by using the mouse pointer to highlight the desired measurement.
FIGURE 2-70 Selecting a New Record
Step 3 Click the left mouse button to activate and display the selected data record.
2-60 Measurement Summary SPARK and BLAZE User Manual
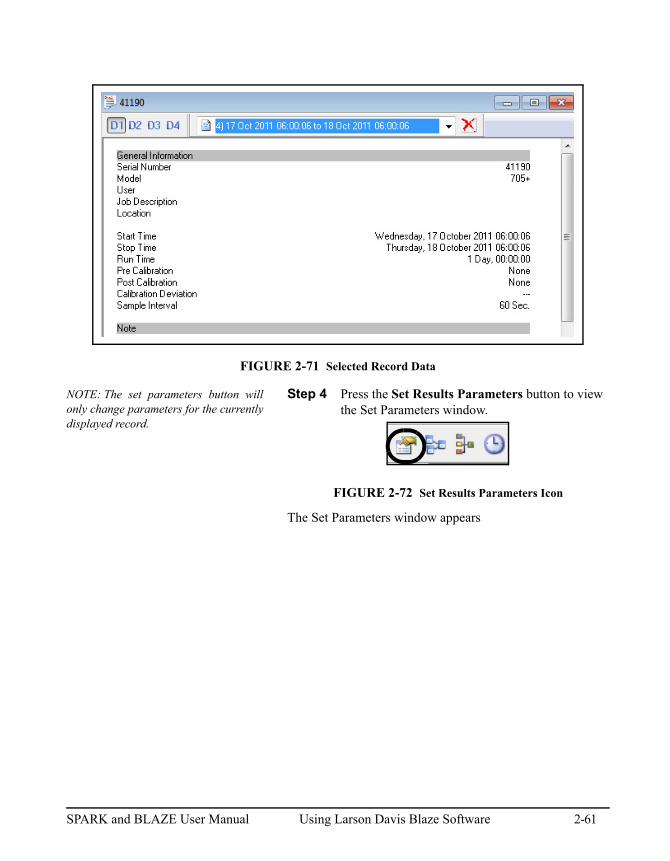
FIGURE 2-71 Selected Record Data
NOTE: The set parameters button willonly change parameters for the currentlydisplayed record.
Step 4 Press the Set Results Parameters button to view the Set Parameters window.
FIGURE 2-72 Set Results Parameters Icon
The Set Parameters window appears
SPARK and BLAZE User Manual Using Larson Davis Blaze Software 2-61
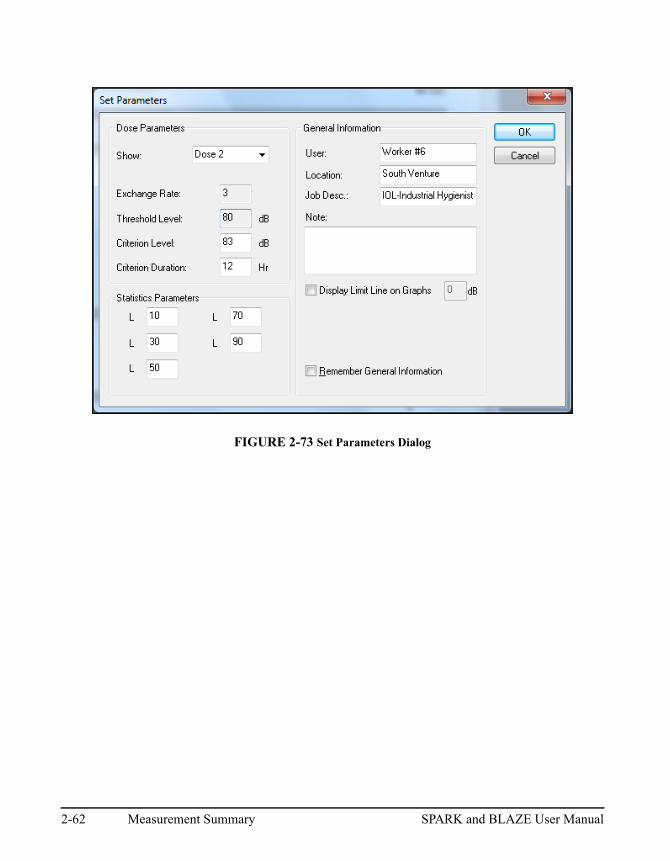
FIGURE 2-73 Set Parameters Dialog
2-62 Measurement Summary SPARK and BLAZE User Manual
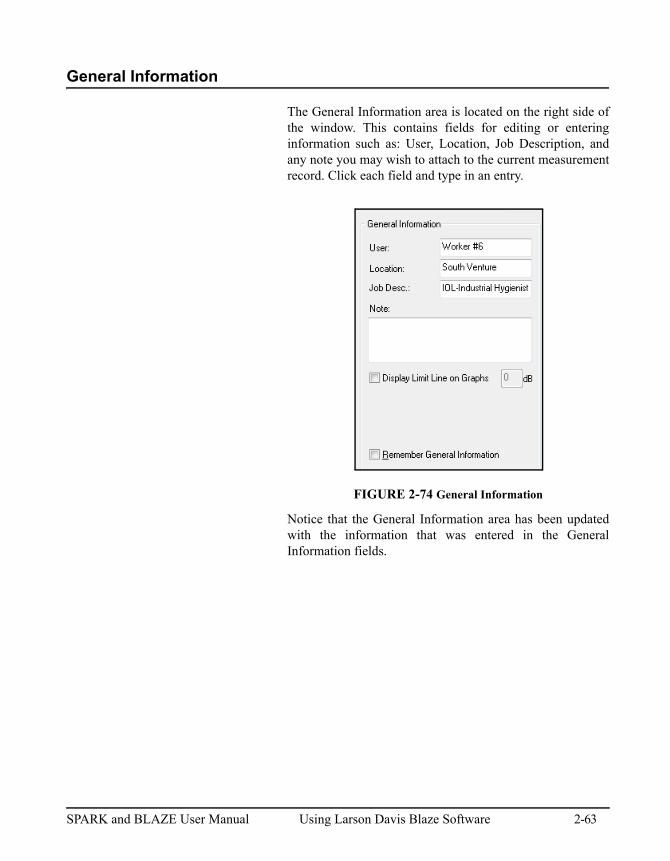
General Information
The General Information area is located on the right side ofthe window. This contains fields for editing or enteringinformation such as: User, Location, Job Description, andany note you may wish to attach to the current measurementrecord. Click each field and type in an entry.
FIGURE 2-74 General Information
Notice that the General Information area has been updatedwith the information that was entered in the GeneralInformation fields.
SPARK and BLAZE User Manual Using Larson Davis Blaze Software 2-63
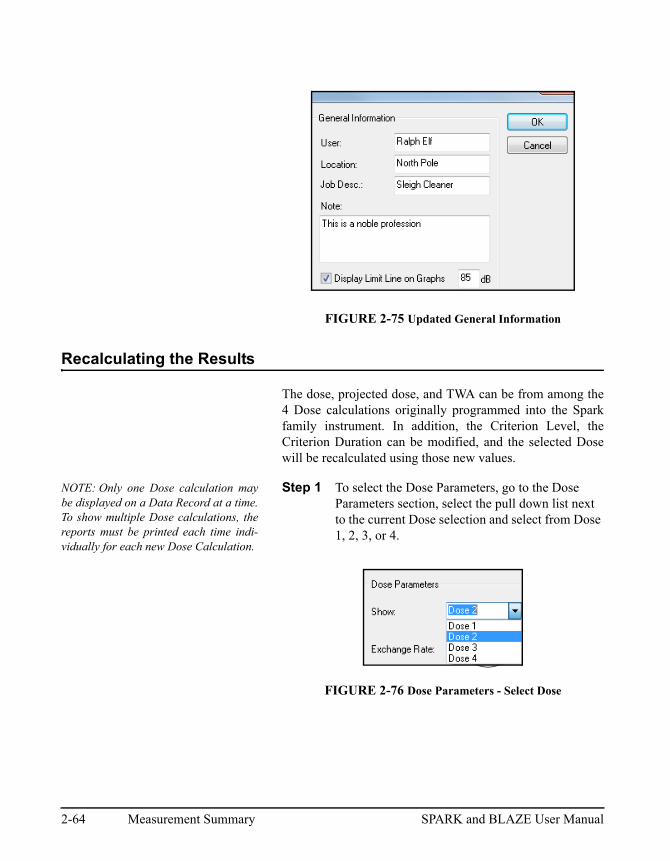
FIGURE 2-75 Updated General Information
Recalculating the Results
The dose, projected dose, and TWA can be from among the4 Dose calculations originally programmed into the Sparkfamily instrument. In addition, the Criterion Level, theCriterion Duration can be modified, and the selected Dosewill be recalculated using those new values.
NOTE: Only one Dose calculation maybe displayed on a Data Record at a time.To show multiple Dose calculations, thereports must be printed each time indi-vidually for each new Dose Calculation.
Step 1 To select the Dose Parameters, go to the Dose Parameters section, select the pull down list next to the current Dose selection and select from Dose 1, 2, 3, or 4.
FIGURE 2-76 Dose Parameters - Select Dose
2-64 Measurement Summary SPARK and BLAZE User Manual
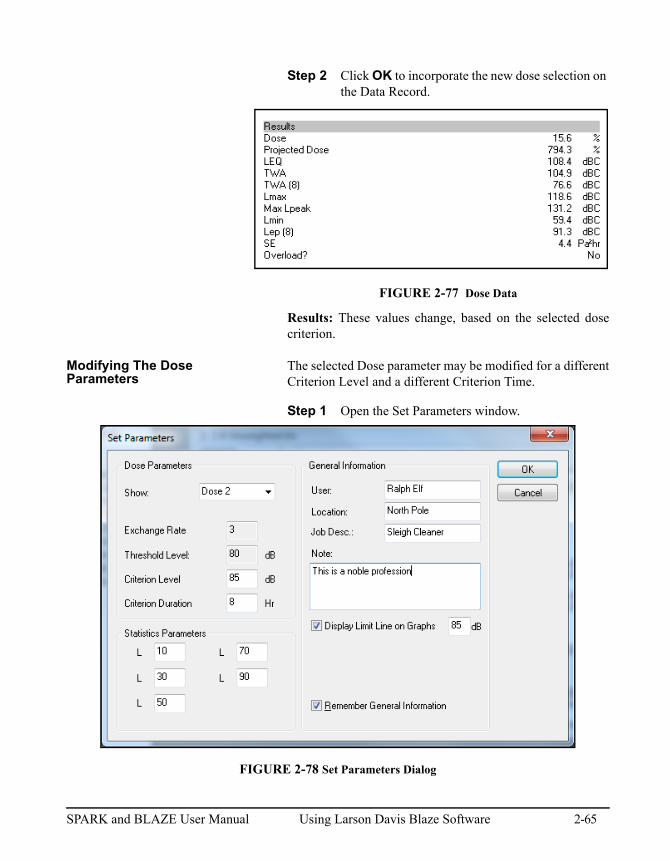
Step 2 Click OK to incorporate the new dose selection on the Data Record.
FIGURE 2-77 Dose Data
Results: These values change, based on the selected dosecriterion.
Modifying The Dose Parameters
The selected Dose parameter may be modified for a differentCriterion Level and a different Criterion Time.
Step 1 Open the Set Parameters window.
FIGURE 2-78 Set Parameters Dialog
SPARK and BLAZE User Manual Using Larson Davis Blaze Software 2-65
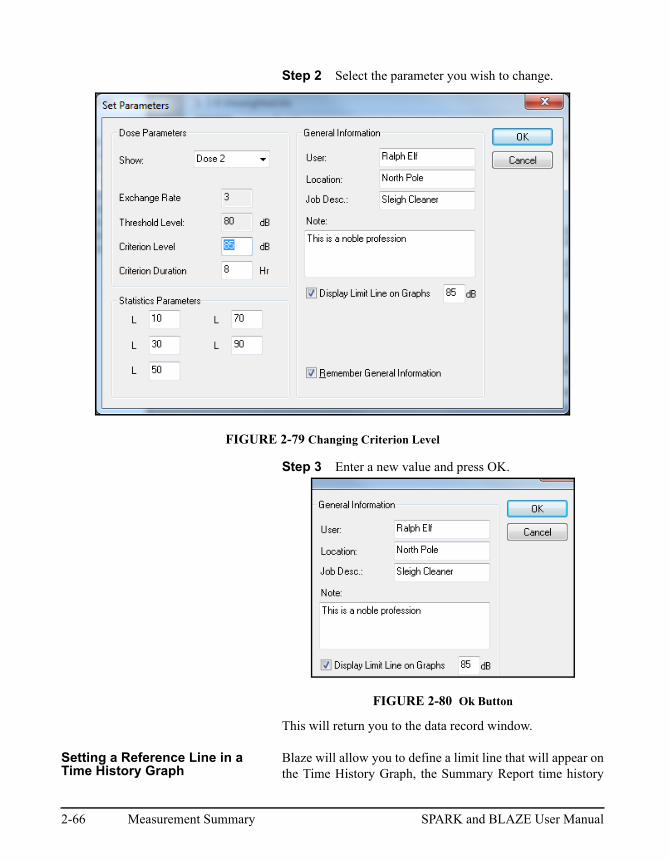
Step 2 Select the parameter you wish to change.
FIGURE 2-79 Changing Criterion Level
Step 3 Enter a new value and press OK.
FIGURE 2-80 Ok Button
This will return you to the data record window.
Setting a Reference Line in a Time History Graph
Blaze will allow you to define a limit line that will appear onthe Time History Graph, the Summary Report time history
2-66 Measurement Summary SPARK and BLAZE User Manual
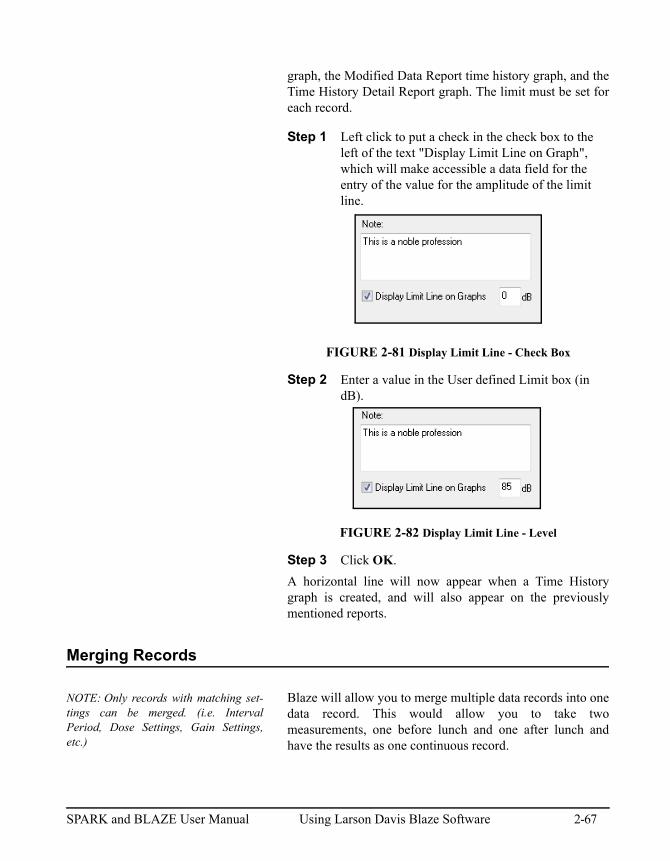
graph, the Modified Data Report time history graph, and theTime History Detail Report graph. The limit must be set foreach record.
Step 1 Left click to put a check in the check box to the left of the text "Display Limit Line on Graph", which will make accessible a data field for the entry of the value for the amplitude of the limit line.
FIGURE 2-81 Display Limit Line - Check Box
Step 2 Enter a value in the User defined Limit box (in dB).
FIGURE 2-82 Display Limit Line - Level
Step 3 Click OK.
A horizontal line will now appear when a Time Historygraph is created, and will also appear on the previouslymentioned reports.
Merging Records
NOTE: Only records with matching set-tings can be merged. (i.e. IntervalPeriod, Dose Settings, Gain Settings,etc.)
Blaze will allow you to merge multiple data records into onedata record. This would allow you to take twomeasurements, one before lunch and one after lunch andhave the results as one continuous record.
SPARK and BLAZE User Manual Using Larson Davis Blaze Software 2-67
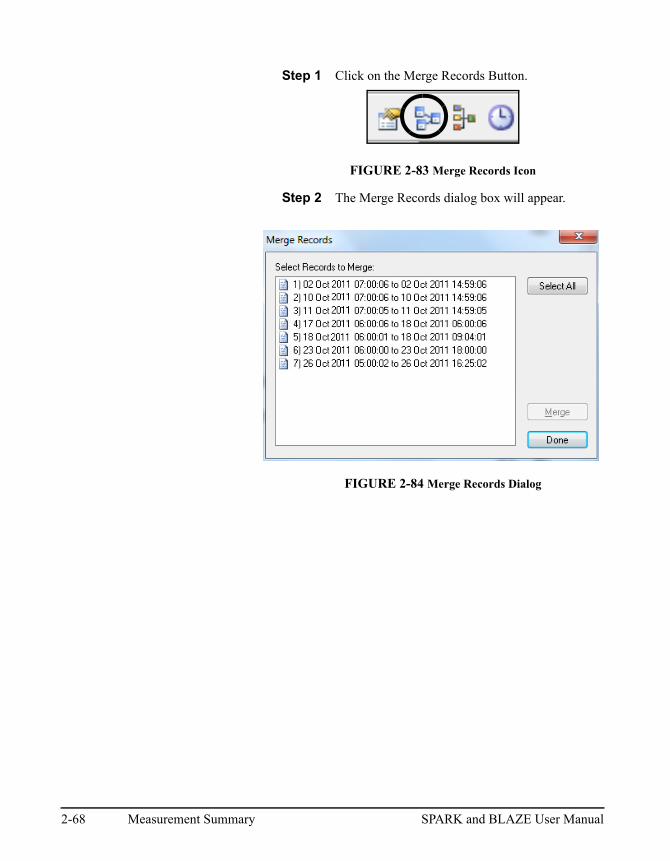
Step 1 Click on the Merge Records Button.
FIGURE 2-83 Merge Records Icon
Step 2 The Merge Records dialog box will appear.
FIGURE 2-84 Merge Records Dialog
2-68 Measurement Summary SPARK and BLAZE User Manual
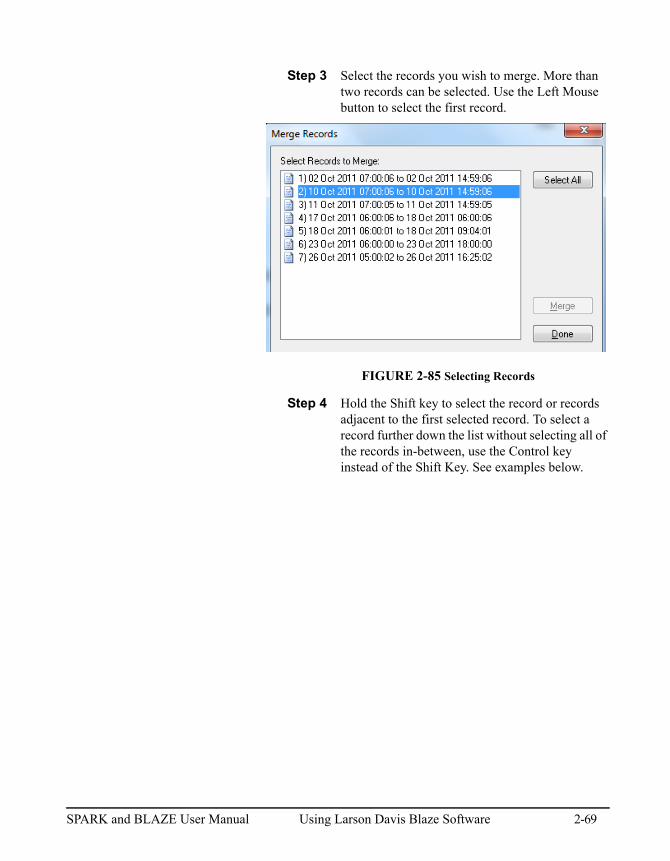
Step 3 Select the records you wish to merge. More than two records can be selected. Use the Left Mouse button to select the first record.
FIGURE 2-85 Selecting Records
Step 4 Hold the Shift key to select the record or records adjacent to the first selected record. To select a record further down the list without selecting all of the records in-between, use the Control key instead of the Shift Key. See examples below.
SPARK and BLAZE User Manual Using Larson Davis Blaze Software 2-69
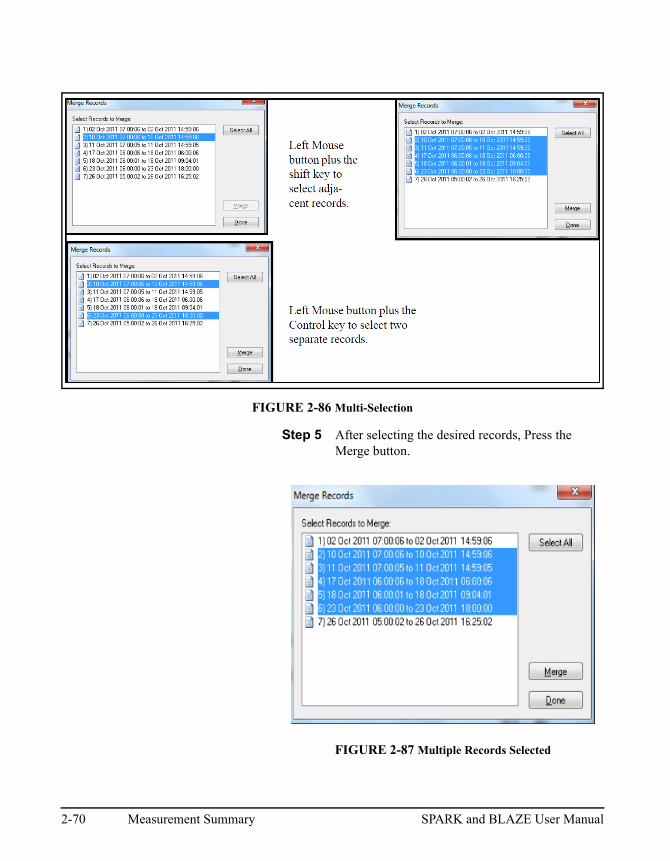
FIGURE 2-86 Multi-Selection
Step 5 After selecting the desired records, Press the Merge button.
FIGURE 2-87 Multiple Records Selected
2-70 Measurement Summary SPARK and BLAZE User Manual
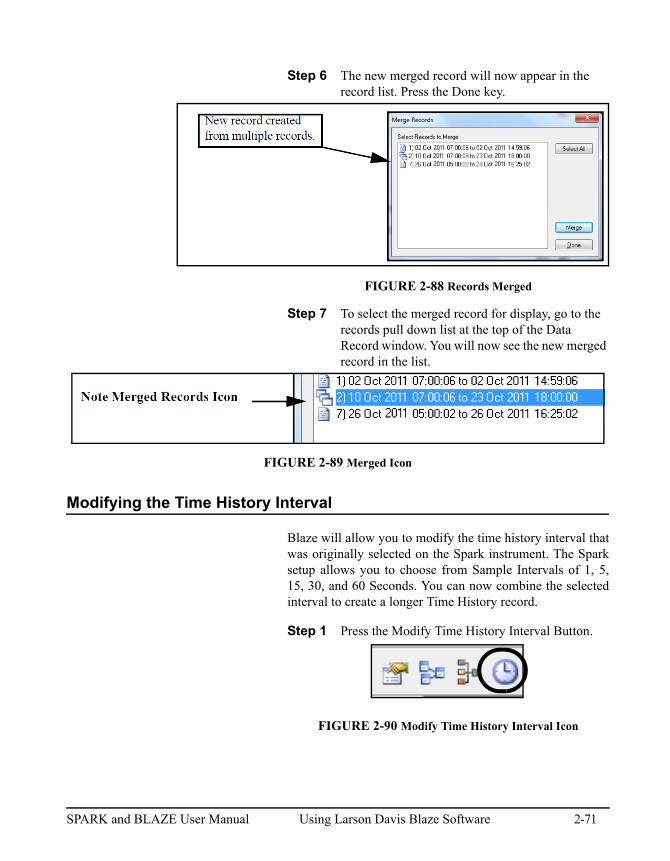
Step 6 The new merged record will now appear in the record list. Press the Done key.
FIGURE 2-88 Records Merged
Step 7 To select the merged record for display, go to the records pull down list at the top of the Data Record window. You will now see the new merged record in the list.
FIGURE 2-89 Merged Icon
Modifying the Time History Interval
Blaze will allow you to modify the time history interval thatwas originally selected on the Spark instrument. The Sparksetup allows you to choose from Sample Intervals of 1, 5,15, 30, and 60 Seconds. You can now combine the selectedinterval to create a longer Time History record.
Step 1 Press the Modify Time History Interval Button.
FIGURE 2-90 Modify Time History Interval Icon
SPARK and BLAZE User Manual Using Larson Davis Blaze Software 2-71
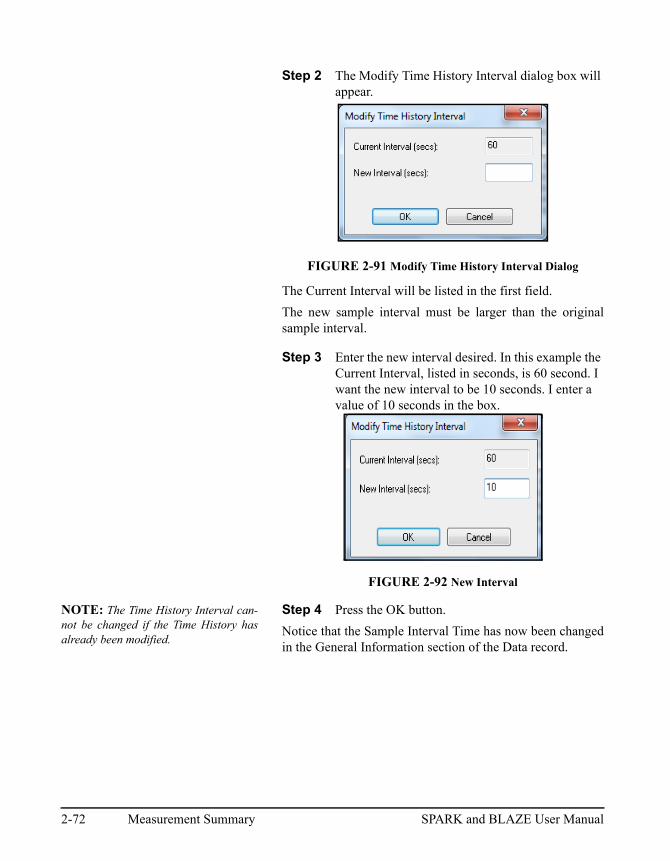
Step 2 The Modify Time History Interval dialog box will appear.
FIGURE 2-91 Modify Time History Interval Dialog
The Current Interval will be listed in the first field.
The new sample interval must be larger than the originalsample interval.
Step 3 Enter the new interval desired. In this example the Current Interval, listed in seconds, is 60 second. I want the new interval to be 10 seconds. I enter a value of 10 seconds in the box.
FIGURE 2-92 New Interval
NOTE: The Time History Interval can-not be changed if the Time History hasalready been modified.
Step 4 Press the OK button.
Notice that the Sample Interval Time has now been changedin the General Information section of the Data record.
2-72 Measurement Summary SPARK and BLAZE User Manual
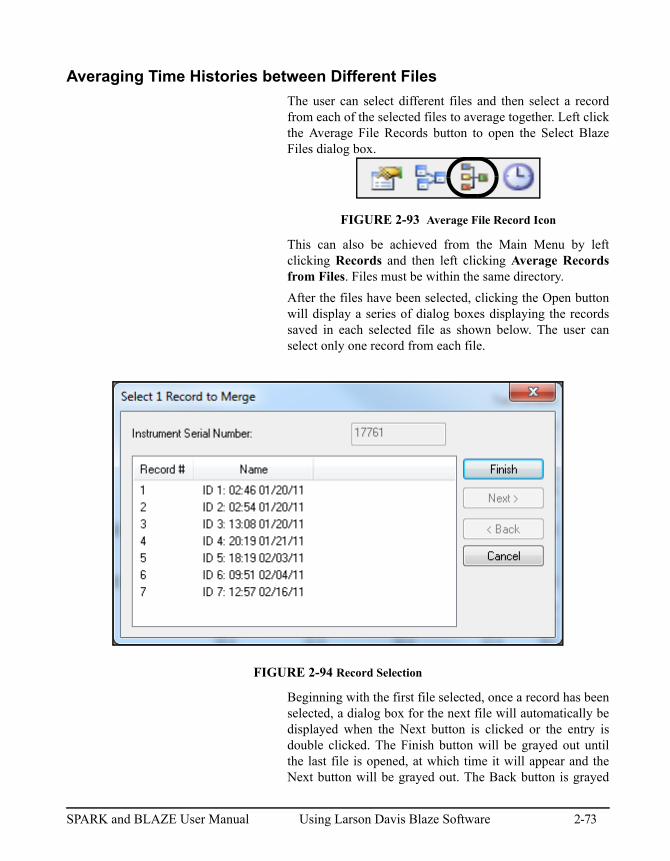
Averaging Time Histories between Different Files
The user can select different files and then select a recordfrom each of the selected files to average together. Left clickthe Average File Records button to open the Select BlazeFiles dialog box.
FIGURE 2-93 Average File Record Icon
This can also be achieved from the Main Menu by leftclicking Records and then left clicking Average Recordsfrom Files. Files must be within the same directory.
After the files have been selected, clicking the Open buttonwill display a series of dialog boxes displaying the recordssaved in each selected file as shown below. The user canselect only one record from each file.
FIGURE 2-94 Record Selection
Beginning with the first file selected, once a record has beenselected, a dialog box for the next file will automatically bedisplayed when the Next button is clicked or the entry isdouble clicked. The Finish button will be grayed out untilthe last file is opened, at which time it will appear and theNext button will be grayed out. The Back button is grayed
SPARK and BLAZE User Manual Using Larson Davis Blaze Software 2-73
out when the dialog box for the first file is open, but it willappear subsequently for the later files in case the user wishesto change the record selected for one of the files earlier inthe selection sequence. The serial number of the instrumentfrom which the file was downloaded will be displayed.
Each selected record must have the same sample interval,weighting, detector, gain, peak weighting, and the sameparameters for each dose. They must also have the samebeginning and ending times. There are two methods whichwill ensure that these last criteria are satisfied:
Method 1 Set the timers for all Spark units to start and end at the same time.
Method 2 Modify existing records by cropping the non-overlapping data from each desired record, save it in a new file and then perform the averaging of records from different files.
The averaged record will be an average of all the Leq andTWA values for the selected records for the time interval asdescribed above with the Lmin, Lmax and peak values, ifpresent, set appropriately). The new record can be saved in anew blaze (.blz) download file.
Time History Graph
Step 1 Click the Time History Graph button to view a time history of the current measurement record.
FIGURE 2-95 Time History Graph Icon
2-74 Time History Graph SPARK and BLAZE User Manual
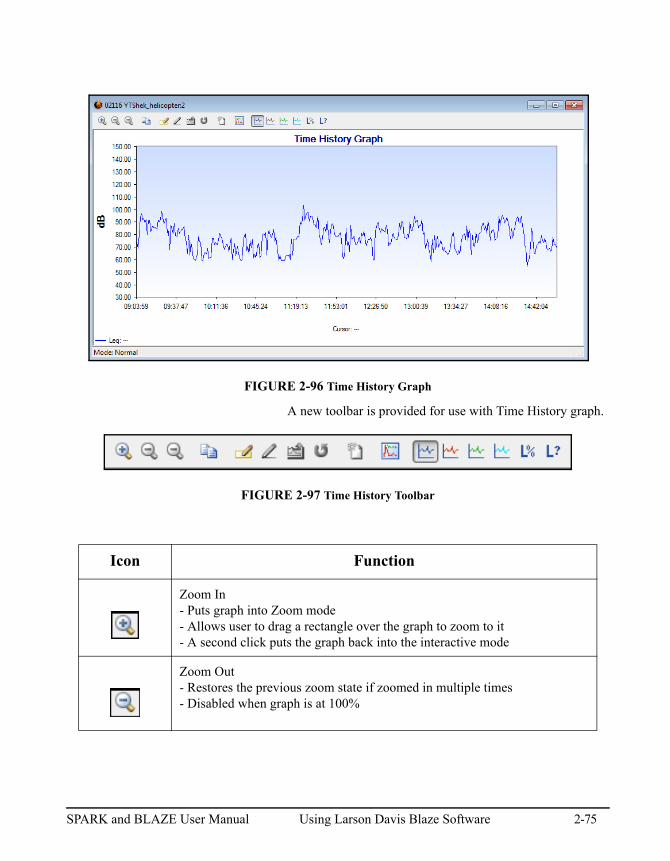
FIGURE 2-96 Time History Graph
A new toolbar is provided for use with Time History graph.
FIGURE 2-97 Time History Toolbar
Icon Function
Zoom In- Puts graph into Zoom mode- Allows user to drag a rectangle over the graph to zoom to it- A second click puts the graph back into the interactive mode
Zoom Out- Restores the previous zoom state if zoomed in multiple times- Disabled when graph is at 100%
SPARK and BLAZE User Manual Using Larson Davis Blaze Software 2-75
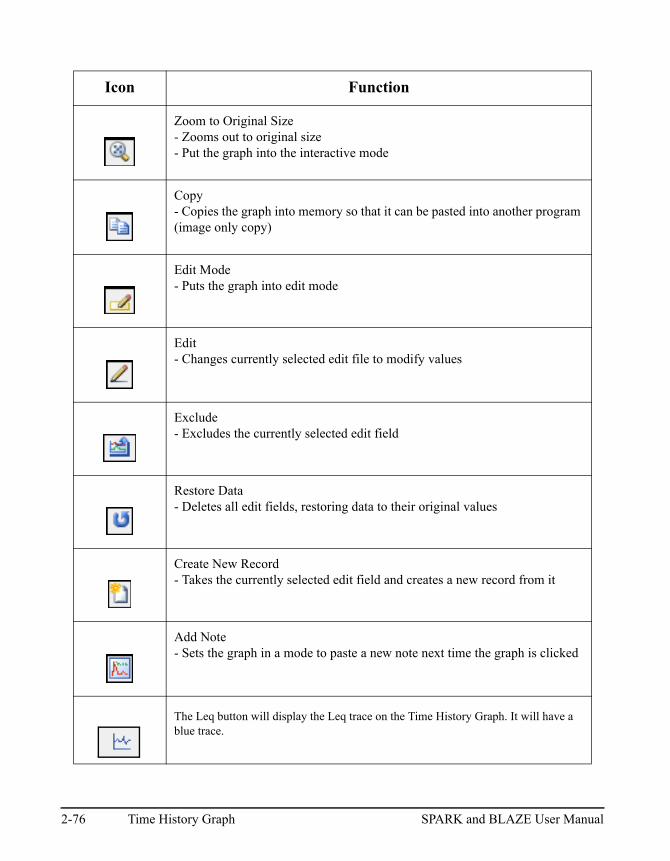
Zoom to Original Size- Zooms out to original size- Put the graph into the interactive mode
Copy- Copies the graph into memory so that it can be pasted into another program (image only copy)
Edit Mode- Puts the graph into edit mode
Edit- Changes currently selected edit file to modify values
Exclude- Excludes the currently selected edit field
Restore Data- Deletes all edit fields, restoring data to their original values
Create New Record- Takes the currently selected edit field and creates a new record from it
Add Note- Sets the graph in a mode to paste a new note next time the graph is clicked
The Leq button will display the Leq trace on the Time History Graph. It will have a blue trace.
Icon Function
2-76 Time History Graph SPARK and BLAZE User Manual
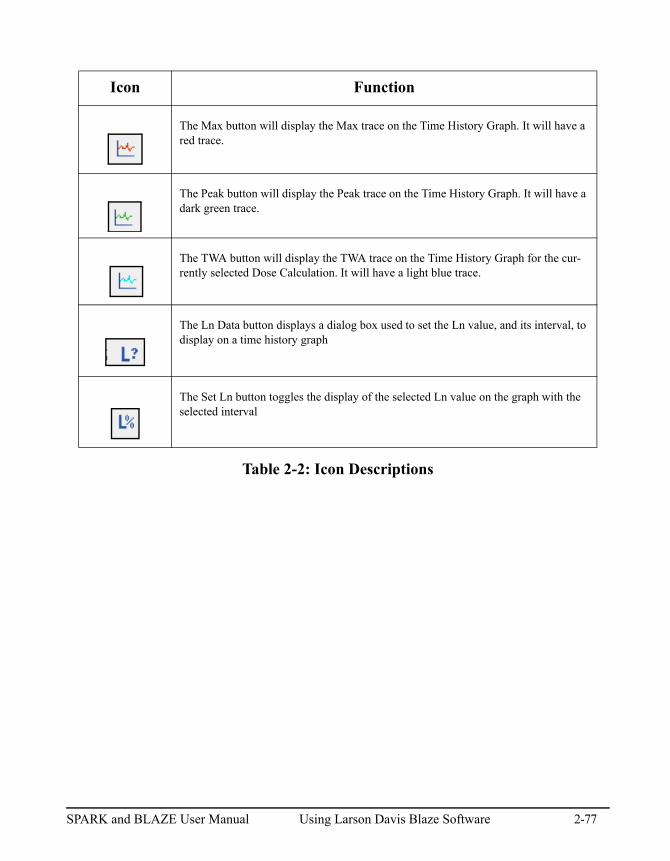
Table 2-2: Icon Descriptions
The Max button will display the Max trace on the Time History Graph. It will have a red trace.
The Peak button will display the Peak trace on the Time History Graph. It will have a dark green trace.
The TWA button will display the TWA trace on the Time History Graph for the cur-rently selected Dose Calculation. It will have a light blue trace.
The Ln Data button displays a dialog box used to set the Ln value, and its interval, to display on a time history graph
The Set Ln button toggles the display of the selected Ln value on the graph with the selected interval
Icon Function
SPARK and BLAZE User Manual Using Larson Davis Blaze Software 2-77
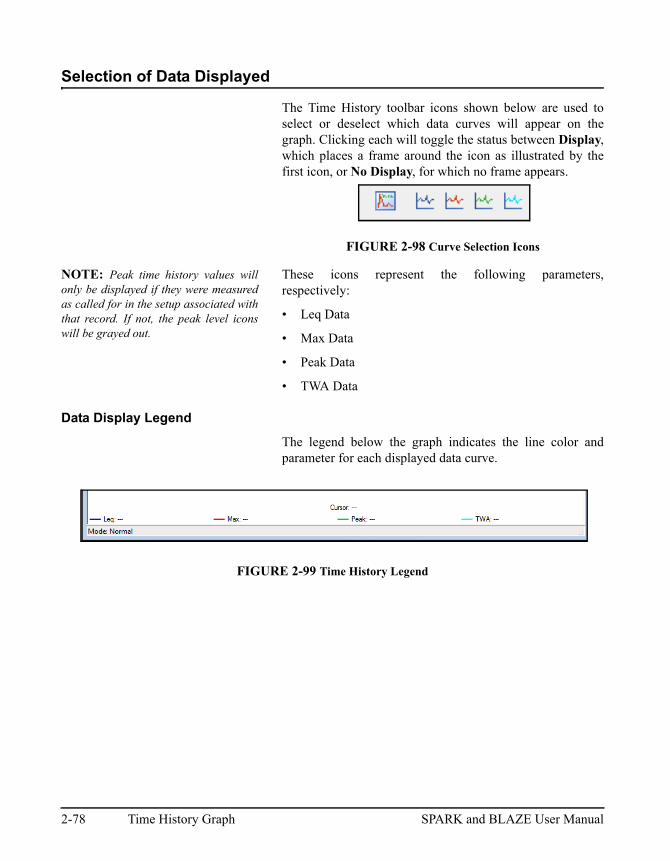
Selection of Data Displayed
The Time History toolbar icons shown below are used toselect or deselect which data curves will appear on thegraph. Clicking each will toggle the status between Display,which places a frame around the icon as illustrated by thefirst icon, or No Display, for which no frame appears.
FIGURE 2-98 Curve Selection Icons
NOTE: Peak time history values willonly be displayed if they were measuredas called for in the setup associated withthat record. If not, the peak level iconswill be grayed out.
These icons represent the following parameters,respectively:
• Leq Data
• Max Data
• Peak Data
• TWA Data
Data Display Legend
The legend below the graph indicates the line color andparameter for each displayed data curve.
FIGURE 2-99 Time History Legend
2-78 Time History Graph SPARK and BLAZE User Manual
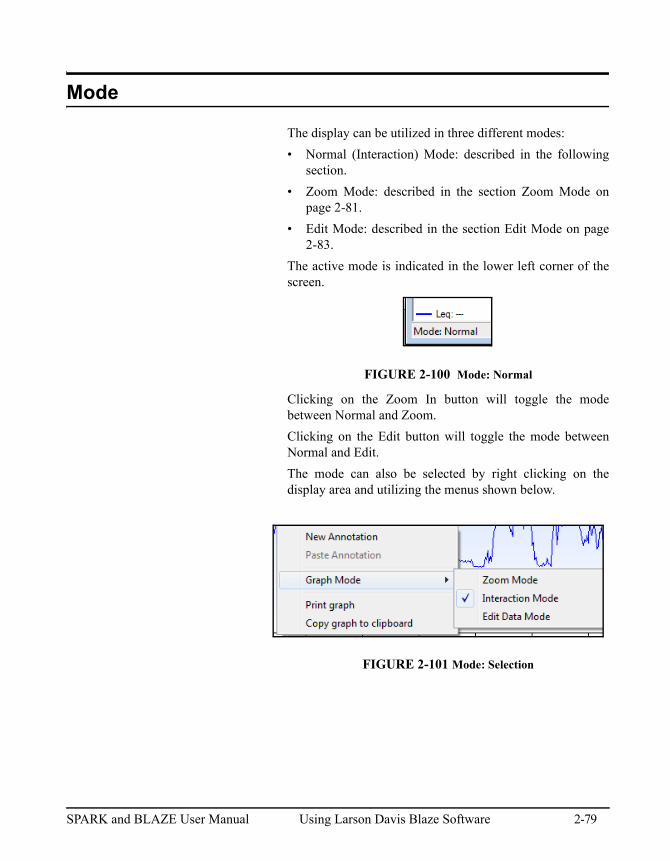
Mode
The display can be utilized in three different modes:
• Normal (Interaction) Mode: described in the followingsection.
• Zoom Mode: described in the section Zoom Mode onpage 2-81.
• Edit Mode: described in the section Edit Mode on page2-83.
The active mode is indicated in the lower left corner of thescreen.
FIGURE 2-100 Mode: Normal
Clicking on the Zoom In button will toggle the modebetween Normal and Zoom.
Clicking on the Edit button will toggle the mode betweenNormal and Edit.
The mode can also be selected by right clicking on thedisplay area and utilizing the menus shown below.
FIGURE 2-101 Mode: Selection
SPARK and BLAZE User Manual Using Larson Davis Blaze Software 2-79
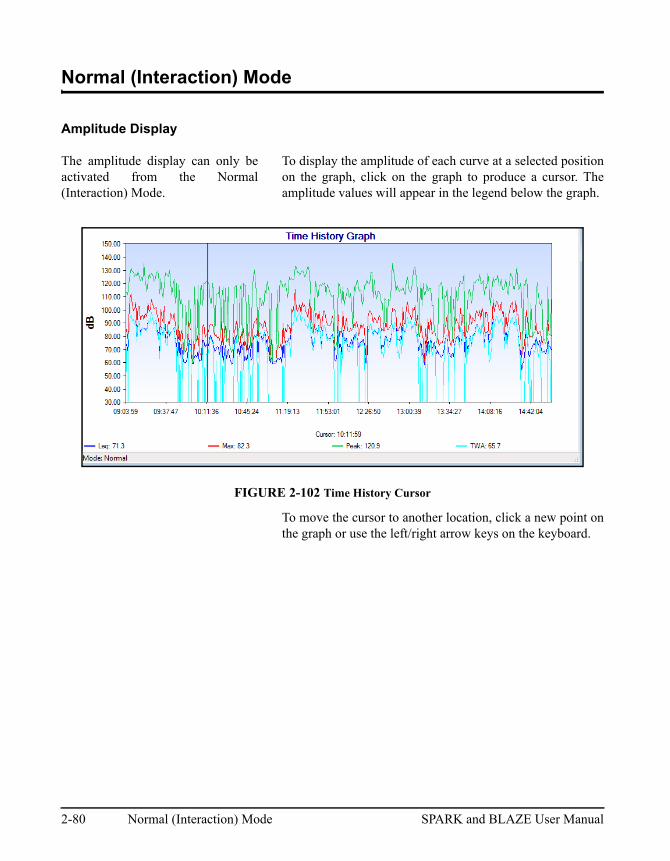
Normal (Interaction) Mode
Amplitude Display
The amplitude display can only beactivated from the Normal(Interaction) Mode.
To display the amplitude of each curve at a selected positionon the graph, click on the graph to produce a cursor. Theamplitude values will appear in the legend below the graph.
FIGURE 2-102 Time History Cursor
To move the cursor to another location, click a new point onthe graph or use the left/right arrow keys on the keyboard.
2-80 Normal (Interaction) Mode SPARK and BLAZE User Manual
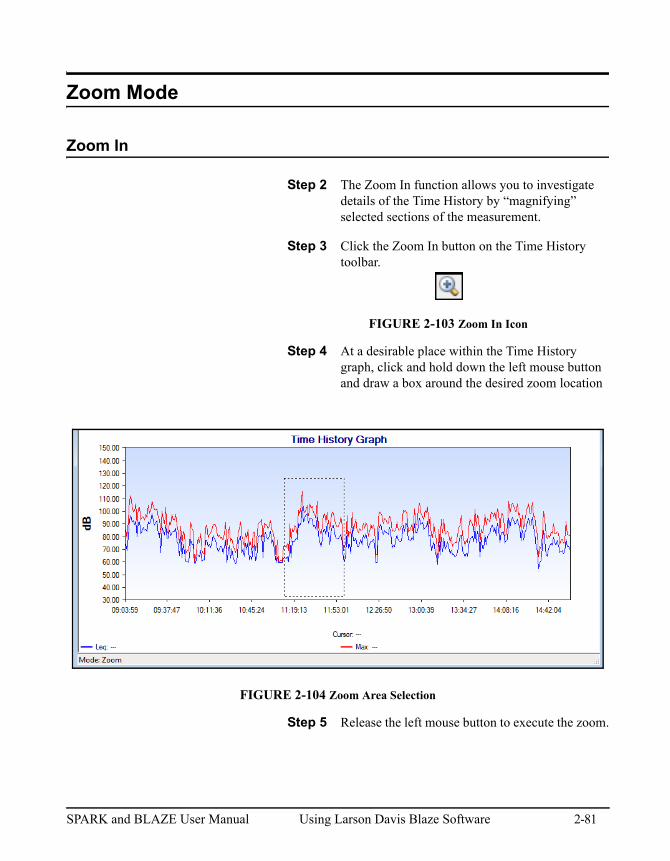
Zoom Mode
Zoom In
Step 2 The Zoom In function allows you to investigate details of the Time History by “magnifying” selected sections of the measurement.
Step 3 Click the Zoom In button on the Time History toolbar.
FIGURE 2-103 Zoom In Icon
Step 4 At a desirable place within the Time History graph, click and hold down the left mouse button and draw a box around the desired zoom location
FIGURE 2-104 Zoom Area Selection
Step 5 Release the left mouse button to execute the zoom.
SPARK and BLAZE User Manual Using Larson Davis Blaze Software 2-81
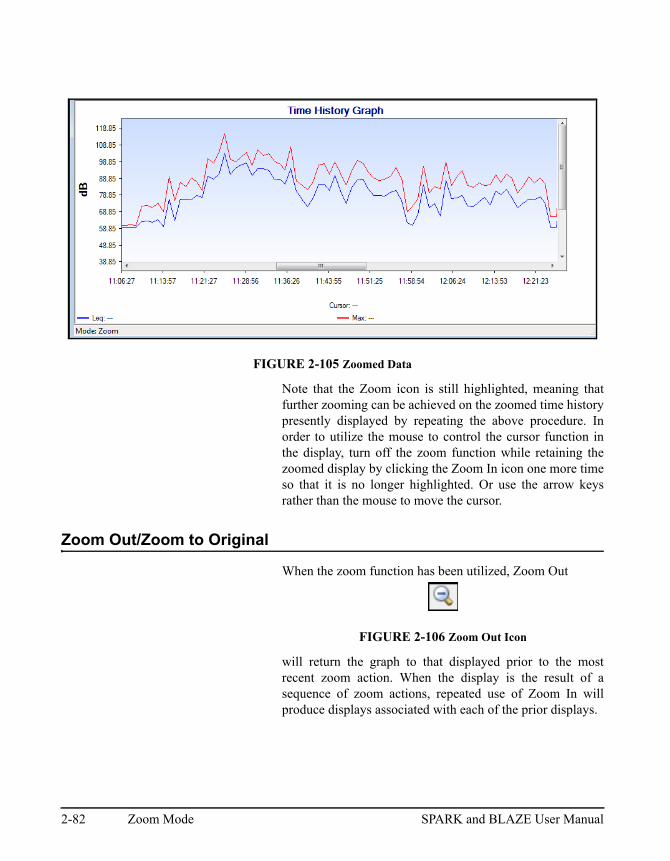
FIGURE 2-105 Zoomed Data
Note that the Zoom icon is still highlighted, meaning thatfurther zooming can be achieved on the zoomed time historypresently displayed by repeating the above procedure. Inorder to utilize the mouse to control the cursor function inthe display, turn off the zoom function while retaining thezoomed display by clicking the Zoom In icon one more timeso that it is no longer highlighted. Or use the arrow keysrather than the mouse to move the cursor.
Zoom Out/Zoom to Original
When the zoom function has been utilized, Zoom Out
FIGURE 2-106 Zoom Out Icon
will return the graph to that displayed prior to the mostrecent zoom action. When the display is the result of asequence of zoom actions, repeated use of Zoom In willproduce displays associated with each of the prior displays.
2-82 Zoom Mode SPARK and BLAZE User Manual
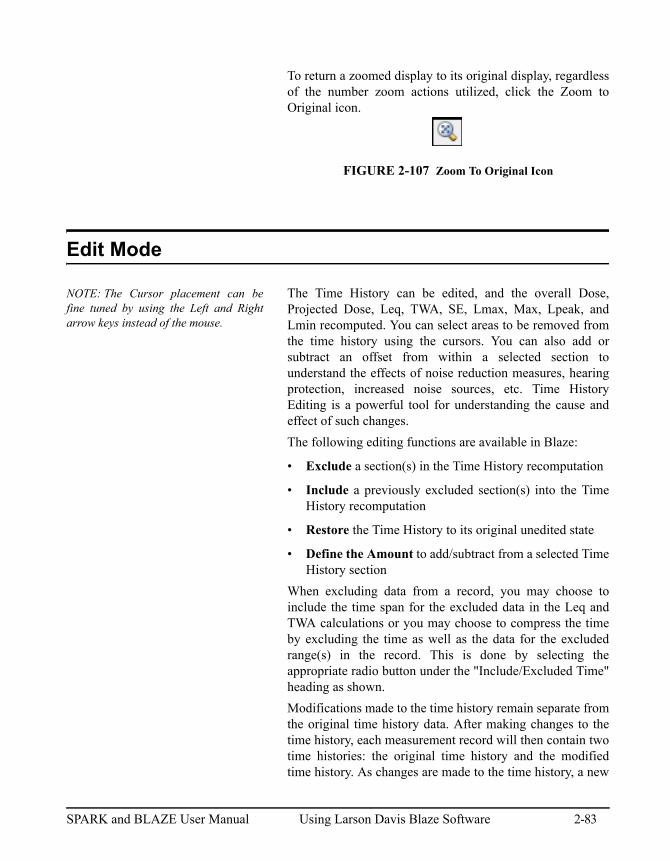
To return a zoomed display to its original display, regardlessof the number zoom actions utilized, click the Zoom toOriginal icon.
FIGURE 2-107 Zoom To Original Icon
Edit Mode
NOTE: The Cursor placement can befine tuned by using the Left and Rightarrow keys instead of the mouse.
The Time History can be edited, and the overall Dose,Projected Dose, Leq, TWA, SE, Lmax, Max, Lpeak, andLmin recomputed. You can select areas to be removed fromthe time history using the cursors. You can also add orsubtract an offset from within a selected section tounderstand the effects of noise reduction measures, hearingprotection, increased noise sources, etc. Time HistoryEditing is a powerful tool for understanding the cause andeffect of such changes.
The following editing functions are available in Blaze:
• Exclude a section(s) in the Time History recomputation
• Include a previously excluded section(s) into the TimeHistory recomputation
• Restore the Time History to its original unedited state
• Define the Amount to add/subtract from a selected TimeHistory section
When excluding data from a record, you may choose toinclude the time span for the excluded data in the Leq andTWA calculations or you may choose to compress the timeby excluding the time as well as the data for the excludedrange(s) in the record. This is done by selecting theappropriate radio button under the "Include/Excluded Time"heading as shown.
Modifications made to the time history remain separate fromthe original time history data. After making changes to thetime history, each measurement record will then contain twotime histories: the original time history and the modifiedtime history. As changes are made to the time history, a new
SPARK and BLAZE User Manual Using Larson Davis Blaze Software 2-83
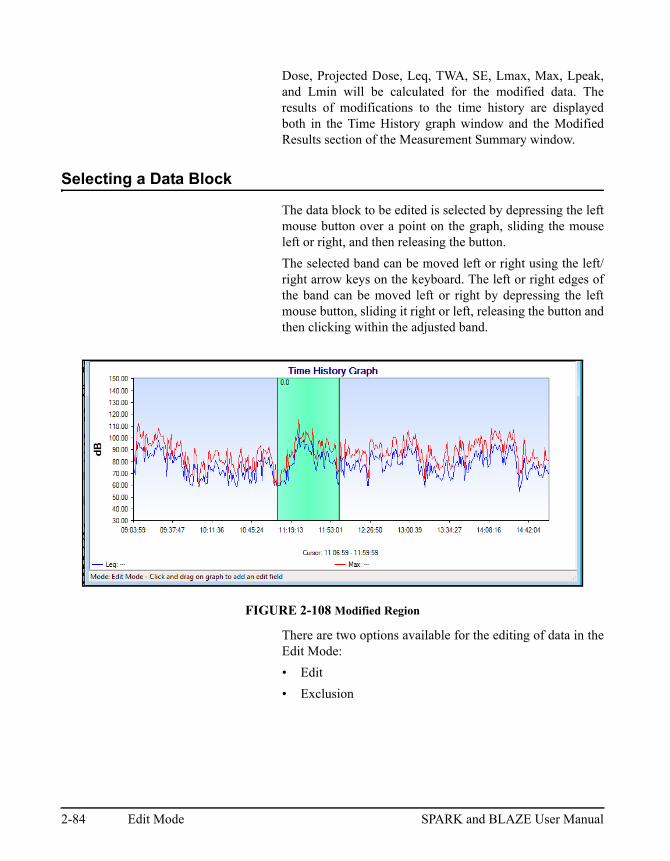
Dose, Projected Dose, Leq, TWA, SE, Lmax, Max, Lpeak,and Lmin will be calculated for the modified data. Theresults of modifications to the time history are displayedboth in the Time History graph window and the ModifiedResults section of the Measurement Summary window.
Selecting a Data Block
The data block to be edited is selected by depressing the leftmouse button over a point on the graph, sliding the mouseleft or right, and then releasing the button.
The selected band can be moved left or right using the left/right arrow keys on the keyboard. The left or right edges ofthe band can be moved left or right by depressing the leftmouse button, sliding it right or left, releasing the button andthen clicking within the adjusted band.
FIGURE 2-108 Modified Region
There are two options available for the editing of data in theEdit Mode:
• Edit
• Exclusion
2-84 Edit Mode SPARK and BLAZE User Manual
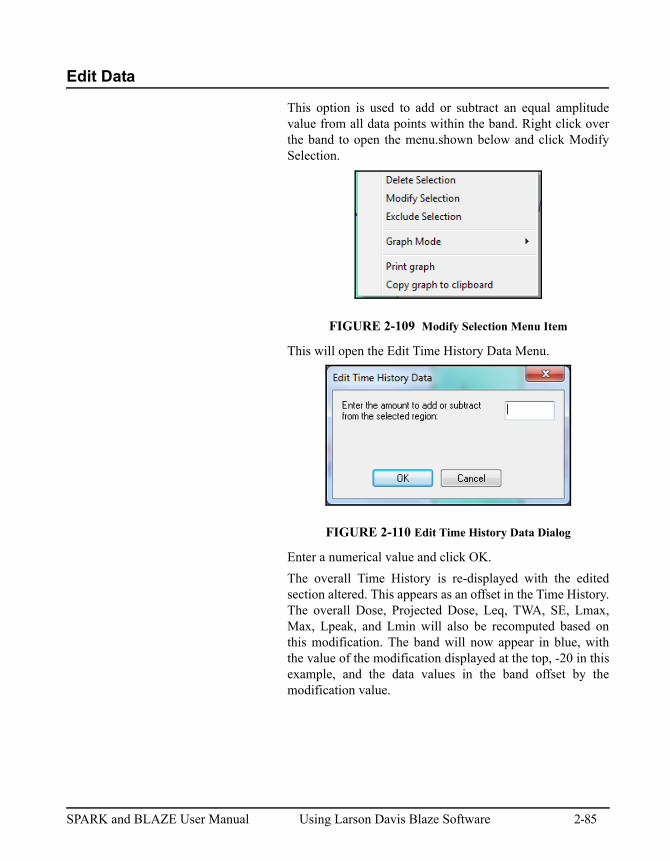
Edit Data
This option is used to add or subtract an equal amplitudevalue from all data points within the band. Right click overthe band to open the menu.shown below and click ModifySelection.
FIGURE 2-109 Modify Selection Menu Item
This will open the Edit Time History Data Menu.
FIGURE 2-110 Edit Time History Data Dialog
Enter a numerical value and click OK.
The overall Time History is re-displayed with the editedsection altered. This appears as an offset in the Time History.The overall Dose, Projected Dose, Leq, TWA, SE, Lmax,Max, Lpeak, and Lmin will also be recomputed based onthis modification. The band will now appear in blue, withthe value of the modification displayed at the top, -20 in thisexample, and the data values in the band offset by themodification value.
SPARK and BLAZE User Manual Using Larson Davis Blaze Software 2-85
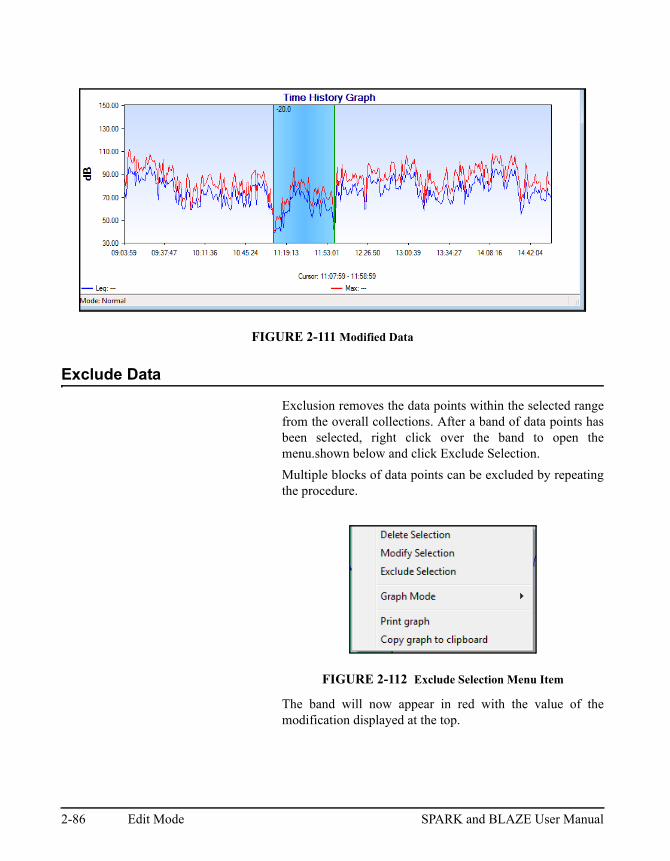
FIGURE 2-111 Modified Data
Exclude Data
Exclusion removes the data points within the selected rangefrom the overall collections. After a band of data points hasbeen selected, right click over the band to open themenu.shown below and click Exclude Selection.
Multiple blocks of data points can be excluded by repeatingthe procedure.
FIGURE 2-112 Exclude Selection Menu Item
The band will now appear in red with the value of themodification displayed at the top.
2-86 Edit Mode SPARK and BLAZE User Manual
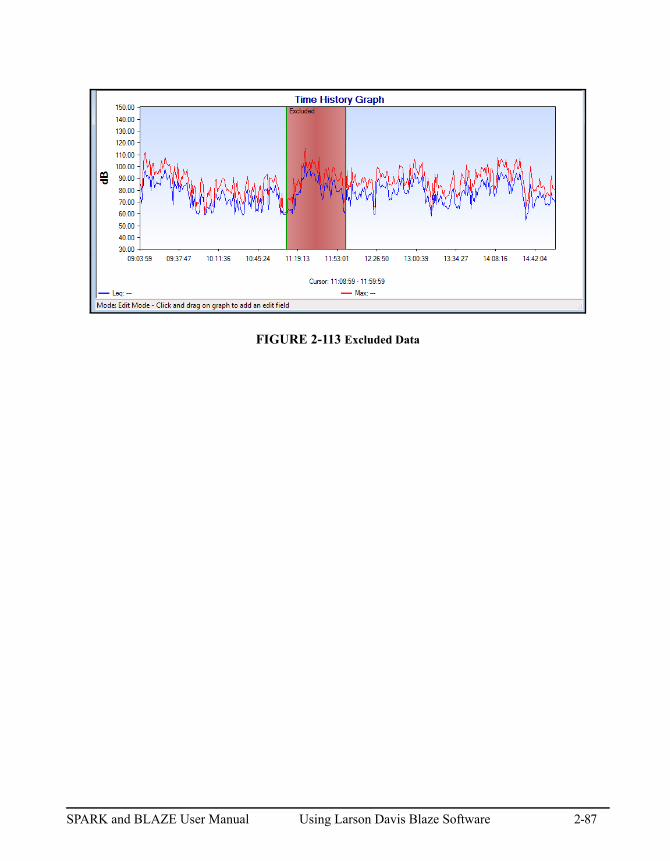
FIGURE 2-113 Excluded Data
SPARK and BLAZE User Manual Using Larson Davis Blaze Software 2-87
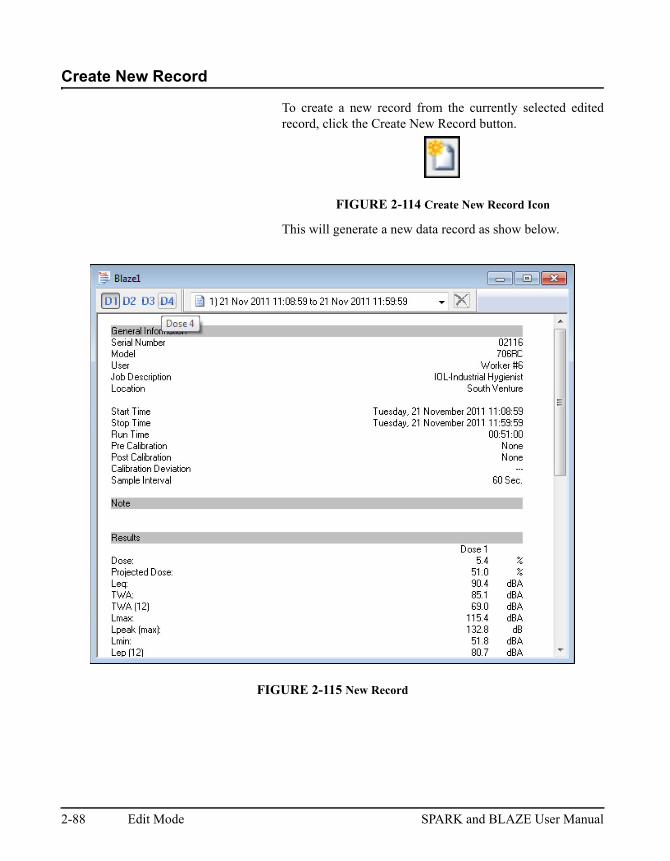
Create New Record
To create a new record from the currently selected editedrecord, click the Create New Record button.
FIGURE 2-114 Create New Record Icon
This will generate a new data record as show below.
FIGURE 2-115 New Record
2-88 Edit Mode SPARK and BLAZE User Manual
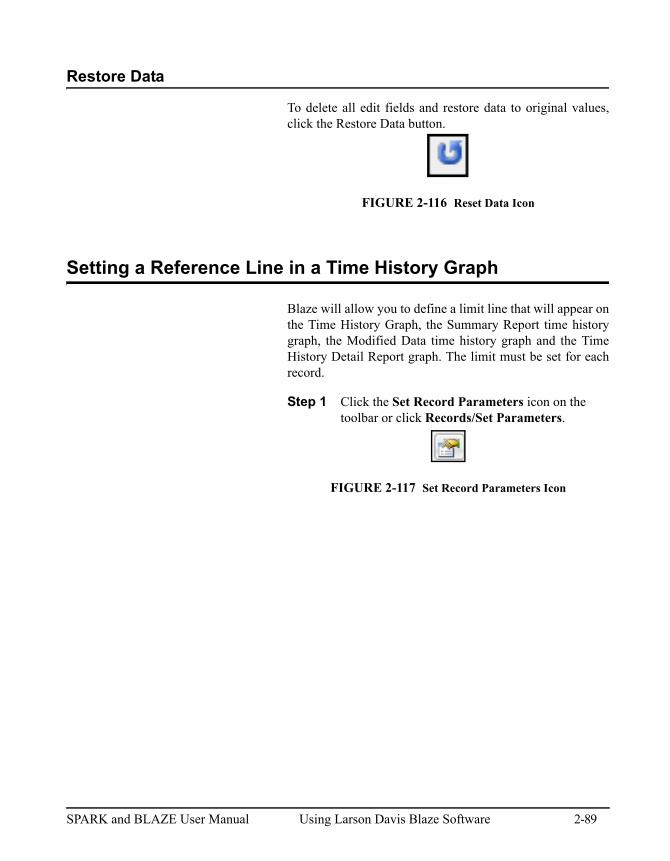
Restore Data
To delete all edit fields and restore data to original values,click the Restore Data button.
FIGURE 2-116 Reset Data Icon
Setting a Reference Line in a Time History Graph
Blaze will allow you to define a limit line that will appear onthe Time History Graph, the Summary Report time historygraph, the Modified Data time history graph and the TimeHistory Detail Report graph. The limit must be set for eachrecord.
Step 1 Click the Set Record Parameters icon on the toolbar or click Records/Set Parameters.
FIGURE 2-117 Set Record Parameters Icon
SPARK and BLAZE User Manual Using Larson Davis Blaze Software 2-89
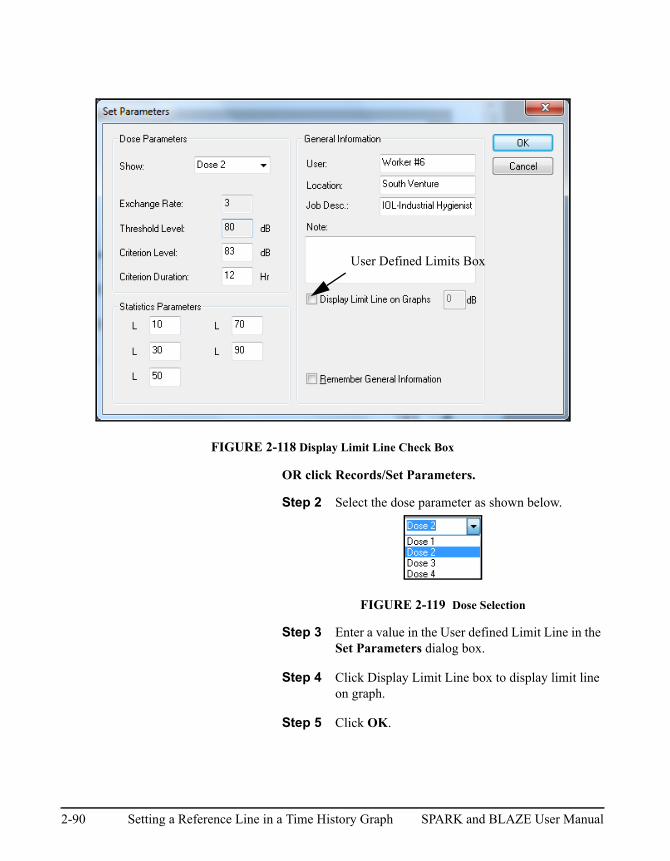
FIGURE 2-118 Display Limit Line Check Box
OR click Records/Set Parameters.
Step 2 Select the dose parameter as shown below.
FIGURE 2-119 Dose Selection
Step 3 Enter a value in the User defined Limit Line in the Set Parameters dialog box.
Step 4 Click Display Limit Line box to display limit line on graph.
Step 5 Click OK.
User Defined Limits Box
2-90 Setting a Reference Line in a Time History Graph SPARK and BLAZE User Manual
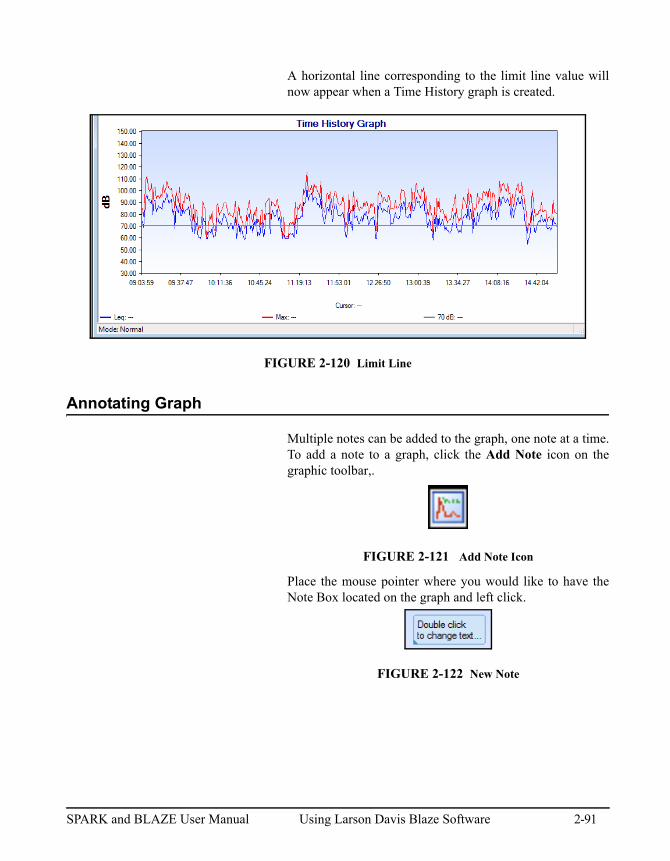
A horizontal line corresponding to the limit line value willnow appear when a Time History graph is created.
FIGURE 2-120 Limit Line
Annotating Graph
Multiple notes can be added to the graph, one note at a time.To add a note to a graph, click the Add Note icon on thegraphic toolbar,.
FIGURE 2-121 Add Note Icon
Place the mouse pointer where you would like to have theNote Box located on the graph and left click.
FIGURE 2-122 New Note
SPARK and BLAZE User Manual Using Larson Davis Blaze Software 2-91
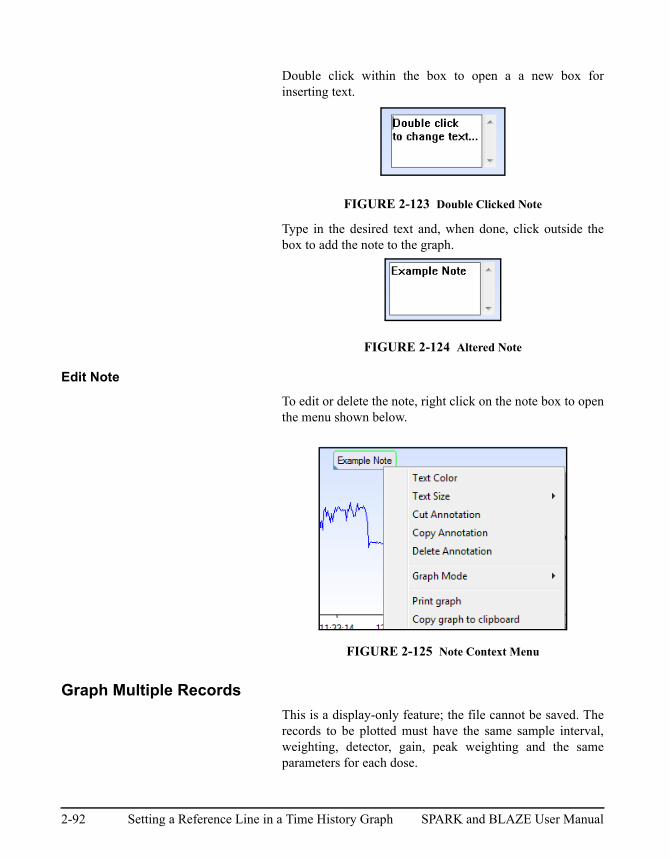
Double click within the box to open a a new box forinserting text.
FIGURE 2-123 Double Clicked Note
Type in the desired text and, when done, click outside thebox to add the note to the graph.
FIGURE 2-124 Altered Note
Edit Note
To edit or delete the note, right click on the note box to openthe menu shown below.
FIGURE 2-125 Note Context Menu
Graph Multiple Records
This is a display-only feature; the file cannot be saved. Therecords to be plotted must have the same sample interval,weighting, detector, gain, peak weighting and the sameparameters for each dose.
2-92 Setting a Reference Line in a Time History Graph SPARK and BLAZE User Manual
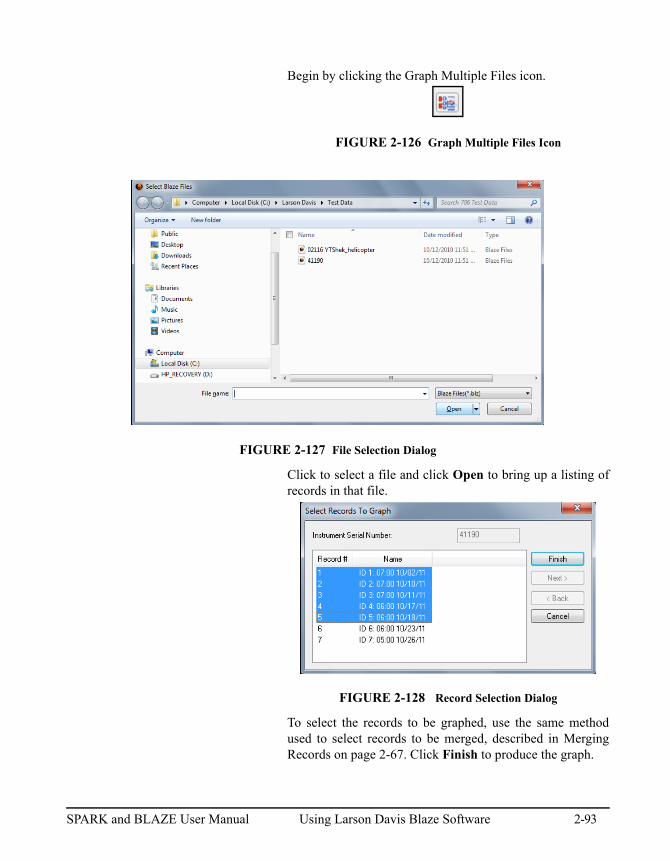
Begin by clicking the Graph Multiple Files icon.
FIGURE 2-126 Graph Multiple Files Icon
FIGURE 2-127 File Selection Dialog
Click to select a file and click Open to bring up a listing ofrecords in that file.
FIGURE 2-128 Record Selection Dialog
To select the records to be graphed, use the same methodused to select records to be merged, described in MergingRecords on page 2-67. Click Finish to produce the graph.
SPARK and BLAZE User Manual Using Larson Davis Blaze Software 2-93
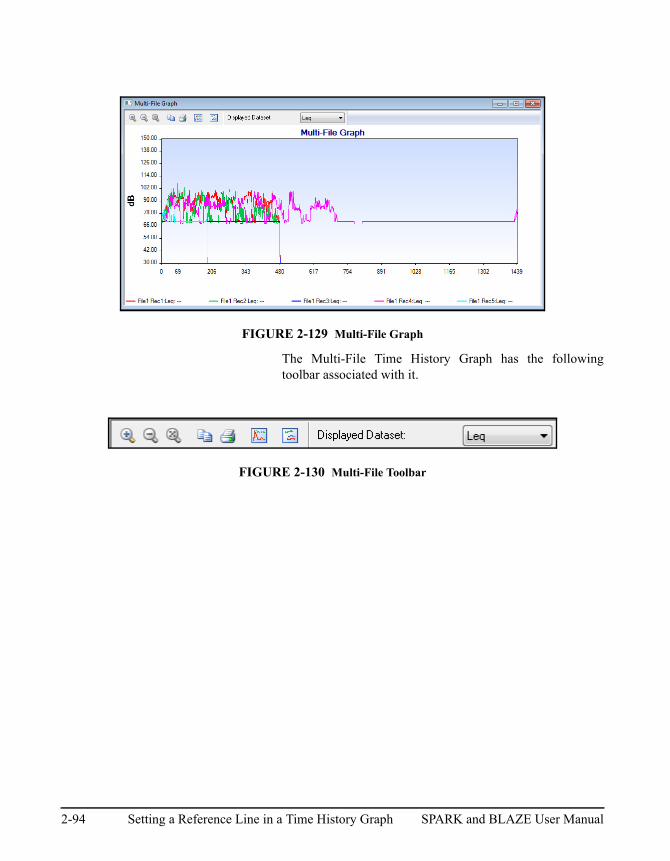
FIGURE 2-129 Multi-File Graph
The Multi-File Time History Graph has the followingtoolbar associated with it.
FIGURE 2-130 Multi-File Toolbar
2-94 Setting a Reference Line in a Time History Graph SPARK and BLAZE User Manual
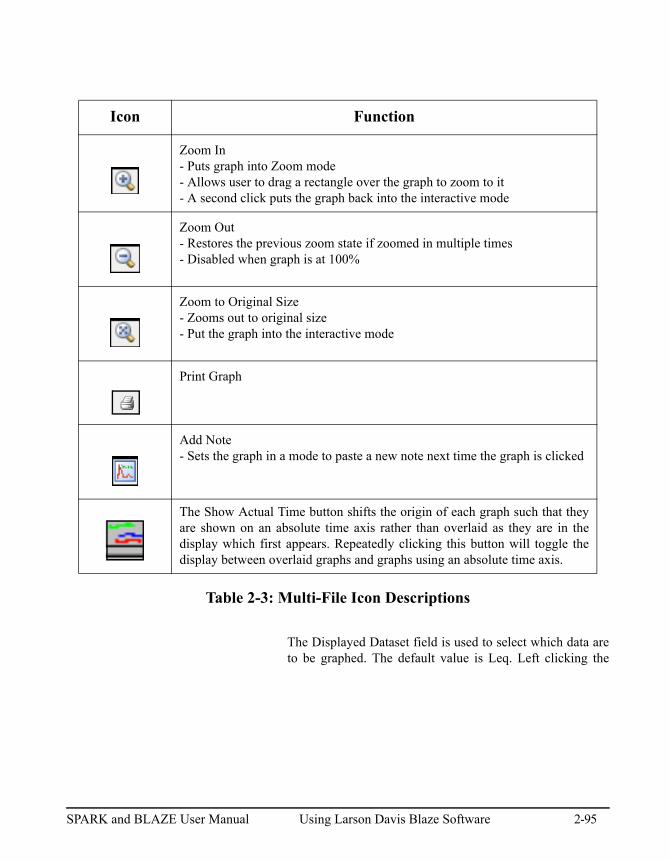
Table 2-3: Multi-File Icon Descriptions
The Displayed Dataset field is used to select which data areto be graphed. The default value is Leq. Left clicking the
Icon Function
Zoom In- Puts graph into Zoom mode- Allows user to drag a rectangle over the graph to zoom to it- A second click puts the graph back into the interactive mode
Zoom Out- Restores the previous zoom state if zoomed in multiple times- Disabled when graph is at 100%
Zoom to Original Size- Zooms out to original size- Put the graph into the interactive mode
Print Graph
Add Note- Sets the graph in a mode to paste a new note next time the graph is clicked
The Show Actual Time button shifts the origin of each graph such that theyare shown on an absolute time axis rather than overlaid as they are in thedisplay which first appears. Repeatedly clicking this button will toggle thedisplay between overlaid graphs and graphs using an absolute time axis.
SPARK and BLAZE User Manual Using Larson Davis Blaze Software 2-95
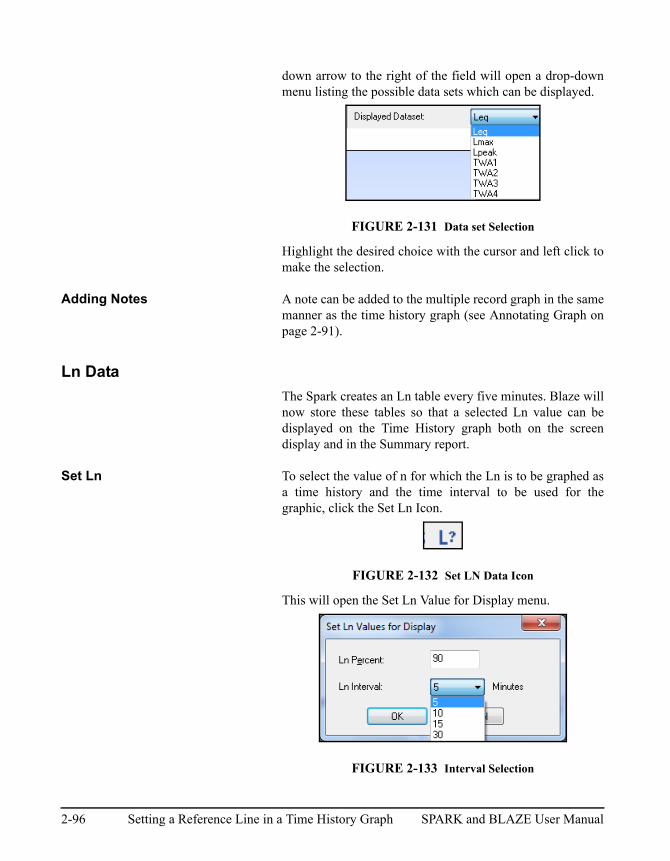
down arrow to the right of the field will open a drop-downmenu listing the possible data sets which can be displayed.
FIGURE 2-131 Data set Selection
Highlight the desired choice with the cursor and left click tomake the selection.
Adding Notes A note can be added to the multiple record graph in the samemanner as the time history graph (see Annotating Graph onpage 2-91).
Ln Data
The Spark creates an Ln table every five minutes. Blaze willnow store these tables so that a selected Ln value can bedisplayed on the Time History graph both on the screendisplay and in the Summary report.
Set Ln To select the value of n for which the Ln is to be graphed asa time history and the time interval to be used for thegraphic, click the Set Ln Icon.
FIGURE 2-132 Set LN Data Icon
This will open the Set Ln Value for Display menu.
FIGURE 2-133 Interval Selection
2-96 Setting a Reference Line in a Time History Graph SPARK and BLAZE User Manual
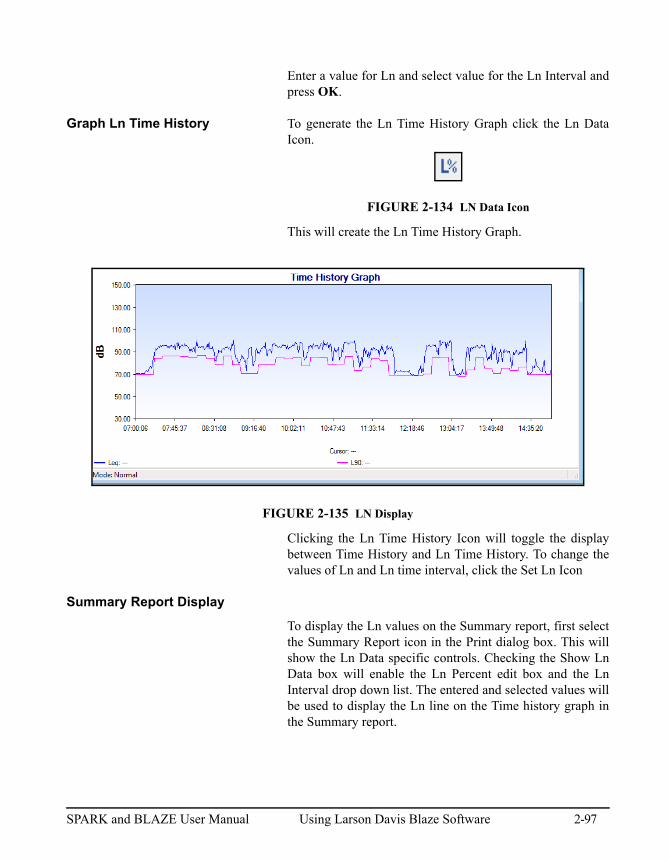
Enter a value for Ln and select value for the Ln Interval andpress OK.
Graph Ln Time History To generate the Ln Time History Graph click the Ln DataIcon.
FIGURE 2-134 LN Data Icon
This will create the Ln Time History Graph.
FIGURE 2-135 LN Display
Clicking the Ln Time History Icon will toggle the displaybetween Time History and Ln Time History. To change thevalues of Ln and Ln time interval, click the Set Ln Icon
Summary Report Display
To display the Ln values on the Summary report, first selectthe Summary Report icon in the Print dialog box. This willshow the Ln Data specific controls. Checking the Show LnData box will enable the Ln Percent edit box and the LnInterval drop down list. The entered and selected values willbe used to display the Ln line on the Time history graph inthe Summary report.
SPARK and BLAZE User Manual Using Larson Davis Blaze Software 2-97
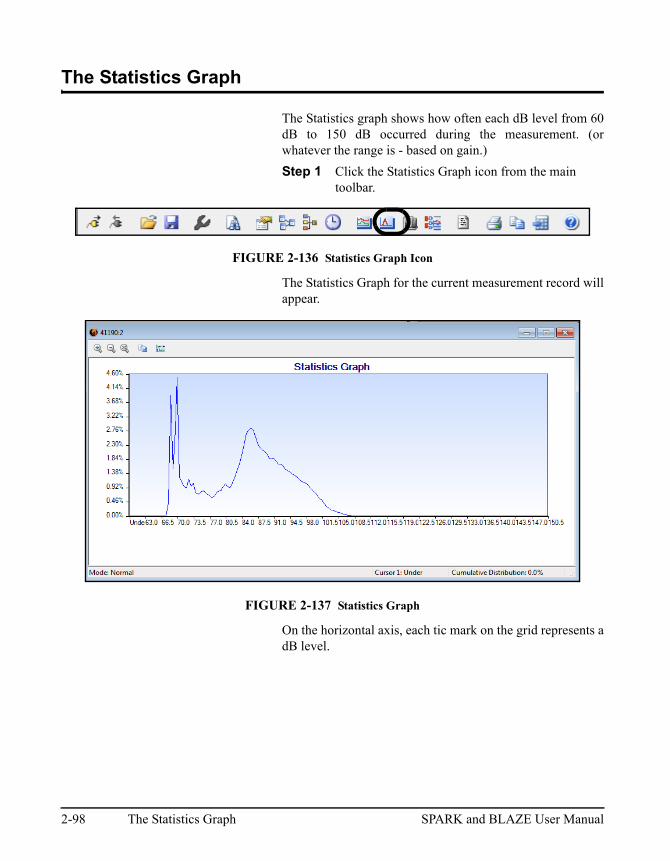
The Statistics Graph
The Statistics graph shows how often each dB level from 60dB to 150 dB occurred during the measurement. (orwhatever the range is - based on gain.)
Step 1 Click the Statistics Graph icon from the main toolbar.
FIGURE 2-136 Statistics Graph Icon
The Statistics Graph for the current measurement record willappear.
FIGURE 2-137 Statistics Graph
On the horizontal axis, each tic mark on the grid represents adB level.
2-98 The Statistics Graph SPARK and BLAZE User Manual
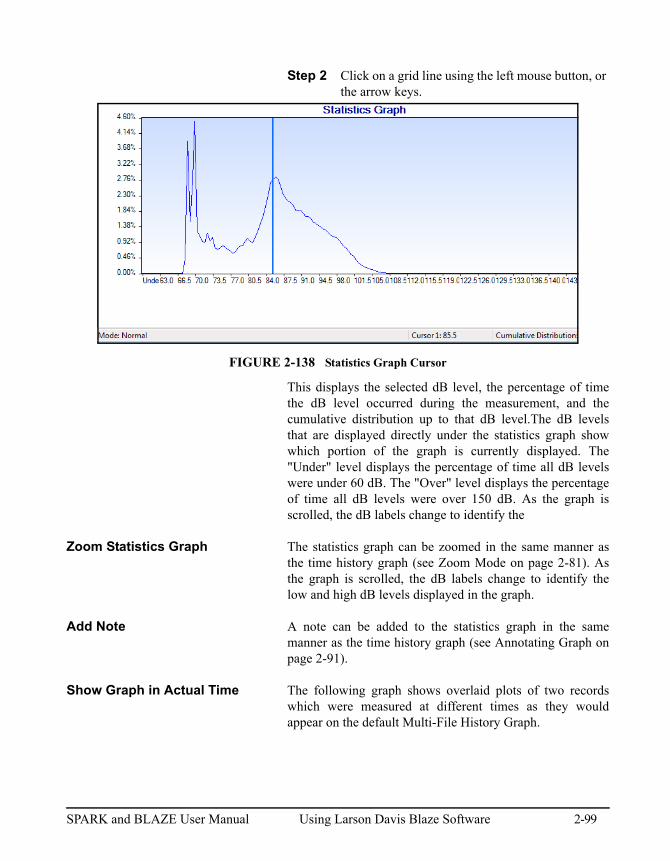
Step 2 Click on a grid line using the left mouse button, or the arrow keys.
FIGURE 2-138 Statistics Graph Cursor
This displays the selected dB level, the percentage of timethe dB level occurred during the measurement, and thecumulative distribution up to that dB level.The dB levelsthat are displayed directly under the statistics graph showwhich portion of the graph is currently displayed. The"Under" level displays the percentage of time all dB levelswere under 60 dB. The "Over" level displays the percentageof time all dB levels were over 150 dB. As the graph isscrolled, the dB labels change to identify the
Zoom Statistics Graph The statistics graph can be zoomed in the same manner asthe time history graph (see Zoom Mode on page 2-81). Asthe graph is scrolled, the dB labels change to identify thelow and high dB levels displayed in the graph.
Add Note A note can be added to the statistics graph in the samemanner as the time history graph (see Annotating Graph onpage 2-91).
Show Graph in Actual Time The following graph shows overlaid plots of two recordswhich were measured at different times as they wouldappear on the default Multi-File History Graph.
SPARK and BLAZE User Manual Using Larson Davis Blaze Software 2-99
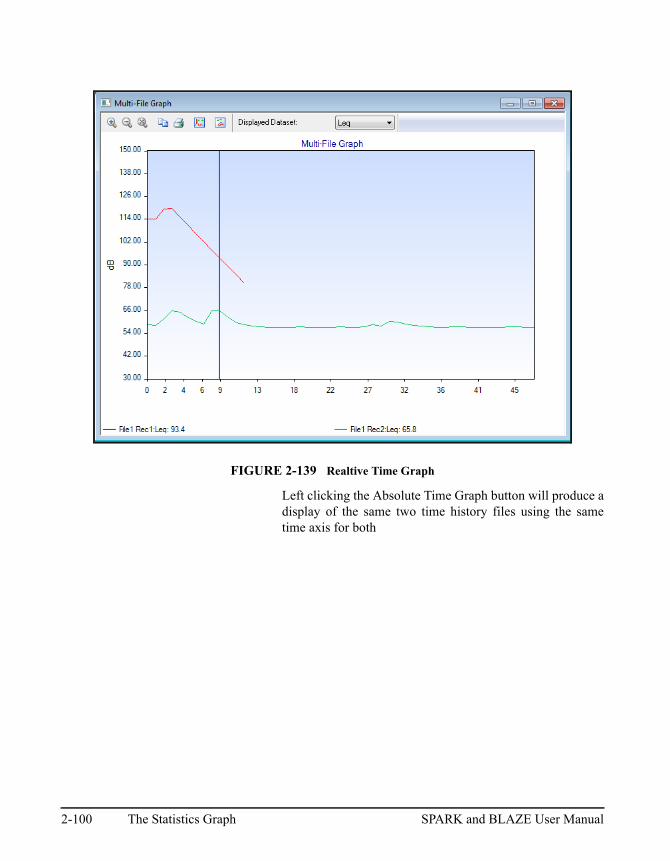
FIGURE 2-139 Realtive Time Graph
Left clicking the Absolute Time Graph button will produce adisplay of the same two time history files using the sametime axis for both
2-100 The Statistics Graph SPARK and BLAZE User Manual
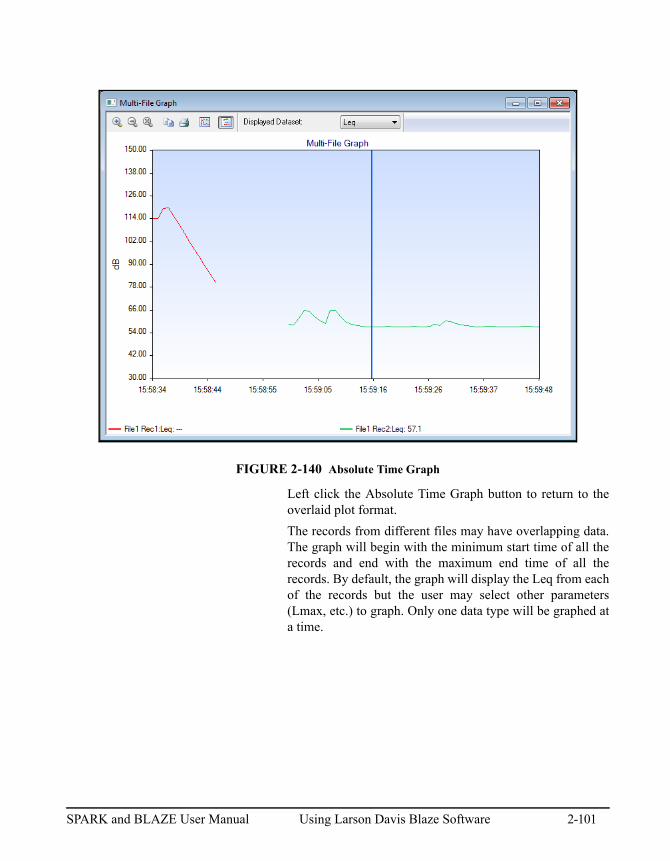
FIGURE 2-140 Absolute Time Graph
Left click the Absolute Time Graph button to return to theoverlaid plot format.
The records from different files may have overlapping data.The graph will begin with the minimum start time of all therecords and end with the maximum end time of all therecords. By default, the graph will display the Leq from eachof the records but the user may select other parameters(Lmax, etc.) to graph. Only one data type will be graphed ata time.
SPARK and BLAZE User Manual Using Larson Davis Blaze Software 2-101
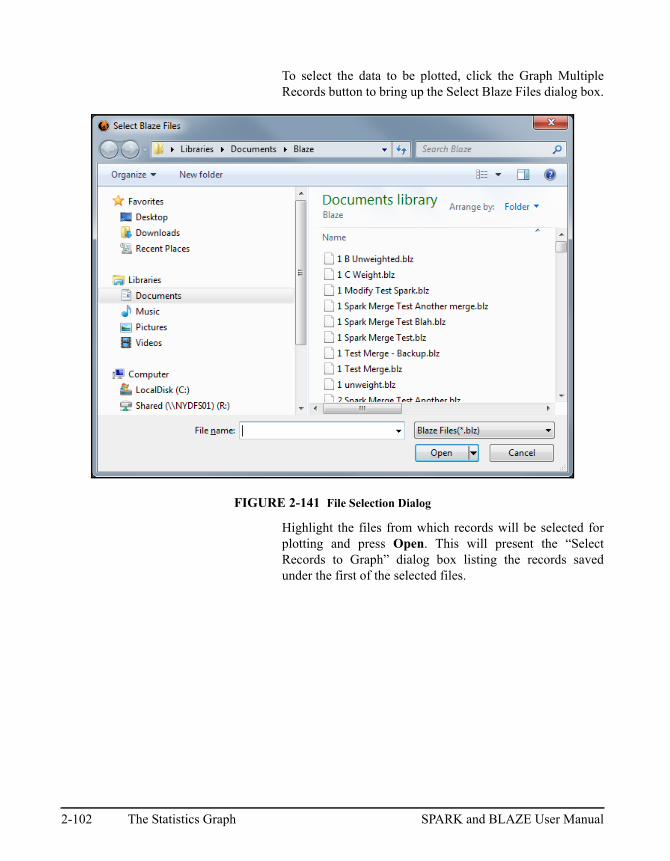
To select the data to be plotted, click the Graph MultipleRecords button to bring up the Select Blaze Files dialog box.
FIGURE 2-141 File Selection Dialog
Highlight the files from which records will be selected forplotting and press Open. This will present the “SelectRecords to Graph” dialog box listing the records savedunder the first of the selected files.
2-102 The Statistics Graph SPARK and BLAZE User Manual
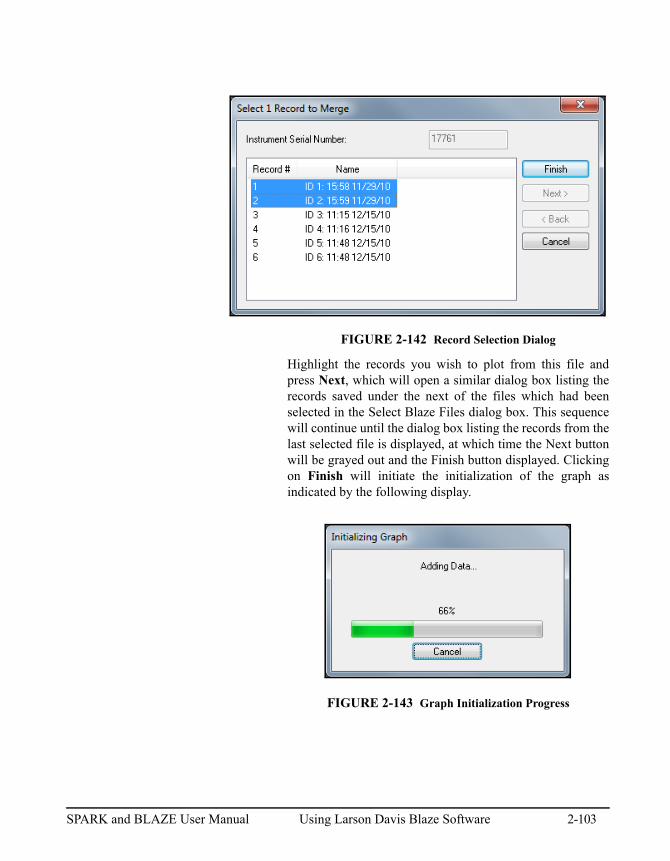
FIGURE 2-142 Record Selection Dialog
Highlight the records you wish to plot from this file andpress Next, which will open a similar dialog box listing therecords saved under the next of the files which had beenselected in the Select Blaze Files dialog box. This sequencewill continue until the dialog box listing the records from thelast selected file is displayed, at which time the Next buttonwill be grayed out and the Finish button displayed. Clickingon Finish will initiate the initialization of the graph asindicated by the following display.
FIGURE 2-143 Graph Initialization Progress
SPARK and BLAZE User Manual Using Larson Davis Blaze Software 2-103
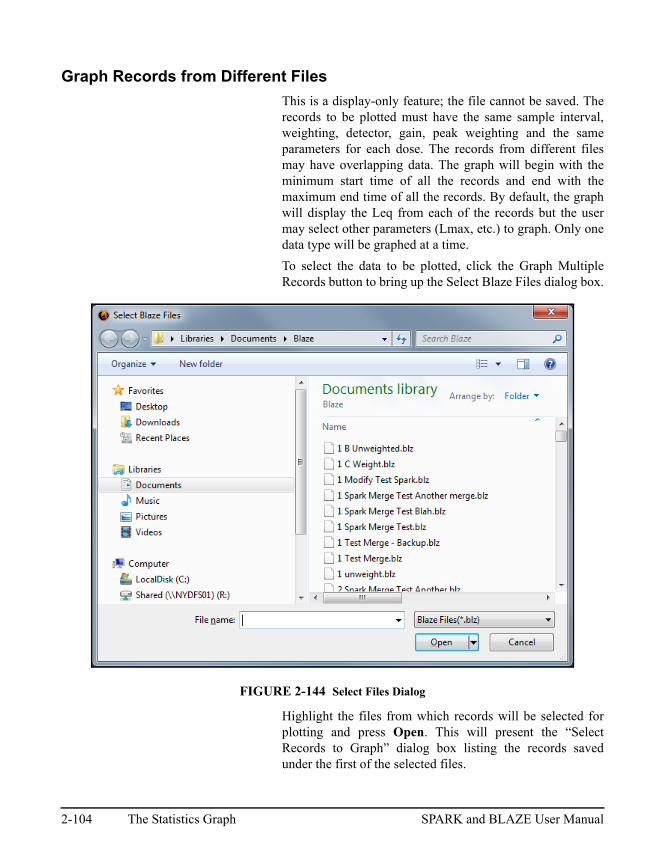
Graph Records from Different Files
This is a display-only feature; the file cannot be saved. Therecords to be plotted must have the same sample interval,weighting, detector, gain, peak weighting and the sameparameters for each dose. The records from different filesmay have overlapping data. The graph will begin with theminimum start time of all the records and end with themaximum end time of all the records. By default, the graphwill display the Leq from each of the records but the usermay select other parameters (Lmax, etc.) to graph. Only onedata type will be graphed at a time.
To select the data to be plotted, click the Graph MultipleRecords button to bring up the Select Blaze Files dialog box.
FIGURE 2-144 Select Files Dialog
Highlight the files from which records will be selected forplotting and press Open. This will present the “SelectRecords to Graph” dialog box listing the records savedunder the first of the selected files.
2-104 The Statistics Graph SPARK and BLAZE User Manual
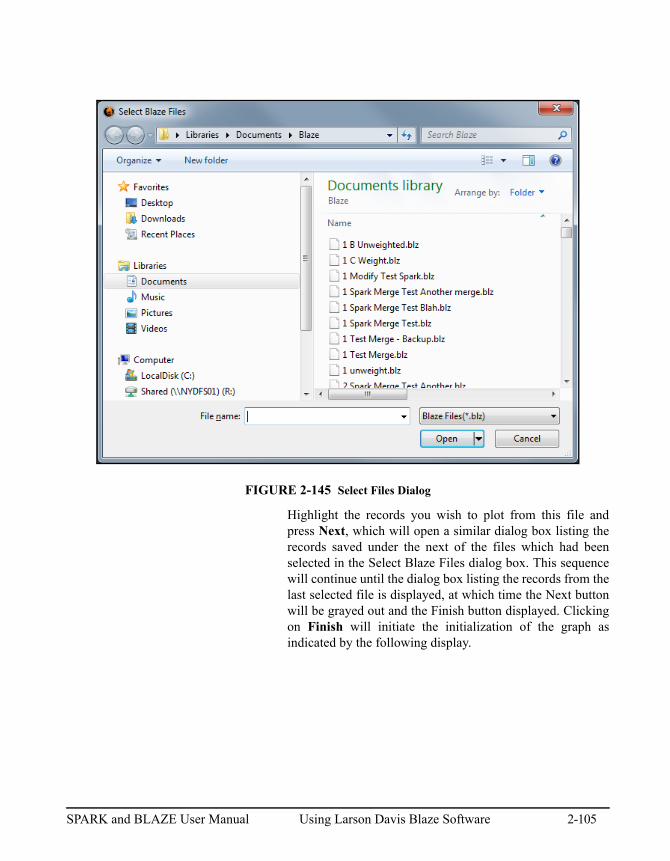
FIGURE 2-145 Select Files Dialog
Highlight the records you wish to plot from this file andpress Next, which will open a similar dialog box listing therecords saved under the next of the files which had beenselected in the Select Blaze Files dialog box. This sequencewill continue until the dialog box listing the records from thelast selected file is displayed, at which time the Next buttonwill be grayed out and the Finish button displayed. Clickingon Finish will initiate the initialization of the graph asindicated by the following display.
SPARK and BLAZE User Manual Using Larson Davis Blaze Software 2-105
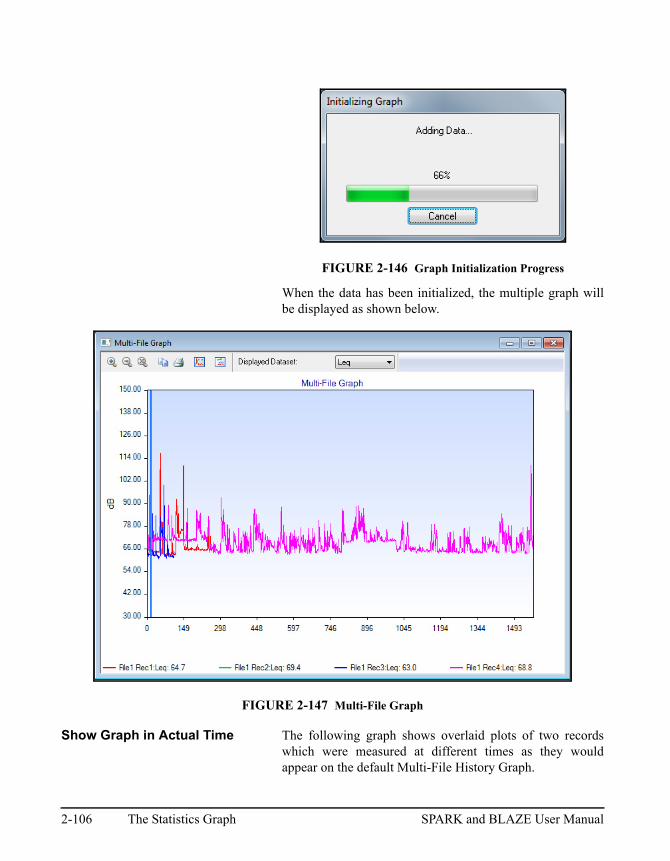
FIGURE 2-146 Graph Initialization Progress
When the data has been initialized, the multiple graph willbe displayed as shown below.
FIGURE 2-147 Multi-File Graph
Show Graph in Actual Time The following graph shows overlaid plots of two recordswhich were measured at different times as they wouldappear on the default Multi-File History Graph.
2-106 The Statistics Graph SPARK and BLAZE User Manual
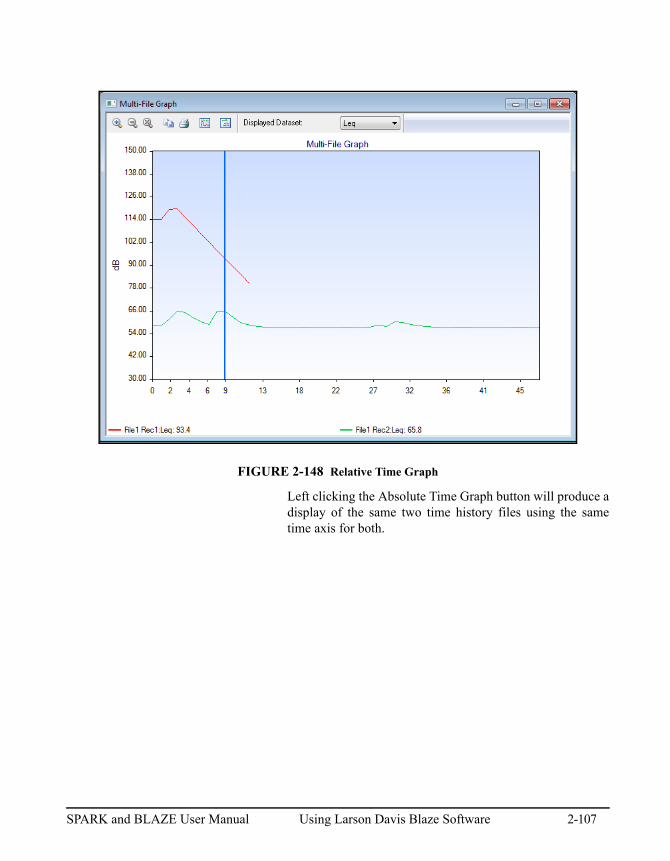
FIGURE 2-148 Relative Time Graph
Left clicking the Absolute Time Graph button will produce adisplay of the same two time history files using the sametime axis for both.
SPARK and BLAZE User Manual Using Larson Davis Blaze Software 2-107
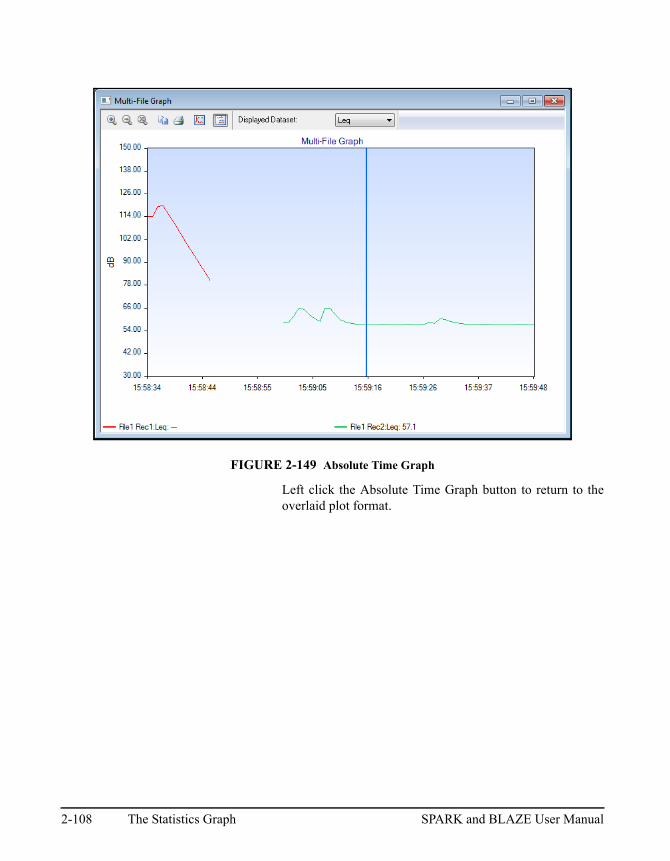
FIGURE 2-149 Absolute Time Graph
Left click the Absolute Time Graph button to return to theoverlaid plot format.
2-108 The Statistics Graph SPARK and BLAZE User Manual
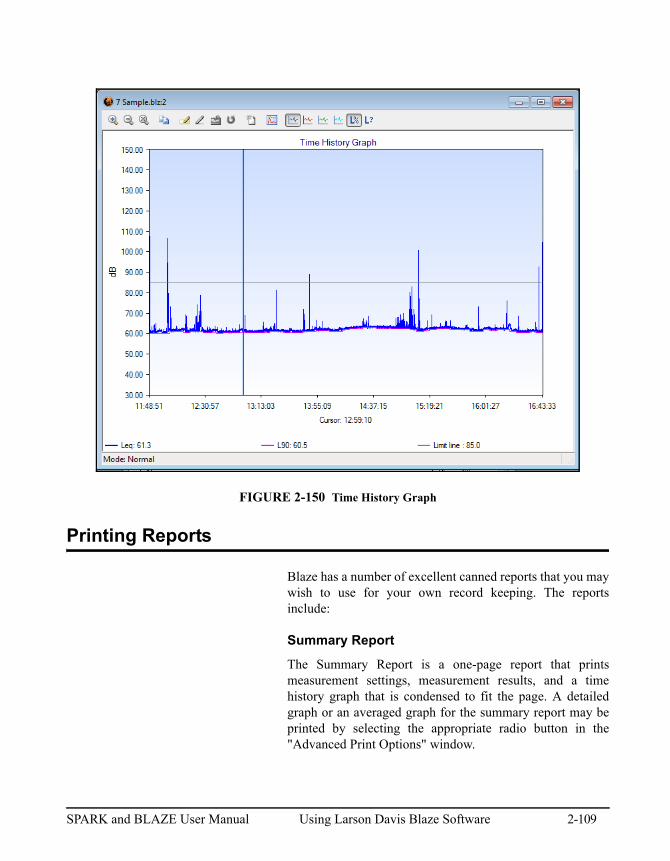
FIGURE 2-150 Time History Graph
Printing Reports
Blaze has a number of excellent canned reports that you maywish to use for your own record keeping. The reportsinclude:
Summary Report
The Summary Report is a one-page report that printsmeasurement settings, measurement results, and a timehistory graph that is condensed to fit the page. A detailedgraph or an averaged graph for the summary report may beprinted by selecting the appropriate radio button in the"Advanced Print Options" window.
SPARK and BLAZE User Manual Using Larson Davis Blaze Software 2-109
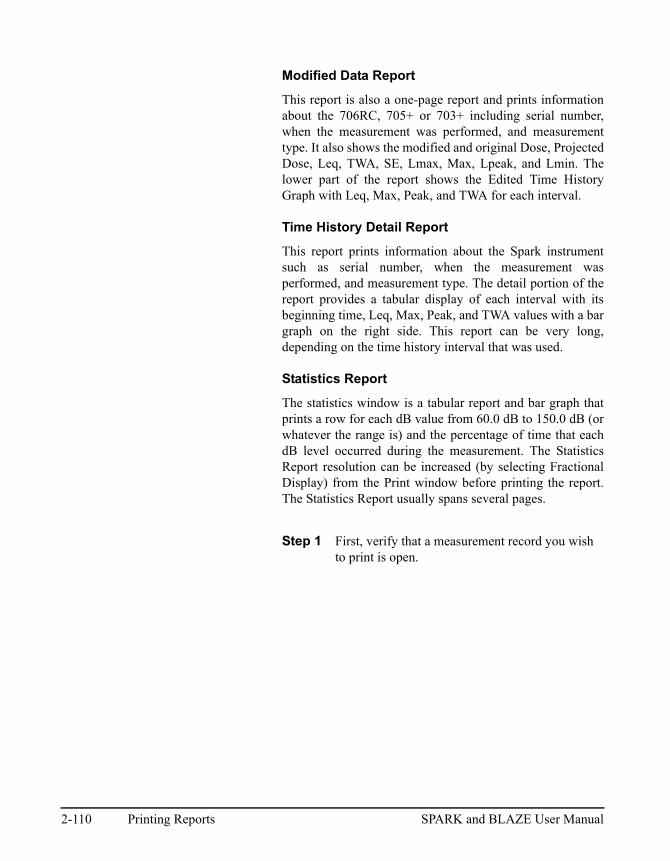
Modified Data Report
This report is also a one-page report and prints informationabout the 706RC, 705+ or 703+ including serial number,when the measurement was performed, and measurementtype. It also shows the modified and original Dose, ProjectedDose, Leq, TWA, SE, Lmax, Max, Lpeak, and Lmin. Thelower part of the report shows the Edited Time HistoryGraph with Leq, Max, Peak, and TWA for each interval.
Time History Detail Report
This report prints information about the Spark instrumentsuch as serial number, when the measurement wasperformed, and measurement type. The detail portion of thereport provides a tabular display of each interval with itsbeginning time, Leq, Max, Peak, and TWA values with a bargraph on the right side. This report can be very long,depending on the time history interval that was used.
Statistics Report
The statistics window is a tabular report and bar graph thatprints a row for each dB value from 60.0 dB to 150.0 dB (orwhatever the range is) and the percentage of time that eachdB level occurred during the measurement. The StatisticsReport resolution can be increased (by selecting FractionalDisplay) from the Print window before printing the report.The Statistics Report usually spans several pages.
Step 1 First, verify that a measurement record you wish to print is open.
2-110 Printing Reports SPARK and BLAZE User Manual
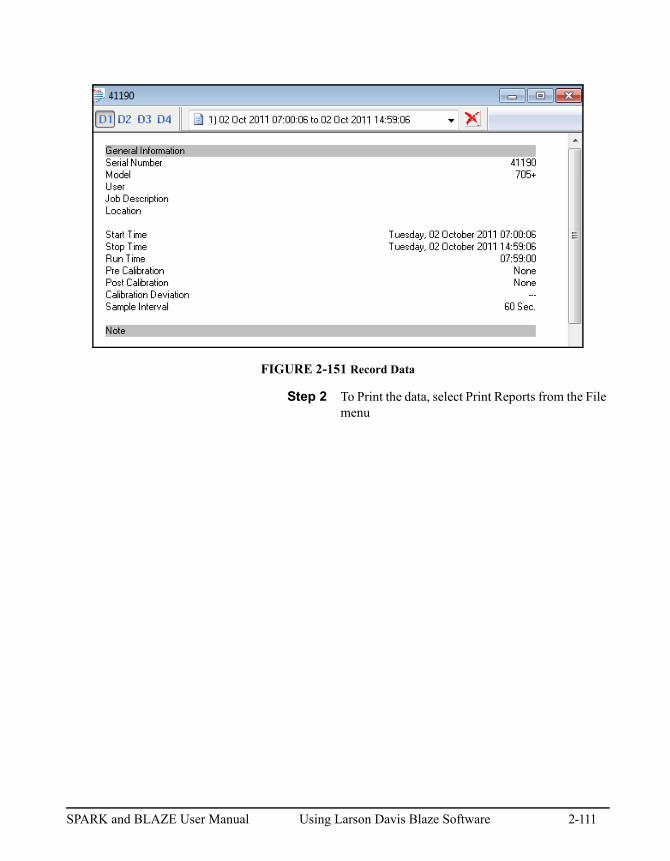
FIGURE 2-151 Record Data
Step 2 To Print the data, select Print Reports from the File menu
SPARK and BLAZE User Manual Using Larson Davis Blaze Software 2-111
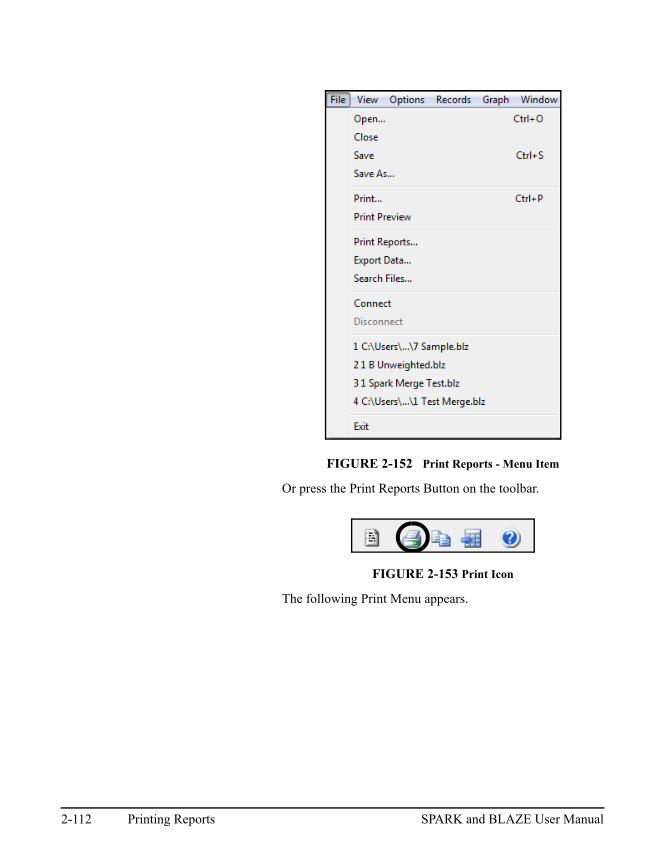
FIGURE 2-152 Print Reports - Menu Item
Or press the Print Reports Button on the toolbar.
FIGURE 2-153 Print Icon
The following Print Menu appears.
2-112 Printing Reports SPARK and BLAZE User Manual
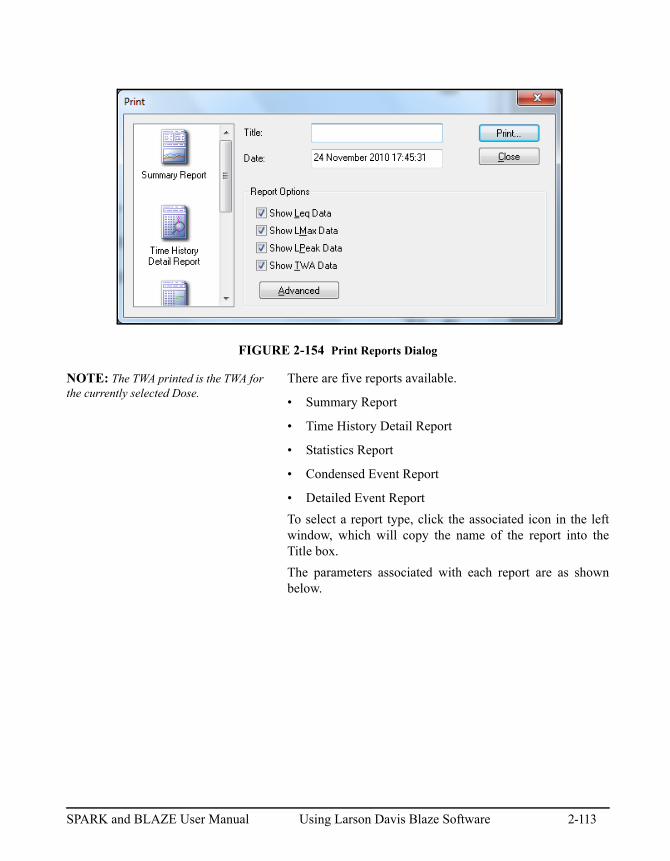
FIGURE 2-154 Print Reports Dialog
NOTE: The TWA printed is the TWA forthe currently selected Dose.
There are five reports available.
• Summary Report
• Time History Detail Report
• Statistics Report
• Condensed Event Report
• Detailed Event Report
To select a report type, click the associated icon in the leftwindow, which will copy the name of the report into theTitle box.
The parameters associated with each report are as shownbelow.
SPARK and BLAZE User Manual Using Larson Davis Blaze Software 2-113
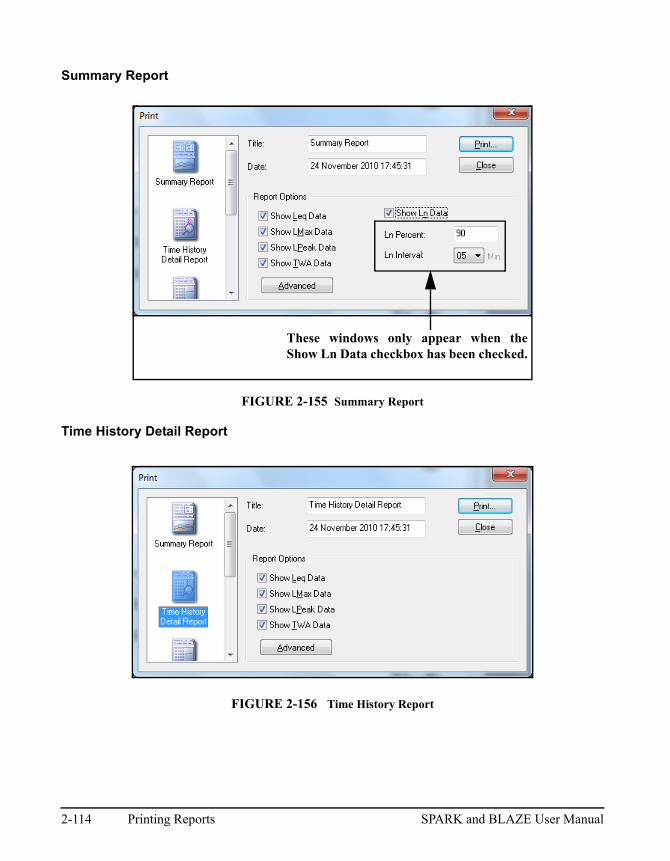
Summary Report
FIGURE 2-155 Summary Report
Time History Detail Report
FIGURE 2-156 Time History Report
These windows only appear when theShow Ln Data checkbox has been checked.
2-114 Printing Reports SPARK and BLAZE User Manual
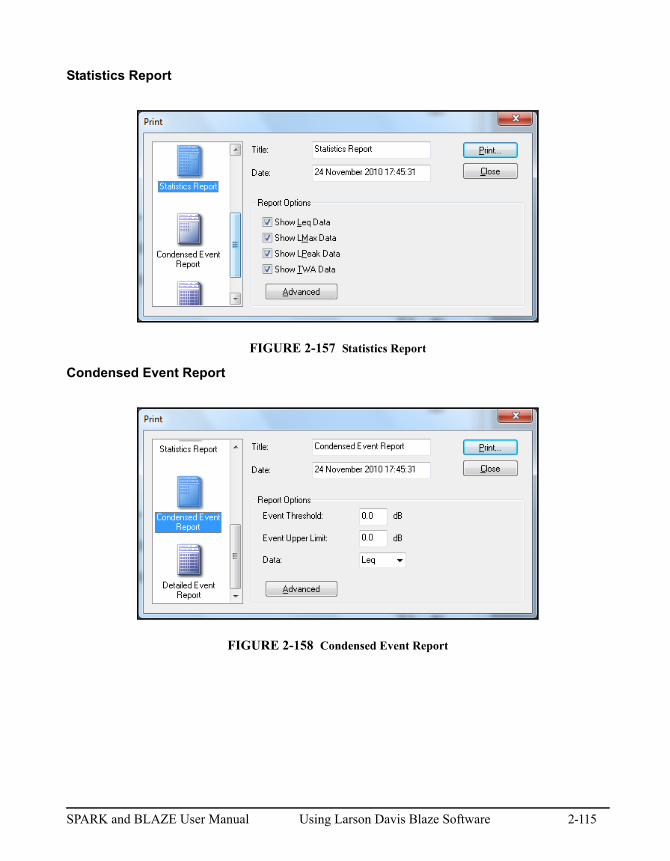
Statistics Report
FIGURE 2-157 Statistics Report
Condensed Event Report
FIGURE 2-158 Condensed Event Report
SPARK and BLAZE User Manual Using Larson Davis Blaze Software 2-115
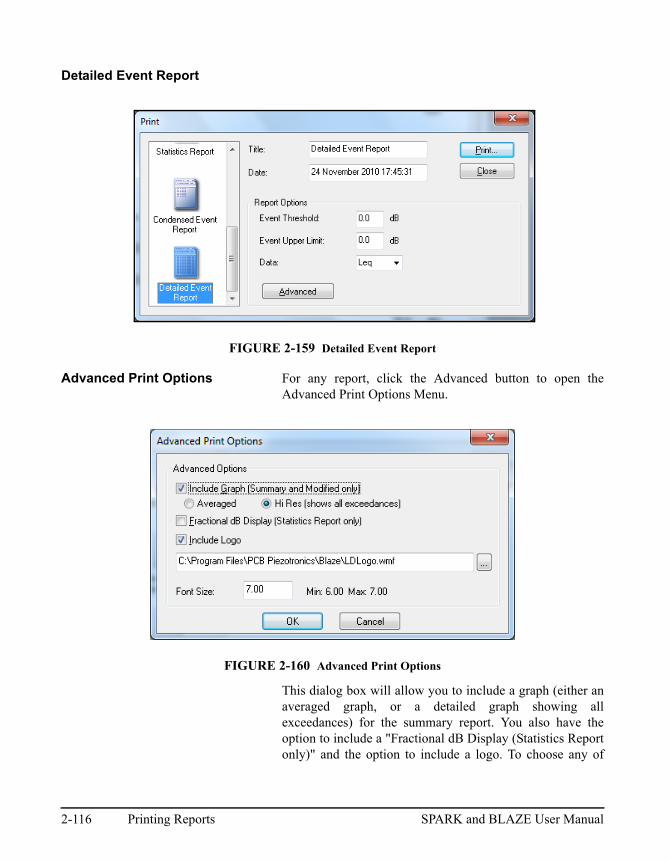
Detailed Event Report
FIGURE 2-159 Detailed Event Report
Advanced Print Options For any report, click the Advanced button to open theAdvanced Print Options Menu.
FIGURE 2-160 Advanced Print Options
This dialog box will allow you to include a graph (either anaveraged graph, or a detailed graph showing allexceedances) for the summary report. You also have theoption to include a "Fractional dB Display (Statistics Reportonly)" and the option to include a logo. To choose any of
2-116 Printing Reports SPARK and BLAZE User Manual
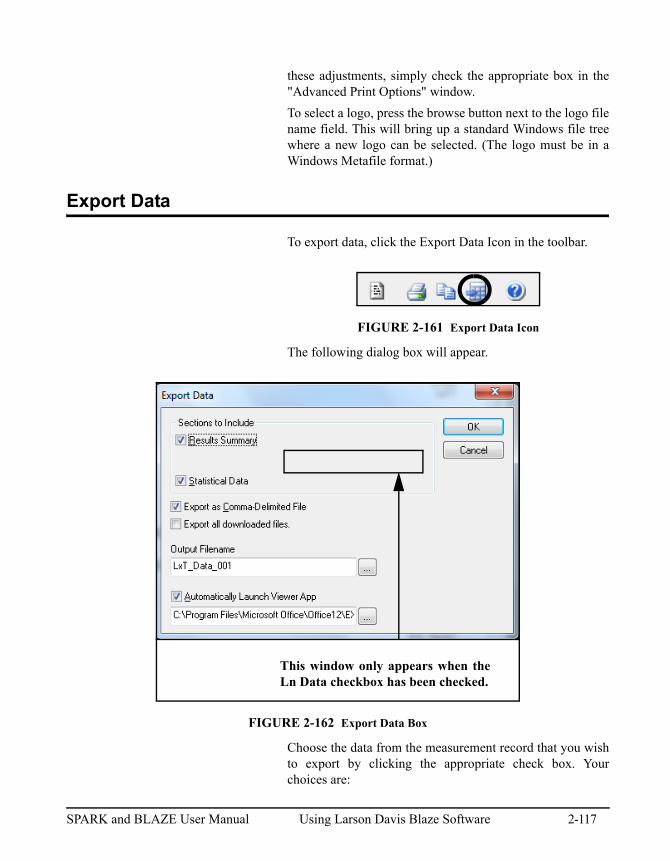
these adjustments, simply check the appropriate box in the"Advanced Print Options" window.
To select a logo, press the browse button next to the logo filename field. This will bring up a standard Windows file treewhere a new logo can be selected. (The logo must be in aWindows Metafile format.)
Export Data
To export data, click the Export Data Icon in the toolbar.
FIGURE 2-161 Export Data Icon
The following dialog box will appear.
FIGURE 2-162 Export Data Box
Choose the data from the measurement record that you wishto export by clicking the appropriate check box. Yourchoices are:
This window only appears when theLn Data checkbox has been checked.
SPARK and BLAZE User Manual Using Larson Davis Blaze Software 2-117
• Results Summary
• Time History Data
• Statistical Data
• Ln Data
You can create an easily parsed text file by clicking the"Export as a Comma-Delimited File" check box.
Placing a check in the "Export all downloaded files" checkbox will export all downloaded files to separate .csv or .txtfiles at the same time. Using the file name assigned below inthe program will append _001, _002, etc. sequentially toeach of the exported files.
To choose the name of the text file you wish to create, andthe location where you require to be it stored.
To choose the name of the text file you wish to create, andthe location where you require to be it stored, click on theOutput Filename selection box, input a path to the desiredfilename and click Save
Ln Data Export
When exporting Ln data, Blaze uses the L percentile valuesset in the "Set Parameters" dialog box described in SummaryReport Display on page 2-97. To export the Ln data, checkthe "Show Ln Data" box as shown below and select thedesired Ln time interval from the "Ln Interval" drop list. Theexport file will list the date, time and five L values at eachselected interval.
Searching the Blaze Database
Blaze incorporates a powerful search function which willallow you to search through saved Data Records on specificitems.
Select the Query Files button from the Tool bar.
FIGURE 2-163 Query Files Icon
2-118 Searching the Blaze Database SPARK and BLAZE User Manual
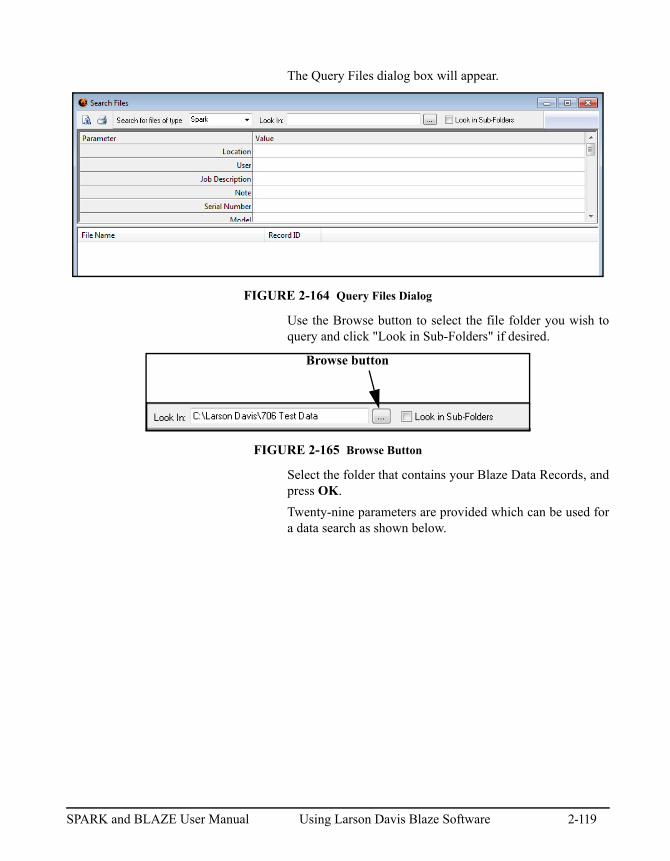
The Query Files dialog box will appear.
FIGURE 2-164 Query Files Dialog
Use the Browse button to select the file folder you wish toquery and click "Look in Sub-Folders" if desired.
FIGURE 2-165 Browse Button
Select the folder that contains your Blaze Data Records, andpress OK.
Twenty-nine parameters are provided which can be used fora data search as shown below.
Browse button
SPARK and BLAZE User Manual Using Larson Davis Blaze Software 2-119
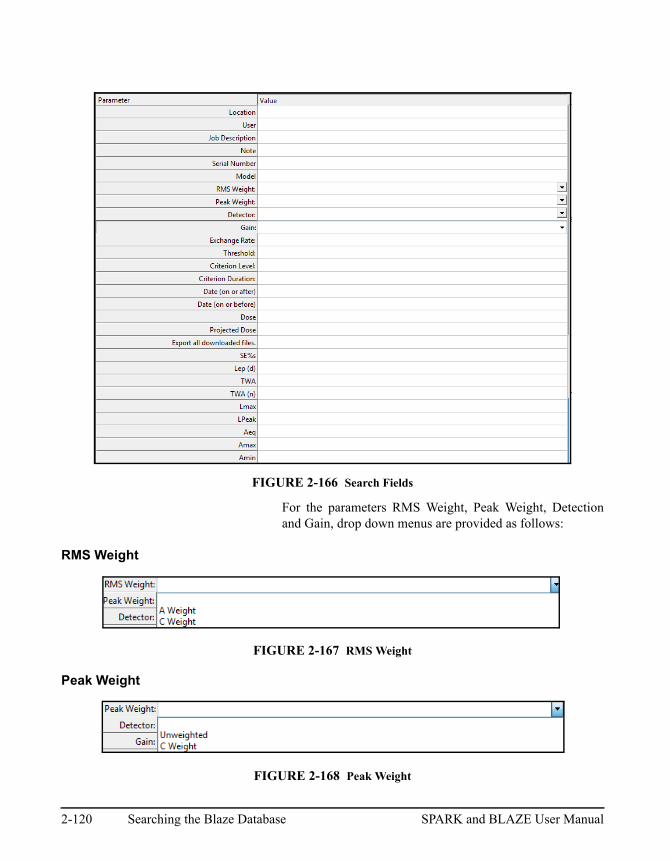
FIGURE 2-166 Search Fields
For the parameters RMS Weight, Peak Weight, Detectionand Gain, drop down menus are provided as follows:
RMS Weight
FIGURE 2-167 RMS Weight
Peak Weight
FIGURE 2-168 Peak Weight
2-120 Searching the Blaze Database SPARK and BLAZE User Manual
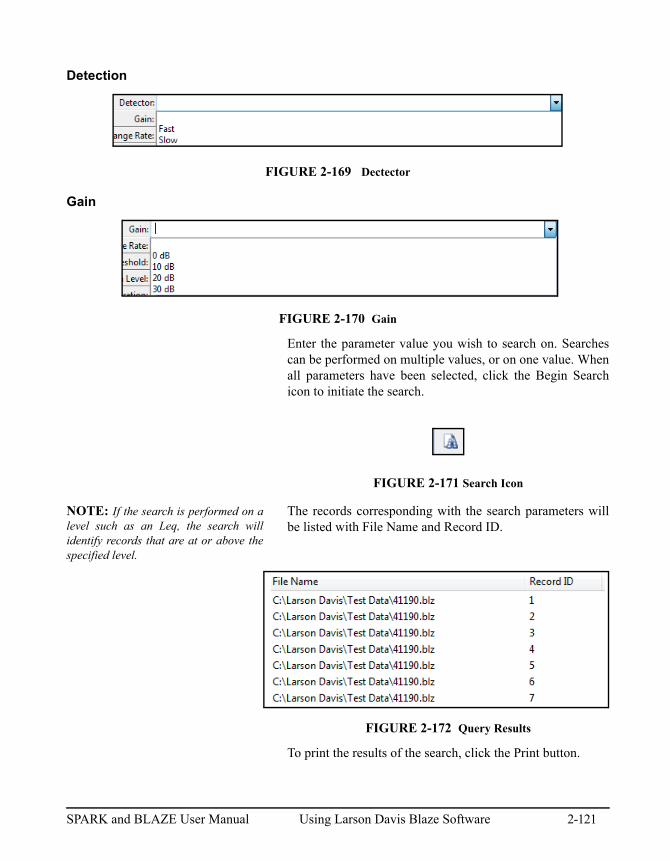
Detection
FIGURE 2-169 Dectector
Gain
FIGURE 2-170 Gain
Enter the parameter value you wish to search on. Searchescan be performed on multiple values, or on one value. Whenall parameters have been selected, click the Begin Searchicon to initiate the search.
FIGURE 2-171 Search Icon
NOTE: If the search is performed on alevel such as an Leq, the search willidentify records that are at or above thespecified level.
The records corresponding with the search parameters willbe listed with File Name and Record ID.
FIGURE 2-172 Query Results
To print the results of the search, click the Print button.
SPARK and BLAZE User Manual Using Larson Davis Blaze Software 2-121
FIGURE 2-173 Print Icon
Double click an any record to display it.
Troubleshooting Download Problems
A situation can occur in which the instrument connects tothe Blaze software, but the download process fails, indicatedby the message "The file could not be downloaded. Checkthe battery and the connection and try again". There mightalso be a message "restore the connection" with acountdown.
Note: All stored data is in non-volatile memory and will be safewhile the batteries are changed.
If this occurs, replace the batteries with fresh new batteries.Often times the batteries will have just enough energy toallow the unit to run fine, and connect to Blaze, but there isnot enough to allow the download process.
Also, it is often the case that the energy capacity in NiCd andNiMH batteries will degrade over time. If NiCd or NiMHbatteries are being used and this problem occurs, try newlypurchased NiCd or NiMH batteries, or temporarily installalkaline batteries for the download instead.
Temporary Workaround A temporary workaround is as follows:
Step 1 Connect the Spark unit to the Blaze software.
Step 2 Locate the GENERAL SETTING tab of the SPARK INSTRUMENT MANAGER box.
Step 3 Change BATTERY TYPE from NiCd or NiMH to ALKALINE.
Step 4 Click on the CONFIGURE INSTRUMENT button.
Step 5 Perform download.
Step 6 set BATTERY TYPE back to whatever it had been previously.
2-122 Searching the Blaze Database SPARK and BLAZE User Manual
Step 7 click on the CONFIGURE INSTRUMENT button.
SPARK and BLAZE User Manual Using Larson Davis Blaze Software 2-123

2-124 Searching the Blaze Database SPARK and BLAZE User Manual
C H A P T E R
3 Manual Operation of the Spark706RC
Spark 706RC – Quick Reference
Congratulations! You now have your hands on the mostpowerful, smartest noise dosimeter available. It is also oneof the smallest and lightest. We at Larson Davis thank youfor your purchase of the Spark 706RC, and trust you willreceive many years of good service from it. This section hasbeen developed to guide you through the operation of the706RC, independent of the Blaze software.
Overview
This manual is best used with the instrument at your side.You will be guided through a step-by-step tour of the Spark706RC. The appropriate keypad button will be shown on thepage. The resultant 706RC display will then be presented toverify that you have performed the correct action.
You will likely find the user interface of the Spark 706RC tobe intuitive. This section is intended to give you a tour of the706RC’s capabilities, and insights to its operation. You willnavigate through the 706RC’s simple interface and makemeasurements immediately. You may find that it will also beuseful to refer to this guide when trying something new withthe 706RC.
SPARK and BLAZE User Manual Manual Operation of the Spark 706RC 3-1
User Interface
Navigation within the 706RC display is achieved using thekeypad. The keypad allows the user to maneuver through the706RC’s simple menu structure, change settings, and viewdata.
Keypad Functions
The keypad functions are as follows:
v – this key is used to power the 706RC on or off.
s – this is the RUN/STOP key. It initiates or ends ameasurement
You will not lose any data whendoing a RESET.
R – the RESET key performs a reset of the currentmeasurement. The measurement screen will clear and a newmeasurement can be acquired. RESET is also used to exitfrom menus/screens.
T – the TOOLS key is used to access various systemfunctions of the 706RC such as calibration, setting the706RC locking feature, changing the instrument setup,viewing the available memory, viewing the firmwareversion, viewing battery capacity, viewing the timers, andadjusting the contrast of the display.
The arrow keys: l,r,u,d, provide a variety ofdifferent navigation operations within the 706RC operatingsystem. This includes maneuvering through menus anddisplays. Typically, the up and down arrows move the userup and down through displays and menus. The up and downarrow are also used to navigate through menu choices. Theleft and right arrows move the user from one related screento another.
c – The check key is used to select an option or choicefrom a 706RC menu.
3-2 User Interface SPARK and BLAZE User Manual
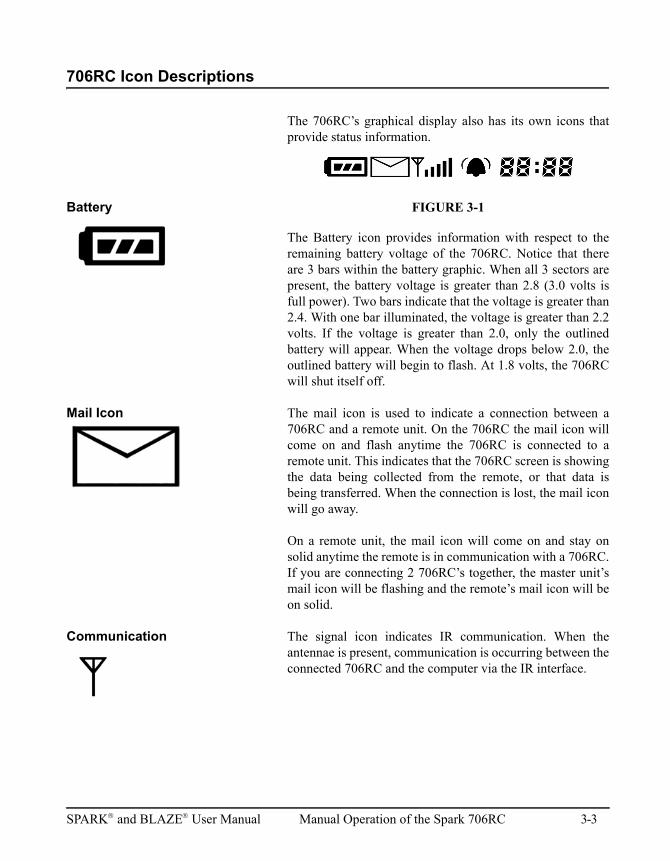
706RC Icon Descriptions
The 706RC’s graphical display also has its own icons thatprovide status information.
Battery FIGURE 3-1
The Battery icon provides information with respect to theremaining battery voltage of the 706RC. Notice that thereare 3 bars within the battery graphic. When all 3 sectors arepresent, the battery voltage is greater than 2.8 (3.0 volts isfull power). Two bars indicate that the voltage is greater than2.4. With one bar illuminated, the voltage is greater than 2.2volts. If the voltage is greater than 2.0, only the outlinedbattery will appear. When the voltage drops below 2.0, theoutlined battery will begin to flash. At 1.8 volts, the 706RCwill shut itself off.
Mail Icon The mail icon is used to indicate a connection between a706RC and a remote unit. On the 706RC the mail icon willcome on and flash anytime the 706RC is connected to aremote unit. This indicates that the 706RC screen is showingthe data being collected from the remote, or that data isbeing transferred. When the connection is lost, the mail iconwill go away.
On a remote unit, the mail icon will come on and stay onsolid anytime the remote is in communication with a 706RC.If you are connecting 2 706RC’s together, the master unit’smail icon will be flashing and the remote’s mail icon will beon solid.
Communication The signal icon indicates IR communication. When theantennae is present, communication is occurring between theconnected 706RC and the computer via the IR interface.
SPARK and BLAZE User Manual Manual Operation of the Spark 706RC 3-3
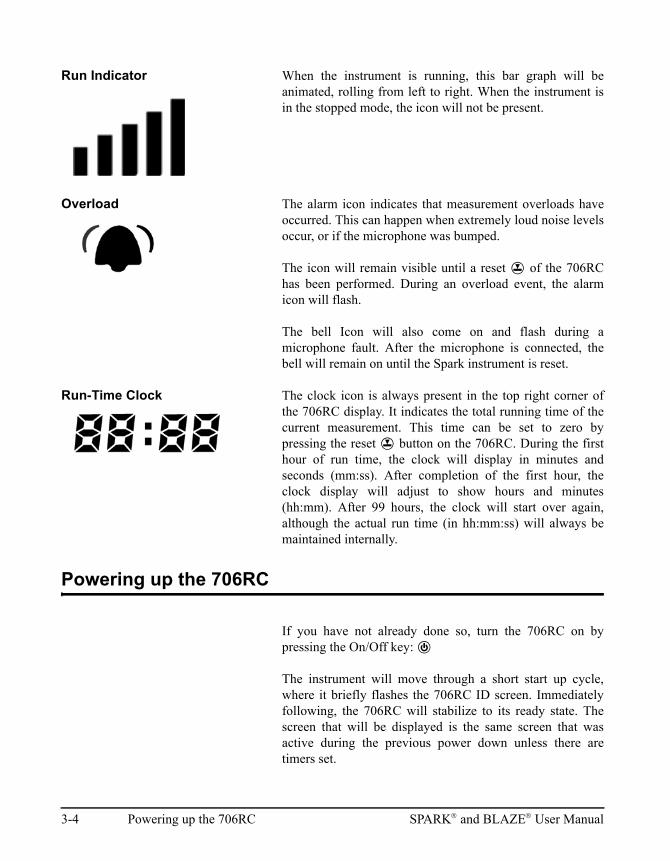
Run Indicator When the instrument is running, this bar graph will beanimated, rolling from left to right. When the instrument isin the stopped mode, the icon will not be present.
Overload The alarm icon indicates that measurement overloads haveoccurred. This can happen when extremely loud noise levelsoccur, or if the microphone was bumped.
The icon will remain visible until a reset R of the 706RChas been performed. During an overload event, the alarmicon will flash.
The bell Icon will also come on and flash during amicrophone fault. After the microphone is connected, thebell will remain on until the Spark instrument is reset.
Run-Time Clock The clock icon is always present in the top right corner ofthe 706RC display. It indicates the total running time of thecurrent measurement. This time can be set to zero bypressing the reset R button on the 706RC. During the firsthour of run time, the clock will display in minutes andseconds (mm:ss). After completion of the first hour, theclock display will adjust to show hours and minutes(hh:mm). After 99 hours, the clock will start over again,although the actual run time (in hh:mm:ss) will always bemaintained internally.
Powering up the 706RC
If you have not already done so, turn the 706RC on bypressing the On/Off key: v
The instrument will move through a short start up cycle,where it briefly flashes the 706RC ID screen. Immediatelyfollowing, the 706RC will stabilize to its ready state. Thescreen that will be displayed is the same screen that wasactive during the previous power down unless there aretimers set.
3-4 Powering up the 706RC SPARK and BLAZE User Manual
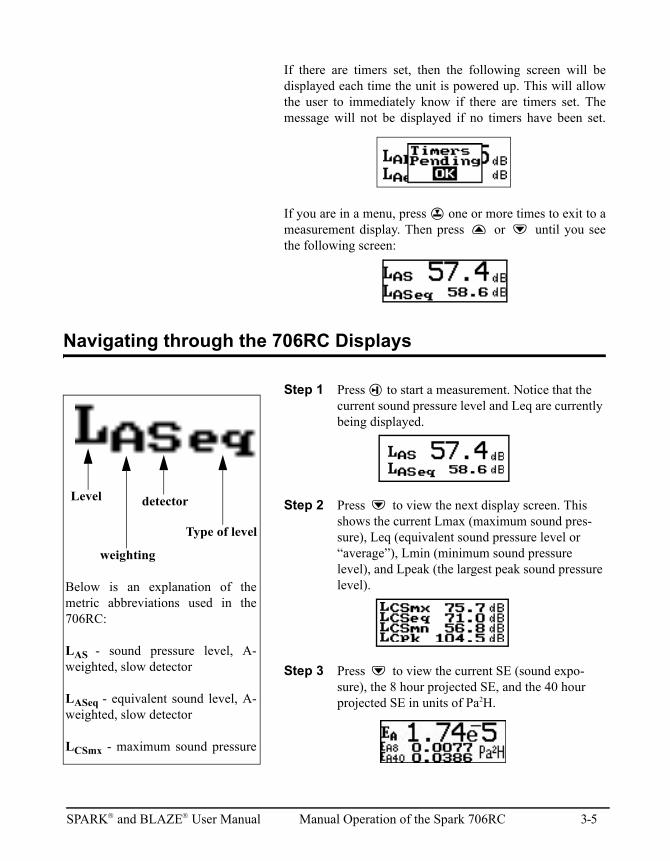
If there are timers set, then the following screen will bedisplayed each time the unit is powered up. This will allowthe user to immediately know if there are timers set. Themessage will not be displayed if no timers have been set.
If you are in a menu, press R one or more times to exit to ameasurement display. Then press u or d until you seethe following screen:
Navigating through the 706RC Displays
Step 1 Press s to start a measurement. Notice that the current sound pressure level and Leq are currently being displayed.
Step 2 Press d to view the next display screen. This shows the current Lmax (maximum sound pres-sure), Leq (equivalent sound pressure level or “average”), Lmin (minimum sound pressure level), and Lpeak (the largest peak sound pressure level).
Step 3 Press d to view the current SE (sound expo-sure), the 8 hour projected SE, and the 40 hour projected SE in units of Pa2H.
Below is an explanation of themetric abbreviations used in the706RC:
LAS - sound pressure level, A-weighted, slow detector
LASeq - equivalent sound level, A-weighted, slow detector
LCSmx - maximum sound pressure
Level
weighting
detector
Type of level
SPARK and BLAZE User Manual Manual Operation of the Spark 706RC 3-5
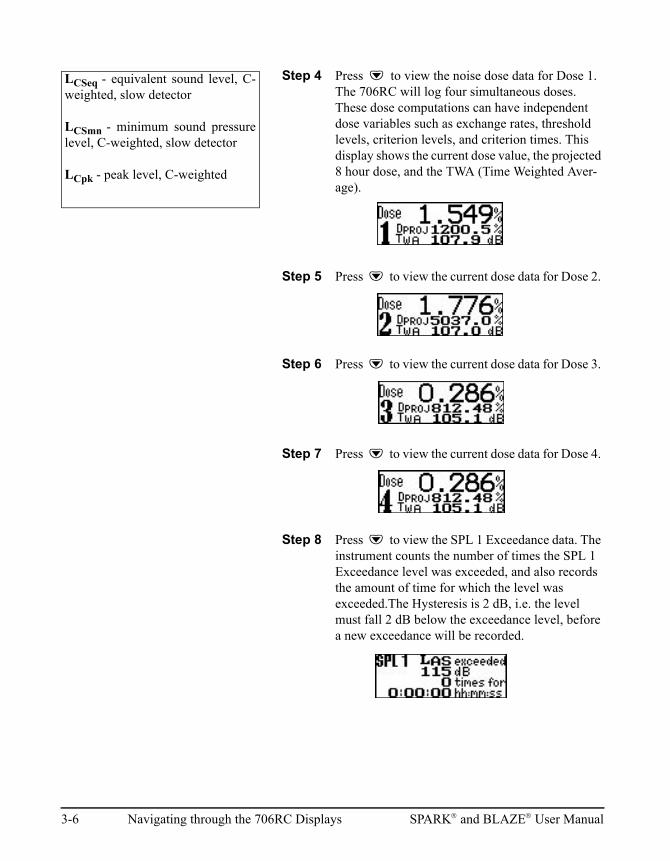
Step 4 Press d to view the noise dose data for Dose 1. The 706RC will log four simultaneous doses. These dose computations can have independent dose variables such as exchange rates, threshold levels, criterion levels, and criterion times. This display shows the current dose value, the projected 8 hour dose, and the TWA (Time Weighted Aver-age).
Step 5 Press d to view the current dose data for Dose 2.
Step 6 Press d to view the current dose data for Dose 3.
Step 7 Press d to view the current dose data for Dose 4.
Step 8 Press d to view the SPL 1 Exceedance data. The instrument counts the number of times the SPL 1 Exceedance level was exceeded, and also records the amount of time for which the level was exceeded.The Hysteresis is 2 dB, i.e. the level must fall 2 dB below the exceedance level, before a new exceedance will be recorded.
LCSeq - equivalent sound level, C-weighted, slow detector
LCSmn - minimum sound pressurelevel, C-weighted, slow detector
LCpk - peak level, C-weighted
3-6 Navigating through the 706RC Displays SPARK and BLAZE User Manual
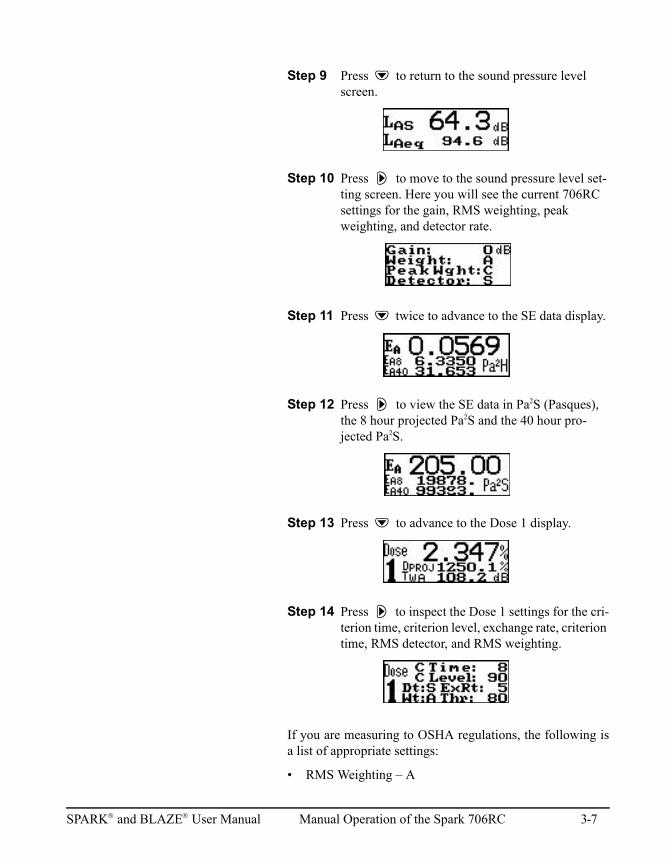
Step 9 Press d to return to the sound pressure level screen.
Step 10 Press r to move to the sound pressure level set-ting screen. Here you will see the current 706RC settings for the gain, RMS weighting, peak weighting, and detector rate.
Step 11 Press d twice to advance to the SE data display.
Step 12 Press r to view the SE data in Pa2S (Pasques), the 8 hour projected Pa2S and the 40 hour pro-jected Pa2S.
Step 13 Press d to advance to the Dose 1 display.
Step 14 Press r to inspect the Dose 1 settings for the cri-terion time, criterion level, exchange rate, criterion time, RMS detector, and RMS weighting.
If you are measuring to OSHA regulations, the following isa list of appropriate settings:
• RMS Weighting – A
SPARK and BLAZE User Manual Manual Operation of the Spark 706RC 3-7
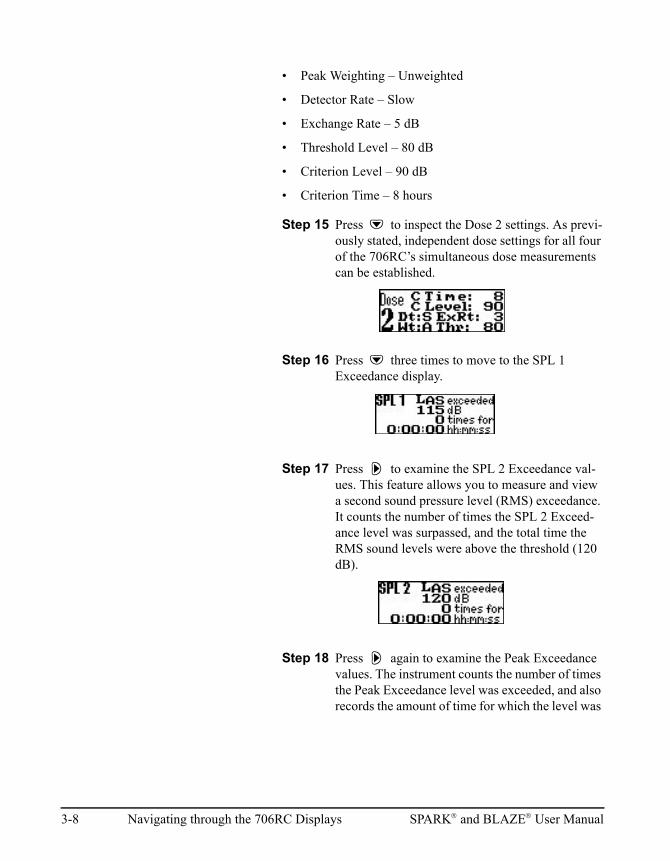
• Peak Weighting – Unweighted
• Detector Rate – Slow
• Exchange Rate – 5 dB
• Threshold Level – 80 dB
• Criterion Level – 90 dB
• Criterion Time – 8 hours
Step 15 Press d to inspect the Dose 2 settings. As previ-ously stated, independent dose settings for all four of the 706RC’s simultaneous dose measurements can be established.
Step 16 Press d three times to move to the SPL 1 Exceedance display.
Step 17 Press r to examine the SPL 2 Exceedance val-ues. This feature allows you to measure and view a second sound pressure level (RMS) exceedance. It counts the number of times the SPL 2 Exceed-ance level was surpassed, and the total time the RMS sound levels were above the threshold (120 dB).
Step 18 Press r again to examine the Peak Exceedance values. The instrument counts the number of times the Peak Exceedance level was exceeded, and also records the amount of time for which the level was
3-8 Navigating through the 706RC Displays SPARK and BLAZE User Manual
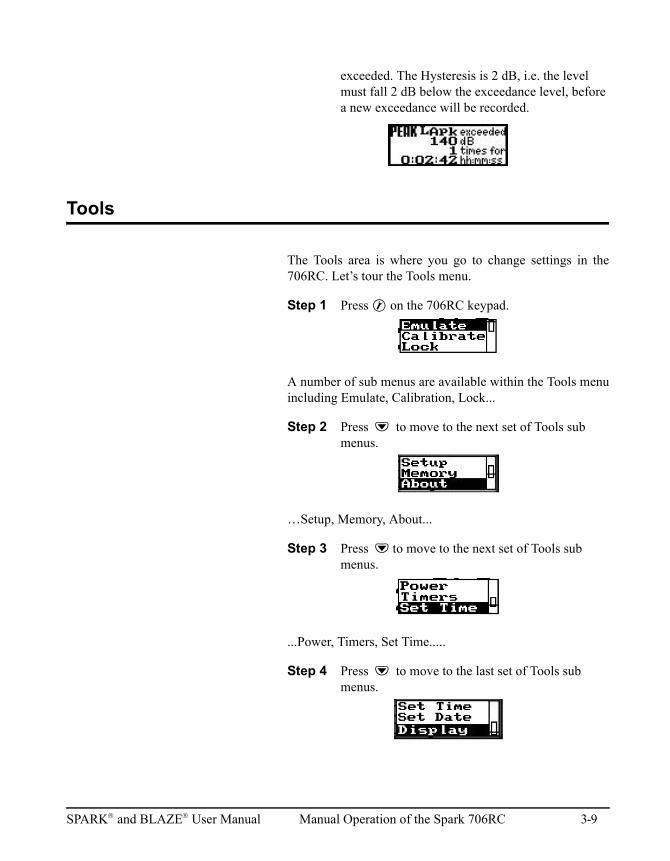
exceeded. The Hysteresis is 2 dB, i.e. the level must fall 2 dB below the exceedance level, before a new exceedance will be recorded.
Tools
The Tools area is where you go to change settings in the706RC. Let’s tour the Tools menu.
Step 1 Press T on the 706RC keypad.
A number of sub menus are available within the Tools menuincluding Emulate, Calibration, Lock...
Step 2 Press d to move to the next set of Tools sub menus.
…Setup, Memory, About...
Step 3 Press dto move to the next set of Tools sub menus.
...Power, Timers, Set Time.....
Step 4 Press d to move to the last set of Tools sub menus.
SPARK and BLAZE User Manual Manual Operation of the Spark 706RC 3-9
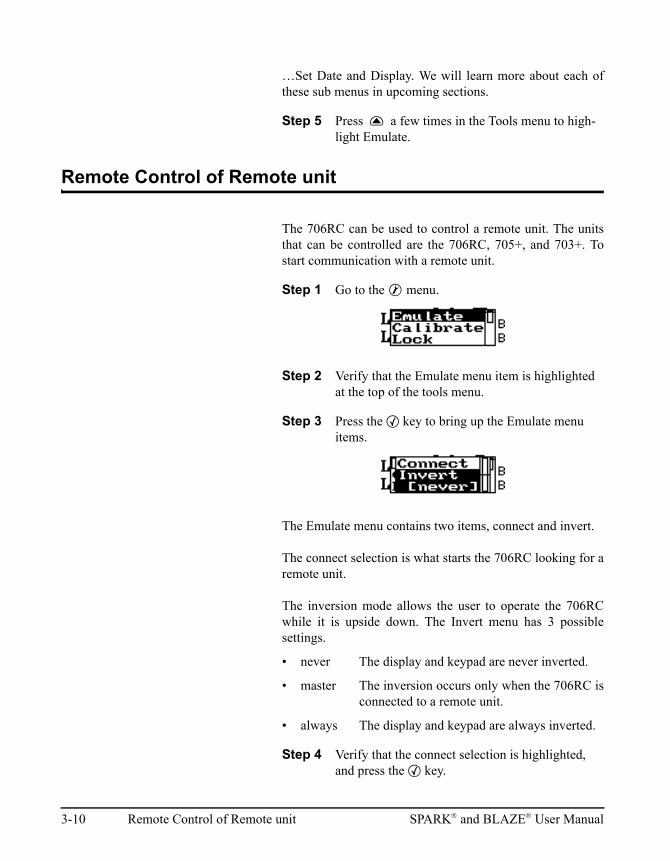
…Set Date and Display. We will learn more about each ofthese sub menus in upcoming sections.
Step 5 Press u a few times in the Tools menu to high-light Emulate.
Remote Control of Remote unit
The 706RC can be used to control a remote unit. The unitsthat can be controlled are the 706RC, 705+, and 703+. Tostart communication with a remote unit.
Step 1 Go to the T menu.
Step 2 Verify that the Emulate menu item is highlighted at the top of the tools menu.
Step 3 Press the c key to bring up the Emulate menu items.
The Emulate menu contains two items, connect and invert.
The connect selection is what starts the 706RC looking for aremote unit.
The inversion mode allows the user to operate the 706RCwhile it is upside down. The Invert menu has 3 possiblesettings.
• never The display and keypad are never inverted.
• master The inversion occurs only when the 706RC isconnected to a remote unit.
• always The display and keypad are always inverted.
Step 4 Verify that the connect selection is highlighted, and press the c key.
3-10 Remote Control of Remote unit SPARK and BLAZE User Manual
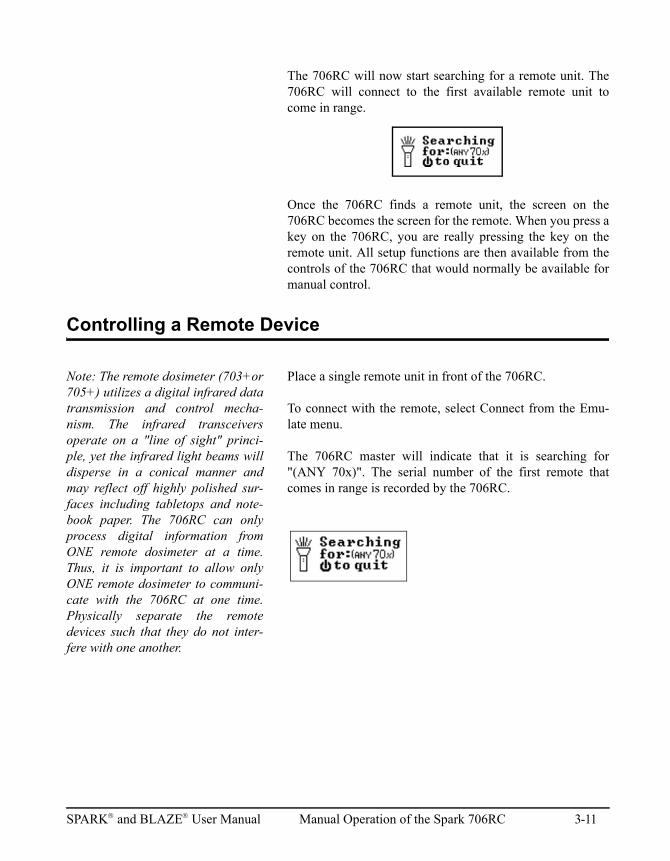
The 706RC will now start searching for a remote unit. The706RC will connect to the first available remote unit tocome in range.
Once the 706RC finds a remote unit, the screen on the706RC becomes the screen for the remote. When you press akey on the 706RC, you are really pressing the key on theremote unit. All setup functions are then available from thecontrols of the 706RC that would normally be available formanual control.
Controlling a Remote Device
Note: The remote dosimeter (703+or705+) utilizes a digital infrared datatransmission and control mecha-nism. The infrared transceiversoperate on a "line of sight" princi-ple, yet the infrared light beams willdisperse in a conical manner andmay reflect off highly polished sur-faces including tabletops and note-book paper. The 706RC can onlyprocess digital information fromONE remote dosimeter at a time.Thus, it is important to allow onlyONE remote dosimeter to communi-cate with the 706RC at one time.Physically separate the remotedevices such that they do not inter-fere with one another.
Place a single remote unit in front of the 706RC.
To connect with the remote, select Connect from the Emu-late menu.
The 706RC master will indicate that it is searching for"(ANY 70x)". The serial number of the first remote thatcomes in range is recorded by the 706RC.
SPARK and BLAZE User Manual Manual Operation of the Spark 706RC 3-11
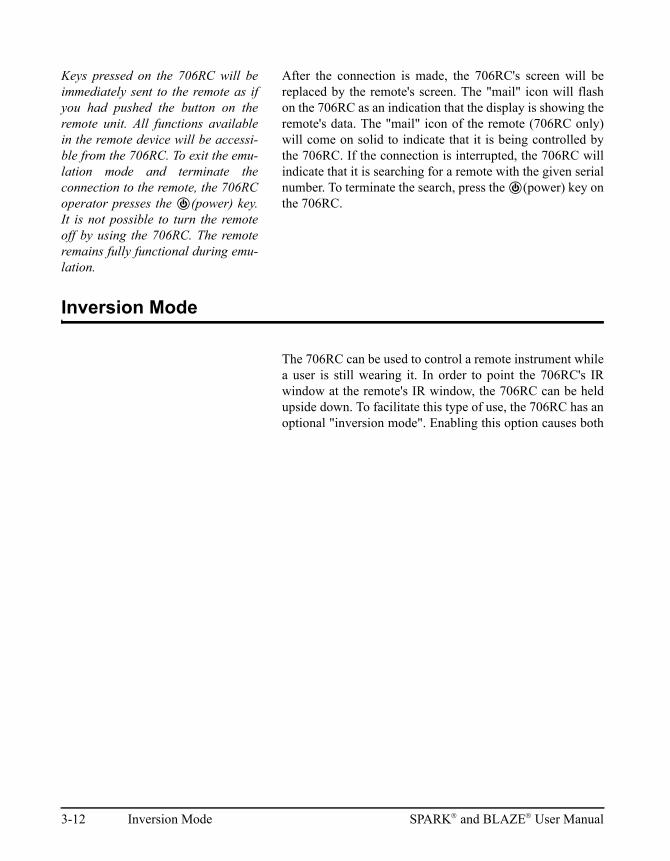
Keys pressed on the 706RC will beimmediately sent to the remote as ifyou had pushed the button on theremote unit. All functions availablein the remote device will be accessi-ble from the 706RC. To exit the emu-lation mode and terminate theconnection to the remote, the 706RCoperator presses the v(power) key.It is not possible to turn the remoteoff by using the 706RC. The remoteremains fully functional during emu-lation.
After the connection is made, the 706RC's screen will bereplaced by the remote's screen. The "mail" icon will flashon the 706RC as an indication that the display is showing theremote's data. The "mail" icon of the remote (706RC only)will come on solid to indicate that it is being controlled bythe 706RC. If the connection is interrupted, the 706RC willindicate that it is searching for a remote with the given serialnumber. To terminate the search, press the v(power) key onthe 706RC.
Inversion Mode
The 706RC can be used to control a remote instrument whilea user is still wearing it. In order to point the 706RC's IRwindow at the remote's IR window, the 706RC can be heldupside down. To facilitate this type of use, the 706RC has anoptional "inversion mode". Enabling this option causes both
3-12 Inversion Mode SPARK and BLAZE User Manual
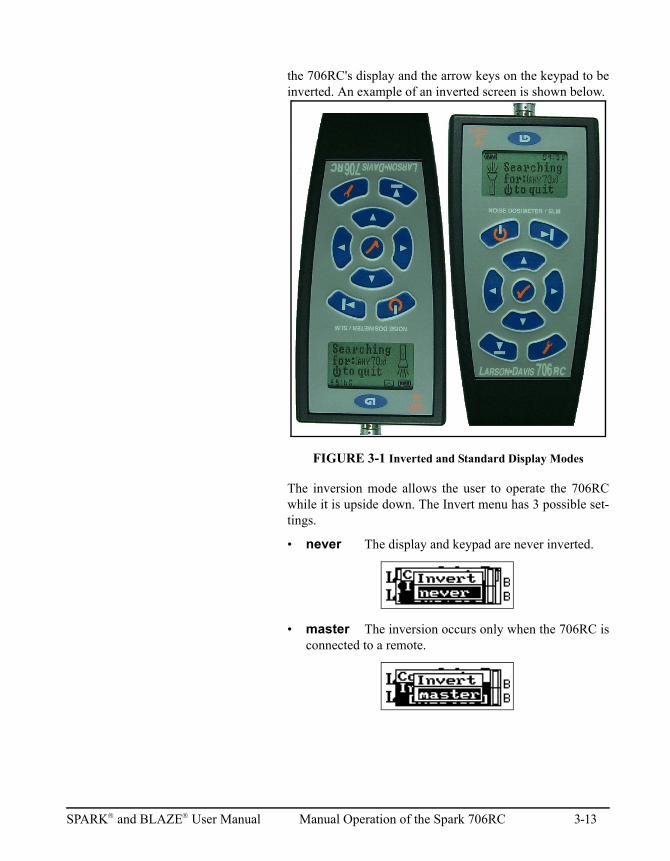
the 706RC's display and the arrow keys on the keypad to beinverted. An example of an inverted screen is shown below.
FIGURE 3-1 Inverted and Standard Display Modes
The inversion mode allows the user to operate the 706RCwhile it is upside down. The Invert menu has 3 possible set-tings.
• never The display and keypad are never inverted.
• master The inversion occurs only when the 706RC isconnected to a remote.
SPARK and BLAZE User Manual Manual Operation of the Spark 706RC 3-13
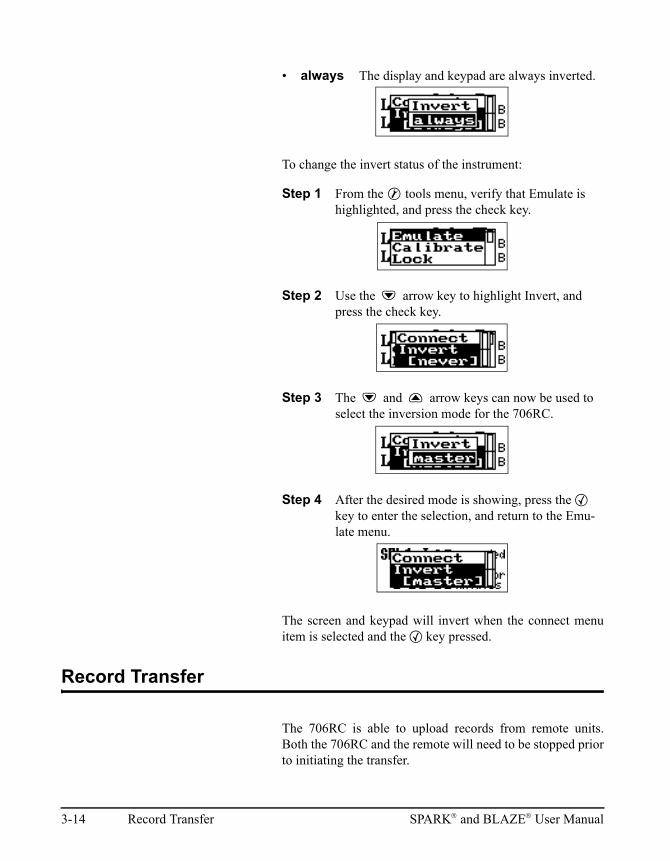
• always The display and keypad are always inverted.
To change the invert status of the instrument:
Step 1 From the T tools menu, verify that Emulate is highlighted, and press the check key.
Step 2 Use the d arrow key to highlight Invert, and press the check key.
Step 3 The d and u arrow keys can now be used to select the inversion mode for the 706RC.
Step 4 After the desired mode is showing, press the c key to enter the selection, and return to the Emu-late menu.
The screen and keypad will invert when the connect menuitem is selected and the c key pressed.
Record Transfer
The 706RC is able to upload records from remote units.Both the 706RC and the remote will need to be stopped priorto initiating the transfer.
3-14 Record Transfer SPARK and BLAZE User Manual
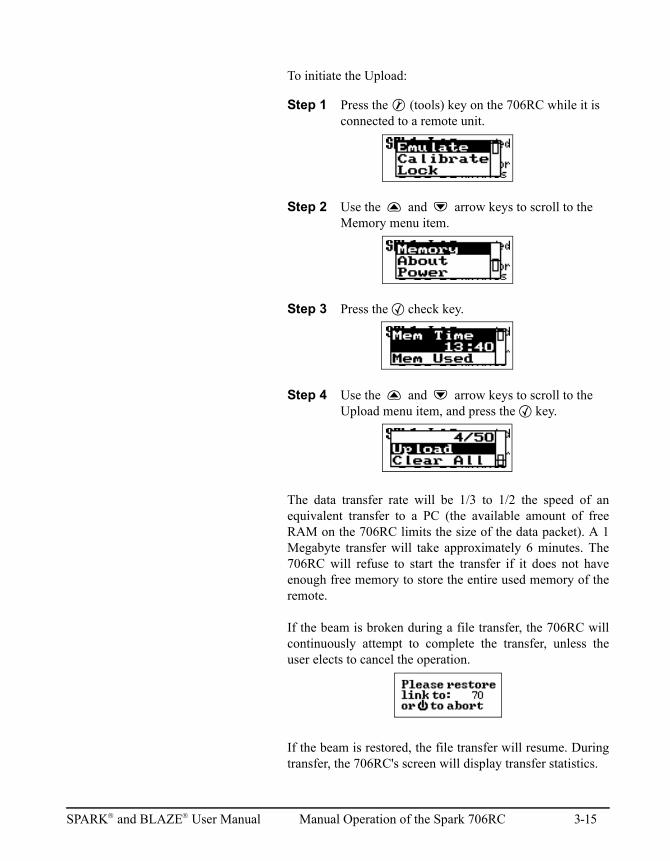
To initiate the Upload:
Step 1 Press the T (tools) key on the 706RC while it is connected to a remote unit.
Step 2 Use the u and d arrow keys to scroll to the Memory menu item.
Step 3 Press the c check key.
Step 4 Use the u and d arrow keys to scroll to the Upload menu item, and press the c key.
The data transfer rate will be 1/3 to 1/2 the speed of anequivalent transfer to a PC (the available amount of freeRAM on the 706RC limits the size of the data packet). A 1Megabyte transfer will take approximately 6 minutes. The706RC will refuse to start the transfer if it does not haveenough free memory to store the entire used memory of theremote.
If the beam is broken during a file transfer, the 706RC willcontinuously attempt to complete the transfer, unless theuser elects to cancel the operation.
If the beam is restored, the file transfer will resume. Duringtransfer, the 706RC's screen will display transfer statistics.
SPARK and BLAZE User Manual Manual Operation of the Spark 706RC 3-15
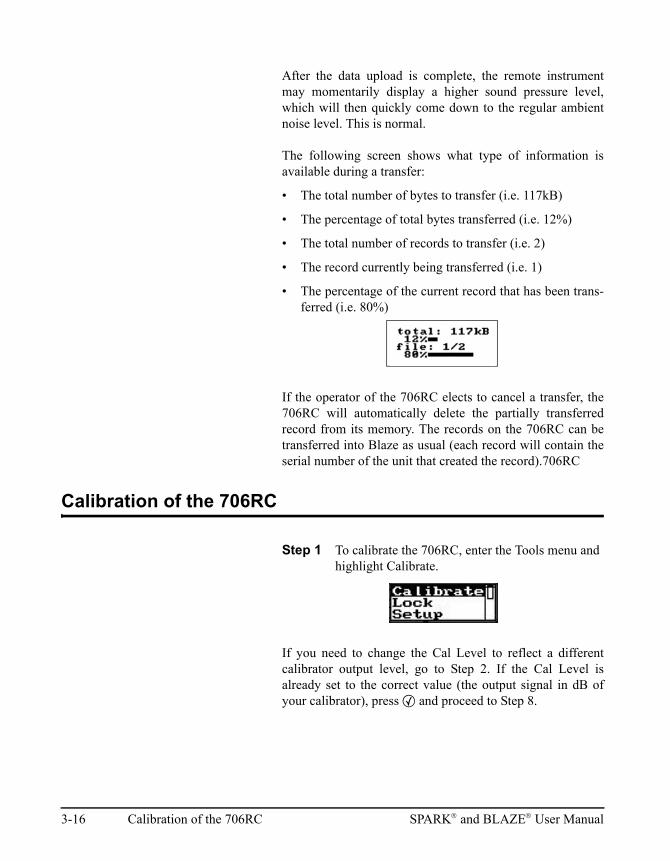
After the data upload is complete, the remote instrumentmay momentarily display a higher sound pressure level,which will then quickly come down to the regular ambientnoise level. This is normal.
The following screen shows what type of information isavailable during a transfer:
• The total number of bytes to transfer (i.e. 117kB)
• The percentage of total bytes transferred (i.e. 12%)
• The total number of records to transfer (i.e. 2)
• The record currently being transferred (i.e. 1)
• The percentage of the current record that has been trans-ferred (i.e. 80%)
If the operator of the 706RC elects to cancel a transfer, the706RC will automatically delete the partially transferredrecord from its memory. The records on the 706RC can betransferred into Blaze as usual (each record will contain theserial number of the unit that created the record).706RC
Calibration of the 706RC
Step 1 To calibrate the 706RC, enter the Tools menu and highlight Calibrate.
If you need to change the Cal Level to reflect a differentcalibrator output level, go to Step 2. If the Cal Level isalready set to the correct value (the output signal in dB ofyour calibrator), press c and proceed to Step 8.
3-16 Calibration of the 706RC SPARK and BLAZE User Manual
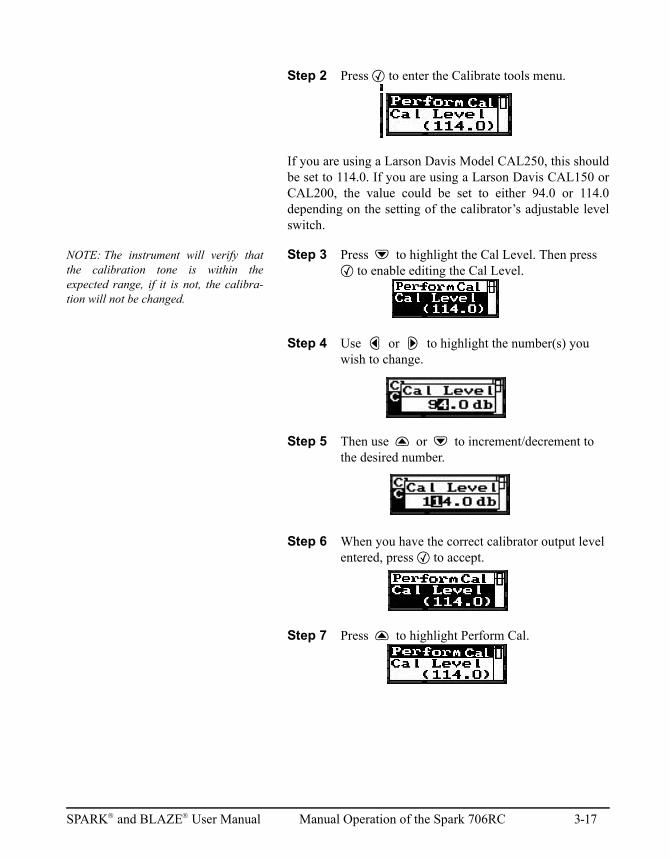
Step 2 Press c to enter the Calibrate tools menu.
If you are using a Larson Davis Model CAL250, this shouldbe set to 114.0. If you are using a Larson Davis CAL150 orCAL200, the value could be set to either 94.0 or 114.0depending on the setting of the calibrator’s adjustable levelswitch.
NOTE: The instrument will verify thatthe calibration tone is within theexpected range, if it is not, the calibra-tion will not be changed.
Step 3 Press d to highlight the Cal Level. Then press c to enable editing the Cal Level.
Step 4 Use l or r to highlight the number(s) you wish to change.
Step 5 Then use u or d to increment/decrement to the desired number.
Step 6 When you have the correct calibrator output level entered, press c to accept.
Step 7 Press u to highlight Perform Cal.
SPARK and BLAZE User Manual Manual Operation of the Spark 706RC 3-17
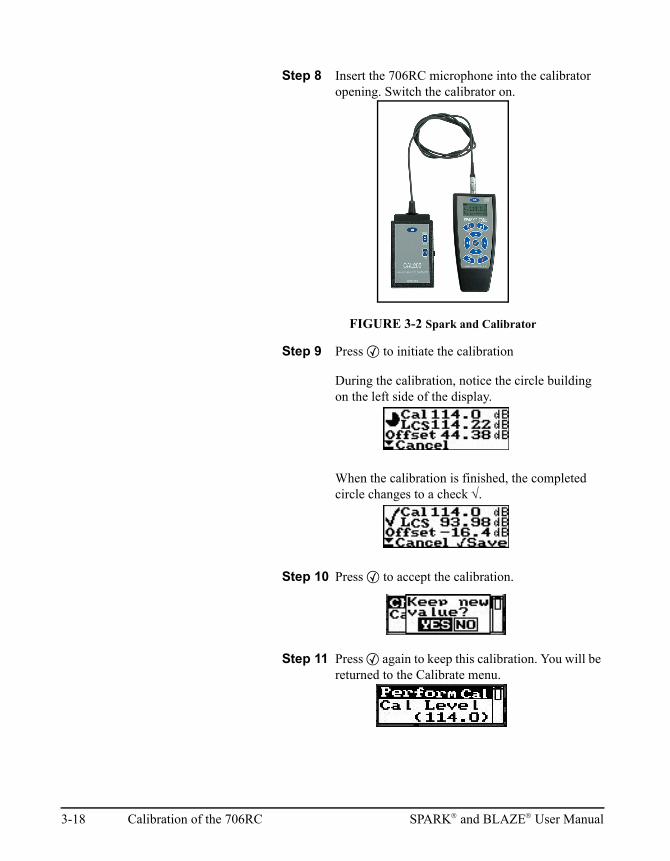
Step 8 Insert the 706RC microphone into the calibrator opening. Switch the calibrator on.
FIGURE 3-2 Spark and Calibrator
Step 9 Press c to initiate the calibration
During the calibration, notice the circle building on the left side of the display.
When the calibration is finished, the completed circle changes to a check .
Step 10 Press c to accept the calibration.
Step 11 Press c again to keep this calibration. You will be returned to the Calibrate menu.
3-18 Calibration of the 706RC SPARK and BLAZE User Manual
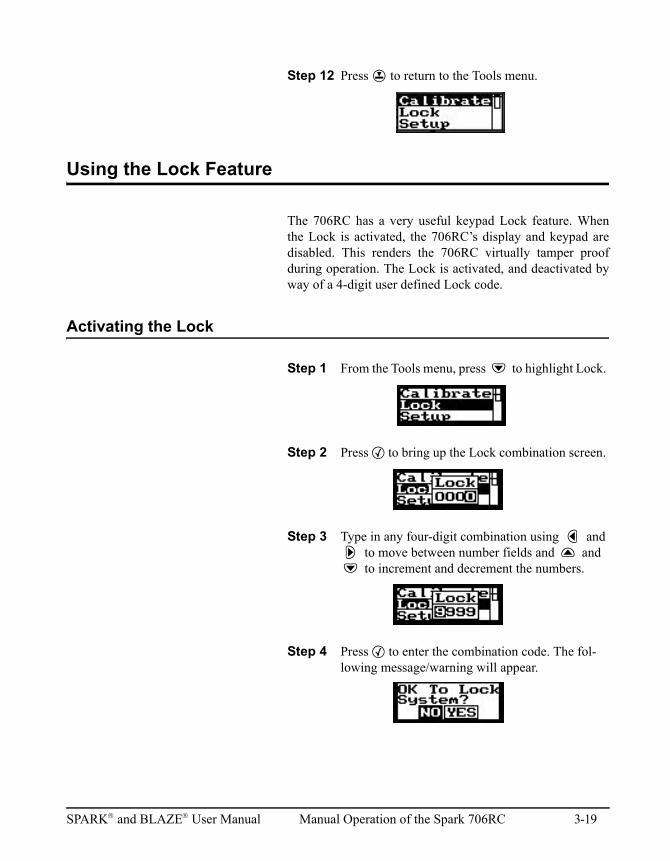
Step 12 Press R to return to the Tools menu.
Using the Lock Feature
The 706RC has a very useful keypad Lock feature. Whenthe Lock is activated, the 706RC’s display and keypad aredisabled. This renders the 706RC virtually tamper proofduring operation. The Lock is activated, and deactivated byway of a 4-digit user defined Lock code.
Activating the Lock
Step 1 From the Tools menu, press d to highlight Lock.
Step 2 Press c to bring up the Lock combination screen.
Step 3 Type in any four-digit combination using l and r to move between number fields and u and d to increment and decrement the numbers.
Step 4 Press c to enter the combination code. The fol-lowing message/warning will appear.
SPARK and BLAZE User Manual Manual Operation of the Spark 706RC 3-19
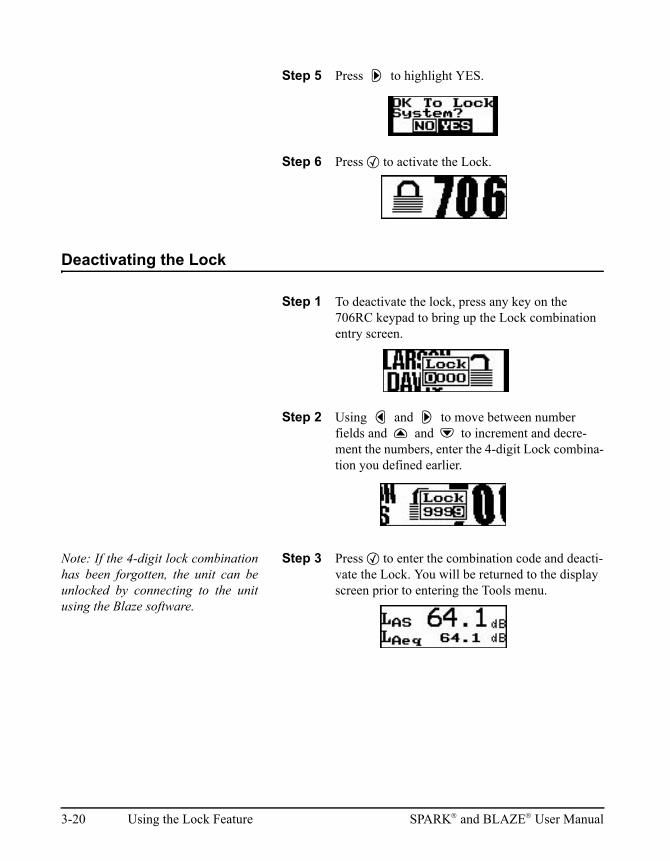
Step 5 Press r to highlight YES.
Step 6 Press c to activate the Lock.
Deactivating the Lock
Step 1 To deactivate the lock, press any key on the 706RC keypad to bring up the Lock combination entry screen.
Step 2 Using l and r to move between number fields and u and d to increment and decre-ment the numbers, enter the 4-digit Lock combina-tion you defined earlier.
Note: If the 4-digit lock combinationhas been forgotten, the unit can beunlocked by connecting to the unitusing the Blaze software.
Step 3 Press c to enter the combination code and deacti-vate the Lock. You will be returned to the display screen prior to entering the Tools menu.
3-20 Using the Lock Feature SPARK and BLAZE User Manual
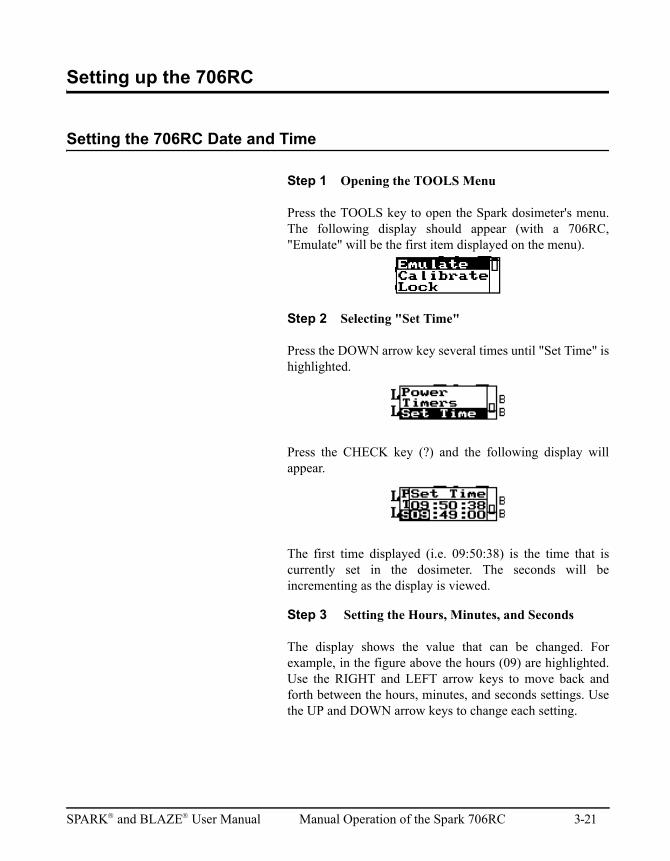
Setting up the 706RC
Setting the 706RC Date and Time
Step 1 Opening the TOOLS Menu
Press the TOOLS key to open the Spark dosimeter's menu.The following display should appear (with a 706RC,"Emulate" will be the first item displayed on the menu).
Step 2 Selecting "Set Time"
Press the DOWN arrow key several times until "Set Time" ishighlighted.
Press the CHECK key (?) and the following display willappear.
The first time displayed (i.e. 09:50:38) is the time that iscurrently set in the dosimeter. The seconds will beincrementing as the display is viewed.
Step 3 Setting the Hours, Minutes, and Seconds
The display shows the value that can be changed. Forexample, in the figure above the hours (09) are highlighted.Use the RIGHT and LEFT arrow keys to move back andforth between the hours, minutes, and seconds settings. Usethe UP and DOWN arrow keys to change each setting.
SPARK and BLAZE User Manual Manual Operation of the Spark 706RC 3-21
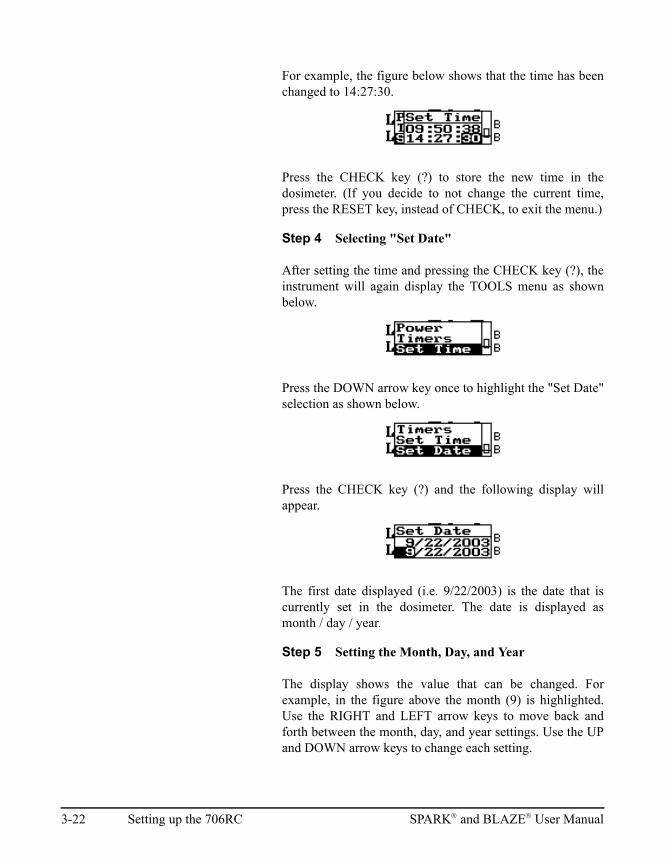
For example, the figure below shows that the time has beenchanged to 14:27:30.
Press the CHECK key (?) to store the new time in thedosimeter. (If you decide to not change the current time,press the RESET key, instead of CHECK, to exit the menu.)
Step 4 Selecting "Set Date"
After setting the time and pressing the CHECK key (?), theinstrument will again display the TOOLS menu as shownbelow.
Press the DOWN arrow key once to highlight the "Set Date"selection as shown below.
Press the CHECK key (?) and the following display willappear.
The first date displayed (i.e. 9/22/2003) is the date that iscurrently set in the dosimeter. The date is displayed asmonth / day / year.
Step 5 Setting the Month, Day, and Year
The display shows the value that can be changed. Forexample, in the figure above the month (9) is highlighted.Use the RIGHT and LEFT arrow keys to move back andforth between the month, day, and year settings. Use the UPand DOWN arrow keys to change each setting.
3-22 Setting up the 706RC SPARK and BLAZE User Manual
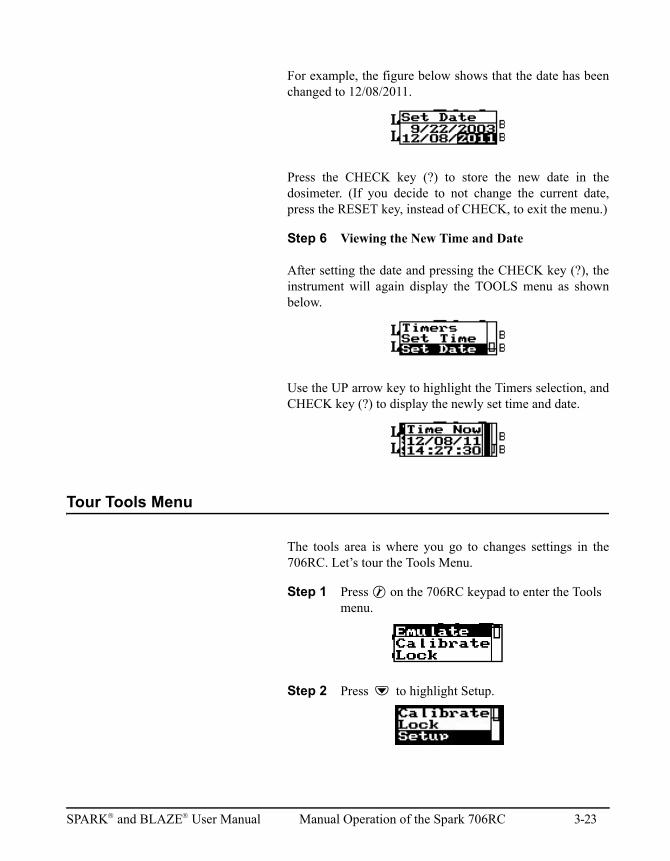
For example, the figure below shows that the date has beenchanged to 12/08/2011.
Press the CHECK key (?) to store the new date in thedosimeter. (If you decide to not change the current date,press the RESET key, instead of CHECK, to exit the menu.)
Step 6 Viewing the New Time and Date
After setting the date and pressing the CHECK key (?), theinstrument will again display the TOOLS menu as shownbelow.
Use the UP arrow key to highlight the Timers selection, andCHECK key (?) to display the newly set time and date.
Tour Tools Menu
The tools area is where you go to changes settings in the706RC. Let’s tour the Tools Menu.
Step 1 Press T on the 706RC keypad to enter the Tools menu.
Step 2 Press d to highlight Setup.
SPARK and BLAZE User Manual Manual Operation of the Spark 706RC 3-23
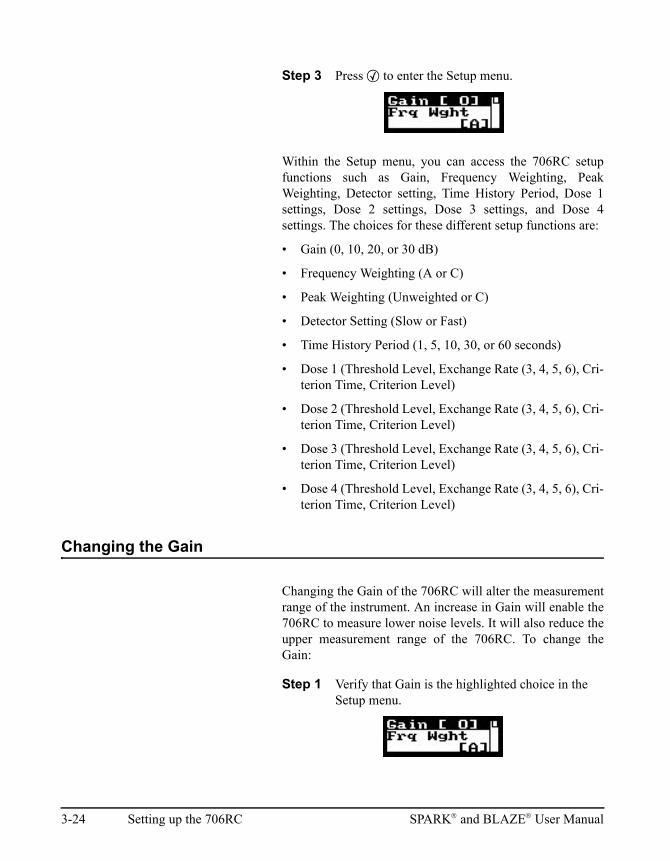
Step 3 Press c to enter the Setup menu.
Within the Setup menu, you can access the 706RC setupfunctions such as Gain, Frequency Weighting, PeakWeighting, Detector setting, Time History Period, Dose 1settings, Dose 2 settings, Dose 3 settings, and Dose 4settings. The choices for these different setup functions are:
• Gain (0, 10, 20, or 30 dB)
• Frequency Weighting (A or C)
• Peak Weighting (Unweighted or C)
• Detector Setting (Slow or Fast)
• Time History Period (1, 5, 10, 30, or 60 seconds)
• Dose 1 (Threshold Level, Exchange Rate (3, 4, 5, 6), Cri-terion Time, Criterion Level)
• Dose 2 (Threshold Level, Exchange Rate (3, 4, 5, 6), Cri-terion Time, Criterion Level)
• Dose 3 (Threshold Level, Exchange Rate (3, 4, 5, 6), Cri-terion Time, Criterion Level)
• Dose 4 (Threshold Level, Exchange Rate (3, 4, 5, 6), Cri-terion Time, Criterion Level)
Changing the Gain
Changing the Gain of the 706RC will alter the measurementrange of the instrument. An increase in Gain will enable the706RC to measure lower noise levels. It will also reduce theupper measurement range of the 706RC. To change theGain:
Step 1 Verify that Gain is the highlighted choice in the Setup menu.
3-24 Setting up the 706RC SPARK and BLAZE User Manual
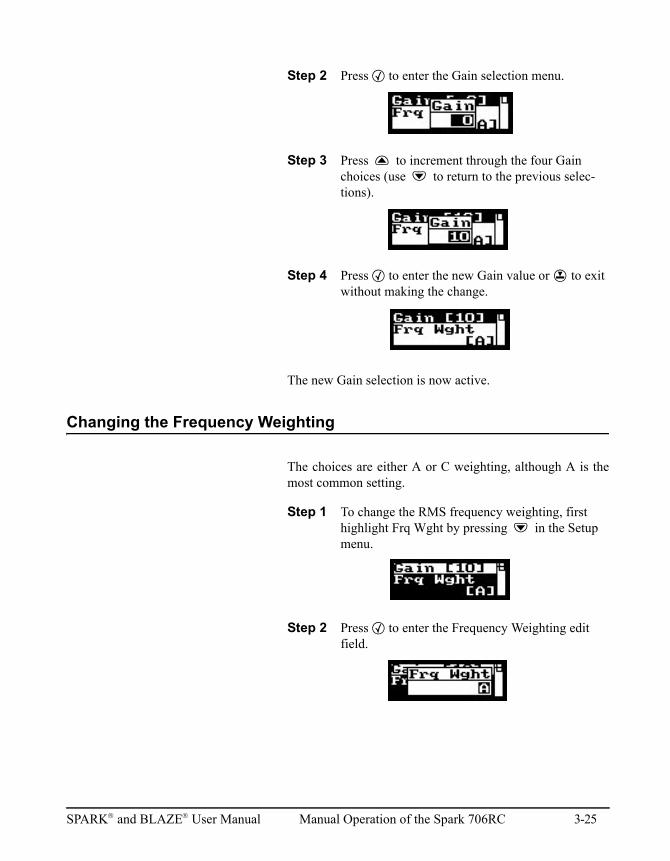
Step 2 Press c to enter the Gain selection menu.
Step 3 Press u to increment through the four Gain choices (use d to return to the previous selec-tions).
Step 4 Press c to enter the new Gain value or R to exit without making the change.
The new Gain selection is now active.
Changing the Frequency Weighting
The choices are either A or C weighting, although A is themost common setting.
Step 1 To change the RMS frequency weighting, first highlight Frq Wght by pressing d in the Setup menu.
Step 2 Press c to enter the Frequency Weighting edit field.
SPARK and BLAZE User Manual Manual Operation of the Spark 706RC 3-25
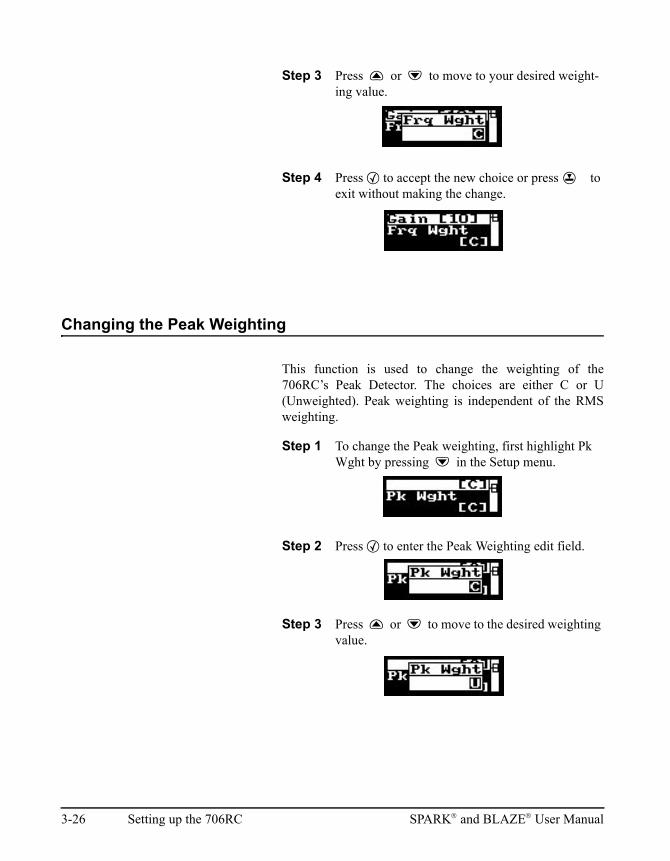
Step 3 Press u or d to move to your desired weight-ing value.
Step 4 Press c to accept the new choice or press R to exit without making the change.
Changing the Peak Weighting
This function is used to change the weighting of the706RC’s Peak Detector. The choices are either C or U(Unweighted). Peak weighting is independent of the RMSweighting.
Step 1 To change the Peak weighting, first highlight Pk Wght by pressing d in the Setup menu.
Step 2 Press c to enter the Peak Weighting edit field.
Step 3 Press u or d to move to the desired weighting value.
3-26 Setting up the 706RC SPARK and BLAZE User Manual
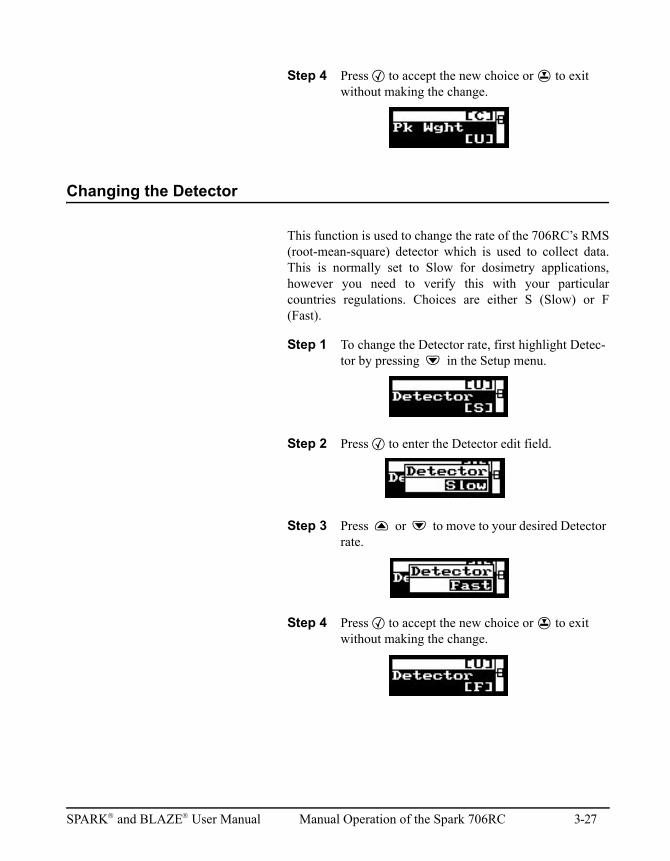
Step 4 Press c to accept the new choice or R to exit without making the change.
Changing the Detector
This function is used to change the rate of the 706RC’s RMS(root-mean-square) detector which is used to collect data.This is normally set to Slow for dosimetry applications,however you need to verify this with your particularcountries regulations. Choices are either S (Slow) or F(Fast).
Step 1 To change the Detector rate, first highlight Detec-tor by pressing d in the Setup menu.
Step 2 Press c to enter the Detector edit field.
Step 3 Press u or d to move to your desired Detector rate.
Step 4 Press c to accept the new choice or R to exit without making the change.
SPARK and BLAZE User Manual Manual Operation of the Spark 706RC 3-27
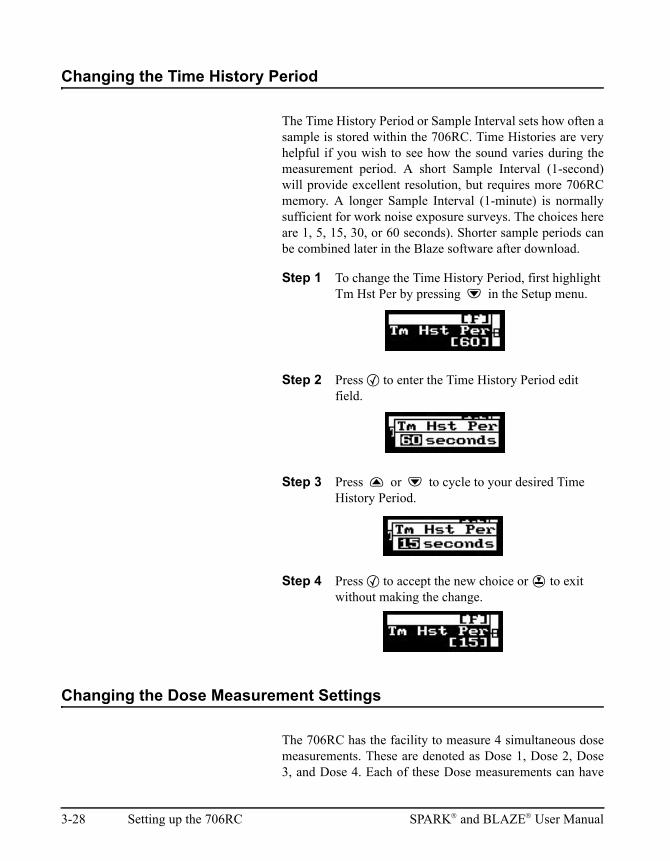
Changing the Time History Period
The Time History Period or Sample Interval sets how often asample is stored within the 706RC. Time Histories are veryhelpful if you wish to see how the sound varies during themeasurement period. A short Sample Interval (1-second)will provide excellent resolution, but requires more 706RCmemory. A longer Sample Interval (1-minute) is normallysufficient for work noise exposure surveys. The choices hereare 1, 5, 15, 30, or 60 seconds). Shorter sample periods canbe combined later in the Blaze software after download.
Step 1 To change the Time History Period, first highlight Tm Hst Per by pressing d in the Setup menu.
Step 2 Press c to enter the Time History Period edit field.
Step 3 Press u or d to cycle to your desired Time History Period.
Step 4 Press c to accept the new choice or R to exit without making the change.
Changing the Dose Measurement Settings
The 706RC has the facility to measure 4 simultaneous dosemeasurements. These are denoted as Dose 1, Dose 2, Dose3, and Dose 4. Each of these Dose measurements can have
3-28 Setting up the 706RC SPARK and BLAZE User Manual
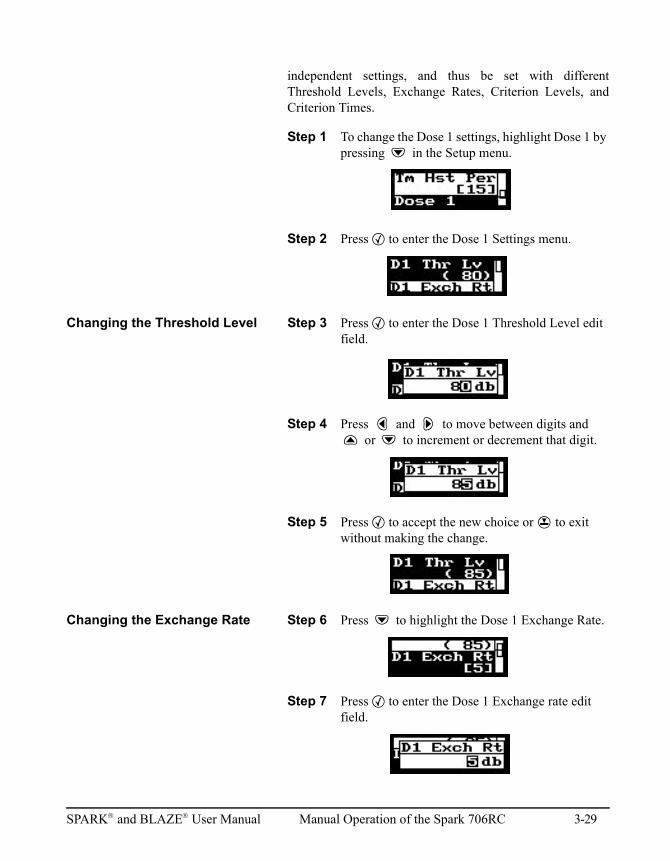
independent settings, and thus be set with differentThreshold Levels, Exchange Rates, Criterion Levels, andCriterion Times.
Step 1 To change the Dose 1 settings, highlight Dose 1 by pressing d in the Setup menu.
Step 2 Press c to enter the Dose 1 Settings menu.
Changing the Threshold Level Step 3 Press c to enter the Dose 1 Threshold Level edit field.
Step 4 Press l and r to move between digits and u or d to increment or decrement that digit.
Step 5 Press c to accept the new choice or R to exit without making the change.
Changing the Exchange Rate Step 6 Press d to highlight the Dose 1 Exchange Rate.
Step 7 Press c to enter the Dose 1 Exchange rate edit field.
SPARK and BLAZE User Manual Manual Operation of the Spark 706RC 3-29
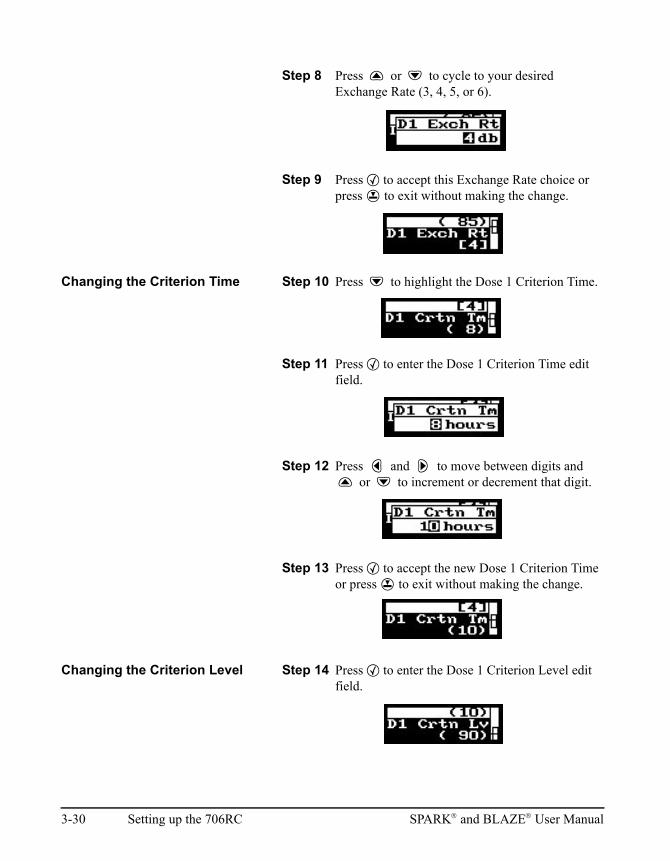
Step 8 Press u or d to cycle to your desired Exchange Rate (3, 4, 5, or 6).
Step 9 Press c to accept this Exchange Rate choice or press R to exit without making the change.
Changing the Criterion Time Step 10 Press d to highlight the Dose 1 Criterion Time.
Step 11 Press c to enter the Dose 1 Criterion Time edit field.
Step 12 Press l and r to move between digits and u or d to increment or decrement that digit.
Step 13 Press c to accept the new Dose 1 Criterion Time or press R to exit without making the change.
Changing the Criterion Level Step 14 Press c to enter the Dose 1 Criterion Level edit field.
3-30 Setting up the 706RC SPARK and BLAZE User Manual
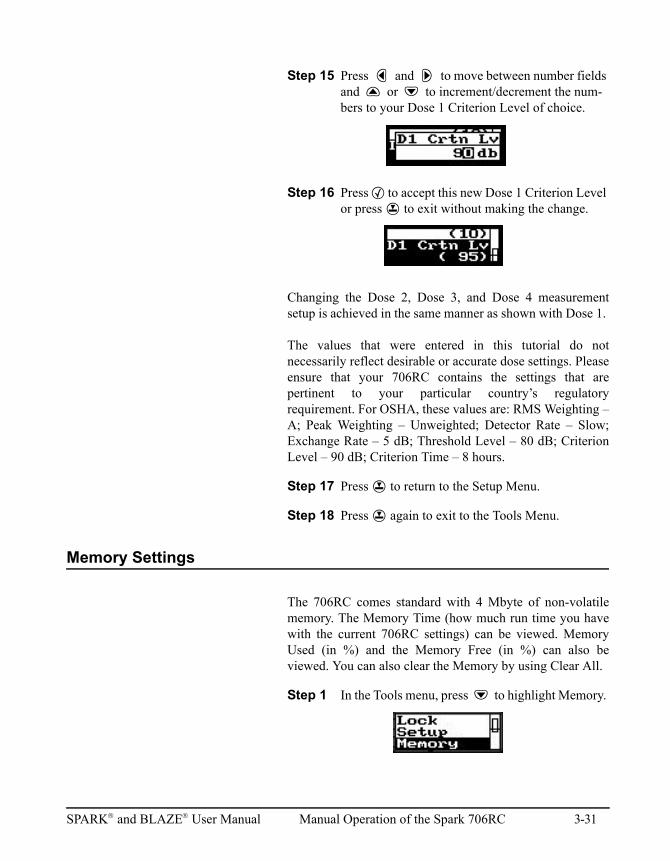
Step 15 Press l and r to move between number fields and u or d to increment/decrement the num-bers to your Dose 1 Criterion Level of choice.
Step 16 Press c to accept this new Dose 1 Criterion Level or press R to exit without making the change.
Changing the Dose 2, Dose 3, and Dose 4 measurementsetup is achieved in the same manner as shown with Dose 1.
The values that were entered in this tutorial do notnecessarily reflect desirable or accurate dose settings. Pleaseensure that your 706RC contains the settings that arepertinent to your particular country’s regulatoryrequirement. For OSHA, these values are: RMS Weighting –A; Peak Weighting – Unweighted; Detector Rate – Slow;Exchange Rate – 5 dB; Threshold Level – 80 dB; CriterionLevel – 90 dB; Criterion Time – 8 hours.
Step 17 Press R to return to the Setup Menu.
Step 18 Press R again to exit to the Tools Menu.
Memory Settings
The 706RC comes standard with 4 Mbyte of non-volatilememory. The Memory Time (how much run time you havewith the current 706RC settings) can be viewed. MemoryUsed (in %) and the Memory Free (in %) can also beviewed. You can also clear the Memory by using Clear All.
Step 1 In the Tools menu, press d to highlight Memory.
SPARK and BLAZE User Manual Manual Operation of the Spark 706RC 3-31
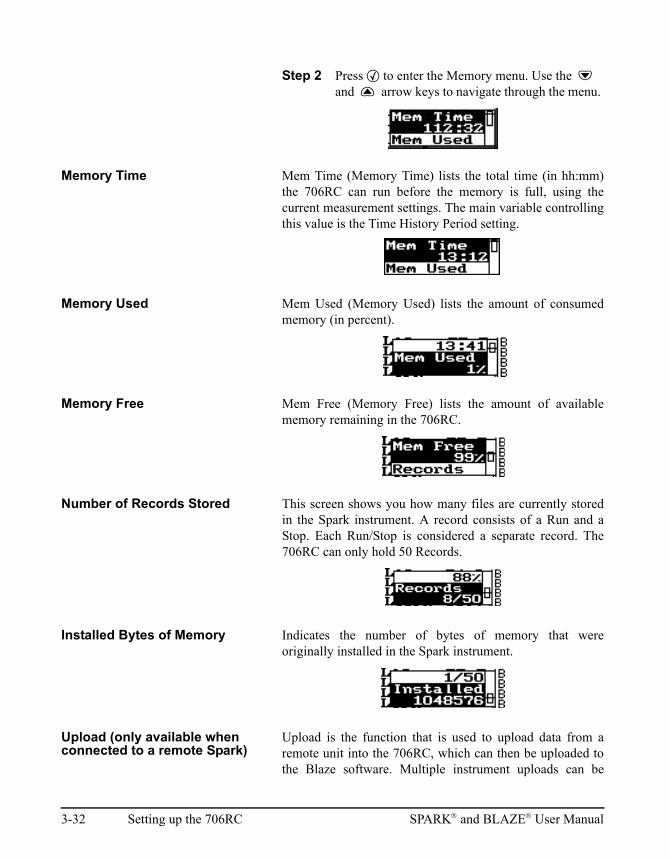
Step 2 Press c to enter the Memory menu. Use the d and u arrow keys to navigate through the menu.
Memory Time Mem Time (Memory Time) lists the total time (in hh:mm)the 706RC can run before the memory is full, using thecurrent measurement settings. The main variable controllingthis value is the Time History Period setting.
Memory Used Mem Used (Memory Used) lists the amount of consumedmemory (in percent).
Memory Free Mem Free (Memory Free) lists the amount of availablememory remaining in the 706RC.
Number of Records Stored This screen shows you how many files are currently storedin the Spark instrument. A record consists of a Run and aStop. Each Run/Stop is considered a separate record. The706RC can only hold 50 Records.
Installed Bytes of Memory Indicates the number of bytes of memory that wereoriginally installed in the Spark instrument.
Upload (only available when connected to a remote Spark)
Upload is the function that is used to upload data from aremote unit into the 706RC, which can then be uploaded tothe Blaze software. Multiple instrument uploads can be
3-32 Setting up the 706RC SPARK and BLAZE User Manual
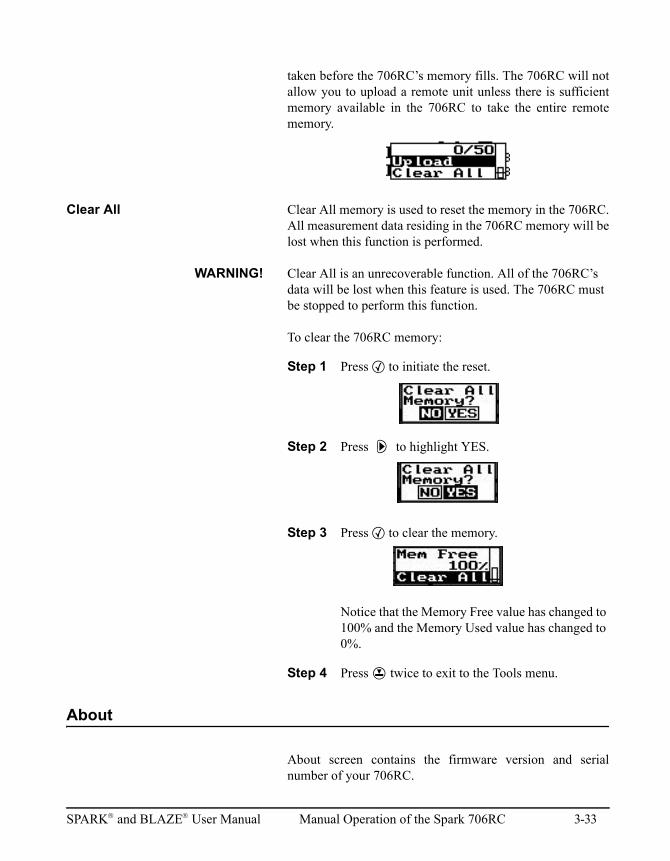
taken before the 706RC’s memory fills. The 706RC will notallow you to upload a remote unit unless there is sufficientmemory available in the 706RC to take the entire remotememory.
Clear All Clear All memory is used to reset the memory in the 706RC.All measurement data residing in the 706RC memory will belost when this function is performed.
WARNING! Clear All is an unrecoverable function. All of the 706RC’s data will be lost when this feature is used. The 706RC must be stopped to perform this function.
To clear the 706RC memory:
Step 1 Press c to initiate the reset.
Step 2 Press r to highlight YES.
Step 3 Press c to clear the memory.
Notice that the Memory Free value has changed to 100% and the Memory Used value has changed to 0%.
Step 4 Press R twice to exit to the Tools menu.
About
About screen contains the firmware version and serialnumber of your 706RC.
SPARK and BLAZE User Manual Manual Operation of the Spark 706RC 3-33
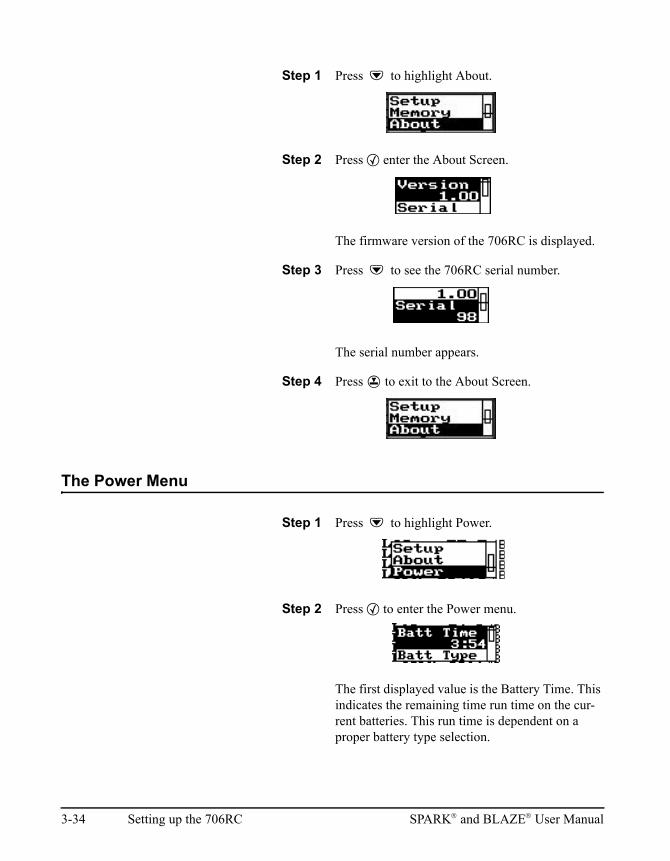
Step 1 Press d to highlight About.
Step 2 Press c enter the About Screen.
The firmware version of the 706RC is displayed.
Step 3 Press d to see the 706RC serial number.
The serial number appears.
Step 4 Press R to exit to the About Screen.
The Power Menu
Step 1 Press d to highlight Power.
Step 2 Press c to enter the Power menu.
The first displayed value is the Battery Time. This indicates the remaining time run time on the cur-rent batteries. This run time is dependent on a proper battery type selection.
3-34 Setting up the 706RC SPARK and BLAZE User Manual
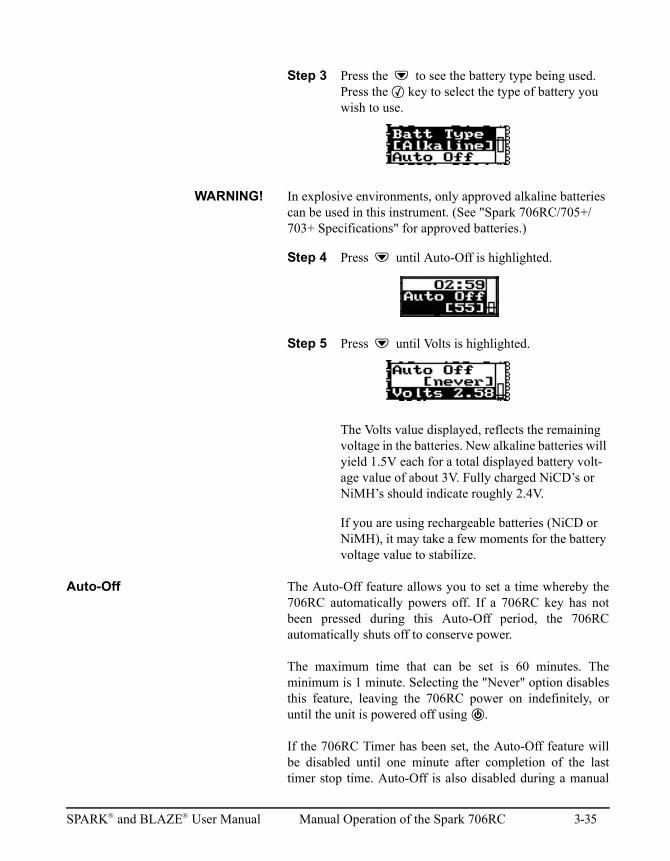
Step 3 Press the d to see the battery type being used. Press the c key to select the type of battery you wish to use.
WARNING! In explosive environments, only approved alkaline batteries can be used in this instrument. (See "Spark 706RC/705+/703+ Specifications" for approved batteries.)
Step 4 Press d until Auto-Off is highlighted.
Step 5 Press d until Volts is highlighted.
The Volts value displayed, reflects the remaining voltage in the batteries. New alkaline batteries will yield 1.5V each for a total displayed battery volt-age value of about 3V. Fully charged NiCD’s or NiMH’s should indicate roughly 2.4V.
If you are using rechargeable batteries (NiCD or NiMH), it may take a few moments for the battery voltage value to stabilize.
Auto-Off The Auto-Off feature allows you to set a time whereby the706RC automatically powers off. If a 706RC key has notbeen pressed during this Auto-Off period, the 706RCautomatically shuts off to conserve power.
The maximum time that can be set is 60 minutes. Theminimum is 1 minute. Selecting the "Never" option disablesthis feature, leaving the 706RC power on indefinitely, oruntil the unit is powered off using v.
If the 706RC Timer has been set, the Auto-Off feature willbe disabled until one minute after completion of the lasttimer stop time. Auto-Off is also disabled during a manual
SPARK and BLAZE User Manual Manual Operation of the Spark 706RC 3-35
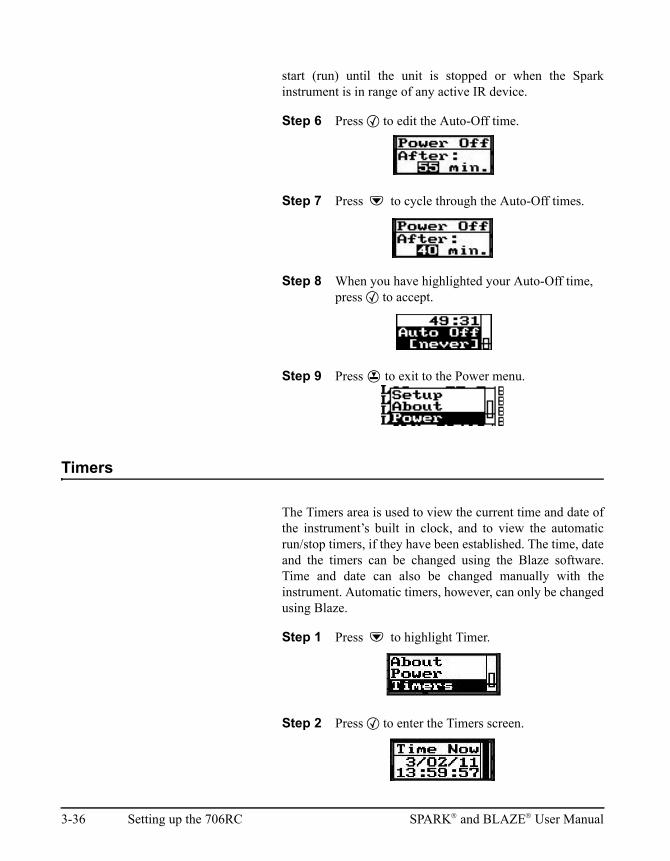
start (run) until the unit is stopped or when the Sparkinstrument is in range of any active IR device.
Step 6 Press c to edit the Auto-Off time.
Step 7 Press d to cycle through the Auto-Off times.
Step 8 When you have highlighted your Auto-Off time, press c to accept.
Step 9 Press R to exit to the Power menu.
Timers
The Timers area is used to view the current time and date ofthe instrument’s built in clock, and to view the automaticrun/stop timers, if they have been established. The time, dateand the timers can be changed using the Blaze software.Time and date can also be changed manually with theinstrument. Automatic timers, however, can only be changedusing Blaze.
Step 1 Press d to highlight Timer.
Step 2 Press c to enter the Timers screen.
3-36 Setting up the 706RC SPARK and BLAZE User Manual
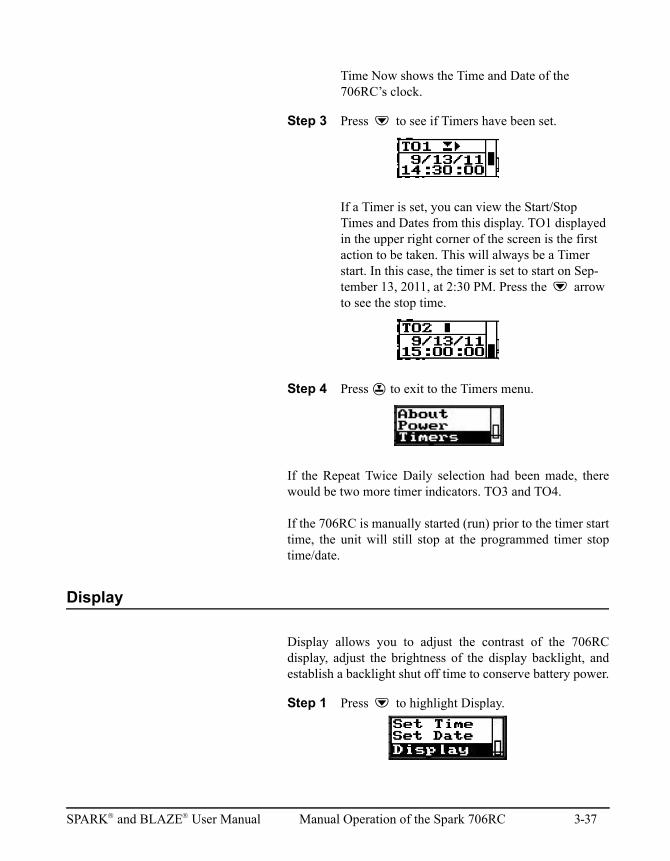
Time Now shows the Time and Date of the 706RC’s clock.
Step 3 Press d to see if Timers have been set.
If a Timer is set, you can view the Start/Stop Times and Dates from this display. TO1 displayed in the upper right corner of the screen is the first action to be taken. This will always be a Timer start. In this case, the timer is set to start on Sep-tember 13, 2011, at 2:30 PM. Press the d arrow to see the stop time.
Step 4 Press R to exit to the Timers menu.
If the Repeat Twice Daily selection had been made, therewould be two more timer indicators. TO3 and TO4.
If the 706RC is manually started (run) prior to the timer starttime, the unit will still stop at the programmed timer stoptime/date.
Display
Display allows you to adjust the contrast of the 706RCdisplay, adjust the brightness of the display backlight, andestablish a backlight shut off time to conserve battery power.
Step 1 Press d to highlight Display.
SPARK and BLAZE User Manual Manual Operation of the Spark 706RC 3-37
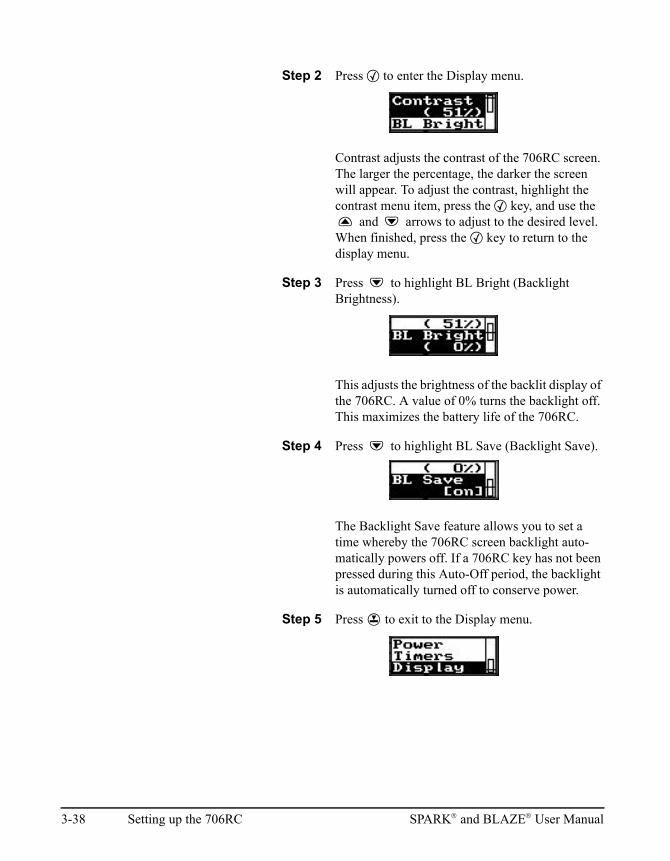
Step 2 Press c to enter the Display menu.
Contrast adjusts the contrast of the 706RC screen. The larger the percentage, the darker the screen will appear. To adjust the contrast, highlight the contrast menu item, press the c key, and use the u and d arrows to adjust to the desired level. When finished, press the c key to return to the display menu.
Step 3 Press d to highlight BL Bright (Backlight Brightness).
This adjusts the brightness of the backlit display of the 706RC. A value of 0% turns the backlight off. This maximizes the battery life of the 706RC.
Step 4 Press d to highlight BL Save (Backlight Save).
The Backlight Save feature allows you to set a time whereby the 706RC screen backlight auto-matically powers off. If a 706RC key has not been pressed during this Auto-Off period, the backlight is automatically turned off to conserve power.
Step 5 Press R to exit to the Display menu.
3-38 Setting up the 706RC SPARK and BLAZE User Manual
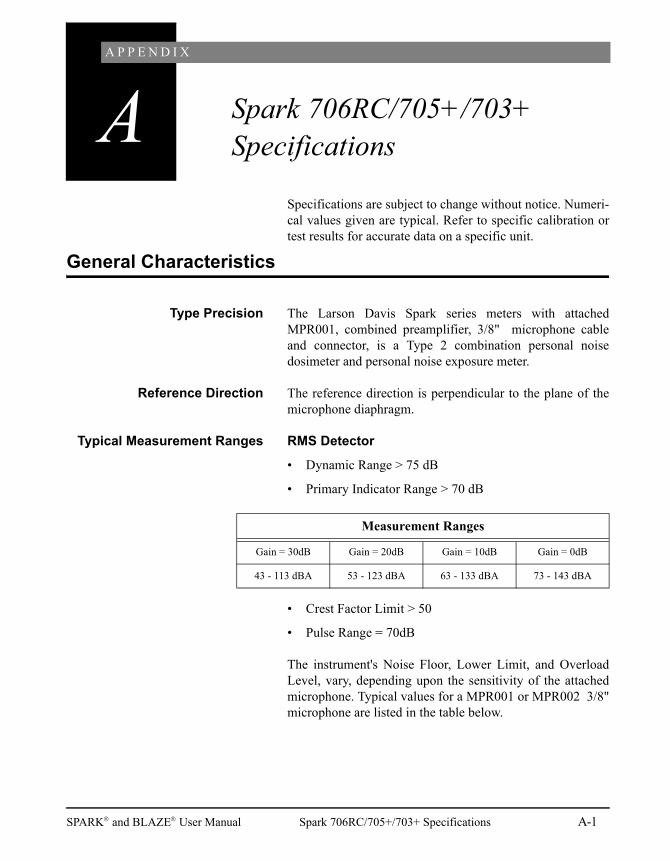
A P P E N D I X
A Spark 706RC/705+/703+ Specifications
Specifications are subject to change without notice. Numeri-cal values given are typical. Refer to specific calibration ortest results for accurate data on a specific unit.
General Characteristics
Type Precision The Larson Davis Spark series meters with attachedMPR001, combined preamplifier, 3/8" microphone cableand connector, is a Type 2 combination personal noisedosimeter and personal noise exposure meter.
Reference Direction The reference direction is perpendicular to the plane of themicrophone diaphragm.
Typical Measurement Ranges RMS Detector
• Dynamic Range > 75 dB
• Primary Indicator Range > 70 dB
• Crest Factor Limit > 50
• Pulse Range = 70dB
The instrument's Noise Floor, Lower Limit, and OverloadLevel, vary, depending upon the sensitivity of the attachedmicrophone. Typical values for a MPR001 or MPR002 3/8"microphone are listed in the table below.
Measurement Ranges
Gain = 30dB Gain = 20dB Gain = 10dB Gain = 0dB
43 - 113 dBA 53 - 123 dBA 63 - 133 dBA 73 - 143 dBA
SPARK and BLAZE User Manual Spark 706RC/705+/703+ Specifications A-1
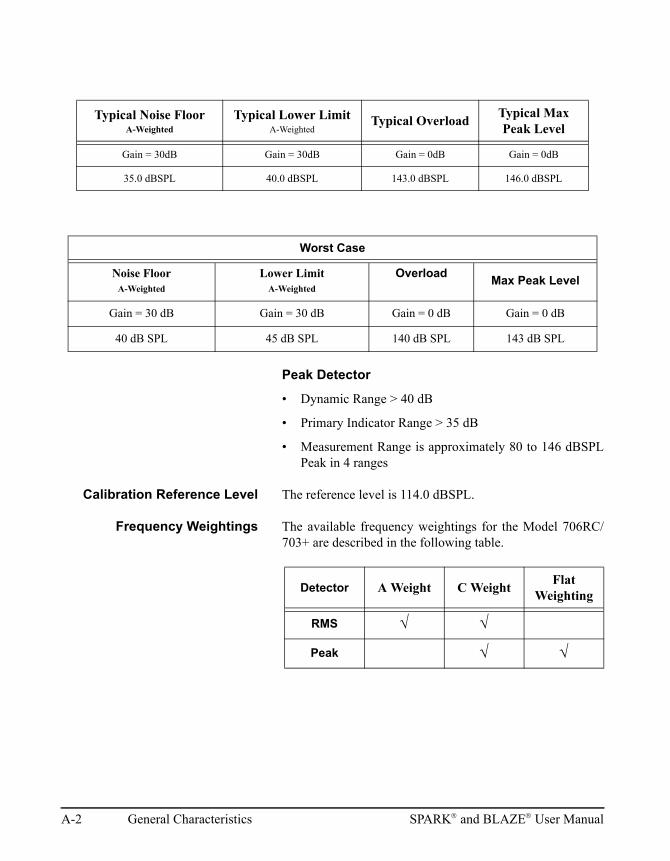
Peak Detector
• Dynamic Range > 40 dB
• Primary Indicator Range > 35 dB
• Measurement Range is approximately 80 to 146 dBSPLPeak in 4 ranges
Calibration Reference Level The reference level is 114.0 dBSPL.
Frequency Weightings The available frequency weightings for the Model 706RC/703+ are described in the following table.
Typical Noise Floor A-Weighted
Typical Lower Limit A-Weighted
Typical OverloadTypical Max Peak Level
Gain = 30dB Gain = 30dB Gain = 0dB Gain = 0dB
35.0 dBSPL 40.0 dBSPL 143.0 dBSPL 146.0 dBSPL
Worst Case
Noise Floor A-Weighted
Lower Limit A-Weighted
OverloadMax Peak Level
Gain = 30 dB Gain = 30 dB Gain = 0 dB Gain = 0 dB
40 dB SPL 45 dB SPL 140 dB SPL 143 dB SPL
Detector A Weight C WeightFlat
Weighting
RMS
Peak
A-2 General Characteristics SPARK and BLAZE User Manual
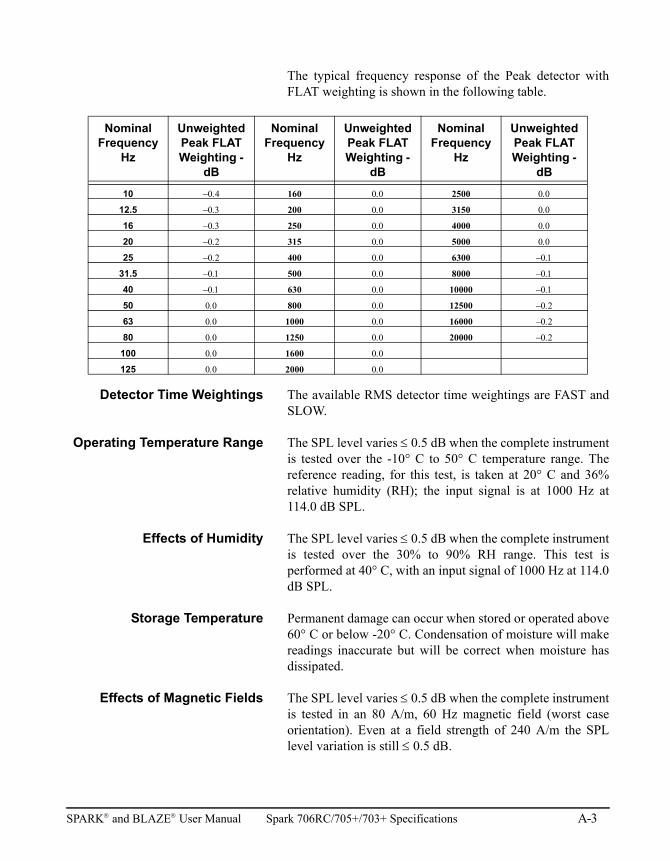
The typical frequency response of the Peak detector withFLAT weighting is shown in the following table.
Detector Time Weightings The available RMS detector time weightings are FAST andSLOW.
Operating Temperature Range The SPL level varies 0.5 dB when the complete instrumentis tested over the -10° C to 50° C temperature range. Thereference reading, for this test, is taken at 20° C and 36%relative humidity (RH); the input signal is at 1000 Hz at114.0 dB SPL.
Effects of Humidity The SPL level varies 0.5 dB when the complete instrumentis tested over the 30% to 90% RH range. This test isperformed at 40° C, with an input signal of 1000 Hz at 114.0dB SPL.
Storage Temperature Permanent damage can occur when stored or operated above60° C or below -20° C. Condensation of moisture will makereadings inaccurate but will be correct when moisture hasdissipated.
Effects of Magnetic Fields The SPL level varies 0.5 dB when the complete instrumentis tested in an 80 A/m, 60 Hz magnetic field (worst caseorientation). Even at a field strength of 240 A/m the SPLlevel variation is still 0.5 dB.
Nominal Frequency
Hz
Unweighted Peak FLAT Weighting -
dB
Nominal Frequency
Hz
Unweighted Peak FLAT Weighting -
dB
Nominal Frequency
Hz
Unweighted Peak FLAT Weighting -
dB
10 160 2500
12.5 200 3150
16 250 4000
20 315 5000
25 400 6300
31.5 500 8000
40 630 10000
50 800 12500
63 1000 16000
80 1250 20000
100 1600
125 2000
SPARK and BLAZE User Manual Spark 706RC/705+/703+ Specifications A-3
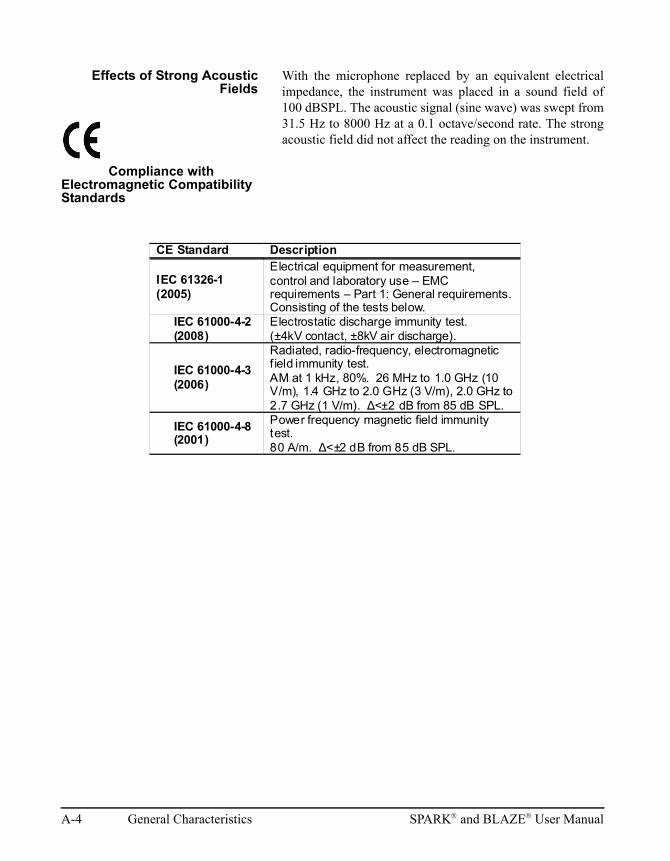
Effects of Strong AcousticFields
With the microphone replaced by an equivalent electricalimpedance, the instrument was placed in a sound field of100 dBSPL. The acoustic signal (sine wave) was swept from31.5 Hz to 8000 Hz at a 0.1 octave/second rate. The strongacoustic field did not affect the reading on the instrument.
Compliance with Electromagnetic Compatibility Standards
CE Standard Description
IEC 61326-1 (2005)
Electrical equipment for measurement, control and laboratory use – EMC requirements – Part 1: General requirements. Consisting of the tests below.
IEC 61000-4-2 (2008)
Electrostatic discharge immunity test. (±4kV contact, ±8kV air discharge).
IEC 61000-4-3 (2006)
Radiated, radio-frequency, electromagnetic f ield immunity test. AM at 1 kHz, 80%. 26 MHz to 1.0 GHz (10 V/m), 1.4 GHz to 2.0 GHz (3 V/m), 2.0 GHz to 2.7 GHz (1 V/m). ∆<±2 dB from 85 dB SPL.
IEC 61000-4-8 (2001)
Power frequency magnetic field immunity test. 80 A/m. ∆<±2 dB from 85 dB SPL.
A-4 General Characteristics SPARK and BLAZE User Manual
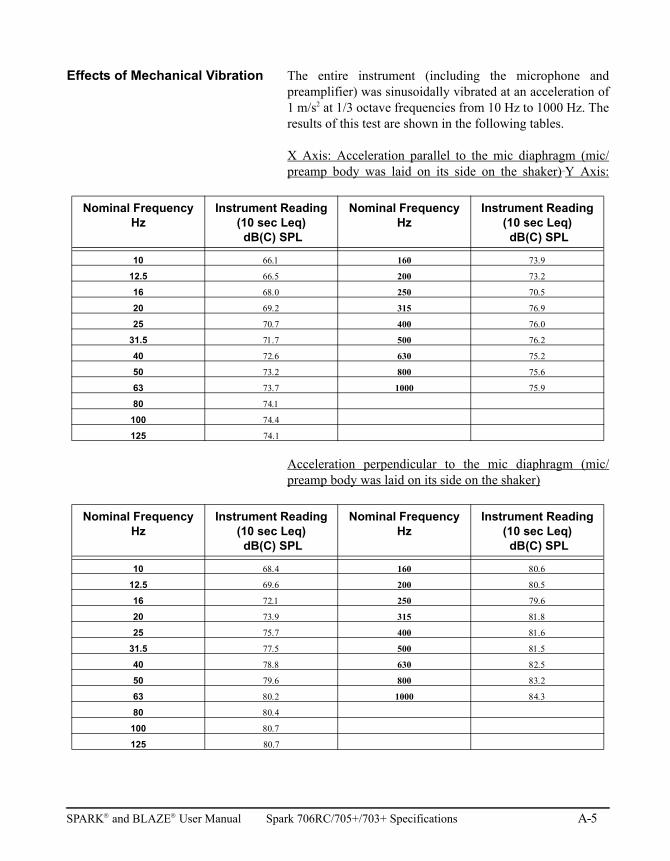
Effects of Mechanical Vibration The entire instrument (including the microphone andpreamplifier) was sinusoidally vibrated at an acceleration of1 m/s2 at 1/3 octave frequencies from 10 Hz to 1000 Hz. Theresults of this test are shown in the following tables.
X Axis: Acceleration parallel to the mic diaphragm (mic/preamp body was laid on its side on the shaker) Y Axis:
Acceleration perpendicular to the mic diaphragm (mic/preamp body was laid on its side on the shaker)
Nominal Frequency Hz
Instrument Reading(10 sec Leq) dB(C) SPL
Nominal Frequency Hz
Instrument Reading(10 sec Leq) dB(C) SPL
10 160
12.5 200
16 250
20 315
25 400
31.5 500
40 630
50 800
63 1000
80
100
125 74.1
Nominal Frequency Hz
Instrument Reading(10 sec Leq) dB(C) SPL
Nominal Frequency Hz
Instrument Reading(10 sec Leq) dB(C) SPL
10 160
12.5 200
16 250
20 315
25 400
31.5 500
40 630
50 800
63 1000
80
100
125 80.7
SPARK and BLAZE User Manual Spark 706RC/705+/703+ Specifications A-5
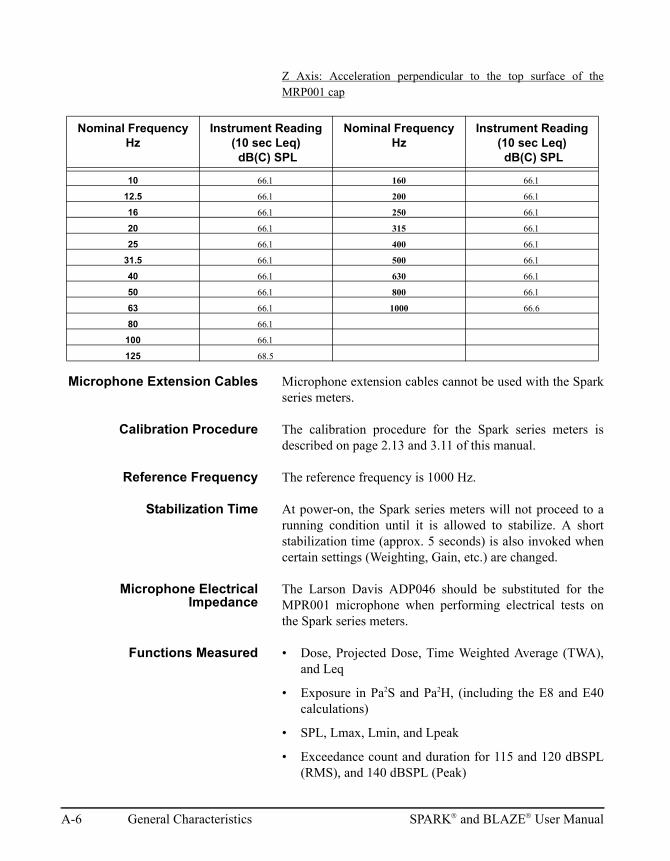
Z Axis: Acceleration perpendicular to the top surface of theMRP001 cap
Microphone Extension Cables Microphone extension cables cannot be used with the Sparkseries meters.
Calibration Procedure The calibration procedure for the Spark series meters isdescribed on page 2.13 and 3.11 of this manual.
Reference Frequency The reference frequency is 1000 Hz.
Stabilization Time At power-on, the Spark series meters will not proceed to arunning condition until it is allowed to stabilize. A shortstabilization time (approx. 5 seconds) is also invoked whencertain settings (Weighting, Gain, etc.) are changed.
Microphone ElectricalImpedance
The Larson Davis ADP046 should be substituted for theMPR001 microphone when performing electrical tests onthe Spark series meters.
Functions Measured • Dose, Projected Dose, Time Weighted Average (TWA),and Leq
• Exposure in Pa2S and Pa2H, (including the E8 and E40calculations)
• SPL, Lmax, Lmin, and Lpeak
• Exceedance count and duration for 115 and 120 dBSPL(RMS), and 140 dBSPL (Peak)
Nominal Frequency Hz
Instrument Reading(10 sec Leq) dB(C) SPL
Nominal Frequency Hz
Instrument Reading(10 sec Leq) dB(C) SPL
10 160
12.5 200
16 250
20 315
25 400
31.5 500
40 630
50 800
63 1000
80
100
125
A-6 General Characteristics SPARK and BLAZE User Manual
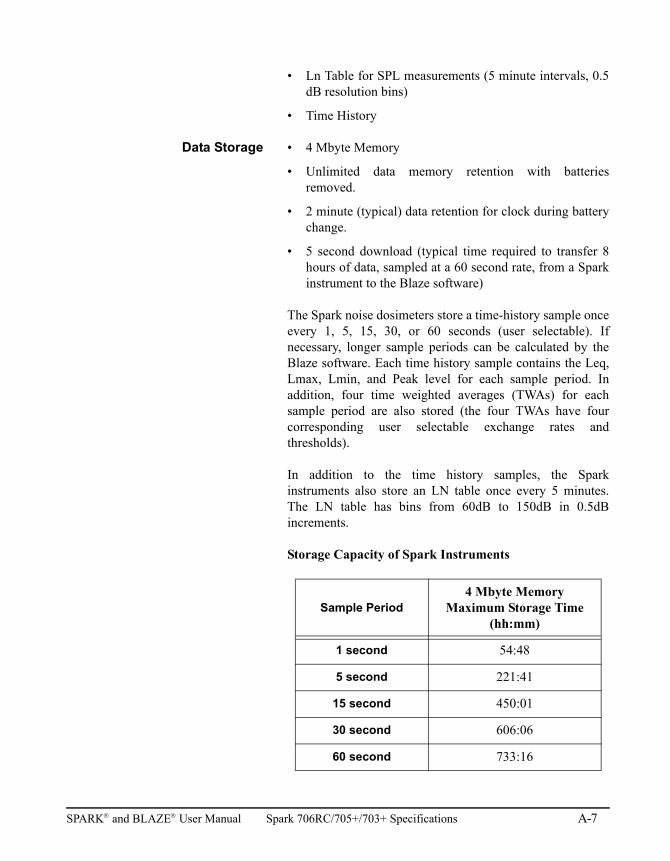
• Ln Table for SPL measurements (5 minute intervals, 0.5dB resolution bins)
• Time History
Data Storage • 4 Mbyte Memory
• Unlimited data memory retention with batteriesremoved.
• 2 minute (typical) data retention for clock during batterychange.
• 5 second download (typical time required to transfer 8hours of data, sampled at a 60 second rate, from a Sparkinstrument to the Blaze software)
The Spark noise dosimeters store a time-history sample onceevery 1, 5, 15, 30, or 60 seconds (user selectable). Ifnecessary, longer sample periods can be calculated by theBlaze software. Each time history sample contains the Leq,Lmax, Lmin, and Peak level for each sample period. Inaddition, four time weighted averages (TWAs) for eachsample period are also stored (the four TWAs have fourcorresponding user selectable exchange rates andthresholds).
In addition to the time history samples, the Sparkinstruments also store an LN table once every 5 minutes.The LN table has bins from 60dB to 150dB in 0.5dBincrements.
Storage Capacity of Spark Instruments
Sample Period4 Mbyte Memory
Maximum Storage Time(hh:mm)
1 second 54:48
5 second 221:41
15 second 450:01
30 second 606:06
60 second 733:16
SPARK and BLAZE User Manual Spark 706RC/705+/703+ Specifications A-7
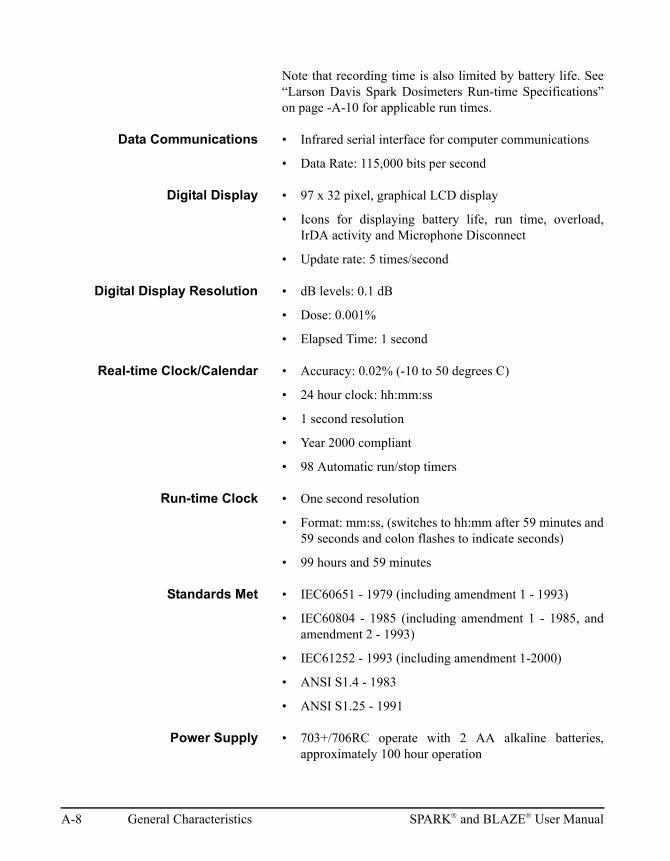
Note that recording time is also limited by battery life. See“Larson Davis Spark Dosimeters Run-time Specifications”on page -A-10 for applicable run times.
Data Communications • Infrared serial interface for computer communications
• Data Rate: 115,000 bits per second
Digital Display • 97 x 32 pixel, graphical LCD display
• Icons for displaying battery life, run time, overload,IrDA activity and Microphone Disconnect
• Update rate: 5 times/second
Digital Display Resolution • dB levels: 0.1 dB
• Dose: 0.001%
• Elapsed Time: 1 second
Real-time Clock/Calendar • Accuracy: 0.02% (-10 to 50 degrees C)
• 24 hour clock: hh:mm:ss
• 1 second resolution
• Year 2000 compliant
• 98 Automatic run/stop timers
Run-time Clock • One second resolution
• Format: mm:ss, (switches to hh:mm after 59 minutes and59 seconds and colon flashes to indicate seconds)
• 99 hours and 59 minutes
Standards Met • IEC60651 - 1979 (including amendment 1 - 1993)
• IEC60804 - 1985 (including amendment 1 - 1985, andamendment 2 - 1993)
• IEC61252 - 1993 (including amendment 1-2000)
• ANSI S1.4 - 1983
• ANSI S1.25 - 1991
Power Supply • 703+/706RC operate with 2 AA alkaline batteries,approximately 100 hour operation
A-8 General Characteristics SPARK and BLAZE User Manual
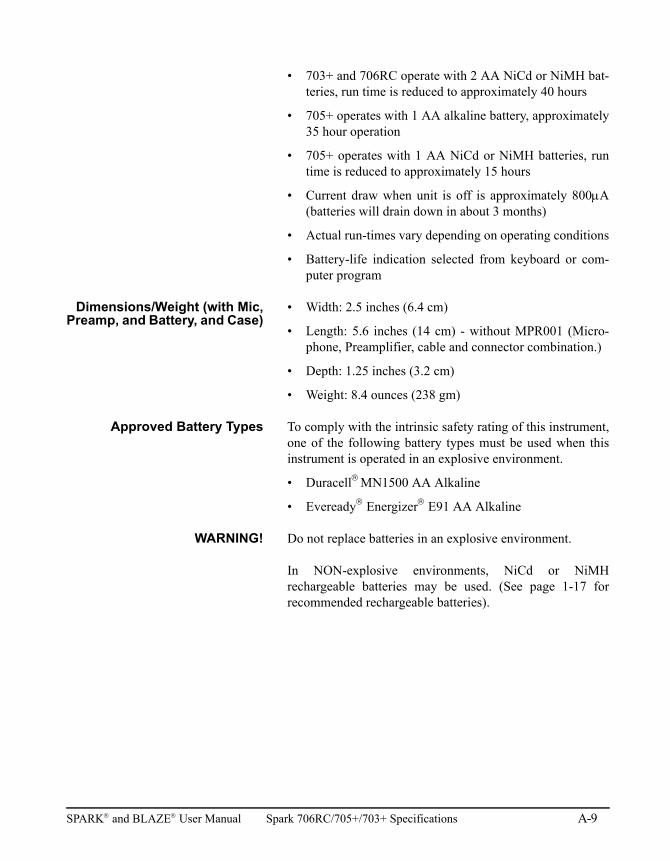
• 703+ and 706RC operate with 2 AA NiCd or NiMH bat-teries, run time is reduced to approximately 40 hours
• 705+ operates with 1 AA alkaline battery, approximately35 hour operation
• 705+ operates with 1 AA NiCd or NiMH batteries, runtime is reduced to approximately 15 hours
• Current draw when unit is off is approximately 800A(batteries will drain down in about 3 months)
• Actual run-times vary depending on operating conditions
• Battery-life indication selected from keyboard or com-puter program
Dimensions/Weight (with Mic,Preamp, and Battery, and Case)
• Width: 2.5 inches (6.4 cm)
• Length: 5.6 inches (14 cm) - without MPR001 (Micro-phone, Preamplifier, cable and connector combination.)
• Depth: 1.25 inches (3.2 cm)
• Weight: 8.4 ounces (238 gm)
Approved Battery Types To comply with the intrinsic safety rating of this instrument,one of the following battery types must be used when thisinstrument is operated in an explosive environment.
• Duracell MN1500 AA Alkaline
• Eveready Energizer E91 AA Alkaline
WARNING! Do not replace batteries in an explosive environment.
In NON-explosive environments, NiCd or NiMHrechargeable batteries may be used. (See page 1-17 forrecommended rechargeable batteries).
SPARK and BLAZE User Manual Spark 706RC/705+/703+ Specifications A-9
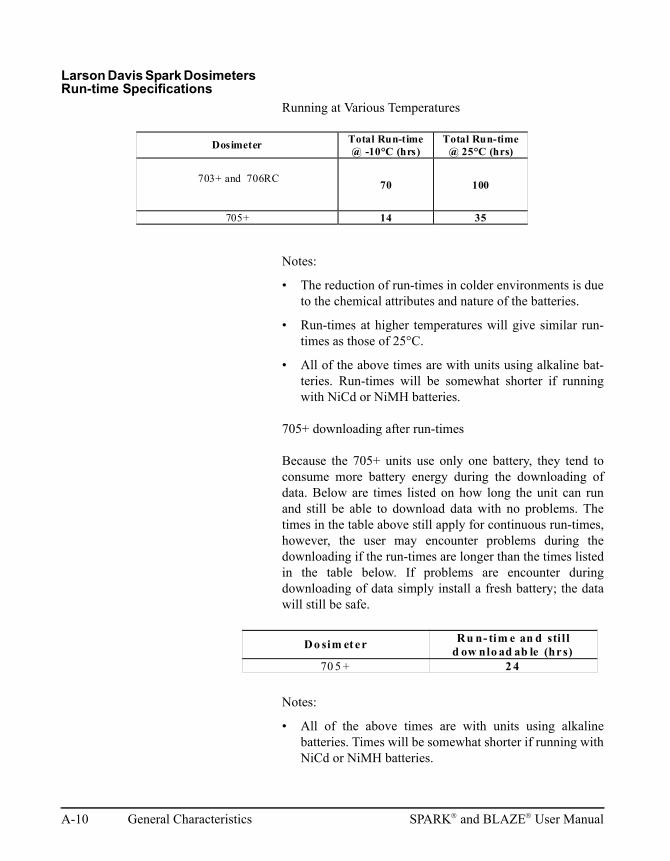
Larson Davis Spark Dosimeters Run-time Specifications
Running at Various Temperatures
Notes:
• The reduction of run-times in colder environments is dueto the chemical attributes and nature of the batteries.
• Run-times at higher temperatures will give similar run-times as those of 25°C.
• All of the above times are with units using alkaline bat-teries. Run-times will be somewhat shorter if runningwith NiCd or NiMH batteries.
705+ downloading after run-times
Because the 705+ units use only one battery, they tend toconsume more battery energy during the downloading ofdata. Below are times listed on how long the unit can runand still be able to download data with no problems. Thetimes in the table above still apply for continuous run-times,however, the user may encounter problems during thedownloading if the run-times are longer than the times listedin the table below. If problems are encounter duringdownloading of data simply install a fresh battery; the datawill still be safe.
Notes:
• All of the above times are with units using alkalinebatteries. Times will be somewhat shorter if running withNiCd or NiMH batteries.
Dosimeter Total Run-time @ -10°C (hrs)
Total Run-time @ 25°C (hrs)
703+ and 706RC 70 100
705+ 14 35
Do sim et er Ru n- tim e an d sti l l d ow nlo ad ab le (hrs)
70 5 + 2 4
A-10 General Characteristics SPARK and BLAZE User Manual
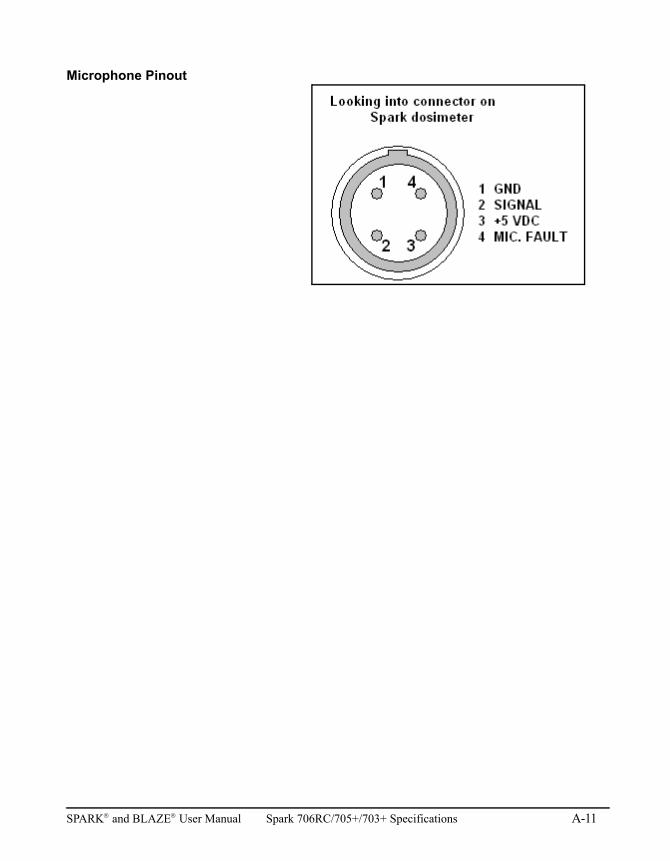
Microphone Pinout
SPARK and BLAZE User Manual Spark 706RC/705+/703+ Specifications A-11

A-12 General Characteristics SPARK and BLAZE User Manual
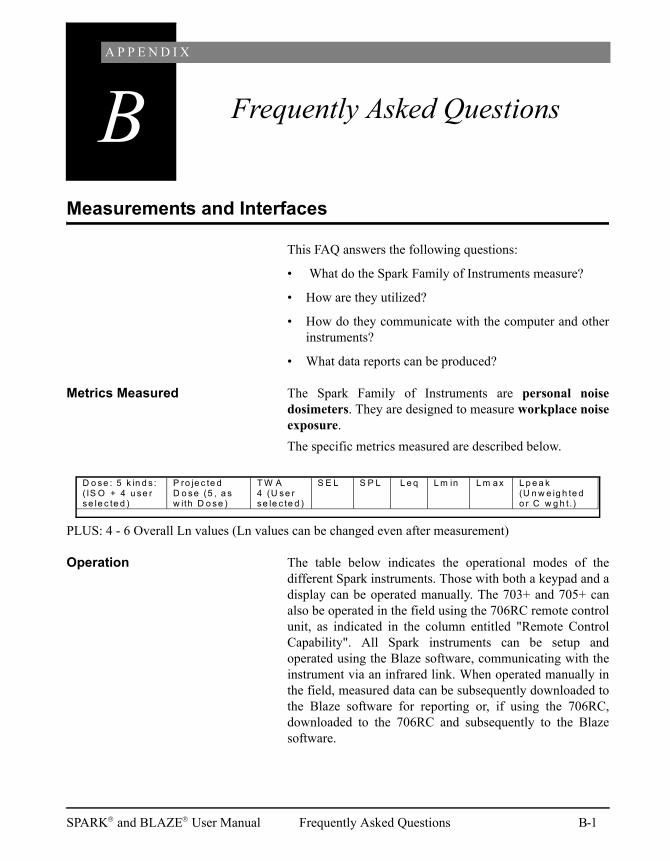
A P P E N D I X
B Frequently Asked Questions
Measurements and Interfaces
This FAQ answers the following questions:
• What do the Spark Family of Instruments measure?
• How are they utilized?
• How do they communicate with the computer and otherinstruments?
• What data reports can be produced?
Metrics Measured The Spark Family of Instruments are personal noisedosimeters. They are designed to measure workplace noiseexposure.
The specific metrics measured are described below.
PLUS: 4 - 6 Overall Ln values (Ln values can be changed even after measurement)
Operation The table below indicates the operational modes of thedifferent Spark instruments. Those with both a keypad and adisplay can be operated manually. The 703+ and 705+ canalso be operated in the field using the 706RC remote controlunit, as indicated in the column entitled "Remote ControlCapability". All Spark instruments can be setup andoperated using the Blaze software, communicating with theinstrument via an infrared link. When operated manually inthe field, measured data can be subsequently downloaded tothe Blaze software for reporting or, if using the 706RC,downloaded to the 706RC and subsequently to the Blazesoftware.
D o se : 5 k in d s : ( IS O + 4 u se r se le c te d )
P ro je c te d D o se (5 , a s w ith D o se )
T W A 4 (U se r se le c te d )
S E L S P L L e q L m in L m ax L p e a k (U n w e ig h te d o r C w g h t.)
SPARK and BLAZE User Manual Frequently Asked Questions B-1
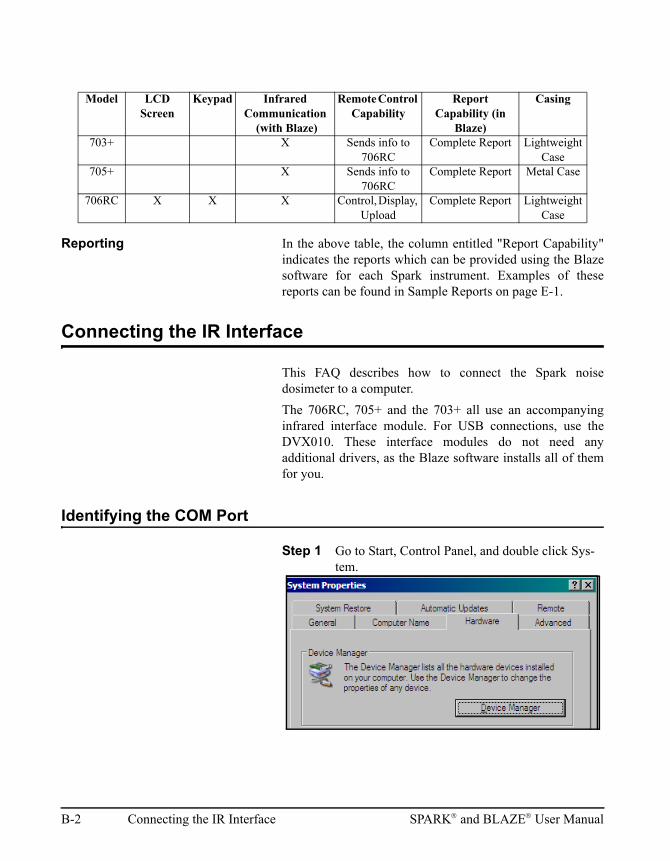
Reporting In the above table, the column entitled "Report Capability"indicates the reports which can be provided using the Blazesoftware for each Spark instrument. Examples of thesereports can be found in Sample Reports on page E-1.
Connecting the IR Interface
This FAQ describes how to connect the Spark noisedosimeter to a computer.
The 706RC, 705+ and the 703+ all use an accompanyinginfrared interface module. For USB connections, use theDVX010. These interface modules do not need anyadditional drivers, as the Blaze software installs all of themfor you.
Identifying the COM Port
Step 1 Go to Start, Control Panel, and double click Sys-tem.
Model LCD Screen
Keypad Infrared Communication
(with Blaze)
Remote Control Capability
Report Capability (in
Blaze)
Casing
703+ X Sends info to 706RC
Complete Report Lightweight Case
705+ X Sends info to 706RC
Complete Report Metal Case
706RC X X X Control, Display, Upload
Complete Report Lightweight Case
B-2 Connecting the IR Interface SPARK and BLAZE User Manual
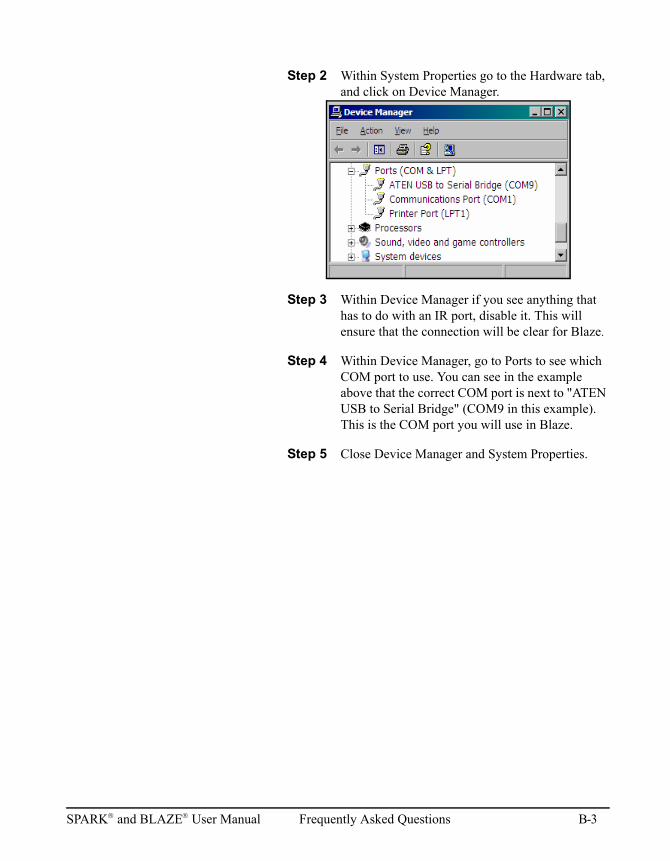
Step 2 Within System Properties go to the Hardware tab, and click on Device Manager.
Step 3 Within Device Manager if you see anything that has to do with an IR port, disable it. This will ensure that the connection will be clear for Blaze.
Step 4 Within Device Manager, go to Ports to see which COM port to use. You can see in the example above that the correct COM port is next to "ATEN USB to Serial Bridge" (COM9 in this example). This is the COM port you will use in Blaze.
Step 5 Close Device Manager and System Properties.
SPARK and BLAZE User Manual Frequently Asked Questions B-3
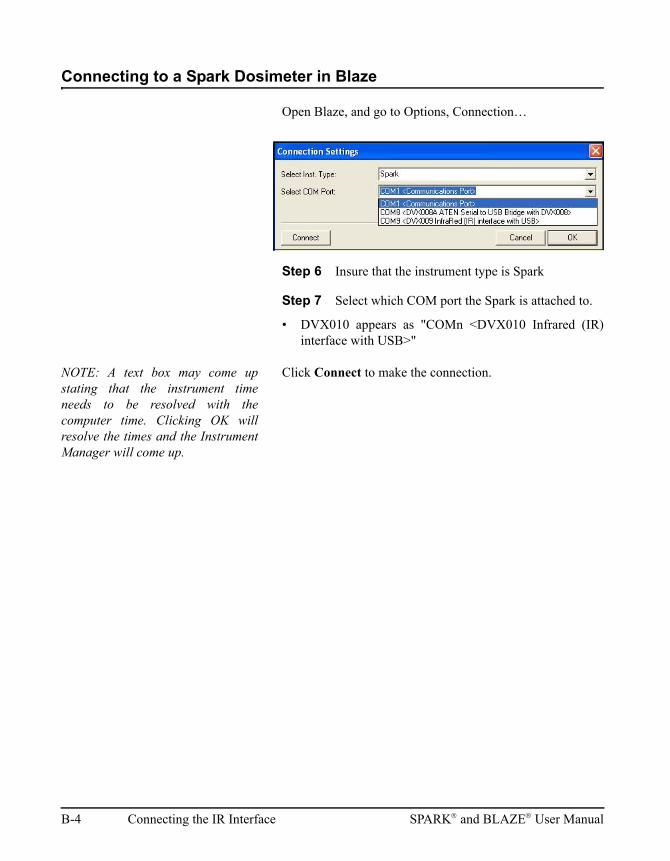
Connecting to a Spark Dosimeter in Blaze
Open Blaze, and go to Options, Connection…
Step 6 Insure that the instrument type is Spark
Step 7 Select which COM port the Spark is attached to.
• DVX010 appears as "COMn <DVX010 Infrared (IR)interface with USB>"
NOTE: A text box may come upstating that the instrument timeneeds to be resolved with thecomputer time. Clicking OK willresolve the times and the InstrumentManager will come up.
Click Connect to make the connection.
B-4 Connecting the IR Interface SPARK and BLAZE User Manual
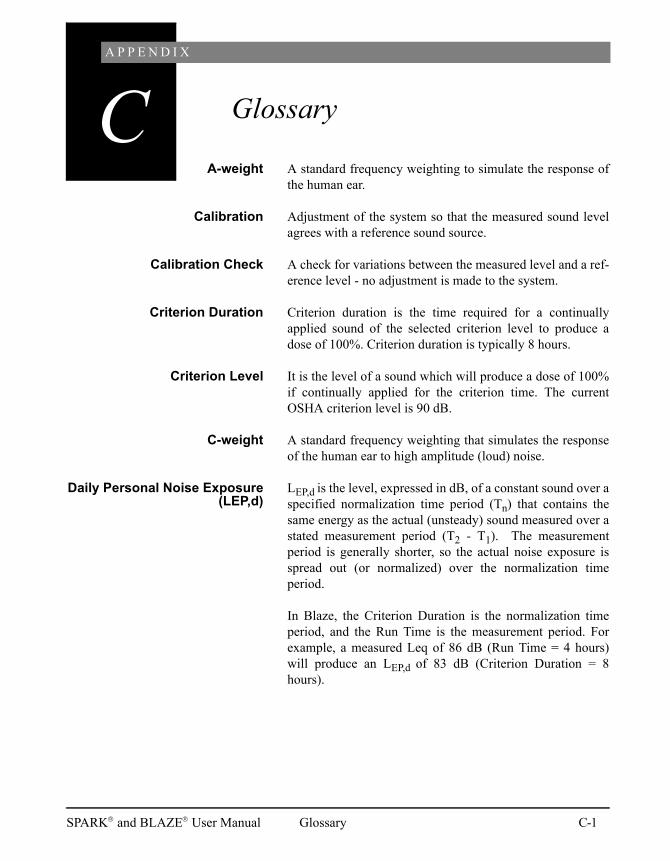
A P P E N D I X
C Glossary
A-weight A standard frequency weighting to simulate the response ofthe human ear.
Calibration Adjustment of the system so that the measured sound levelagrees with a reference sound source.
Calibration Check A check for variations between the measured level and a ref-erence level - no adjustment is made to the system.
Criterion Duration Criterion duration is the time required for a continuallyapplied sound of the selected criterion level to produce adose of 100%. Criterion duration is typically 8 hours.
Criterion Level It is the level of a sound which will produce a dose of 100%if continually applied for the criterion time. The currentOSHA criterion level is 90 dB.
C-weight A standard frequency weighting that simulates the responseof the human ear to high amplitude (loud) noise.
Daily Personal Noise Exposure(LEP,d)
LEP,d is the level, expressed in dB, of a constant sound over aspecified normalization time period (Tn) that contains thesame energy as the actual (unsteady) sound measured over astated measurement period (T2 - T1). The measurementperiod is generally shorter, so the actual noise exposure isspread out (or normalized) over the normalization timeperiod.
In Blaze, the Criterion Duration is the normalization timeperiod, and the Run Time is the measurement period. Forexample, a measured Leq of 86 dB (Run Time = 4 hours)will produce an LEP,d of 83 dB (Criterion Duration = 8hours).
SPARK and BLAZE User Manual Glossary C-1
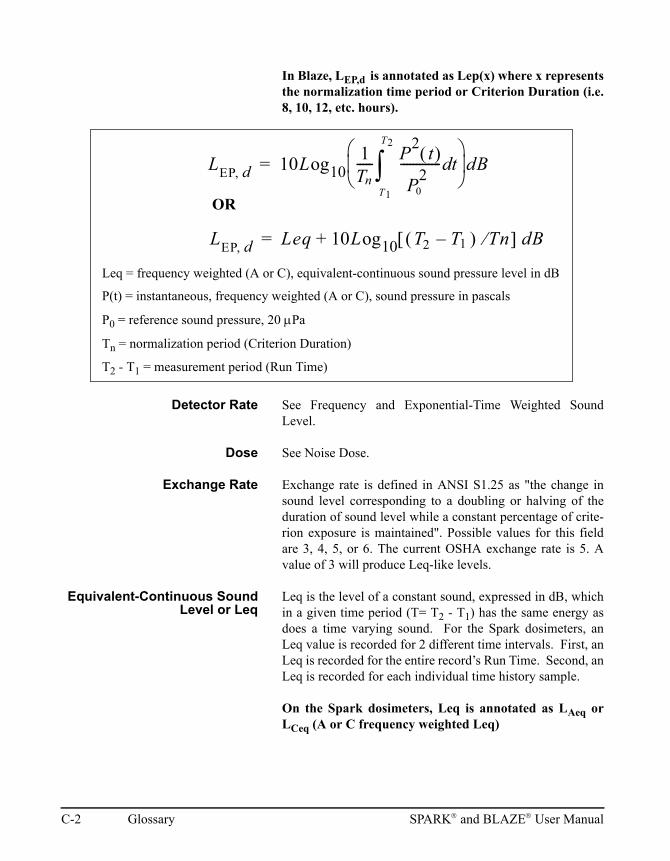
In Blaze, LEP,d is annotated as Lep(x) where x representsthe normalization time period or Criterion Duration (i.e.8, 10, 12, etc. hours).
Detector Rate See Frequency and Exponential-Time Weighted SoundLevel.
Dose See Noise Dose.
Exchange Rate Exchange rate is defined in ANSI S1.25 as "the change insound level corresponding to a doubling or halving of theduration of sound level while a constant percentage of crite-rion exposure is maintained". Possible values for this fieldare 3, 4, 5, or 6. The current OSHA exchange rate is 5. Avalue of 3 will produce Leq-like levels.
Equivalent-Continuous SoundLevel or Leq
Leq is the level of a constant sound, expressed in dB, whichin a given time period (T= T2 - T1) has the same energy asdoes a time varying sound. For the Spark dosimeters, anLeq value is recorded for 2 different time intervals. First, anLeq is recorded for the entire record’s Run Time. Second, anLeq is recorded for each individual time history sample.
On the Spark dosimeters, Leq is annotated as LAeq orLCeq (A or C frequency weighted Leq)
LEP d 10Log101Tn----- P
2t
P2
0
------------- td
T1
T2
dB=
LEP d Leq 10Log10 T2 T1– Tn dB+=
OR
Leq = frequency weighted (A or C), equivalent-continuous sound pressure level in dB
P(t) = instantaneous, frequency weighted (A or C), sound pressure in pascals
P0 = reference sound pressure, 20 Pa
Tn = normalization period (Criterion Duration)
T2 - T1 = measurement period (Run Time)
C-2 Glossary SPARK and BLAZE User Manual
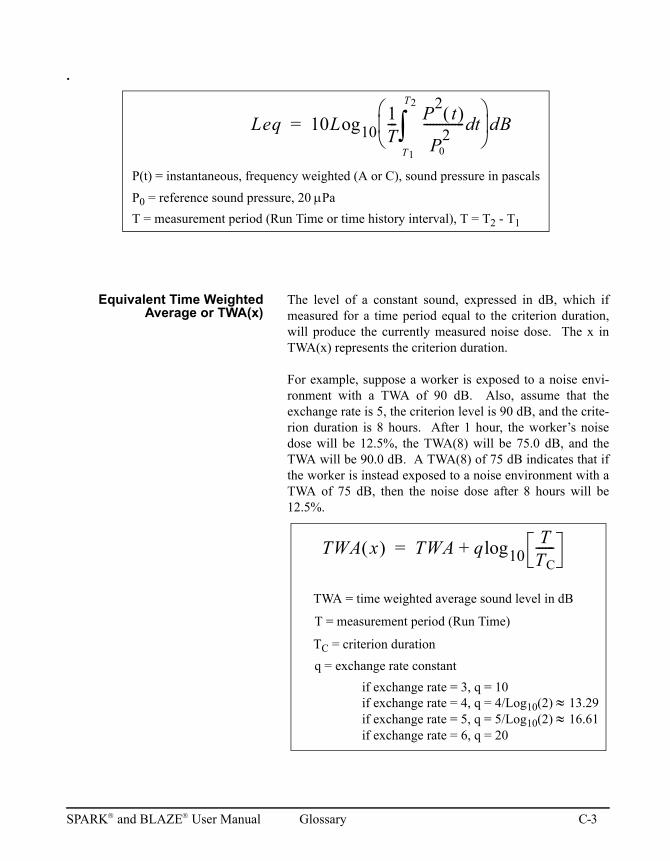
.
Equivalent Time WeightedAverage or TWA(x)
The level of a constant sound, expressed in dB, which ifmeasured for a time period equal to the criterion duration,will produce the currently measured noise dose. The x inTWA(x) represents the criterion duration.
For example, suppose a worker is exposed to a noise envi-ronment with a TWA of 90 dB. Also, assume that theexchange rate is 5, the criterion level is 90 dB, and the crite-rion duration is 8 hours. After 1 hour, the worker’s noisedose will be 12.5%, the TWA(8) will be 75.0 dB, and theTWA will be 90.0 dB. A TWA(8) of 75 dB indicates that ifthe worker is instead exposed to a noise environment with aTWA of 75 dB, then the noise dose after 8 hours will be12.5%.
Leq 10Log101T--- P
2t
P2
0
------------- td
T1
T2
dB=
P(t) = instantaneous, frequency weighted (A or C), sound pressure in pascals
P0 = reference sound pressure, 20 Pa
T = measurement period (Run Time or time history interval), T = T2 - T1
TWA x TWA q+ log10T
TC------=
TWA = time weighted average sound level in dB
T = measurement period (Run Time)
TC = criterion duration
q = exchange rate constant
if exchange rate = 3, q = 10if exchange rate = 4, q = 4/Log10(2) 13.29if exchange rate = 5, q = 5/Log10(2) 16.61if exchange rate = 6, q = 20
SPARK and BLAZE User Manual Glossary C-3
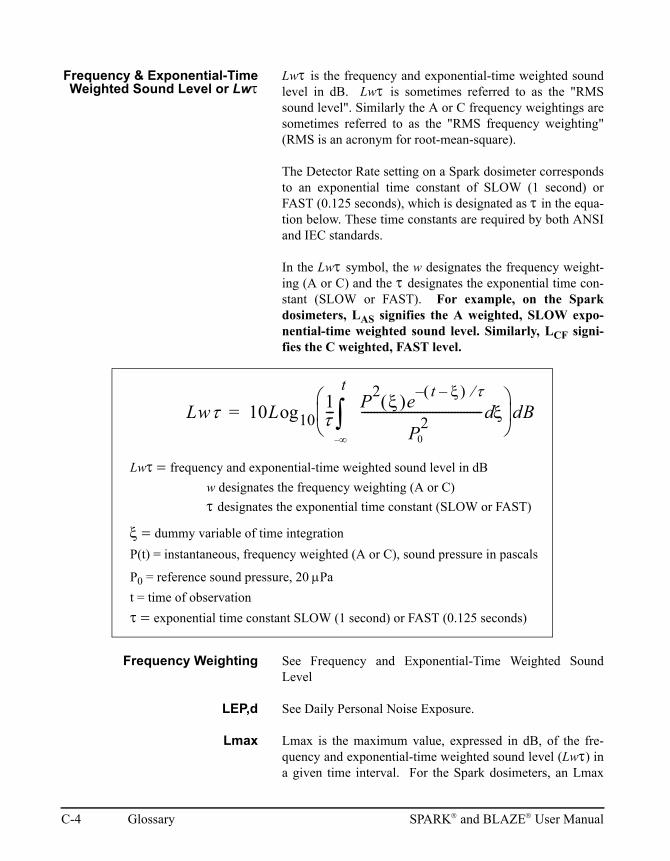
Frequency & Exponential-TimeWeighted Sound Level or Lw
Lw is the frequency and exponential-time weighted soundlevel in dB. Lw is sometimes referred to as the "RMSsound level". Similarly the A or C frequency weightings aresometimes referred to as the "RMS frequency weighting"(RMS is an acronym for root-mean-square).
The Detector Rate setting on a Spark dosimeter correspondsto an exponential time constant of SLOW (1 second) orFAST (0.125 seconds), which is designated as in the equa-tion below. These time constants are required by both ANSIand IEC standards.
In the Lwsymbol, the w designates the frequency weight-ing (A or C) and the designates the exponential time con-stant (SLOW or FAST). For example, on the Sparkdosimeters, LAS signifies the A weighted, SLOW expo-nential-time weighted sound level. Similarly, LCF signi-fies the C weighted, FAST level.
Frequency Weighting See Frequency and Exponential-Time Weighted SoundLevel
LEP,d See Daily Personal Noise Exposure.
Lmax Lmax is the maximum value, expressed in dB, of the fre-quency and exponential-time weighted sound level (Lw) ina given time interval. For the Spark dosimeters, an Lmax
Lw 10Log101---
P2 e t – –
P2
0
--------------------------------------- d–
t
dB=
Lwfrequency and exponential-time weighted sound level in dB
w designates the frequency weighting (A or C)
designates the exponential time constant (SLOW or FAST)
dummy variable of time integration
P(t) = instantaneous, frequency weighted (A or C), sound pressure in pascals
P0 = reference sound pressure, 20 Pa
t = time of observation
exponential time constant SLOW (1 second) or FAST (0.125 seconds)
C-4 Glossary SPARK and BLAZE User Manual
value is recorded for 2 different time intervals. First, anLmax is recorded for the entire record’s Run Time. Second,an Lmax is recorded for each individual time history sample.
On the Spark display, the Lmax annotation includes the cur-rent settings for frequency weighting and exponential-timeweighting. For example, on a Spark dosimeter LASmxsignifies the maximum, A weighted, SLOW level. Simi-larly, LCFmx signifies the maximum, C weighted, FASTlevel.
Lmin Lmin is the minimum value, expressed in dB, of the fre-quency and exponential-time weighted sound level (Lw) ina given time interval. For the Spark dosimeters, the timeinterval is the record’s Run Time.
On the Spark display, the Lmin annotation includes the cur-rent settings for frequency weighting and exponential-timeweighting. For example, on a Spark dosimeter LASmnsignifies the minimum, A weighted, SLOW level. Simi-larly, LCFmn signifies the minimum, C weighted, FASTlevel.
Ln An Ln is the frequency and exponential-time weightedsound level (Lw) that is exceeded n percent of the time in agiven time interval. In Blaze, the time interval is the record’sRun Time. For example, L10 is that sound level, expressedin dB, which was exceeded for 10% of the total Run Time.The default Ln percentages are 10, 30, 50, 70, 90. DifferentLn values can be entered and recalculated in Blaze.
Noise Dose Noise dose is the percentage of time that a person is exposedto noise that is potentially damaging to hearing. Zero repre-sents no exposure and 100 or more represents completeexposure. It is calculated by dividing the actual time ofexposure by the allowed time of exposure. The allowed timeof exposure is determined by the Criterion Duration and bythe sound level (the higher the level, the shorter the allowedtime). The sound levels must be measured with A-weightingin frequency and slow-exponential weighting in time.
SPARK and BLAZE User Manual Glossary C-5
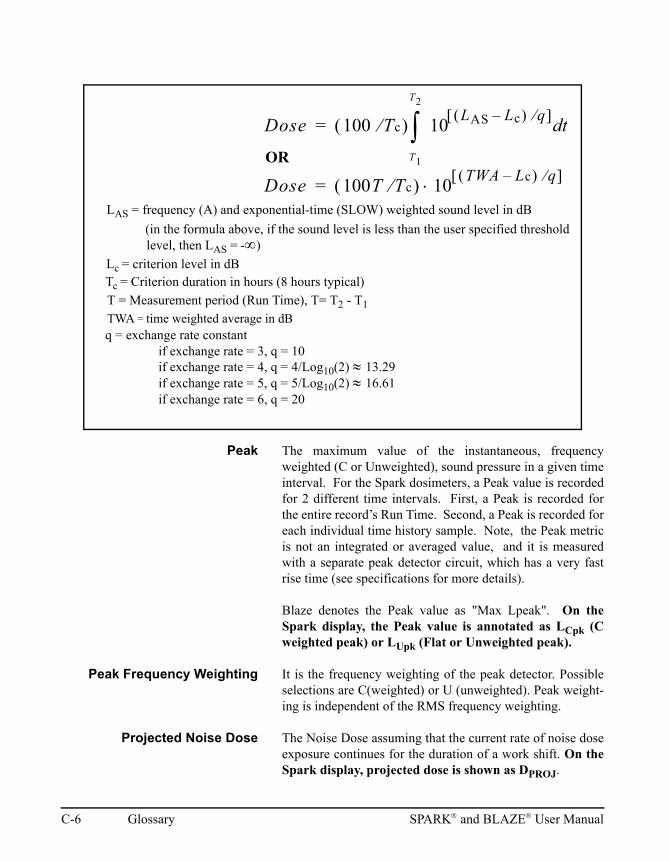
Peak The maximum value of the instantaneous, frequencyweighted (C or Unweighted), sound pressure in a given timeinterval. For the Spark dosimeters, a Peak value is recordedfor 2 different time intervals. First, a Peak is recorded forthe entire record’s Run Time. Second, a Peak is recorded foreach individual time history sample. Note, the Peak metricis not an integrated or averaged value, and it is measuredwith a separate peak detector circuit, which has a very fastrise time (see specifications for more details).
Blaze denotes the Peak value as "Max Lpeak". On theSpark display, the Peak value is annotated as LCpk (Cweighted peak) or LUpk (Flat or Unweighted peak).
Peak Frequency Weighting It is the frequency weighting of the peak detector. Possibleselections are C(weighted) or U (unweighted). Peak weight-ing is independent of the RMS frequency weighting.
Projected Noise Dose The Noise Dose assuming that the current rate of noise doseexposure continues for the duration of a work shift. On theSpark display, projected dose is shown as DPROJ.
Dose 100 Tc 10LAS Lc– q
td
T1
T2
=
T = Measurement period (Run Time), T= T2 - T1
Tc = Criterion duration in hours (8 hours typical)
LAS = frequency (A) and exponential-time (SLOW) weighted sound level in dB
Lc = criterion level in dB
q = exchange rate constant
Dose 100T Tc 10TWA Lc– q =
OR
(in the formula above, if the sound level is less than the user specified thresholdlevel, then LAS = -)
TWA = time weighted average in dB
if exchange rate = 3, q = 10if exchange rate = 4, q = 4/Log10(2) 13.29if exchange rate = 5, q = 5/Log10(2) 16.61if exchange rate = 6, q = 20
C-6 Glossary SPARK and BLAZE User Manual
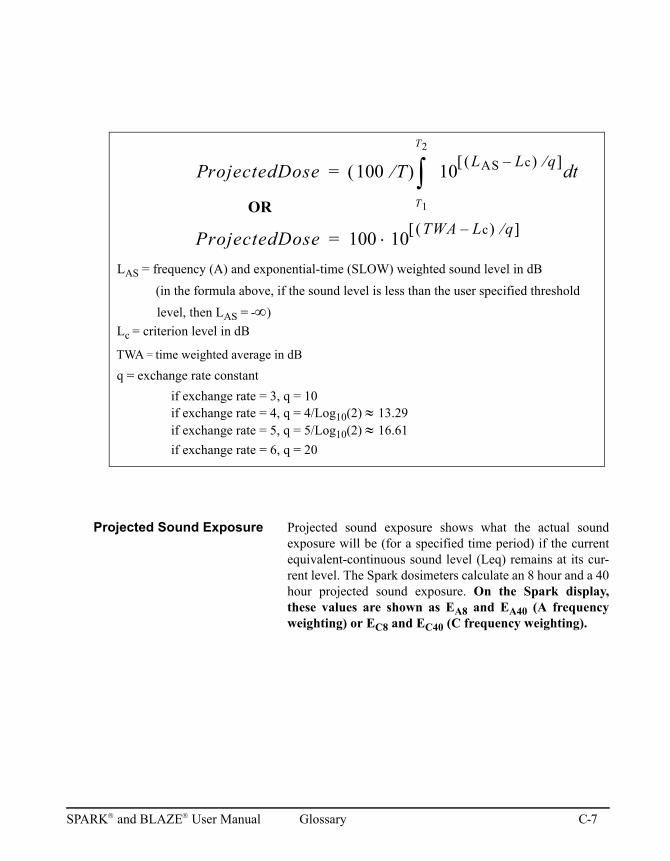
Projected Sound Exposure Projected sound exposure shows what the actual soundexposure will be (for a specified time period) if the currentequivalent-continuous sound level (Leq) remains at its cur-rent level. The Spark dosimeters calculate an 8 hour and a 40hour projected sound exposure. On the Spark display,these values are shown as EA8 and EA40 (A frequencyweighting) or EC8 and EC40 (C frequency weighting).
ProjectedDose 100 10TWA Lc– q =
ProjectedDose 100 T 10LAS Lc– q
td
T1
T2
=
OR
LAS = frequency (A) and exponential-time (SLOW) weighted sound level in dB
Lc = criterion level in dB
q = exchange rate constant
(in the formula above, if the sound level is less than the user specified threshold
level, then LAS = -)
TWA = time weighted average in dB
if exchange rate = 3, q = 10if exchange rate = 4, q = 4/Log10(2) 13.29if exchange rate = 5, q = 5/Log10(2) 16.61
if exchange rate = 6, q = 20
SPARK and BLAZE User Manual Glossary C-7
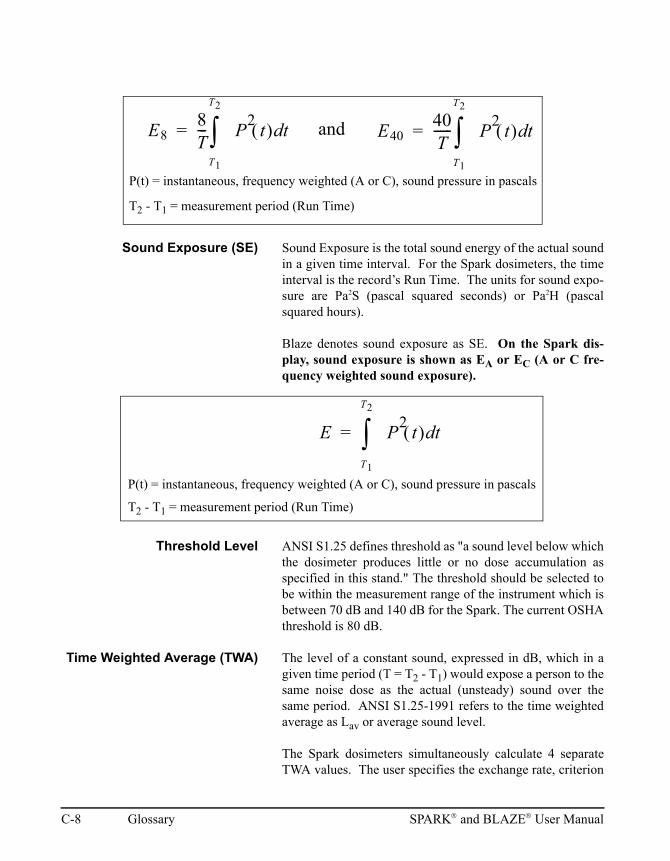
Sound Exposure (SE) Sound Exposure is the total sound energy of the actual soundin a given time interval. For the Spark dosimeters, the timeinterval is the record’s Run Time. The units for sound expo-sure are Pa2S (pascal squared seconds) or Pa2H (pascalsquared hours).
Blaze denotes sound exposure as SE. On the Spark dis-play, sound exposure is shown as EA or EC (A or C fre-quency weighted sound exposure).
Threshold Level ANSI S1.25 defines threshold as "a sound level below whichthe dosimeter produces little or no dose accumulation asspecified in this stand." The threshold should be selected tobe within the measurement range of the instrument which isbetween 70 dB and 140 dB for the Spark. The current OSHAthreshold is 80 dB.
Time Weighted Average (TWA) The level of a constant sound, expressed in dB, which in agiven time period (T = T2 - T1) would expose a person to thesame noise dose as the actual (unsteady) sound over thesame period. ANSI S1.25-1991 refers to the time weightedaverage as Lav or average sound level.
The Spark dosimeters simultaneously calculate 4 separateTWA values. The user specifies the exchange rate, criterion
E88T--- P
2t td
T1
T2
=
P(t) = instantaneous, frequency weighted (A or C), sound pressure in pascals
T2 - T1 = measurement period (Run Time)
and E4040T------ P
2t td
T1
T2
=
E P2
t td
T1
T2
=
P(t) = instantaneous, frequency weighted (A or C), sound pressure in pascals
T2 - T1 = measurement period (Run Time)
C-8 Glossary SPARK and BLAZE User Manual
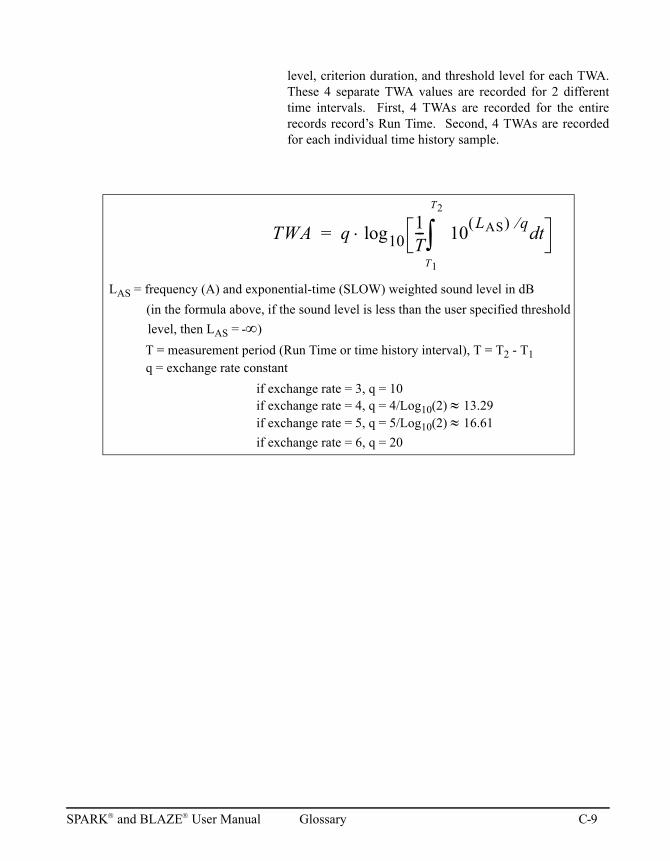
level, criterion duration, and threshold level for each TWA.These 4 separate TWA values are recorded for 2 differenttime intervals. First, 4 TWAs are recorded for the entirerecords record’s Run Time. Second, 4 TWAs are recordedfor each individual time history sample.
TWA q log101T--- 10
LAS qtd
T1
T2
=
LAS = frequency (A) and exponential-time (SLOW) weighted sound level in dB
(in the formula above, if the sound level is less than the user specified threshold
level, then LAS = -)
T = measurement period (Run Time or time history interval), T = T2 - T1q = exchange rate constant
if exchange rate = 3, q = 10if exchange rate = 4, q = 4/Log10(2) 13.29if exchange rate = 5, q = 5/Log10(2) 16.61
if exchange rate = 6, q = 20
SPARK and BLAZE User Manual Glossary C-9

C-10 Glossary SPARK and BLAZE User Manual
A P P E N D I X
D 706RC/705+/703+ IR Communications Troubleshooting
If you are having difficulty establishing communicationbetween your 706RC/705+/703+ and computer, this sectionis provided to help you with a few basic steps to setting upIR communication. This section will help you get yourinfrared communications working in the shortest amount oftime. If you prefer, feel free to call Larson Davis technicalsupport to help you with the infrared communications.Technical support is also available by e-mail:[email protected].
The First Step
The first step in solving problems in IR communications isto establish that the 706RC/705+/703+ is operating. If youare using a 706RC, it should be powered on. If you are usinga 705+/703+, the green LED should be blinking. If the unitsdo not power up, install new batteries. The 706RC can be setto automatically power down after a specified time fromwithin the power menu (see page 3-27). To disable thisfeature, set the AUTO OFF function on the 706RC TONEVER.
Still Having Problems? If you are still experiencing problems, please contact LarsonDavis technical support.
SPARK and BLAZE User Manual706RC/705+/703+ IR Communications Troubleshooting D-1
Additional IR Connection Solutions
The following suggestions and procedures will help inresolving most connection problems.
General Information
• Ensure the unit is powered on.
• Install new or freshly charged batteries.
• Ensure that IR interface module is firmly secured to thePC (either to the serial or USB port).
• For optimal data transfer performance, it is recom-mended that the instrument be placed a distance betweenone and three feet from the IR interface module.
• Ensure that the IR lens on both the instrument and the IRinterface module are clean and not obstructed from eachother.
• Ensure that all other Spark instruments are facing awayfrom the IR interface module.
• Ensure latest version of Blaze is being used. You can findthe version by clicking on Help on the main menu andAbout Blaze...
• If using in bright or direct sunlight, shade the instrumentand IR interface module.
• If instrument and IR interface module are sitting on areflective surface (i.e. gloss white or stainless steel sur-face) try moving them to a non-reflective surface.
USB Connection If a direct COM serial port is not available on the computerbeing used, a Larson Davis DVX010 USB-to-IR interfacemodule should be used instead.
Note: If the DVX010 is switched to adifferent USB port, reconfiguring theport through the Connections Set-tings dialog box is not necessary.
• Ensure the latest version of Blaze is being used. The ver-sion can be found by clicking on Help in the main menuand About Blaze.
• Try using the IR interface module with an externallypowered USB hub.
D-2 706RC/705+/703+ IR Communications Troubleshooting SPARK and BLAZE User Manual
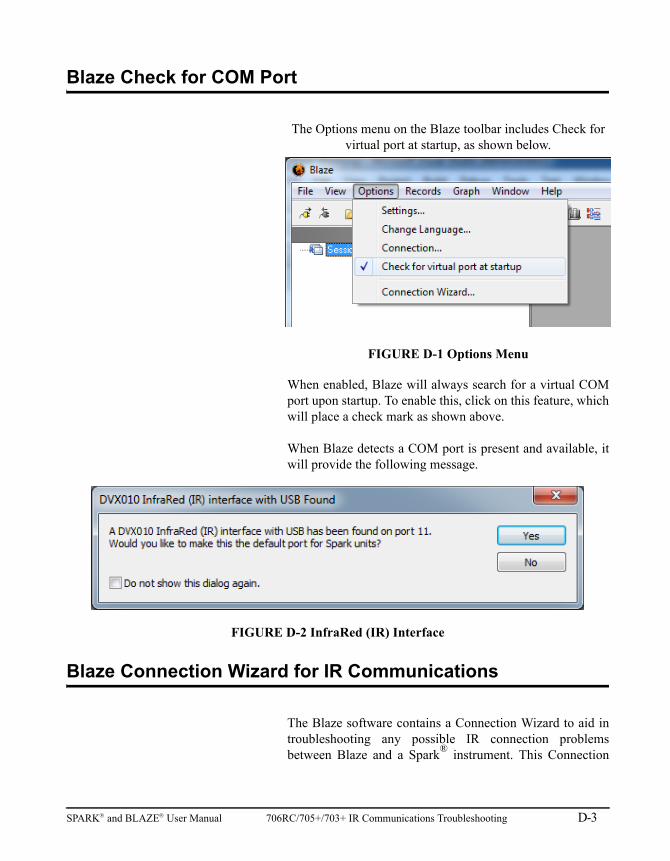
Blaze Check for COM Port
The Options menu on the Blaze toolbar includes Check for virtual port at startup, as shown below.
FIGURE D-1 Options Menu
When enabled, Blaze will always search for a virtual COMport upon startup. To enable this, click on this feature, whichwill place a check mark as shown above.
When Blaze detects a COM port is present and available, itwill provide the following message.
FIGURE D-2 InfraRed (IR) Interface
Blaze Connection Wizard for IR Communications
The Blaze software contains a Connection Wizard to aid introubleshooting any possible IR connection problemsbetween Blaze and a Spark
® instrument. This Connection
SPARK and BLAZE User Manual 706RC/705+/703+ IR Communications Troubleshooting D-3

Wizard will start automatically if an instrument is not foundon a connection attempt.
To start the Connection Wizard manually for initial setup,click on Options in the main menu and then on ConnectionWizard.
D-4 706RC/705+/703+ IR Communications Troubleshooting SPARK and BLAZE User Manual
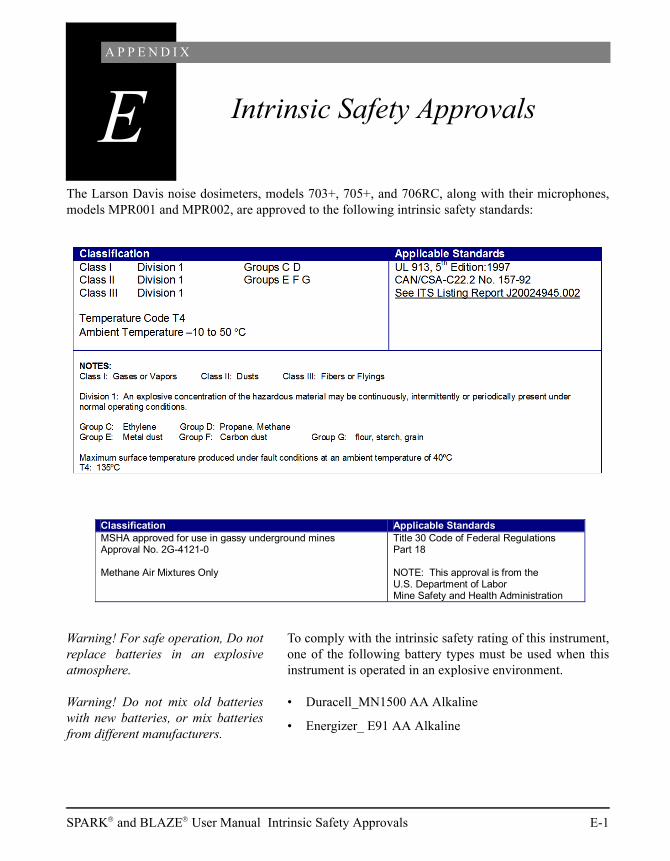
A P P E N D I X
E Intrinsic Safety Approvals
The Larson Davis noise dosimeters, models 703+, 705+, and 706RC, along with their microphones,models MPR001 and MPR002, are approved to the following intrinsic safety standards:
Warning! For safe operation, Do notreplace batteries in an explosiveatmosphere.
To comply with the intrinsic safety rating of this instrument,one of the following battery types must be used when thisinstrument is operated in an explosive environment.
Warning! Do not mix old batterieswith new batteries, or mix batteriesfrom different manufacturers.
• Duracell_MN1500 AA Alkaline
• Energizer_ E91 AA Alkaline
Classification Applicable Standards MSHA approved for use in gassy underground mines Approval No. 2G-4121-0 Methane Air Mixtures Only
Title 30 Code of Federal Regulations Part 18 NOTE: This approval is from the U.S. Department of Labor Mine Safety and Health Administration
SPARK and BLAZE User Manual Intrinsic Safety Approvals E-1
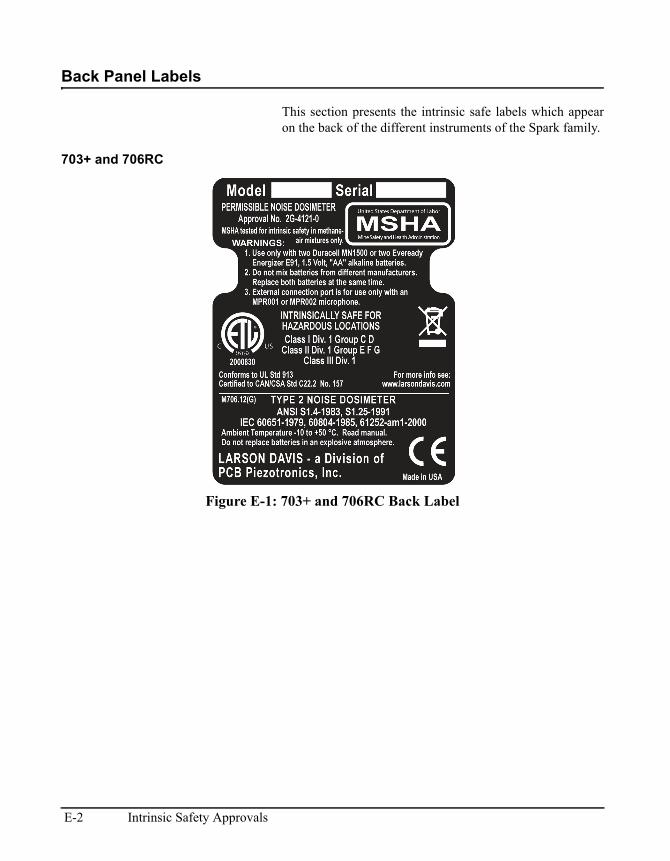
Back Panel Labels
This section presents the intrinsic safe labels which appearon the back of the different instruments of the Spark family.
703+ and 706RC
Figure E-1: 703+ and 706RC Back Label
E-2 Intrinsic Safety Approvals
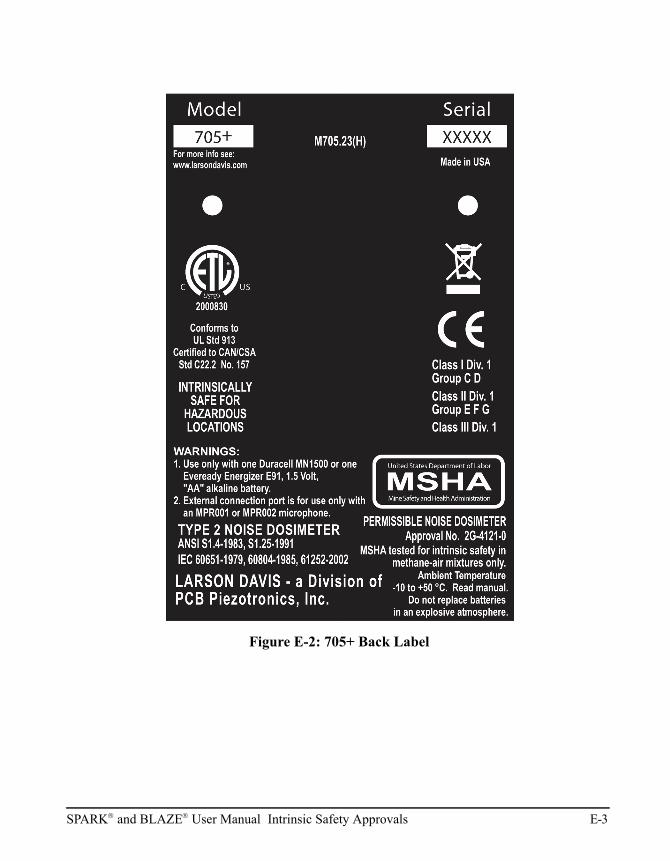
Figure E-2: 705+ Back Label
SPARK and BLAZE User Manual Intrinsic Safety Approvals E-3

E-4 Intrinsic Safety Approvals


