
I2C Exerciser User's Manual - Corelis · 2017-07-28 · Edition 3, May 2006 Edition 4, June 2006...
250
Corelis, Inc. 13100 Alondra Blvd. Cerritos, CA 90703 Telephone: 562.926.6727 • Fax: (562) 404-6196 CORELIS 1 BusPro-I ™ I2C Bus Analyzer, Exerciser, Programmer, and Tester User’s Manual
Transcript of I2C Exerciser User's Manual - Corelis · 2017-07-28 · Edition 3, May 2006 Edition 4, June 2006...

Corelis, Inc.13100 Alondra Blvd. Cerritos, CA 90703
Telephone: 562.926.6727 • Fax: (562) 404-6196
CORELIS1
BusPro-I ™
I2C Bus Analyzer, Exerciser, Programmer, and Tester
User’s Manual


Preface i
Preface
Copyright © 2006-2017, Corelis Inc.
PRINTING HISTORY
Edition 1, February 2006Edition 2, March 2006Edition 3, May 2006Edition 4, June 2006Edition 5, November 2006Edition 6, October 2007Edition 7, July 2008Edition 8, January 2009Edition 9, January 2010Edition 10, February 2011Edition 11, October 2012Edition 12, October 2013Edition 13, October 2016Edition 14, July 2017
GENERAL NOTICEInformation contained in this document is subject to change without notice. CORELIS shall not be liablefor errors contained herein for incidental or consequential damages in connection with the furnishing,performance, or use of material contained in this manual.This document contains proprietary information that is protected by copyright. All rights reserved. No partof this document may be reproduced or translated to other languages without the prior written consent ofCORELIS. This manual is a CORELIS proprietary document and may not be transferred to another partywithout the prior written permission of CORELIS.CORELIS assumes no responsibility for the use of or reliability of its software on equipment that is notfurnished by CORELIS.
ENVIRONMENTAL NOTICE
This product must be disposed of in accordance with the WEEE directive.
TRADEMARK NOTICEI2C Bus is a registered trademark of Philips Electronics N.V.Pentium and SMBus are registered trademarks of Intel Corporation.Windows is a registered trademark of Microsoft Corporation.Other products and services named in this book are trademarks or registered trademarks of theirrespective companies. All trademarks and registered trademarks in this book are the property of theirrespective holders.

ii
PRODUCT WARRANTY AND SOFTWARE MAINTENANCEFor product warranty and software maintenance information, see the PRODUCT WARRANTY ANDSOFTWARE MAINTENANCE POLICY statement included with your product shipment.
EXCLUSIVE REMEDIESTHE REMEDIES CONTAINED HEREIN ARE THE CUSTOMER'S SOLE AND EXCLUSIVE REMEDIES.CORELIS SHALL NOT BE LIABLE FOR ANY DIRECT, INDIRECT, SPECIAL, INCIDENTAL, ORCONSEQUENTIAL DAMAGES, WHETHER BASED ON CONTRACT, TORT, OR ANY OTHER LEGALTHEORY.
Product maintenance agreements and other customer assistance agreements are available for Corelisproducts. For assistance, contact your nearest Corelis Sales and Service Office.
RETURN POLICYNo items returned to CORELIS for warranty, service, or any other reason shall be accepted unless firstauthorized by CORELIS, either direct or through its authorized sales representatives. All returned itemsmust be shipped pre-paid and clearly display a Return Merchandise Authorization (RMA) number on theshipping carton. Freight collect items will NOT be accepted.
Customers or authorized sales representatives must first contact CORELIS with notice of request forreturn of merchandise. RMAs can only originate from CORELIS. If authorization is granted, an RMAnumber will be forwarded to the customer either directly or through its authorized sales representative.
CONTACT INFORMATIONThe latest news, tips and updates on the Corelis bus analyzer hardware and software products can befound in the Corelis user forums. The forums are provided as a free service to our existing customers butan individual user name and password is required. To request an account, please visitforums.corelis.com/register.php
For sales inquiries, please contact [email protected].
For any support related questions, please enter a support request at www.corelis.com/support or [email protected].
For more information about other products and services that Corelis offers, please visit www.corelis.com

iii
Table of Contents
Chapter 1 Product Overview ...................................................................................... 1Introduction to I2C and SMBus.............................................................................................................. 1
Introduction to the BusPro-I™ .............................................................................................................. 2
Software Toolset..................................................................................................................................... 3
Hardware Features ................................................................................................................................. 4
Host Computer Requirements............................................................................................................... 6
Chapter 2 Installation.................................................................................................. 7Installing the I2C Exerciser Application Software............................................................................... 8
BusPro-I Hardware Installation ...........................................................................................................17
Chapter 3 Getting Started......................................................................................... 23Overview................................................................................................................................................23
Tutorial – Using Demo Mode ...............................................................................................................23
Tutorial – Using Live Mode..................................................................................................................74
Chapter 4 Connecting to a Target............................................................................ 91Connecting the I2C Signals..................................................................................................................91
Interface Setup......................................................................................................................................93
Chapter 5 Bus Traffic Monitor................................................................................ 103Trace Listing .......................................................................................................................................104
Timing Field.........................................................................................................................................107
Monitor Configurations......................................................................................................................110
Monitor Preferences ...........................................................................................................................117
Monitor Trigger ...................................................................................................................................121
Monitor Window Reference ...............................................................................................................134
Chapter 6 Interactive Debugger............................................................................. 149Send Data ............................................................................................................................................150
Receive Data .......................................................................................................................................152
Debugger Script..................................................................................................................................154
Debugger Options ..............................................................................................................................157
Debugger Window Reference............................................................................................................159
iv
Chapter 7 Serial EEPROM Programmer................................................................ 163Programmer Operations ....................................................................................................................164
Programmer Options..........................................................................................................................168
Programmer Window Reference .......................................................................................................169
Chapter 8 Configuration and Preferences ............................................................ 173Configuration Manager ......................................................................................................................173
Preferences Dialog .............................................................................................................................187
Using Project Files .............................................................................................................................192
Calibration ...........................................................................................................................................194
Chapter 9 Third Party Application Interface ......................................................... 197Overview..............................................................................................................................................197
Dynamic Link Library (DLL)...............................................................................................................198
General Calling Sequence .................................................................................................................199
Function Reference ............................................................................................................................200
Appendix A BusPro-I Hardware Reference.......................................................... 233Hardware Specifications....................................................................................................................233
Electrical Specifications ....................................................................................................................234

v
List of Figures
Figure 1. I2C Bus Topology .......................................................................................................................... 1Figure 2. Illustration of the BusPro-I............................................................................................................. 2Figure 3. I2C Exerciser Installation Wizard .................................................................................................. 8Figure 4. Windows Run Dialog..................................................................................................................... 9Figure 5. License Agreement Screen........................................................................................................... 9Figure 6. Customer Registration Screen....................................................................................................10Figure 7. Destination Folder Screen ..........................................................................................................11Figure 8. Select Program Folder Screen....................................................................................................12Figure 9. Completing the Installation Wizard Screen.................................................................................13Figure 10. Windows 7 Security Warning Pop-up Window .........................................................................14Figure 11. Windows XP Logo Test Warning Pop-up Window....................................................................14Figure 12. Software Installation Button on the Windows XP Task Bar ......................................................15Figure 13. Installation Completed Screen ..................................................................................................16Figure 14. Found New Hardware Wizard - Welcome Screen (Windows XP) ............................................17Figure 15. Found New Hardware Wizard - Install Options (Windows XP).................................................18Figure 16. Windows XP Logo Test Warning Pop-up Window....................................................................19Figure 17. Found New Hardware Wizard – Installation Complete (Windows XP) .....................................20Figure 18. Windows Device Manager (Windows XP) ................................................................................21Figure 19. Initial I2C Exerciser Warning Message when BusPro-I is Not Initially Connected ...................24Figure 20. Tools Menu Demo Mode Selection...........................................................................................25Figure 21. Status Bar Indicating Demo Mode ............................................................................................25Figure 22. Begin Monitor Data Collection ..................................................................................................26Figure 23. Demo Mode Reminder Pop-up Window ...................................................................................26Figure 24. Run Status Tab .........................................................................................................................27Figure 25. Monitor Window Centered on Trigger Line ...............................................................................28Figure 26. Monitor Window Right-Click Pop-up Menu ...............................................................................29Figure 27. Monitor Window Trace List Positioned on Trigger Line ............................................................30Figure 28. Monitor Window Right-Click Pop-up Menu Selecting Trigger Settings.....................................31Figure 29. Configuration Manager Trigger Setup Screen ..........................................................................32Figure 30. Monitor Window Trace List Column Headings..........................................................................33Figure 31. I2C Exerciser Status Bar...........................................................................................................33Figure 32. Go to Start Tool Bar Button.......................................................................................................34Figure 33. Monitor Window Trace List Showing Symbolic Address and Data Entries...............................35Figure 34. Configuration Manager Symbols Definition Screen ..................................................................36Figure 35. Symbol Definition Dialog...........................................................................................................37Figure 36. Configuration Manager Symbols Definition Screen with DAC Symbol.....................................38Figure 37. Monitor Window Trace List Showing New DAC Symbolic Address Entries .............................39Figure 38. Monitor Window Trace List Data Byte Column Right-Click Pop-up Menu................................40Figure 39. Monitor Window Trace List Data Column with Symbols Disabled............................................41Figure 40. Monitor Window Trace List Data Byte Column Right-Click Pop-up Menu................................42Figure 41. Monitor Window Trace List Data Column with Data Bytes in Binary Format............................42Figure 42. Monitor Window Trace List Data Byte Column Right-Click Pop-up Menu................................43Figure 43. Monitor Window Trace List in Compact Mode ..........................................................................44Figure 44. Monitor Window Trace List in Compact Mode with Data Bytes Pop-up Window .....................45Figure 45. Monitor Window Trace List I/O 2 Right-Click Pop-up Menu .....................................................46Figure 46. Dragging Monitor Window Trace List I/O 1 Column Heading...................................................46Figure 47. Monitor Window Trace List with Rearranged I/O Columns.......................................................47Figure 48. Trace Layout Dialog..................................................................................................................48

vi
Figure 49. Monitor Window Timing Display................................................................................................49Figure 50. Monitor Window Trace List Positioned on Cursor A Line .........................................................50Figure 51. Monitor Window Trace List Positioned on Cursor B Line .........................................................51Figure 52. Monitor Window Timing Display Showing Edges Zoomed in at Line 100 ................................52Figure 53. Monitor Window Timing Display Measuring the Time Between Cursors A & B .......................53Figure 54. Go to Start Tool Bar Button.......................................................................................................54Figure 55. Find Tool Bar Button .................................................................................................................55Figure 56. Find Dialog ................................................................................................................................55Figure 57. Find a Data Value of 2E............................................................................................................57Figure 58. Monitor Window Trace List Showing Find 2E Data Result .......................................................58Figure 59. Find a Data Value of 72 ............................................................................................................59Figure 60. Clear Tagged Rows Prompt......................................................................................................59Figure 61. Matched Transactions Prompt ..................................................................................................60Figure 62. Monitor Window Trace List Showing Find 72 Data Result .......................................................60Figure 63. Go to Tagged Row Tool Bar Button..........................................................................................61Figure 64. Monitor Window Trace List Showing the Second Find 72 Data Result ....................................61Figure 65. Monitor Colors Preferences Screen..........................................................................................62Figure 66. Monitor Colors Preferences Screen Changing Cursor A Background Color ............................63Figure 67. Monitor Window with Updated Cursor A Colors .......................................................................64Figure 68. Monitor Window with Updated Cursor A Colors .......................................................................65Figure 69. Monitor Window with Alternating Row Colors...........................................................................66Figure 70. Monitor Window Trace List with the Trigger Line Centered......................................................67Figure 71. Monitor Options Preferences Screen........................................................................................68Figure 72. Monitor Window Trace List with Trigger at Line Zero Numbering ............................................69Figure 73. Monitor Window Trace List with Trigger is Time Zero Timestamps..........................................70Figure 74. Monitor Window Trace List with Relative Timestamps .............................................................71Figure 75. Monitor Window Trace List Showing Addresses in FE mode...................................................72Figure 76. Monitor Window Trace List Showing Addresses in 7F mode ...................................................73Figure 77. Tools Menu Deselect Demo Mode............................................................................................74Figure 78. Status Bar Indicating Live Data Mode ......................................................................................74Figure 79. Analyzer Supplied Mode Prompt ..............................................................................................75Figure 80. Debugger Window ....................................................................................................................76Figure 81. Byte Sent From the Debugger ..................................................................................................77Figure 82. Receive Three Bytes in the Debugger ......................................................................................78Figure 83. Capture of Debugger Send .......................................................................................................79Figure 84. Tutorial Script Loaded Into Debugger .......................................................................................80Figure 85. Capture of Debugger Script ......................................................................................................81Figure 86. Set Discrete I/O Modes.............................................................................................................82Figure 87. Debugger Discrete I/O Script ....................................................................................................83Figure 88. Monitor Debugger Discrete I/O Manipulation............................................................................83Figure 89. Debugger Close ........................................................................................................................84Figure 90. SMBus Raw Data......................................................................................................................85Figure 91. SMBus Pane Before Associating Decoder File ........................................................................86Figure 92. SMBus Decoder File Dialog with TC74 Information .................................................................87Figure 93. Switch to SMBus Mode.............................................................................................................88Figure 94. SMBus Decoded Data ..............................................................................................................88Figure 95. Decoded SMBus Message ToolTip ..........................................................................................89Figure 96. SMBus Data Window ................................................................................................................89Figure 97. RJ45 Connector Pin Numbering ...............................................................................................92Figure 98. Configuration Manager .............................................................................................................94Figure 99. Analyzer Supplied Voltage Prompt ...........................................................................................95Figure 100. Configuration Manager Analyzer Supplied .............................................................................96Figure 101. Configuration Manager Settings Pane....................................................................................98Figure 102. Bus Electrical Features ...........................................................................................................99Figure 103. Bus Drive and Monitoring Features ......................................................................................100
vii
Figure 104. Input/Output Signals .............................................................................................................101Figure 105. Monitor Buffer Options ..........................................................................................................102Figure 106. Monitor Window ....................................................................................................................103Figure 107. Monitor Trace Listing ............................................................................................................104Figure 108. Monitor Timing Field .............................................................................................................107Figure 109. Timing Field Popup Menu .....................................................................................................109Figure 110. Filters Pane ...........................................................................................................................111Figure 111. Filter Definition Dialog (similar to Edit)..................................................................................112Figure 112. Symbols Pane.......................................................................................................................113Figure 113. Symbol Definition Dialog.......................................................................................................114Figure 114. SMBus Pane .........................................................................................................................115Figure 115. SMBus Decoder File Dialog..................................................................................................116Figure 116. Monitor Colors Pane .............................................................................................................117Figure 117. Monitor Options Pane ...........................................................................................................119Figure 118. Formats Pane........................................................................................................................120Figure 119. Trigger Tab on Monitor Tools Dialog ....................................................................................121Figure 120. Trigger on Single Event ........................................................................................................125Figure 121. Trigger on Repeated Single Event........................................................................................126Figure 122. Trigger on Sequence of Multiple Events ...............................................................................127Figure 123. Trigger on Consecutive Sequence of Events .......................................................................128Figure 124. Trigger Dialog........................................................................................................................129Figure 125. Context Popup Menu on Trigger Definition Tree ..................................................................130Figure 126. Create New Trigger Dialog ...................................................................................................131Figure 127. Active Trigger Operation Status............................................................................................133Figure 128. I2C Exerciser Monitor Window Layout..................................................................................134Figure 129. Monitor File Menu .................................................................................................................135Figure 130. Monitor Trace Menu..............................................................................................................136Figure 131. Trace | Execute Submenu ....................................................................................................137Figure 132. Run Status Tab on Monitor Tools Window ...........................................................................138Figure 133. Trace | Go To Submenu .......................................................................................................139Figure 134. Trace | View Submenu..........................................................................................................140Figure 135. Monitor Find Dialog – Regular ..............................................................................................141Figure 136. Monitor Find Dialog – Compact ............................................................................................141Figure 137. Trace Layout Dialog..............................................................................................................143Figure 138. Tools Menu ...........................................................................................................................144Figure 139. Monitor Window Menu ..........................................................................................................145Figure 140. Monitor Help Menu................................................................................................................145Figure 141. Monitor Tool Bar....................................................................................................................146Figure 142. Debugger Window ................................................................................................................149Figure 143. Debugger Send Controls ......................................................................................................150Figure 144. Debugger Receive Controls..................................................................................................152Figure 145. Debugger Options Pane .......................................................................................................157Figure 146. I2C Exerciser Debugger Window Layout ..............................................................................159Figure 147. Debugger File Menu .............................................................................................................160Figure 148. Debugger Tool Bar................................................................................................................161Figure 149. Programmer Window ............................................................................................................164Figure 150. Programmer Read Window...................................................................................................166Figure 151. Programming Progress Window ...........................................................................................167Figure 152. Verifying Progress Window...................................................................................................167Figure 153. Erasing Progress Window.....................................................................................................167Figure 154. Programmer Options Pane ...................................................................................................168Figure 155. I2C Exerciser Programmer Window......................................................................................169Figure 156. Programmer File Menu .........................................................................................................170Figure 157. Programmer Tool Bar ...........................................................................................................171Figure 158. Configuration Manager Dialog Panes (Settings selected) ....................................................174

viii
Figure 159. Filters Pane ...........................................................................................................................176Figure 160. Filter Definition Dialog (similar to Edit)..................................................................................177Figure 161. Symbols Pane.......................................................................................................................178Figure 162. Symbol Definition Dialog.......................................................................................................179Figure 163. SMBus Pane .........................................................................................................................180Figure 164. SMBus Decoder File Dialog..................................................................................................181Figure 165. Settings Pane........................................................................................................................182Figure 166. Files Pane .............................................................................................................................186Figure 167. Monitor Colors Pane .............................................................................................................187Figure 168. Monitor Options Pane ...........................................................................................................188Figure 169. Debugger Options Pane .......................................................................................................189Figure 170. Programmer Options Pane ...................................................................................................190Figure 171. Formats Pane........................................................................................................................191Figure 172. Title Bar for a New Project ....................................................................................................192Figure 173. Title Bar for a Saved Project .................................................................................................193Figure 174. File Menu MRU Project List ..................................................................................................193Figure 175. Calibration Prompt ................................................................................................................194Figure 176. Calibration Warning ..............................................................................................................194Figure 177. Calibration Status..................................................................................................................195Figure 178. Calibration Complete ............................................................................................................195

ix
List of Tables
Table 1. Optional Interface Cables ............................................................................................................... 7Table 2. Flying Leads Serial Bus Connector Pin Assignments ..................................................................91Table 3. 4-Pin Crimp Cable Pin Assignments ............................................................................................92Table 4. Summary of available Trigger Components ...............................................................................122Table 5. Monitor Window Layout ..............................................................................................................134Table 6. Monitor Tool Bar Functions ........................................................................................................147Table 7. Debugger Script Keywords.........................................................................................................155Table 8. Debugger Window Layout ..........................................................................................................159Table 9. Debugger Tool Bar Functions.....................................................................................................161Table 10. Programmer Function Descriptions ..........................................................................................165Table 11. Programmer Read Contents Window Function Descriptions...................................................166Table 12. Programmer Window Areas .....................................................................................................169Table 13. Programmer Tool Bar Functions ..............................................................................................171Table 14. Configuration Manager Panes..................................................................................................175Table 15. DLL Components......................................................................................................................198Table 16. I2C DLL Functions....................................................................................................................201


Introduction xi
Introduction
What this User’s Manual CoversThis User’s Manual was designed to make using your BusPro-I™ analyzer and its software easier andmore efficient. The manual contains easy to navigate tutorials and reference information that arepresented in a logical progression.
The following briefly summarizes each chapter:
Chapter 1: Product OverviewThis chapter provides you with an introduction to the I2C bus and SMBus as well as a description of theBusPro-I analyzer and software application features.
Chapter 2: InstallationIn this chapter you will learn how to install the I2C Exerciser software and the BusPro-I hardware.
Chapter 3: Getting StartedThis chapter introduces you to the basic usage of the BusPro-I for monitoring and generating bus traffic,writing debug scripts, and working with EEPROM devices. Although it is possible to explore thecapabilities of the BusPro-I on your own, working through this chapter will provide you with an immediatefeel for its ease of use and core functionality.
Chapter 4: Connecting to a TargetThis chapter provides you with instructions on how to hook up the BusPro-I to a target board anddescribes the initial software settings that you should be aware of to have the BusPro-I working properly.
Chapter 5: Bus Traffic MonitorThis chapter describes the features of the Monitor window which is used to collect and analyze trafficfrom the target I2C bus.
Chapter 6: Interactive DebuggerThis chapter describes the features of the Debugger which is used to manually generate traffic andinteract with the target I2C bus.
Chapter 7: Serial EEPROM ProgrammerThis chapter describes the features of the Programmer which is used to read and write the content ofEEPROM memory devices on the target I2C bus.

xii Introduction
Chapter 8: Configuration and PreferencesThis chapter describes all of the various project options and settings that can be found in theConfiguration Manager and Preferences dialogs.
Chapter 9: Third Party Application InterfaceThis chapter provides a reference on all of the function calls available for use in third party softwareapplications that control the BusPro-I analyzer through the provided dynamic link library (DLL).
Appendix A: BusPro-I Hardware ReferenceThis appendix presents the physical and electrical specifications for the BusPro-I hardware.

Product Overview 1
Chapter 1Product Overview
BusPro-I™ Bus Analyzer and I2C Exerciser product overview
Introduction to I2C and SMBusThe I2C bus was developed by Philips for basic communication between devices. It has since evolved,increasing in performance and finding many new applications including data transfer and system-levelcommand-and-control.
As shown in Figure 1, the physical I2C bus consists of two bidirectional open-drain signals and a commonground. The two active signals on the bus consist of a serial data line (SDA) and a serial clock line (SCL),each requiring a system voltage reference through a pull-up resistor. Every device connected to the busis software addressable by a unique address and masters can operate as master-transmitters or asmaster-receivers. The I2C bus supports a multi-master bus methodology including collision detection andarbitration to avoid data corruption if two or more masters simultaneously initiate data transfer. Serial, 8-bit oriented bidirectional data transfers can be made at up to 100 Kbit/s in the Standard mode or up to400 Kbit/s in the Fast mode.
Figure 1. I2C Bus Topology
The System Management Bus, or SMBus, was defined by Intel® Corporation in 1995 and is based on theI2C bus architecture. It is used in personal computers and servers for low-speed system managementcommunications.
SMBus is a two-wire interface through which simple system and power management related chips cancommunicate with the rest of the system. A system using SMBus as a control bus for these system andpower management related tasks pass messages to and from devices by addressed transfers, enablingmoderate transfer rates using minimal board resources. With System Management Bus, for example, a

2 Product Overview
device can provide manufacturer information, tell the system what its model/part number is, save its statefor a suspend event, report different types of errors, accept control parameters, and return its status. TheSMBus may share the same host device and physical bus with standard I2C components. Intel originallyconceived the SMBus as the communication bus to accommodate Smart Batteries and other system andpower management components.
Introduction to the BusPro-I™The Corelis BusPro-I is an I2C-bus/SMBus analyzer, exerciser, programmer, and tester. This advancedinstrument is used to:
Monitor and log I2C bus traffic in real-time Generate traffic to exercise the bus and communicate with its slave components Program and read in-system EEPROMs
Because of its rich feature set and ease-of-use, the BusPro-I can be used in a variety of applications,such as product development, troubleshooting, validation, system integration, production, and fieldtesting.
The BusPro-I pod, shown in Figure 2, connects to the PC via a high-speed USB 2.0 port and can operateeither with the provided I2C Exerciser software application, or using the included API of C/C++ libraryfunction calls from third party software applications such as National Instruments’ LabWindows/CVI andLabVIEW, or custom user-developed software.
Figure 2. Illustration of the BusPro-I

Product Overview 3
Software Toolset
MonitorUsing the Monitor tool, the BusPro-I listens and records all I2C bus traffic while displaying it as bothstate and timing information. Transactions can be examined and stored to files and later retrieved forreview. Monitor features include message filtering, symbolic translation of numeric values, and eventtriggering. The BusPro-I continually verifies compliance to the bus protocol and flags errors when itdetects a protocol violation. Concurrent with the bus transaction state listings, a timing display forboth the SCL and SDA signals is depicted showing the edge transition history.
DebuggerUsing the Debugger tool, the BusPro-I can be utilized to send and receive individual messages on theI2C bus. Looping is supported for repeating I/O patterns to facilitate external signal observation.Storing and restoring files allows saving of received data for post-analysis and reuse of previouslysent message scripts. A callable API library distributed as a Windows DLL further enables access tothe I2C bus from 3rd-party applications outside of the I2C Exerciser GUI.
ProgrammerUsing the Programmer tool, the BusPro-I can be utilized to perform high speed programming of I2C-compatible serial EEPROM memory devices, with a user interface similar to the Corelis ScanExpressProgrammer boundary-scan in-system programming product. Devices can be programmed in-systemand at maximum programming speed, which is typically within several seconds depending on thememory size. The Programmer provides options to Erase, Program, Verify, and Read targetEEPROM memory. The content of the EEPROM memory device can be saved to a file in a supportedfile format including Motorola S-Record, Intel Hex, and a hex-text file format.

4 Product Overview
Hardware FeaturesThe main hardware features of the BusPro-I are described in the following sections.
I2C Speed SupportThe BusPro-I operates using the Standard/Fast-mode/Fast-mode Plus protocol over its entireperformance range for both monitoring and driving the bus (up to 5 MHz). The High-speed mode(Hs-mode) is supported for monitoring only. Additionally, an accelerated rising slope control feature isincluded to facilitate the driving of higher capacitance targets at high clock rates.
USB Port Host InterfaceThe BusPro-I uses a high-speed USB 2.0 interface for easy connection to a PC. The host PC suppliesoperating power to the unit and the hot-plug feature of the USB standard is fully supported. You simplyplug the BusPro-I into a PC USB 2.0 socket and it will be automatically detected, configured, and thenready to go.
A USB 2.0 port on the host computer is required for optimal performance. The BusPro-I does not supportUSB 1.1 ports.
Software Programmable Voltage Levels and Pull-Up ResistorsThe I2C bus reference voltage can be programmed as target-driven (Target Supplied mode) through itsown pull-ups or as driven from the BusPro-I (Analyzer Supplied mode) through instrument pull-ups. Whenthe BusPro-I is programmed to source this reference level (for both SCL and SDA signals), the voltagecan be set in 100 mV steps from 0.8V to 5.0V. In this case, the target pull-ups should be removed toprevent contention with the analyzer.
In addition, for the Analyzer Supplied mode reference voltage, you can select one of a set of pull-upresistors with the same value for both bus signals. The resistor values can be set from about 250 to 50Kohms in varying increments.
The TTL output signal level of the set of discrete I/O and trigger lines is programmable from 1.25V to 3.3Vin steps of 50 mV.
Furthermore, sensed bus signal high and low threshold levels can each be adjusted, supporting the bushysteresis requirement. Default software-determined values are provided automatically with user overridecapability.

Product Overview 5
Programmable Clock RateThe BusPro-I clock rate is software programmable when it drives the bus. It supports Standard-mode,Fast-mode, and Fast-mode Plus transfers up to 5 Mbits/sec and many intermediate rates. The target busconditions, especially pull-up values and parasitic capacitance, can limit the upper rate of operation. Theability of the analyzer to track the signals is also affected by receive threshold voltage settings. The usershould be aware of the analog behavior of the bus signals, especially slow rise-times, and theirrelationship to transitions at higher clock rates.
This clock rate setting does not apply to target master clocks which are not driven but are only monitoredby the BusPro-I. In such cases, the rate is automatically tracked up to 5 MHz.
When the BusPro-I drives the bus, it also automatically synchronizes the clock signal in compliance withthe I2C specification’s multi-master requirements.
Discrete I/O SignalsTwo programmable general purpose lines can be operated under PC host software control and areavailable to stimulate the target system or sense target conditions in coordination with its testing. Eachline is programmable as an input, a TTL output, or an open-drain output. The voltage level of thesesignals is programmable independent of I2C bus levels. The state of these signals is monitored anddisplayed in the trace listing while collecting bus traffic and they can contribute to trigger conditions.
Each one of the two discrete lines can source 12 mA and can be used as a limited programmable powersource to a target when configured as a TTL output.
Power RequirementsThe BusPro-I receives the standard power available from the host USB port.
Built-in Self-TestThe BusPro-I has a built-in self-test capability. Logic is provided to loop back bus signals from the targetconnector. This enables a basic go/no-go confidence testing of its operation. It is launched from the Toolsmenu and requires that there be no external target attached.
CalibrationSince the electrical characteristics of each individual BusPro-I and host USB bus can be slightly different,the BusPro-I includes a calibration feature to optimize output when using it to supply pull-up voltage to atarget bus. Calibration also adjusts the output voltage of the two discrete I/O signals.

6 Product Overview
Host Computer RequirementsI2C Exerciser is a 32-bit Microsoft Windows®-based application which controls the BusPro-I. The PC onwhich it will be installed should meet the following minimum requirements:
One available USB 2.0 PortWindows® XP (SP2), Windows® Vista, Windows® 7, or Windows® 83.2 GHz Pentium® 4 Processor (or equivalent)1 GB of RAM600 MB of Free Hard Disk Space (2 GB or more for continuous logging of trace data)CD-ROM Drive

Installation 7
Chapter 2Installation
Installing the I2C Exerciser software and the BusPro-I hardware
Prior to installation, please verify that the following I2C Exerciser software and BusPro-I hardwarematerials are present and free from visible damage or defects. If anything appears to be missing ordamaged, please contact Corelis immediately.
The BusPro-I product consists of the following components:- BusPro-I Hardware- 6’ USB 2.0 Cable- 12” I2C Target Interface Cable consisting of flying leads with test clips (Part# 15438-2)- Corelis I2C Bus Analyzer, Exerciser, Programmer, and Tester CD-ROM containing the I2C
Exerciser application, support software and example target test files
Your application may require additional optional interface cables. Table 1 lists the optional target interfacecables available from Corelis.
Cable Description Corelis Part Number
24” I2C Target Interface Flying Leads with Test Clips 15438-3
6” I2C Target Interface 4-pin Crimp Connector 15431-1
12” I2C Target Interface 4-pin Crimp Connector 15431-2
24” I2C Target Interface 4-pin Crimp Connector 15431-3
Table 1. Optional Interface Cables

8 Installation
Installing the I2C Exerciser Application SoftwareYou must first install the I2C Exerciser application software, and then connect the BusPro-I controller. Theapplication software contains the driver for the BusPro-I.
The BusPro-I controller is a hot-pluggable USB device. However, you should not plug in or unplug theBusPro-I while the I2C Exerciser application is running. The BusPro-I CD-ROM contains the installationprogram. Windows will automatically recognize and configure the BusPro-I the first time it is detected inyour system. Administrator rights are required to install the software on Windows XP.
If the I2C Exerciser is already installed on your system, skip this chapter and proceed to chapters 3and 4.
To install the software:Close any Windows applications that are currently running.Disable any memory resident virus checking software. The software may interfere with the installationprocess.Insert the Corelis I2C Exerciser CD-ROM into your CD drive. The installation program should startautomatically and display the Welcome to the Installation Wizard screen as shown in Figure 3.
Figure 3. I2C Exerciser Installation Wizard
Installation 9
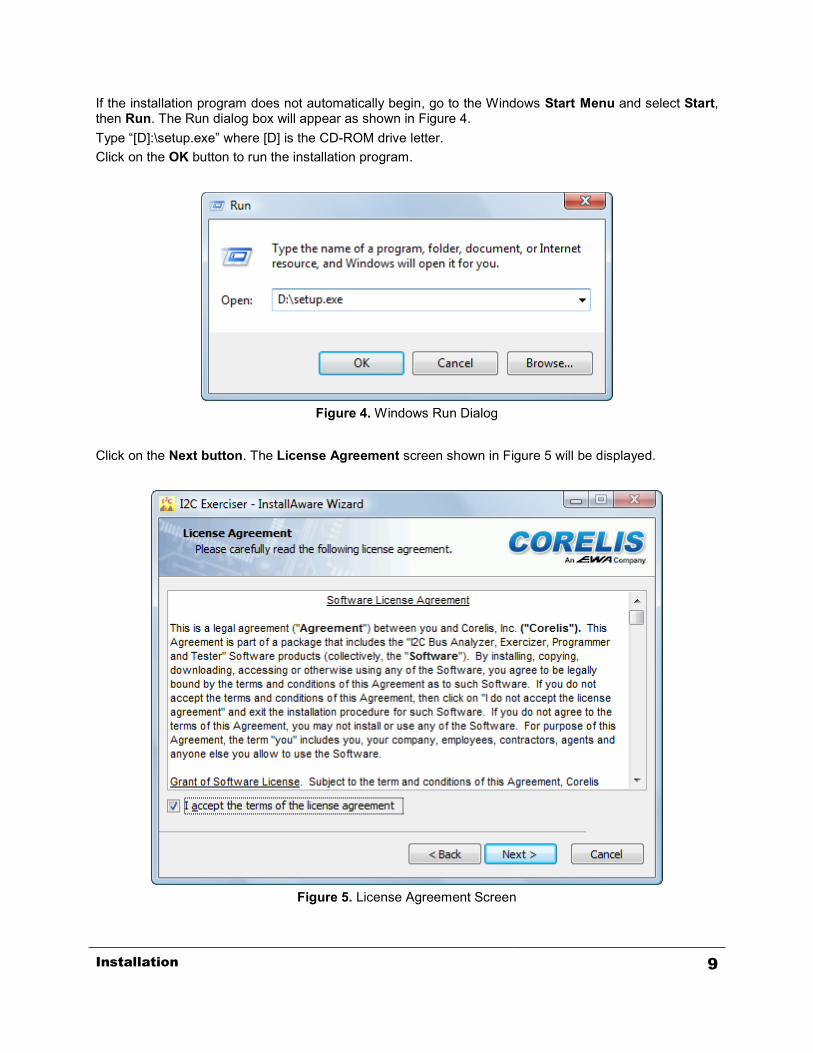
If the installation program does not automatically begin, go to the Windows Start Menu and select Start,then Run. The Run dialog box will appear as shown in Figure 4.Type “[D]:\setup.exe” where [D] is the CD-ROM drive letter.Click on the OK button to run the installation program.
Figure 4. Windows Run Dialog
Click on the Next button. The License Agreement screen shown in Figure 5 will be displayed.
Figure 5. License Agreement Screen
10 Installation
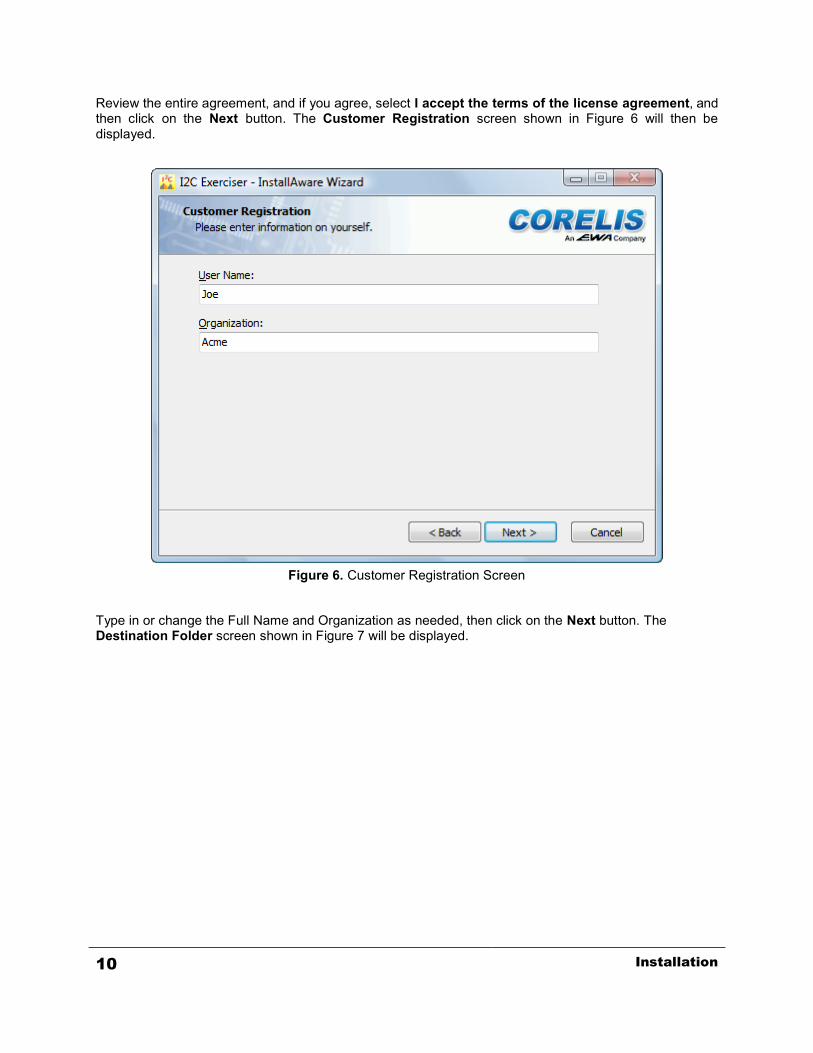
Review the entire agreement, and if you agree, select I accept the terms of the license agreement, andthen click on the Next button. The Customer Registration screen shown in Figure 6 will then bedisplayed.
Figure 6. Customer Registration Screen
Type in or change the Full Name and Organization as needed, then click on the Next button. TheDestination Folder screen shown in Figure 7 will be displayed.

Installation 11
Accept the default installation folder, or customize your installation by selecting the Change button.It is strongly recommended that the application be installed in the default folder.
Figure 7. Destination Folder Screen
Click on the Next button, and the Select Program Folder screen shown in Figure 8 will be displayed.

12 Installation
Select Anyone who uses this computer or Only for me.By default, the installer will place a shortcut icon for the I2C Exerciser on your desktop. If you do not wishthis shortcut to be created, uncheck the checkbox on this screen.
Figure 8. Select Program Folder Screen
Click on the Next button, and the Completing the Installation Wizard screen shown in Figure 9 will bedisplayed.
Installation 13
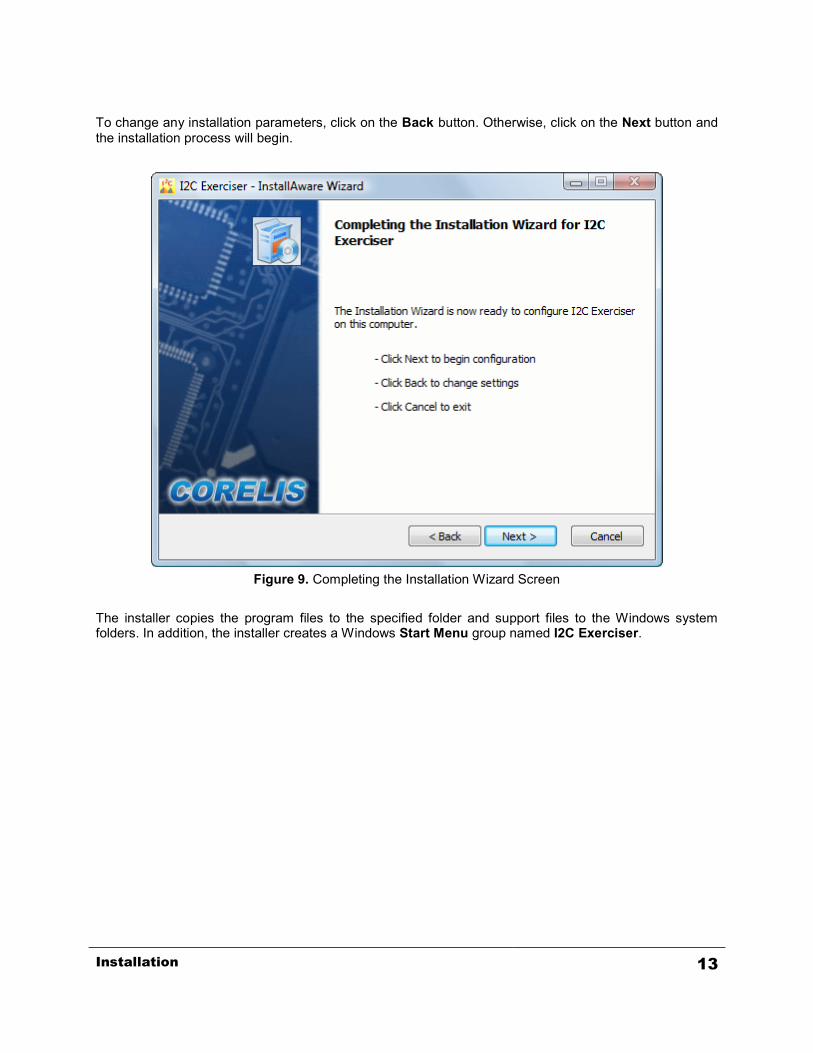
To change any installation parameters, click on the Back button. Otherwise, click on the Next button andthe installation process will begin.
Figure 9. Completing the Installation Wizard Screen
The installer copies the program files to the specified folder and support files to the Windows systemfolders. In addition, the installer creates a Windows Start Menu group named I2C Exerciser.

14 Installation
If you are running Windows 7 or Vista, the software installation may be interrupted by the operatingsystem by displaying warning pop-up windows as shown in Figure 10. If this occurs, click on the Installthis driver software anyway button to safely ignore the warnings and proceed with the installation.
Figure 10. Windows 7 Security Warning Pop-up Window
If you are running Windows XP, the software installation may be interrupted by the operating system bydisplaying warning pop-up windows as shown in Figure 11. If this occurs, click on the Continue Anywaybutton to safely ignore the warnings and proceed with the installation.
Figure 11. Windows XP Logo Test Warning Pop-up Window

Installation 15
The warning pop up windows may be hidden behind the installation window. If this happens, theinstallation progress bar will stop updating and the installation may appear to be hung. Bring thewarning pop up windows to the foreground by clicking on the Software Installation button on theWindows task bar as shown in Figure 12. Then click on the Continue Anyway button to safely ignorethe warnings and proceed with the installation.
Figure 12. Software Installation Button on the Windows XP Task Bar

16 Installation
The Installation Completed screen shown in Figure 13 will appear to indicate that the installation iscomplete. Click on the Finish button to exit from the installation program.
Figure 13. Installation Completed Screen

Installation 17
BusPro-I Hardware InstallationThe BusPro-I controller is a hot-plug USB device. You must first install the I2C Exerciser software beforeinstalling the BusPro-I controller. Drivers for the BusPro-I controller are installed with the I2C Exercisersoftware and not installing the software and drivers first may result in improper unit configuration andoperation.
Installation Steps
1. You should have already installed the I2C Exerciser at this point. If not, please do so beforecontinuing with hardware installation.
2. Connect a USB 2.0 compatible cable from the BusPro-I USB 2.0 connector to any available USB 2.0connector on your PC.
3. If you are running Windows XP, the Found New Hardware Wizard dialog box should automaticallyappear as shown in Figure 14.
Figure 14. Found New Hardware Wizard - Welcome Screen (Windows XP)
4. Click on No, not this time and click on the Next button.

18 Installation
5. The dialog shown in Figure 15 will pop up. Click on Install the software automatically(Recommended) and click on the Next button.
Figure 15. Found New Hardware Wizard - Install Options (Windows XP)

Installation 19
6. The Hardware Wizard will attempt to locate the driver that was installed with the I2C Exercisersoftware. Under Windows XP, a warning dialog box will pop up as shown in Figure 16. You can safelyignore the warning and continue the installation process by pressing the Continue Anyway button.
Figure 16. Windows XP Logo Test Warning Pop-up Window

20 Installation
7. After the necessary files are copied to the system, the dialog box shown in Figure 17 will appearindicating that the driver has been successfully installed.
Figure 17. Found New Hardware Wizard – Installation Complete (Windows XP)

Installation 21
8. Click on the Finish button to close the Hardware Wizard dialog box.9. Another Found New Hardware Wizard should appear again. Repeat steps 3 to 8.10. The installation of the driver is now complete and Windows will proceed to detect and configure the
BusPro-I Verify that the BusPro-I was correctly detected by checking for its entry in the WindowsDevice Manager. To open the Device Manager, right-click on the My Computer icon on the desktopand then select Properties from the pop-up menu. Click on the Hardware tab and then click on theDevice Manager button. An entry named Corelis BusPro-I - 9101 should be listed in the UniversalSerial Bus controllers section as shown in Figure 18.
Figure 18. Windows Device Manager (Windows XP)
11. Plug the RJ45 connector end of the target cable into the BusPro-I socket labeled Serial Bus and theother end of the cable can be connected to the target I2C bus signals. The target cables and pinoutsare detailed in the Connecting to a Target chapter.
Congratulations! You have now successfully installed the BusPro-I and drivers on your computer and it isready to be used. We recommend that you preserve the original packing material for future shipment orstorage of the BusPro-I.

22 Installation

Getting Started 23
Chapter 3Getting Started
I2C Exerciser operation overview and tutorial
Overview
This chapter will quickly introduce you to the basic usage of the Corelis I2C Exerciser tool for viewing bustraffic via the BusPro-I. Although it is possible to explore the capabilities of this system on your own,working through this chapter is intended to give an immediate feel and appreciation for its ease of useand core functionality. After you have become familiar with the program, you can go back and explore therich variety of additional options, tools, and methods available by browsing through the menu system,reading the remainder of this manual, or going through the on-line help.
The material in this chapter is divided into two parts. Most of what you will do while working through thechapter will involve using the demo mode feature of I2C Exerciser with the Monitor window to look atvarious bus tracing capabilities. The second part of the chapter will briefly take you through using the livemode of I2C Exerciser in order to familiarize you with the Debugger window that is not available in thedemo mode.
Calibration NoteIf you are going through these tutorials for the first time with a new installation of I2C Exerciser and youhave a BusPro-I connected, then you may be prompted to calibrate the BusPro-I. The calibration featurefine-tunes the electrical outputs of the BusPro-I for use when it is providing the voltage source for anattached target bus.
Feel free to skip the process during these tutorials by clicking on the No button if prompted to performcalibration. However, if you wish to get the calibration out of the way, you may allow it to proceed byfollowing the on-screen instructions—it should only take a minute or two and need only be completedonce per the computer being connected to. For details on the calibration feature, refer to the Calibrationsection in the Configuration and Preferences chapter.
Tutorial – Using Demo ModeThe steps in the following tutorial will guide you through basic BusPro-I usage once you have successfullyinstalled the software and, optionally, the hardware. This will not require a live target or even an attachedBusPro-I controller.
The demo mode feature of I2C Exerciser allows the user to quickly observe and become familiar with thebasic bus tracing features. This mode creates simulated traffic for display in the Monitor window, imitatinga connection to virtual targets on an I2C bus. The steps outlined in the demo tutorial focus mainly onunderstanding the information provided in the Monitor window, including both the trace list and timingdisplay. You will learn how to collect I2C bus traffic, view it in the trace list and timing display, navigatethrough the data, and utilize various options and features.

24 Getting Started
Step 1 – Start I2C ExerciserStart the I2C Exerciser application by opening the Windows Start menu, clicking on Programs (or AllPrograms), then clicking on the I2C Exerciser program group, and finally clicking on the I2C Exerciserentry. A splash screen will be displayed for a few seconds, and then the main I2C Exerciser window willappear with the Monitor window active. By default, the program will try to detect if the BusPro-I isconnected and will enter Live Data mode if the controller is found. If the BusPro-I is not attached to thehost PC, you will get the warning message shown in Figure 19 indicating that the controller was notdetected and the program will automatically start in Demo Mode. If the warning appears, click on the OKbutton to close it.
Figure 19. Initial I2C Exerciser Warning Message when BusPro-I is Not Initially Connected

Getting Started 25
Step 2 – Enable Demo modeClick on the Tools menu and verify that the Demo Mode menu item has a check mark next to it as shownbelow in Figure 20. This indicates that the program is in Demo Mode. If the BusPro-I was connected tothe PC when you started I2C Exerciser, you will have to select this menu item to force the program intoDemo Mode. You can also verify that the program is in Demo Mode by observing the programs status barin the lower right corner of the main window as shown in Figure 21. The leftmost indicator will eithercontain the bold red text DEMO or the plain text LIVE.
Figure 20. Tools Menu Demo Mode Selection
Figure 21. Status Bar Indicating Demo Mode

26 Getting Started
Step 3 – Begin the Monitor Window Simulated Bus ActivityClick on the Run Single tool bar button (represented by a green arrow) as shown in Figure 22 to beginMonitor data collection of the simulated bus activity.
Figure 22. Begin Monitor Data Collection
When the program is in Demo Mode and a Run command is invoked, an informational pop-up window asshown in Figure 23 will appear to remind you that the program is currently in Demo Mode. Click on theOK button to proceed.
Figure 23. Demo Mode Reminder Pop-up Window

Getting Started 27
When traffic collection begins, the Run Status tab on the Monitor Tools window will be displayed toshow progress information as the trace buffer fills with simulated traffic. You may move or resize thiswindow at any time to obtain a better view of the trace list lines and timing display as shown in Figure 24.
Step-by-step color-highlighted progress milestones are provided in the Run Status tab. This tab alsodisplays the number of bus transactions collected so far and a progress bar indicating what percentage ofthe trace buffer has been filled. After the buffer is filled, the Run Status tab will indicate Data collectedsuccessfully and the Close will be enabled, allowing the user to close the window.
Figure 24. Run Status Tab

28 Getting Started
Step 4 – Close the Monitor Tools WindowClick on the Monitor Tools window close button and the window will close allowing a full view of theMonitor window which shows a portion of the trace buffer content. If a user-specified trigger isencountered while acquiring bus traffic, the trace list will automatically be centered on the transaction thatsatisfied the trigger condition. The Demo Mode data has a matching trigger condition on line 45 as can beseen in Figure 25.
Figure 25. Monitor Window Centered on Trigger Line

Getting Started 29
Step 5 – View the Trace DataThe Monitor window allows the user to examine the captured data in the trace buffer. A vertical scroll baris available on the right edge of the screen for standard positioning of the lines in addition to use of thepage-up and page-down keys. Scrolling the display up will show older entries with lower line numbers.Scrolling the display down will show newer entries with higher line numbers. The oldest entry will be online one and the newest entry will be on the last line in the trace list. Each bus message is displayed asmultiple lines in the trace listing and consists of a master address read/write cycle, followed by one ormore data write (SDA line driven by a master toward a slave) or data read (SDA driven by a slavetowards a master) cycles.
Right-clicking anywhere in the Monitor window trace list will display the pop-up menu shown in Figure 26.This menu provides easy access to navigation, command, and configuration functions. All of thesecommands can also be accessed via either tool bar buttons or the regular menu system.
Figure 26. Monitor Window Right-Click Pop-up Menu

30 Getting Started
While scrolling around the trace list data, you will notice that some lines are highlighted with specialbackground colors and the Marker column may contain various indications such as Trigger, Cursor A,Cursor B, or Tagged. These markers are used to indicate special transactions of interest and will bedescribed in more detail later. There are navigation tool bar buttons as well as menu equivalents toimmediately jump to any of these special types of lines or to quickly jump directly to the beginning or endof the trace buffer.
Single-clicking on a trace list line will highlight that selected line. This highlighting helps to identify all ofthe transaction information across the columns of the trace listing. The Find tool can also populate theirrequired transaction fields automatically by using the data from the currently selected line.
Lines in the trace listing can be arbitrarily flagged as lines of interest. Such lines are denoted by blue textas well as the Tagged indicator in the Marker column. This flag is set or unset by double-clicking on thetrace list line. The Find tool, discussed later in this tutorial, can also use this tagging mechanism toidentify transactions throughout the trace buffer that satisfied certain specified criteria. Double-click onany untagged line and observe its text color change and Marker column change to Tagged. Double-clickon the same line again and it will return to untagged status.
Right-click in the trace list area of the Monitor window and select the Go to Trigger pop-up menu entry asshown in Figure 26. This will cause the trace list and timing display to reposition to the Trigger line asshown in Figure 27. The Trigger line can be seen on line 45 in the trace list which is identified by a redbackground and it is also indicated at the top of the timing display by a red flag (with the symbol “T”). I2Cbus transaction characteristics that constitute a Trigger are configured by the user prior to starting datacollection. The BusPro-I searches for the user-specified set of conditions while collecting trace data inorder to mark the Trigger line and place it in a specific position in the buffer.
Figure 27. Monitor Window Trace List Positioned on Trigger Line

Getting Started 31
To access the Trigger setup screen, right-click in the trace list area and select the Trigger… entry fromthe pop-up menu as shown in Figure 28. The Trigger dialog will appear as shown in Figure 29.
Figure 28. Monitor Window Right-Click Pop-up Menu Selecting Trigger Settings
The Trigger dialog allows the user to specify particular address, data value, and other miscellaneousevent criteria which correspond to the bus transaction of interest.

32 Getting Started
In Demo mode, the trigger condition is fixed internally and this screen is non-functional. Click on theClose button to close this dialog.
Figure 29. Configuration Manager Trigger Setup Screen

Getting Started 33
Transaction Line Columns
The Monitor window trace list column headings are shown in Figure 30. A description of each column isprovided below.
Figure 30. Monitor Window Trace List Column Headings
Line – Displays a sequential unique number for each bus transaction.
Marker – Identifies special lines such as the Trigger, Cursor A, Cursor B, or Tagged.
Type – Identifies the transaction as either an Address or Data cycle.
Location – Indicates the device involved in the current transaction as being either a target device on thebus or the BusPro-I analyzer. For address transactions, “Analyzer” means the analyzer is the master(debugger or emulated master), while “Target” means a UUT master is driving. For data transactions(write toward the slave, read from the slave), “Analyzer” means the analyzer is an emulated slave, while“Target” means a live UUT slave is involved. This localizes the source of address cycles and thesource/destination of data cycles as residing in the Analyzer or the Target.
Addr – Displays the bus address of the related message. This column can be displayed in hexadecimal,decimal, or binary format. The display format is shown in parenthesis in the column heading.
AddrType – Identifies the address type as the protocol defined 7-bit, 10-bit, or Hs-mode. Note that for7-bit addresses displayed in hex format, I2C Exerciser can present a given address value in one of twoformats based on the users preference. In 7F format mode, addresses are displayed with the sevenaddress bits shown as right-justified in the hex byte value with the MSB always being zero. In FE formatmode, the addresses are displayed with the seven address bits shown as left-justified in the hex bytevalue with the LSB always being zero. For example, given a binary address of 0011010, the hexrepresentation in 7F format would be 1A, while in FE format it would be 34. Both of these formats areencountered in the I2C world, and the I2C Exerciser application is flexible enough to use either format.The currently active mode is reflected in the lower corner of the I2C Exerciser status bar (AddrFormat FEor AddrFormat 7F) as shown in Figure 31. The AddrFormat can be configured on the Formats tab ofthe Preferences dialog.
Figure 31. I2C Exerciser Status Bar

34 Getting Started
R/W – Displays the read/write direction of data flow relative to the master (R = read from a slave, W =write toward a slave).
NAK – Blank for normal ACK responses, or will indicate NAK when the cycle is not acknowledged.
Error – Blank for normal bus protocol transactions, or will indicate Error if the BusPro-I detected aprotocol violation. If an error was detected, the user can click on the Error text and a pop-up window willappear describing the cause of error. Observe line 85 which is an example of such an entry.
KHz – Displays the best estimate of the average clock rate for the transaction in units of Kilohertz.
I/O 1 – Displays the current state of discrete I/O line 1 (regardless of whether the discrete is configured asan input or output).
I/O 2 – Displays the current state of discrete I/O line 2 (regardless of whether the discrete is configured asan input or output).
Data Byte – Displays the byte value conveyed by this transaction to or from a slave device. This columncan be displayed in hexadecimal, decimal, or binary format. The current display format is shown inparenthesis in the column heading.
Time – Displays the timestamp assigned to the beginning time of each transaction. Supported timedisplay units are nanoseconds, microseconds, milliseconds, and seconds. The current time unit format isshown in parenthesis in the column heading.
The Monitor window tool bar shown in Figure 32 provides buttons for quickly repositioning the trace listdisplay to various points of interest. You can quickly jump to the trigger, to the next tagged row, to thebeginning or end of the buffer, or to Cursor A or Cursor B. You can also quickly jump to these positions inthe trace list using the right-click menu previously illustrated.
Click on the Go to Start tool bar button as shown in Figure 32 to bring the trace list view to the firstentries in the trace listing. This will also cause the first line in the trace list to be highlighted as shown inFigure 33.
Figure 32. Go to Start Tool Bar Button
Observe that some address columns contain symbolic values such as PLL and ADC, and some datacolumns contain symbolic values such as FAULT, WARNING, and CHANSEL. The user can definesymbols for both address and data to enhance device-specific readability.

Getting Started 35
Figure 33. Monitor Window Trace List Showing Symbolic Address and Data Entries
36 Getting Started
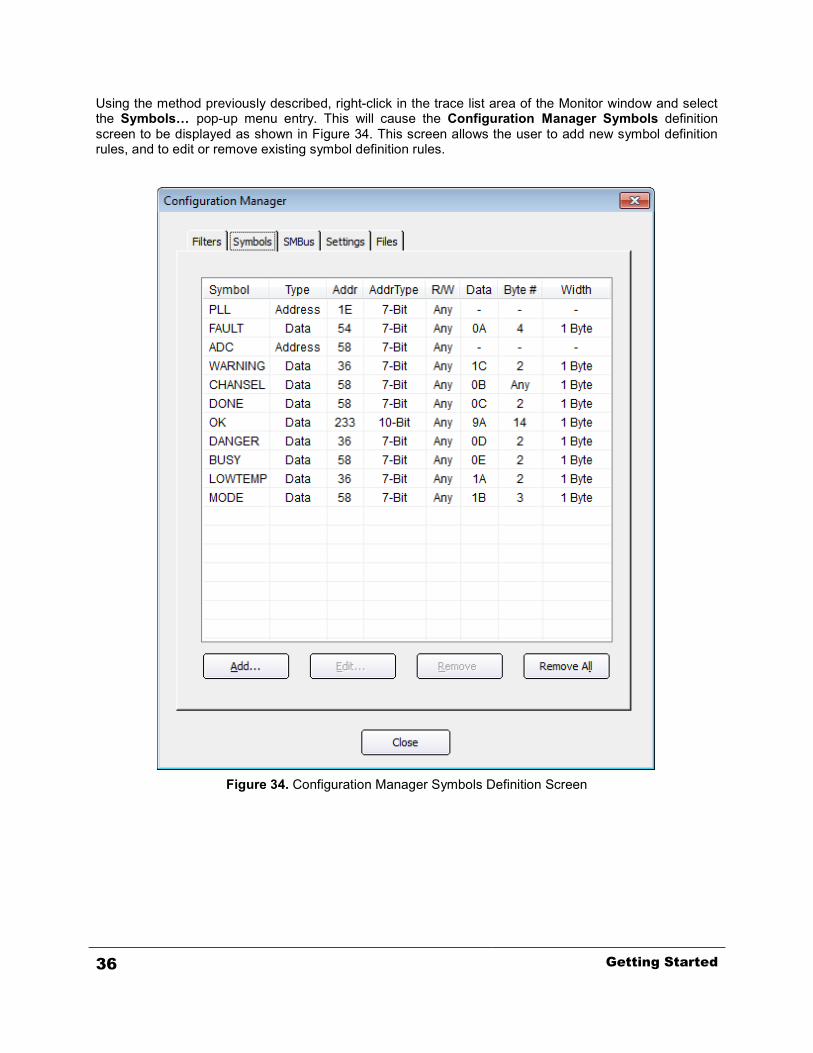
Using the method previously described, right-click in the trace list area of the Monitor window and selectthe Symbols… pop-up menu entry. This will cause the Configuration Manager Symbols definitionscreen to be displayed as shown in Figure 34. This screen allows the user to add new symbol definitionrules, and to edit or remove existing symbol definition rules.
Figure 34. Configuration Manager Symbols Definition Screen

Getting Started 37
Click on the Add button and the Symbol Definition dialog shown in Figure 35 will appear. In the Symbolfield, type DAC which is an acronym for Digital-to-Analog Converter. In the Addr field, type 18. This willcause the string DAC to be displayed in the address column for any trace list entries with a 7-bit hexaddress of 18. Click on the OK button to accept the new symbol definition rule.
Figure 35. Symbol Definition Dialog

38 Getting Started
The Configuration Manager Symbols screen will now contain the newly added DAC entry as shown inFigure 36. Click on the Close button to close the Configuration Manager Symbols screen.
Figure 36. Configuration Manager Symbols Definition Screen with DAC Symbol
Getting Started 39
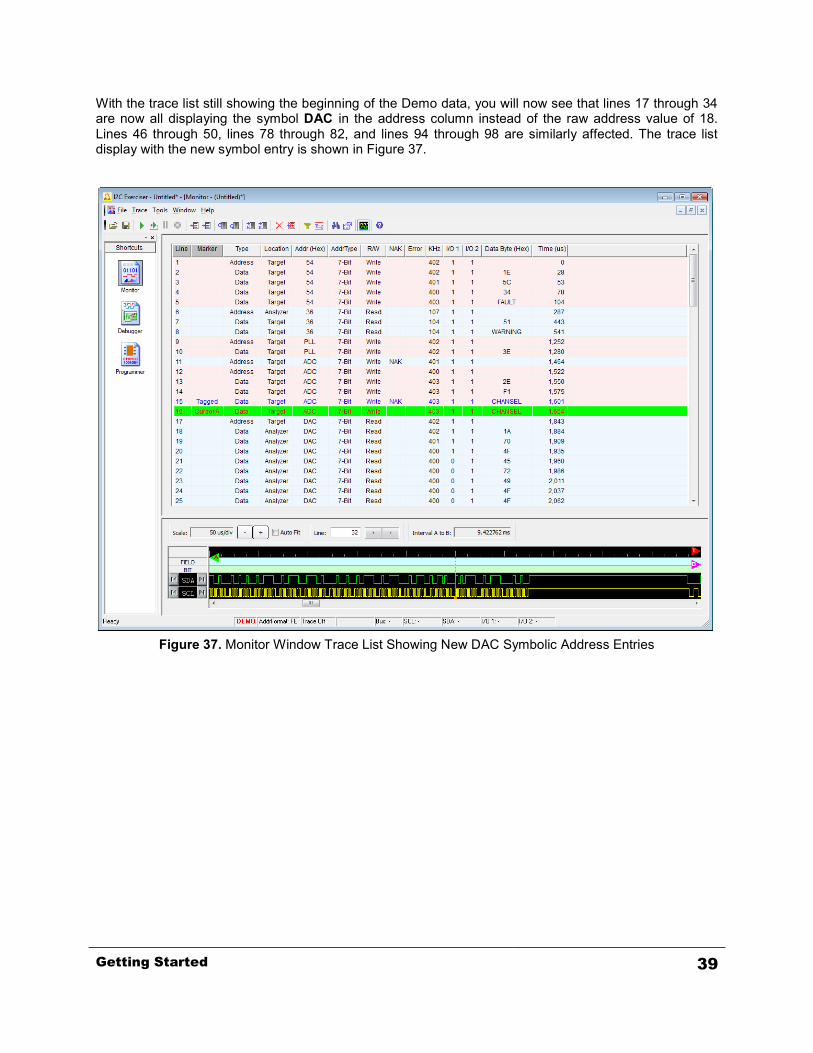
With the trace list still showing the beginning of the Demo data, you will now see that lines 17 through 34are now all displaying the symbol DAC in the address column instead of the raw address value of 18.Lines 46 through 50, lines 78 through 82, and lines 94 through 98 are similarly affected. The trace listdisplay with the new symbol entry is shown in Figure 37.
Figure 37. Monitor Window Trace List Showing New DAC Symbolic Address Entries

40 Getting Started
Right-clicking on the column headings of either the Addr or Data Byte column allows the user to togglethe symbolic translation on and off. Additionally, the pop-up menu allows selection of the numeric displayformat to either hexadecimal, binary, or decimal. These settings work independently for the Addr andData Byte columns. Right-click on the Data Byte column heading and select the Disable Symbols menuentry as shown in Figure 38. Observe that symbols are no longer being displayed in the Data Bytecolumn as shown in Figure 39.
Figure 38. Monitor Window Trace List Data Byte Column Right-Click Pop-up Menu

Getting Started 41
Figure 39. Monitor Window Trace List Data Column with Symbols Disabled
42 Getting Started
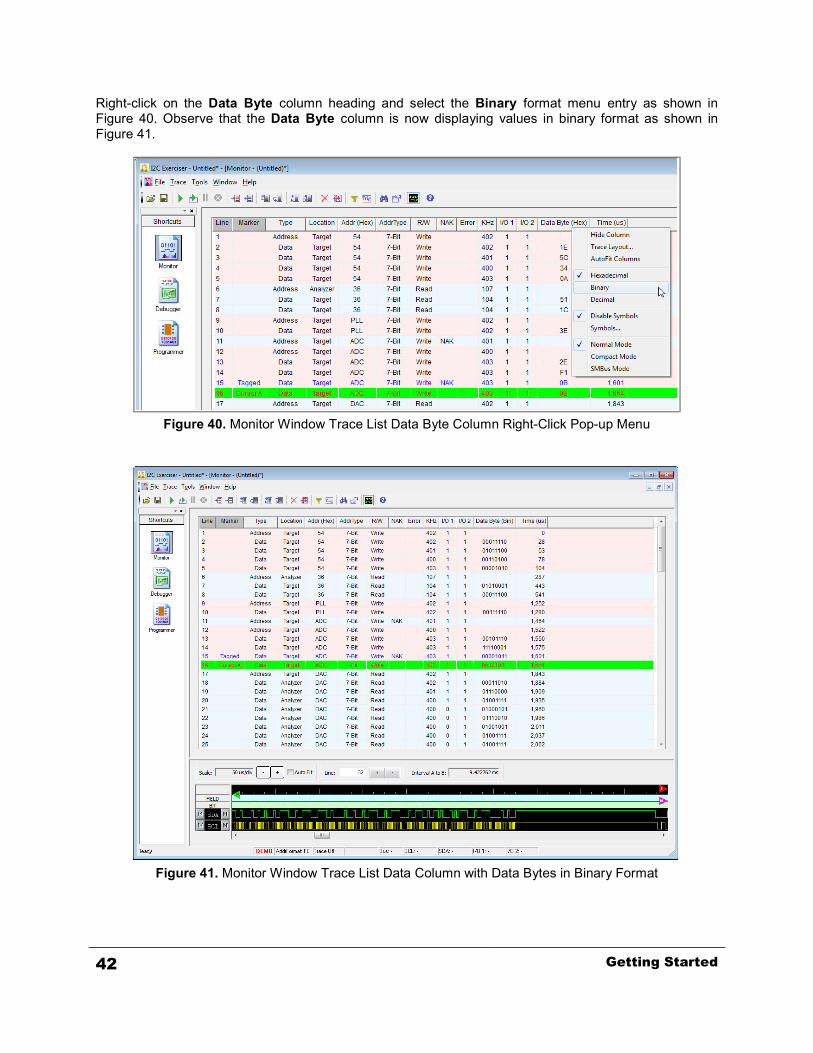
Right-click on the Data Byte column heading and select the Binary format menu entry as shown inFigure 40. Observe that the Data Byte column is now displaying values in binary format as shown inFigure 41.
Figure 40. Monitor Window Trace List Data Byte Column Right-Click Pop-up Menu
Figure 41. Monitor Window Trace List Data Column with Data Bytes in Binary Format
Getting Started 43
Using the method just described, re-enable symbol translation and change the display format back tohexadecimal.
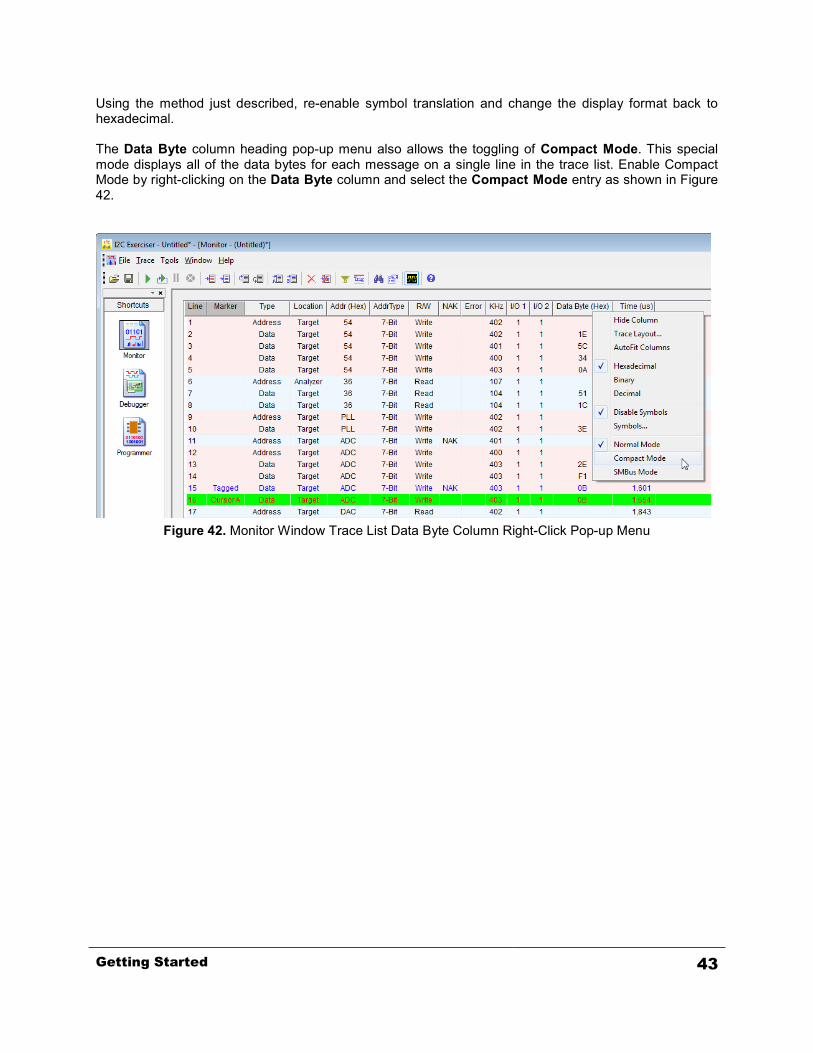
The Data Byte column heading pop-up menu also allows the toggling of Compact Mode. This specialmode displays all of the data bytes for each message on a single line in the trace list. Enable CompactMode by right-clicking on the Data Byte column and select the Compact Mode entry as shown in Figure42.
Figure 42. Monitor Window Trace List Data Byte Column Right-Click Pop-up Menu

44 Getting Started
The trace list data will be reformatted as shown in Figure 43. Some messages may contain more databytes than will fit on the screen. When the display is in Compact Mode, clicking on any data transaction inthe Data Byte column will cause a pop-up Data Bytes window to appear making it possible to view andscroll through all data in the selected message. Click on line 18 in the Data Byte column and the pop-upwindow shown in Figure 44 will appear allowing you to see all of the data bytes in that message which arenot all visible in the Data Byte column. This pop-up window will remain open until you close it and willcontinue to update if you click in the Data Byte column for any other data transaction.
Figure 43. Monitor Window Trace List in Compact Mode

Getting Started 45
Figure 44. Monitor Window Trace List in Compact Mode with Data Bytes Pop-up Window
When you have finished viewing the trace list in Compact Mode, close the Data Bytes pop-up window.Then select the Normal Mode selection from the Data Bytes column heading menu to put the trace listdisplay back into Normal mode.

46 Getting Started
You can right-click on any column heading and select Hide Column to remove the selected column fromthe trace list display. This may be useful when the user is not interested in some of the data columns andhiding them can reduce screen clutter. Additionally, you can drag and drop column headings to changethe order that the columns are displayed in. Right-click on the I/O 2 column heading and select HideColumn as shown in Figure 45. Click on the I/O 1 column heading and while holding the mouse buttondown, drag the column to just after the Time column heading as shown in Figure 46 and then release themouse button.
Figure 45. Monitor Window Trace List I/O 2 Right-Click Pop-up Menu
Figure 46. Dragging Monitor Window Trace List I/O 1 Column Heading

Getting Started 47
After hiding the I/O 2 column and repositioning the I/O 1 column, the Monitor window should now look likeFigure 47.
Figure 47. Monitor Window Trace List with Rearranged I/O Columns

48 Getting Started
If you wish to unhide one or more previously hidden columns or wish to restore the column layout to itsdefault state, right-click on any column heading and select the Trace Layout menu. The Trace Layoutdialog will appear as shown in Figure 48 showing each column and whether or not it is visible. Click onthe Default Column Layout button to restore the default column settings and then click on the Closebutton.
Figure 48. Trace Layout Dialog

Getting Started 49
Timing Display
The lower portion of the Monitor window contains a graphical representation of the I2C bus signaltransitions depicted as a timing diagram similar to a logic analyzer. A picture of the timing display isshown in Figure 49. It displays the actual state and edge times of the signals as they transitioned on thebus while conveying transactions.
Figure 49. Monitor Window Timing Display
The bus clock line (SCL) is shown at the bottom of the timing display with the bus data line (SDA)positioned just above it. This allows the value of the data line to be easily determined as the clock linerises and falls.
The Bit row displays one of the following letters over each recognized sequence of bus transitions toindicate what has occurred.
S – A Start/Restart bit occurred indicating a new message is beginningP – A Stop bit occurred indicating the end of a messageR – Master indication that this message is performing a read operationW – Master indication that this message is performing a write operation0 – A value of 0 is being conveyed in either an address or data transaction1 – A value of 1 is being conveyed in either an address or data transactionA – The current address or data transaction is being acknowledged (ACK)N – The current address or data transaction is being not-acknowledged (NAK)
The Field row provides a higher level decoding of bus transition groupings and identifies either anaddress transaction, a data transaction, or when the bus has transitioned to an idle state.
The vertical orange dotted-line in the center of the timing display will identify the first timing edge thatcorresponds to either the currently highlighted line in the trace list or to the entry at the top of the tracelist. This setting can be configured on the Monitor Options tab of the Tools | Preferences menu entry.The default setting is to have the timing display track the currently highlighted trace line. Click on differenttrace list transactions and observe how the timing display updates to show the newly selectedtransactions.
You can navigate in the timing display area itself by jumping forward or backward between lines via theprovided arrow buttons or enter the desired trace line number in the edit field and press return. TheMonitor trace list will track the timing display according to the currently active display locking preference.You can also use the horizontal scroll bar underneath the timing display to position the display withoutaffecting the position of the trace listing.

50 Getting Started
Notice the colored flags that are displayed just above the top Field row of the timing display. These flagsindicate the locations of the Trigger marker and the Cursor markers. A cursor is a special marker that canbe positioned in the timing display at various points of interest to allow time measurements between anytwo points. There are two cursors available: Cursor A is identified by its green background and Cursor Bis identified by its magenta background by default. These colors can be configured on the MonitorColors tab of the Tools | Preferences menu entry.
If the cursors are not in the currently visible range of timing information, the Field row will contain a smallgreen (Cursor A) or magenta (Cursor B) triangle on either the extreme left or right side of the row toindicate the cursor is located before or after the visible range of timing information. You can click on thesemarkers and drag them left or right to move the corresponding cursor into the visible range of timinginformation. When in the visible range, the cursors are represented by small colored boxes with a verticalline that extends below them through the timing display. Similarly, a trigger is represented by a redvertical line and a small red box just above the Field row when in the visible range and represented by ared triangle above the Field row when out of the visible range.
Right-click in the trace list area of the Monitor window and select the Go to Cursor A pop-up menu entry.This will cause the trace list and timing display to reposition to the Cursor A line as shown in Figure 50.The Cursor A line can be seen on line 16 in the trace list. Both the trace list line and vertical marker inthe timing display for Cursor A are colored green to help distinguish them from other display elements.
Figure 50. Monitor Window Trace List Positioned on Cursor A Line

Getting Started 51
Now right-click in the trace list area of the Monitor window and select the Go to Cursor B pop-up menuentry. This will cause the trace list and timing display to reposition to the Cursor B line as shown in Figure51. The Cursor B line can be seen on line 100 in the trace list. Both the trace list line and vertical markerin the timing display are colored magenta to help distinguish them from other display elements. Note thatthe timing display’s Line field is displaying 100 and that the magenta colored vertical marker for Cursor Bis positioned on the first edge of this data word.
Figure 51. Monitor Window Trace List Positioned on Cursor B Line
The zoom function focuses around the center of the display. Clicking on either the - or + zoom buttons inthe Scale area will change the time scale and cause the display to zoom out or zoom in allowing you tosee less detail but more edges or more detail but fewer edges. You can also right-click anywhere in thetiming display and select Zoom-in or Zoom-out from the pop-up menu to change the zoom level. If youzoom out far enough in the timing display, you can see all of the timing edges in the entire trace buffer.The Auto-Fit option when checked will automatically adjust the time scale so that one full transaction isvisible on the right side of the center orange marker line.
With the timing display still showing the timing edges beginning at line 100 as shown in Figure 51, click onthe + zoom button in the scale area. The timing display will zoom in as shown in Figure 52.

52 Getting Started
Notice that the time scale has been reduced from 50µs/div to 20µs/div and that the edges appear muchlarger now revealing more detail.
Figure 52. Monitor Window Timing Display Showing Edges Zoomed in at Line 100

Getting Started 53
The Interval A to B field always displays the calculated time difference between the position of Cursor Aand Cursor B. Reposition Cursor A by clicking on the small green triangle on the left side of the Field rowand, while holding the mouse button, down drag it over the last edge of the previous transaction as shownin Figure 53. Notice that while you are dragging the Cursor, a tool tip follows the cursor and constantlyupdates to show you the current absolute time of the current cursor position and the difference in timebetween Cursors A and B. Once Cursor A is positioned over the last edge of the previous transaction,release the mouse button to place Cursor A there. The Interval A to B field now displays the difference intime between Cursor A and Cursor B which in this case is measuring the gap in time between the end ofthe transaction on trace line 99 and the start of the transaction on trace line 100.
Figure 53. Monitor Window Timing Display Measuring the Time Between Cursors A & B

54 Getting Started
Step 6 – Find OperationsPush the Go to Start tool bar button as shown in Figure 54 to bring the trace list view to the first entries inthe trace listing. This will also cause the first line in the trace list to be highlighted. The Find function willnow search for entries starting with the first entry all the way to the end of the trace buffer contents.
Figure 54. Go to Start Tool Bar Button

Getting Started 55
Click on the Find tool bar button as shown in Figure 55 below. It will bring up the Find dialog shown inFigure 56.
Figure 55. Find Tool Bar Button
Figure 56. Find Dialog

56 Getting Started
The Less button compacts this dialog to display only the four buttons on top to minimize any obscuring ofthe Monitor window. This is useful when you have configured the search parameters and want to repeatthe same search query many times. While compacted, this button changes to More enabling the user toforce the dialog back to its expanded format. The Tag All button launches a search throughout the tracebuffer for the specified search criteria and will tag all lines which match. After this type of search iscompleted, you can use the Go to Tagged Row tool bar button on the Monitor window to easily locateand step through all of these lines. The Find Next button simply moves the Monitor trace list to the nextfound line matching the search criteria. This action can be repeated to locate all matching lines, butwithout tagging them. If the end of the buffer if reached, the search will wrap and continue at the start ofthe trace buffer.
The various fields are intuitive for defining search criteria and allow searching over a wide range ofconditions from very specific to entire classes of trace lines. The mask feature allows enabling/disablingindividual bits when looking for a single-byte data pattern. The Byte Position indicates which data byte ina message is to be considered. The Width field may not be modified and is locked at one byte for searchdata values.
When the user clicks on the Load From Selected Monitor Trace Line button, the characteristics of thecurrently selected line in the trace buffer are used to populate the Find dialog. The user can then tweakany needed changes to the search criteria fields. This facilitates searching for the same or similar linesthroughout the trace buffer with a minimal amount of manual data entry. Each field’s pull-down will supplycommon selections, previously entered values, or defined symbols, as appropriate. Otherwise, type in thedesired values.

Getting Started 57
Go to the start of the trace list using the Go to Start tool bar button as previously shown. Then in the Findwindow, enter the value 2E into the Data Byte Value field as shown in Figure 57.
Figure 57. Find a Data Value of 2E
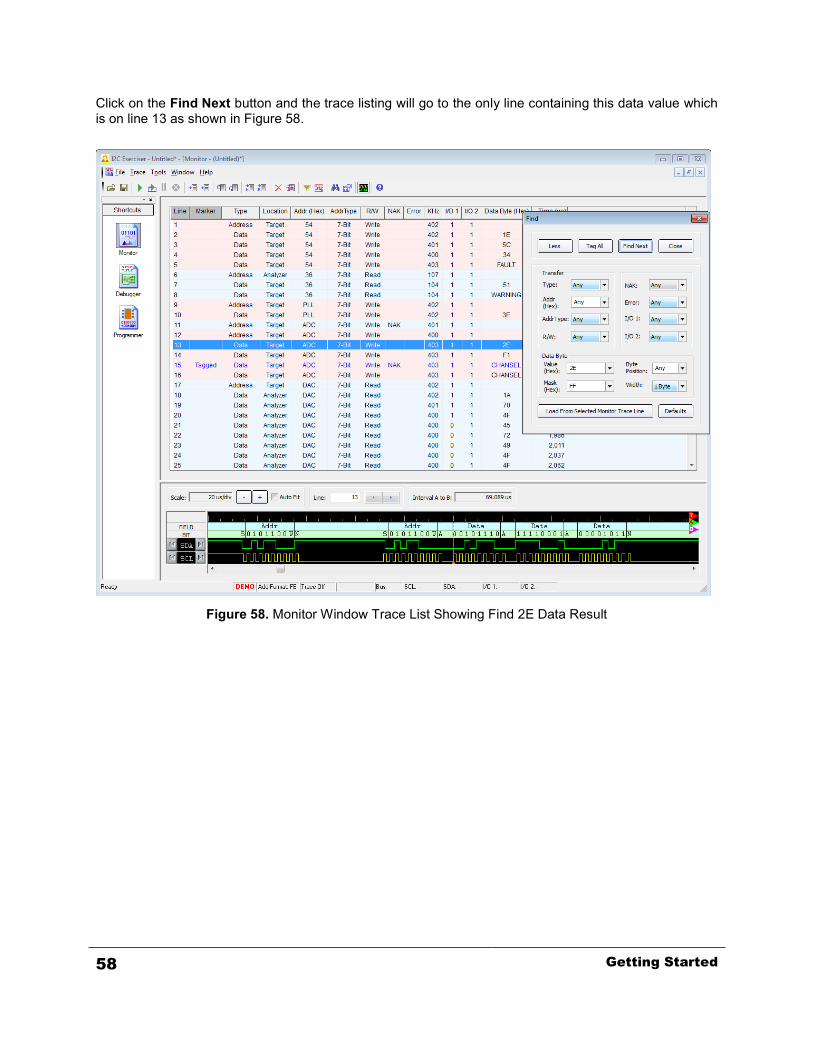
58 Getting Started
Click on the Find Next button and the trace listing will go to the only line containing this data value whichis on line 13 as shown in Figure 58.
Figure 58. Monitor Window Trace List Showing Find 2E Data Result

Getting Started 59
Go to the start of the trace list using the Go to Start tool bar button as previously shown. Change theData Byte Value field to 72 as shown in Figure 59. Click on the Tag All button and you will be promptedto clear all existing tags in the trace listing as shown in Figure 60. Click on the Yes button and the searchwill commence.
Figure 59. Find a Data Value of 72
Figure 60. Clear Tagged Rows Prompt

60 Getting Started
When the search is complete, the pop-up window in Figure 61 will appear to notify you how many tracelines matched the search criteria. Click on the OK button and the trace list will display the first tagged lineas shown in Figure 62. Lines 22 and 80 will be tagged since they contain the data value 72.
Figure 61. Matched Transactions Prompt
Figure 62. Monitor Window Trace List Showing Find 72 Data Result

Getting Started 61
You can click on the Go to Tagged Row tool bar button, shown in Figure 63, to move to the secondsearch result as shown in Figure 64. Repeatedly clicking on the Go to Tagged Row tool bar button willcause the trace list to alternate between the two tagged lines.
Figure 63. Go to Tagged Row Tool Bar Button
Figure 64. Monitor Window Trace List Showing the Second Find 72 Data Result

62 Getting Started
Step 7 – Changing PreferencesThere are a number of user configurable preferences available from the Tools | Preferences menu entry.Right-click in the trace list and select Go to Cursor B from the pop-up menu. Select theTools | Preferences menu entry and the Preferences dialog will appear. By default, this screen will bedisplaying the options on the Monitor Colors tab. Move the Preferences screen to the right side of theMonitor window as shown in Figure 65.
The Monitor Colors tab affects the various coloring elements of the Monitor window. These settingsallow the user to change the text and background colors of the trigger and cursor markers, the color of theSDA line, SCL line, and beginning marker lines in the timing display, and the normal trace list line coloringscheme. Changing any of these settings while the affected element is visible on the screen will result inthe immediate update of the color change in the Monitor window.
Figure 65. Monitor Colors Preferences Screen

Getting Started 63
Since Cursor A is visible in the trace list, we will change its background color to observe how these colorconfiguration items work. Click on the Cursor A Background control and select the color Blue from thepop-up color picker as shown in Figure 66. Using the same method, click on the Cursor A Text controland select the color White from the pop-up color picker.
Figure 66. Monitor Colors Preferences Screen Changing Cursor A Background Color

64 Getting Started
After making these color changes, observe that the Cursor A line in the Monitor window trace list hasimmediately been painted with the newly selected colors as shown in Figure 67. All of the other items onthe Monitor Colors tab can be similarly changed.
Figure 67. Monitor Window with Updated Cursor A Colors

Getting Started 65
The Color Scheme controls how trace line groupings are displayed. The options are no color, alternatingcolor per line, or alternating color per message (address transaction and all conveyed data to/from thataddress). The default setting is Alternate color per message, but the user may prefer a different setting.Click on the Color Scheme control and select the Alternate color per row entry as shown in Figure 68.
Figure 68. Monitor Window with Updated Cursor A Colors

66 Getting Started
After changing the Color Scheme, observe the resulting effect as shown in Figure 69. Click on theUse Defaults button to reset all of the options on the Monitor Colors tab back to their default settings.Click on the Close button to close the Preferences screen.
Figure 69. Monitor Window with Alternating Row Colors

Getting Started 67
Right-click in the trace list and select Go to | Trigger from the pop-up menu. Use the vertical scroll bar onthe right side of the trace list to position the line containing the trigger into the middle of the window asshown in Figure 70.
Figure 70. Monitor Window Trace List with the Trigger Line Centered

68 Getting Started
Select the Tools | Preferences menu entry and the Preferences screen will appear. Click on theMonitor Options tab and move the Preferences screen to the middle of the Monitor window as shown inFigure 71.
Figure 71. Monitor Options Preferences Screen

Getting Started 69
The Monitor Options tab allows configuration of other Monitor window display options. The LineColumn option affects how the Line column in the trace list is displayed. When set to Starting from 1,the trace list rows will start at number one and increment sequentially. This is the default setting. Whenset to Trigger is line 0, the line containing the trigger will be zero, lines before the trigger will be negative,and lines after the trigger will be positive. Click on the Trigger is line 0 option, and observe how the Linenumber column changes around the Trigger line as shown in Figure 72.
Figure 72. Monitor Window Trace List with Trigger at Line Zero Numbering

70 Getting Started
The Timestamp Start option operates in a similar fashion. When set to Starting from 0, timestamps willincrement sequentially starting from the first trace list entry. This is the default setting. When set toTrigger is time 0, the line entry containing the trigger will have a timestamp of zero with lines before thetrigger having a negative timestamp and lines after having a positive timestamp. Click on the Trigger istime 0 option, and observe how the Time column changes around the Trigger line as shown in Figure 73.
Figure 73. Monitor Window Trace List with Trigger is Time Zero Timestamps

Getting Started 71
The Timestamp Display option affects how timestamps are calculated and displayed. When set toAbsolute, the timestamp displayed for each entry is the absolute time relative to the start of bus trafficacquisition. This is the default setting. When set to Relative, the timestamp displayed for each entry is theelapsed time since the last transaction was recorded. Click on the Relative option, and observe how theTime column changes around the Trigger line as shown in Figure 74.
Figure 74. Monitor Window Trace List with Relative Timestamps
There are several other miscellaneous options on this tab which will not be explored in this tutorial but aredescribed in the Configuration and Preferences chapter. Click on the Use Default button to return theMonitor Options settings back to their default settings.
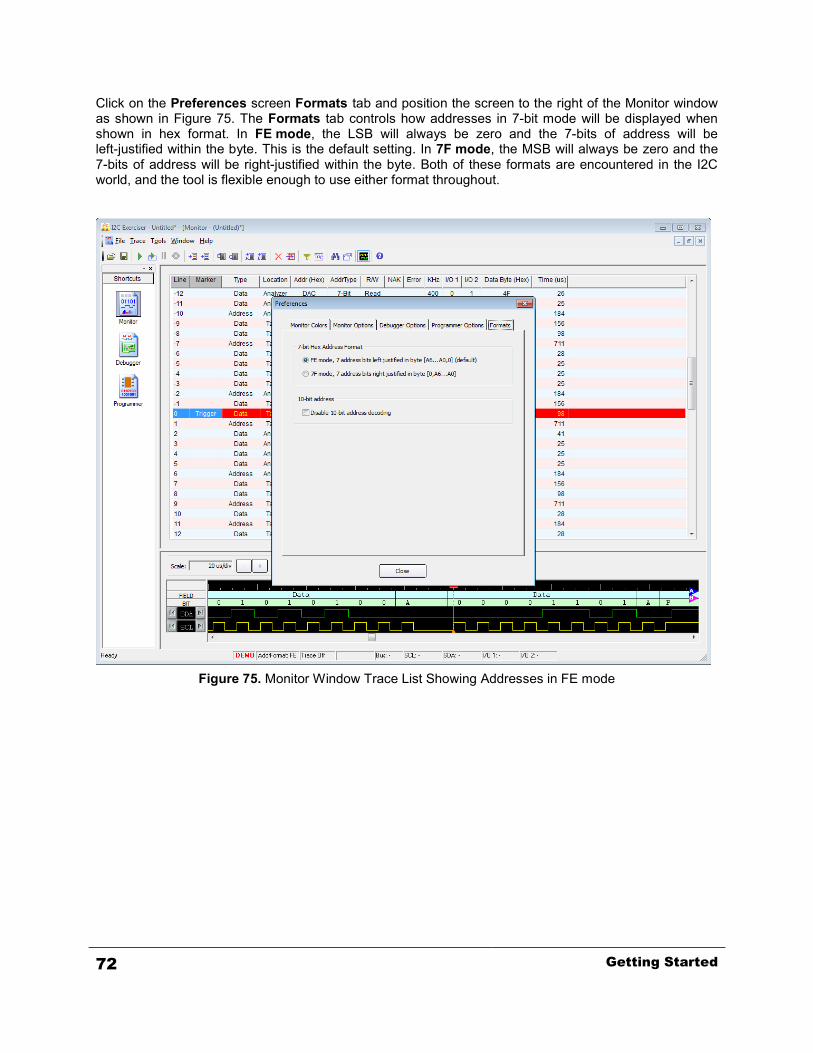
72 Getting Started
Click on the Preferences screen Formats tab and position the screen to the right of the Monitor windowas shown in Figure 75. The Formats tab controls how addresses in 7-bit mode will be displayed whenshown in hex format. In FE mode, the LSB will always be zero and the 7-bits of address will beleft-justified within the byte. This is the default setting. In 7F mode, the MSB will always be zero and the7-bits of address will be right-justified within the byte. Both of these formats are encountered in the I2Cworld, and the tool is flexible enough to use either format throughout.
Figure 75. Monitor Window Trace List Showing Addresses in FE mode

Getting Started 73
Click on the 7F mode option and observe how the Addr column changes as shown in Figure 76. Theaddresses are effectively divided by two since the seven address bits are now displayed in a right-justifiedformat within the byte. Click on the FE mode selection to return this setting to its default state. Click onthe Close button to close the Preferences screen.
Figure 76. Monitor Window Trace List Showing Addresses in 7F mode

74 Getting Started
Tutorial – Using Live ModeBy now you should have a firm grasp on the use of the I2C Exerciser’s Monitor window and basic bustracing features. The following portion of this tutorial will provide you with an understanding of the use ofthe Debugger window which provides a facility for interactive communication with devices on the I2C bus.This window is not available for use in the demo mode and to fully employ its features requiresconnection of the BusPro-I to an actual target. However, in working through the rest of this chapter, youwill use only the BusPro-I controller with no target attached which is sufficient to enable you to becomefamiliar with how the debugger component of the I2C Exerciser functions.
If it is not already connected, you will need to connect the BusPro-I controller by attaching the providedUSB cable between the USB port on the back of the BusPro-I and an available USB 2.0 port on the hostcomputer. Refer to the Installation chapter for detailed installation instructions. No target should beconnected to the BusPro-I controller during this portion of the tutorial.
Step 1 – Enable Live modeAs mentioned in the first part of this chapter, I2C Exerciser checks upon starting to see if the BusPro-I isattached and automatically enters Live Data Mode if it is or Demo Mode if it is not. Click on the Toolsmenu to see if there is a check mark next to the Demo Mode menu item and, if so, you will have to clickon this menu item to remove the check mark and switch the program into Live Data Mode as shownbelow in Figure 77. You can also verify that the program is in Live Data mode by observing the program’sstatus bar in the lower right corner of the main window as shown in Figure 78. The leftmost indicatorshould contain the text LIVE.
Figure 77. Tools Menu Deselect Demo Mode
Figure 78. Status Bar Indicating Live Data Mode

Getting Started 75
When the I2C Exerciser is first used to interact with the bus in Live Mode (as you will do in the next step),it checks the electrical characteristics of the target bus to determine if there may be a possible conflictwith the electrical settings of the current project. Because you have no target connected during thistutorial, you can expect to see the warning message shown in Figure 79 below.
Figure 79. Analyzer Supplied Mode Prompt
If you see this message, click on the Yes button to open the Configuration Manager with the I2CExerciser’s recommended electrical settings. Then simply click on the Close button at the bottom of theConfiguration Manager window to accept the recommended defaults. You can then continue with thetutorial.

76 Getting Started
Step 2 – Send and Receive with DebuggerClick on the Debugger icon in the shortcut bar on the far left side of the main window to open theDebugger window. Alternatively, you could select the Debugger entry from the Tools menu. TheDebugger window will appear as shown in Figure 80 below.
The left area of the Debugger window is for sending data to slave devices on the I2C bus and the rightarea for receiving data back from slave devices. You can see fields on both sides for specifying the busaddress and address type. Both sides also have a No Stop checkbox that allows you to generate amessage without a Stop cycle, if necessary, such that the next Address cycle will commence with aRepeated Start cycle. The Run field on the send side allows you to specify the number of times thatdebugger commands will be looped (including continuous looping). The Bytes field on the receive sidelets you enter the number of bytes that you want to read from the slave device at the specified busaddress.
Figure 80. Debugger Window

Getting Started 77
The text box in the bottom portion of the Send area is for entering debugger commands. An entry in thistext box can be as simple as a single hexadecimal byte value to send. You can refer to the InteractiveDebugger chapter later for more details on all of the commands. For now, go ahead and enter the hexvalue 3E into this box.
Even though there is no target attached to the analyzer, you are able to send the byte 3E to the bus. Clickon the Send button and the byte value should be echoed in the Receive section text box on the right sideof the window as shown below in Figure 81. Note that the option to echo the sent data (default) can becontrolled in the Debugger preferences (Tools | Preferences | Debugger Options). If turned off, the sentdata would not be shown in the receive section text box.
In Analyzer Supplied mode, the BusPro-I controller supplies the pull-up voltage for the I2C bus. If youwere still in Target Supplied mode, since there is no target connected there would be no pull-up supply tothe bus making the lines undefined when high. Therefore, any attempt to send or receive messageswould likely result in a timeout error. You can confirm and adjust the voltage source settings from theSettings pane of the Configuration Manager (Tools | Configuration Manager… | Settings).
Figure 81. Byte Sent From the Debugger

78 Getting Started
Click on the Receive button now. The value FF will appear in the Receive area text box. Without a targetattached to communicate with, this is the only value that should ever be received since the bus is floatinghigh. Enter the number 3 in the Bytes field and then click on the Receive button again to tell thedebugger to read three bytes. The value FF will now be displayed three times in the text box as shown inFigure 82 below.
Figure 82. Receive Three Bytes in the Debugger

Getting Started 79
Step 3 – Send While MonitoringIn order to see the bus traffic that is being generated by the Debugger, you need to start the Monitor tocollect data.
Go to the Monitor window by clicking on its entry in the Shortcut Bar. Click on the Run Single button in
the I2C Exerciser tool bar (indicated by the icon).
If a message box comes up asking if you want to save the current Monitor trace data, click on the Nobutton. The Run Status tab on the Monitor Tools window will open and the Monitor will begin capturingdata. You may want to minimize the Monitor Tools window if it obstructs your view of the Debugger andMonitor windows.
Go back to the Debugger window and click on the Send button.
Switch to the Monitor window by clicking on its entry in the Shortcut Bar. The trace list will display thewrite message for the byte sent as shown in Figure 83 below. The NAK column indicates that themessage was not acknowledged since there are no devices connected to the analyzer which would beable to respond to the message.
Figure 83. Capture of Debugger Send

80 Getting Started
Return to the Debugger window by clicking on the Debugger Shortcut Bar icon. You will now execute asimple Debugger script. Refer to the Interactive Debugger chapter for details on using debugger scriptcommands. For now you will load a very short debugger script from a debugger control file.
Click on the Open Command File button in the tool bar (represented by the icon). Click on the Nobutton if prompted for saving the current Debugger commands. The Open Debugger Command Filedialog window will be displayed so that you can browse for the file. It is located in the “Demo” subfolder ofthe I2C Exerciser examples folder. For a default installation, this would be “C:\Corelis Examples\I2CExerciser\Demo”. Find this subfolder and select the file named “tutorial.dcf” and then click on the Openbutton. This debugger control file script will load into the Debugger window as shown in Figure 84 below.
Figure 84. Tutorial Script Loaded Into Debugger
Notice the first line of the debugger script. This is a comment line that specifies the address mode (FE or7F) that must be used with this script. The current address mode is shown in the status bar at the bottomof the main window. It should report the default FE mode with the text, “AddrFormat: FE,” to match theexpected behavior of the script instructions. Recall from earlier in the chapter that this setting is changedvia the Formats tab of the Preferences dialog (Tools | Preferences...). When you save a debuggercommand file, this line is automatically inserted at the beginning to remind you of the address modeneeded for the script to execute correctly.
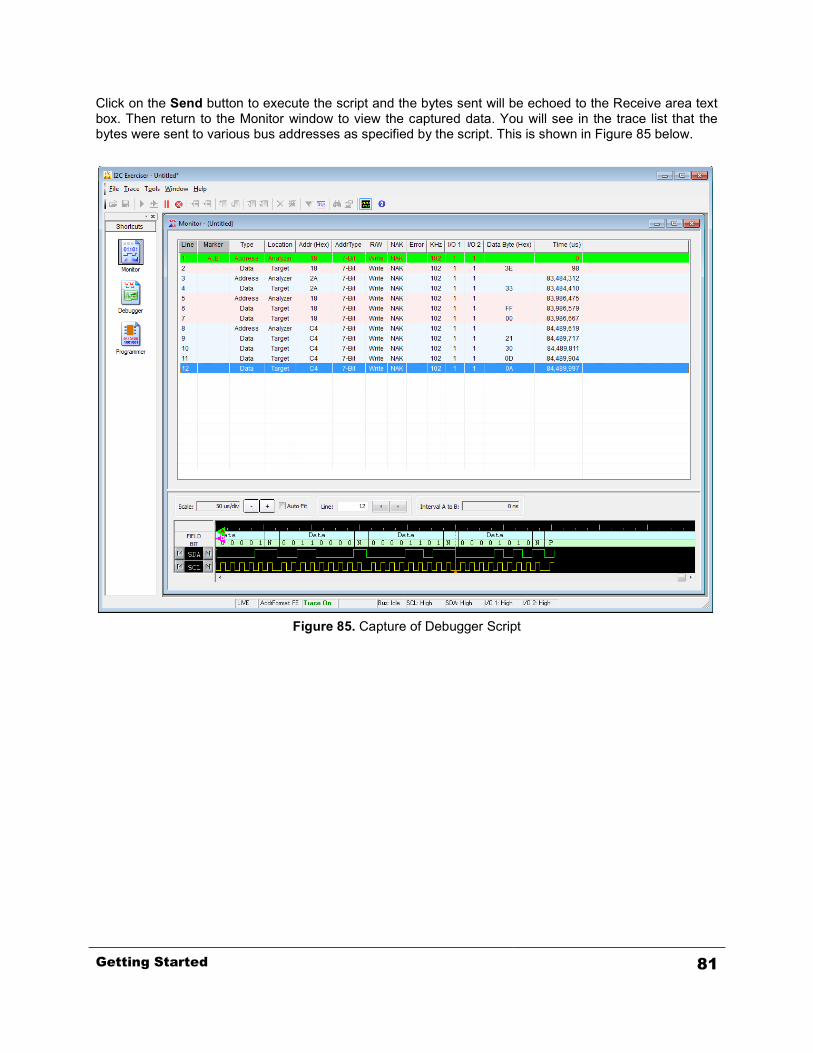
Getting Started 81
Click on the Send button to execute the script and the bytes sent will be echoed to the Receive area textbox. Then return to the Monitor window to view the captured data. You will see in the trace list that thebytes were sent to various bus addresses as specified by the script. This is shown in Figure 85 below.
Figure 85. Capture of Debugger Script

82 Getting Started
Step 4 – Manipulate Discrete I/O SignalsSuppose that you want to use the I/O 1 and I/O 2 general purpose lines to stimulate a target device. Todrive these signals, you must first set the discrete I/O modes to output. Open the Configuration Managerby clicking on its entry in the I2C Exerciser’s Tools menu and then click on the Settings tab. Near thebottom of the dialog there is a section called Input/Output Signals. Set both the I/O 1 and I/O 2 Functionfields to “Out, TTL” using the dropdown menus as shown in Figure 86 below. A custom voltage can alsobe specified here, but leave it at the default 3.30 V. Click on the Close button when you are finished.
Figure 86. Set Discrete I/O Modes
Return to the Debugger window by clicking on the Debugger Shortcut Bar icon. Click on the File menuand then click on New Debugger Command File… Enter the following commands into the empty Sendarea text box:
// Discrete I/O TestAddress10 118SetDiscrete 1 0SetDiscrete 2 0A1SetDiscrete 2 12BSetDiscrete 2 0SetDiscrete 1 19FSetDiscrete 2 1E8
The first number that follows the SetDiscrete command specifies the line — either I/O 1 or I/O 2. Thesecond number specifies the state to which the signal will be set — high on 1 or low on 0. This script willoutput a byte after setting each of the four possible combinations of signal states. Notice that theAddress10 command is used to specify that the messages will be sent to the 10-bit address 118 (hex).

Getting Started 83
Set the script to execute twice by entering a 2 in the Run field. Then click on the Send button to executethe script. The contents of the Debugger window should appear as shown in Figure 87 below. Click onthe Monitor entry in the Shortcut Bar to return to the Monitor window. As shown below in Figure 88, thetrace list will display the messages that were sent to the 10-bit address 118 and you can see changes inthe I/O lines by observing to the I/O 1 and I/O 2 columns.
Figure 87. Debugger Discrete I/O Script
Figure 88. Monitor Debugger Discrete I/O Manipulation

84 Getting Started
Step 5 – Close the Debugger
Click on the Stop button in the I2C Exerciser tool bar (indicated by the icon) to stop the Monitor fromcollecting data.
Return to the Run Status tab on the Monitor Tools window that was opened when data capturingstarted—you may have to restore it from minimized state if you had minimized it earlier. Since you aredone capturing data, click on the Close button at the bottom of the window.
Click on the Debugger entry in the Shortcut Bar to return to the Debugger window and close thedebugger session by clicking on the X button in the upper right corner of the window. A message box willcome up as shown in Figure 89 below, giving you a chance to save your debugger script. Click on the Nobutton and the Debugger will close.
Figure 89. Debugger Close

Getting Started 85
Step 6 – SMBus DecodingThe I2C Exerciser software features SMBus decoding for common SMBus devices. Ordinarily, the rawdata of the I2C transactions between SMBus devices must be manually decoded into meaningfulinformation. With the SMBus decoding feature, a specific device address can be associated with a textfile containing decoding information which allows the I2C Exerciser software to do the interpretationautomatically.
There are three parts to viewing decoded SMBus data. These can be done in any order: collect the data,associate a decoding file with a device address, and switch to SMBus Mode.
Trace data for this step has already been collected and saved in the file “tc74.tdf.” This file is located inthe “Demo” subfolder of the I2C Exerciser examples folder. For a default installation, this would be“C:\Corelis Examples\I2C Exerciser\Demo”. From the Monitor window, click on the File menu and thenclick on Open Trace Data… Note that there is also a tool bar button for this. Browse to the “Demo” foldermentioned above and select the file “tc74.tdf.” Then click on the Open button. The Monitor trace windowwill fill up with the data as shown in Figure 90 below.
Figure 90. SMBus Raw Data
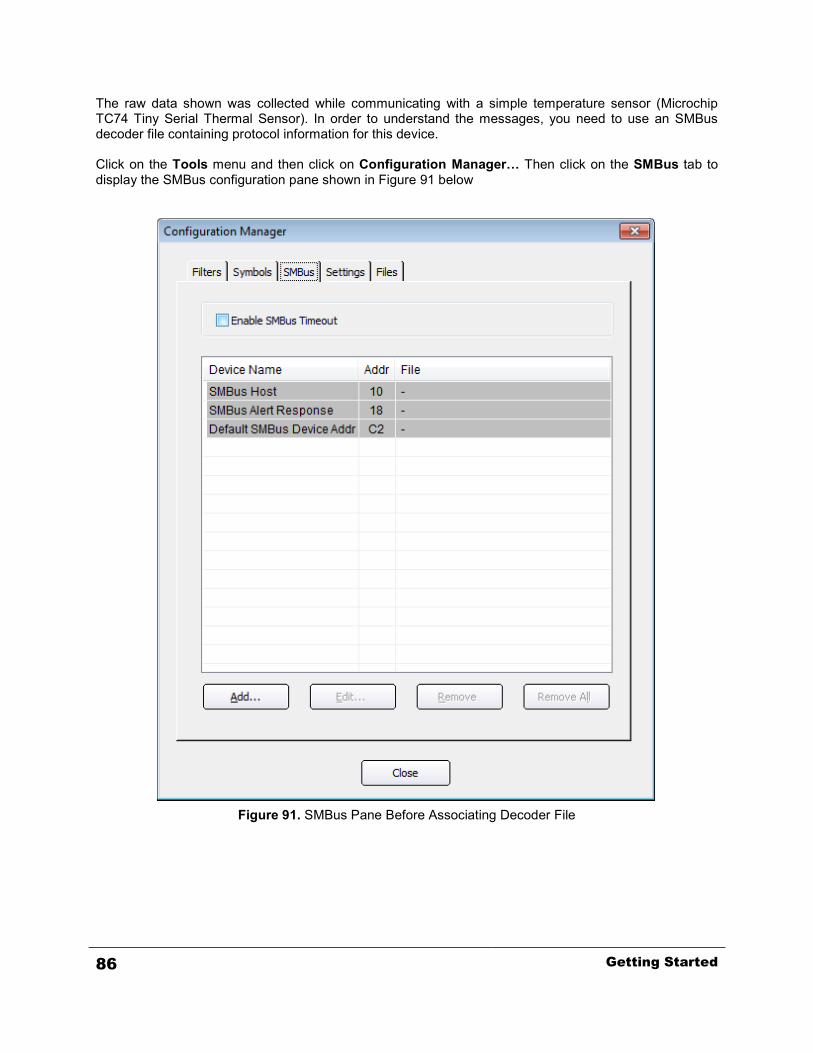
86 Getting Started
The raw data shown was collected while communicating with a simple temperature sensor (MicrochipTC74 Tiny Serial Thermal Sensor). In order to understand the messages, you need to use an SMBusdecoder file containing protocol information for this device.
Click on the Tools menu and then click on Configuration Manager… Then click on the SMBus tab todisplay the SMBus configuration pane shown in Figure 91 below
Figure 91. SMBus Pane Before Associating Decoder File

Getting Started 87
To associate a decoder file with the TC74 device, click on the Add… button and the SMBus Decoder Filedialog will open. Then click on the Browse… located on the right side of the dialog window. SMBusdecoder files are located in the “Decoder” subfolder of the I2C Exerciser examples folder. For a defaultinstallation, this would be “C:\Corelis Examples\I2C Exerciser\Decoder”. Browse to this folder and selectthe file named “tc74.smb.” Then click on the Select button and the File field of the SMBus Decoder Filedialog window will be filled in. Now click on the Update button to automatically fill in the rest of the fieldswith information from the decoder file. The dialog window will now appear as shown below in Figure 92.
Figure 92. SMBus Decoder File Dialog with TC74 Information
Click on the OK button at the bottom of the dialog window to finish adding the device association to theSMBus association list. You can see the new entry at the bottom of the list in the SMBus configurationpane. Click on the Close button to close the Configuration Manager.

88 Getting Started
Now back in the Monitor window, right-click in the Data Byte column heading and click on the SMBusMode menu item as shown in Figure 93 below. SMBus messages in the Data Byte column will now bedecoded for you as well as the device name in the Addr column as shown below in Figure 94.
Figure 93. Switch to SMBus Mode
Figure 94. SMBus Decoded Data
If the text of the decoded data does not fit within the width of the Data Byte column, positioning the mousepointer over the entry will cause a “tooltip” to display with the entire decoded SMBus message. Try this by

Getting Started 89
placing your mouse pointer over the line 18 Data Byte column entry for several seconds as shown inFigure 95 below.
Figure 95. Decoded SMBus Message ToolTip
You can also open up a window containing the full decoded SMBus message by clicking on the Data Bytecolumn entry. Click on that entry for line number 18 and the window will pop up as shown in Figure 96below.
Figure 96. SMBus Data Window
Click on the Close button to close the SMBus Data window.

90 Getting Started
This completes the I2C Exerciser tutorial. Please refer to chapters 5 and on for more detailed informationon the I2C Exerciser graphical user interface.

Connecting to a Target 91
Chapter 4Connecting to a Target
BusPro-I analyzer connection instructions and pin assignments
Connecting the I2C SignalsThe BusPro-I connects to the target’s I2C bus through the RJ45 socket on the front panel labeled SerialBus. This connector provides access to the I2C bus and discrete I/O signals.
NOTE 1: The BusPro-I should not be connected to a target I2C bus without also being plugged in tothe USB 2.0 port of a powered host PC, otherwise the target I2C bus may not function properly.
NOTE 2: The RJ45 connector is not for Ethernet and should NEVER be mistakenly connected to anetwork. The only proper connection to the host PC is through the USB 2.0 port.
Two types of test cables are available to plug into the Serial Bus connector according to your targetneeds as listed in Table 1. One, included in the standard BusPro-I package, terminates in sleeved flyingleads with detachable mini clips for arbitrary target test point hookup. The pin assignments of this cableare presented in Table 2.
The other optional cable terminates to a 4-pin crimp target connector that is compatible with the PhilipsI2C demo board. Table 3 shows the pin assignments of this cable.
In addition, SMB connectors are provided to allow synchronization with external instruments. Theseconnectors are labeled AT1 and AT2 on the BusPro-I front panel and are compatible with standard 50-ohm coaxial cables (not included).
RJ45Pin
SignalName Signal Description Cable Wire Color Target End
Sleeve Color
1 I/O1 Programmable Input/Output White with Orange YELLOW
2 Reserved Orange -
3 GND White with Green BLACK *
4 SCL I2C Clock Blue RED
5 GND White with Blue BLACK *
6 SDA I2C Data Green BLUE
7 I/O2 Programmable Input/Output White with Brown WHITE
8 Reserved Brown -
* tied together into a single sleeve.Table 2. Flying Leads Serial Bus Connector Pin Assignments
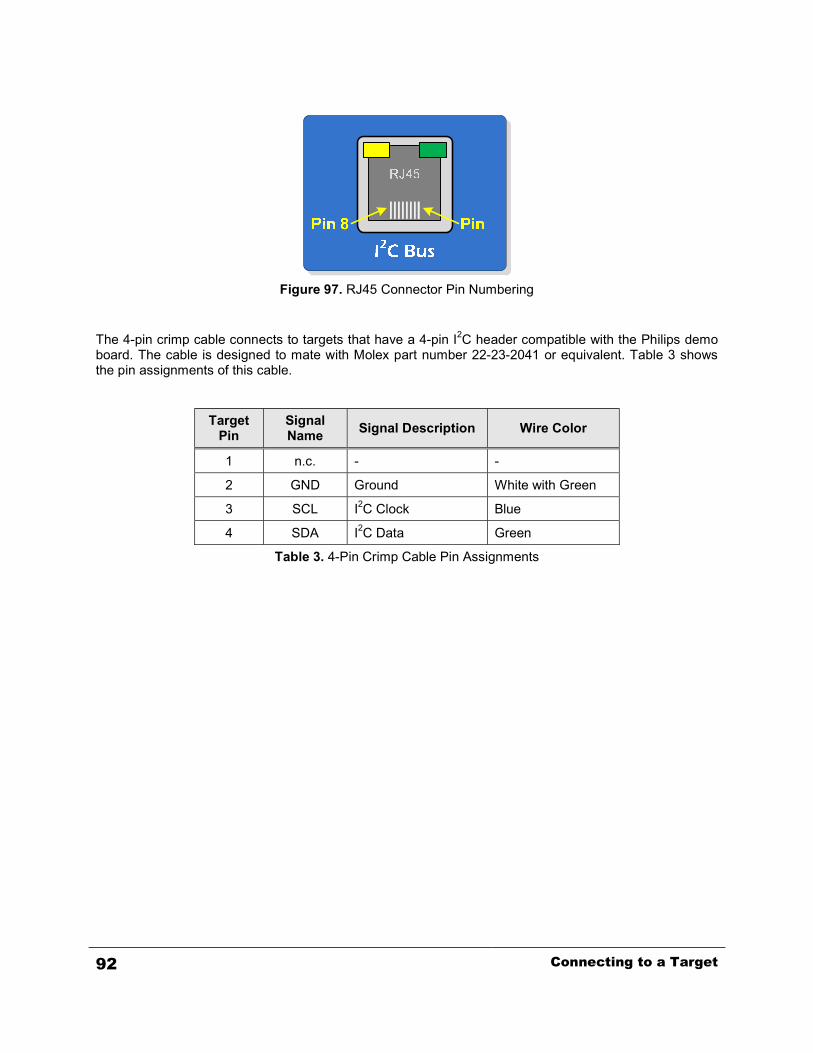
92 Connecting to a Target
Figure 97. RJ45 Connector Pin Numbering
The 4-pin crimp cable connects to targets that have a 4-pin I2C header compatible with the Philips demoboard. The cable is designed to mate with Molex part number 22-23-2041 or equivalent. Table 3 showsthe pin assignments of this cable.
TargetPin
SignalName Signal Description Wire Color
1 n.c. - -
2 GND Ground White with Green
3 SCL I2C Clock Blue
4 SDA I2C Data Green
Table 3. 4-Pin Crimp Cable Pin Assignments

Connecting to a Target 93
Interface SetupAside from setting up the physical connections between the BusPro-I and the target I2C bus, it isimportant to set up various configuration options in the I2C Exerciser application so that the BusPro-I isready to interface properly with the bus and commence traffic collection and viewing with minimalcomplications. The I2C Exerciser’s Configuration Manager provides access to these settings.
Once configured by the user, most of the settings and custom preferences are conveniently saved by theI2C Exerciser with each project. A new project always begins with the BusPro-I’s factory default settings,but a previously saved project configuration file can be opened to load a particular saved setup.
Important factors to consider when configuring the I2C Exerciser include:
Whether a target is connected Whether the target has its own pull-up voltage source Whether the target is expected to exhibit slow signal rise-times (because of excessively high
capacitance or excessively high pull-up resistance) Whether the target has a master lacking support for multi-master operation What signal clock rate is supported by the target
When the BusPro-I analyzer is first used to interact with the target bus, it checks for a target supplied pull-up. If a target supplied pull-up is detected but the analyzer expects to provide the pull-up source, then aprompt will be displayed so that the analyzer may be set to not provide the pull-up source in order toavoid contention with the target. Conversely, if no target pull-up is detected and the analyzer is not set toprovide the pull-up source, then a prompt will be displayed so that the analyzer may be set to provide thepull-up source for the bus.

94 Connecting to a Target
ScenariosThe following scenarios are presented to help you configure the BusPro-I analyzer to get it up andrunning in the shortest amount of time. Most setup options are found in the Settings pane of theConfiguration Manager, as shown in Figure 98. The Configuration Manager can be opened from the I2CExerciser’s menu bar by selecting Tools | Configuration Manager… or by pressing the <F8> key. Fordetailed descriptions of each setting, see the Settings Reference section later in this chapter.
Figure 98. Configuration Manager
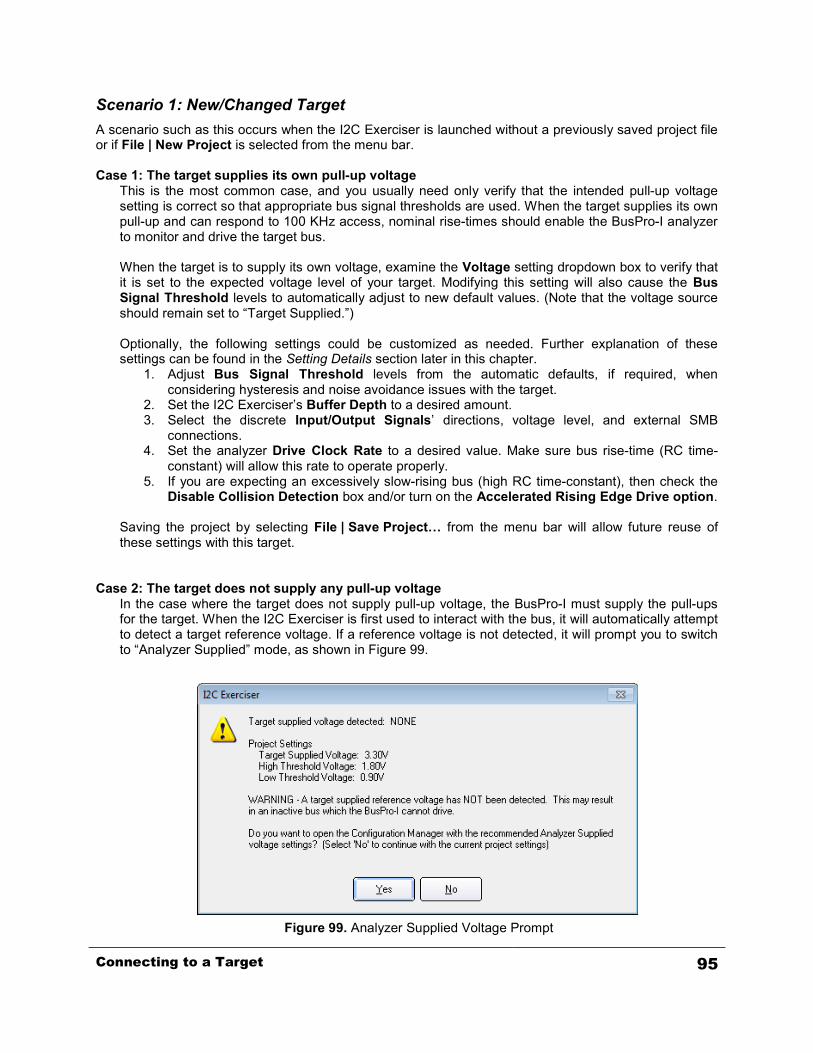
Connecting to a Target 95
Scenario 1: New/Changed TargetA scenario such as this occurs when the I2C Exerciser is launched without a previously saved project fileor if File | New Project is selected from the menu bar.
Case 1: The target supplies its own pull-up voltageThis is the most common case, and you usually need only verify that the intended pull-up voltagesetting is correct so that appropriate bus signal thresholds are used. When the target supplies its ownpull-up and can respond to 100 KHz access, nominal rise-times should enable the BusPro-I analyzerto monitor and drive the target bus.
When the target is to supply its own voltage, examine the Voltage setting dropdown box to verify thatit is set to the expected voltage level of your target. Modifying this setting will also cause the BusSignal Threshold levels to automatically adjust to new default values. (Note that the voltage sourceshould remain set to “Target Supplied.”)
Optionally, the following settings could be customized as needed. Further explanation of thesesettings can be found in the Setting Details section later in this chapter.
1. Adjust Bus Signal Threshold levels from the automatic defaults, if required, whenconsidering hysteresis and noise avoidance issues with the target.
2. Set the I2C Exerciser’s Buffer Depth to a desired amount.3. Select the discrete Input/Output Signals’ directions, voltage level, and external SMB
connections.4. Set the analyzer Drive Clock Rate to a desired value. Make sure bus rise-time (RC time-
constant) will allow this rate to operate properly.5. If you are expecting an excessively slow-rising bus (high RC time-constant), then check the
Disable Collision Detection box and/or turn on the Accelerated Rising Edge Drive option.
Saving the project by selecting File | Save Project… from the menu bar will allow future reuse ofthese settings with this target.
Case 2: The target does not supply any pull-up voltageIn the case where the target does not supply pull-up voltage, the BusPro-I must supply the pull-upsfor the target. When the I2C Exerciser is first used to interact with the bus, it will automatically attemptto detect a target reference voltage. If a reference voltage is not detected, it will prompt you to switchto “Analyzer Supplied” mode, as shown in Figure 99.
Figure 99. Analyzer Supplied Voltage Prompt

96 Connecting to a Target
Click on the Yes button to allow the application to automatically switch to “Analyzer Supplied” fromthe “Target Supplied” setting and the Configuration Manager will open for you to review the newsettings. Additionally, you can select the desired bus pull-up resistance and voltage, as well aschange the settings described in Case 1 above. Note that the Pull-up Resistance setting is enabledonly when the Analyzer Supplied voltage source is selected, as seen in Figure 100. When theBusPro-I is to supply pull-ups, examine the following settings:
1. Make sure that the Analyzer Supplied radio button is selected.2. Select an appropriate pull-up Voltage for the bus.3. Select the bus Pull-up Resistance (this is for both the SCL and the SDA signal), taking into
consideration its capacitance (keep RC time constant small enough for expected SCL rates).
Figure 100. Configuration Manager Analyzer Supplied

Connecting to a Target 97
Auto DetectAt any time, you may have the I2C Exerciser check for a voltage on the target bus and automaticallypick recommended default electrical settings for you by clicking on the Auto Detect button in theConfiguration Manager Settings pane.
Scenario 2: Previously Tested TargetThis scenario occurs when you load a previously saved project file either during launch of the applicationor by selecting File | Open Project from the menu bar. Since the software has already saved the settingsfor the target bus in the project file, no additional setup should be necessary.
Scenario 3: No TargetThis scenario occurs when no target is attached to the bus. Because a nonexistent target means thatthere will be a lack of pull-up voltage, the software will behave as in Case 2 of Scenario 1 above.Depending on whether the program is already set up, you will either perform the necessary setup or donothing at all.
Case 1: Program not set upWhen you first try to interact with the bus, a reference voltage will not be detected and you will beprompted to change to Analyzer Supplied. Select Yes and follow the steps in Case 2 of Scenario 1described above. With no target attached, the BusPro-I will effectively talk to itself.
Case 2: Program already set upIf the program is already set up, such as from a loaded project or from prior usage, you should not needto do anything.

98 Connecting to a Target
Setting DetailsAll of the BusPro-I settings that are of principal concern when connecting to a target can be found in theSettings pane of the Configuration Manager, shown in Figure 101. This can be opened by pressing <F8>or selecting Tools | Configuration Manager from the menu bar, and then selecting the Settings tab.Each of the setting groupings is described in the following sections. For details on the other panes of theConfiguration Manager as well as the Preferences dialog, refer to the Configuration and Preferenceschapter.
Figure 101. Configuration Manager Settings Pane

Connecting to a Target 99
Bus Electrical FeaturesThe Bus Electrical Features group, shown in Figure 102, specifies the electrical characteristics of the bus.
Figure 102. Bus Electrical Features
Voltage Source:
Target Supplied – Specifies that the connected target I2C bus has its own pull-up voltage supply. Inthis case, the target bus is self-sufficient and ready for use. When this setting is selected, the Pull-upResistance setting is disabled.
Analyzer Supplied – Specifies that the BusPro-I will supply pull-up voltage to the target bus. In thiscase, the target has no other attached pull-up voltage source and the analyzer must supply this toactivate the bus. When this setting is selected, both the Voltage and Pull-up Resistance settings areenabled.
Voltage – In Analyzer Supplied mode, this specifies the voltage to which the bus will be pulled upby the BusPro-I. The user must ensure that this level is compatible with the operation of anyattached target bus. In Target Supplied mode, this specifies the voltage level that will be providedby the target so that appropriate bus signal threshold levels can be automatically set.
Pull-up Resistance – In Analyzer Supplied mode, this specifies the pull-up resistor value throughwhich both bus signals (SCL and SDA) will be pulled up by the BusPro-I. The user shouldconsider the target I2C bus capacitance such that the resultant RC time-constant will notadversely affect its operation at expected clock rates (by producing signal rise-times that are tooslow).
Bus Signal Thresholds – These settings apply in general to all monitoring of the bus by the analyzer.Default values for these settings are based on the pull-up voltage selected in the Voltage dropdown box.
High Level –This value establishes the minimum voltage that a bus signal (SDA and SCL) must riseabove from the low state before it is considered to be high.
Low Level –This value establishes the maximum voltage that a bus signal (SDA and SCL) must dropbelow from the high state before it is considered to be low.
Auto Detect – This button causes the I2C Exerciser to check for a voltage on the target bus andautomatically select recommended default electrical settings based on its findings.

100 Connecting to a Target
Bus Drive and Monitoring FeaturesThe Bus Drive and Monitoring Features group of settings, shown in Figure 103, specify the clock rate,accelerated rising edge drive, collision detection, and high-speed mode options for the BusPro-I when it isdriving the target bus.
Figure 103. Bus Drive and Monitoring Features
Drive Clock Rate – Specifies the nominal clock rate of the SCL signal when the BusPro-I drives the bus.Note that the I2C bus is not of a continuously clocking type since various conditions can stretch the clockor require resynchronization between multiple sources. Therefore, a constant period is not expected.
Disable Collision Detection – Under normal circumstances, when the BusPro-I drives the bus (actinglike a master) it is required to detect that the signal levels it drives match (within a reasonable time) what itsenses on the bus. Failure to detect a match would imply a collision with another master. If the bus hasexcessive capacitance or high pull-up/capacitance combinations which cause its rise-time to be slow, afalse collision may be repeatedly detected and prevent the BusPro-I from completing its transactions.Enabling this Disable Collision Detection option accommodates such slow busses and allows the BusPro-I driving to proceed, but without the I2C arbitration mechanism. Therefore, the user needs to keep anytarget I2C bus master(s) quiet while the BusPro-I drives the bus when collision detection is disabled.
Accelerated Rising Edge Drive – In general, when a driver on the bus makes a positive signaltransition, the rise-time is determined by the RC time-constant of the bus. The rise-time governs the upperlimit on effective clock rates. When the BusPro-I drives the bus, it can apply a strong rising drive duringthe signal transition to overcome the RC time-constant, creating a rapid edge. This can then allow anincrease in the clock rate for a given RC value of the bus. If this option is set to AUTO, the BusPro-I willengage the fast rising edge mechanism automatically whenever it is operating with the I2C high-speedmode (Hs-mode) protocol—note, however, that the High-Speed Mode emulation is not currentlysupported by the BusPro-I and so the AUTO setting will have the same effect as OFF. If this optionis set to ON, the BusPro-I employs the mechanism at all times. Setting this option to OFF fully disablesthe mechanism, letting the pull-ups or the target capacitance determine rise times.
High-Speed Mode Monitoring – This setting provides an option to turn on or off the Hi-Speed Modemonitoring mechanism. When it is turned off, the glitch filtering mechanism of BusPro-I becomes enabled.The glitch filtering mechanism filters out glitches that are less than 50 ns in duration for protocol decoding,but indicates their occurrences on the timing display. At Drive Clock Rate higher than 1 MHz, this option isforced to be ON to avoid any over-filtering of glitches.

Connecting to a Target 101
Input/Output SignalsThe discrete Input/Output signals (I/O 1 and I/O 2) augment the normal I2C bus signals (SDA and SCL) tosupport sensing or stimulation of a connected target or to support synchronization with externalinstruments. They can be individually steered as outward or inward signals and mapped to the SMBconnectors (AT1 and AT2) on the BusPro-I. The Input/Output Signals group of settings, shown in Figure104, allow configuration of these discrete I/O lines.
Figure 104. Input/Output Signals
High Level – Specifies the TTL high voltage level of the I/O signals. When sensing inputs, the BusPro-Iwill also use this setting to automatically determine corresponding signal threshold values.
Function – These settings control the inward/outward direction of the discrete I/O signals.
I/O 1 – Specifies the discrete signal I/O 1 to be an input, an output TTL driver, or an output open-draindriver.
Drive SMB AT1 – If the I/O 1 discrete signal is set as an output, selecting this option will map thestate of the I/O 1 line to the AT1 SMB connector on the BusPro-I for signaling external instruments.Not applicable when I/O 1 is an input.
I/O 2 – Specifies the discrete signal I/O 2 to be an input, an output TTL driver, or an output open-draindriver.
Source – If the I/O 2 discrete signal is set as an input, this setting specifies the source of the signal.Selecting “Target” routes it through the Serial Bus (RJ-45) connector on the BusPro-I. Selecting “SMBAT2” routes it from the AT2 SMB connector on the BusPro-I, enabling trigger inputs from externalinstruments.

102 Connecting to a Target
Monitor Buffer OptionsMonitor Buffer Depth – The Monitor Buffer Depth setting, shown in Figure 105, allows the user to selectthe buffer depth specified by the number of transactions. This value indicates the number of transactionsthat occur before the monitor trace is considered to be full.
Figure 105. Monitor Buffer Options
The Monitor Buffer Depth ranges from 1 K (1,024) to 1 M (1,048,576) transactions. Note that this optionmay be limited by the available RAM in the host computer and requires much more storage in bytes thanthe actual number of transactions indicated. Choosing a large depth may considerably slow down theapplication when running the monitor if there is not enough memory in the host computer. The default of64 K (65,536) transactions should be adequate for most monitoring needs.
Monitor Buffer Log to File – This option provides continuous logging of trace data to the hostcomputer’s hard disk and, during "Run Repetitive" monitoring, can record and store endless hours of I2Cbus traffic limited only by available disk space. When this option is selected, the captured Monitor tracedata is saved to files as described below.
The trace data is stored in files with the extension "*.tdf", each of which holds up to 1M of consecutive I2Cbus transactions. The trace data path and base filename are user-specified and then a numerical index isappended to each filename ("_nnnn") to indicate the chronological order in which the data was capturedand saved. Note that each 1M-transaction trace data file uses about 260MB of disk space as it containsall captured I2C bus transaction data, including signal waveforms, timing and timestamp information.
Use the Monitor Window's "Run Repetitive" button to continuously capture the traffic. Data will becaptured into a *.tdf file and when the file exceeds 1M transactions, another file will be opened to continuestoring transactions, and so forth. Note that when the "Run" or the "Run Repetitive" button is clicked andtrace data files with the same base filename already exist in the specified location, the user will beprompted to overwrite them. While running, the Monitor Window displays the most recent 1M transactionsof data, and the Run Status tab on the Monitor Tools window lists the name of the trace data file currentlybeing logged to. After data capture has finished, you may double-click on the listed filenames to load thetrace data to the Monitor Window.
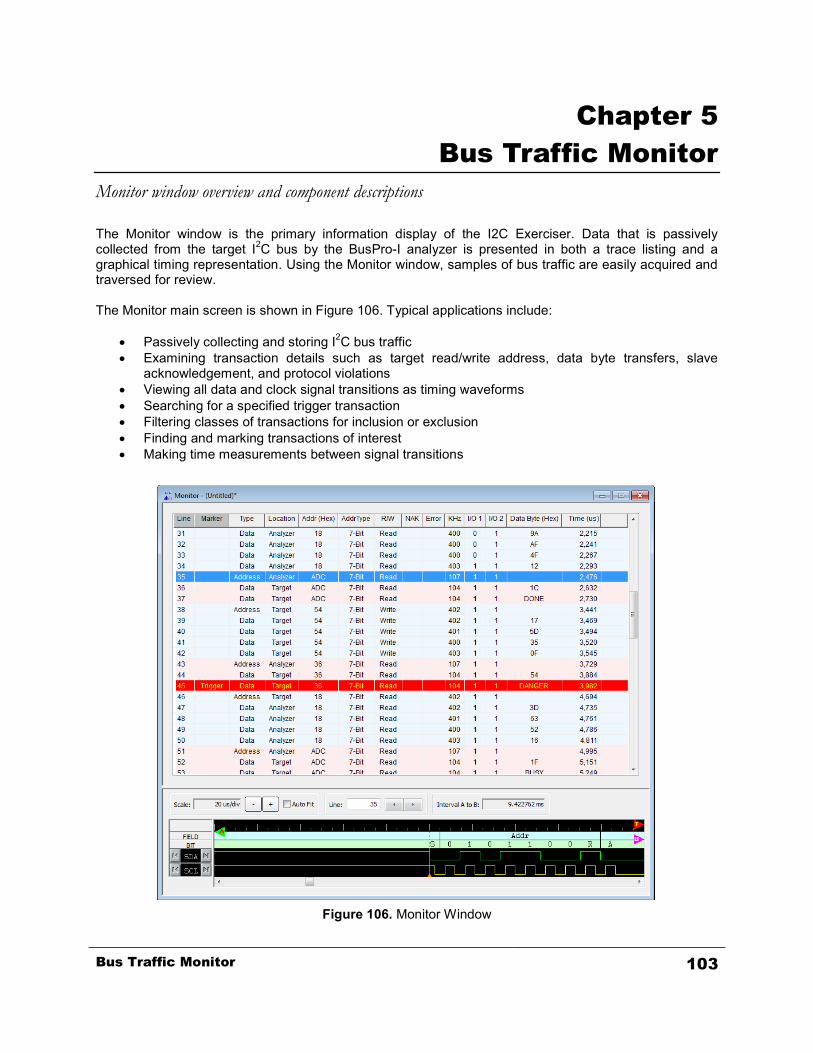
Bus Traffic Monitor 103
Chapter 5Bus Traffic Monitor
Monitor window overview and component descriptions
The Monitor window is the primary information display of the I2C Exerciser. Data that is passivelycollected from the target I2C bus by the BusPro-I analyzer is presented in both a trace listing and agraphical timing representation. Using the Monitor window, samples of bus traffic are easily acquired andtraversed for review.
The Monitor main screen is shown in Figure 106. Typical applications include:
Passively collecting and storing I2C bus traffic Examining transaction details such as target read/write address, data byte transfers, slave
acknowledgement, and protocol violations Viewing all data and clock signal transitions as timing waveforms Searching for a specified trigger transaction Filtering classes of transactions for inclusion or exclusion Finding and marking transactions of interest Making time measurements between signal transitions
Figure 106. Monitor Window

104 Bus Traffic Monitor
Trace ListingThe trace listing, located in the top portion of the Monitor window, provides the fundamental presentationof traffic acquired from the target I2C bus. Each row is considered to represent a transaction whichdescribes a complete read/write address or data byte sequence that is conveyed over the bus. All of thetransaction details are included as columns in the listing. Figure 107 shows the Monitor window tracelisting.
Figure 107. Monitor Trace Listing
Column DescriptionsLine – This column contains a line number for each trace line. The numbering can be relative to the startof the collected traffic or to the line that has been marked as “Trigger,” depending on the preference thathas been set. Refer to the Monitor Options section of the Preferences Dialog description in theConfiguration and Preferences chapter.
Marker – This column is used to mark particular lines of interest. It may contain one of the followingidentifiers:
Trigger – A trigger is a special user-defined transaction event that determines when the monitorwill automatically stop data collection. See the Trigger section later in this chapter for moreinformation on Triggers.
Cursor A, B – Each of the two cursors is a special indicator that is used in the timing field tomeasure time intervals. As a cursor is positioned in the timing field, the trace listing transactionwhich occurs nearest to the cursor is marked for reference.
Tagged – This marker identifies any number of user-designated lines of interest. Lines in thetrace listing can be tagged by double-clicking on them, making the lines easy to locate bothvisually and using the “Go to Tagged Row” function available from the Monitor’s Tool Bar orTrace menu. Double-clicking on a line that is already tagged will clear this marker.

Bus Traffic Monitor 105
Type – This column contains an identifier that indicates one of the two major classes of transactions:
Address – The I2C bus transaction cycle during which a START or repeated START conditionleads to the shifting of a transfer address for a target slave device and write or read qualifier ontothe bus. This action precedes subsequent data byte transfers to the indicated target slave andthat data transfer is terminated by either a STOP or repeated START condition. The transferaddress is shown in the Addr column and the read/write qualifier in the R/W column.
Data – The I2C bus transaction cycle during which data bytes are conveyed to or from a targetslave device. The address of the target slave is determined by the previous address cycle and isshown in the Addr column. The read/write qualifier indicated in the R/W column designateswhether the data bytes are being written to or read from the target slave. For data cycletransactions, the data byte(s) conveyed will be present in the Data Byte column.
Location – This column indicates whether the BusPro-I analyzer is involved in the transaction. Foraddress cycle transactions, “Analyzer” signifies that the analyzer is acting as a master (through theDebugger or Emulator, for example), while “Target” signifies that a master on the target I2C bus is driving.For data cycle transactions, “Analyzer” signifies that the addressed slave is in fact being emulated by theanalyzer, while “Target” signifies that a live target slave device is involved.
Addr – This column indicates the I2C bus address of the target slave device for the transaction. Theaddress is either a 7-bit, 10-bit, or Hs-mode type depending on which is indicated in the AddrTypecolumn. Various numerical formats are available for displaying the address value, including hex, decimal,and binary. The current display format is shown in parenthesis in the column heading and right-clicking onthe column heading will display a popup menu that allows selection of the display format. If symbols areenabled and there is an address symbol defined for the target slave, then that symbolic name will appearin place of the numeric value (refer to the Symbols section later in this chapter).
When using SMBus Mode, the address value of each transaction is decoded into the name of the SMBusdevice if there is a decoding file associated with the address value (refer to the SMBus section of thischapter for more information).
Note that 7-bit I2C addresses are represented numerically as 8-bit values and their format is dependenton the current address mode setting (FE mode or 7F mode). Please refer to the Formats section of thePreferences Dialog description in the Configuration and Preferences chapter for more information.
AddrType – This column indicates whether the address value in the Addr column is a 7-bit, 10-bit, or Hs-mode address.
R/W – This column indicates the state of the read/write bit that is conveyed during an address cycle. Fromthis state, the direction of data flow is determined relative to the master: “R” signifies that data is readfrom a target slave and “W” signifies that data is written to a target slave.
NAK – This column indicates whether a transaction terminated with a not-acknowledge (NAK). If thiscolumn entry is blank, an acknowledge (ACK) occurred, otherwise it contains the identifier, “NAK.”
Error – This column indicates whether an I2C protocol violation has been detected. If so, the column entrycontains the identifier, “Error,” otherwise it is blank. If an error is detected, left-clicking on the cell willdisplay a popup that reveals the location in the transaction where the error occurred (such as during theaddress cycle, data cycle, START or STOP, etc). Reviewing the associated timing field graph can helpprovide more details regarding the Error. Note that an error can cause the analyzer to losesynchronization and all signal edge transitions that occur while the analyzer attempts to resynchronize willbe associated with the same trace list entry.
KHz – This column indicates the approximate average clock rate for the transaction in units of kilohertz.

106 Bus Traffic Monitor
I/O 1 – This column indicates the state of discrete I/O line 1 during the transaction.
I/O 2 – This column indicates the state of discrete I/O line 2 during the transaction.
Data Byte – This column indicates the data byte values conveyed to or from the target slave device bythe transaction. Various numerical formats are available for displaying the values, including hex, decimal,and binary. The current display format is shown in parenthesis in the column heading and right-clicking onthe column heading will display a popup menu that allows selection of the display format. If symbols areenabled and there is a data byte symbol defined for the target slave, then that symbolic name will appearin place of the numeric value (refer to the Symbols section later in this chapter).
When using Compact mode, all data byte transactions following an address transaction will be displayedon a single trace listing line. Left-clicking the column entry will display all of the bytes as an array of hexvalues in a separate scrollable dialog.
When using SMBus Mode, each data byte value of the transaction is decoded into a text SMBusmessage if the value is associated in an SMBus decoding file (refer to the SMBus section later in thischapter). In this mode, positioning the mouse pointer over a data column entry will bring up a “tooltip”containing the entire SMBus message. Also, left-clicking the column entry will display the entire messagein a separate scrollable dialog.
Right-clicking on the column heading will display a popup menu that allows selection (or de-selection) ofCompact mode, SMBus mode, or the default Normal mode.
Time – This column indicates the timestamp that is assigned to the beginning time of each transaction.Various time display units are supported, including nanoseconds, microseconds, milliseconds, andseconds. The current time unit is shown in parenthesis in the column heading and right-clicking on thecolumn heading will display a popup menu that allows selection of the time unit.
Timestamps can be displayed in relative mode (the time between transactions) or absolute mode (theaccumulative time starting from zero). Time zero can also be selected to start at the first transaction or atthe Trigger transaction (with prior transactions having negative time). Refer to the Monitor Options sectionof the Preferences Dialog description in the Configuration and Preferences chapter.

Bus Traffic Monitor 107
Timing FieldThe timing field located in the bottom portion of the Monitor window provides a graphical image of bussignal edge transitions over time. This information is similar to that acquired by logic analyzers, showingthe state progression of clock (SCL) and data (SDA) signals. Figure 108 shows the Monitor timing fieldwith its major components labeled. These labeled areas are described below.
Figure 108. Monitor Timing Field
Component DescriptionsField Descriptors – This row of the timing display indicates the protocol segment of the waveform. Thefollowing labels are used:
Addr – Designates the address cycle during which target slave address bits are conveyed alongwith the transfer direction indicator bit.
Data – Designates the data cycle during which data bytes are conveyed to and from a slave.
Idle – Designates the occurrence of a STOP condition, placing the I2C bus in an idle state.
Bit Descriptors – This row of the timing display indicates the meaning of the waveforms relative to thetransition cycle (identified by the field descriptor in the row above). The following labels are used:
0/1 – Designates the bit level conveyed during an address or data cycle.
A/N – Designates the ACK/NAK bit. After an address or data cycle, either an “A” is shownmeaning that the transaction is acknowledged or an “N” is shown meaning that the transaction isnot-acknowledged.
P – Designates a STOP condition.
S – Designates a START or repeated START condition.

108 Bus Traffic Monitor
W/R – Designates the transfer direction indicator bit. During an address cycle, either a “W” isshown meaning that a master is writing data to a target slave device or an “R” is shown meaningthat a master is reading data from a target slave device.
Scale controls – These controls adjust the zoom level of the timing graph waveforms.
Scale text box – This indicates the length of time between each of the larger tick marks acrossthe top of the timing display (based on the current zoom level).
-/+ buttons – These buttons enable zooming out (-) or in (+) to show the timing waveformsexpanded (more detail) or contracted (more transitions over the length of the graph). Zooming isrelative to the point at the center of the timing graph, which remains fixed as both ends of thewaveforms stretch closer to or farther from it. Alternately, mouse scroll wheels can be used forzooming in or out.
Auto Fit checkbox – If checked, the zoom level automatically adjusts to an “optimum” scale suchthat about 20 SCL clock periods are shown over the timing graph.
Line controls – These controls reflect the location of the timing graph’s Link-Edge Marker (describedbelow) relative to the trace listing and allow easy navigation through the transactions.
Line text box – This indicates the trace listing line that corresponds to the location of the Link-Edge Marker in the timing waveform (whether in view or not). An arbitrary number may beentered here to jump to that transaction line. The Link-Edge Marker will then attach to thebeginning of the transaction waveform and the graph will center on this new location.
Line buttons – These left and right arrow buttons assign the Link-Edge Marker to the previous orfollowing transaction, respectively. The graph will center on this new location.
Link-Edge Marker – This vertical line in the waveform graph indicates the beginning of a particulartransaction. It corresponds to the trace listing line that is identified in the Line text box (described above).
Interval A to B – This indicates the time difference between the position of Cursor A and Cursor B.
Waveforms – These waveforms show the graphical time sequence of SDA, SCL, I/O 1, and I/O 2 signalstates as they transition from low to high.
Cross-hairs indicator – As the mouse cursor is positioned over the timing graph, the time at its positionand the nearest corresponding trace listing line number to that time are displayed next to the cross-hairsindicator. Left-clicking, holding, and dragging the cross-hairs will drag the timing display in the direction ofthe mouse movement. Performing the same action with the CTRL key pressed will show the relative timedisplacement dragged out.
Cursor A/B – These are two vertical line markers which can be placed anywhere in the timing graph (byleft-clicking and dragging). The markers will remain where placed, even when not in view, and are used tomeasure time intervals (see the Interval A to B component above). The transaction line nearest a cursoris indicated in the trace listing with special highlighting and an entry in the Marker column.

Bus Traffic Monitor 109
Timing Field Popup MenuThe Timing Field Popup Menu is accessed by right-clicking in the waveform area of the timing fieldwindow as shown in Figure 109. It provides various functions to help users to navigate and examine thewaveform display.
Figure 109. Timing Field Popup Menu
Zoom In – Zooms into the waveform by one scale-step at the right-clicked point.
Zoom Out – Zooms out from the waveform by one scale-step at the right-clicked point.
Go To – Jumps the display to the points of interest such as the trigger, cursors, next, and previous lines.
Place Cursor – Places the cursor A or B at the right-clicked point.
Hide Monitor Timing – Hides the Monitor timing field.
Print Monitor Timing – Sends the image of Monitor timing field as shown on the screen to the Windowsprinter.
Preferences – Opens the Preferences dialog.

110 Bus Traffic Monitor
Monitor ConfigurationsVarious configuration options relevant to the Monitor Window can be specified by opening theConfiguration Manager from the Tools menu. The Configuration Manager can be used to configure theFilters, Symbols, and SMBus features which are applicable to use of the Monitor Window.
FiltersA filter defines a class of transactions by specifying a set of particular transaction features. Each filter canbe individually activated or not via the checkbox beside the filter’s name, and the activated filters arecombined using OR logic unless the AND Filter Conditions Together option is set. The combinedselection of active filters can be set to either determine which transaction classes are included or whichare excluded from the trace listing. Use of filters allows you to view only the bus activity of interest, withitems considered clutter removed. If a transaction is removed from the monitor trace listing, it is alsoeffectively removed from the timing display graph where it will appear as a non-busy bus.
The Filters pane dialog is shown in Figure 110.

Bus Traffic Monitor 111
Figure 110. Filters Pane
Filters can either define transactions that will be included in the trace listing or excluded from the tracelisting. The radio buttons at the top of the dialog determine this selection or turn off filtering completely.The Include and Exclude selections each have their own separate set of filters which are displayed in thedialog’s list box. A filter from the list can be selected by the user for editing or removal.
Using the Add button beneath the list box, a new filter can be defined and appended to the list. The Editbutton enables alteration of an existing selected filter. The Remove and Remove All buttons enable thedeletion of a selected filter or the entire set of filters.
The Filter Definition dialog for setting the transaction criteria for each filter is similar to those for the Finddialog. This dialog, shown in Figure 111, is displayed when using the Add or Edit buttons.

112 Bus Traffic Monitor
Figure 111. Filter Definition Dialog (similar to Edit)

Bus Traffic Monitor 113
SymbolsThis dialog, shown in Figure 112, displays a list that can contain symbolic text strings along withassociated parameters that specify the criteria which determine where the symbolic text will replace anumeric value in the trace listing and other related dialogs. This can be used to enhance the userreadability of transactions.
Figure 112. Symbols Pane

114 Bus Traffic Monitor
Using the Add button beneath the list box, a new symbol can be defined and appended to the list. TheEdit button allows alteration of an existing selected symbol definition. The Remove and Remove Allbuttons enable the deletion of a selected symbol definition or the entire list of symbol definitions. TheSymbol Definition dialog that is displayed when using the Add or Edit buttons is shown in Figure 113.
Figure 113. Symbol Definition Dialog
For Data Bytes, the value located at a specific byte number position in a message can define a certainsymbol which might relate to a device-specific structure. For example, the n’th byte of a slave devicemight be a register, the contents of which may be appropriately shown using some symbolic text, insteadof the numeric value.
Symbols can also operate in the reverse direction. That is, a symbolic text string can be entered in placeof a numeric value when using the Find dialog or specifying a slave device address in the Debugger ordebugger command script file. Thus, for example, a slave device can be referenced by a name like “PLL”instead of a numeric bus address like “1E”.

Bus Traffic Monitor 115
SMBusThis dialog, shown in Figure 114, shows a list of associations between bus addresses and SMBusdevices. Device entries shaded gray are reserved by the SMBus Specification (v. 2.0). Those devicescannot be removed, but their associated addresses can be re-associated with a different device ifnecessary. For other entries, each address may only be associated with one device.
Figure 114. SMBus Pane

116 Bus Traffic Monitor
Each entry in the device list box contains the device name, bus address value, and the decoding file. Thedevice name is the name of the SMBus device that is associated with the address value and will bedisplayed in the Address column of the trace listing. The bus address value specifies the slave addressthat is being associated. This 7-bit address is displayed in hex according to the current FE or EF displaymode. The last piece of information is the path to the file containing the protocol decoding information forthe device. Decoding files for devices that are not built-in are provided in the “Decoder” subfolder of theinstallation folder.
The four buttons at the bottom of the window allow the user to manipulate the association list. Using theAdd button, a new device can be associated with an address. The Edit button enables alteration of anexisting selected association. The Remove and Remove All buttons enable deletion of the selectedassociation or the entire list of associations.
When using the Add or Edit buttons, the SMBus Decoder File dialog is displayed as shown in Figure115. Click on the Browse button to select the decoder file. Click on the Update button to have theinformation from the decoder file automatically filled into the Address and Name fields. Click on the OKbutton to finish or the Cancel button to cancel. If the address being associated is a reserved address,overriding of the reserved address must be confirmed. Other addresses already associated with a devicewill not be allowed to be re-associated until they are removed from the association list.
Figure 115. SMBus Decoder File Dialog
SMBus TimeoutThe SMBus Timeout checkbox is used to enable the detection of a timeout condition as defined by theSMBus specification. When this setting is checked, an SMBus Timeout will be reported as an error line inthe Monitor trace listing any time that the clock signal (SCL) is detected to be low for 25 milliseconds orlonger during capturing of bus traffic. If a timeout occurs while the BusPro-I is driving the bus, it willabandon all transactions and generate a STOP condition to return the bus to the idle state.

Bus Traffic Monitor 117
Monitor PreferencesPreferences relevant to the Monitor Window can be selected by opening the Preferences dialog from theTools menu. The Preferences dialog can be used to specify the monitor colors and other monitor options,as well as address format.
Monitor ColorsThis pane enables altering of the colors of the trigger and cursor backgrounds and text in the trace listing.It also enables the background color pattern (color scheme) between line groupings to be changed. Theoptions for the color scheme are no color, alternating background color per row, or alternatingbackground color per messages (default). The color for background and text assigned to the alternatingline groups can also be selected. Any changes made take effect immediately. A Use Defaults buttonrestores the original default settings.
Figure 116. Monitor Colors Pane

118 Bus Traffic Monitor
Trigger – Changes the text and background color of the Trigger trace listing
Cursor A – Changes the text and background color of the cursor marked “A” in the Timing Field
Cursor B – Changes the text and background color of the cursor marked “B” in the Timing Field
Timing View – Changes the colors of the SDA, SCL, IO1, and IO2 signals in the Timing Field
Other – Specifies one of the three coloring schemes No color: no coloring of messages Alternate color per message (default): each complete transaction is grouped together in one
color, the color alternates between adjacent messages. Alternate color per row: alternates the color between adjacent rowsAlternately, the user can select the two alternating colors for adjacent messages, both the textand background color, if a coloring scheme is selected.

Bus Traffic Monitor 119
Monitor OptionsThis pane enables the altering of preferences for the layout and style of data in the Monitor window.
Figure 117. Monitor Options Pane
Line Column – Sets the numbering of entries in the trace list to start from one at the first entry (default) orstart from zero at the trigger, with earlier transactions being negative.
Timestamp Start – Sets whether time zero starts at the first entry (default) or at the trigger, with earliertransactions being negative.
Timestamp Display – Controls how timestamps are determined for trace list entries. When set to“Absolute,” the first trace list entry is set to time zero and each entry’s timestamp represents the length oftime since the first entry. When set to “Relative to last,” each trace list entry’s timestamp represents thelength of time since the previous entry.

120 Bus Traffic Monitor
Other Options – The first preference sets whether or not a prompt to save data pops up whenever thetrace list will be cleared. The second preference allows the Timing display to be locked to the tracescreen (on the first line), rather than aligning with the selected line.
START Hold Time Checking – sets the minimum START hold time value which will be checked againstevery transaction. Errors will be flagged for the messages not meeting the specified minimum value.
FormatsThis pane enables selection of how a 7 binary bit address representation is formatted for hexadecimaldisplay (does not apply to 10-bit addresses or to non-hex representations such as symbolic). The FEformat (default) shows the hexadecimal byte value with the 7 address bits left-justified in the byte. The 7Fformat shows the 7 address bits right-justified in the byte. In addition, you can disable decoding of 10-bitaddresses in the Monitor trace listing so that all slave addresses are treated as a 7-bit address.
Figure 118. Formats Pane

Bus Traffic Monitor 121
Monitor TriggerA trigger defines a set of criteria to be compared against the transactions captured by the Monitor. Whena match occurs, a trigger transaction marker will appear on the Monitor’s trace listing and the capturingprocess stops when the triggering transaction reaches a user-specified position in the buffer. In addition,a trigger out signal can be generated through one of the I/O lines when the match occurs so that externalthird-party tools can be triggered for further data capturing and analysis.
I2C Exerciser provides an advanced trigger mechanism which enables tracking of a series of events onthe bus and triggering when a specified sequence of events happens. The operation of this multi-leveltrigger system is based on the idea of “events”, “states”, and “transitions” which eventually leads to thetriggering state. Figure 119 shows the user interface for defining and activating the Trigger feature. Thedialog can be opened by clicking on the Trigger button on the Monitor’s toolbar or by selecting theTrigger menu item from the Trace menu.
Figure 119. Trigger Tab on Monitor Tools Dialog

122 Bus Traffic Monitor
There are two special states in the Trigger definition tree. START is the default state in which the statemachine begins when I2C data collection begins. TRIGGER is the ending state, which causes thetriggering actions to occur. Between the START and TRIGGER states, there are one or moreintermediate states, which have conditional branches to check for matching events and perform actionsaccordingly. The system can transition from one state to another, eventually leading to a final TRIGGERstate when the specified sequence of events has been matched.
Trigger Components
The following sections describe the components in the Monitor’s Trigger feature.
Component Symbol Types Available inSTART States TRIGGER
Events TxType √Address √AddrType √R/W √Ack/Nak √Error √IO1 / IO2 √DataByte √Counter √
States Start N/A N/A N/ATrigger N/A N/A N/AUser Defined N/A N/A N/A
StateLogicalComponents
IF √ELSEIF √THEN √ELSE √AND √OR √
Actions Goto √Set / Increment / DecrementCounter
√ √
Pulse IO √ √ √Fill Buffer √Tag Line √
Table 4. Summary of available Trigger Components
EventsEvents are defined by a set of matching criteria for the I2C transactions being captured. When there is amatch between the user-defined event conditions and the captured transaction data, it initiates a set ofactions including transitioning to another state and/or updating global counters. These event conditionscan be AND’ed or OR’ed together in a nested manner so that more complex logical conditions can begenerated. Each address and data transaction captured by the Monitor is compared against the specified

Bus Traffic Monitor 123
event condition at the current state of the Trigger state machine. Then actions specified in the matchingIF/ELSE/THEN branch are executed.
The following items are available criteria of an event and their possible values. If any of these conditionsare not specified, they are considered as “don’t-care”. For example, if the TxType (transaction type) is notspecified and an Address value of “A2” is set as the matching condition, not only the address transactionbut also the data transaction communicating with a slave address “A2” will satisfy the condition.
TxType – The type of I2C transaction. The possible values are “Address” or “Data”.
Address – The address of I2C slave device, which the transaction is targeted to. The possible values are7- or 10-bit hexadecimal numbers.
AddrType – The address type of I2C slave device, which the transaction is targeted to. The possiblevalues are “7-bit”, “10-bit”, or “HS-mode”.
R/W – The direction of transfer. The possible values are “Read” or “Write”.
Ack/Nak – The acknowledgement status of transaction. The possible values are “ACK” or “NAK”.
Error – The occurrence of a protocol error. The possible values are “Yes” or “No”.
IO1 / IO2 – The status of General Purpose I/O lines 1 and 2 within the transaction. The possible valuesfor each line are “High”, “Low”, “Rising”, “Falling”, or “Any Transition”.
DataByte – The value in a data transaction. The possible values are one or more 8-bit hex numbers. Inaddition, the mask bits and offset values can be specified with the data bytes.
Counter – The current value of the counter. This is usually used for keeping track of the repeated numberof matching events.
StatesStates are the intermediate points between the start of the trigger matching process and the finaltriggering state. At each state, a set of event criteria are compared with incoming transactions, andaccording to the result, it sets off actions such as transitioning to another state and/or updating thecounter values. A virtually unlimited number of states can be created. The states contain thecombinations of IF/ THEN, ELSEIF/THEN, and ELSE blocks. The IF and ELSEIF blocks contain AND/ORblocks with conditional statements. The THEN and ELSE blocks contain action statements.
ActionsAt each state, a set of actions can be defined to be executed when certain event conditions have met.The actions include transitioning to another state and updating the global counters. In addition, an actioncan be defined to generate a pulse signal to one of the I/O lines, for example, to trigger external third-party tools. The following is list of available actions and their descriptions.
Goto – Generates a transition from one state to another. The possible parameters are “Trigger” or“StateN” where N is a state number.
Set / Increment / Decrement Counter – Updates the counter values by setting, incrementing, ordecrementing by the specified value.

124 Bus Traffic Monitor
Pulse IO – Generates a pulse signal to one of the I/O lines. The pulse can be either “ActiveHigh”, whichgenerates a high and then low signal, or “ActiveLow”, which generates a low and then high signal. Thewidth of the pulse is about 0.5 ms, and the typical delay between the actual trigger event on the bus andthe trigger out pulse is approximately 1.6 ms. This delay may vary from 1.5 ms to 150 ms depending onthe data traffic load.
Fill Buffer – Stop the monitor when the triggering transaction hits the 15%, 50%, or 85% mark of thetrace buffer. This is a built-in action for the TRIGGER state. If the trigger event occurs, the capturing stopsautomatically when enough post-trigger transactions have been collected to fill the buffer, such that thetrigger’s position in the buffer space reaches that which is specified by the Trigger Buffer Position settingof “Early,” “Middle,” or “Late”. Pre-trigger transactions would then constitute a portion of all transactions inthe filled buffer equal to, at most, 15%, 50%, or 85% respectively. The percentage of pre-triggertransactions is less than this amount when there are not enough transactions collected before the triggerevent occurs.
Tag Line – Tag the triggering line in the Monitor’s trace list. This is a built-in action for the TRIGGER state
CountersCounters are numerical variables that can be incremented, decremented, set, and compared to user-defined values during the course of the multi-level triggering process. This component allows users tokeep track of the repeated number of matching events.

Bus Traffic Monitor 125
Examples
The following sections present some examples to describe how the components described in theprevious sections can be integrated together to design various triggering sequences.
Scenario 1) Trigger on Single EventGoal: Trigger when Event A occurs
Figure 120. Trigger on Single Event
START:[Action] Go to State 1;
State 1:If Event A happens
[Action] Go to TRIGGER;Else
[Action] Do nothing; // stay at State 1TRIGGER:
[Action] stop the monitor when the triggering transaction hitsthe 15%, 50%, or 85% mark of the trace buffer[Action] Tag the triggering line in the Monitor’s trace list[Action] pulse an I/O line if needed

126 Bus Traffic Monitor
Scenario 2) Trigger on Repeated Single EventGoal: Trigger when Event A occurs 3 times in total
Figure 121. Trigger on Repeated Single Event
START:[Action] Set counter C1 = 3;[Action] Go to State 1;
State 1:If C1 > 1 and Event A happens
[Action] Decrement C1 by 1 and Stay at State 1Else If C1 = 1 and Event A happens
[Action] Go to TRIGGER;TRIGGER:
[Action] stop the monitor when the triggering transaction hitsthe 15%, 50%, or 85% mark of the trace buffer[Action] Tag the triggering line in the Monitor’s trace list[Action] pulse an I/O line if needed
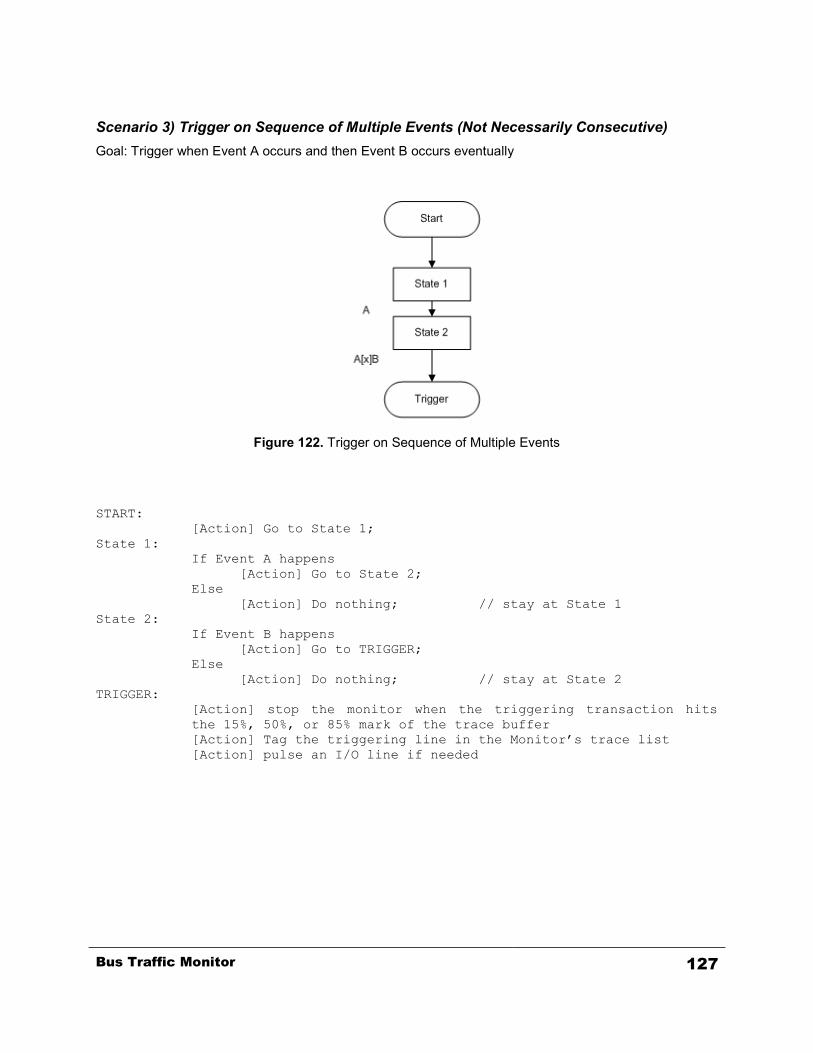
Bus Traffic Monitor 127
Scenario 3) Trigger on Sequence of Multiple Events (Not Necessarily Consecutive)Goal: Trigger when Event A occurs and then Event B occurs eventually
Figure 122. Trigger on Sequence of Multiple Events
START:[Action] Go to State 1;
State 1:If Event A happens
[Action] Go to State 2;Else
[Action] Do nothing; // stay at State 1State 2:
If Event B happens[Action] Go to TRIGGER;
Else[Action] Do nothing; // stay at State 2
TRIGGER:[Action] stop the monitor when the triggering transaction hitsthe 15%, 50%, or 85% mark of the trace buffer[Action] Tag the triggering line in the Monitor’s trace list[Action] pulse an I/O line if needed
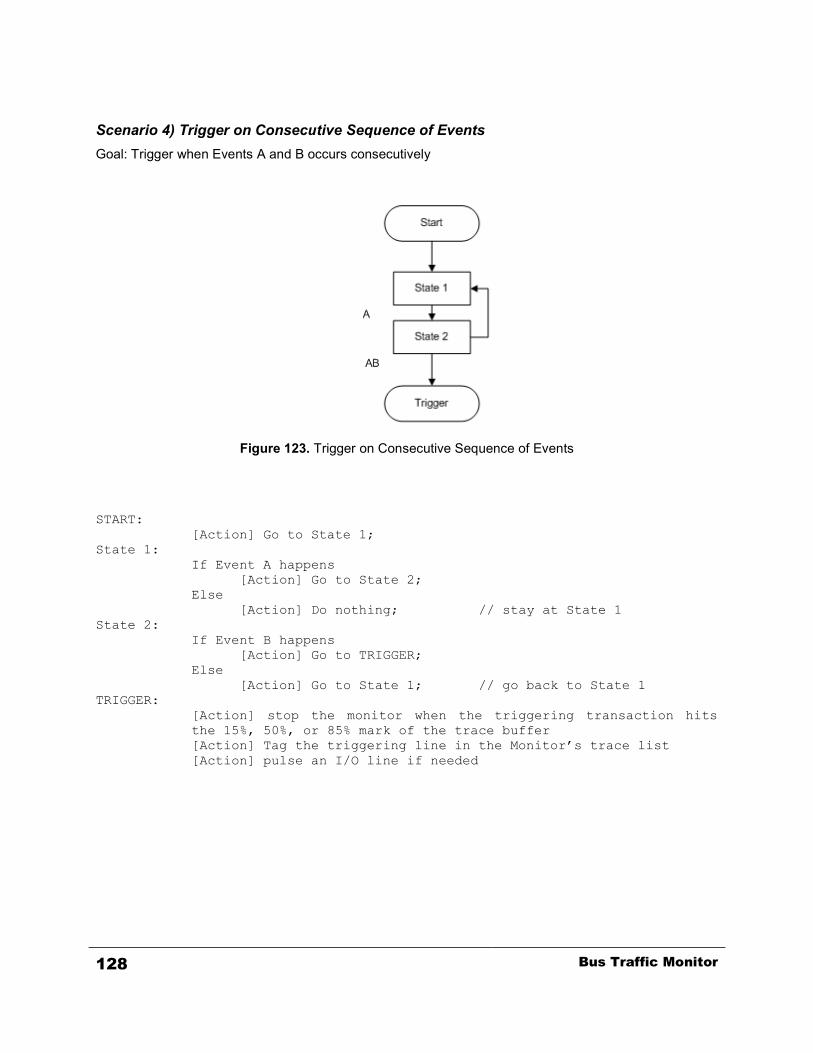
128 Bus Traffic Monitor
Scenario 4) Trigger on Consecutive Sequence of EventsGoal: Trigger when Events A and B occurs consecutively
Figure 123. Trigger on Consecutive Sequence of Events
START:[Action] Go to State 1;
State 1:If Event A happens
[Action] Go to State 2;Else
[Action] Do nothing; // stay at State 1State 2:
If Event B happens[Action] Go to TRIGGER;
Else[Action] Go to State 1; // go back to State 1
TRIGGER:[Action] stop the monitor when the triggering transaction hitsthe 15%, 50%, or 85% mark of the trace buffer[Action] Tag the triggering line in the Monitor’s trace list[Action] pulse an I/O line if needed

Bus Traffic Monitor 129
Trigger DialogThe following is list of GUI components in Trigger dialog and their descriptions.
Mode selection – Enable or disables the Trigger operation. The Trigger definition can be edited onlywhen it is disabled.
New… button – Launches the “Create New Trigger” dialog, which provides a list of Trigger templates thatcan be used as the basis for creating a new Trigger.
Open… button – Loads a previously saved Trigger definition from a file.
Save button – Saves the currently loaded Trigger definition to the same file it was loaded from.
Save As… button – Saves the currently loaded Trigger definition to a file specified by the user.
Counter Status table – shows the list of currently active counters with their values and user-enterednotes.
Figure 124. Trigger Dialog

130 Bus Traffic Monitor
Designing a TriggerThe Trigger feature is in design mode when the Disable Trigger (Design Mode) option is selected on theTrigger dialog. In this mode, if a node in the Trigger definition tree is right-clicked, a context popup menuwill appear as shown in Figure 125. This menu allows you to insert, edit, delete, cut, copy, and pastevarious nodes representing the States, ELSEIF/THEN block, ELSE blocks, AND/OR, comparison, andaction statements. The items appearing on the context popup menu depends on the nature of thecurrently selected node.
Figure 125. Context Popup Menu on Trigger Definition Tree

Bus Traffic Monitor 131
In order to provide an easy starting point for designing a new trigger definition, the Create New Triggerdialog is provided. When the New button is clicked at the Trigger dialog, the dialog will appear as shownin Figure 126. This dialog lets you browse and select from sample templates, which can be used as thebasis for creating a new trigger definition. Clicking on the items in the Templates list on the left side willchange the Description and the Sample on right accordingly. After selecting an appropriate template,you can click on the Create button to generate a new trigger definition based on the template.
Figure 126. Create New Trigger Dialog

132 Bus Traffic Monitor
Activating TriggerThe Trigger feature is activated when the Enable Trigger option is selected at the Trigger dialog, and theMonitor is running.
When I2C Exerciser is collecting bus data in Run Single mode and the Trigger is disabled, the capturingprocess will stop automatically once the buffer becomes full. No trigger operation will be performed, andno transaction marker will appear in the trace listing. If the Trigger is enabled, however, the monitor willcontinue to capture new transactions even after the buffer becomes full, until the trigger event occurs. Oldtransactions will be thrown out in order to accommodate the new ones once the buffer is full.
If the trigger event occurs, the capturing stops automatically when enough post-trigger transactions havebeen collected to fill the buffer, such that the trigger’s position in the buffer space reaches that which isspecified by the FillBuffer setting of “Early,” “Middle,” or “Late.” Pre-trigger transactions would thenconstitute a portion of all transactions in the filled buffer equal to, at most, 15%, 50%, or 85% respectively.The percentage of pre-trigger transactions is less than this amount when there are not enoughtransactions collected before the trigger event occurs. At any time, the capturing of transactions can bestopped by the user, in which case the rules for the positioning of the trigger transaction in the bufferspace do not apply.
When I2C Exerciser is collecting bus data in Run Repetitive mode, occurrence of the trigger event willnot cause the capture process to stop. The monitor will stop capturing transactions only when the userexplicitly invokes the stop command. Since the buffer space is limited, old transactions will be thrown outin order to accommodate the new ones once the buffer becomes full. In such cases, the triggertransaction may also get thrown out.
The Pulse IO action provides a link between the incoming trigger events to a trigger out signal throughone of the discrete I/O’s. When the Pulse IO action is set to one of two discrete I/O’s, the signal will pulsehigh or low according to the ActiveHigh or ActiveLow setting when the specified trigger event occurs.The width of the pulse is about 0.5 ms, and the typical delay between the actual trigger event on the busand the trigger out pulse is approximately 1.6 ms. This delay may vary from 1.5 ms to 150 ms dependingon the data traffic load.
While the Trigger is in Active mode, the current state of the trigger operation is indicated with a flashingarrow, and the counter values are updated accordingly as shown in Figure 127.

Bus Traffic Monitor 133
Figure 127. Active Trigger Operation Status

134 Bus Traffic Monitor
Monitor Window ReferenceThe Monitor window, shown in Figure 128, can be opened using the either the Monitor entry in theShortcut Bar or in the Tools menu. By default, the Monitor window is opened when the I2C Exerciserstarts. Table 5 describes the numbered areas of the I2C Exerciser Monitor window.
Figure 128. I2C Exerciser Monitor Window Layout
# Component Description
1 Menu Bar Contains the menu bar for the active Monitor window. Refer to thefollowing Menu Bar section in this chapter.
2 Tool Bar Provides quick single-click access to commonly used tools for the activeMonitor window. Refer to the Tool Bar section of this chapter.
3 Trace Listing Provides the fundamental presentation of traffic acquired from the targetI2C bus. Refer to the Trace Listing section of this chapter.
4 Timing Field Provides a graphical image of bus signal edge transitions over time. Referto the Timing Field section of this chapter.
Table 5. Monitor Window Layout
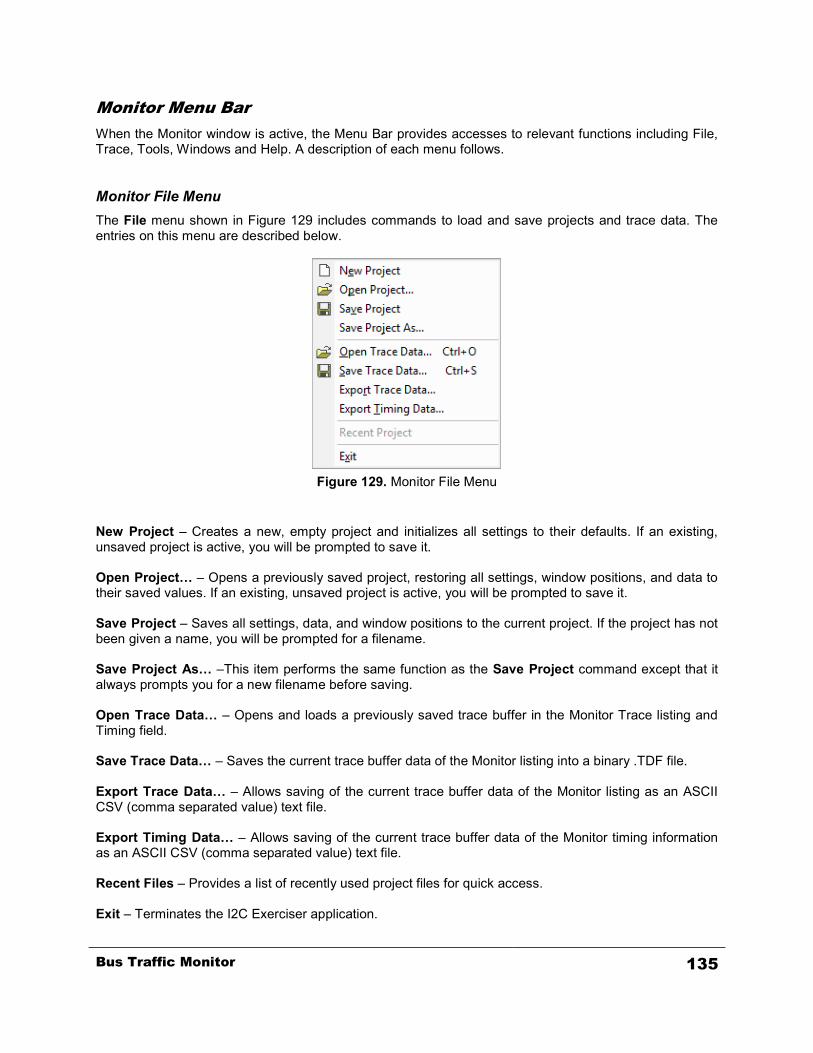
Bus Traffic Monitor 135
Monitor Menu BarWhen the Monitor window is active, the Menu Bar provides accesses to relevant functions including File,Trace, Tools, Windows and Help. A description of each menu follows.
Monitor File MenuThe File menu shown in Figure 129 includes commands to load and save projects and trace data. Theentries on this menu are described below.
Figure 129. Monitor File Menu
New Project – Creates a new, empty project and initializes all settings to their defaults. If an existing,unsaved project is active, you will be prompted to save it.
Open Project… – Opens a previously saved project, restoring all settings, window positions, and data totheir saved values. If an existing, unsaved project is active, you will be prompted to save it.
Save Project – Saves all settings, data, and window positions to the current project. If the project has notbeen given a name, you will be prompted for a filename.
Save Project As… –This item performs the same function as the Save Project command except that italways prompts you for a new filename before saving.
Open Trace Data… – Opens and loads a previously saved trace buffer in the Monitor Trace listing andTiming field.
Save Trace Data… – Saves the current trace buffer data of the Monitor listing into a binary .TDF file.
Export Trace Data… – Allows saving of the current trace buffer data of the Monitor listing as an ASCIICSV (comma separated value) text file.
Export Timing Data… – Allows saving of the current trace buffer data of the Monitor timing informationas an ASCII CSV (comma separated value) text file.
Recent Files – Provides a list of recently used project files for quick access.
Exit – Terminates the I2C Exerciser application.

136 Bus Traffic Monitor
Monitor Trace MenuThe Trace menu as shown in Figure 130 is used to access various trace buffer functions includingrun/stop control, buffer navigation, data layout and display formats, filter and trigger management setup,and clearing of trace data or line tags. These menu entries are described below.
Figure 130. Monitor Trace Menu
Run/Stop – This selection will cause the trace buffer run/stop control submenu to appear as shown inFigure 131.
Go To – This selection will cause the trace buffer navigation control submenu to appear as shown inFigure 133.
View – This selection will cause the data view mode control submenu to appear as shown in Figure 134.
Clear Trace Data – Deletes all of the trace buffer contents and clears the trace list and timing display. Ifthe current data has not yet been saved, you will be prompted to save it. This prompt can be disabledfrom the Tools | Preferences | Monitor Options window.
Clear All Tags – Removes the “tagged” status for all lines in the trace buffer.
Hide/Show Monitor Timing – Toggles the visibility status of the timing display. If you are not interestedin viewing the timing data, hiding it provides more room in the Monitor window to display additional tracelist data.
I/O 1 – Toggles the visibility status of the I/O 1 waveform on timing display.
I/O 2 – Toggles the visibility status of the I/O 2 waveform on timing display.
Filters… – Provides direct access to the Filters tab of the Configuration Manager allowing the user toview, add, edit, or remove filters. Filter rules qualify data transactions for inclusion or exclusion from thetrace listing. The Filter function is described earlier in this chapter.

Bus Traffic Monitor 137
Trigger… – Provides access to the Trigger dialog allowing the user to view or edit the trigger condition.The trigger defines conditions to mark a special transaction event in the trace buffer. The Trigger functionis described earlier in this chapter.
Symbols… – Provides access to the Symbols tab of the Configuration Manager allowing the viewing,adding, editing, or removing of the symbol definitions used for trace list address and data substitution.The Symbols function will be described in more detail later in this chapter.
Find… – Launches the Find dialog in either the regular (“More”) or compact (“Less”) mode depending onthe last used size as shown in Figure 135 and Figure 136. This dialog allows the user to search throughthe trace listing for transactions matching the specified pattern.
Trace Layout… – Launches the Trace Layout dialog as in Figure 137 which allows customization of thetrace listing columns.
Trace | Run/Stop SubmenuThe Trace | Run/Stop submenu shown in Figure 131 provides run control of the Monitor window tracebuffer.
Figure 131. Trace | Execute Submenu
Run Single – Begins bus traffic acquisition until the number of acquired transactions equals theconfigured trace buffer depth. The Run Status tab shown in Figure 132 will be displayed showing theprogression of this activity until it completes either by the trace buffer becoming full or by the usermanually stopping acquisition. The trace listing will scroll and update as new traffic is detected on the I2Ctest bus. If a Trigger is enabled, the Monitor will keep acquiring transactions, even if the buffer becomesfull, until it detects the triggering event. When the event is detected, additional transactions will beacquired until either the specified trigger position (early, middle, or late) is reached or the user stops itmanually. Some Monitor window commands are disabled while bus traffic is being accumulated.
Run Repetitive – Begins bus traffic acquisition which will continue forever until the user stops theprocess. A Run Repetitive Status dialog similar to the Run Status tab in Figure 132 with identicalfunctionality (as noted above for Run Single) will appear to show progress. If the buffer becomes full, thebuffer will wrap and new entries will overwrite the oldest entries. When collecting transactions in thismode, having an active Trigger does not change the behavior. Some Monitor window commands aredisabled while bus traffic is being accumulated.
Pause – This command pauses bus traffic acquisition and enables all Monitor window commands.Subsequent Run Single or Run Repetitive command will continue to append newly acquired bus trafficto the existing trace data list.
Stop – This command immediately stops bus traffic acquisition and enables all Monitor windowcommands.

138 Bus Traffic Monitor
Run Status TabWhen the Monitor window is started via the Run or Run Repetitive command, the Run Status tab willappear to provide status about events and progress. If a Trigger is active, it will notify you when thetrigger condition has been met. It also provides information about when the trace buffer becomes full orwraps in addition to displaying how many transactions have been collected so far. The Run Status willremain open while trace buffer collection is active and can only be closed when data collection iscomplete. If you are not interested in the contents of this window, it can either be repositioned out of theway or minimized. The next time data collection begins, the window will remember its last position.
Figure 132. Run Status Tab on Monitor Tools Window

Bus Traffic Monitor 139
Trace | Go To SubmenuThe Trace | Go To submenu shown in Figure 133 provides navigation control for the Monitor windowtrace buffer.
Figure 133. Trace | Go To Submenu
Trigger – Causes the quick positioning of visible trace lines to bring the Trigger into view at the top of thescreen.
Tagged Row – Causes the quick positioning of visible trace lines to bring the next tagged line into view atthe top of the screen.
Start – Causes the quick positioning of visible trace lines to bring the first trace buffer line into view at thetop of the screen.
End – Causes the quick positioning of visible trace lines to bring the last trace buffer line into view at thebottom of the screen.
Cursor A – Causes the quick positioning of visible trace lines to bring the Cursor A line into view at thetop of the screen.
Cursor B – Causes the quick positioning of visible trace lines to bring the Cursor B line into view at thetop of the screen.

140 Bus Traffic Monitor
Trace | View SubmenuThe Trace | View submenu shown in Figure 134 provides data view mode control for the Monitor windowData Byte column.
Figure 134. Trace | View Submenu
Normal Mode – Causes the Data Byte column display to switch to the default Normal mode. When usingNormal mode, the Data Byte column simply indicates the raw data byte values conveyed to or from atarget slave device during a transaction, one byte per trace listing line.
Compact Mode – Causes the Data Byte column display to switch to Compact mode. When usingCompact mode, all data byte transactions following an address transaction will be displayed on a singletrace listing line.
SMBus Mode – Causes the Data Byte column display to switch to SMBus mode. When using SMBusmode, each data byte value of the transaction is decoded into a text SMBus message if the value isassociated in an SMBus decoding file (refer to the SMBus section of this chapter).

Bus Traffic Monitor 141
Find FunctionYou can use the Find function to search for entries in the trace buffer matching user specified criteria.Figure 135 and Figure 136 show the regular and compact version of the Find dialog box. The regular (full-size) dialog allows the user to configure the various transaction search conditions, including don’t-careentries. If the user plans to search for the same set of conditions frequently, clicking on the Less buttonwill cause the dialog to shrink to its compact size. This allows the user to repeatedly search for the currenttransaction criteria while reducing screen clutter.
The “Load From Selected Monitor Trace Line” button facilitates quick parameter entry by reading thespecifications from the currently selected trace line. The Find operation can either hop to the next foundline or tag all buffer lines meeting the setup conditions.
Figure 135. Monitor Find Dialog – Regular
Figure 136. Monitor Find Dialog – Compact

142 Bus Traffic Monitor
Each of the Find window search criteria fields is described below.
Type – Indicates that either an address or data transaction is being searched for. Select Any to specify“don’t-care.”
Addr (Hex) – Specifies the address of interest. Select Any to specify “don’t-care”. If a 7-bit address isbeing entered, the hex address value should be entered properly according to the current “FE mode” or“7F mode” setting.
Addr Type – Indicates that either a 7-bit, 10-bit, or Hs-mode address type transaction is being searchedfor. Select Any to specify “don’t-care.” Note that if there is an address in the Addr field, this field may notbe Any.
R/W – Indicates that either a read or write transaction is being searched for. Select Any to specify“don’t-care.”
NAK – Indicates that a transaction with either an acknowledge (ACK) or not-acknowledge (NAK) is beingsearched for. Select Any to specify “don’t-care.”
Error – Indicates that a transaction with a protocol error or no protocol error is being searched for. SelectAny to specify “don’t-care.”
I/O 1 – Indicates that discrete I/O line 1 should have a specific value of 0, 1, falling, rising, toggling, or anytransition during a transaction. Select Any to specify “don’t-care.”
I/O 2 – Indicates that discrete I/O line 2 should have a specific value of 0, 1, falling, rising, toggling, or anytransition during a transaction. Select Any to specify “don’t-care.”
Value – Specifies the data byte value of interest. Select Any to specify “don’t-care.”
Mask – Specifies a data byte mask which is applied to all data bytes before comparing them to theconfigured data value of interest. This allows the user to isolate individual bits of interest. Select FF toalways compare all eight bits of each data value.
Byte Position – Allows the user to select a specific data byte position within each message to do thedata value comparison on. Select Any to specify “don’t-care.”
Width – Specifies the number of data bytes contained in the search pattern. The default value is onebyte.

Bus Traffic Monitor 143
Trace LayoutThe Trace Layout dialog shown in Figure 137 controls which columns will be displayed in the trace listing.The dialog also allows you to restore the factory defaults for column widths, visibility, and order.
Figure 137. Trace Layout Dialog

144 Bus Traffic Monitor
Monitor Tools MenuThe Tools menu shown in Figure 138 provides a path to the major application function windows.
Figure 138. Tools Menu
Monitor – Launches the Monitor window which provides acquisition and viewing of bus traffictransactions.
Debugger – Launches the Debugger window which provides interactive sending and receiving ofmessages to and from the bus.
Programmer – Launches the Programmer window which allows EEPROM memory programming andviewing of supported devices using the I2C bus.Demo Mode – Switches between Demo Mode and Live Data Mode. A check mark is placed to the left ofthis menu item to indicate that the I2C Exerciser application is in the demo mode.
Self-Test – Launches a test sequence to validate the basic proper operation of the BusPro-I hardware.
Calibration – Launches an automated tool that calibrates the BusPro-I electrical outputs in order toimprove analyzer supplied voltage source settings.
Configuration Manager – Invokes the Configuration Manager window which allows the user to configurenumerous system-wide settings including filters, symbols, SMBus, hardware options, and project files.
Preferences – Invokes the Preferences dialog which allows the user to alter configurable settings of eachindividual tool window.

Bus Traffic Monitor 145
Monitor Window MenuThe Window menu shown in Figure 139 manages the windows of I2C Exerciser.
Figure 139. Monitor Window Menu
Arrange Icons – Arranges all minimized windows in order at the bottom of the main window.
Shortcut Bar – Enables whether or not the Shortcut Bar is displayed. By default, the Shortcut Bar dockson the left side of the application window.
Close All Windows – Provides a fast way to close all application windows.
The lower portion of this menu will contain a numbered list of the currently open windows. You canquickly activate any window by clicking on its number.
Monitor Help MenuThe Help menu shown in Figure 140 accesses the on-line help features.
Figure 140. Monitor Help Menu
Help Topics – Invokes the I2C Exerciser online help system and displays a list of available help topics.Technical Support / Corelis Forum / Corelis on the Web – Opens support, forum, and Corelis Webpage using the default Web browser.
Check for Updates… – Checks for availability of the latest version of I2C Exerciser over the internet.
About I2C Exerciser… – Provides the program version number and copyright information.

146 Bus Traffic Monitor
Monitor Tool BarThe Monitor Tool Bar shown in Figure 141 provides quick single-click access to commonly usedcommands in the Monitor window. Simply click on the tool bar button to perform the desired command.Table 6 describes the tool bar functions. Positioning the mouse cursor over each tool bar button will alsodisplay a pop-up “tooltip” providing a short description of the command.
Figure 141. Monitor Tool Bar
Icon Name Function Description
Open Trace Data Opens and loads a previously saved trace buffer in the Monitor Tracelisting and Timing display.
Save Trace Data Saves the current trace buffer data of the Monitor listing into a binary.TDF file.
Run Single Begins bus traffic acquisition until the number of acquired transactionsequals the configured trace buffer depth. (See the Trace | Executesubmenu Run Single entry described earlier.)
Run Repetitive Begins bus traffic acquisition which will continue forever until the userstops the process. (See the Trace | Execute submenu RunRepetitive entry described earlier.)
Pause Pauses bus traffic acquisition and enables all Monitor windowcommands.
Stop Immediately stops bus traffic acquisition and enables all Monitorwindow commands.
Go to Trigger Causes the quick positioning of visible trace lines to bring the Triggerinto view at the top of the screen.
Go to Tagged Row Causes the quick positioning of visible trace lines to bring the nexttagged line into view at the top of the screen.
Go to Start Causes the quick positioning of visible trace lines to bring the firsttrace buffer line into view at the top of the screen.
Go to End Causes the quick positioning of visible trace lines to bring the lasttrace buffer line into view at the bottom of the screen.
Go to Cursor A Causes the quick positioning of visible trace lines to bring the Cursor Aline into view at the top of the screen.
Go to Cursor B Causes the quick positioning of visible trace lines to bring the Cursor Bline into view at the top of the screen.
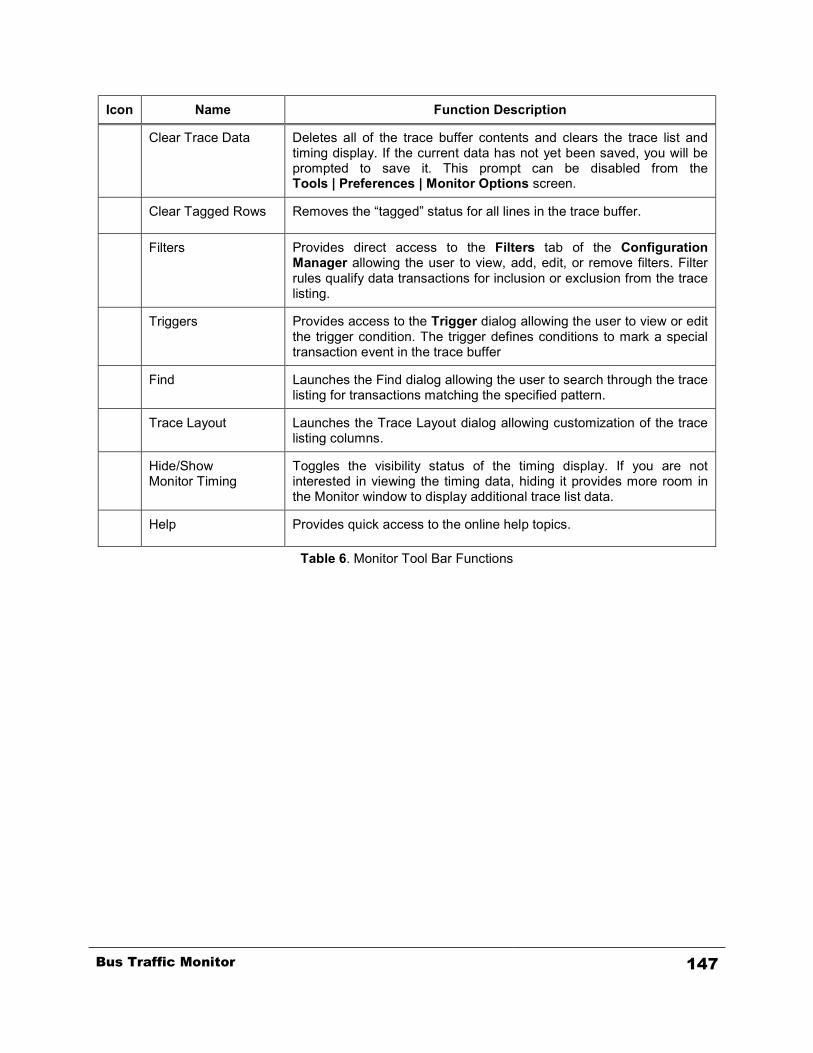
Bus Traffic Monitor 147
Icon Name Function Description
Clear Trace Data Deletes all of the trace buffer contents and clears the trace list andtiming display. If the current data has not yet been saved, you will beprompted to save it. This prompt can be disabled from theTools | Preferences | Monitor Options screen.
Clear Tagged Rows Removes the “tagged” status for all lines in the trace buffer.
Filters Provides direct access to the Filters tab of the ConfigurationManager allowing the user to view, add, edit, or remove filters. Filterrules qualify data transactions for inclusion or exclusion from the tracelisting.
Triggers Provides access to the Trigger dialog allowing the user to view or editthe trigger condition. The trigger defines conditions to mark a specialtransaction event in the trace buffer
Find Launches the Find dialog allowing the user to search through the tracelisting for transactions matching the specified pattern.
Trace Layout Launches the Trace Layout dialog allowing customization of the tracelisting columns.
Hide/ShowMonitor Timing
Toggles the visibility status of the timing display. If you are notinterested in viewing the timing data, hiding it provides more room inthe Monitor window to display additional trace list data.
Help Provides quick access to the online help topics.
Table 6. Monitor Tool Bar Functions

148 Bus Traffic Monitor

Interactive Debugger 149
Chapter 6Interactive Debugger
Debugger window overview and component descriptions
The Debugger window provides a direct read/write interactive interface with the target I2C bus. Unlike theMonitor window where the BusPro-I is passively monitoring the bus, the Debugger can be used toperform simple message transfers both to and from slave devices. During this process, the BusPro-Ianalyzer essentially acts as a master on the bus.
The Debugger main screen is shown in Figure 142. Typical applications include:
Generating I2C bus traffic and confirming basic bus operation and integrity Establishing the presence and behavior of slave devices Poking data to (or initializing) slave devices Peeking the contents of slave devices Interactively checking I2C devices under various signal and timing conditions and assessing bus
conformance while observing signals with external instrumentation
Figure 142. Debugger Window

150 Interactive Debugger
Send DataThe left side of the Debugger window contains controls for generating messages that write data to slavedevices on the target I2C bus. These controls are shown in Figure 143.
Figure 143. Debugger Send Controls
Addr – This field specifies the I2C bus address of the target slave that is being written to. An address canbe entered as a hexadecimal value or an address symbol may be used if one has been defined for thetarget slave (refer to the Symbols section of the Configuration Manager description in the Configurationand Preferences chapter). Additionally, the field’s dropdown list provides a selection of recently usedaddress values and all of the currently defined address symbols.
Note that 7-bit I2C addresses are represented as 8-bit hexadecimal values and their format is dependanton the current address mode setting (FE mode or 7F mode). Please refer to the Formats section of thePreferences Dialog description in the Configuration and Preferences chapter for more information.
AddrType – This field specifies the bit length of the target slave address. The dropdown list allowsselection of either 7-Bit or 10-Bit.
Run – This field specifies the number of consecutive times that the Debugger repeats its Send operation.A decimal value can be entered here as well as the text, “single”, to run just once or, “continuous”,to run in a continuous loop until stopped. Additionally, the field’s dropdown list provides a selection ofrecently used values.

Interactive Debugger 151
No Stop – This check box specifies whether a STOP condition is generated at the end of a message.When unchecked (default), the STOP condition is included after all of a message’s data bytes have beenwritten. Checking this box causes the STOP condition to be omitted. Under the I2C bus protocol, absenceof the STOP condition means that a master is not yet done transmitting. The previous data transfer canthen be followed by a repeated START condition and another data transfer. This can be used to supportsome slave devices which require that the first data transfer specify the value of an offset register (or acommand) and then the following data is written to (or read from) the device at that offset location.
Send text box – The large text area constituting the bottom portion of the Debugger’s Send controls isused to specify the data bytes that are written to a target slave device. These data bytes are entered assequences of two-digit hexadecimal values. Debugger script commands can also be entered here inorder to execute more complex Send operations or to perform Error Injection. These script commands areexplained later in this chapter.
Send button – Clicking on this button begins the operation of writing to a target slave device. During theSend operation, this button becomes a Stop button that allows the operation to be cancelled. Dependingon the user preference that has been set, the Debugger may abort its Send operation if a message is notacknowledged (NAK’d) by the specified target slave device (by default, the Debugger continues to senddata even when NAK’d). Additionally, all data bytes that are successfully transmitted using the Debuggerare listed in the text box on the Receive side of the Debugger window by default. Refer to the DebuggerOptions section of this chapter for more information on user preferences.
Status Box – This indicator is located just below the Send button and displays the resulting status of thelast Send operation. The following can be indicated:
Indicates that the Send operation completed successfully with the propernumber of data bytes written to the target slave.
Indicates that an I2C bus protocol violation was detected during the Sendoperation. Using the I2C Exerciser’s Monitor window to capture the Debugger’sbus transactions can help to acquire more details about the cause of the error.
Indicates that the Send operation was not completed. When a timeout occurs, amessage box is displayed to suggest possible reasons for the timeout.

152 Interactive Debugger
Receive DataThe right side of the Debugger window contains controls for generating messages that read data fromslave devices on the target I2C bus. These controls are shown in Figure 144.
Figure 144. Debugger Receive Controls
Addr – This field specifies the I2C bus address of the target slave that is being read from. An address canbe entered as a hexadecimal value or an address symbol may be used if one has been defined for thetarget slave (refer to the Symbols section the Configuration Manager description in the Configuration andPreferences chapter). Additionally, the field’s dropdown list provides a selection of recently used addressvalues and all of the currently defined address symbols.
Note that 7-bit I2C addresses are represented as 8-bit hexadecimal values and their format is dependanton the current address mode setting (FE mode or 7F mode). Please refer to the Formats section of thePreferences Dialog description in the Configuration and Preferences chapter for more information.
AddrType – This field specifies the bit length of the target slave address. The dropdown list allowsselection of either 7-Bit or 10-Bit.
Bytes – This field specifies the number of bytes that the Debugger reads from the target slave during itsReceive operation. A decimal value can be entered here and the field’s dropdown list provides a selectionof recently used values.
No Stop – This check box specifies whether a STOP condition is generated at the end of a message.When unchecked (default), the STOP condition is included after all of a message’s data bytes have been

Interactive Debugger 153
read. Checking this box causes the STOP condition to be omitted. Under the I2C bus protocol, absence ofthe STOP condition means that a master is not yet done transmitting. The previous data transfer can thenbe followed by a repeated START condition and another data transfer. This can be used to support someslave devices which require that the first data transfer specify the value of an offset register (or acommand) and then the following data is read from (or written to) the device at that offset location.
Receive text box – The large text area constituting the bottom portion of the Debugger’s Receivecontrols displays the data bytes that are successfully read from the I2C bus. By default all data bytes thatare successfully transmitted using the Debugger are automatically listed here, however the user can electto not echo the sent data. Refer to the Debugger Options section of this chapter for more information onuser preferences.
Receive button – Clicking on this button begins the operation of reading from a target slave device.Depending on the user preference that has been set, the Debugger may abort its Receive operation if amessage is not acknowledged (NAK’d) by the specified target slave device (by default, the Debuggercontinues to receive data even when NAK’d). Refer to the Debugger Options section of the PreferencesDialog description in the Configuration and Preferences chapter for more information on userpreferences.
Status Box – This indicator is located just below the Receive button and displays the resulting status ofthe last Receive operation. The following can be indicated:
Indicates that the Receive operation completed successfully with the propernumber of data bytes read from the target slave.
Indicates that an I2C bus protocol violation was detected during the Receiveoperation. Using the I2C Exerciser’s Monitor window to capture the Debugger’sbus transactions can help to acquire more details about the cause of the error.
Indicates that the Receive operation was not completed. When a timeoutoccurs, a message box is displayed to suggest possible reasons for the timeout.

154 Interactive Debugger
Debugger ScriptThe large text area constituting the bottom portion of the Debugger’s Send controls is used to specify thebyte values that are written to target slave devices. This text field also supports the use of specialcommands that can override the settings of the other Send controls as well as insert pauses in themessage transmission sequence, manipulate the BusPro-I analyzer’s two discrete I/O lines, or activateError Injection.
Using script commands provides the ability to write a series of data bytes while progressing automaticallythrough a sequence of various slave addresses. In this manner, for example, a complete targetinitialization could be performed. The ability to control the discrete I/O lines allows a connected target tobe stimulated during this process. Additionally, Debugger scripts can be saved to or loaded from .DCFtext files (using the Debugger’s File Menu or Tool Bar described later in this chapter) for convenientreusability. This scripting offers significant message transfer automation facility that can be combined withthe capture capability of the Monitor window for immediate analysis of the target I2C bus.
The left side of the Debugger Script text area contains a gutter that is used to mark errors when a syntaxerror occurs and can optionally display line numbers. Syntax highlighting is also provided to help identifydebugger script keywords.
Debugger Script Command KeywordsThe Debugger script keywords are listed in Table 7 on the next page. Debugger commands are not case-sensitive and are always immediately followed by their parameters. While multiple data bytes can belisted together on a single line, each command (along with its associated parameters) must be placed onits own separate line—although a trailing comment is allowed on the same line. An example debuggerscript follows the table of keywords. Command keywords will be highlighted blue when entered in theDebugger script text area.
In addition to these keywords and the hex values, the user may also enter symbols that are defined in theSymbols tab in the Configuration Manager. These symbols can be used anywhere a hex value isexpected. However, an address symbols can only be used where an address is expected and a datasymbol can only appear in the byte position defined. Refer to the Symbols section of the ConfigurationManager description in the Configuration and Preferences chapter to learn more about how to definesymbols.

Interactive Debugger 155
Keyword Example Description
ADDRESS ADDRESS 3A Indicates that the send address should change to the 7-bitaddress specified by the following hex value parameter. Thiscommand modifies the value of the Send-side Addr combobox.Note that 7-bit I2C addresses are represented as 8-bithexadecimal values and their format is dependant on thecurrent address mode setting (FE mode or 7F mode). Pleaserefer to the Formats section of the Preferences Dialogdescription in the Configuration and Preferences chapter formore information.
ADDRESS10 ADDRESS10 2A5 Same as above but for 10 bit addresses (which supportvalues up to 3FF). Here, the address format mode does notapply.
ADDRONLY ADDRONLY Sends the address byte only.
// <comment> // your comment Comments begin with the characters “//” and continue for theremainder of a line.
<hex bytes> 3F 54 7A 8B 22 Ordered set of hexadecimal byte values to send to the targetslave using the address specified in the Send-side Addrcombo box. These values may be separated by more thanone white-space or by new lines.
NOSTOP 3B 31NOSTOP55 E6
Causes the last byte prior to the command to be designatedas the end of a message and disables the Stop cycle at itsconclusion (regardless of the No Stop checkbox setting). Anyimmediately following bytes start a new message (ie. a newaddress cycle).
PAUSE PAUSE 350 Indicates that a delay for the specified number of decimalmilliseconds should be inserted. Any data byte values thatfollow this command are sent beginning with a new addresscycle.
PECON PECON Turns on the SMBus PEC (Packet Error Checking) bytegeneration option. The PEC is a CRC-8 error-checking byte,calculated on all the message bytes (including addresses andread/write bits). The PEC is appended to the message as thelast data byte.
PECOFF PECOFF Turns off the SMBus PEC (Packet Error Checking) bytegeneration option.
SETDISCRETE SETDISCRETE 1 0 Modifies the state of one of the discrete I/O signals. Theparticular discrete I/O signal (1 or 2) is specified by the firstparameter and the level to which it is set (1 for high or 0 forlow) is specified by the second parameter. It remains at thisstate until another similar command is encountered.
STOP 3B 31 // LastSTOP // Stop55 E6 // Start
Causes the last byte prior to the command to be designatedas the end of a message and forces the Stop cycle toconclude it (regardless of the No Stop checkbox setting). Anyimmediately following bytes start a new message.
Table 7. Debugger Script Keywords

156 Interactive Debugger
Example Debugger Script Command Text FileBelow is an example debugger script that might be used to load an EEPROM with some values in part ofits first page of memory and wiggle one of the discrete I/O signals while processing.
// ADDRESS_MODE: FE
// fill 24AA16 eeprom// page 0
address A0 // page 000 // address ptr// data bytes00 01 02 03 04 05 06 0708 09 0A 0B 0C 0D 0E 0F
// wait for write to complete// ...spec = 5 msec. min.PAUSE 30 //ms
address A0 // new wrt10 // address ptr// data bytes10 11 12 13 14 15 16 1718 19 1A 1B 1C 1D 1E 1F
PAUSE 30 //msSETDISCRETE 1 0 // lower I/O 1
address A0 // new wrt20 // address ptr// data bytes20 21 22 23 24 25 26 2728 29 2A 2B 2C 2D 2E 2F
PAUSE 30 //ms
address A0 // new wrt30 // address ptr// data bytes30 31 32 33 34 35 36 3738 39 3A 3B 3C 3D 3E 3F
PAUSE 30 //msSETDISCRETE 1 1 // raise I/O 1
address A0 // new wrt40 // address ptr// data bytes40 41 42 43 44 45 46 4748 49 4A 4B 4C 4D 4E 4F

Interactive Debugger 157
Debugger OptionsThe preferences relevant to the Debugger window can be specified by accessing the Debugger Optionspane of the Preferences dialog. Open the Preferences dialog by pressing F7 or by selectingPreferences from the Tool menu. When the Preferences dialog appears, choose the Debugger Optionstab, as shown in Figure 145. The four options are described below:
Figure 145. Debugger Options Pane
Track Transactions – If selected, data sent by the BusPro-I is tracked by the Monitor and the transactiontimes out if matching data does not appear on the bus within 2 seconds. Tracking the sent byte willensure the sent bytes are generated on the bus correctly. However, this will generate more than 1 ms gapbetween the transactions. In order to eliminate the gap, you must disable this option. The Echo SentData and Abort Message if Address is NAK’d options can be enabled only when this option is on.

158 Interactive Debugger
Echo Sent Data – If selected, data sent by the BusPro-I is echoed in the Receive-side text box along withall other incoming traffic during the send operation. This option is available only when the TrackTransaction option is enabled.
Abort Message if Address is NAK’d – If selected, the debugger aborts sending the message data bytesif the address is NAKed. This option is available only when the Track Transaction option is enabled.
Show Send Command Line Number – If selected, the debugger script text box will display line numbersin the gutter.
Enable Restricted Address Checking – If selected, sending to and receiving from a slave with I2Crestricted address will be flagged as errors.

Interactive Debugger 159
Debugger Window ReferenceThe Debugger window, shown in Figure 146, can be opened using the either the Debugger entry in theShortcut Bar or in the Tools menu. Table 8 describes the numbered areas of the I2C Exerciser Debuggerwindow.
Figure 146. I2C Exerciser Debugger Window Layout
# Component Description
1 Menu Bar Contains the menu bar for the active Debugger window. Refer to thefollowing Menu Bar section in this chapter.
2 Tool Bar Provides quick single-click access to commonly used tools for the activeDebugger window. Refer to the Tool Bar section of this chapter.
3 Send Section Provides controls for writing to a slave device address on the target bus.Refer to the Debugger Send Controls section of this chapter.
4 Receive Section Provides controls for reading from a slave device address on the targetbus. Refer to the Debugger Receive Controls section of this chapter.
Table 8. Debugger Window Layout

160 Interactive Debugger
Debugger Menu BarWhen the Debugger window is active, the Menu Bar contains entries relevant to the Debugger functionsincluding File, Tools, Windows and Help. A description of each menu follows.
Debugger File MenuThe File menu shown in Figure 147 includes options to load and save projects and debugger commandfiles as well as an option to save debugger data from the Debugger window’s Receive section. Theoptions related to the loading and saving of projects are identical to those described in the Monitor MenuBar section of the Bus Traffic Monitor chapter.
Figure 147. Debugger File Menu
New Debugger Command File… – Clears the Debugger window’s Send text box in preparation forentering new debugger commands and data. If the text box contains existing unsaved commandsand data, a prompt is displayed to save it.
Open Debugger Command File… – Opens a previously saved command file and restores the saveddebugger commands and data to the Debugger window’s Send text box. If the text box containsexisting unsaved commands and data, a prompt is displayed to save it.
Save Debugger Command File… – Saves the debugger commands and data from the Debuggerwindow’s Send text box to a .DCF text file. If not already working with an opened command file, aprompt is displayed to save it.
Save Debugger Command File As… – Same as Save Debugger Command File above, except that italways prompts for a new filename before saving.
Save Debugger Data – Stores the data collected from the bus in the Receive text box into a .DDF textfile.
Recent Files – Provides a list of recently used project files for quick access.Exit – Terminates the I2C Exerciser application.
Debugger Tools MenuThe Tools menu provides a path to the major application function windows. This is identical to theMonitor Tools Menu described in the Bus Traffic Monitor chapter.

Interactive Debugger 161
Debugger Window MenuThe Window menu manages the various windows of I2C Exerciser and is identical to the Monitor WindowMenu described in the Bus Traffic Monitor chapter.
Debugger Help MenuThe Help menu accesses the on-line help features and is identical to the Monitor Help Menu described inthe Bus Traffic Monitor chapter.
Debugger Tool BarThe Debugger Tool Bar shown in Figure 148 provides quick single-click access to commonly usedcommands in the Debugger window. Simply click the tool bar button to perform the desired command.Table 9 describes the tool bar functions. Positioning the mouse cursor over each tool bar button alsodisplays a pop-up “tooltip” providing a short description of the command.
Figure 148. Debugger Tool Bar
Icon Name Function Description
New Command File Clears the Debugger window’s Send text box in preparation forentering new debugger commands and data. If the text box containsexisting unsaved commands and data, a prompt is displayed to save it.
Open Command File Opens a previously saved command file and restores the saveddebugger commands and data to the Debugger window’s Send textbox. If the text box contains existing unsaved commands and data, aprompt is displayed to save it.
Save Command File Saves the debugger commands and data from the Debugger window’sSend text box to a .DCF text file. If not already working with an openedcommand file, a prompt is displayed to save it.
Save Data File Stores the data collected from the bus in the Receive text box into a.DDF text file.
Help Provides quick access to the online help topics.
Table 9. Debugger Tool Bar Functions

162 Interactive Debugger

Serial EEPROM Programmer 163
Chapter 7Serial EEPROM Programmer
Programmer Window Overview and component descriptions
The Programmer Window provides an interface specifically tailored for convenient interaction withstandard I2C EEPROM devices on the target I2C bus. It enables file-linked programming and viewing ofthe content of such devices. It further supports comparing current contents against the data loaded from afile. Device content can also be viewed and saved to a file.
Standard file formats supported include;
EXO
BIN
MCS
HEX
In addition, a simple user-friendly text file format can specify the EEPROM content.
The user selects the target device type from a pull-down list of known manufacturers and types, whosestandard address and address-type (7 or 10 bit width) is preloaded. This latter information can beoverwritten by the user for non-standard systems. In addition to selecting a related data file, the user canenter an additive/subtractive adjustment to the internal device offset declared in the file.Various device interaction buttons enable the following actions:
Read – read and display the EEPROM content in a popup which supports scrolling andpage-hopping through the data. This information can be saved to a file.
Program – load the EEPROM with the contents of the referenced data file.
Verify – compare the EEPROM with the referenced file and indicate a pass/fail outcome.
Erase – clear the content of the EEPROM
During any of the above operations, if the Monitor is running, the related traffic transactions with thedevice can be viewed.
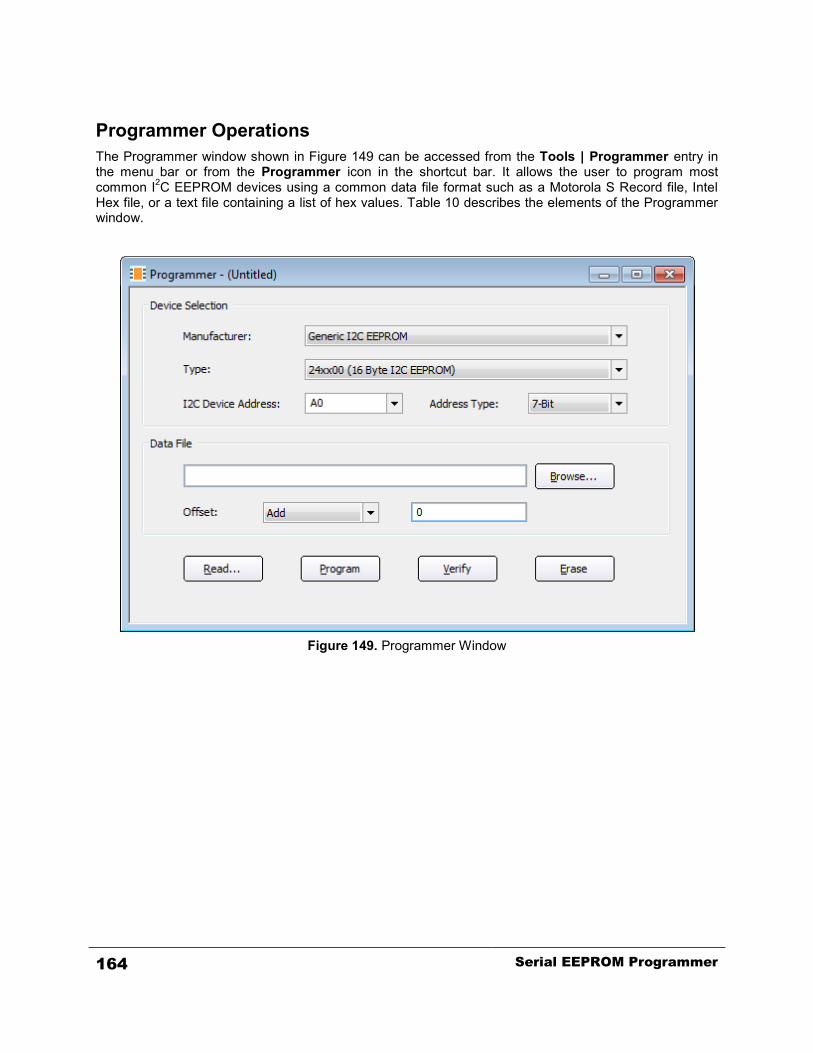
164 Serial EEPROM Programmer
Programmer OperationsThe Programmer window shown in Figure 149 can be accessed from the Tools | Programmer entry inthe menu bar or from the Programmer icon in the shortcut bar. It allows the user to program mostcommon I2C EEPROM devices using a common data file format such as a Motorola S Record file, IntelHex file, or a text file containing a list of hex values. Table 10 describes the elements of the Programmerwindow.
Figure 149. Programmer Window
Serial EEPROM Programmer 165
Component Description
Manufacturer combo box Specifies the manufacturer of the I2C EEPROM device to beprogrammed. Most devices can be programmed as a “Generic”manufacturer device if they are compatible with the ATMEL 24xxXXXseries of I2C EEPROM devices.
Type combo box Specifies the type of the EEPROM device to program. Various selectionsare available for supported devices from each of the manufactures in theManufacturer combo box. The types that are available when using the“Generic” manufacturer support all of the ATMEL 24xxXXX series of I2CEEPROM devices.
I2C Device Addresscombo box
Specifies the I2C device address of the EEPROM. Initially, this is set tothe manufacturer’s specified default address. If the device is configured touse an address other than the manufacturer default, that address can beentered into this field. The address format complies with the Preferenceoption in force. FE mode is an 8-bit format with the 7 address bits left-justified and 7F mode makes the 7 address bits right-justified. Theexample in the figure is in FE format.
Address Type combo box Specifies the size of the address (7-bit or 10-bit). At this time, the onlyEEPROM devices that the Programmer supports use 7-bit addresses, soonly 7-bit may be selected here.
Data File edit box andBrowse button
Specifies the file containing data to be programmed. Use the browsebutton to locate the data file.
Offset combo box andedit box
Specifies an offset for the programming. The drop-down combo boxallows for selection of whether to “Add” or “Subtract” the offset valuewhich is entered into the edit box on the right. The offset value must beentered in hexadecimal format.
Table 10. Programmer Function Descriptions

166 Serial EEPROM Programmer
Read ButtonThe Read button opens the Read Contents window shown in Figure 150. This allows the user to examinethe memory content of the I2C EEPROM device without dumping the entire data to a file. Thecomponents of the Read Contents window are described in Table 11.
Figure 150. Programmer Read Window
Icon Name Description
Go to Beginning Moves to the beginning of the EEPROMmemory.
Go to End Moves to the end of the EEPROMmemory.
Back Moves one page backward in theEEPROM memory.
Forward Moves one page forward in theEEPROM memory.
Go to Location Moves to the specified EEPROMmemory location. Type in the address inhexadecimal format and press the Enterkey to go to that location.
Done Closes the Read Contents window.
Table 11. Programmer Read Contents Window Function Descriptions

Serial EEPROM Programmer 167
Program ButtonThe Program button allows the user to program and verify the I2C EEPROM device. With a single clickon the button, the I2C Exerciser will program the device using the specified data file. If the Preferences isset to verify after programming (see the Programmer Options section of this chapter), the I2C Exerciserwill automatically verify that the data is written to the device by performing a read. During theprogramming operation, the progress dialog box shown in Figure 151 will pop up to show theprogramming status.
Figure 151. Programming Progress Window
Verify ButtonThe Verify button allows you to verify the content of the I2C EEPROM device against the specified datafile. During the verifying operation, the progress dialog box shown in Figure 152 will pop up to show theverification status.
Figure 152. Verifying Progress Window
Erase ButtonThe Erase button allows you to initialize the device memory contents with the value FF. During theerasing operation, the progress dialog box shown in Figure 153 will pop up to show the erasing status.
Figure 153. Erasing Progress Window
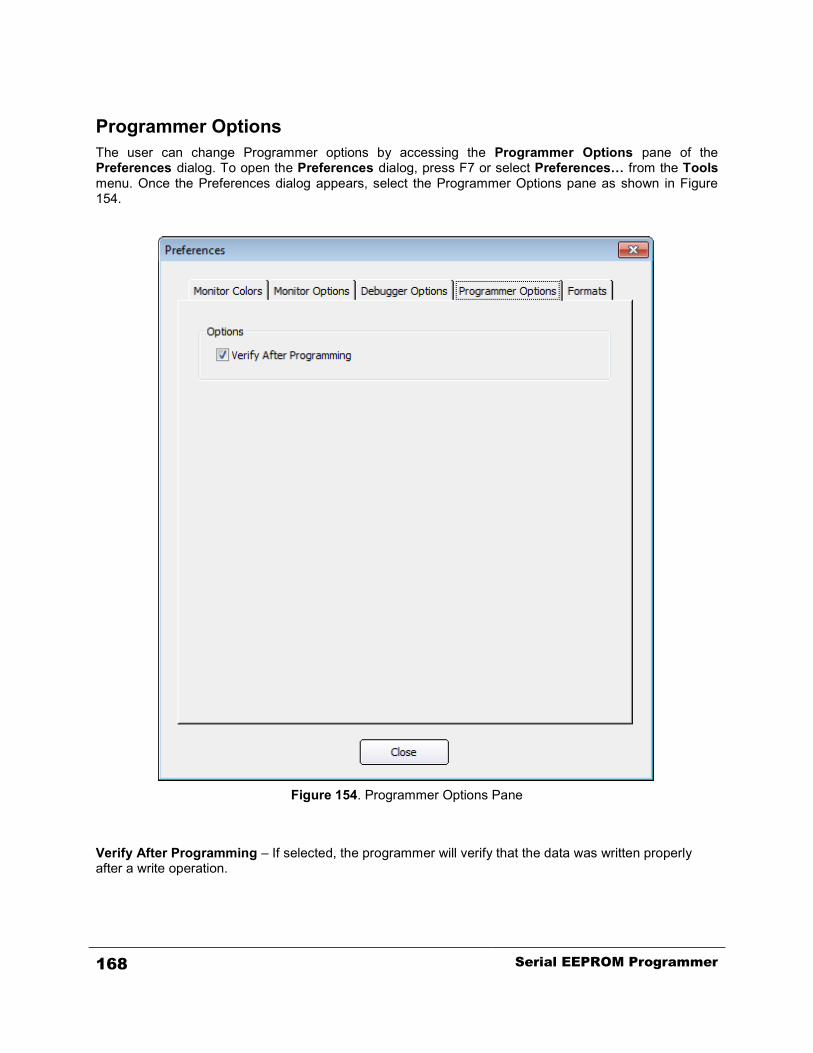
168 Serial EEPROM Programmer
Programmer OptionsThe user can change Programmer options by accessing the Programmer Options pane of thePreferences dialog. To open the Preferences dialog, press F7 or select Preferences… from the Toolsmenu. Once the Preferences dialog appears, select the Programmer Options pane as shown in Figure154.
Figure 154. Programmer Options Pane
Verify After Programming – If selected, the programmer will verify that the data was written properlyafter a write operation.

Serial EEPROM Programmer 169
Programmer Window ReferenceThe Programmer window, shown in Figure 155, can be opened using the either the Programmer entry inthe Shortcut Bar or in the Tools menu. Table 12 describes the numbered areas of the I2C ExerciserProgrammer window.
Figure 155. I2C Exerciser Programmer Window
# Component Description
1 Menu Bar Contains the menu bar for the active Programmer window.
2 Tool Bar Provides quick single-click access to commonly used commands for theactive Programmer window
3 ProgrammerWindow
The main Programmer window which allows for programming of I2CEEPROM devices on the target I2C bus.
Table 12. Programmer Window Areas

170 Serial EEPROM Programmer
Programmer Menu BarWhen the Programmer window is active, the Menu Bar contains entries relevant to the Programmerfunctions including File, Tools, Windows and Help. A description of each menu follows.
Programmer File MenuThe File menu shown in Figure 156 includes commands to load and save projects and programmerconfiguration files as well as a command to save a dump of the data from a device. The commandsrelated the loading and saving of projects are identical to those described earlier for the Monitor MenuBar.
Figure 156. Programmer File Menu
New Programmer Configuration File… – Initializes the Programmer configuration to its defaults. If theactive Programmer configuration contains unsaved settings, you will be prompted to save theconfiguration.
Open Programmer Configuration File… – Loads a previously saved configuration from file. If the activeProgrammer configuration contains unsaved settings, you will be prompted to save the configuration.
Save Programmer Configuration File… – Saves the Programmer configuration to a .PCF text file. If youare not already working with an open configuration file, you will be prompted for a filename.
Save Programmer Configuration File As… – Same as Save above, except the user is prompted for anew file name to avoid overwriting the previously loaded file.
Dump Data… – Stores the data read from a device to a file (*.EXO, *.HEX, *.BIN, *.TXT).
Recent Files – Provides a list of recently used project files for quick access.
Exit – Terminates the I2C Exerciser application.

Serial EEPROM Programmer 171
Programmer Tools MenuThe Tools menu provides a path to the major application function windows. This is identical to theMonitor Tools Menu selections in the Bus Traffic Monitor chapter.
Programmer Window MenuThe Window menu manages the various windows of I2C Exerciser and is identical to the Monitor WindowMenu in the Bus Traffic Monitor chapter.
Programmer Help MenuThe Help menu accesses the on-line help features and is identical to the Monitor Help Menu in the BusTraffic Monitor chapter.
Programmer Tool BarThe Programmer Tool Bar shown in Figure 157 provides quick single-click access to commonly usedcommands in the Programmer window. Simply click the tool bar button to perform the desired command.Table 13 describes the tool bar functions. Positioning the mouse cursor over each tool bar button will alsodisplay a pop-up “tooltip” providing a short description of the command.
Figure 157. Programmer Tool Bar
Icon Name Function Description
New ConfigurationFile
Initializes the Programmer configuration to its defaults. If the activeProgrammer configuration contains unsaved settings, you will beprompted to save the configuration.
Open ConfigurationFile
Loads a previously saved configuration from file. If the activeProgrammer configuration contains unsaved settings, you will beprompted to save the configuration.
Save ConfigurationFile
Saves the Programmer configuration to a .PCF text file. If you are notalready working with an open configuration file, you will be promptedfor a filename.
Dump Data to a File Stores data read from a device to a file (*.EXO, *.HEX, *.BIN, *.TXT).
Help Provides quick access to the online help topics.
Table 13. Programmer Tool Bar Functions

172 Serial EEPROM Programmer
Configuration and Preferences 173
Chapter 8Configuration and Preferences
Configuration Manager and Preferences dialogs overview and component descriptions
Configuration ManagerThe Configuration Manager allows the user to change the setting for the various tools provided by the I2CExerciser in one easily accessible location. The user can access certain Configurations Manager tabsdirectly from some of the tools such as the Filters and Trigger toolbar in the Monitor window. The user canalso access the most recently used Configuration Manager tab by using the Tools | ConfigurationManager menu command accessible from all windows.
The Configuration Manager is used to perform the following tasks: Configuring settings
o Setting the I2C bus electrical features such as voltage source and bus signal thresholdo Setting the bus drive and monitoring features such as clock rateo Configuring external discrete signalso Setting the amount of traffic to monitor
Associating files with the current project Setting filters Associating SMBus devices with decoding files
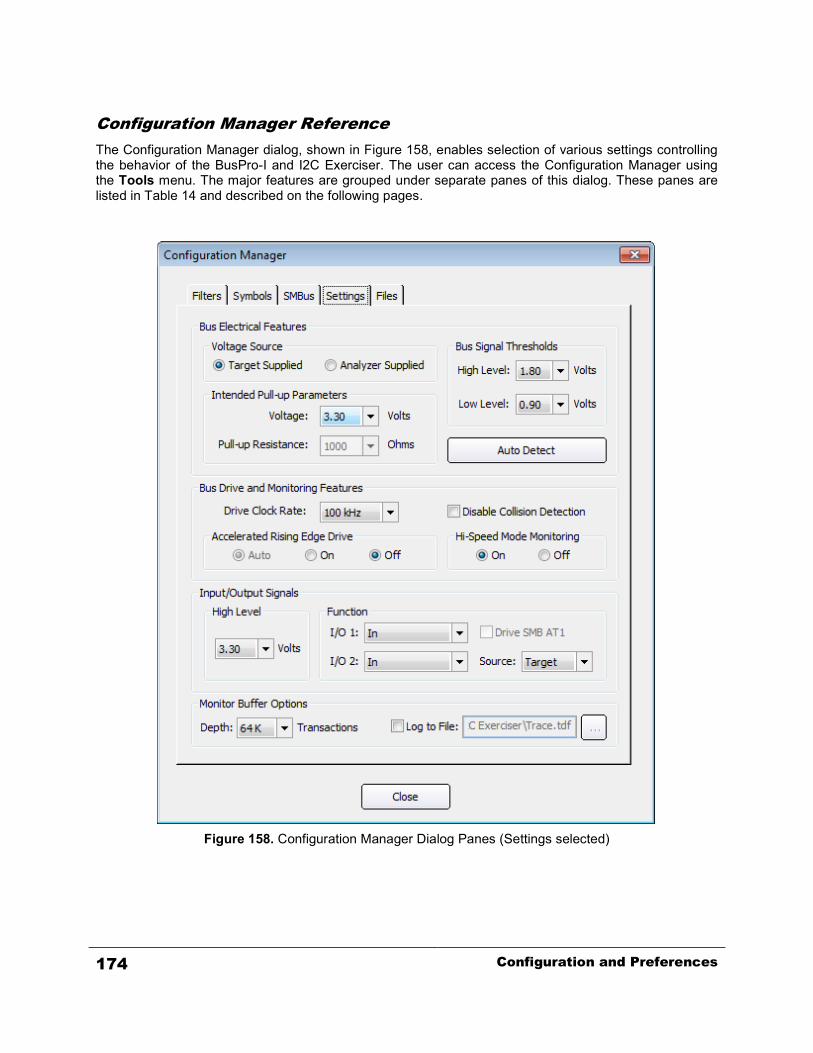
174 Configuration and Preferences
Configuration Manager ReferenceThe Configuration Manager dialog, shown in Figure 158, enables selection of various settings controllingthe behavior of the BusPro-I and I2C Exerciser. The user can access the Configuration Manager usingthe Tools menu. The major features are grouped under separate panes of this dialog. These panes arelisted in Table 14 and described on the following pages.
Figure 158. Configuration Manager Dialog Panes (Settings selected)

Configuration and Preferences 175
Function Description
Filters Establishes the criteria for one or more filters that determine what transactions will beincluded or excluded from the trace listing.
Symbols Establishes the criteria for transactions that will have their particular address or databyte value replaced by a specified text string symbol.
SMBus Establishes the associations between bus addresses and SMBus devices using filescontaining SMBus decoding information.
Settings Establishes the various electrical and bus settings of the analyzer.
Files Lists the set of support files associated with the currently loaded project.
Table 14. Configuration Manager Panes
Filters PaneA filter defines a class of transactions by specifying a set of particular transaction features. Each filter canbe individually activated or not via the checkbox beside the filter’s name, and the activated filters arecombined using OR logic unless the AND Filter Conditions Together option is set. The combinedselection of active filters can be set to either determine which transaction classes are included or whichare excluded from the trace listing. Use of filters allows you to view only the bus activity of interest, withitems considered clutter removed. If a transaction is removed from the monitor trace listing, it is alsoeffectively removed from the timing display graph where it will appear as a non-busy bus.
The Filters pane dialog is shown in Figure 159.

176 Configuration and Preferences
Figure 159. Filters Pane
Filters can either define transactions that will be included in the trace listing or excluded from the tracelisting. The radio buttons at the top of the dialog determine this selection or turn off filtering completely.The Include and Exclude selections each have their own separate set of filters which are displayed in thedialog’s list box. A filter from the list can be selected by the user for editing or removal.
Using the Add button beneath the list box, a new filter can be defined and appended to the list. The Editbutton enables alteration of an existing selected filter. The Remove and Remove All buttons enable thedeletion of a selected filter or the entire set of filters.
The Filter Definition dialog for setting the transaction criteria for each filter is similar to those for the Finddialog. This dialog, shown in Figure 160, is displayed when using the Add or Edit buttons.

Configuration and Preferences 177
Figure 160. Filter Definition Dialog (similar to Edit)

178 Configuration and Preferences
Symbols PaneThis dialog, shown in Figure 161, displays a list that can contain symbolic text strings along withassociated parameters that specify the criteria which determine where the symbolic text will replace anumeric value in the trace listing and other related dialogs. This can be used to enhance the userreadability of transactions.
Figure 161. Symbols Pane

Configuration and Preferences 179
Using the Add button beneath the list box, a new symbol can be defined and appended to the list. TheEdit button allows alteration of an existing selected symbol definition. The Remove and Remove Allbuttons enable the deletion of a selected symbol definition or the entire list of symbol definitions. TheSymbol Definition dialog that is displayed when using the Add or Edit buttons is shown in Figure 162.
Figure 162. Symbol Definition Dialog
For Data Bytes, the value located at a specific byte number position in a message can define a certainsymbol which might relate to a device-specific structure. For example, the n’th byte of a slave devicemight be a register, the contents of which may be appropriately shown using some symbolic text, insteadof the numeric value.
Symbols can also operate in the reverse direction. That is, a symbolic text string can be entered in placeof a numeric value when using the Find dialog or specifying a slave device address in the Debugger ordebugger command script file. Thus, for example, a slave device can be referenced by a name like “PLL”instead of a numeric bus address like “1E”.
SMBus PaneThis dialog, shown in Figure 163, shows a list of associations between bus addresses and SMBusdevices. Device entries shaded gray are reserved by the SMBus Specification (v. 2.0). Those devicescannot be removed, but their associated addresses can be re-associated with a different device ifnecessary. For other entries, each address may only be associated with one device.

180 Configuration and Preferences
Figure 163. SMBus Pane

Configuration and Preferences 181
Each entry in the device list box contains the device name, bus address value, and the decoding file. Thedevice name is the name of the SMBus device that is associated with the address value and will bedisplayed in the Address column of the trace listing. The bus address value specifies the slave addressthat is being associated. This 7-bit address is displayed in hex according to the current FE or EF displaymode. The last piece of information is the path to the file containing the protocol decoding information forthe device. Decoding files for devices that are not built-in are provided in the “Decoder” subfolder of theinstallation folder.
The four buttons at the bottom of the window allow the user to manipulate the association list. Using theAdd button, a new device can be associated with an address. The Edit button enables alteration of anexisting selected association. The Remove and Remove All buttons enable deletion of the selectedassociation or the entire list of associations.
When using the Add or Edit buttons, the SMBus Decoder File dialog is displayed as shown in Figure164. Click on the Browse button to select the decoder file. Click on the Update button to have theinformation from the decoder file automatically filled into the Address and Name fields. Click on the OKbutton to finish or the Cancel button to cancel. If the address being associated is a reserved address,overriding of the reserved address must be confirmed. Other addresses already associated with a devicewill not be allowed to be re-associated until they are removed from the association list.
Figure 164. SMBus Decoder File Dialog
SMBus TimeoutThe SMBus Timeout checkbox is used to enable the detection of a timeout condition as defined by theSMBus specification. When this setting is checked, an SMBus Timeout will be reported as an error line inthe Monitor trace listing any time that the clock signal (SCL) is detected to be low for 25 milliseconds orlonger during capturing of bus traffic. If a timeout occurs while the BusPro-I is driving the bus, it willabandon all transactions and generate a STOP condition to return the bus to the idle state.

182 Configuration and Preferences
Settings PaneThis dialog, shown in Figure 165, allows setting of the various electrical and bus features of the analyzer.There are some settings that depend on others and may be grayed out accordingly. All of the controlspresent in the Settings pane are detailed below.
Figure 165. Settings Pane

Configuration and Preferences 183
Target Supplied – Specifies that the connected target I2C bus has its own pull-up voltage supply. In thiscase, the target bus is self-sufficient and ready for use. When this setting is selected, the Pull-upResistance setting is disabled.
Analyzer Supplied – Specifies that the BusPro-I will supply pull-up voltage to the target bus. In this case,the target has no other attached pull-up voltage source and the analyzer must supply this to activate thebus. When this setting is selected, both the Voltage and Pull-up Resistance settings are enabled.
Voltage – In Analyzer Supplied mode, this specifies the voltage to which the bus will be pulled up bythe BusPro-I. The user must ensure that this level is compatible with the operation of any attachedtarget bus. In Target Supplied mode, this specifies the voltage level that will be provided by the targetso that appropriate bus signal threshold levels can be automatically set.
Pull-up Resistance – In Analyzer Supplied mode, this specifies the pull-up resistor value throughwhich both bus signals (SCL and SDA) will be pulled up by the BusPro-I. The user should considerthe target I2C bus capacitance such that the resultant RC time-constant will not adversely affect itsoperation at expected clock rates (by producing signal rise-times that are too slow).
Bus Signal Threshold High Level – This value establishes the minimum voltage that a bus signal (SDAand SCL) must rise above from the low state before it is considered to be high. This setting applies ingeneral to all monitoring of the bus by the analyzer. Default values for these settings are based on thepull-up voltage selected in the Voltage dropdown box.
Bus Signal Threshold Low Level –This value establishes the maximum voltage that a bus signal (SDAand SCL) must drop below from the high state before it is considered to be low. This setting applies ingeneral to all monitoring of the bus by the analyzer. Default values for these settings are based on thepull-up voltage selected in the Voltage dropdown box.
Auto Detect – This button causes the I2C Exerciser to check for a voltage on the target bus andautomatically select recommended default electrical settings based on its findings.
Drive Clock Rate – Specifies the nominal clock rate of the SCL signal when the BusPro-I drives the bus.Note that the I2C bus is not of a continuously clocking type since various conditions can stretch the clockor require resynchronization between multiple sources. Therefore, a constant period is not expected.
Disable Collision Detection – Under normal circumstances, when the BusPro-I drives the bus (actinglike a master) it is required to detect that the signal levels it drives match (within a reasonable time) what itsenses on the bus. Failure to detect a match would imply a collision with another master. If the bus hasexcessive capacitance or high pull-up/capacitance combinations which cause its rise-time to be slow, afalse collision may be repeatedly detected and prevent the BusPro-I from completing its transactions.Enabling this Disable Collision Detection option accommodates such slow busses and allows the BusPro-I driving to proceed, but without the I2C arbitration mechanism. Therefore, the user needs to keep anytarget I2C bus master(s) quiet while the BusPro-I drives the bus when collision detection is disabled.

184 Configuration and Preferences
Accelerated Rising Edge Drive – In general, when a driver on the bus makes a positive signaltransition, the rise-time is determined by the RC time-constant of the bus. The rise-time governs the upperlimit on effective clock rates. When the BusPro-I drives the bus, it can apply a strong rising drive duringthe signal transition to overcome the RC time-constant, creating a rapid edge. This can then allow anincrease in the clock rate for a given RC value of the bus. If this option is set to AUTO, the BusPro-I willengage the fast rising edge mechanism automatically whenever it is operating with the I2C high-speedmode (Hs-mode) protocol—note, however, that the High-Speed Mode emulation is not currentlysupported by the BusPro-I and so the AUTO setting will have the same effect as OFF. If this optionis set to ON, the BusPro-I employs the mechanism at all times. Setting this option to OFF fully disablesthe mechanism, letting the pull-ups or the target capacitance determine rise times.
High-Speed Mode Monitoring – This setting provides an option to turn on or off the Hi-Speed Modemonitoring mechanism. When it is turned off, the glitch filtering mechanism of BusPro-I becomes enabled.The glitch filtering mechanism filters out glitches that are less than 50 ns in duration for protocol decoding,but indicates their occurrences on the timing display. At Drive Clock Rate higher than 1 MHz, this option isforced to be ON to avoid any over-filtering of glitches.
Input/Output Signals High Level – Specifies the TTL high voltage level of the I/O signals. When sensinginputs, the BusPro-I will also use this setting to automatically determine commensurate signal thresholdvalues.
I/O 1 – Specifies the discrete signal I/O 1 to be an input, an output TTL driver, or an output open-draindriver.
Drive SMB AT1 – If I/O 1 discrete signal is set as an output, selecting this option will map the state of theI/O 1 line to the AT1 SMB connector on the BusPro-I for signaling external instruments. Not applicablewhen I/O 1 is an input.
I/O 2 – Specifies the discrete signal I/O 2 to be an input, an output TTL driver, or an output open-draindriver.
Source – If I/O 2 discrete signal is set as an input, this setting specifies the source of the signal. SelectingTarget routes it through the Serial Bus (RJ-45) connector on the BusPro-I. Selecting SMB AT2 routes itfrom the AT2 SMB connector on the BusPro-I, enabling triggers in from external instruments.
Monitor Buffer Depth – This value indicates the number of transactions that occur before the monitortrace is considered to be full. The transaction depth ranges from 1 K (1,024) to 1 M (1,048,576)transactions.
Monitor Buffer Log to File – This option provides continuous logging of trace data to host computer’shard disk and, during "Run Repetitive" monitoring, can record and store endless hours of I2C bus trafficlimited only by the available disk space. When this option is selected, the captured Monitor trace data issaved to files as described below.
The trace data is stored in files with the extension "*.tdf", each of which holds up to 1M of consecutive I2Cbus transactions. The trace data path and base filename are user-specified and then a numerical index isappended to each filename ("_nnnn") to indicate the chronological order in which the data was capturedand saved. Note that each 1M-transaction trace data file uses about 260MB of disk space as it containsall captured I2C bus transaction data, including signal waveforms, timing and timestamp information.
Use the Monitor Window's "Run Repetitive" button to continuously capture the traffic. Data will becaptured into a *.tdf file and, once the file exceeds 1M transactions, another file will be opened tocontinue storing transactions, and so forth. Note that when the "Run" or the "Run Repetitive" button isclicked and trace data files with the same base filename already exist in the specified location, the userwill be prompted to overwrite them. While running, the Monitor Window displays the most recent 1M

Configuration and Preferences 185
transactions of data, and the Run Status tab on the Monitor Tools window lists the name of the trace datafile currently being logged to. After finishing capturing, you may double-click on the listed filenames toload the trace data to the Monitor Window.
Driving Bus Clock Rate ConsiderationsWhen adjusting the SCL clock rate at which the analyzer operates the bus as a master (during Debuggerfunctions), the user must be aware of limitations imposed by the target bus itself. For example, if the busrise-time is too slow for the selected rate (signals take a long time to reach the high threshold voltage) itmay appear to the analyzer that another master is colliding and overriding its own SDA level. For verylong rise-times, the signal might not even reach this level before turning around to fall. This may result inthe analyzer protocol tracker reporting errors or it may even hang the bus if it seems like a new clockstate has not arrived. Such a bus is therefore not suitable for the selected clock rate without additionalmethods to account for it.
The Disable Collision Detection option restores better clock rate capability but eliminates the possibility oflegitimate collisions getting detected and flagged in the trace listing.
Forcing the Accelerated Rising Edge Drive mode on (even when not in high-speed mode) will allow betterdriving clock rate range since the analyzer will force rising edges up quickly despite the excesscapacitance. This of course only fixes the bus when the analyzer is the master and does not cure slowrise-times for target resident masters.
Finally, the above slow rise-time issues are strongly affected by analyzer supplied reference voltage andpull-up selections, which determine when the rising signal reaches the upper threshold to becomedetected as high. This applies when the analyzer is driving the bus. The two Bus Signal Threshold valuesfurther affect sensitivity to slow busses for either driver of the bus (analyzer or target) since signal leveldecision points are adjusted.
Files PaneWhen a project is saved, an .I2C file is created that stores all preferences, options, and settings for thesession. Some of the project information, however, is stored separately from the main .I2C project file.This includes the configuration of trigger conditions (stored in a .TRG file), filters (stored in a .FIL file), andsymbols (stored in a .SYM file). Separating this information from the project file allows for it to be easilyimported into other projects where the same trigger, filter, or symbol configuration might be required.
When a project is saved, the Files pane dialog, shown in Figure 166, will be automatically populated withany trigger, filter, or symbol configuration files that are created. The Browse… button is used to select afile for importing the relevant information from another project.

186 Configuration and Preferences
Figure 166. Files Pane

Configuration and Preferences 187
Preferences DialogThe Preferences Dialog allows the user to change the preferences for the various tools provided by theI2C Exerciser in one easily accessible location. The user can access the last used Preferences tab byusing the Tools | Preferences menu command accessible from all windows. The user can use thePreferences dialog to set the preferences for the monitor colors, monitor options, debugger options,programmer options, and formats.
Monitor ColorsThis pane enables altering of the colors of the trigger and cursor backgrounds and text in the trace listing.It also enables the background color pattern (color scheme) between line groupings to be changed. Theoptions for the color pattern are no color, alternating background color per row, or alternating backgroundcolor per messages (default). The color for background and text assigned to the alternating line groupscan also be selected. Any changes made take effect immediately. A Use Defaults button restores theoriginal default settings.
Figure 167. Monitor Colors Pane

188 Configuration and Preferences
Monitor OptionsThis pane enables the altering of preferences for the layout and style of data in the Monitor window.
Figure 168. Monitor Options Pane
Line Column – sets the numbering of entries in the trace list to start from one at the first entry (default) orstart from zero at the trigger, with earlier transactions being negative.
Timestamp Start – sets whether time zero starts at the first entry (default) or at the trigger, with earliertransactions being negative.
Timestamp Display – controls how timestamps are determined for trace list entries. When set to“Absolute,” the first trace list entry is set to time zero and each entry’s timestamp represents the length oftime since the first entry. When set to “Relative to last,” each trace list entry’s timestamp represents thelength of time since the previous entry.
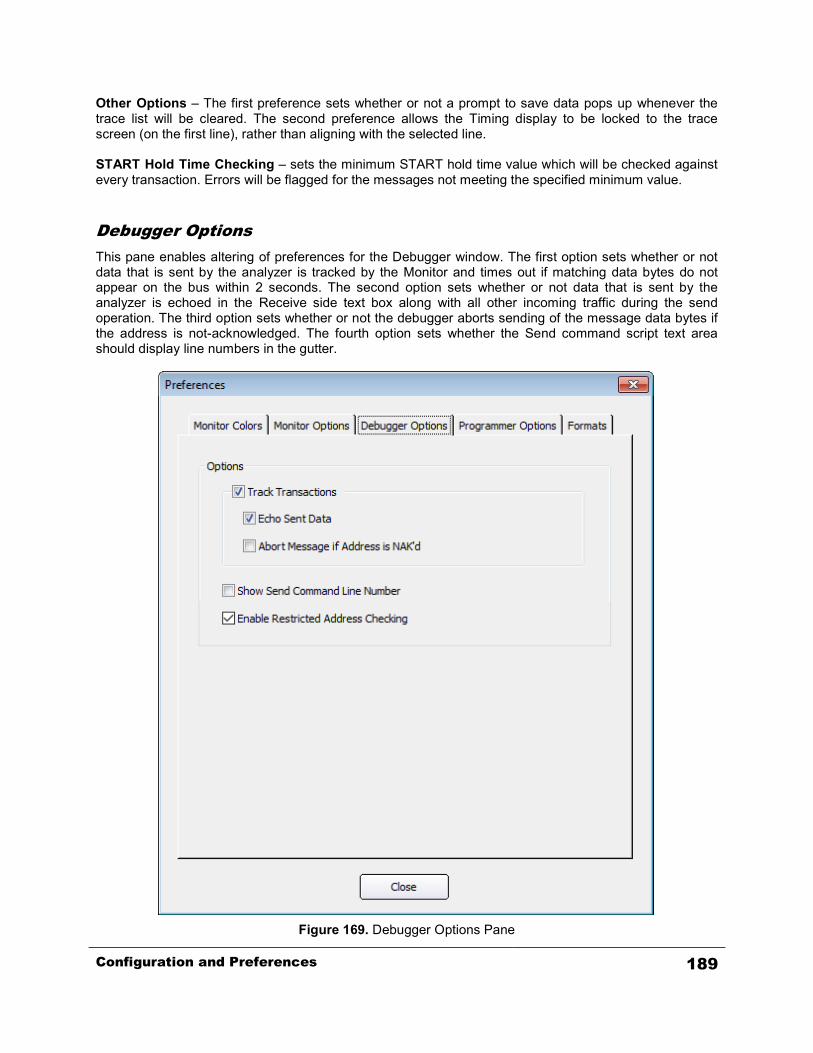
Configuration and Preferences 189
Other Options – The first preference sets whether or not a prompt to save data pops up whenever thetrace list will be cleared. The second preference allows the Timing display to be locked to the tracescreen (on the first line), rather than aligning with the selected line.
START Hold Time Checking – sets the minimum START hold time value which will be checked againstevery transaction. Errors will be flagged for the messages not meeting the specified minimum value.
Debugger OptionsThis pane enables altering of preferences for the Debugger window. The first option sets whether or notdata that is sent by the analyzer is tracked by the Monitor and times out if matching data bytes do notappear on the bus within 2 seconds. The second option sets whether or not data that is sent by theanalyzer is echoed in the Receive side text box along with all other incoming traffic during the sendoperation. The third option sets whether or not the debugger aborts sending of the message data bytes ifthe address is not-acknowledged. The fourth option sets whether the Send command script text areashould display line numbers in the gutter.
Figure 169. Debugger Options Pane

190 Configuration and Preferences
Programmer OptionsThis pane enables setting of whether or not the Programmer performs a verification of written data afterprogramming a device.
Figure 170. Programmer Options Pane

Configuration and Preferences 191
FormatsThis pane enables selection of how a 7 binary bit address representation is formatted for hexadecimaldisplay (does not apply to 10-bit addresses or to non-hex representations such as symbolic). The FEformat (default) shows the hexadecimal byte value with the 7 address bits left-justified in the byte. The 7Fformat shows the 7 address bits right-justified in the byte. In addition, you can disable decoding of 10-bitaddresses in the Monitor trace listing so that all slave addresses are treated as a 7-bit address.
Figure 171. Formats Pane

192 Configuration and Preferences
Using Project FilesWhen the I2C Exerciser saves and loads project files, it saves and loads all of your customized settingsand preferences with these files. It is recommended that you become familiar with this feature and makeuse of it as much as possible. This functionality allows you to save an environment that you have set upfor a particular target bus, debugging session, or test routine, and then load up that environmentwhenever needed. Using this feature, you can not only save and retrieve the bus interface settings, butalso preserve the look and feel of the project by storing options such as color schemes, data formats, andwindow sizes, layouts, and positions. This can provide a great way to let multiple users have their ownseparate project setting defaults.
Following is a list of settings that are saved in the project file:
All settings from the Configuration Manager including:o Filterso Symbolso SMBus decoding file listo Bus interface settingso Project sub-file list
All settings from the Preferences dialog including:o Monitor colors and optionso Debugger optionso Programmer optionso Address format options
All settings from the Trigger dialog Window sizes and positions of the Monitor, Debugger, Programmer, Emulator, Test, Parameters
Scope, and Monitor Tools windows Monitor window’s layout, column settings, and trace data file path Debugger window’s send and receive settings including address, address types, run repetitions,
number of bytes to read, no-stop-bit options, and debugger command file path Programmer window’s configuration file path
When you launch the I2C Exerciser for the first time, either from its shortcut on the desktop or the I2CExerciser program group of the Windows Start menu, you are staring with a new project using theapplication default configuration settings. You will notice that in this case the title bar of the mainapplication window displays the project name “Untitled” as shown in Figure 172. To give a name to yourproject, simply select the Save Project menu item from the File menu and then specify a name and thepath for the project file. If you want to rename your project at a later time, you can choose the SaveProject As menu item from the File menu and provide a new file name and path.
Figure 172. Title Bar for a New Project

Configuration and Preferences 193
Once you have saved a project to a file, the title bar will display the current project file name as shown inFigure 173.
Figure 173. Title Bar for a Saved Project
The project settings are saved in a file with “.i2c” extension. Along with this main *.i2c file, severalsecondary files are created and associated with the project whenever you create a new project. They arethe trigger (*.trg), filters (*.fil), and symbols (*.sym) files. Having these separate project sub-files allowsyou to re-use the settings that they contain from within another project. This can be achieved by selectingthe sub-files from the Files tab of the Configuration Manager. By default, when you create and save anew project, the application will automatically give the same name to these sub-files as the main projectfile (only the file extension will differ).
The I2C Exerciser keeps track of any changes made to a project’s settings during a session. Upon exitingthe application or closing the current project, it will ask you whether you want to save the changes or not.You may choose not to save it, to preserve your original project settings, or to save the latest changes tothe project for next time.
Along with the configuration settings, preferences, and window positions, a project also remembers thenames and paths of certain data files associated with the project. These data files include: the monitortrace data file (*.tdf), the debugger command file (*.dcf), the programmer configuration file (*.pcf), and thetest script file (*.scr). Note that the project file only stores the names and paths of these data files, nottheir actual contents.
Once you have saved a project, you can load it again later in three different ways. You may start the I2CExerciser and then select the Open Project menu item from the File menu to bring up a dialog thatallows you to browse for and select the desired project file. Secondly, you may select the project namefrom among the MRU (Most Recently Used) list in the File menu (see Figure 174). This list includes up tothe last four projects that have been opened. Finally, you can also launch the I2C Exerciser and load aproject file in a single step by double clicking on the associated project file from the Windows Explorer.
Figure 174. File Menu MRU Project List
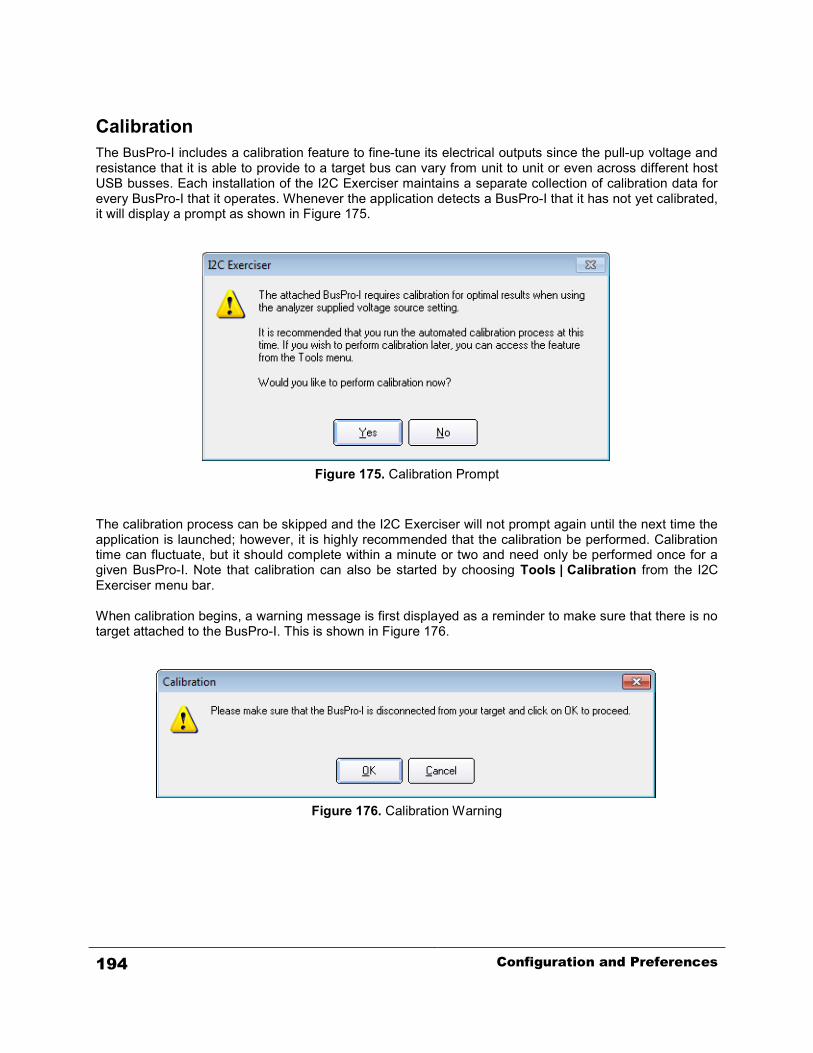
194 Configuration and Preferences
CalibrationThe BusPro-I includes a calibration feature to fine-tune its electrical outputs since the pull-up voltage andresistance that it is able to provide to a target bus can vary from unit to unit or even across different hostUSB busses. Each installation of the I2C Exerciser maintains a separate collection of calibration data forevery BusPro-I that it operates. Whenever the application detects a BusPro-I that it has not yet calibrated,it will display a prompt as shown in Figure 175.
Figure 175. Calibration Prompt
The calibration process can be skipped and the I2C Exerciser will not prompt again until the next time theapplication is launched; however, it is highly recommended that the calibration be performed. Calibrationtime can fluctuate, but it should complete within a minute or two and need only be performed once for agiven BusPro-I. Note that calibration can also be started by choosing Tools | Calibration from the I2CExerciser menu bar.
When calibration begins, a warning message is first displayed as a reminder to make sure that there is notarget attached to the BusPro-I. This is shown in Figure 176.
Figure 176. Calibration Warning

Configuration and Preferences 195
Upon clicking the OK button, calibration will proceed through four steps: analyzer supplied bus voltages,discrete I/O line output voltages, SCL pull-up resistors, and SDA pull-up resistors. The progress of eachstep is reported in the Calibration Status window as shown in Figure 177. When all steps have completedsuccessfully, the status window may be closed by clicking on the Done button as shown in Figure 178and the calibrated BusPro-I is ready for use.
Figure 177. Calibration Status
Figure 178. Calibration Complete

196 Configuration and Preferences

Third Party Application Interface 197
Chapter 9Third Party Application Interface
Description of using the BusPro-I with third party software
OverviewThe BusPro-I provides the ability to operate some of its features by using function calls from third partysoftware. In this manner, such applications can access the connected I2C bus of the target, includingobserving its traffic, interacting with it, and performing bus measurements. This effectively provides suchsoftware with a portal to the connected I2C bus.
One set of common third party applications includes the National Instruments LabWindows/CVI andLabVIEW software. These are capable of accessing external routines by using DLL function calls.Therefore, the DLL library described in this chapter can be used by these popular applications.
More generally, any application which can call DLL routines can invoke the library routines described inthis chapter and gain control and visibility of the BusPro-I resources and the connected I2C bus.

198 Third Party Application Interface
Dynamic Link Library (DLL)The Dynamic Link Library is comprised of a set of routines which can be invoked in a standard fashion bya user’s program. Table 15 lists the primary files necessary for using the DLL.
Component Description
I2C_DLL.dll The encapsulated library of I2C routines
I2C_DLL.lib The import library
I2C_DLL_API.h C include file containing the required DLL function prototypes
i2c_fpga_bin.bin Hardware engine binary file
Table 15. DLL Components
These files are provided in the I2C Exerciser installation folder. The I2C_DLL.dll and i2c_fpga_bin.binfiles are required in order to execute third-party programs calling the I2C_DLL functions.
Additionally, some examples, DLL wrappers, and driver files for third-party tools and languages such asLabVIEW, Python, Microsoft Visual C++, and Visual Basic are provided in the I2C_DLL example folder,which is located at “C:\Corelis Examples\I2C Exerciser\I2C_DLL”.
Note that the DLL is a 32-bit version and can be used with 32-bit versions of programs only.
Table 16 lists and describes the functions provided by the I2C DLL. The following pages give moredetailed information about each function.

Third Party Application Interface 199
General Calling SequenceCertain DLL function calls are required to properly initiate, setup, operate, and shut down the BusPro-I.This sequence of calls is summarized as follows:
I2C_InitHardware // required connection to PC USB port + loading logic and firmwareI2C_LoadSetup // optional… brings in previously saved setup information.I2C_SetFEAddrFormat // optional (default is FE mode)… establish address byte format.
Assorted configuration and/orOverwrite functions // optional setting or over-writing loaded configuration.
.
.
.Target interaction sequences // do various mission related target operations...
I2C_ShutdownHardware // required shut down and disconnection from PC USB port.
The first and last function calls are mandatory. The first function call will enable most of the otheroperations. The last function call ensures a clean disconnection of the BusPro-I so that it can be restartedtrouble-free. If this is not done, it may be necessary to cycle-plug the analyzer in the USB port.
Note that I2C_DLL.dll exports a dual set of functions, one using the _cdecl convention and the otherusing the _stdcall convention. For the set of functions using the standard call convention, the postfix"_StdCall" is added to each function name, and the list is provided in the “I2C_DLL.def” file. Forexample, “I2C_InitHardware()” is a _cdecl function while “I2C_InitHardware_StdCall()” is a _stdcallfunction.

200 Third Party Application Interface
Function Reference
Function Description
I2C_ConfigureDiscretes Overwrites several configuration parameters relating to configuringthe two discrete I/O lines.
I2C_DisableCollisionDetection Enables an analyzer mode which ignores bus collision conditionswhen it is driving the bus.
I2C_DisableTxTracking Turns off the transmission tracking feature. Removes delaysbetween transactions.
I2C_EnableTxTracking Turns on the transmission tracking feature. Adds delays betweentransactions.
I2C_GetLastStatus Reports supplemental status of the most recent call to an APIfunction.
I2C_GetLastTransferStatus Reports supplemental status of the most recent call toI2C_Receive_Data or I2C_Send_Data.
I2C_InitHardware Confirms BusPro-I status and establishes default initial conditions.
I2C_LoadSetup Reloads all previously stored setup parameters from a project file.
I2C_PulseDiscrete Pulses one of the discrete I/O signals low for a given period oftime.
I2C_Random_Read Writes and then reads data from the specified target slaveaddress.
I2C_Receive_Data Conveys a message from the I2C bus for a given address.
I2C_Receive_Data_Q Reads data from the specified target and returns immediatelywithout waiting for the read values, which will be stored in aqueue for later retrieval.
I2C_Receive_Data_Q_Get Retrieves previously queued read data.
I2C_SendData Conveys a message to the I2C bus for a given address
I2C_SendDataPEC Conveys a message to the I2C bus for a given address with aSMBus Packet Error Checking (PEC) byte.
I2C_SenseDiscrete Reads the level of one of the discrete I/O signals.
I2C_SetBusDriveVoltage Overwrites configuration bus reference voltage with providedvalue.
I2C_SetBusHighVoltageThreshold Overwrites configuration receiver high threshold voltage withprovided value.
I2C_SetBusLowVoltageThreshold Overwrites configuration receiver low threshold voltage withprovided value.
I2C_SetBusPullupResistance Overwrites configuration pull-up resistor value for both bus signalswith provided value.
I2C_SetBusVoltageSource Selects the bus reference voltage source as either provided by thetarget or by the analyzer programmable level.

Third Party Application Interface 201
Function DescriptionI2C_SetClockRate Overwrites configuration SCL rate with provided value when the
analyzer is driving the bus.
I2C_SetDiscrete Sets the output level of one of the discrete I/O signals.
I2C_SetDiscreteVoltage Overwrite configuration TTL voltage level for the high state ofthe discrete I/O signals.
I2C_SetFEAddrFormat Defines the mode of byte representation used throughout the setof DLL commands for 7-bit addresses.
I2C_SetMonitorCallback Sets application-defined callback function for processingtransaction data captured by the analyzer.
I2C_SetRisingEdgeDriveMode Overwrites configuration rising edge drive setting with providedselection.
I2C_ShutdownHardware Forces an orderly shutdown of the BusPro-I analyzer and its USBdisconnection.
Table 16. I2C DLL Functions
202 Third Party Application Interface
I2C_ConfigureDiscretesOverwrites several configuration parameters related to driving the two discrete I/O lines. This includessetting each line’s direction, drive type (TTL or open-drain), SMB connector linkage and voltage level.
Prototype:extern “C” __declspec(dllexport) int _cdecl
I2C_ConfigureDiscretes ( int nDiscrete1Function,BOOL bDiscrete1DrivesSMB_AT1,int nDiscrete2Function,BOOL nDiscrete2InputFromSMB_AT2,char *szVoltage );
Return Value:0 if I2C_InitHardware was never called.1 if successful-1 if invalid nDiscrete1Function parameter-2 if invalid nDiscrete2Function parameter-3 if invalid szVoltage parameter
Parameters:nDiscrete1Function
0 = Input, 1 = TTL Output, 2 = Open-drain OutputbDiscrete1DrivesSMB_AT1
irrelevant if Discrete 1 is configured as an input, otherwise, 0 = drives target connector, 1 = drivesSMB AT1 connector
nDiscrete2Function0 = Input, 1 = TTL Output, 2 = Open-drain Output
nDiscrete2InputFromSMB_AT2irrelevant if Discrete 2 is configured as an output, otherwise, 0 = input comes from targetconnector, 1 = input comes from SMB AT2
szVoltagediscrete output voltage between 1.25 and 3.30 (rounded to nearest 0.05V)

Third Party Application Interface 203
I2C_DisableCollisionDetectionEnables an analyzer mode which ignores bus collision conditions when it is driving the bus. This maybe useful for busses with overly slow rise-times. In such cases, the analyzer will not see its own highSDA drive level soon enough before deciding that another master is driving the bus and colliding withit. This mode will stop the analyzer from checking this condition and permit continued operationwithout an error condition.
Prototype:extern “C” __declspec(dllexport) int _cdecl
I2C_DisableCollisionDetection ( int nEnable );
Return Value:0 if I2C_InitHardware has not yet been called, otherwise, 1.
Parameters:nEnable
1 = disable collision detection. 0 = enable collision detection.

204 Third Party Application Interface
I2C_DisableTxTrackingTurns off the transmission tracking feature. Removes delays between transactions.
Prototype:extern “C” __declspec(dllexport) char * _cdecl
I2C_DisableTxTracking ( void );
Return Value:NULL if the initialization was successful, otherwise, a pointer to a string containing text with an errormessage.
Parameters:None.
Third Party Application Interface 205
I2C_EnableTxTrackingTurns on the transmission tracking feature. Adds delays between transactions.
Prototype:extern “C” __declspec(dllexport) char * _cdecl
I2C_EnableTxTracking ( void );
Return Value:NULL if the initialization was successful, otherwise, a pointer to a string containing text with an errormessage.
Parameters:None.

206 Third Party Application Interface
I2C_GetLastStatusReports supplemental status of the most recent call to an API function.
Prototype:extern “C” __declspec(dllexport) char * _cdecl
I2C_GetLastStatus ( void );
Return Value:The status string indicating the result of the most recent call to an API function, including any errormessages.
Parameters:None.
Third Party Application Interface 207
I2C_GetLastTransferStatusReports supplemental status of the most recent call to I2C_Receive_Data or I2C_Send_Data. Theevent of an address cycle NAK is provided.
Prototype:extern “C” __declspec(dllexport) char * _cdecl
I2C_GetLastTransferStatus ( void );
Return Value:NULL if there is no transfer status information, otherwise the string "ADDRESSNAK".
Parameters:None.

208 Third Party Application Interface
I2C_InitHardwareConfirms that the BusPro-I is present and properly linked via its USB port. It initializes the hardwarewith logic and downloads the firmware, with all settings at factory default states.
Prototype:extern “C” __declspec(dllexport) char * _cdecl
I2C_InitHardware ( void );
Return Value:NULL if the initialization was successful, otherwise, a pointer to a string containing text with an errormessage.
Parameters:None.

Third Party Application Interface 209
I2C_LoadSetupOverwrites all settings from the referenced project (*.i2c) file. Following are the parameters beingloaded.
LowThresholdVoltageSetting,HighThresholdVoltageSetting,InterfaceSpeedSetting,TolerateSlowRiseTimes,DisableCollisionDetection,AnalyzerSuppliesBusVoltage,BusDriveVoltageSetting,BusDrivePullUpSetting,SlopeControlMode,BufferDepthSetting,Discrete1IOmode,Discrete1Drives_SMB_AT1,Discrete2IOmode,Discrete2InputSource,DiscreteVoltage,HiSpeedMode,TimingSkewMode,TimingSkewSetupTime,TimingSkewHoldTime,SMBusTimeout,Is8BitAddrFormat
Prototype:extern “C” __declspec(dllexport) char * _cdecl
I2C_LoadSetup ( char * szFilename );
Return Value:NULL if the loading the parameters was successful, otherwise a pointer to a string containing an errormessage.
Parameters:szFilename
The string holding the full path, including the filename of the project file containing the instrumentsettings.

210 Third Party Application Interface
I2C_PulseDiscretePulses one of the discrete I/O signals low for a specified period of time, if it is configured as output. Ifdiscrete 1 is selected and it is configured as tied to the output trigger SMB, that signal will beoperated instead of the line to the target. This will leave the discrete high regardless of what state itstarted at.
Prototype:extern “C” __declspec (dllexport) int _cdecl
I2C_PulseDiscrete ( int nDiscreteNumber,int nMilliseconds );
Return Value:0 if I2C_InitHardware was never called.-1 if illegal discrete number.-2 if selected discrete is not configured as an output1 if successful
Parameters:nDiscreteNumber
The index selecting the discrete to drive, either 1 or 2.nMilliseconds
Time period in milliseconds to hold the discrete low before going back to high.

Third Party Application Interface 211
I2C_Random_ReadWrites internal memory address of the slave device to read from, and then reads data from it.
Prototype:extern “C” __declspec(dllexport) int _cdecl
I2C_Random_Read ( int nAddress,int b10BitAddress,unsigned char * pMemAddrBytes,int nMemAddrLength,unsigned char * pReceiveData,int nDataCount,int bUseStopBits);
Return Value:-1 if I2C_InitHardware was never called.-2 if a timeout occurred.otherwise the number of bytes received (may be 0 if transfer was aborted due to address NAK)
Parameters:nAddress
This is the 7-bit or 10-bit address of the source slave (depending on following parameter).b10BitAddress
If 1, the above address is a 10-bit value. If 0, it is a 7-bit address.pMemAddrBytes
A pointer to a block of memory where the internal memory address bytes of the slave device areprovided.
nMemAddrLengthThe number of bytes contained in the above block of memory.
pReceiveDataA pointer to a block of memory where the receive data bytes are to be stored.
nDataCountThe number of storage bytes of the above block of memory.
bUseStopBitsIf 1, a stop cycle terminates the message after the last data byte read, otherwise, no stop cycle isissued (the analyzer continues to control the bus with SCL low, ready to perform a comingRepeat Start on the next access).
212 Third Party Application Interface
I2C_Receive_DataLaunches a Receive operation as in the Debugger function, conveying data bytes from a given busaddress and checking for its timely completion. This function may not return quickly (up to the timeoutinterval) depending on the time it takes to receive and confirm completion. Use theI2C_GetLastTransferStatus function following this call to determine if the address cycle gotNAK’ed.
Prototype:extern “C” __declspec(dllexport) int _cdecl
I2C_Receive_Data ( int nAddress,int b10BitAddress,unsigned char * pReceiveData,int nDataCount,int bUseStopBits);
Return Value:-1 if I2C_InitHardware was never called.-2 if a timeout occurred.otherwise the number of bytes received (may be 0 if transfer was aborted due to address NAK)
Parameters:nAddress
This is the 7-bit or 10-bit address of the source slave (depending on following parameter).b10BitAddress
If 1, the above address is a 10-bit value. If 0, it is a 7-bit address.pReceiveData
A pointer to a block of memory where the receive data bytes are to be stored.nDataCount
The number of storage bytes of the above block of memory.bUseStopBits
If 1, a stop cycle terminates the message after the last data byte read, otherwise, no stop cycle isissued (the analyzer continues to control the bus with SCL low, ready to perform a comingRepeat Start on the next access).
Third Party Application Interface 213
I2C_Receive_Data_QReads data from the specified target and returns immediately without waiting for the read values,which will be stored in a queue for later retrieval. In order to retrieve the queued data, callI2C_Receive_Data_Q_Get function with matching QID. This function enables retrieving of the readdata while avoiding the gaps between transactions.NOTE: The transaction tracking must be disabled prior to calling this function. In order to disabletransaction tracking, call I2C_DisableTxTracking function.
Prototype:extern “C” __declspec(dllexport) int _cdecl
I2C_Receive_Data_Q ( int nQIDint nAddress,int b10BitAddress,unsigned char * pReceiveData,int nDataCount,int bUseStopBits);
Return Value:-1 if I2C_InitHardware was never called.-2 if a timeout occurred.-3 if transaction tracking is enabled.0 otherwise.
Parameters:nQID
ID of the queue entry in the memory to store the read values for later retrieval.nAddress
This is the 7-bit or 10-bit address of the source slave (depending on following parameter).b10BitAddress
If 1, the above address is a 10-bit value. If 0, it is a 7-bit address.pReceiveData
Not used.nDataCount
The number of storage bytes of the above block of memory.bUseStopBits
If 1, a stop cycle terminates the message after the last data byte read, otherwise, no stop cycle isissued (the analyzer continues to control the bus with SCL low, ready to perform a comingRepeat Start on the next access).

214 Third Party Application Interface
I2C_Receive_Data_Q_GetRetrieves queued data values stored from the previous I2C_Receive_Data_Q function call.
Prototype:extern “C” __declspec(dllexport) int _cdecl
I2C_Receive_Data_Q_Get ( int nQID,unsigned char * pReceiveData,int nDataCount);
Return Value:Number of bytes retrieved.
Parameters:nQID
ID of the queue entry to be retrieved from the memory.pReceiveData
A pointer to a block of memory where the receive data bytes are to be stored.nDataCount
The number of storage bytes of the above block of memory.

Third Party Application Interface 215
I2C_Send_DataSends a message (ie. performs a write operation) to the specified target slave address. This functionmay not return quickly (up to the timeout interval) depending on the time it takes to send and confirmcompletion. Use the I2C_GetLastTransferStatus function following this call to determine if theaddress cycle got NAK’ed.NOTE: This function is available for backward compatibility only. Use the new I2C_SendDatafunction instead if possible.
Prototype:extern “C” __declspec(dllexport) int _cdecl
I2C_Send_Data( int nAddress,int b10BitAddress,unsigned char * pSendData,unsigned char * pReceiveData,int nDataCount,int bUseStopBits);
Return Value:-1 if I2C_InitHardware was never called.-2 if a timeout occurred.otherwise the number of bytes sent (may be 0 if transfer was aborted due to address NAK)
Parameters:nAddress
This is the 7-bit or 10-bit address of the destination slave (depending on following parameter).b10BitAddress
If one, the above address is a 10-bit value. If zero, it is a 7-bit address.pSendData
A pointer to a block of memory where the send data bytes are provided.pReceiveData
A pointer to a block of memory where the successfully sent data bytes are returned. This is anoptional parameter which can be NULL.
nDataCountThe number of bytes contained in the above block of memory.
bUseStopBitsIf one, a stop cycle terminates the message after the last data byte sent, otherwise, no stop cycleis issued (the analyzer continues to control the bus with SCL low, ready to perform a comingRepeat Start on the next access).

216 Third Party Application Interface
I2C_SendDataSends a message (ie. performs a write operation) to the specified target slave address. This functionmay not return quickly (up to the timeout interval) depending on the time it takes to send and confirmcompletion. Use the I2C_GetLastStatus function following this call to determine if the addresscycle got NAK’ed.
Prototype:extern “C” __declspec(dllexport) int _cdecl
I2C_SendData( int nAddress,int b10BitAddress,unsigned char * pSendData,unsigned char * pReceiveData,int nDataCount,int bUseStopBit,unsigned long ulParam);
Return Value:Number of bytes successfully sent0 if error occurred-1 if address was NAK’d-2 if a timeout occurredCall I2C_GetLastStatus function to get the result of the call in a string format, including an errormessage.
Parameters:nAddress
This is the 7-bit or 10-bit address of the destination slave (depending on following parameter).b10BitAddress
If one, the above address is a 10-bit value. If zero, it is a 7-bit address.pSendData
A pointer to a block of memory where the send data bytes are provided.pReceiveData
A pointer to a block of memory where the successfully sent data bytes are returned. This is anoptional parameter which can be NULL.
nDataCountThe number of bytes contained in the above block of memory.
bUseStopBitIf one, a stop cycle terminates the message after the last data byte sent, otherwise, no stop cycleis issued (the analyzer continues to control the bus with SCL low, ready to perform a comingRepeat Start on the next access).
ulParamOptional parameter. Set this to ‘0’.

Third Party Application Interface 217
I2C_SendDataPECSends a message (ie. performs a write operation) with a SMBus Packet Error Checking (PEC) byte tothe specified target slave address. The PEC is a CRC-8 error-checking byte, calculated on all themessage bytes (including addresses and read/write bits). The PEC is appended to the message asthe last data byte. This function behaves same as the I2C_SendData function except for theaddition of PEC byte.
Prototype:extern “C” __declspec(dllexport) int _cdecl
I2C_SendDataPEC( int nAddress,int b10BitAddress,unsigned char * pSendData,unsigned char * pReceiveData,int nDataCount,int bUseStopBit,unsigned long ulParam);
Return Value:Number of bytes successfully sent0 if error occurred-1 if address was NAK’d-2 if a timeout occurredCall I2C_GetLastStatus function to get the result of the call in a string format, including an errormessage.
Parameters:nAddress
This is the 7-bit or 10-bit address of the destination slave (depending on following parameter).b10BitAddress
If one, the above address is a 10-bit value. If zero, it is a 7-bit address.pSendData
A pointer to a block of memory where the send data bytes are provided.pReceiveData
A pointer to a block of memory where the successfully sent data bytes are returned. This is anoptional parameter which can be NULL.
nDataCountThe number of bytes contained in the above block of memory.
bUseStopBitIf one, a stop cycle terminates the message after the last data byte sent, otherwise, no stop cycleis issued (the analyzer continues to control the bus with SCL low, ready to perform a comingRepeat Start on the next access).
ulParamOptional parameter. Set this to ‘0’.

218 Third Party Application Interface
I2C_SenseDiscreteReads the level of one of the discrete I/O signals. If discrete 2 is selected and it is configured as tiedto the input trigger SMB, that signal will drive this function instead of the target signal. The configureddirection of the signal has no effect here.
Prototype:extern “C” __declspec(dllexport) int _cdecl
I2C_SenseDiscrete ( int nDiscreteNumber,int * nLevel );
Return Value:0 if I2C_InitHardware was never called.-1 if illegal discrete number.1 if successful.
Parameters:nDiscreteNumber
The index selecting the discrete to drive, either 1 or 2.nLevel
If not NULL, pointer to sensed value of the output.

Third Party Application Interface 219
I2C_SetBusDriveVoltageOverwrite configuration reference voltage with provided value.
Prototype:extern “C” __declspec(dllexport) char * _cdecl
I2C_SetBusDriveVoltage ( char * szVoltage );
Return Value:NULL if I2C_InitHardware was never called, otherwise a pointer to a string containing the actualresulting reference voltage (closest available to requested).
Parameters:szVoltage
The string holding text of the new bus reference level as a floating-point decimal value in volts.

220 Third Party Application Interface
I2C_SetBusHighVoltageThresholdOverwrite configuration high threshold voltage with provided value. This supports the hysteresisfeature of the analyzer as it monitors the bus and improves noise immunity. If a bus signal is currentlyconsidered low, it must be sensed above this voltage before being switched to high by the analyzer.Note that for slow rising busses (high parasitic capacitance, with Accelerated Rising Edge Drive off),the rise time may limit the ability of a driver to achieve a desired clock rate (since the top of the pulsemay not reach the high threshold before turning around again). The threshold levels may also impactproper sensing of the bus since level crossings may occur in the nearly horizontal (and noisesensitive) final stage of signal rising.
Prototype:extern “C” __declspec(dllexport) char * _cdecl
I2C_SetBusHighVoltageThreshold ( char * szVoltage );
Return Value:NULL if I2C_InitHardware was never called, otherwise a pointer to a string containing the actualresulting high threshold voltage (closest available to requested).
Parameters:szVoltage
The string holding text of the new bus high threshold level as a floating-point decimal value involts.
Third Party Application Interface 221
I2C_SetBusLowVoltageThresholdOverwrite configuration low threshold voltage with provided value. This supports the hysteresisfeature of the analyzer as it monitors the bus and improves noise immunity. If a bus signal is currentlyconsidered high, it must be sensed below this voltage before being switched to low by the analyzer.Note that for slow rising busses (high parasitic capacitance, with Accelerated Rising Edge Drive off),the rise time may limit the ability of a driver to achieve a desired clock rate (since the top of the pulsemay not reach the high threshold before turning around again). The threshold levels may also impactproper sensing of the bus since level crossings may occur in the nearly horizontal (and noisesensitive) final stage of signal rising.
Prototype:extern “C” __declspec(dllexport) char * _cdecl
I2C_SetBusLowVoltageThreshold ( char * szVoltage );
Return Value:NULL if I2C_InitHardware was never called, otherwise a pointer to a string containing the actualresulting low threshold voltage (closest available to requested).
Parameters:szVoltage
The string holding text of the new bus low threshold level as a floating-point decimal value involts.

222 Third Party Application Interface
I2C_SetBusPullupResistanceOverwrite configuration pull-up resistors with provided value (same for both bus signals). Note thathigh pull-up values may increase the signal rise times impacting the bus monitoring function andaffecting clock rate performance. This is also affected by Accelerated Rising Edge Drive andthreshold values.
Prototype:extern “C” __declspec(dllexport) char * _cdecl
I2C_SetBusPullupResistance ( char * szResistance );
Return Value:NULL if I2C_InitHardware was never called, otherwise a pointer to a string containing the actualresulting resistor value (closest available to requested).
Parameters:szResistance
The string holding text of the new pull-up resistor values as a floating-point decimal value inohms.

Third Party Application Interface 223
I2C_SetBusVoltageSourceSelects the bus reference voltage source as either provided by the target, or by the analyzerprogrammable level (the target pull-ups should be removed).
Prototype:extern “C” __declspec(dllexport) int _cdecl
I2C_SetBusVoltageSource ( int nSource );
Return Value:0 if I2C_InitHardware was never called, otherwise 1.
Parameters:nSource
0 if target should drive the voltage (enter Target Supplied mode). 1 if the BusPro-I should drivethe voltage (enter Analyzer Supplied mode).

224 Third Party Application Interface
I2C_SetClockRateOverwrite configuration SCL clock rate with the provided value. This is the rate at which the analyzerattempts to run when it drives the bus. Note that for slow rising busses (high parasitic capacitance,with Accelerated Rising Edge Drive off), the rise time may limit the ability of a driver to achieve adesired clock rate (since the top of the pulse may not reach the high threshold before turning aroundagain). The threshold levels may also impact proper sensing of the bus since level crossings mayoccur in the nearly horizontal (and noise sensitive) final stage of signal rising.
Prototype:extern “C” __declspec(dllexport) char * _cdecl
I2C_SetClockRate ( char * szClockRateKhz );
Return Value:NULL if I2C_InitHardware was never called, otherwise a pointer to a string containing the actualresulting clock rate (closest available to requested).
Parameters:szClockRateKhz
The string holding text of the new SCL clock rate as a floating-point decimal value in kilohertz.The actual clock rate set will be rounded to the nearest value in the following list:
4 kHz, 5 kHz, 6 kHz, 7 kHz, 8 kHz, 9 kHz, 10 kHz, 20 kHz, 30 kHz,40 kHz, 50 kHz, 60 kHz, 70 kHz, 80 kHz, 90 kHz, 100 kHz, 150 kHz,200 kHz, 250 kHz, 301 kHz, 352 kHz, 397 kHz, 446 kHz, 500 kHz, 556 kHz, 595 kHz, 658 kHz, 694 kHz, 758 kHz, 806 kHz, 862 kHz, 893 kHz, 962 kHz, 1.000 MHz, 1.471 MHz, 1.923 MHz, 2.500 MHz, 3.125 MHz, 4.167 MHz, 5.000 MHz

Third Party Application Interface 225
I2C_SetDiscreteDrives the level of one of the discrete I/O signals to the state passed in, if configured as output. Ifdiscrete 1 is selected and it is configured as tied to the output trigger SMB, that path will be operatedinstead of the line to the target. Note, if the output is configured as open-collector, it is possible tonormally read back a value different than driven out.
Prototype:extern “C” __declspec(dllexport) int _cdecl
I2C_SetDiscrete ( int nDiscreteNumber,int nLevel,int * nSensedLevel );
Return Value:0 if I2C_InitHardware was never called.-1 if illegal discrete number.-2 if illegal discrete level.-3 if selected discrete not configured as an output1 if successful.
Parameters:nDiscreteNumber
The index selecting the discrete to drive, either 1 or 2.nLevel
The binary drive level for the discrete (0 or 1).nSensedLevel
If not NULL, pointer to sensed value of the output, after setting it.

226 Third Party Application Interface
I2C_SetDiscreteVoltageOverwrite configuration TTL voltage level for the high state of the discrete I/O signals.
Prototype:extern “C” __declspec(dllexport) char * _cdecl
I2C_SetDiscreteVoltage ( char * szVoltage );
Return Value:NULL if I2C_InitHardware was never called, otherwise a pointer to a string containing the actualresulting voltage (closest available to requested).
Parameters:szVoltage
The string holding text of the new TTL high voltage level of the discrete I/O as a floating-pointdecimal value in volts.

Third Party Application Interface 227
I2C_SetFEAddrFormatDefines the mode of byte representation used throughout the set of DLL commands for 7-bitaddresses. That is, the 7 bits of the protocol address is always given in a byte, but these bits can beplaced in the byte either left-justified where the LSB is zero (FE mode), or right-justified where theMSB is zero (7F mode). Suppose the protocol slave address is binary 0110101; it can be representedin a byte as hex 6A (left-justified = FE mode) or 35 (right-justified = 7F mode).
Prototype:extern “C” __declspec(dllexport) int _cdecl
I2C_SetFEAddrFormat ( int bEnable );
Return Value:0 if I2C_InitHardware was never called, otherwise 1.
Parameters:bEnable
1 for FE mode. 0 for 7F mode.

228 Third Party Application Interface
I2C_SetMonitorCallbackSets application-defined callback function for processing transaction data. This callback function iscalled whenever BusPro-I detects any new transactions on the target I2C bus. The callback functionshould perform minimal necessary work and return immediately to avoid overflowing of BusPro-Ibuffer. When this API function is called the current timestamp value is also reset to zero.
Prototype:extern “C” __declspec(dllexport) unsigned int _cdecl
I2C_SetMonitorCallback (TXDATAHANDLERPROC TxDataHnadlerProc,void* pWnd );
Return Value:1 if successful0 if failed
Parameters:nTxDataHnadlerProc
Pointer to application defined callback function. The definition of callback function is:
typedef UINT (CALLBACK* TXDATAHANDLERPROC)(ULONG, ULONGLONG, LPARAM);
The first parameter, ULONG, is the encoded transaction data (See below for the details).The second parameter, ULONGLONG, is the transaction timestamp in nanoseconds.The third parameter, LPARAM, is the pointer to application supplied data.
pWndPointer to application-supplied data. This pointer is passed to the callback function along with thetransaction data and timestamp information.
Transaction Data Format
Address Transaction Type: TxType[3:0] = 0x1
TxType[3]
TxType[2]
TxType[1]
TxType[0]
WriteTx
10-bit
Addr
I/O2
I/O1
NAK
Addr[9]
Addr[8]
Addr[7]
Addr[6]
Addr[5]
Addr[4]
Addr[3]
Addr[2]
Addr[1]
Addr[0]
31
30
29
28
27
26
25
24
23
22
21
20
19
18
17
16
15
14
13
12
11
10 9 8 7 6 5 4 3 2 1 0
Data Transaction Type: TxType[3:0] = 0x2

Third Party Application Interface 229
TxTy
pe[3
]
TxTy
pe[2
]
TxTy
pe[1
]
TxTy
pe[0
]
I/O
2
I/O
1
NAK
Data
[7]
Data
[6]
Data
[5]
Data
[4]
Data
[3]
Data
[2]
Data
[1]
Data
[0]
31
30
29
28
27
26
25
24
23
22
21
20
19
18
17
16
15
14
13
12
11
10 9 8 7 6 5 4 3 2 1 0
Error Transaction Type: TxType[3:0] = 0x3
TxType[3]
TxType[2]
TxType[1]
TxType[0]
ErrC
ode[3]
ErrC
ode[2]
ErrC
ode[1]
ErrC
ode[0]
I/O2
I/O1
31
30
29
28
27
26
25
24
23
22
21
20
19
18
17
16
15
14
13
12
11
10 9 8 7 6 5 4 3 2 1 0
Summary of Error Codes:
00H: no error
01H: ADDR_ERR - Protocol violation found during address transaction
02H: START_ERR - START hold time violation (i.e. less than minimum hold time)
03H: DATA_ERR - Protocol violation found during data transaction
04H: reserved
05H: reserved
06H: reserved
07H: SCL_HUNG_ERR - SMBus timeout (SCL held low for more than 25 msec) when enabled
08H-FFH: reserved

230 Third Party Application Interface
I2C_SetRisingEdgeDriveModeOverwrite configuration rising edge drive setting with provided selection. When enabled and drivingthe bus, the analyzer will assert hard drivers on the bus momentarily, during signal rising edges. Thisshould overcome parasitic capacitance on the bus resulting in fast rise-times.
Prototype:extern “C” __declspec(dllexport) int _cdecl
I2C_SetRisingEdgeDriveMode ( int nMode );
Return Value:0 if I2C_InitHardware was never called, otherwise 1.
Parameters:nMode
0 is off. 1 is on.

Third Party Application Interface 231
I2C_ShutdownHardwareForces an orderly shutdown of the BusPro-I analyzer and its USB disconnection. This function mustbe invoked prior to any new I2C_InitHardware call, for trouble-free operation. Otherwise, theanalyzer must be unplugged and re-plugged into the PC before being initialized again. This functionmay not return immediately, until the disconnection is complete.
Prototype:extern “C” __declspec(dllexport) void _cdecl
I2C_ShutdownHardware ( void );
Return Value:None.
Parameters:None.

232 Third Party Application Interface

Hardware Reference 233
Appendix ABusPro-I Hardware Reference
Hardware SpecificationsPhysical
MechanicalDimensions – box 5.48 +/- 0.10 x 1.00 +/- 0.10 x 4.75 +/- 0.10 inches
Operating Environment
Temperature 0°C to 55°C
Relative Humidity 10% to 90%, non-condensing
Storage Environment
Temperature -40°C to 85°C
USB Interface
USB Connector Standard Type B Socket
Port Version 2.0
Power Requirements
5.0V Provided by the host USB 2.0 port in compliance with its requirements.Do not connect the BusPro-I to the host PC through a bus (passive/un-powered) powered USB hub. It may not provide adequate operatingcurrent. An externally powered hub is OK.USB extender cables are not recommended.

234 Hardware Reference
Electrical SpecificationsTarget I2C Signals
Serial Bus Connector RJ45, AMP P/N 406549-1 (or equivalent)
Prior to launching the I2C Exerciser application, both LEDswill be lit while plugged into a powered host PC. Once theapplication is running, the LEDs have the following meaning:Green LED – BusPro-I is powered and initializedAmber LED – I2C bus activity is detected
Target Test Cables:
Flying Leads Target Cable 6 leads with female sleeved crimp terminal each,Molex 16-02-0097, or equivalent.Slips on target 0.025 inch square posts.Test Clips are included.Cable 12 inches (other options available)
4-pin Target Cable 4-pin female socket, Molex 08-50-0113 crimp terminals inMolex 22-01-3047 housing, 0.1” single row, or equivalent.Mates with friction lock header, Molex 22-23-2041 (orequivalent) at the target.Cable 12 inches (other options available)
Bus Sampling Rate 50 MHz
Incoming SCL frequency 0 Hz to 5 MHz
Master Outgoing SCL frequency 4 KHz to 5 MHz Programmable at assorted values.
Typical Timestamp Accuracy < 350 nsecs
Input Bus Dynamic Range -0.5V to 5.5V
Absolute Input Voltage Limits -0.5V to 6.0V
Programmable High Input Thresholds 0.0V to 5.0V, in 0.05V steps
Programmable Low Input Thresholds 0.0V to 5.0V, in 0.05V steps
Analyzer Input Capacitance < 60 pF – calculated with test cable excluded
Analyzer Input Resistance to Ground 100K ohms
Programmable SDA/SCL AnalyzerReference Voltage
Floating (Target Supplied mode) or 0.8V to 5.0V in 0.1Vsteps (Analyzer Supplied mode)

Hardware Reference 235
Programmable SDA/SCL ReferencePull-up Resistors
Pull-up resistor (in Analyzer Supplied mode) starting at abase approximate value of 250 ranging up to 50K ohms in anassortment of 64 values. Available values are 250, 1000,1850, 2650, 3450, 4200, 5000, 5800, 6600, 7400, 8200,9000, 9750, 10550, 11350, 12150, 12950, 13750, 14550,15350, 16100, 16900, 17700, 18500, 19300, 20100, 20900,21700, 22450, 23250, 24050, 24850, 25650, 26450, 27250,28050, 28800, 29600, 30400, 31200, 32000, 32800, 33600,34400, 35150, 35950, 36750, 37550, 38350, 39150, 39950,40750, 41500, 42300, 43100, 43900, 44700, 45500, 46300,47100, 47850, 48650, 49450, and 50250 ohms. Pull-upResistor Tolerance: +/- 20% (at 25 degrees C)
Programmable Rising Slope Control When enabled, momentarily pulls up rising-edge driven bussignals to quickly overcome capacitance.
Target Discrete I/O1, I/O2 Test Signals
Programmable TTL Discrete I/O OutputVoltage (V_adj)
1.25V to 3.3V, in 50mV steps
Independent ProgrammableDirection/Characteristics
Pulled up to Programmable V_adj by 4.7k Ω.TTL Output.Open-Collector Output.TTL Input (5V tolerant by clamping to 4.3V).
Discrete I/O Signal DC Characteristics
Symbol Test Conditions Limit Units
Minimum Maximum
VIH V_adj >= 2.7 V 2.0 V_adj + 0.5 V
V_adj < 2.7 V 0.65 × V_adj V_adj + 0.5 V
VIL V_adj >= 2.7 0.8 V
V_adj <= 2.0 0.35 × V_adj V
VOH IOH= -12 mA V_adj – 0.5 V
VOL IOL = 12 mA 0.4 V
SMB Trigger Output Signal
Connector Standard SMB – Front panel AT1
Signal Output tracks Discrete I/O1 – Buffered copy
SMB Trigger Input Signal
Connector Standard SMB – Front panel AT2
Signal 3.3V standard threshold levels

236 Hardware Reference
- The BusPro-I supports SCL frequencies of up to 5 MHz, but actual performance may be limited due totarget bus conditions, such as parasitic capacitance and pull-up resistance (rise-time).- Standard/Fast/Fast-mode Plus is supported for master emulation and monitoring up to 5MHz; High-Speed mode is supported for target monitoring only up to 5 MHz (no emulation).