Quantitative assays for esterified oxylipins generated by ...

1
Targeted Metabolomics of the Arachidonic Acid Casca de – Current State and Challenges of LC-MS Analysis of Oxylipins
I. Willenberg1, #, A.I. Ostermann1, # and N.H. Schebb1, 2*
1University of Veterinary Medicine Hannover, Institute for Food Toxicology and Analytical
Chemistry, Bischofsholer Damm 15, 30173 Hannover, Germany. .
2 University of Wuppertal, Institute of Food Chemistry, Gaußstraße 20, 42119 Wuppertal, Germany.
# both authors contributed equally
*Corresponding author (Tel: +49 511 856 7780 ; Fax : +49 511 856 7409 ; E-mail: [email protected])
Quantification of eicosanoids and oxylipins derived from other polyunsaturated fatty acids in biological samples is crucial for a better understanding of the biology of these lipid mediators. Moreover, a robust and reliable qu antification is necessary to monitor the effects of pharmaceutical intervention and diet on the arachidonic acid (AA) cascade, one of today’s most relevant drug targets. Low (sub-nanomolar) concentrations and a large number of structurally s imilar analytes, including regioisomers, require high chromatographic resoluti on and selective as well as sensitive MS analysis. Currently, reversed phase LC in combination with detection on sensitive triple quadrupole instruments, operating in selected reaction monitoring (SRM) mode, is dominantly used for quantitative oxy lipin analysis. A lack of standardized sample collection, handling and prepar ation procedures, degradation of the analytes during sample preparation and purity a s well as availability of standards (internal standards) are the major problems of curr ent targeted metabolomics approaches of the AA cascade. Major challenges for instrumental analytical methods are the detection of esterified oxylipins as well a s separation and individual detection of oxylipin-isomers. Solving these issues are major tasks of current bio-analytical research which would help to elevate the knowledge of the biology of lipid mediators to a higher level.
Introduction:
Lipid mediators play an important role in biology. Particularly eicosanoids (C20) and oxidative products of other long chain polyunsaturated fatty acids (PUFA) regulate a large variety of cellular and physiological functions [1]. In mammals, these oxylipins are formed enzymatically via three pathways: i) constitutively expressed cyclooxygenase 1 (COX-1) and inducible COX-2, ii) 5-, 12- and 15-lipoxygenases (LOX) as well as iii) cytochrome P450 monooxygenases (CYP), particularly CYP2J and CYP2C, and non-enzymatically by (aut)oxidation. The initially formed products can be further converted by several other enzymes, for example by microsomal prostaglandin E synthase (mPGES) or by soluble epoxide hydrolase (sEH) leading to a pleiotrop of oxylipins formed in the arachidonic acid (AA) cascade (Fig. 1). In several cases, the product pattern of the four processes overlaps. For example, 15-HETE is not only generated by 15-LOX, but also by COXs and autoxidation, with distinct differences in stereochemistry [2]. Moreover, the route of formation of several mediators has not been unveiled yet, e.g. of 18-HEPE, being the major OH-FA metabolite in several cultured cells incubated with EPA [3].
More than half of the currently sold pharmaceuticals target directly the AA cascade [4], for example non-steroidal anti-inflammatory drugs (NSAID), aspirin and selective COX-2 inhibitors (e.g. celecoxib), or 5-LOX inhibitors and leukotriene (LT) antagonists. About 30 years after the

2
Nobel Prize to J. Vane, S. Bergström and B. Samuelsson for the discovery of the importance of prostaglandins (PGs), the biological roles of non-classical eicosanoids and oxylipins beyond PGs and LT becomes clearer. For example, multiple hydroxylated DHA and EPA have been discovered as a new class of inflammation resolving lipid mediators [5,6]. The vasodilatory action of epoxy-FA (Fig. 1) on endothelial cells is well established and a large number of studies describe anti-inflammatory and analgesic effects, though an epoxy-FA receptor has not been discovered. While both AA as well as DHA and EPA derived epoxides share the biological activity, the effects in cancer are different, with AA derived EpETrEs promoting angiogenesis, while n3-PUFA derived epoxides suppress tumor growth [7].
In order to investigate and understand the role of the large number of different oxylipins in physiology, analytical methods are needed to quantify their levels in biological samples. The most promising strategy is the parallel quantification of a comprehensive pattern of products of the AA cascade derived from both n6-PUFA, such as AA, and n3-PUFA, such as EPA and DHA. By monitoring the activity of an enzyme or pathway of the cascade based on several products instead of only one main product, the up and down regulation of distinct pathways can be deduced with higher certainty. Moreover, routes of formation and crosstalk between the branches of the AA cascade can be unraveled [8]. Taking into account that many pharmaceuticals modulate the AA cascade, quantification of oxylipins is also crucial for the determination of in vivo target engagement of established drugs, such as aspirin, as well as new experimental drugs, such as sEH inhibitors. This article briefly summarizes the current state of LC-MS based targeted metabolomics of the AA cascade and focusses on the challenges of the quantification of oxylipins in biological matrices.
Instrumental analysis
Current targeted metabolomics LC-MS approaches of the AA cascade have impressive characteristics: One method allows the parallel analysis of 141 lipid mediators derived from different n6- and n3-FAs. Of these, 102 can be quantified against standards using 30 stable isotope labelled internal standards (IS) in a run time of only 25 min with high sensitivity (limit of detection (LOD) 0.1-1 pg on column) [9]. Several other approaches show a similar performance, e.g. parallel quantification of 104 oxylipins with the use of 11 IS in 26 min and LODs between 1.8 and 340 pg on column [10], or quantification of 88 analytes (6 IS) in 21 min and LOQs between 0.06 and 15.96 pg on column [4,11,12]. For methods established in other labs the total number of covered analytes is not clear since the articles are focused on groups of analytes, e.g. resolvins, or only report oxylipins above the LOQ [13,14,5]. However, analysis times (of about 25 minutes) and sensitivities (LODs between 0.01 and 0.21 pg on column) are comparable [13,14,5].
All of these methods employ reversed phase (RP) LC coupled to a highly sensitive triple-quadrupole (QqQ) (MS) instrument using negative electrospray ionization of the slightly acidic analytes (fatty acid derivatives). For the analysis of oxylipins in biological samples the following challenges have to be addressed by the LC-MS method: (i) low (<nM) concentration of the analytes, (ii) huge concentration differences between the lowest and the highest abundant oxylipin within a single sample (>103-fold), requiring a broad linear detector response [15,16], (iii) correct identification of the LC-MS peaks and (iv) simultaneous quantification of a multitude of chemically and structurally similar analytes with numerous isomers present in all samples, e.g. regioisomers of hydroxy-FAs or PGE2 and PGD2 (Fig. 1). While the sensitivity and linear detector response of modern QqQ-MS fulfill the demands of i-ii, the identity confirmation of the analytes (iii) requires obtaining meaningful fragment spectra [17,14]. Since all oxylipins can occur in form of several isomers, identification only by retention time and selected reaction monitoring (SRM) of the analyte’s transition can lead to false conclusions. That is why many groups employ QTRAP instruments for oxylipin analysis, allowing operating the second

3
analytical quadrupole as linear ion trap to obtain high quality fragment spectra. Selective detection (iv) requires both, a highly efficient chromatographic separation and detection in SRM mode. This can be demonstrated for the analysis of 8-, 9- and 12-HETE (Fig. 1-2). Despite high chromatographic resolution using a modern <2µm particle filled column, 8- and 12-HETE coelute. As a consequence, quantification can only be achieved by detecting unique fragment ions in SRM. For 9- and 12-HETE it is the other way round: The MS/MS spectra of both compounds are very similar and provide no specific SRM transitions. Therefore, these OH-FAs have to be separated chromatographically.
The narrow oxylipin peaks resulting from today’s LC-methods require rapid switching times and sensitivity at short dwell times of the MS. In order to keep cycle times of the MS short, but simultaneously providing enough data points per peak, all current methods use software assisted features like scheduled or dynamic multiple reaction monitoring (MRM). Nevertheless, narrow elution windows of a large number of analytes still require dwell times of less than 10 ms. In the future it will be interesting if other MS detector types will enter the field of targeted oxylipin analysis. However, since high resolution MS (HRMS) could improve signal to noise ratio, but does not allow distinguishing the numerous constitution isomers, detection in SRM mode is mandatory for this analysis. It will be interesting if modern qTOF instruments could provide sufficient sensitivity and linear detector response. For the orbitrap instruments, the major question is if the cycle time for SRM detection could be short enough for quantification of the narrow LC peaks. The first report about oxylipin analysis by using an orbitrap instrument is promising: The comparison of the quantitative performance between orbitrap and a QqQ-MS showed similar results with respect to linear detection ranges, with LODs for the orbitrap ranging between 10 and 30 pg of the oxylipins [18]. If these instruments proof to keep up with the rapid, sensitive and robust quantification of QqQ-MS, the combination of quantification with HRMS and continous detection of fragment spectra would elevate instrumental oxylipin analysis to a new level.
Aside from improvements on side of the LC-MS instruments, derivatization could lead to better separation efficacy and particularly MS detection. Gelb and coworkers introduced a derivatization strategy which converts the carboxy moiety of the oxylipins to an amide with positively charged N-(4-aminomethylphenyl) pyridinium (AMPP) [19], enabling detection in positive ESI mode. This strategy could also enhance sensitivity on today´s instruments, though they have a more efficient ion transmission in negative ESI compared to the instruments used by Gelb and coworkers.
Derivatization to pentafluorobenzyl (PFB) esters was used by Blair and Coworkers allowing efficient normal phase chiral separation of oxylipins (see below). Furthermore, dedicated ion formation by electron capture atmospheric pressure chemical ionization (APCI) increased both selectivity and sensitivity due to decreased background signals [2]. APCI is generally recognized to be less prone for matrix effects compared to ESI. Hence, a similar derivatization is promising to circumvent the massive problems occurring from ion suppression in RP-LC-ESI(-)-MS of oxylipins in biological samples [12]. New derivatization agents together with specific ionization, e.g. electrochemistry-assisted ionization [20], or novel ionization techniques, like dielectric barrier discharge ionization-MS [21], could further improve selectivity, sensitivity and robustness of oxylipin detection by mass spectrometry in the future.
Sample preparation
Extraction of free oxylipins from a biological matrix like plasma or tissues is not trivial. The analytes have a broad polarity range and are prone to degradation by autoxidation (all oxylipins) as well as base (PGs) or acid (epoxy-FA) treatment. Yet, when analyte concentrations are well above the LOQ of the instrument – which is rarely the case – it is possible to directly inject the sample after dilution/protein precipitation with/by organic solvents. However, most analyses require pre-concentration. For this purpose liquid-liquid extractions

4
(LLE) [22] or most frequently solid phase extractions (SPE) [14,13,10,4,9] are used. By contrast to similar instrumental analyses of oxylipins, SPE protocols differ considerably from lab to lab. The employed stationary phases range from RP-18 [14] and mixed mode phases with RP-8 and anion exchange properties [13] to polymeric phases [9,10,4]. As it can be expected, these methods have a dissimilar performance leading to different oxylipin patterns for the same sample, particularly for epoxy-FAs (Fig. 3) [12]. The ESI-interfering matrix in plasma is most efficiently removed by specific SPE procedures utilizing anion exchange stationary phases [13] (carboxy acid moiety of the oxylipins) or polar and non-polar washing steps (water and n-hexane) prior elution of the medium to non-polar oxylipins by methyl formiate on the C-18 column [14]. It is interesting that the latter procedure on classical RP material overall outperforms the other protocols, with respect to recovery of IS, reduction of ion suppressing matrix and extraction efficacy of oxylipins from the biological matrix (Fig. 3). It would be interesting to explore if the performance could be further improved by using the elution procedure (water followed by n-hexane and elution with methyl formiate) on a modern polymeric stationary phase with embedded polar groups.
An adequate sample preparation which eliminates as much matrix as possible is essential since insufficient removal of interfering matrix compounds is highly problematic for quantitative oxylipin analysis: In all methods, a single internal standard (IS) is used for a whole group of structurally similar analytes eluting at different retention times. Thus, the IS cannot compensate for all matrix effects, leading to matrix dependent over- and under-calculations of the oxylipin concentration. In addition to further optimization of the sample preparation procedures, the availability and use of more heavy isotope labeled IS would largely improve robustness, accuracy and precision of oxylipin analysis in biological samples.
(Biological) variation of oxylipin concentration
Current reports about human serum and plasma oxylipin concentrations document strong (interindividual) variations between samples from different subjects [15,23]. These variations hamper the recognition of biologically significant differences in lipid mediator levels between groups of different (patho)physiological conditions. Moreover, significant effects of pharmacological or nutritional intervention can vanish within high standard deviations/standard errors. Part of the variation is obviously based on biological differences, e.g. different habits of human subjects. For example physical exercise elicits changes in the systemic levels of epoxy- and dihydroxy-FAs [24]. Little is known about the changes in oxylipins during the circadian rhythm; however it is clear that the nutritional status strongly affects the levels of circulating lipids and lipid mediators. Even a single moderate dose of n3-PUFA causes changes in plasma hydroxy-, epoxy- and dihydroxy-FA levels [25]. Thus, sample collection from human subjects should be carried out as standardized as possible (e.g. fixed fasting period, day time, physical activity).
Another major problem contributing to poor precision in the analysis of biological samples is the formation and degradation of oxylipins after sample collection. Even short storage of blood before further processing has massive effects on the plasma concentration of several oxylipins (Figure 4). Moreover, if the sample sits for few minutes in the centrifuge, after centrifugation and before the plasma is collected and frozen, the levels of some oxylipins are significantly reduced (Supplementary Information, SI). Furthermore, prolonged storage in the freezer can also lead to degradation and loss of the analytes as shown for several DHA and EPA derived resolvins and prostanoides [5]. In few studies COX and sEH inhibitors as well as protease and esterase inhibitors are added to the samples to prevent enzymatic formation/degradation [26]. More frequently antioxidants, such as radical scavenging butylated hydroxytoluene (BHT) and chelating ethylenediaminetetraacetic acid (EDTA) are used to prevent oxylipin degradation or formation (e.g. 11-HETE, 9-HETE, isoprostanes) by autoxidation during sample preparation [26,11,10,4]. However, the benefit of these procedures has not been systematically evaluated for a comprehensive set of oxylipins so far. Overall, artificial (ex vivo) formation/degradation of

5
the lipid mediators is one of the major challenges in the analysis of biological samples which can only be addressed by tight standard operating procedures (SOPs) including rapid sample processing and optimized storage conditions (-80 °C, short time). Only for few oxylipins, ex vivo formation/degradation can be excluded/measured by additional determination of their endogenously formed metabolites, e.g. 11-dehydro-TxB2 [27] together with TxB2 or bicycloprostaglandin E2 as stable degradation product of PGE2 [28].
Plasma or serum?
Both, plasma as well as serum should be regarded as appropriate matrices for quantitative oxylipin analysis of circulating oxylipins [5,16]. In case of plasma, the anticoagulant should be chosen carefully: EDTA seems to be the best choice since for example heparin is known to cause artifacts [29]. For serum it has to be kept in mind that coagulation is in part mediated by the AA cascade and causes massive (ex vivo) formation of several oxylipins such as TxB2 and 12-HETE (Fig. 1). Moreover, detectability of low concentrated mediators, such as resolvins is improved [5]. Regarding variability, it remains to be evaluated if plasma or serum allows the determination of oxylipin concentrations in blood with a higher precision.
Accuracy and inter-lab comparability
In addition to high intersample variations, huge differences between the mean concentrations of the lipid mediators were found in different studies, e.g. for human plasma or serum (summarized in [15]). This indicates that the accuracy of current methods is a further problem. Because of the above summarized difficulties of oxylipin analysis and their nature as endogenously formed lipid mediators (biomarkers), validation procedures as suggested for drugs, e.g. by European Medicines Agency (EMA), are not or only in part applicable. With respect to accuracy, current methods determined for example the recovery in spiked plasma [10] or in (matrix free) saline phosphate buffer [4]. Interestingly, others failed to recover oxylipins from buffer, probably because of low solubility of the oxylipins in the aqueous solution [10]. Regardless how rigid recovery rates in (spiked) quality control samples are determined, the quantification relies on the availability and purity of reference standards. In most cases these compounds have to be synthetized or are obtained commercially (currently from a single company). For the latter, the affordable quantities are so low that purity cannot be checked by classical chemical methods. Thus, a mistake in the concentration provided by the manufacturer directly leads to systemical errors. Matching LC-MS response from batch to batch and comparing peak areas of regioisomers in selected ion monitoring mode under isocratic LC conditions are the only possibilities to verify the plausibility of manufacturer information. In order to improve quality of the results in the future it would be important to agree on criteria which have to be fulfilled for a fit-for-purpose-validation in oxylipin analysis. Together with an exchange of samples, standards between groups and inter-laboratory tests this would help to improve comparability.
The free, the bound, and the total…
– or the analytical challenge in detecting esterif ied oxylipins
Although a significant portion of oxylipins is incorporated in lipids, it is believed that their paracrine and autocrine action is mainly mediated by their free, i.e. non-esterified form [16]. The esterified (bound) oxylipins can readily be liberated, e.g. by phospholipases [30]. In plasma, the concentrations of esterified epoxy-FAs and hydroxy-FAs exceed the concentrations of the free ones about 50 to 350-fold and 10 to 40-fold, respectively [16,13]. Esterified oxylipins are commonly quantified following saponification (base hydrolysis) [13,31,32,16,33]. For this purpose, the samples are incubated with sodium hydroxide (1.00-

6
3.75 M) either overnight at 4 °C [31] or at 60 °C for 20-30 min [13,16]. Other methods incubate the extracted lipids with 0.1 M sodium carbonate at 4 °C overnight [33] or perform transesterification of lipids to methyl esters (0.35 M sodium methoxide solution for 60 min at 60 °C) following hydrolysis by the addition of water (60 min) [32]. The performance of the different cleavage-protocols has not been systematically compared up to now. However, alkaline treatment degrades a large number of oxylipins, particularly PGs, e.g. β-hydroxy-keto prostanoids, such as PGE2, PGD2, or thromboxanes [32,31] and thus information on their concentration is lost. Harsh alkaline treatment could even lead to the formation of conjugated FAs from PUFA [34] and thus is prone to produce artifacts of the polyunsaturated analytes. On the contrary, a moderate saponification could lead to incomplete liberation of esterified oxylipins. All current cleavage techniques lead to the sum of free and esterified oxylipins and provide no information on how the analytes are bound in the samples. Yet, it is highly relevant, if a mediator is bound to the sn2-position of a phospholipid of the cell membrane, rapidly releasable by phospholipases upon inflammatory stimuli or if it is bound in a triacylglyceride (fat) with unknown biological fate. One way of addressing this issue would be to separate the different lipid classes of a lipid extract prior hydrolysis, as commonly carried out for fatty acid analysis [35]. Another possibility is the direct detection of the esterified oxylipin, as recently successfully carried out, e.g. for C16:0/12-HETE-phosphatidylethanolamine [36] Combining all oxylipins and possible lipids, a fairly large number of analytes results. Thus, the integration of targeted oxylipin metabolomics in lipidomics is doubtlessly one of the biggest challenges for analytical chemistry of oxylipins. However, the low (total) concentration of the lipid mediators makes it questionable if the sensitivity of today´s instruments is sufficient for their detection if they are distributed in several individually detected lipids.
Detection of stereoisomers
A major task for instrumental analytical methods, which is timely to be addressed, is the differentiation between stereochemical configurations. Cis-trans isomers of epoxides (Fig. 1) can be well resolved by RP chromatography. The enzymatically formed cis-isomers elute first, followed by the trans-epoxides formed by (aut)oxidation [37] (same SRM transition as the cis-isomer, eluting 1-3 min later). Though considerably large peaks of trans-epoxides are found in biological samples, particularly after conjugate cleavage, these metabolites are not included in most current methods. Thus, the concentrations of trans-epoxides are not evaluated, which makes it impossible to assess their role as lipid mediators. Particularly the timely question weather and to which extend trans-epoxy-FAs contribute to the biological effects associated to cis-epoxy-FAs cannot be evaluated.
The robust and efficient RP chromatography fails to separate formed enantiomers. Thus, for example the lipid mediator referred to as 14(15)-EpETrE (or 14(15)-EET), is not only one, but in fact 4 compounds which are generated via CYP conversion as well as (aut)oxidation processes and can be hydrolyzed by sEHi at isomer specific rates [37] (Fig. 1). Besides the epoxides, almost all oxylipins are chiral with more or less (understood) biological activity.
While enzymatic routes form products at a distinct enantiomer ratio, aut(oxidation) processes result in the formation of racemats. Therefore, the application of chiral separation can be very helpful to differentiate between the varying routes of formation. Moreover, in several cases, different enzymatic routes of formation can be distinguished based on the enantiomer ratio, e.g. (±)15-HETE (Fig. 1). While the formation of 15-(S)-H(p)ETE is catalyzed by 15-LOX, 15(R)-H(p)ETE is formed by aspirin acetylated COX-2 [2]. As demonstrated for this example, chiral separation would greatly assist to unravel the route of formation of the lipid mediators which is poorly understood for several oxylipins, e.g. for the dominantly formed and bioactive 18-HEPE (Fig. 1). Several chiral chromatographic separation methods have been developed as recently summarized by Mesaros and Blair [19]. However, since current chiral-LC cannot keep up with the robustness and (overall) separation power of RP chromatography, they are comparably rarely used. Thus, targeted oxylipin metabolomics would massively benefit from

7
progress in chiral LC-MS approaches [38]. A promising further tool for enantiomer separation might be ion mobility spectrometry using a chiral modifier [39] at the front end of the MS or (chiral) supercritical fluid chromatography. Taking all challenges for instrumental analytical chemistry mentioned in this article together, the integration of chiral separation in the routinely used targeted metabolomics platforms would have the largest impact on our understanding of the biology of oxylipins. With the data resulting from these methods at hand, one could not only monitor the activity of distinct enzymatic and (aut)oxidative pathways in vivo, but also identify the biologically most active isomers.
Outlook
Highly sensitive LC-MS methods have been developed which allow gaining an impressive understanding about the biological importance of the lipid mediators formed in the AA cascade. However, numerous questions remain to be answered, e.g. unraveling the mechanisms of the effects of dietary n3-PUFA intake on human health. The comprehensive investigation of hydroxy-n3-PUFAs, resolvins and n3-epoxides by methods summarized in this article, could be the key to address this question.
With today´s “ultra-high-performance” liquid chromatography and high end QqQ-MS the instrumentation for highly sensitive and specific detection of oxylipins is available. Moreover, new HRMS instruments entering the field may cause a revolution of targeted lipid mediator analysis. With the help of these instruments it is easy to generate peaks, areas and numbers. However, it will still be a challenge to get meaningful results, i.e. accurate concentrations in biological samples. Particularly, the optimization of sample collection, stabilization and preparation seem to be timely. With respect to the instrumental analysis the greatest challenges are the differential detection of stereoisomers and the analysis of esterified oxylipins. In order to foster this progress in the field of targeted oxylipin metabolomics, it is crucial that analytical chemistry is regarded as an integral part of the medical/biological research. Thoroughly developed methods and their continuous improvement require time and (grant) money. Though, not all method developments may address fundamental scientific questions (such as the detection of esterified oxylipins), in particular improvements on sample preparation, a fit-for-purpose validation and interlab comparison seem to be of high importance for the field.
Acknowledgements
Our work is supported by the Fonds der Chemischen Industrie, the German Research Foundation (DFG, Grant SCHE 1801) and the European Union (Grant CIG 293536).
8
References
1. Buczynski MW, Dumlao DS, Dennis EA (2009) Thematic Review Series: Proteomics. An integrated omics analysis of eicosanoid biology. J Lipid Res 50 (6):1015-1038. 2. Mesaros C, Blair IA (2012) Targeted Chiral Analysis of Bioactive Arachidonic Acid Metabolites Using Liquid-Chromatography-Mass Spectrometry. Metabolites 2:337-365. 3. Ostermann AI, Willenberg I, Weylandt KH, Schebb NH (2014) Development of an Online-SPE–LC–MS/MS Method for 26 Hydroxylated Polyunsaturated Fatty Acids as Rapid Targeted Metabolomics Approach for the LOX, CYP, and Autoxidation Pathways of the Arachidonic Acid Cascade. Chromatographia DOI 10.1007/s10337-014-2768-8. 4. Yang J, Schmelzer K, Georgi K, Hammock BD (2009) Quantitative profiling method for oxylipin metabolome by liquid chromatography electrospray ionization tandem mass spectrometry. Anal Chem 81 (19):8085-8093. 5. Colas RA, Shinohara M, Dalli J, Chiang N, Serhan CN (2014) Identification and signature profiles for pro-resolving and inflammatory lipid mediators in human tissue. Am J Physiol Cell Physiol. 6. Serhan CN, Dalli J, Colas RA, Winkler JW, Chiang N (2014) Protectins and maresins: New pro-resolving families of mediators in acute inflammation and resolution bioactive metabolome. Biochim Biophys Acta. 7. Zhang G, Kodani S, Hammock BD (2014) Stabilized epoxygenated fatty acids regulate inflammation, pain, angiogenesis and cancer. Prog Lipid Res 53:108-123. 8. Yang J, Dong H, Hammock BD (2011) Profiling the regulatory lipids: another systemic way to unveil the biological mystery. Curr Opin Lipidol 22 (3):197-203. 9. Dumlao DS, Buczynski MW, Norris PC, Harkewicz R, Dennis EA (2011) High-throughput lipidomic analysis of fatty acid derived eicosanoids and N-acylethanolamines. Biochim Biophys Acta 1811 (11):724-736. 10. Strassburg K, Huijbrechts AM, Kortekaas KA, Lindeman JH, Pedersen TL, Dane A, Berger R, Brenkman A, Hankemeier T, van Duynhoven J, Kalkhoven E, Newman JW, Vreeken RJ (2012) Quantitative profiling of oxylipins through comprehensive LC-MS/MS analysis: application in cardiac surgery. Anal Bioanal Chem 404 (5):1413-1426. 11. Inceoglu B, Wagner KM, Yang J, Bettaieb A, Schebb NH, Hwang SH, Morisseau C, Haj FG, Hammock BD (2012) Acute augmentation of epoxygenated fatty acid levels rapidly reduces pain-related behavior in a rat model of type I diabetes. Proc Natl Acad Sci U S A 109 (28):11390-11395. 12. Ostermann AI, Willenberg I, Schebb NH (2014) Comparison of sample preparation methods for the quantitative analysis of eicosanoids and other oxylipins in plasma by means of LC-MS/MS. under review, ABC-01929-2014. 13. Fischer R, Konkel A, Mehling H, Blossey K, Gapelyuk A, Wessel N, von Schacky C, Dechend R, Muller DN, Rothe M, Luft FC, Weylandt K, Schunck WH (2014) Dietary omega-3 fatty acids modulate the eicosanoid profile in man primarily via the CYP-epoxygenase pathway. J Lipid Res 55 (6):1150-1164. 14. Yang R, Chiang N, Oh SF, Serhan CN (2011) Metabolomics-lipidomics of eicosanoids and docosanoids generated by phagocytes. Curr Protoc Immunol Chapter 14:Unit 14 26. 15. Schuchardt JP, Schmidt S, Kressel G, Dong H, Willenberg I, Hammock BD, Hahn A, Schebb NH (2013) Comparison of free serum oxylipin concentrations in hyper- vs. normolipidemic men. Prostag Leukotr Ess 89 (1):19-29. 16. Schebb NH, Ostermann AI, Yang J, Hammock BD, Hahn A, Schuchardt JP (2014) Comparison of the effects of long-chain omega-3 fatty acid supplementation on plasma levels of free and esterified oxylipins. Prostag Oth Lipid M. 17. Harkewicz R, Fahy E, Andreyev A, Dennis EA (2007) Arachidonate-derived dihomoprostaglandin production observed in endotoxin-stimulated macrophage-like cells. J Biol Chem 282 (5):2899-2910. 18. Masoodi M, Eiden M, Koulman A, Spaner D, Volmer DA (2010) Comprehensive Lipidomics Analysis of Bioactive Lipids in Complex Regulatory Networks. Anal Chem 82 (19):8176-8185.

9
19. Bollinger JG, Thompson W, Lai Y, Oslund RC, Hallstrand TS, Sadilek M, Turecek F, Gelb MH (2010) Improved Sensitivity Mass Spectrometric Detection of Eicosanoids by Charge Reversal Derivatization. Anal Chem 82 (16):6790-6796. 20. Seiwert B, Karst U (2008) Ferrocene-based derivatization in analytical chemistry. Anal Bioanal Chem 390 (1):181-200. 21. Gilbert-Lopez B, Geltenpoth H, Meyer C, Michels A, Hayen H, Molina-Diaz A, Garcia-Reyes JF, Franzke J (2013) Performance of dielectric barrier discharge ionization mass spectrometry for pesticide testing: a comparison with atmospheric pressure chemical ionization and electrospray ionization. Rapid Commun Mass Spectrom 27 (3):419-429. 22. Fromel T, Jungblut B, Hu J, Trouvain C, Barbosa-Sicard E, Popp R, Liebner S, Dimmeler S, Hammock BD, Fleming I (2012) Soluble epoxide hydrolase regulates hematopoietic progenitor cell function via generation of fatty acid diols. Proc Natl Acad Sci U S A 109 (25):9995-10000. 23. Nording ML, Yang J, Georgi K, Hegedus Karbowski C, German JB, Weiss RH, Hogg RJ, Trygg J, Hammock BD, Zivkovic AM (2013) Individual variation in lipidomic profiles of healthy subjects in response to omega-3 Fatty acids. PLoS One 8 (10):e76575. 24. Giordano RM, Newman JW, Pedersen TL, Ramos MI, Stebbins CL (2011) Effects of dynamic exercise on plasma arachidonic Acid epoxides and diols in human volunteers. Int J Sport Nutr Exerc Metab 21 (6):471-479. 25. Schuchardt JP, Schneider I, Willenberg I, Yang J, Hammock BD, Hahn A, Schebb NH (2014) Increase of EPA-derived hydroxy, epoxy and dihydroxy fatty acid levels in human plasma after a single dose of long-chain omega-3 PUFA. Prostaglandins Other Lipid Mediat 10.1016/j.prostaglandins.2014.03.001. 26. Balvers MGJ, Verhoeckx KCM, Bijlsma S, Rubingh CM, Meijerink J, Wortelboer HM, Witkamp RF (2012) Fish oil and inflammatory status alter the n-3 to n-6 balance of the endocannabinoid and oxylipin metabolomes in mouse plasma and tissues. Metabolomics 8 (6):1130-1147. 27. Tsikas D, Zoerner AA (2014) Analysis of eicosanoids by LC-MS/MS and GC-MS/MS: a historical retrospect and a discussion. J Chromatogr B 964:79-88. 28. Granstrom E, Hamberg M, Hansson G, Kindahl H (1980) Chemical instability of 15-keto-13,14-dihydro-PGE2: the reason for low assay reliability. Prostaglandins 19 (6):933-957. 29. Goodfriend TL, Pedersen TL, Grekin RJ, Hammock BD, Ball DL, Vollmer A (2007) Heparin, lipoproteins, and oxygenated fatty acids in blood: a cautionary note. Prostaglandins Leukot Essent Fatty Acids 77 (5-6):363-366. 30. Shearer GC, Newman JW (2009) Impact of circulating esterified eicosanoids and other oxylipins on endothelial function. Current Atherosclerosis Reports 11 (6):403-410. 31. Shearer GC, Harris WS, Pedersen TL, Newman JW (2010) Detection of omega-3 oxylipins in human plasma and response to treatment with omega-3 acid ethyl esters. J Lipid Res 51 (8):2074-2081. 32. Gladine C, Newman JW, Durand T, Pedersen TL, Galano JM, Demougeot C, Berdeaux O, Pujos-Guillot E, Mazur A, Comte B (2014) Lipid profiling following intake of the omega 3 fatty acid DHA identifies the peroxidized metabolites F4-neuroprostanes as the best predictors of atherosclerosis prevention. PLoS One 9 (2):e89393. 33. Morisseau C, Inceoglu B, Schmelzer K, Tsai HJ, Jinks SL, Hegedus CM, Hammock BD (2010) Naturally occurring monoepoxides of eicosapentaenoic acid and docosahexaenoic acid are bioactive antihyperalgesic lipids. J Lipid Res 51 (12):3481-3490. 34. Holman RT, Burr GO (1948) Alkali Conjugation of the Unsaturated Fatty Acids. Arch of Biochem 19 (3):474-482. 35. Kaluzny MA, Duncan LA, Merritt MV, Epps DE (1985) Rapid separation of lipid classes in high yield and purity using bonded phase columns. J Lipid Res 26 (1):135-140. 36. Morgan AH, Hammond VJ, Morgan L, Thomas CP, Tallman KA, Garcia-Diaz YR, McGuigan C, Serpi M, Porter NA, Murphy RC, O'Donnell VB (2010) Quantitative assays for esterified oxylipins generated by immune cells. Nat Protoc 5 (12):1919-1931. 37. Jiang HL, McGiff JC, Quilley J, Sacerdoti D, Reddy LM, Falck JR, Zhang F, Lerea KM, Wong PYK (2004) Identification of 5,6-trans-epoxyeicosatrienoic acid in the phospholipids of red blood cells. Journal of Biological Chemistry 279 (35):36412-36418.
10
38. Ward TJ, Ward KD (2010) Chiral separations: fundamental review 2010. Anal Chem 82 (12):4712-4722. 39. Kanu AB, Dwivedi P, Tam M, Matz L, Hill HH, Jr. (2008) Ion mobility-mass spectrometry. J Mass Spectrom 43 (1):1-22. Figure Captions Figure 1: Illustrative overview about the AA cascade, randomly highlighting few metabolites in order to illustrate analytical challenges. It should be noted that the product pattern is not representative and the effects on biological function are highly simplified (for a more comprehensive figure of AA metabolites refer to [1,10].
Figure 2: Separation of regioisomers of hydroxy-AA (8-, 9- and 12-HETE) by means of RP-18 LC and ESI-MS/MS. (A) Co-elution of 8- and 12-HETE which can be detected independently, based on specific SRM transitions. (B) Chromatographic separation of 9- and 12-HETE. Both show interfering SRM transitions because of almost identical collision induced dissociation MS/MS spectra of their [M-H+]- ions (C).
Figure 3 : Concentrations of selected oxylipins in pooled human EDTA plasma using different well established solid phase extraction (SPE) methods for sample preparation: (A) prostanoides and hydroxy-FA of AA and (B) dihydroxy-FA and epoxy-FA of AA and DHA. All results are shown as mean ± SD (n=5). The following protocols were used: SepPak – C18 phase, washing with water and n-hexane, elution with methyl formiate [14]; AnionEx – C8 phase with anion exchange properties, washing with methanol/water (v:v, 1:1), elution with ethyl acetate/n-hexane (75:25) [13]; StrataX – polymeric phase with polar groups washing with 10% methanol, elution with methanol [9]; Oasis – polymeric phase with polar groups, washing with 5% methanol acidified with 0.1% acetic acid, subsequent elution with methanol and ethyl acetate [4].Instrumental analysis was carried out as described [11,4]. The complete evaluation of the performance of the procedures can be found in [12].
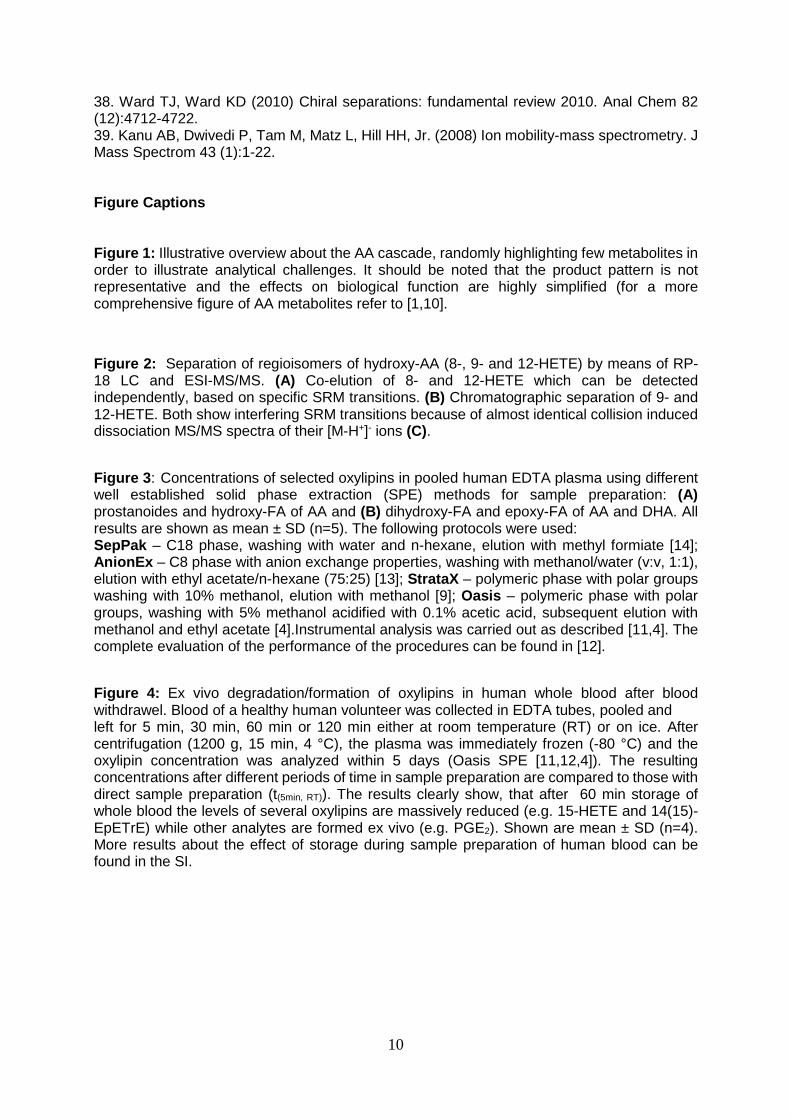
Figure 4: Ex vivo degradation/formation of oxylipins in human whole blood after blood withdrawel. Blood of a healthy human volunteer was collected in EDTA tubes, pooled and left for 5 min, 30 min, 60 min or 120 min either at room temperature (RT) or on ice. After centrifugation (1200 g, 15 min, 4 °C), the plasma was immediately frozen (-80 °C) and the oxylipin concentration was analyzed within 5 days (Oasis SPE [11,12,4]). The resulting concentrations after different periods of time in sample preparation are compared to those with direct sample preparation (t(5min, RT)). The results clearly show, that after 60 min storage of whole blood the levels of several oxylipins are massively reduced (e.g. 15-HETE and 14(15)-EpETrE) while other analytes are formed ex vivo (e.g. PGE2). Shown are mean ± SD (n=4). More results about the effect of storage during sample preparation of human blood can be found in the SI.

PGE2
PGE3
E-resolvinsD-resolvins
D-protectins
12-HpETE
12-HpEPE14-HpDHA
14,15-DiHETrE(4 isomers)
anti-platelet aggregation
vasodilation
PGI2
COOH
AACOOH
EPA
COOH
DHA
COOH
OR1 R2
O
R1 R2
O
COOH
O
or
14(S),15(R)-EpETrE 14(R),15(S)-EpETrE
or
14(S),15(S)-EpETrE 14(R),15(R)-EpETrE
trans-epoxides cis-epoxides
COOH
O
19(20)-EpDPE
EpETEsvasodilatory
anti-angiogenic
vasodilatory, anti-inflammatory
angiogenic, analgetic
vasoconstrictory
COOH
OH
20-HETE
PGH2
COOH
OH
O
HO
pain, fever, inflammation
O
COOH
OH
O
platelet activation
TxA2
TxA3
TxB2
TxB3
PG
IS
OH
OCOOH
6-keto-PFG1α
Δ17 6-keto-PFG1α
PGI3
PGH3COOH
OH
15-(S)-HETE17-(S)-HDHA
15-HEPE
15-(R)-HETE17-(R)-HDHA
18-HEPE
5-HpETE5-HpEPE
4/7-HpEPE
5-LOX
LTA4
LTB4chemoattractant
pro-inflammatory
lipoxins
LTC4
COOH
OH OH
COOH
OH
COOHOH
12-HETE
12-HEPE
14-HDHA
5-(S)-HETE5-HEPE
4/7-HDHA
5-iso-PGF2α-VI
IsoprostanesNeuroprostanes
inflammation resolving
COOH
OHHO
vasodilatory
11-dehyro-TxB2
11-dehydro-TxB3
HETEs (e.g. 9-HETE)
HEPEs (e.g. 18-HEPE)HDHAs (e.g. 20-HDHA)
O
O
COOH
bicyclo PGE2
R1
O R2
R1
O R2 COOH
HO
HO OH
Fig. 1

Fig. 2
15.0 15.50
50
100
time (min)
12-HETE
14.5 15.0 15.50
50
100
rela
tive in
ten
sit
y (
%)
time (min)
8-HETEm/z 319
12-HETEm/z 319
9-HETE
m/z 155
m/z 179
100 150 200 250 300
0
100
rela
tive in
ten
sit
y(%
)
m/z (Da)
9-HETE(A) (B) (C)
167179
257
237279
0
100
167179
257
237
279
12-HETE
COOH
OH
COOH
HO

0.25
0.50
3.00
4.00
6.00
pla
sm
aco
nc
[nM
]
0.25
0.50
0.75
1.00
1.25SepPak
StrataX
AnionEx
Oasis
(A) (B)
Fig. 3
(%)
of
co
ncen
trati
on
at
t (5 m
in,
RT
)
50
100
150
200
2505 min, RT5 min, ice
30 min, RT30 min, ice
60 min, RT60 min, ice
120 min, RT120 min, ice
Fig. 4

0
100
200
300
Fig. S1: Ex vivo degradation/formation of TxB2, prostaglandins (PGs) and trihomes in human whole blood after blood withdrawal. Blood of a healthy human volunteer was collected in EDTA tubes, pooled and left for 5 min, 30 min, 60 min or 120 min either at room temperature (RT) or on ice. After centrifugation (1200 x g, 15 min, 4 °C), the plasma was immediately frozen (-80 °C) and the oxylipinconcentration was analyzed within 5 days (Oasis SPE, [4]). The resulting concentrations after different periods of time in sample preparation are compared to those with direct sample preparation (t(5 min, RT)). In comparison to 5 min storage at RT the concentration of the PGs was significantlydecreased already 5 min after storage on ice. After 30 min (ice and RT) the PG levels wereincreased before they finally decreased again after 60 min. The concentrations of TxB2, 20-COOH-LTB4 and trihomes were stable up to 120 min either on ice or at RT. Shown are mean ± SD (n=4).
5 min, RT5 min, ice
30 min, RT30 min, ice
60 min, RT60 min, ice
120 min, RT120 min, ice
(%)
of
con
cen
trat
ion
att (5
min
, RT
)

0
50
100
5 min, RT5 min, ice
30 min, RT30 min, ice
60 min, RT60 min, ice
120 min, RT120 min, ice
0
50
100
Fig. S2: Ex vivodegradation/ formation of diolsin human whole blood after blood withdrawal. Blood of a healthy human volunteer was collected in EDTA tubes, pooled and left for 5 min, 30 min, 60 min or 120 min either at room temperature (RT) or on ice. After centrifugation (1200 x g, 15 min, 4 °C), the plasma was immediately frozen (-80 °C) and the oxylipinconcentration was analyzed within 5 days (Oasis SPE, [4])The resulting concentrations after different periods of time in sample preparation are compared to those with direct sample preparation (t(5 min,
RT)). Shown aremean ± SD (n=4).
(%)
of
con
cen
trat
ion
att (5
min
, RT
)(%
) o
fco
nce
ntr
atio
nat
t (5 m
in, R
T)

0
50
100
150
5 min, RT5 min, ice
30 min, RT30 min, ice
60 min, RT60 min, ice
120 min, RT120 min, ice
0
50
100
Fig. S3: Ex vivodegradation/ formation of epoxides in human whole blood after blood withdrawal. Blood of a healthy human volunteer was collected in EDTA tubes, pooled and left for 5 min, 30 min, 60 min or 120 min either at room temperature (RT) or on ice. After centrifugation (1200 x g, 15 min, 4 °C), the plasma was immediately frozen (-80 °C) and the oxylipinconcentration was analyzed within 5 days (Oasis SPE, [4]). The resulting concentrations after different periods of time in sample preparation are compared to those with direct sample preparation (t(5 min, RT)). The concentrations of11(12)- and 14(15)-EpETrE were halvedafter 60 min of storageeither on ice or at RT. The other epoxides werenot affected up to 120 min of storage. Shownare mean ± SD (n=4).
(%)
of
con
cen
trat
ion
att (5
min
, RT
)(%
) o
fco
nce
ntr
atio
nat
t (5 m
in, R
T)

0
50
100
5 min, RT5 min, ice
30 min, RT30 min, ice
60 min, RT60 min, ice
120 min, RT120 min, ice
0
50
100
Fig. S4: Ex vivodegradation/ formation of alcohols in human whole blood after blood withdrawal. Blood of a healthy human volunteer was collected in EDTA tubes, pooled and left for 5 min, 30 min, 60 min or 120 min either at room temperature (RT) or on ice. After centrifugation (1200 x g, 15 min, 4 °C), the plasma was immediately frozen (-80 °C) and the oxylipinconcentration was analyzed within 5 days (Oasis SPE, [4]). The resulting concentrations after different periods of time in sample preparation are compared to those with direct sample preparation (t(5 min, RT)). While concentrations of11- and 15-HETE halvedafter 60 min on ice or at RT, the levels of furtheralcohols were stable upto 120 min. Shown aremean ± SD (n=4).
(%)
of
con
cen
trat
ion
att (5
min
, RT
)(%
) o
fco
nce
ntr
atio
nat
t (5 m
in, R
T)
150

0
50
100
0
50
100
Fig. S5: Ex vivo degradation/ formation of alcohols (A) aswell as TxB2, prostaglandinsand trihomes (B) in freshlycentrifuged human plasma. Blood of a healthy human volunteer was collected in EDTA tubes, pooled and centrifuged (1200 x g, 15 min, 4 °C) after 5 min at roomtemperature (RT). The resulting plasma was left withthe cell pellet for 0 min, 30 min or 60 min on ice beforefreezing at -80 °C tillanalysis. Oxylipinconcentrations were analyzed within 5 days (Oasis SPE, [4]). The resulting concentrations after different periods of time in sample preparation are compared to those with direct sample preparation (t(0 min)). While the concentrations of11- and 15-HETE halved in the first 30 min after centrifugation, most otheralcohols showed no losses(A). The levels of PGE2 andPGF2α significantly decreasedin the first 30 min of storagewhile TxB2, 20-COOH-LTB4, 6-keto-PGF1αand thetrihomes showed no changesup to 60 min (B). Shown are mean ± SD (n=4).
(A)
(B)
0 min 30 min 60 min
(%)
of
con
cen
trat
ion
att (0
min
)(%
) o
fco
nce
ntr
atio
nat
t (0 m
in)

0
50
100
0 min 30 min 60 min
0
50
100
Fig. S6: Ex vivodegradation/ formation of diols (A) and epoxides(B) in freshly centrifugedhuman plasma. Blood of a healthy human volunteer was collected in EDTA tubes, pooled and centrifuged (1200 x g, 15 min, 4 °C) after 5 min atroom temperature (RT). The resulting plasma was left with the cell pellet for0 min, 30 min or 60 min on ice before freezing at -80 °C till analysis. Oxylipin concentrations were analyzed within 5 days (Oasis SPE, [4]). The resulting concentrations after different periods of time in sample preparation are compared to those with direct sample preparation (t(0 min)). The detecteddiols (A) and most of theepoxides (B) showed noor only minor lossesduring this storage. However, theconcentrations of all EpETrEs decreasedwithin the first 30 min. Shown are mean ± SD (n=4).
(A)
(B)
(%)
of
con
cen
trat
ion
att (0
min
)(%
) o
fco
nce
ntr
atio
nat
t (0 m
in)

analyte 5 min RT (pM) 5 min, ice (pM) 30 min RT (pM) 30 min, ice (pM) 60 min RT (pM) 60 min, ice (pM) 120 min RT (pM) 120 min, ice (pM)
mean SD mean SD mean SD mean SD mean SD mean SD mean SD mean SD
TxB2 392.2 ± 45.3 350.7 ± 22.3 375.3 ± 17.7 394.4 ± 27.4 391.2 ± 70.5 354.8 ± 33.3 363.0 ± 27.3 355.9 ± 42.6
PGF2α 164.6 ± 23.5 76.2 ± 6.9 180.6 ± 70.7 225.3 ± 79.7 74.2 ± 7.4 72.2 ± 3.9< LOQ (70.3)
± - 72.5 ± 3.4
PGE2 27.4 ± 3.4 15.4 ± 10.1 42.1 ± 20.1 31.9 ± 9.5 13.2 ± 6.4 10.5 ± 0.9 10.7 ± 1.4 11.4 ± 1.7
6-keto-PGF1α 206.3 ± 20.7 147.3 ± 12.5 347.0 ± 166.3 441.4 ± 236.2 142.2 ± 10.9 187.8 ± 85.5 129.6 ± 9.6 192.0 ± 42.5
20-COOH-LTB4 310.8 ± 23.7 284.7 ± 28.6 300.5 ± 37.1 305.4 ± 46.0 276.5 ± 18.1 317.7 ± 14.1 313.4 ± 8.2 307.8 ± 34.6
9,12,13-TriHOME 42610.0 ± 433.4 40336.2 ± 3574.8 43035.5 ± 2310.0 42953.5 ± 822.2 43074.5 ± 1888.0 41452.0 ± 1849.6 42914.7 ± 964.1 41698.5 ± 1757.0
9,10,13-TriHOME 1990.1 ± 36.6 1926.4 ± 246.7 2124.8 ± 172.9 1987.2 ± 77.1 1911.2 ± 117.7 1819.4 ± 63.2 1937.0 ± 41.7 1886.4 ± 158.0
9-HOTrE 2200.9 ± 103.5 2092.3 ± 158.1 2226.5 ± 57.1 2187.5 ± 31.0 2260.8 ± 143.5 2224.8 ± 40.8 2235.3 ± 66.2 2173.2 ± 59.4
13-HOTrE 1634.2 ± 108.0 1677.5 ± 121.6 1744.5 ± 68.1 1835.2 ± 131.4 1679.2 ± 194.0 1624.0 ± 76.5 1676.4 ± 95.9 1606.6 ± 52.0
20-HETE 785.1 ± 108.0 685.9 ± 195.1 726.4 ± 132.4 848.6 ± 146.9 731.7 ± 89.3 692.6 ± 93.9 876.9 ± 115.0 707.1 ± 51.0
5-HEPE 134.8 ± 5.8 131.9 ± 11.5 129.5 ± 7.6 126.2 ± 9.0 135.8 ± 12.5 139.5 ± 11.5 131.5 ± 6.0 136.6 ± 3.4
13-HODE 27428.5 ± 1177.5 26318.2 ± 1528.5 28053.2 ± 1255.3 27127.2 ± 404.2 26768.7 ± 1707.2 26375.3 ± 485.4 27401.5 ± 873.0 26364.3 ± 623.0
9-HODE 30861.3 ± 1546.6 30095.2 ± 2043.4 32013.5 ± 1276.3 30922.3 ± 591.4 30790.2 ± 1985.8 29731.1 ± 459.0 31222.3 ± 965.3 29639.9 ± 173.8
15-HETE 1233.2 ± 52.2 1315.9 ± 369.7 1492.0 ± 287.9 1180.6 ± 223.9 809.7 ± 65.1 792.0 ± 30.7 753.2 ± 19.7 741.4 ± 17.9
11-HETE 665.3 ± 48.8 550.6 ± 115.6 665.4 ± 106.8 487.1 ± 94.8 352.2 ± 23.3 342.4 ± 10.7 356.9 ± 13.1 343.4 ± 23.3
12-HETE 988.5 ± 49.1 926.5 ± 104.3 1103.9 ± 52.0 929.6 ± 60.1 912.7 ± 62.8 794.4 ± 8.4 955.6 ± 79.5 814.4 ± 66.7
15(S)-HETrE 394.6 ± 16.0 376.9 ± 21.1 418.1 ± 23.1 398.2 ± 12.9 370.1 ± 28.4 339.3 ± 13.4 386.2 ± 9.4 345.6 ± 3.1
5-HETE 1190.5 ± 56.7 1215.9 ± 195.1 1398.8 ± 198.6 1137.9 ± 110.8 1067.4 ± 74.0 1038.7 ± 14.8 1105.9 ± 9.1 1018.8 ± 16.9
15,16-DiHODE 25001.4 ± 668.0 24183.1 ± 1704.3 24578.8 ± 907.2 24783.0 ± 77.5 26114.0 ± 1384.9 25527.1 ± 674.5 25368.4 ± 466.1 24684.7 ± 248.9
9,10-DiHODE 707.7 ± 20.4 682.8 ± 53.7 683.7 ± 27.6 694.8 ± 4.9 727.3 ± 38.2 706.6 ± 19.2 708.4 ± 11.6 679.5 ± 14.0
12,13-DiHODE 675.3 ± 130.2 616.6 ± 60.0 626.6 ± 58.2 575.9 ± 106.2 650.4 ± 135.4 581.6 ± 74.5 612.2 ± 83.5 502.4 ± 100.5
17,18-DiHETE 341.3 ± 14.2 321.4 ± 21.0 326.8 ± 10.5 331.2 ± 5.5 350.5 ± 18.9 340.7 ± 7.7 342.2 ± 5.5 339.7 ± 2.9
14,15-DiHETE 48.4 ± 3.1 46.7 ± 2.2 48.1 ± 2.3 49.4 ± 2.3 53.5 ± 4.3 50.7 ± 3.6 50.5 ± 4.3 52.8 ± 4.1
11,12-DiHETE 37.1 ± 3.2 35.7 ± 2.7 34.6 ± 4.4 36.8 ± 2.1 35.7 ± 1.6 35.8 ± 1.5 38.7 ± 2.5 36.1 ± 3.7
12,13-DiHOME 22190.9 ± 591.2 21501.0 ± 1736.6 21442.2 ± 789.9 21819.0 ± 133.1 23326.1 ± 1229.5 22776.8 ± 525.6 22621.4 ± 379.2 21702.3 ± 377.9
9,10-DiHOME 10992.6 ± 341.1 10604.9 ± 560.8 10854.3 ± 310.8 10817.8 ± 168.8 10511.4 ± 692.7 10224.2 ± 206.2 10684.2 ± 315.0 10294.3 ± 228.7
19,20-DiHDPE 3911.3 ± 261.2 3769.8 ± 102.3 4057.0 ± 227.6 3896.6 ± 113.7 3584.6 ± 220.5 3485.0 ± 119.1 3857.0 ± 215.3 3685.7 ± 241.5
Tab. S1: Concentrations of oxylipins in plasma obtained from whole blood after different storage conditions. Blood of a healthy human volunteer was collected in EDTA tubes, pooled and left for 5 min, 30 min, 60 min or 120 min either at room temperature (RT) or on ice. After centrifugation (1200 x g, 15 min, 4 °C), the plasma was immediately frozen (-80 °C) and the oxylipin concentration was analyzed within 5 days (Oasis SPE, [4 ,11-12]). Shown are mean ± SD (n=4).

analyte 5 min RT (pM) 5 min, ice (pM) 30 min RT (pM) 30 min, ice (pM) 60 min RT (pM) 60 min, ice (pM) 120 min RT (pM) 120 min, ice (pM)
mean SD mean SD mean SD mean SD mean SD mean SD mean SD mean SD
14,15-DiHETrE 742.7 ± 27.2 714.1 ± 46.3 745.7 ± 25.5 752.1 ± 12.9 758.8 ± 46.8 742.1 ± 4.3 760.2 ± 20.0 739.9 ± 9.4
16,17-DiHDPE 329.3 ± 12.3 307.7 ± 17.7 322.2 ± 11.2 316.5 ± 5.5 334.0 ± 20.1 323.3 ± 10.2 336.4 ± 6.1 323.5 ± 7.5
11,12-DiHETrE 701.3 ± 70.4 631.8 ± 20.8 694.9 ± 39.8 696.4 ± 21.9 616.4 ± 40.3 612.9 ± 4.9 655.4 ± 25.0 641.5 ± 36.7
13,14-DiHDPE 299.4 ± 13.9 290.9 ± 11.5 304.4 ± 10.5 303.8 ± 6.2 306.7 ± 20.7 299.8 ± 2.1 313.3 ± 6.0 305.2 ± 6.0
10,11-DiHDPE 264.8 ± 18.7 242.1 ± 13.4 254.2 ± 9.9 254.6 ± 7.6 260.6 ± 13.4 253.9 ± 4.6 260.0 ± 9.3 246.5 ± 5.0
8,9-DiHETrE 347.4 ± 25.7 300.9 ± 11.3 344.2 ± 20.4 340.4 ± 15.8 341.7 ± 20.0 316.0 ± 18.6 345.6 ± 14.7 323.5 ± 14.9
5,6-DiHETrE 232.7 ± 6.0 228.2 ± 22.0 229.7 ± 14.6 226.3 ± 15.7 225.1 ± 16.1 204.6 ± 9.6 242.4 ± 11.4 208.2 ± 9.0
4,5-DiHDPE 425.5 ± 53.6 421.3 ± 30.5 383.9 ± 38.6 389.8 ± 53.7 463.6 ± 63.1 505.9 ± 82.8 503.1 ± 42.6 487.2 ± 51.1
9(10)-EpODE 171.4 ± 2.8 143.1 ± 30.7 140.4 ± 17.6 152.3 ± 10.5 207.0 ± 14.6 169.8 ± 20.8 162.0 ± 18.3 191.8 ± 38.7
12(13)-EpODE 203.4 ± 8.9 186.0 ± 25.8 189.4 ± 11.8 194.9 ± 13.7 230.4 ± 25.7 201.4 ± 12.9 205.2 ± 15.5 215.5 ± 30.2
19(20)-EpDPE 352.9 ± 11.2 329.2 ± 36.2 338.1 ± 4.7 327.4 ± 28.8 321.7 ± 7.5 304.0 ± 11.6 339.8 ± 29.6 315.9 ± 15.9
12(13)-EpOME 4378.6 ± 211.1 3834.2 ± 521.0 3813.0 ± 321.7 3834.9 ± 234.5 4584.6 ± 364.3 4087.4 ± 337.5 3937.9 ± 306.8 4131.8 ± 635.3
14(15)-EpETrE 175.7 ± 2.0 206.9 ± 80.5 170.8 ± 34.8 178.2 ± 33.7 108.6 ± 9.9 114.9 ± 13.7 96.9 ± 3.6 113.7 ± 11.4
9(10)-EpOME 2206.0 ± 128.8 1826.3 ± 429.4 1785.6 ± 199.6 1855.9 ± 196.5 2334.7 ± 225.2 1886.9 ± 283.3 1878.1 ± 268.1 1975.9 ± 420.4
16(17)-EpDPE 49.0 ± 4.7 46.8 ± 13.9 48.6 ± 6.6 48.3 ± 1.4 61.7 ± 8.3 54.3 ± 7.1 52.9 ± 13.3 57.4 ± 2.6
10(11)-EpDPE 123.7 ± 12.4 121.2 ± 6.1 126.7 ± 12.5 128.3 ± 9.0 128.4 ± 10.2 123.7 ± 12.1 123.0 ± 8.4 125.0 ± 13.4
11(12)-EpETrE 184.0 ± 30.9 226.3 ± 125.6 172.9 ± 47.8 195.1 ± 44.8 95.3 ± 21.4 99.2 ± 16.7 83.7 ± 8.5 110.4 ± 8.4
5(6)-EpETrE 542.6 ± 65.9 608.5 ± 149.0 532.4 ± 106.4 556.4 ± 19.4 466.7 ± 35.8 518.7 ± 43.5 373.0 ± 10.5 504.6 ± 45.5
15(16)-EpODE 4523.0 ± 156.4 4323.6 ± 368.6 4272.9 ± 191.2 4521.4 ± 34.5 4922.4 ± 315.7 4832.8 ± 219.6 4510.5 ± 155.0 4603.0 ± 171.0
Tab. S1: Continued
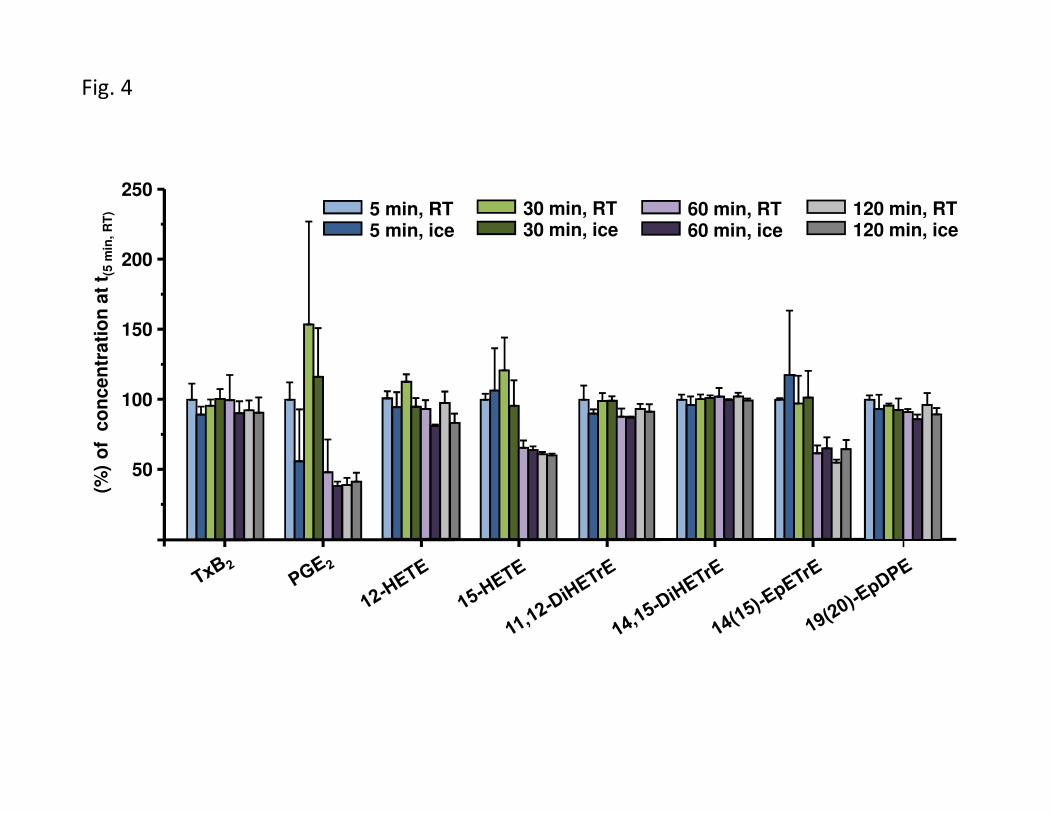
Tab. S2: Concentrations of oxylipins in freshly centrifuged plasma which was stored on ice for different periods oftime. Blood of a healthy human volunteer was collected in EDTA tubes, pooled and centrifuged (1200 x g, 15 min, 4 °C) after 5 min at room temperature (RT). The resulting plasma was left with the cell pellet for 0 min, 30 min or 60 min on ice before freezing at -80 °C till analysis. Oxylipin concentrations were analyzed within 5 days (Oasis SPE[4, 11-12]). Shown is mean (n=4) with SD.
analyte 0 min (pM) 5 min (pM) 30 min (pM)
mean SD mean SD mean SD
TxB2 392.2 ± 45.3 365.4 ± 47.3 352.2 ± 37.1
PGF2α 164.6 ± 23.5 70.3 ± 0.0 71.7 ± 2.8
PGE2 27.4 ± 3.4 15.3 ± 4.4 12.2 ± 2.9
6-keto-PGF1α 206.3 ± 20.7 180.7 ± 22.4 163.0 ± 23.4
20-COOH-LTB4 310.8 ± 23.7 352.6 ± 28.7 326.0 ± 10.3
9,12,13-TriHOME 42610.0 ± 433.4 41995.3 ± 934.9 42088.5 ± 1699.4
9,10,13-TriHOME 1990.1 ± 36.6 1821.6 ± 67.5 1860.0 ± 91.9
9-HOTrE 2200.9 ± 103.5 2189.0 ± 62.2 2219.0 ± 64.5
13-HOTrE 1634.2 ± 108.0 1678.9 ± 55.4 1659.7 ± 70.7
20-HETE 785.1 ± 108.0 745.3 ± 35.1 720.7 ± 47.7
5-HEPE 134.8 ± 5.8 145.1 ± 8.3 141.2 ± 10.4
13-HODE 27428.5 ± 1177.5 26550.6 ± 995.9 26497.1 ± 339.6
9-HODE 30861.3 ± 1546.6 30123.0 ± 1227.5 30064.0 ± 728.3
15-HETE 1233.2 ± 52.2 730.2 ± 21.5 743.1 ± 43.6
11-HETE 665.3 ± 48.8 323.5 ± 17.0 322.1 ± 21.4
12-HETE 988.5 ± 49.1 772.1 ± 26.9 769.1 ± 36.9
15(S)-HETrE 394.6 ± 16.0 351.8 ± 14.2 338.3 ± 8.8
5-HETE 1190.5 ± 56.7 1029.5 ± 83.2 1008.1 ± 21.3
15,16-DiHODE 25001.4 ± 668.0 25775.9 ± 949.5 25459.6 ± 570.7
9,10-DiHODE 707.7 ± 20.4 714.3 ± 23.1 704.6 ± 19.2
12,13-DiHODE 675.3 ± 130.2 623.6 ± 115.9 530.4 ± 164.6
17,18-DiHETE 341.3 ± 14.2 338.1 ± 13.0 340.4 ± 11.1
14,15-DiHETE 48.4 ± 3.1 49.3 ± 3.7 50.1 ± 2.0
analyte 0 min (pM) 5 min (pM) 30 min (pM)
mean SD mean SD mean SD
11,12-DiHETE 37.1 ± 3.2 38.0 ± 1.4 34.6 ± 2.1
12,13-DiHOME 22190.9 ± 591.2 22866.3 ± 656.9 22778.2 ± 692.7
9,10-DiHOME 10992.6 ± 341.1 10260.8 ± 383.8 10085.2 ± 155.4
19,20-DiHDPE 3911.3 ± 261.2 3473.1 ± 74.6 3381.9 ± 21.4
14,15-DiHETrE 742.7 ± 27.2 746.9 ± 20.4 739.9 ± 4.6
16,17-DiHDPE 329.3 ± 12.3 314.2 ± 12.7 310.1 ± 7.2
11,12-DiHETrE 701.3 ± 70.4 601.7 ± 15.8 586.5 ± 4.1
13,14-DiHDPE 299.4 ± 13.9 300.0 ± 12.6 289.2 ± 5.0
10,11-DiHDPE 264.8 ± 18.7 246.7 ± 17.2 247.7 ± 3.6
8,9-DiHETrE 347.4 ± 25.7 309.9 ± 8.1 310.3 ± 8.6
5,6-DiHETrE 232.7 ± 6.0 204.8 ± 8.4 206.8 ± 9.6
4,5-DiHDPE 425.5 ± 53.6 514.3 ± 46.3 474.5 ± 34.0
9(10)-EpODE 171.4 ± 2.8 185.2 ± 19.5 187.3 ± 17.7
12(13)-EpODE 203.4 ± 8.9 204.6 ± 16.4 218.7 ± 18.3
19(20)-EpDPE 352.9 ± 11.2 310.5 ± 17.5 300.6 ± 22.9
12(13)-EpOME 4378.6 ± 211.1 4366.2 ± 267.7 4414.4 ± 287.8
14(15)-EpETrE 175.7 ± 2.0 98.9 ± 8.3 100.5 ± 14.3
9(10)-EpOME 2206.0 ± 128.8 2150.1 ± 170.4 2230.9 ± 202.2
16(17)-EpDPE 49.0 ± 4.7 46.0 ± 10.3 45.0 ± 9.8
10(11)-EpDPE 123.7 ± 12.4 110.7 ± 3.7 103.6 ± 11.0
11(12)-EpETrE 184.0 ± 30.9 91.8 ± 11.5 85.4 ± 14.8
5(6)-EpETrE 542.6 ± 65.9 407.8 ± 40.9 392.4 ± 34.7
15(16)-EpODE 4523.0 ± 156.4 4620.1 ± 155.2 4641.5 ± 141.1


![(4) Masama,B - Willenberg,C [D94] - Chess Western Province](https://static.fdocuments.us/doc/165x107/61969d21a1cc9770721a84d9/4-masamab-willenbergc-d94-chess-western-province.jpg)