i USING AN AUDIENCE RESPONSE SYSTEM (ARS) …dwb.unl.edu/Diss/Kendrick/RKDiss.pdf · Roger A....
43
i USING AN AUDIENCE RESPONSE SYSTEM (ARS) A.K.A. “CLICKER” TO DO ATTENTION RESEARCH by Roger A. Kendrick A DISSERTATION Presented to the Faculty of The Graduate College at the University of Nebraska In Partial Fulfillment of Requirements For the Degree of Doctor of Philosophy Major: Educational Studies (Internet-Based Education) Under the Supervision of Professor David Brooks Lincoln, Nebraska December, 2010
-
Upload
trinhtuyen -
Category
Documents
-
view
219 -
download
3
Transcript of i USING AN AUDIENCE RESPONSE SYSTEM (ARS) …dwb.unl.edu/Diss/Kendrick/RKDiss.pdf · Roger A....

i
USING AN AUDIENCE RESPONSE SYSTEM (ARS) A.K.A. “CLICKER” TO DO
ATTENTION RESEARCH
by
Roger A. Kendrick
A DISSERTATION
Presented to the Faculty of
The Graduate College at the University of Nebraska
In Partial Fulfillment of Requirements
For the Degree of Doctor of Philosophy
Major: Educational Studies (Internet-Based Education)
Under the Supervision of Professor David Brooks
Lincoln, Nebraska
December, 2010

ii
USING AN AUDIENCE RESPONSE SYSTEM (ARS) A.K.A. “CLICKER” TO
DO ATTENTION RESEARCH
Roger A. Kendrick, Ph. D.
University of Nebraska, 2010
Advisor: David Brooks
This study makes an effort to examine whether a student’s attention or engagement is
increased by possession of an Audience Response System (ARS, or clicker). This
experiment tested a difference in performance between students who possessed an ARS
and those who did not. The experiment was conducted at a small state college in the
Midwest where small class size is typical. Approximately half the students in each tested
classroom were handed a clicker and then the entire class was taught a topic. After the
topic presentation, students possessing clickers were assessed using a question based on
that topic. The assessment was discussed. Further instruction was given on that topic.
Then a second question was asked. Just before responding, however, students were
surprised by an instruction to hand their clickers to students who were not expecting to be
assessed. Barnard's exact test was used to analyze the 2x2 data from eight classes with α
= 0.05. The results indicated there were no significant differences between the two
groups of students. The last-minute change in performance expectation did not appear to
affect the assessment outcomes. This study utilized ARSs to collect data for the
experiment. Advantages and disadvantages of using ARS devices to collect data were
examined. ARSs were found to be effective in collecting research data.

iii
Dedication
To my wife, Teena, and my children, Kasey, Nick, and Sam. Always pursue your
goals with perseverance and huge amounts of effort. If you’ve learned anything from me
may it be you have to work hard, sometimes fail, then get up and keep going to get where
you want to be in life. On the journey, remember to be happy and stay in the present
moment.

iv
Acknowledgments
I want to thank my mentors in this pursuit – David Brooks and Lois Veath.
Without someone “gently” encouraging me I know I wouldn’t have made it – you have
given me hope when doubt was threatening my progress and have truly made a positive
difference in my life.
To my Mother, Father, and Family - I want to thank you for helping shape who I
am today. Without your contributions I wouldn’t have gotten this far – your
encouragement and faith in me has always been appreciated.

v
Table of Contents
USING AN AUDIENCE RESPONSE SYSTEM (ARS) A.K.A. “CLICKER” TO DO
ATTENTION RESEARCH ................................................................................................ ii
Dedication .......................................................................................................................... iii
Acknowledgments .............................................................................................................. iv
Table of Contents ................................................................................................................ v
List of Multimedia Objects ............................................................................................... vii
Chapter 1 - Introduction ...................................................................................................... 1
Benefits of ARS .............................................................................................................. 1
Origin of the problem ...................................................................................................... 2
Research Hypotheses ....................................................................................................... 3
Chapter 2 - Review of the Literature .................................................................................. 4
Historical Overview of ARS ........................................................................................... 4
Resistance to Using ARS ................................................................................................ 9
Resurgence of ARS ....................................................................................................... 10
Clickers .......................................................................................................................... 11
Clickers as a Tool in Education – What has been done? .............................................. 13
Clickers – What needs to be examined ......................................................................... 16
Chapter 3 – Methods and Procedures ............................................................................... 18
Population and Samples ................................................................................................ 18

vi
Institutional Review Board Procedures ......................................................................... 19
Classes Utilized and Experiment Procedure ................................................................. 19
Design Analysis ............................................................................................................. 20
Equipment ..................................................................................................................... 21
Chapter 4 - Data Analysis and Results ............................................................................. 22
Results Using ARS to Collect Data ............................................................................... 23
Advantages ................................................................................................................ 23
Disadvantages ............................................................................................................ 24
Chapter 5 - Conclusions and Implications ........................................................................ 25
Limitations and Recommendations of the Study .......................................................... 25
Conclusion ..................................................................................................................... 26
References ......................................................................................................................... 28
Appendix A: Benefits of using ARS from Kay and LeSage (2009) ................................. 32
Appendix B: Email sent to faculty requesting study participation ................................... 34
Appendix C: IRB Approval .............................................................................................. 36

vii
List of Multimedia Objects
Figures
Figure 2. 1 - An ARS classroom from the instructors point of view with gauges and dials
along with a reel to reel tape recorder and projectors in the back ...................................... 5
Figure 2. 2 - A row of ARS stations for student input ........................................................ 5
Figure 2. 3 - Close-up of the instructor panel with gauges showing the percentage
responding to each choice ................................................................................................... 5
.
Table 3. 1 .......................................................................................................................... 18
Table 3. 2 .......................................................................................................................... 23

1
Chapter 1: Introduction
Audience response systems, also known as “clickers,” provide audience members
a means for communicating information to a presenter. For this reason, they have begun
to be widely used by teachers in classrooms. Up to this point in time much of the research
on audience response systems (ARS) has examined students’ attitudes toward using the
devices in class or for rudimentary uses such as daily attendance and low level
knowledge assessments with multiple choice questions. Currently, “more detailed
research is needed to determine why specific benefits and challenges influence the use of
ARSs” (Kay & LeSage, 2009). Attitudes toward audience response systems have been
measured often and have been found to be favorable as to their use in classrooms (Files &
Marshall, 2006; Kay & LeSage, 2009; Roschelle, Penuel, & Abrahamson, 2004). How
are such devices useful in learning?
Benefits of ARS
What are some of the benefits that accompany using an ARS in the classroom?
According to many of the professionals who are studying and using ARS, an increase in
attendance can be expected due to the speed and ease of use of clickers (Burnstein &
Lederman, 2001; Cue, 1998; Greer & Heaney, 2004; Kay & LeSage, 2009; Trees &
Jackson, 2007; Wit, 2003). An increase in time spent by the student preparing for class
and taking this time seriously also can be expected (Burnstein & Lederman, 2001;
Caldwell, 2007; Freeman et al., 2007; Graham, Tripp, Seawright, & Joeckel (III), 2007;
Mazur, 1997). Last but not least, so long as ARSs are used to promote active discussion
and learning, an increase in quiz and examination scores can be expected (Freeman, et al.,

2
2007; Gier & Kreiner, 2009; Hake, 1998; Morling, McAuliffe, Cohen, & DiLorenzo,
2008; Poirier & Feldman, 2007). With benefits such as these, it is surprising that clickers
are not more prevalent in education. Questions about the efficacy of clickers in the
classroom remain to be answered such as “Is there a learning benefit to a student who
possesses a clicker over one that doesn't?”
This study makes an effort to examine whether a student’s attention or
engagement is increased by possession of an ARS. It also utilized ARSs to gather all
research data. The research from which the idea for this investigation derived (Woelk,
2008) suggests that attention is increased by possession of a clicker (over those who do
not possess a clicker) as possession of a clicker creates or sets up a situation where
students will be anticipating interacting with the instructor through the ARS. This
anticipation of being required to answer a question is what is assumed to increase the
student’s attention and thus their performance in the classroom.
Origin of the problem
In Optimizing the Use of Personal Response Devices (Clickers) in Large-
Enrollment Introductory Courses, Klaus Woelk’s (2008) related delivering a workshop
describing the benefits of clickers:
“…conducted a test addressing the engagement of an audience that consisted of
faculty, staff, and graduate students. Exactly half the audience was handed a
clicker for a live test. After exemplarily introducing some very simple chemical
nomenclature, an “I learn”-type question resulted in 88% correct results.
Pretending to strive for improving the learning experience, the author repeated
explaining the nomenclature. Right before polling another question, (the question

3
chosen was almost identical to the first), the members of the audience holding on
to a clicker were asked to pass it to those that did not have one. The result was a
disappointing 56% of correct answers, although the subject matter had been
explained twice. Because the audience members of the second poll did not
anticipate the test, their engagement level was significantly lower. The test
remarkably demonstrated the well-known effect that the expectation to be quizzed
will lead to improved engagement” (Woelk, 2008).
Here Woelk assumes that the lack of expectation to be assessed, implied by not
having a clicker, leads to a decreased level of engagement. Meanwhile, participants who
have a clicker are assumed to have a higher level of engagement because they assume
they will have to answer a question utilizing a clicker. Does the possession of a clicker
increase student engagement relative to students who do not possess a clicker? What are
the advantages and disadvantages of using ARS to collect research data? These questions
were the focus of this research.
Research Hypotheses
Ho: There will be no difference in performance between students who possess an
audience response system and expect to be tested from those who do not possess an ARS.
H1: There will be a significant performance difference between students who
possess an audience response system and expect to be tested from those who do not
possess an ARS.
Research Question
What are the advantages and disadvantages of using ARS to collect research data?

4
Chapter 2: Review of the Literature
Historical Overview of ARS
The first audience response systems (ARSs) were developed in the 1950s when
the United States Air Force used an electronic device to train personnel employing
multiple choice questions which were integrated into training films (Judson & Sawada,
2006). In the 1960s, two more ARSs were built and installed in lecture halls at Stanford
University (1966) and another at Cornell University (1968) (Abrahamson, 2006).
According to Abrahamson (2006), "there are also descriptions of German and Japanese
patents about the same time period, but it is not known if working versions of the systems
were ever built.” The earlier ARSs didn't seem to be very effective as the "technological
difficulty of implementing such systems in the pre-microprocessor, pre-network age can
be inferred from verbal reports of early users of the Stanford system who said it either
“never worked,” or “was a total pain to use” (Abrahamson, 2006). These devices
appeared to be analog driven in design with various dials and gauges for recording
student responses along with some form of wired box with buttons or dials for
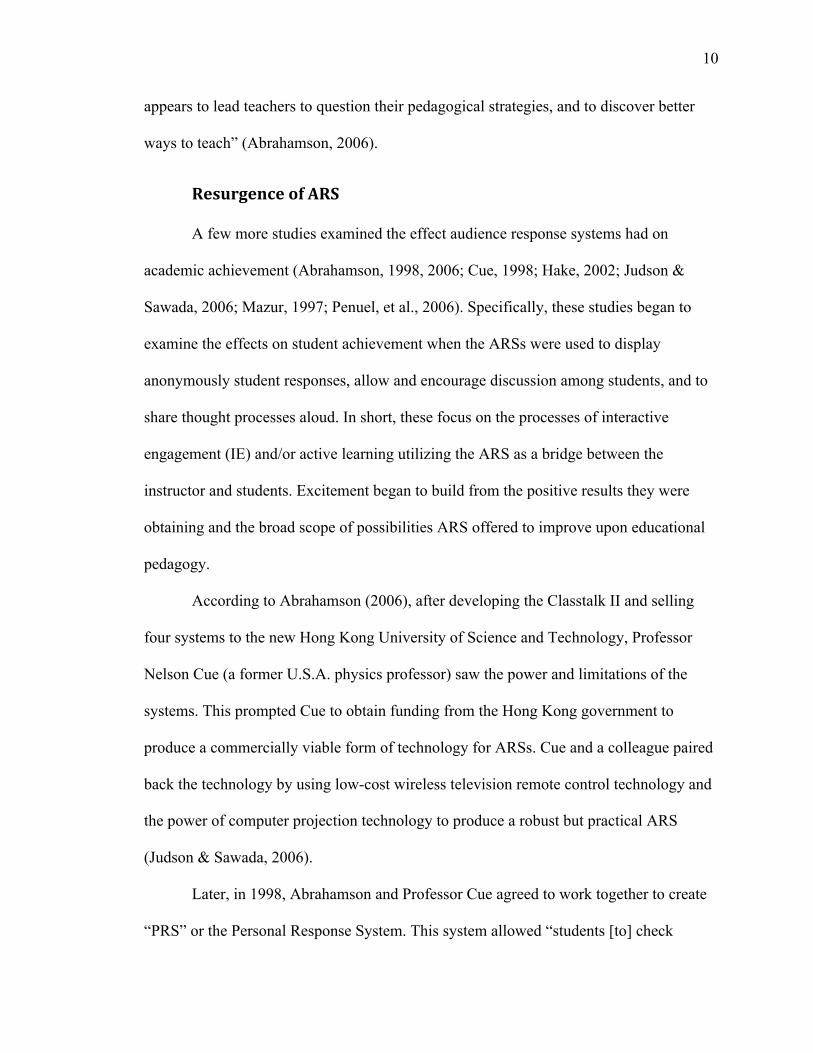
transmitting student responses to the instructors work platform as shown in Figures 2.1,
2.2, and 2.3 (Judson & Sawada, 2006).

5
Audience Response Systems in Higher Education: Applications and Cases by David A. Banks. © 2006, Information Science Publishing. All Rights Reserved. The images above are used in accordance with Section 107, Fair Use, of the Copyright Law, Title 17 of the United States Code.
The effectiveness of the systems seemed to depend upon how well the systems
worked and how efficient the instructor was at interpreting the results from the instructor
panels. The military's tests seemed to go well because they “state that in every one of
these early test cases student attitudes towards use of response systems in university
Figure 2. 1 - An ARS classroom from the instructors point of view with gauges and dials along with a reel to reel tape recorder and projectors in the back
Figure 2. 2 - A row of ARS stations for student input
Figure 2. 3 - Close-up of the instructor panel with gauges showing the percentage responding to each choice

6
lectures was uniformly positive” (Bapst, 1971; Brown, 1972; Casanova, 1971; Garg,
1975; Littauer, 1972 as cited by Abrahamson, 2006). While both the teachers and
students liked using the systems, early results from Bapst (1971), Bessler (1969), Bessler
and Nisbet (1971), Brown (1972), and Casanova (1971) as cited by Abrahamson 2006,
showed “no gains in student achievement from the use of response systems.”
These lacks of gain can be traced back to their use which was largely to maintain
a tailored pace by the instructor who would ask a multiple-choice question after lecturing
on a subject or topic. If enough responses were positive, they would continue on to new
material. If students did not understand the material, the instructor repeated the lecture
material to the students (Judson & Sawada, 2006). Judson and Sawada (2006) equated
this to an ineffectual use of technology and pedagogy as it is “not unlike a traveler being
provided directions repeatedly in a foreign language by an overly helpful Samaritan:
Eventually, the traveler will obligingly smile and be on his or her way without a clue of
where to go, but the Samaritan will feel satisfied in having completed a good deed."
Although the systems created in the 1950s and ‘60s were technically adequate, the
expense of installing these systems (usually supported by grant money) coupled with the
lack of pedagogical development associated with these new teaching tools led to a
decline of their mention in literature until the 1990s. A few exceptions in education
persisted who made unintended but important curricular discoveries in ARS use along
with a few people in the business world who wished to utilize the benefits of audience
response systems in their meetings.
An example of early ARSs associated with business uses can be relayed from
Communications Technology International Incorporated which “has its roots in the very

7
earliest days of the industry. In the late sixties, Bill Simmons retired from IBM where he
had been a Director of Planning. At home, he reflected on how unproductive most
meetings were and built a system to improve them. He named his brainchild the
Consensor and in 1972 applied for a patent which was granted in 1974 (ComTec, 2009).
Simmons (1974) described his work during an interview.
The following is a description of the early product along with the history of the
company (ComTec, 2009): The Consensor was a system of dials, wires, and three lights
(red, yellow, and green). A question was asked verbally, and people would turn their dial
anywhere from 0 to 10. If the majority agreed, the green lamp would light. If not, either
the yellow or red would. Simmons teamed with a couple of others to form Applied
Futures, one of the very first audience response companies. Although business was strong
for this fledgling company, the Command and Control management style of the day
proved a formidable opponent. Brooks International, a management consulting firm
headquartered in northern New Jersey, purchased Applied Futures in 1986. Brooks found
the Consensor to be an invaluable tool in getting a quick, accurate "finger on the pulse"
of a client organization. In 1988, Mike Lull (then a vice president with Brooks) purchased
the Consensor business from Brooks and renamed the company Communications
Technology. In 1992, Tom Campione joined ComTec and helped build an industry
leading company that has focused on software development for Fleetwood Wireless
Audience Response Systems. In 2005, Campione purchased a majority stake in ComTec
and along with the rest of today's management team remains committed to providing
quality products while retaining an industry leadership role (Simmons, 1974). This
suggests uses other than education for which ARS systems can be employed successfully.

8
According to Abrahamson (2006), in 1985 he along with Fred Hartline and
Milton Fabert built a series of wired prototypes they named Classtalk from surplus
materials (Atari keypad's, LED displays, etc.) that all culminated in being connected to a
teacher's Apple computer. They set up their system in a 200-seat lecture hall at
Christopher Newport University where it was to be used to teach. He said they benefited
from two lucky accidents. Because they could only afford 64 keypads in the lecture hall,
students were forced to use keypads in small groups, a structure that promoted sharing of
information within each group. Professor George Webb, Dean at the University, who
despite his other duties had been teaching university physics for over 15 years, had an
especially strong pedagogical orientation.
Professor Webb had been teaching university physics for so long he enjoyed a
sense of security with the subject matter which, along with the new Classtalk system,
gave him an opportunity to try out different pedagogical ideas. Although students’ talking
in classes was generally unacceptable, Professor Webb started to encourage these group
discussions and found the students not only seemed to learn more but stayed together in
these small groups after class to study. He would also start class or a new subject by,
“very carefully choose[ing] a question that had an obvious answer based on everyday
non-physicist thinking, but which was invalid. When over 90% of the class chose this
answer and found out that they were all wrong, they suddenly became interested and
were more than ready to listen” (Abrahamson, 2006). Some of the other commercially
available systems, before a resurgence in popularity in the 1990’s, were the Spitz Student
Response System, the Anonymous Audience Response System, and the Instructoscope

9
which went a little further in providing individual student feedback by lighting a green or
red light (Judson & Sawada, 2006).
Resistance to Using ARS
In the late 1980s and very early in the 1990s, there was still much resistance to
using audience response systems beyond the expense involved in installing an ARS.
Some people said they could get the same response from students allowing them to raise
their hand in response to questions (Lasry, 2008). The lack of anonymity due to students
looking around (or cheating) is such that only the bravest of students volunteer (Judson &
Sawada, 2006; Mazur, 1997; Penuel, Abrahamson, & Roschelle, 2006). Another issue is
the students’ lack of anonymity called response set (a.k.a., response style or bias) which
is the "tendency of some people to answer a large number of items in the same way
(usually agreeing) out of laziness or a psychological predisposition" (Neuman, 2003).
Another form of resistance that came around the mid-1980s and was named the
“George Orwellian,” “1984,” or “big brother” effect where teachers would use their
power to constantly watch over and intimidate students (Abrahamson, 2006). This idea, it
turns out, is self-correcting and tends not to happen since, "in most educational situations,
aggressive surveillance poses penalties for the instructor in terms of student attitude,
reduced student motivation, and unpleasant classroom atmosphere” (Abrahamson, 2006).
It was found that professors who tend to be overly controlling and/or overbearing have
low enrollments or large drop rates at the beginning of their classes, and low evaluations
at the end of the semester. Researchers at Ohio State University working with high school
teachers uncovered a more powerful explanation: "the data itself coming from the system
10
appears to lead teachers to question their pedagogical strategies, and to discover better
ways to teach” (Abrahamson, 2006).
Resurgence of ARS
A few more studies examined the effect audience response systems had on
academic achievement (Abrahamson, 1998, 2006; Cue, 1998; Hake, 2002; Judson &
Sawada, 2006; Mazur, 1997; Penuel, et al., 2006). Specifically, these studies began to
examine the effects on student achievement when the ARSs were used to display
anonymously student responses, allow and encourage discussion among students, and to
share thought processes aloud. In short, these focus on the processes of interactive
engagement (IE) and/or active learning utilizing the ARS as a bridge between the
instructor and students. Excitement began to build from the positive results they were
obtaining and the broad scope of possibilities ARS offered to improve upon educational
pedagogy.
According to Abrahamson (2006), after developing the Classtalk II and selling
four systems to the new Hong Kong University of Science and Technology, Professor
Nelson Cue (a former U.S.A. physics professor) saw the power and limitations of the
systems. This prompted Cue to obtain funding from the Hong Kong government to
produce a commercially viable form of technology for ARSs. Cue and a colleague paired
back the technology by using low-cost wireless television remote control technology and
the power of computer projection technology to produce a robust but practical ARS
(Judson & Sawada, 2006).
Later, in 1998, Abrahamson and Professor Cue agreed to work together to create
“PRS” or the Personal Response System. This system allowed “students [to] check

11
visually, on the overhead screen, to see if their response had been received by the
teacher’s computer” (Abrahamson, 2006). Additionally, “they decided further to cut the
cost of student handheld units by eliminating the handheld screen (which would have
been required for login), and building in a unique identifier into each handheld. In this
way, each student would automatically be uniquely identified no matter where she or he
was located in any classroom. This approach also mandated limiting question types to
multiple-choice only” (Abrahamson, 2006). This last decision, while restricting
pedagogy, meant that a student need only press a single button to respond to a question in
class. These changes allowed a student to buy, own, and carry his or her unit to any
classroom where a system was in use and the system would recognize it, and by
inference, the student him or herself. Almost all new systems emulate some or all of the
groundbreaking changes Professor Cue introduced to ARSs. These changes also resulted
in the increased use of ARSs after 2003 (Kay & LeSage, 2009).
Clickers
Contemporary audience response systems go by many names including: audience
response system (ARS, most used term), personal response systems (or stations– PRS),
classroom response systems (CRS), interactive voting systems (IVS), electronic voting
systems (EVS), student response systems (SRS), interactive student response systems
(ISRS), group response systems (GRS), group process support systems (GPRS), and the
more colloquial term clickers (Cain & Robinson, 2008; Kay & LeSage, 2009). Kay and
LeSage’s (2009) review of literature referenced no less than 26 different labels and
stressed that inconsistent labeling creates a difficulty in staying current with the latest
research. The modern ARS generally consist of three elements: a wireless

12
transmitter/receiver or handheld system for the audience (the clicker); a
transmitter/receiver system for the lecturer hardwired to a computer (USB or plug-and-
play); and software to collect, analyze, and project the responses. The proprietary
software may be one package or may consist of many different programs allowing for
selection for particular curricular needs. On account of the popularity of Microsoft
PowerPoint presentation software, most companies have a plug-in so that questions can
be included with PowerPoint presentations.
Due to the limits of line of sight infrared (IR) transmission in large lecture halls,
IR technology has been largely replaced with radio frequency (RF) technology.
Contemporary wireless ARS devices vary in features. Some have only a few (usually
five) buttons/keys for multiple choices with no display screen. Other devices have
multiple lines of display and keys capable of answering true false, multiple-choice,
numerical answers, and short one word or sentence answers along with storage space for
homework assignments (eInstruction, 2009a). Testing is currently being undertaken for
an ARS with a full qwerty keyboard which will open up even more avenues when it
comes to delivering answers to instructors (SMART, 2010).
Devices equipped with Bluetooth technology allow companies to create software
for virtual emulation of clickers (eInstruction, 2009b; SMART, 2010). Thus, a laptop
computer, PDA, or mobile smartphone can replace the clicker by using a virtual ARS
application (eInstruction, 2009b; SMART, 2010).
Finally, one noteworthy advance is the wireless networking of scientific
calculators by Texas Instruments (TI). TI has made it possible for a scientific calculator
to take the place of the clicker. The wireless networking device that connects the

13
calculators is called TI-Navigator (TI, 2009a) and allows four calculators to be connected
together for graph, equation, or answer receiving/transmission from teachers and
students. The latest incarnation (Spring 2010) will remove the four calculator “hub” and
allow each calculator to wirelessly connect to the teacher’s computer (TI, 2009b) using
Bluetooth® technology. In this way a teacher can share student solutions with the class or
send equations, questions, or solutions to student calculators. The only drawback is that
there appears to be an upper limit of 40 calculators connected at one time.
Clickers as a Tool in Education – What has been done?
Over the past 40 years, ARSs have garnered a positive response from audiences
and teachers (Caldwell, 2007; Kay & LeSage, 2009; Lantz, 2010). Due to their
transformational qualities (teachers realizing the inadequacy of passive lectures) coupled
with the seeming unending lowering of the price of technology, ARS installation has
taken place in an ever increasing number of classrooms at all levels of education
(Burnstein & Lederman, 2006).
With respect to research, a lack of formal studies regarding clickers along with
associated reliability estimates and validity information makes meta-analysis of studies
unlikely and restricts meaningful comparisons of studies (Kay & LeSage, 2009). With
this type of growing implementation, it is time for researchers to start adding the rigor
necessary to show how and why these systems benefit instructors, students and
researchers.
Studies are beginning to chart new paths to the potential that ARSs offer in
improving both student learning and instructor delivery of pedagogy. With respect to

14
some of the prior work by Roschelle, Penuel, and Abrahamson they have (Abrahamson,
2006),
“… identified 26 studies in mathematics, chemistry, and the humanities reporting
positive outcomes. These range from promoting greater student engagement (16
studies), increasing understanding of complex subject matter (11 studies),
increasing interest and enjoyment of class (7 studies), promoting discussion and
interactivity (6 studies), helping students gauge their own level of understanding
(5 studies), teachers having better awareness of student difficulties (4 studies),
extending material to be covered beyond class time (2 studies), improving quality
of questions asked (1 study), and overcoming shyness (1 study).”
They also mentioned that, although outcomes were positive, these studies lacked rigor or
strong conclusions making it “impossible to draw strong conclusions about the
technology’s effectiveness” (Abrahamson, 2006).
Files and Marshall’s (2006) literature review on ARSs indicates that they are most
often used to take attendance, obtain summative assessment data, or collect survey data.
Reports generally: (1) address individual rather than small group use of CRS; (2)
compare non-CRS supported traditional practice with CRS supported interactive
methodologies; (3) rarely describe conditions of use such as purely formative assessment
that serves to scaffold instruction; and (4) rarely report on classroom interactions where a
CRS is consistently used in complete anonymity (Files & Marshall, 2006). They
additionally categorized 24 reports some of which were included in Roschelle, Penuel,
and Abrahamson (2004), but took a different approach by categorizing reports by either
pedagogical theory or implementation into different areas of undergraduate study.

15
The pedagogical theories examined were: Peer Instruction (PI) by Mazur,
Dufresene et al. (1996), which supported sequence based on Kolb’s Experimental
Learning Cycle; Stroup et al. who focused on “next generation” functionalities from a
socioconstructivist sense and included using new TI-Navigator and PDA technology; and
the inclusively defined Classroom Aggregation Technology for Activating and Assessing
Learning and Your Students’ Thinking” (CATAALYST) by Roschelle et al., (2004). All
of these pedagogical strategies benefited from the immediate feedback ARSs generate in
the form of a histogram except in the case of the TI-Navigator system where student
equations and graphs are additionally collected, displayed, and discussed.
Implementations were mainly in the area of physics. Two involved engineering programs
and medical groups, and one involved high school mathematics and physical and life
science (Files & Marshall, 2006).
Kay and LeSage (2009) undertook a review of 67 peer-reviewed journals "in
order to present a more current and representative summary of benefits and challenges
experienced when using this new technology.” To summarize studies: 64 were performed
between 2000 and 2007, with 49 articles published since 2004. Thirty-six studies
described data about attitudes while 24 focused on learning. Regarding methodology, 20
of the studies were survey-based, 12 were case studies, 13 offered theoretical analyses, 8
presented qualitative data, and the remaining articles provided specific or general reviews
of ARSs. The predominant population was undergraduate students (n = 49) in science- or
mathematics-based subject areas in relatively large classes (Mean = 308).
Kay and LeSage (2009) also included a useful table (their table 1) regarding three
categories of benefits including classroom environment, learning, and assessment. The

16
table is broken into three columns of benefits, descriptions, and evidence. It is reproduced
in Appendix A. The classroom environment benefits examined are attendance, attention,
anonymity, participation, and engagement. The learning benefits are interaction,
discussion, contingent teaching, learning performance, and quality of learning. The
assessment benefits are feedback, formative, and comparison. Key outcomes from Kay
and LeSage (2009) come mainly in the form of direction for future research in at least
four areas.
First, “more detailed research is needed to determine why specific benefits and
challenges influence the use of ARS.” Second, “more research is needed on analyzing the
impact of specific types of questions on creating student-centered, knowledge-rich
learning that builds classroom community.” Third, “the context of ARS use needs to be
expanded to include social science subject areas and K-12 classrooms.” Finally, “more
research is needed on individual differences in the use of ARSs. Focusing on gender,
grade level, age, and learning style would be a viable starting point.”
This literature review along with the others helps to emphasize the use of ARS
technology in the physical sciences and in particular physics. These reviews also stress
that more in-depth research needs to be done into how and when ARS can add to a
learning environment (Abrahamson, 2006; Files & Marshall, 2006; Kay & LeSage, 2009;
Penuel, et al., 2006; Simpson & Oliver, 2002). It appears that research in the area of
clickers will offer an abundance of opportunities in the future.
Clickers – What needs to be examined
According to Roschelle et al., (2004), there are gaps "in systematically measuring
and understanding how teaching and learning unfolds in these kinds of networked

17
classrooms.” The authors go on to say the contribution of specific pedagogical elements
have not been systematically measured and that some of the more dominant theories and
ideas about how instruction in higher education with audience response systems unfolds
does not adequately capture the range of experiences reported by practitioners. According
to Files and Marshall (2006), missing from current research are:
1. Tightly controlled comparisons in which the only difference is the use, or lack of
use, of a CRS.
2. CRS use in connection with diverse pedagogical approaches:
a. Group-based methodologies that are combined with group-based CRS use.
b. Varying degrees of anonymity in response collection.
c. CRS use for purely formative assessment modalities that scaffold learning.
3. CRS use in connection with diverse populations and content areas:
a. Same content area, but different populations.
b. Same population, but different content areas.
4. Finally, it is of particular note that the current literature base contains conflicting
reports of the efficacy of using CRSs in individual mode versus group mode.
Given the emphasis on collaborative work in the National Science Education
Standards and elsewhere, the effects of group mode use merit further study.

18
Chapter 3 – Methods and Procedures
The result reported by Woelk (2008) implied that having a clicker might affect the
attention one paid to instruction based upon whether the same assessment was likely to be
made. In other words, having a clicker impacted the attention paid to instruction. This
series of replicated experiments sought to determine whether the outcome reported from a
training workshop would be similar for actual college classrooms.
Population and Samples
This study was undertaken at a rural Nebraska liberal arts state college in the
Midwest with testing limited to undergraduate baccalaureate students. Average student
demographics for the college (full-time and part-time) for years 2004-2006 are as
follows:
Table 3. 1 Average Undergraduate Population 2245 Gender % Percentage Male 42 Percentage Female 58 Age % Percentage Age, 24 and under 72 Percentage Age, 25 and older 28 Race % Nonresident Alien 1 Black, non-Hispanic 1 American Indian/Alaska Native 2 Asian/Pacific Islander 1 Hispanic 3 White, non-Hispanic 84 Race/ethnicity unknown 8
Undergraduate classes in science, mathematics, arts and humanities were studied.
19
Institutional Review Board Procedures
The author had approval from the Institutional Review Board (IRB) at Chadron
State College. Due to the responses of the students never being associated with the name
of the student, minimal risk to participants, and the research being carried out in a normal
educational setting a waiver for need of consent by individuals was granted by the IRB
(see Appendix C).
Classes Utilized and Experiment Procedure
Initially an e-mail was sent out campus wide to recruit volunteer classes for the
experiment. A copy of the e-mail message used for this purpose is supplied in Appendix
B. Generally an extra e-mail, or two, was necessary for simple clarification of what was
needed from each instructor along with communicating a time for the experiment to be
scheduled. Classes in the sciences, mathematics, humanities and arts were included.
The participants were regularly enrolled students in classes who happened to
attend on the day of this unannounced experiment. Each instructor developed a brief
instructional topic of their choice with two similar topic questions. ARSs were distributed
randomly to fewer than half of the students attending before the instruction. The
instructor announced, "We are making a quick test of these clickers. I'm going to teach
xyz, and then ask a question about that.” The instruction was presented, after which
students with clickers were asked to respond. The instructor presented the question,
announced the accepted answer, and then presented the instruction again with a slightly
different twist. The instructor then asked a new but very similar topic question.
Immediately before asking students to respond, however, the instructor directed students
to pass their clickers to students who did not previously have a clicker. The data gathered

20
included responses to the first and then to the second question. After discussion of the
second question, the clickers were collected. Individual responses were never connected
to a particular student.
There are two groups of data for each class involved in the study. The responses
from participants possessing clickers who expected to be tested (before the switch was
applied – BS) and responses from participants who did not originally possess a clicker
and were not expecting to be tested (after the treatment is applied – AS). Data collected
from the first and second questions was in the form of the number of correct answers and
number of incorrect answers for both before and after the treatment.
Design Analysis
A primary strength of this rural state college is small class size. Since class sizes
N >= 30 are not common at the college, the sample was drawn from approximately eight
college courses with class sizes as close to 30 as possible to add validity (strength) to the
results. The data gathered include responses to two similar topic questions, one before
and one after the desired treatment with responses never connected to a particular
individual. Normally a chi-squared goodness of fit test would be used to compare the
frequencies of correct to incorrect answers before and after the treatment. Due to small
class size and a high probability that frequencies in a cell will be less than or equal to five
(a violation of the chi-squared test) Barnard’s exact test with α = 0.05 was used.
Barnard's exact test was chosen because it is more powerful than Fisher’s exact test
which assumes equal marginal quantities for both rows and columns and is considered
too conservative by today's standards (Lydersen, Fagerland, & Laake, 2009; Upton,
1982).

21
Equipment
The transmitter/receiver and clickers (30) are from eInstruction with the clicker
brand being InterwritePRS (eInstruction, 2009a). Each clicker was identifiable by a
unique number (hardware) and a student input ID which was filled in with a lettering of
A1 to A30 to allow for anonymous collection of data by Interwrite Response software
(eInstruction, 2009a). The equipment was easily carried in two suitcases: one for the
laptop and the other for clickers. The transmitter/receiver and laptop set up time was
approximately five minutes. Data from clickers was gathered using a laptop prepared
prior to the experiment and operated by the primary investigator.

22
Chapter 4 -‐ Data Analysis and Results
The software package used to calculate Barnard's exact test was StatXact 9 (Cytel,
2010). The 2x2 data collected for each class in the experiment appears in Table 3.2. Each
grouping of frequencies has been named by class starting at class1 and ending at class8.
Class0 represents frequencies from Woelk’s original experiment (Woelk, 2010) while
class1 through class8 represents this experimental data and statistical results. Data were
obtained form one other class, but there was a clear violation of the protocol such that the
data from that class were not included in the analysis.
According to Woelk’s experiment that inspired this study, before having the
participants exchange clickers (the treatment) he had explained a topic and asked a
question to which 88% of the participants had answered correctly and 12% incorrectly.
This translates to 28 correct and four incorrect answers out of 32 participants. Then
Woelk gave further instructions on the same topic and asked another question but before
having the students reply he asked participants to hand their clickers to someone who had
not answered a question to determine if the other half of the class understood the topic.
Results showed only 56% correct to 44% incorrect which translates to 18 correct and 14
incorrect answers out of 32 participants. As can be seen from table 3.2 below, class0 from
Woelk’s workshop provided a significant result of p = 0.0118; there is evidence that the
switch created an effect.

23
Table 3. 2 Observed Values Percentages
Barnard's Results Classes Correct Incorrect Correct Incorrect 2 tail
0 BS 28 4 88 12 0.0118
Woelk AS 18 14 56 44
1 BS 4 8 33 67
0.2789 AS 7 5 58 42
2 BS 3 5 38 63
0.8036 AS 4 4 50 50
3 BS 6 4 60 40
0.7766 AS 7 3 70 30
4 BS 4 1 80 20
0.5156 AS 5 0 100 0
5 BS 9 3 75 25
1.0000 AS 9 3 75 25
6 BS 4 7 36 64
0.7785 AS 3 8 27 73
7 BS 9 3 75 25
0.1259 AS 5 7 42 58
8 BS 12 2 86 14
0.7442 AS 11 3 79 21
BS = Before Switch AS = After Switch
Results show (see Table 3.2) that all eight classes that participated in the
experiment had non-significant results.
Results Using ARS to Collect Data
Advantages
Overall, using ARSs to collect research data was a success. The small learning
curve to understand and master the software along with the ease of operating the clicker
and the large array of data that can be collected from the Interwrite PRS clickers
(true/false, multiple choice, matching, numerical and short answer along with the ability

24
to collect homework assignments) makes this device very dynamic when it comes to
collecting data. The near instantaneous results and the different formats offered by this
software to organize what has been collected, termed "reports" by the software, (includes
raw data, percentages right/wrong, breakdown of multiple-choice questions), and a graph
of the normal distribution of responses is impressive. In addition, the software offers the
ability to export data in spreadsheet format that is compatible with today's typical
spreadsheet software packages or as text/comma separated values. Overall, starting with
digital data made the process of storage, analyzing, and archiving convenient (data
already in the computer), powerful (analyze using clicker software or export to familiar
software), and secure (password protected).
Disadvantages
The largest disadvantage to using ARS was carrying the cases around to the
different rooms. Another disadvantage came from set up which was short (approximately
5 minutes) and could be compensated for by showing up a little earlier for each class.
Although this did not occur in the experiment, the possibility of theft of one of the ARS
units is also a possible disadvantage.

25
Chapter 5 -‐ Conclusions and Implications
Limitations and Recommendations of the Study
It is hard to argue that students weren't paying attention (even though they had no
stake in the testing) due to correct answers generally outweighed incorrect answers and
proportions of correct and incorrect answers never being significantly different before
and after the ARS transfer.
This study examined students at the beginning of class periods (approximately the
first 10 to 15 minutes) when their attention level might be highest. Students who had been
in class for more than 15 minutes were not studied. It is possible that differences in
student engagement might have been detected had they been measured later in the class
periods.
It also is possible that the presence of the experimenter had an effect. In these
small classrooms, the presence of a visitor is always noticed, and this may have led to
atypically high levels of attention
Since the experiment conducted was limited to approximately the first 10 to 15
minutes of class time a good follow-up to the experiment would be to repeat this process
at the end of a class to see if a significant difference occurs at that time. This would
suggest that clickers have the ability to maintain student attention due to the expectation
of being tested at any time throughout a class. Since Woelk’s impromptu results were not
reproduced here, this may be a better explanation for what occurred in his workshop.

26
Conclusion
This study sought to determine if there is a significant difference in the attention
of students who possess an ARS and expect to be tested from those who do not possess
an ARS and do not expect to be tested. To test if the expectation to be tested is
responsible for the significant result Woelk’s original experiment was recreated with
testing taking place at the beginning of class when attention levels are at their highest.
Once the treatment was applied to students who were not expecting to be polled an
examination of the data using Bernard’s exact test resulted in no significant difference in
all eight of the classes examined (excluding the one class that violated test protocol).
According to the original experiment, since the second group of students didn't expect to
be tested their results should be significantly different from the first group. This effect
was not evident at any point throughout the experiment. What was found is that both the
expectation to be tested and attention level of the second group was typically on par with
results from the first group. These results speak very clearly and singly by showing that
generally all students at the beginning of a class are paying attention whether or not they
expect to be tested over the topic being discussed.
Further Study
The class sizes at the study institution were small. Large classes, especially ones
where students are more likely to perceive themselves as anonymous, might yield
different results with respect to attention. Also, large classes in first-year subjects might
also be different.
The Woelk report dealt with a workshop environment where the participants had
nothing at stake in learning the content. Repeating this experiment in workshop settings

27
might reveal that inattention was the result of the learner’s goals. A different way to test
this might involve conducting some workshops in which the tested content was discipline
related (more likely to duplicate Woelk’s outcome) versus ones in which the tested
content related to research on clickers (less likely to duplicate Woelk’s outcome because
of workshop participant interest).

28
References
Abrahamson, L. (1998). An overview of teaching and learning research with classroom
communication systems (CCSs) (Online paper). from Better Education Inc.
http://www.bedu.com/Publications/Samos.html
Abrahamson, L. (2006). A brief history of networked classrooms: Effects, cases, pedagogy, and
implications. In D. Banks (Ed.), Audience Response Systems in Higher Education:
Applications and Cases (pp. 1-25). Hershey Pennsylvania: Information Science
Publishing.
Burnstein, R. A., & Lederman, L. M. (2001). Using wireless keypads in lecture classes. The
Physics Teacher, 39(January), 8-11.
Burnstein, R. A., & Lederman, L. M. (2006). The use and evolution of an audience response
system. In D. Banks (Ed.), Audience Resonse Systems in Higher Education: Applications
and Cases (pp. 40-52). Hershey Pennsylvania: Information Science Publishing.
Cain, J., & Robinson, E. (2008). A primer on audience response systems: Current applications
and future considerations. American Journal of Pharmaceutical Education, 72(4), 77.
Caldwell, J. E. (2007). Clickers in the large classroom: Current research and best practice tips.
CBE-Life Sciences Education, 6(Spring), 9-20.
ComTec. (2009). Consensor and ComTec history, 2009, from http://www.comtec-
ars.com/consensor-history.asp
Cue, N. (1998, 10-12 December). A universal learning tool for classrooms? Paper presented at
the First Quality in Teaching and Learning Conference, Hong Kong International Trade
and Exhibition Center (HITEC), Hong Kong SAR, China.

29
Cytel. (2010). Cytel, Inc. adaptive clinical trial software and statistical applications - SiZ, East,
StatXact, LogXact Retrieved 9-28-10, from
http://www.cytel.com/software/StatXact.aspx
eInstruction. (2009a). Interwrite PRS Retrieved October, 2009, from
http://www.einstruction.com/products/assessment/prs/index.html
eInstruction. (2009b). vClicker mobile edition Retrieved October, 2009, from
http://www.einstruction.com/support_downloads/downloads.html
Files, C., & Marshall, J. (2006). Classroom response systems: A review of the literature. Journal
of Science Education and Technology, 15(1), 101-109.
Freeman, S., O'Connor, E., Parks, J. W., Cunningham, M., Hurley, D., Haak, D., . . . Wenderoth,
M. P. (2007). Prescribed active learning increases performance in introductory biologys.
Life Sciences Education, 6, 132-139.
Gier, V. S., & Kreiner, D. S. (2009). Incorporating active learning with powerpoint-based lectures
using content-based questions. Teaching of Psychology, 36, 134-139.
Graham, C. R., Tripp, T. R., Seawright, L., & Joeckel (III), G. L. (2007). Empowering or
compelling reluctant participators using audience response systems. Active Learning in
Higher Education, 8(3), 233 - 258.
Greer, L., & Heaney, P. J. (2004). Real-time analysis of student comprehension: An assessment
of electronic student response technology in an introductory earth science course. Journal
of Geoscience Education, 52(4), 345-351.
Hake, R. R. (1998). Interactive-engagement versus traditional methods: A six-thousand-student
survey of mechanics test data for introductory physics courses. American Journal of
Physics, 66(1), 64-74.
Hake, R. R. (2002). Lessons from the physics education reform effort. Conservation Ecology,
5(2), 28.

30
Judson, E., & Sawada, D. (2006). Audience response systems: Insipid contrivances or inspiring
tools. In D. Banks (Ed.), Audience Response Systems in Higher Education: Applications
in Cases (pp. 26-39). Hershey Pennsylvania: Information Science Publishing.
Kay, R. H., & LeSage, A. (2009). Examining the benefits and challenges of using audience
response systems: A review of the literature. Computers & Education, 53, 819-827.
Lantz, M. E. (2010). The use of 'clickers'in the classroom: Teaching innovation or merely an
amusing novelty? Computers in Human Behavior, 26, 556-561.
Lasry, N. (2008). Clickers or flashcards: Is there really a difference? The Physics Teacher,
46(April), 242-244.
Lydersen, S., Fagerland, M. W., & Laake, P. (2009). Tutorial in biostatistics: Recommended tests
for association in 2x2 tables. Statistics in Medicine, 28, 1159-1175.
Mazur, E. (1997). Peer instruction: A user's manual. Upper Saddle River, NJ: Prentice Hall.
Morling, B., McAuliffe, M., Cohen, L., & DiLorenzo, T. M. (2008). Efficacy of personal
response systems (" clickers") in large, introductory psychology classess. Teaching of
psychology, 35, 45-50.
Neuman, W. L. (2003). Social research methods: Qualitative and quantitative approaches (5
ed.): Allyn and Bacon.
Penuel, W. R., Abrahamson, L., & Roschelle, J. (2006). Theorizing the transformed classroom
sociocultural interpretation of the effects of audience response systems in higher
education. In D. Banks (Ed.), Audience Resonse Systems in Higher Education:
Applications and Cases (pp. 13). Hershey Pennsylvania: Information Science Publishing.
Poirier, C. R., & Feldman, R. S. (2007). Promoting active learning using individual response
technology in large introductory psychology classes. Teaching of Psychology, 34, 194-
196.
Roschelle, J., Penuel, W. R., & Abrahamson, L. (2004). The networked classroom. Educational
Leadership, 61(5), 50-54.

31
Simmons, B. (1974). Communications technology int. incorporated: Consensor and ComTec
history, from http://www.comtec-ars.com/videos/simmons.htm
Simpson, V., & Oliver, M. (2002). Using electronic voting systems in lectures: University of
Surrey.
SMART. (2010). SMART response interactive response systems, from
http://www2.smarttech.com/st/en-US/Products/SMART+Response/default.htm
TI. (2009a). TI-Navigator Retrieved October, 2009, from
http://education.ti.com/educationportal/sites/US/productDetail/us_ti_navigator.html
TI. (2009b). TI-NSpire navigator system, from
http://education.ti.com/educationportal/sites/US/nonProductSingle/nspire_navigator.html
Trees, A. R., & Jackson, M. H. (2007). The learning environment in clicker classrooms: Student
processes of learning and involvement in large University-level courses using student
response systems. Learning, Media and Technology, 32(1), 21-40.
Upton, G. J. G. (1982). A comparison of alternative tests for the 2x2 comparative trial. Journal of
the Royal Statistical Society, 145(1), 86-105.
Wit, E. (2003). Who wants to be... the use of a personal response system in statistics teaching.
MSOR Connections, 3(2), 14-20.
Woelk, K. (2008). Optimizing the use of personal response devices (clickers) in large enrollment
introductory courses. Journal of Chemical Education, 85(10), 1400-1405.
Woelk, K. (2010, October 12, 2010).

32
Appendix A: Benefits of using ARS from Kay and LeSage (2009)
Benefit Description Evidence Classroom Environment Benefits Attendance Students go to class more Burnstein and Lederman (2001),
Caldwell (2007), and Greer and Heaney (2004)
Attention Students are more focused in class
Bergtrom (2006), Burnstein and Lederman (2001), Caldwell (2007), d'lnverno et al. (2003), Draper and Brown (2004), Elliott (2003), Jackson et al. (2005), Jones et al. (2001), Latessa and Mouw (2005), Siau et al. (2006), and Slain et al. (2004)
Anonymity All students participate anonymously
Caldwell (2007), Draper and Brown (2004), Jones et al. (2001), Siau et al. (2006), Simpson and Oliver (2007), and Stuart et al. (2004)
Participation Students participate with peers more in class to solve problems
Bullock et al. (2002), Caldwell (2007), Draper and Brown (2004), Greer and Heaney (2004), Jones et al. (2001), Siau et al. (2006), Stuart et al. (2004), Uhari et al. (2003), and Van Dijk et al. (2001)
Engagement Students are more engaged in class
Bergtrom (2006), Caldwell (2007), Draper and Brown (2004), Latessa and Mouw (2005), Preszler et al. (2007), Siau et al. (2006), and Simpson and Oliver (2007)
Learning benefits Interaction Students interact more with peers
to discuss ideas Beatty (2004), Bergtrom (2006), Caldwell (2007), Elliott (2003), Freeman et al. (2007), Kennedy et al. (2006), Sharma, Khachan, Chan, and O'Byrne (2005), Siau et al. (2006), Slain et al. (2004), Stuart et al. (2004), Trees and Jackson (2007), and Van Dijk et al. (2001)
Discussion Students actively discuss misconceptions to build knowledge
Beatty (2004), Brewer (2004), Draper and Brown (2004), Jones et al. (2001), and Nicol and Boyle (2003)
Contingent teaching Instruction can be modified based on feedback from students
Brewer (2004), Caldwell (2007), Cutts (2006), Draper and Brown (2004), Elliott (2003), Greer and Heaney (2004), Hinde and Hunt (2006), Jackson et al. (2005), Kennedy and Cutts (2005), Poulis et al. (1998) and Stuart et al. (2004)
Learning performance Learning performance increases as a results of using ARS
Bullock et al. (2002), El-Rady (2006), Fagan et al. (2002), Kaleta and Joosten (2007), Kennedy and Cutts

33
(2005), Pradhan et al. (2005), Preszler et al. (2007), Schackow et al. (2004), and Slain et al. (2004)
Quality of learning Qualitative difference when learning with ARS (e.g., better explanations, thinking about important concepts, resolving misconceptions)
Caldwell (2007), d'lnverno et al. (2003), Draper and Brown (2004), Elliott (2003), Greer and Heaney (2004), and Nicol and Boyle (2003)
Assessment benefits Feedback Students and teacher like getting
regular feedback on understanding
Abrahamson (2006), Cline (2006), Draper et al. (2002), McCabe (2006), and Pelton and Pelton (2006)
Formative Assessment is done that improves student understanding and quality of teaching
Beatty (2004), Bergtrom (2006), Brewer (2004), Bullock et al. (2002), Caldwell (2007), Draper and Brown (2004), Dufresne and Gerace (2004), Elliott (2003), Greer and Heaney (2004), Hatch et al. (2005), Jackson et al. (2005), Siau et al. (2006), Simpson and Oliver (2007), and Stuart et al. (2004)
Compare Students compare their ARS responses to class responses
Burton (2006), Caldwell (2007), Draper and Brown (2004), Hinde and Hunt (2006), and Simpson and Oliver (2007)

34
Appendix B: Email sent to faculty requesting study participation
To: Campus Faculty Subject: Hi Guys - I need help please I believe my first email was a bit too long and possibly confusing so I’m going to simplify. I’m doing my dissertation research on Personal Response Systems (PRS - Clickers)
I would like to come to your CLASSROOM and gather some data for my dissertation using these devices – your benefit would be seeing them in action. The Study: I hand out clickers to a random group of students at beginning of class and give a short how-to on using the PRS (Turn it on, join class by pressing enter, then enter your answers when asked – very simple)
1. Whatever you are lecturing on I would like you to make TWO QUESTIONS TOTAL on that topic. Multiple choice or numerical answers preferred.
2. You lecture for a few minutes – ask them a question to see if they have absorbed what you’ve said.
3. I collect the answers and show you how many got it right vs. other answers. 4. You lecture for a few more minutes on your topic – ask them another question on
your topic. Right before they answer I will apply the treatment. 5. I collect the answers and show you how many got it right vs. other answers.
Done in about 10 minutes – real time feedback with your students. Let me know a day and time and I’ll fit my schedule to suite your needs. You can either send me the two questions prior to class so I can place them into a PowerPoint/PRS format to be projected (a mediated room will be necessary) or they can be sequentially displayed in class on paper, an Elmo, or chalkboard – whichever is easiest for you. PS: If you would like I can show up a bit early and show you some of its other features – of course it does quizzes/examinations only there is no Scantron to pay for and the software gives wonderful reports by class/student/etc. for assessment. It also can store up to 3 homework assignments of 30 questions each to be handed in at your convenience. For example they can

35
hand in an assignment and the software instantly grades it – you go over the assignment instantly with your class – more fast feedback. This PRS accepts multiple choice, T/F, numerical answers, and short word answers – the limit is 11 characters. Please, if you can help me I would greatly appreciate it – the bigger the classes the better starting at 20 students. Thank You Very Much, Roger Kendrick Chadron State College 1000 Main Street Chadron, NE 69337 [email protected] or [email protected]

36
Appendix C: IRB Approval


![no · PDF fileE. Kendrick Ma] 16-3 Round 4 Kendrick Gustilo E. Kendrick C. Lewis Kendrick Maj 16-4 ... Johnson South port puni Jayden Bowles Citrus Wrestlin Mason Wislon](https://static.fdocuments.us/doc/165x107/5a8ed0e57f8b9a4a268d68c8/no-kendrick-ma-16-3-round-4-kendrick-gustilo-e-kendrick-c-lewis-kendrick-maj.jpg)


![jkhf.infojkhf.info/Kendrick - 1933 - The Kendrick Gazette/1933...>]fOLUME XLIII KENDRICK, LATAH COUNTY, IDAHO, FRIDAY, AUGUST 25, 1933 H](https://static.fdocuments.us/doc/165x107/5feab4ae1cf62d15df09b106/jkhf-1933-the-kendrick-gazette1933-folume-xliii-kendrick-latah-county.jpg)