I THIS ISSUE Focusing on Undervalued, High Yielding Stocks
21
At Valuentum, our valuation process is unmatched. We explicitly forecast each item on a firm’s income statement and balance sheet and calculate the present value of the resulting future free cash flows long into the future to arrive at a fair value estimate of each company. We combine this extensive discounted cash- flow analysis with a relative value assessment that compares a firm’s forward price-to-earnings ratio and its price-earnings-to-growth (PEG) ratio to constituents in its industry group. Only companies that are trading at a discount to our fair value estimate and compare favorably to peers receive high marks in our book on the basis of valuation. As a result of this extensive and systematic valuation analysis, we’re able to uncover undervalued investment gems, and we’re also able to better assess the health and growth of a firm’s future dividend payments… Focusing on Undervalued, High Yielding Stocks In case you missed it, we plan to become the largest independent provider of in-depth, forward-looking dividend analysis on the market today. Here’s our press release announcing the news: Woodstock, IL, January 14, 2012—Valuentum Securities, Inc., a provider of independent investment research, has now made available 150 dividend reports on the largest companies in their coverage universe. During the next 12 months, Valuentum plans to produce dividend reports for up to 700 companies currently monitored by its analyst team. The reports are available with a subscription to Valuentum.com, the company’s investment Web site. I NSIDE T HIS I SSUE 1 Focusing on Undervalued, High Yielding Stocks 1 Valuentum to Publish Up to 700 Dividend Reports 2 Dividend Spotlight: Microsoft (ticker: MSFT) 3 Dividend Spotlight: Hasbro (ticker: HAS) 5 Our Dividend Growth Portfolio 6 How to Predict Management Actions and Dividend Cuts 7 Keeping Our Eyes on United Tech’s Yield (ticker: UTX) 8 Boeing’s Backlog Increases in 4Q; Watching the Dividend for Further Strength (ticker: BA) 8 Altria Posts Decent Fourth- Quarter Results; Dividend Yield Still Attractive (ticker: MO) 9 We Like JNJ's Dividend Growth Profile (ticker: JNJ) 10 P&G Reduces 2012 Outlook; We Expect Dividend Increase (ticker: PG) 11 Our Dividend Growth Watch List (see table for tickers) 11 Could GE’s Dividend Return to Its Glory Days? (ticker: GE) 13 It’s Another Great Year for McDonald’s (ticker: MCD) 14 Yields to Avoid (see article for tickers) 15 Featured Reports: Superior, Verizon, Chicago Rivet, Harris 19 Our Valuentum Buying Index 21 Valuentum Definitions February 1, 2012 Volume 1 Issue 2 By Brian Nelson, CFA Valuentum to Publish Up to 700 Dividend Reports on the Largest Companies By Valuentum Editorial Staff Please see Focusing on Undervalued, High Yielding Stocks on page 2 Please see Valuentum to Publish Up to 700 Dividend Reports…on page 4 Valuentum Securities Inc. www.valuentum.com [email protected] OUR DIVIDEND GROWTH NEWSLETTER Brian Nelson, CFA President, Equity Research [email protected] © 2012 Valuentum. All rights reserved. Reproduction by any means is prohibited.
Transcript of I THIS ISSUE Focusing on Undervalued, High Yielding Stocks

At Valuentum, our valuation process is unmatched. We explicitly forecast each item on a firm’s income statement and balance sheet and calculate the present value of the resulting future free cash flows long into the future to arrive at a fair value estimate of each company. We combine this extensive discounted cash-flow analysis with a relative value assessment that compares a firm’s forward price-to-earnings ratio and its price-earnings-to-growth (PEG) ratio to constituents in its industry group. Only companies that are trading at a discount to our fair value estimate and compare favorably to peers receive high marks in our book on the basis of valuation.
As a result of this extensive and systematic valuation analysis, we’re able to uncover undervalued investment gems, and we’re also able to better assess the health and growth of a firm’s future dividend payments…
Focusing on Undervalued, High Yielding Stocks
In case you missed it, we plan to become the largest independent provider of in-depth, forward-looking dividend analysis on the market today. Here’s our press release announcing the news:
Woodstock, IL, January 14, 2012—Valuentum Securities, Inc., a provider of independent investment research, has now made available 150 dividend reports on the largest companies in their coverage universe. During the next 12 months, Valuentum plans to produce dividend reports for up to 700 companies currently monitored by its analyst team. The reports are available with a subscription to Valuentum.com, the company’s investment Web site.
I N S I D E T H I S I S S U E 1 Focusing on Undervalued, High
Yielding Stocks
1 Valuentum to Publish Up to 700 Dividend Reports
2 Dividend Spotlight: Microsoft (ticker: MSFT)
3 Dividend Spotlight: Hasbro (ticker: HAS)
5 Our Dividend Growth Portfolio
6 How to Predict Management Actions and Dividend Cuts
7 Keeping Our Eyes on United Tech’s Yield (ticker: UTX)
8 Boeing’s Backlog Increases in 4Q; Watching the Dividend for Further Strength (ticker: BA)
8 Altria Posts Decent Fourth-Quarter Results; Dividend Yield Still Attractive (ticker: MO)
9 We Like JNJ's Dividend Growth Profile (ticker: JNJ)
10 P&G Reduces 2012 Outlook; We Expect Dividend Increase (ticker: PG)
11 Our Dividend Growth Watch List (see table for tickers)
11 Could GE’s Dividend Return to Its Glory Days? (ticker: GE)
13 It’s Another Great Year for McDonald’s (ticker: MCD)
14 Yields to Avoid (see article for tickers)
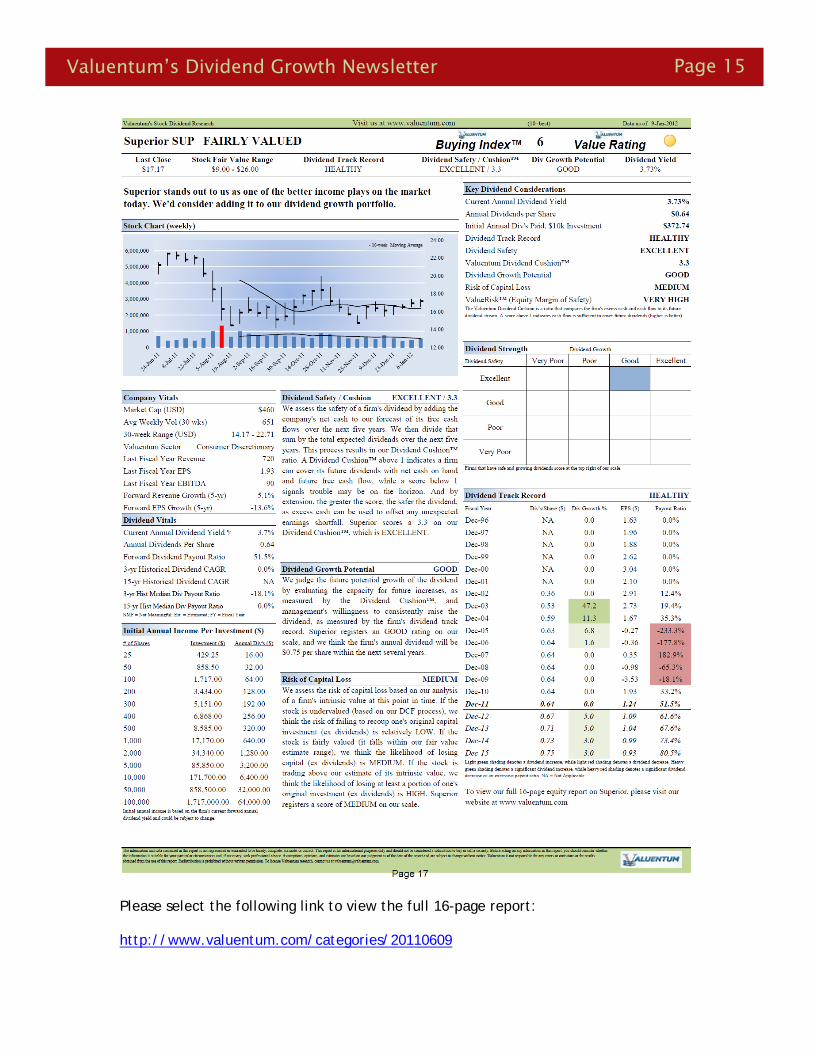
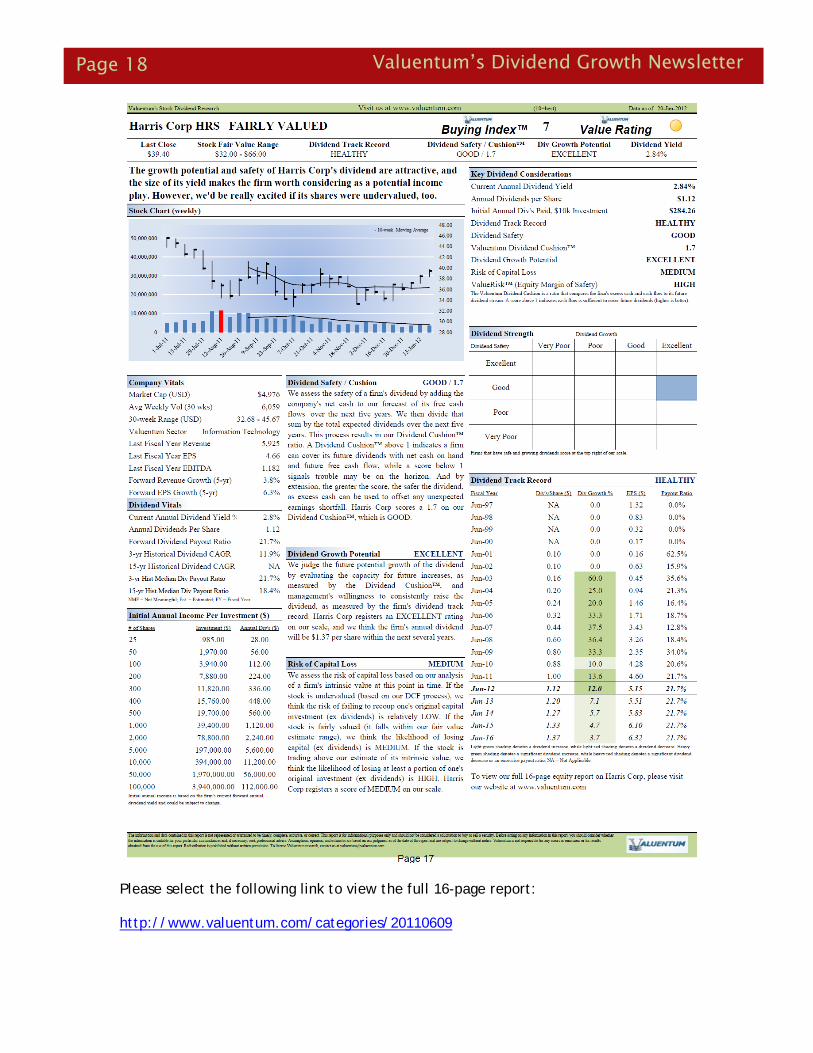
15 Featured Reports: Superior, Verizon, Chicago Rivet, Harris
19 Our Valuentum Buying Index
21 Valuentum Definitions
February 1, 2012 Volume 1 Issue 2
By Brian Nelson, CFA
Valuentum to Publish Up to 700 Dividend Reports on the Largest Companies By Valuentum Editorial Staff
Please see Focusing on Undervalued, High Yielding Stocks on page 2
Please see Valuentum to Publish Up to 700 Dividend Reports…on page 4
Valuentum Securities Inc. www.valuentum.com [email protected]
OUR DIVIDEND GROWTH NEWSLETTER
Brian Nelson, CFA
President, Equity Research
© 2012 Valuentum. All rights reserved.
Reproduction by any means is prohibited.

Page 2 Valuentum’s Dividend Growth Newsletter
A ten-year chart of Microsoft (MSFT) is not a pretty sight. Excludingthe return from dividends, shares are down a little over 10%, and the PE (price-to-earnings) ratio has contracted from above 40 to, at times, below 10. In the same time period, Microsoft has gone from a Wall Street tech darling that dominated computing to a dinosaur, legacy tech-company. Regardless of how accurate such a description may be, investors have fled in droves to Apple (AAPL), which makes innovative consumer devices that have impressed the masses.
During this same time period, Microsoft has had a few wins, including Windows 7, continued excellence with its Office products, Xbox, and Kinect. Throughout the same period we’ve also seen the Zune, unsuccessful tablets, a weak mobile strategy, and Windows Vista. Clearly, it’s been a bit of a mixed bag. But at Valuentum, we look towards the future for profitable investments, and we think it looks pretty promising at Microsoft. With shares trading around $30, we think the company has meaningful upside and a very attractive dividend payout that should not only grow, but also protect investors from substantial downside.
Though we talk about our Valuentum Dividend Cushion™ quite a bit, we think it is the most innovative dividend-cut predictor that investors have at their fingertips to evaluate the health of a firm’s dividend. Followers of Valuentum know that most companies cut dividend payments primarily because cash is expected to be tight for an undefined period into the future (due to a permanent, secular decline in demand for their products, a restructuring, transformation acquisition, or other)--not because they have a hiccup in any one period in reported accounting earnings and/or a temporary elevated dividend payout ratio.
As such, by overlaying our extensive discounted cash-flow and relative-value methodology with an assessment of a firm’s Valuentum Dividend Cushion™, we’re able to identify firms that have the lowest risk of capital loss (the highest probability of capital appreciation) and the greatest likelihood of dividend growth. No other equity research firm does this for their subscribers, and we seek to deliver the cream of the crop of such ideas to investors in our Dividend Growth portfolio. We’re proud to say that we’re off to a good start, with our portfolio thus far outpacing its respective benchmark, the Dow Jones Select Dividend Index Fund (DVY), by about 270 basis points since inception (January 1, 2012).
Focusing on Undervalued, High Yielding Stocks from page 1
Dividend Spotlight: Microsoft (MSFT) Will Microsoft’s Mobile Strategy Lead to its Revival? By Valuentum Analysts
Please see Dividend Spotlight: Microsoft on page 12
“…by overlaying our extensive discounted cash-flow and relative-value methodology with an assessment of a firm’s Valuentum Dividend Cushion, we’re able to identify firms that have the lowest risk of capital loss…and the greatest likelihood of dividend growth.”
Valuentum’s Dividend Growth Newsletter Page 3
With the invention of intuitive iPads and the interactive Xbox Kinect, you would think children would be ready for technology to take over their childhoods. And that may be correct. iBook 2 might shift learningexclusively to the digital world. In the meantime, kids are still kids, and they still enjoy playing with toys. Though it’s unreasonable to expect toys to absolutely explode in popularity, they’ve been around for hundreds of years, and they won’t go completely out of fashion tomorrow.
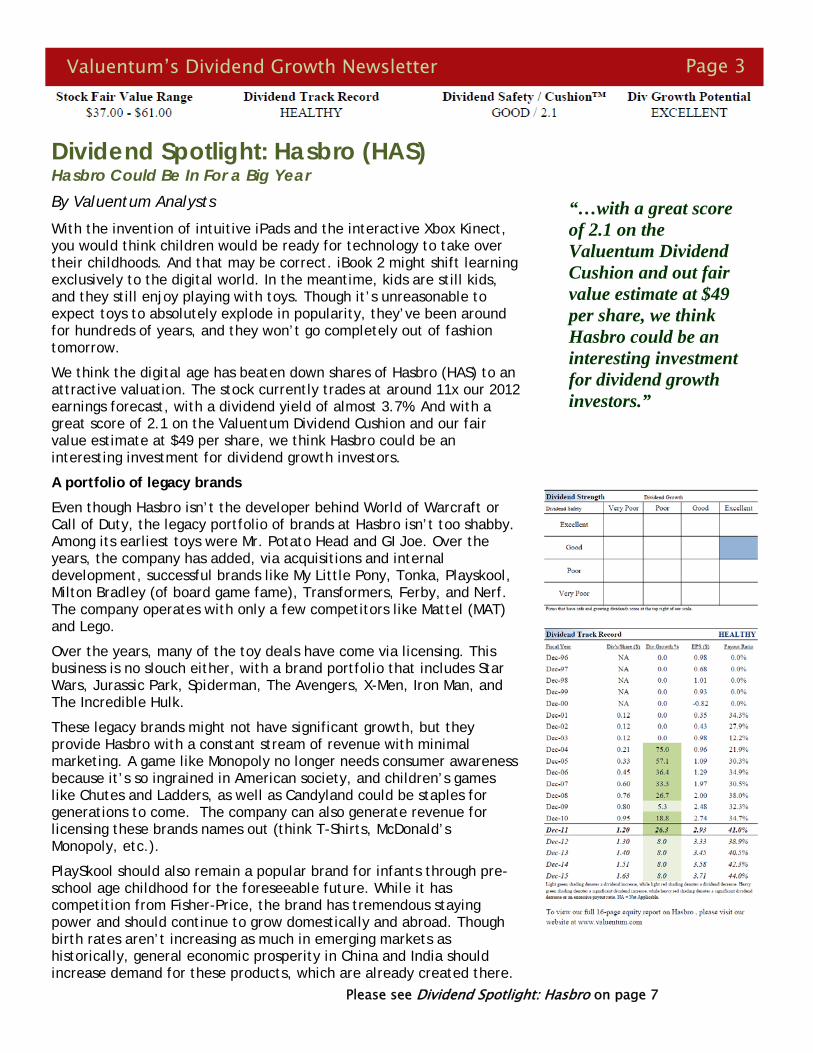
We think the digital age has beaten down shares of Hasbro (HAS) to an attractive valuation. The stock currently trades at around 11x our 2012 earnings forecast, with a dividend yield of almost 3.7%. And with a great score of 2.1 on the Valuentum Dividend Cushion and our fair value estimate at $49 per share, we think Hasbro could be an interesting investment for dividend growth investors.
A portfolio of legacy brands
Even though Hasbro isn’t the developer behind World of Warcraft or Call of Duty, the legacy portfolio of brands at Hasbro isn’t too shabby. Among its earliest toys were Mr. Potato Head and GI Joe. Over the years, the company has added, via acquisitions and internal development, successful brands like My Little Pony, Tonka, Playskool, Milton Bradley (of board game fame), Transformers, Ferby, and Nerf. The company operates with only a few competitors like Mattel (MAT) and Lego.
Over the years, many of the toy deals have come via licensing. This business is no slouch either, with a brand portfolio that includes Star Wars, Jurassic Park, Spiderman, The Avengers, X-Men, Iron Man, and The Incredible Hulk.
These legacy brands might not have significant growth, but they provide Hasbro with a constant stream of revenue with minimal marketing. A game like Monopoly no longer needs consumer awareness because it’s so ingrained in American society, and children’s games like Chutes and Ladders, as well as Candyland could be staples for generations to come. The company can also generate revenue for licensing these brands names out (think T-Shirts, McDonald’s Monopoly, etc.).
PlaySkool should also remain a popular brand for infants through pre-school age childhood for the foreseeable future. While it has competition from Fisher-Price, the brand has tremendous staying power and should continue to grow domestically and abroad. Though birth rates aren’t increasing as much in emerging markets as historically, general economic prosperity in China and India should increase demand for these products, which are already created there.
Dividend Spotlight: Hasbro (HAS) Hasbro Could Be In For a Big Year By Valuentum Analysts “…with a great score
of 2.1 on the Valuentum Dividend Cushion and out fair value estimate at $49 per share, we think Hasbro could be an interesting investment for dividend growth investors.”
Please see Dividend Spotlight: Hasbro on page 7

Page 4 Valuentum’s Dividend Growth Newsletter
Valuentum to Publish Up to 700 Dividend Reports… from page 1
“We strive to be the champion of the individual investor, and our dividend reports are targeted to meet the needs of those seeking out high-yielding, undervalued investment gems.” said Brian Nelson, president of equity research at Valuentum. “The proliferation of untrustworthy financial opinions on the web and the preponderance of backward-looking dividend analysis have left the income investor misguided in today’s difficult market environment. Individual investors can count on Valuentum to provide the most comprehensive forward-looking dividend analysis on the web today."
Valuentum began providing equity research last year, including premium commentary, a Best Ideas Newsletter, and proprietary Valuentum data points. Valuentum analysts perform rigorous discounted cash-flow analysis, assess underlying risks of the investment, and evaluate technical and momentum indicators of a stock in order to pinpoint the best time to buy the most attractive equity investments. Valuentum also launched its Dividend Growth Newsletter, which offers individual investors an actively-managed dividend-growth portfolio, earlier this year.
Valuentum provides the following in each edition of its monthly Dividend Growth Newsletter:
A portfolio of the best dividend growth stocks that it thinks will generate a safe and growing stream of cash flows.
• A forward-looking assessment of the dividend safety of hundreds of firms through its innovative, predictive dividend-cut indicator, the Valuentum Dividend Cushion™. The research firm uses future forecasts for free cash flow and expected dividends and considers a company's net cash position to make sure that each company is able to pay out such dividend obligations -- long into the future.
• Commentary and analysis about firms in its actively-managed portfolio and on any new dividend growth ideas to consider.
• Helpful screens that overlay its Valuentum Buying Index™ with dividend-payers that have safe and growing dividends.
• Email alerts notifying subscribers of any changes it makes to the portfolio, and whether material events have happened to companies held within it.
For additional information about Valuentum and its equity research services (including a list of dividend reports available), please visit the firm's investment website:
http://www.valuentum.com/
“We strive to be the champion of the individual investor, and our dividend reports are targeted to meet the needs of those seeking out high-yielding, undervalued investment gems. The proliferation of untrustworthy financial opinions on the web and the preponderance of backward-looking dividend analysis have left the income investor misguided in today’s difficult market environment. Individual investors can count on Valuentum to provide the most comprehensive, forward-looking dividend analysis on the web today.”
Valuentum’s Dividend Growth Newsletter Page 5
Standard Disclaimer: Our Dividend Growth portfolio is for information purposes only and should not be considered a solicitation to buy or sell any security. Valuentum is not responsible for any errors or omissions or for results obtained from the use of our Dividend Growth Newsletter and accepts no liability for how readers may choose to utilize the content.
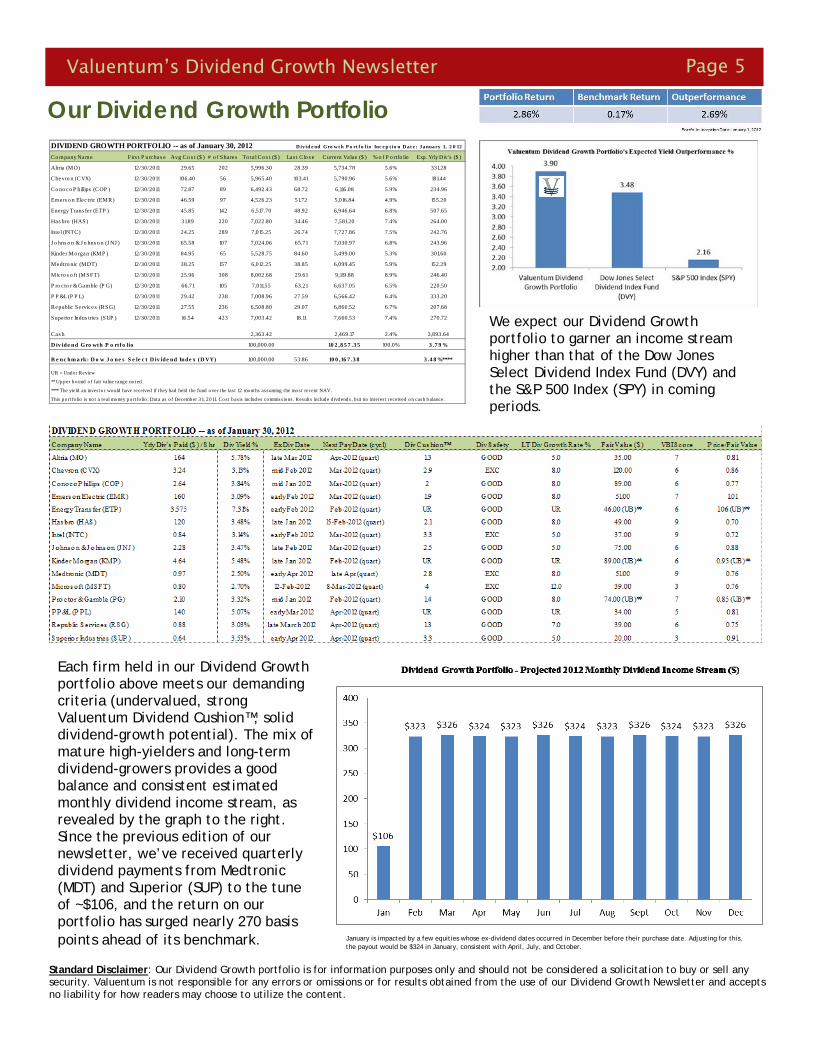
We expect our Dividend Growth portfolio to garner an income stream higher than that of the Dow Jones Select Dividend Index Fund (DVY) and the S&P 500 Index (SPY) in coming periods.
Each firm held in our Dividend Growth portfolio above meets our demanding criteria (undervalued, strong Valuentum Dividend Cushion™, solid dividend-growth potential). The mix of mature high-yielders and long-term dividend-growers provides a good balance and consistent estimated monthly dividend income stream, as revealed by the graph to the right. Since the previous edition of our newsletter, we’ve received quarterly dividend payments from Medtronic (MDT) and Superior (SUP) to the tune of ~$106, and the return on our portfolio has surged nearly 270 basis points ahead of its benchmark. January is impacted by a few equities whose ex-dividend dates occurred in December before their purchase date. Adjusting for this,
the payout would be $324 in January, consistent with April, July, and October.
Our Dividend Growth Portfolio DIVIDEND GROWTH PORTFOLIO -- as of January 30, 2012 D ivid e nd Gro w t h P o rt f o lio Inc e p t io n D at e : Ja nua ry 1, 2 0 12
Co mpany Name Firs t P urchas e Avg Co s t ($ ) # o f Shares To ta l Co s t ($ ) Las t Clo s e Current Value ($ ) % o f P o rtfo lio Exp. Yrly Div's ($ )
Altria (MO) 12/30/2011 29.65 202 5,996.30 28.39 5,734.78 5.6% 331.28
Chevro n (CVX) 12/30/2011 106.40 56 5,965.40 103.41 5,790.96 5.6% 181.44
Co no co P hillips (COP ) 12/30/2011 72.87 89 6,492.43 68.72 6,116.08 5.9% 234.96
Emers o n Elec tric (EMR) 12/30/2011 46.59 97 4,526.23 51.72 5,016.84 4.9% 155.20
Energy Trans fer (ETP ) 12/30/2011 45.85 142 6,517.70 48.92 6,946.64 6.8% 507.65
Has bro (HAS) 12/30/2011 31.89 220 7,022.80 34.46 7,581.20 7.4% 264.00
Inte l (INTC) 12/30/2011 24.25 289 7,015.25 26.74 7,727.86 7.5% 242.76
J o hns o n & J o hns o n (J NJ ) 12/30/2011 65.58 107 7,024.06 65.71 7,030.97 6.8% 243.96
Kinder Mo rgan (KMP ) 12/30/2011 84.95 65 5,528.75 84.60 5,499.00 5.3% 301.60
Medtro nic (MDT) 12/30/2011 38.25 157 6,012.25 38.85 6,099.45 5.9% 152.29
Micro s o ft (MSFT) 12/30/2011 25.96 308 8,002.68 29.61 9,119.88 8.9% 246.40
P ro c to r & Gamble (P G) 12/30/2011 66.71 105 7,011.55 63.21 6,637.05 6.5% 220.50
P P &L (P P L) 12/30/2011 29.42 238 7,008.96 27.59 6,566.42 6.4% 333.20
Republic Se rvices (RSG) 12/30/2011 27.55 236 6,508.80 29.07 6,860.52 6.7% 207.68
Superio r Indus tries (SUP ) 12/30/2011 16.54 423 7,003.42 18.11 7,660.53 7.4% 270.72
Cas h 2,363.42 2,469.17 2.4% 3,893.64
D iv ide nd Gro wth P o rtfo lio 100,000.00 10 2 ,8 5 7 .3 5 100.0% 3 .7 9 %
B e nc hm a rk: D o w J o ne s S e le c t D iv ide nd Inde x (D VY) 100,000.00 53.86 10 0 ,16 7 .3 8 3 .4 8 %****
UR = Under Review
** Up per b ound o f fair value range no ted .
**** The yield an inves to r would have received if they had held the fund over the las t 12 mo nths assuming the mo st recent NAV.
This po rtfo lio is no t a real mo ney p ort fo lio . Data as o f December 3 1, 20 11. Co st basis includes commissions . Results includ e d ivd ends , b ut no interest received o n cash b alance.

Page 6 Valuentum’s Dividend Growth Newsletter
The forward-looking Valuentum Dividend Cushion is a ratio that gauges the safety of a dividend over time. As you may have noticed, most dividend analysis out there is backward-looking – meaning it rests on what the firm has done in the past. Although analyzing historical trends is important, we think assessing what may happen in the future is even more important. After all, investors are looking to the future, not using a rear-view mirror to pick the best dividend-growth stocks.
In the case of a company like Alcoa (AA), the forward-looking Valuentum Dividend Cushion and historical trend analysis come together to explain what we’re seeing with the firm today. According to our dividend-growth methodology, a ratio below 1 for the Valuentum Dividend Cushion signals that the firm’s dividend may not be safe—that is, management (the board) may choose to cut its dividend or may not have the funds to continue paying or raising the dividend. As of December 2011, this ratio sits at 0 for Alcoa (yes, 0), indicating “very poor” dividend safety as well as “very poor” dividend growth potential (view header).
Faced with this score of 0, investors can expect management to focus more on cash flow than earnings, particularly as it looks to maintain its dividend. And perhaps to little surprise, that's exactly what Alcoa's management is focusing on in 2012; our full earnings note on Alcoa can be found at the following link:
http://www.valuentum.com/articles/20120110_1
The Valuentum Dividend Cushion is a powerful tool. It not only helps to protect investors against investing in firms that may cut their dividend, but—in many cases—it also allows investors to assess and anticipate management's actions and financial goals, particularly in times of corporate stress. We make our Valuentum Dividend Cushion™ score available for all firms in our coverage universe.
Interestingly, like all other firms in our coverage universe (except Marriot, which subsequently raised it above pre-cut levels), the Valuentum Dividend Cushion™ would have predicted Alcoa's dividend cut in 2009. In that year, the aluminum producer slashed its quarterly dividend – from 17 cents per share to 3 cents per share – in order to preserve cash in the downturn (view table in the top right).
Reconstructing the ratio from historical data gives a result below 1, signaling trouble on the horizon for the dividend and the firm’s inability to cover future dividend expense. Perhaps needless to say, we think income investors should steer clear of Alcoa's shares and keep an eye on the Dividend Cushion of firms held in their portfolios.
How to Predict Management’s Actions and Dividend Cuts Valuentum Dividend Case Study: Alcoa (AA) By Valuentum Analysts
“The Valuentum Dividend Cushion not only helps to protect investors against investing in firms that may cut their dividend, but—in many cases—it also allows investors to assess and anticipate management’s actions, particularly in times of corporate stress.”

Valuentum’s Dividend Growth Newsletter Page 7
Where’s the growth without video games?
While there may be a generational shift towards video games, there is ample opportunity for the company to gradually grow revenues and expand margins. For 2012, Hasbro will produce the toys for several major films, including The Avengers, Star Wars Episode I: The Phantom Menace, Spiderman, and GI Joe. Each presents an interesting opportunity for collectors of everything related to Star Wars and the Marvel Comic films. The company can release higher priced, limited editions items for these films. Furthermore, Star Wars’ popularity should accelerate with the re-release of it as a 3D experience, exciting younger children and collectors.
GI Joe provides an excellent opportunity, since Hasbro actually created the brand and will license out the film. The last was a blockbuster hit, and this upcoming film, with a star-heavy cast, should perform even better. It may not be able to provide the company with tremendous top-line growth, but it should help offset some of the natural decline of older legacy brands as well as non-electronic toys.
Even if it’s a slow decline, the business continues to throw tons of cash
During the worst year of the most recent recession, 2009, Hasbro still earned over $100 million in free cash flow, which increased to over $300 million last year. Without significant financial leverage, we think this number should steadily increase over the next several years. If this continues, we think management will continue to increase the dividend and buy back loads of stock, as it has done over the past few years.
Ultimately, the company does not deserve a large multiple, but with free cash flow steadily increasing, a strong business portfolio, and streams of new revenue growth, we think the shares are undervalued. With a large dividend and significant room for further expansion, we think it’s one of the best opportunities in the portfolio of our Dividend Growth Newsletter.
United Technologies (UTX) rounded out a solid 2011 with another decent but less-than-impressive quarter. Though we plan to revisit our assumptions on the industrial conglomerate, we don’t expect to make a material change to our fair value estimate at this time.
Organic revenue growth was a mere 2% in the fourth-quarter, but the meager growth was more due to significant strength in the aerospace aftermarket in the prior-year period than any underlying weakness in this quarter. Order growth, however, was a bit lighter than we had hoped. New equipment orders at Otis advanced only 2%, while commercial HVAC new equipment orders at Carrier expanded 5%. Commercial spares orders at Hamilton Sundstrand were up 17%, but spares orders at Pratt & Whitney’s large engine business fell 16%, lapping 45% growth in the prior-year period. We expect some pressure at Sikorski given the increased pressure on military spending under the current and perhaps next administration.
United Tech’s fourth-quarter adjusted segment operating margin came in at 15.4%, roughly 20 basis points better than the year-ago measure, despite higher research and development expense. Fourth-quarter earnings per share came in at $1.47, up 12% and slightly better than consensus expectations. Looking ahead, United Tech is confident that it will deliver on its previously-issued 2012 earnings per share guidance of $5.80 to $6 (up 6% to 9%), excluding its recent acquisition of Goodrich. The firm’s sales, excluding Goodrich, are expected to hit $60 billion, and the firm expects free cash flow conversion to be 100% of net income, which would reflect strong earnings quality.
All things considered, we like United Tech and would strongly consider adding it to our portfolios on a pullback to the low $70s/high $60s, the lower end of our fair value range. At these levels, the firm would provide investors with a ~3% annual dividend yield and tremendous growth prospects.
Dividend Spotlight: Hasbro continued from page 3 Keeping Our Eyes on United Tech’s Yield By Valuentum Analysts

Page 8 Valuentum’s Dividend Growth Newsletter
The Boeing Co. (BA) reported fourth-quarter resultsthat showed continued cost pressures as it relates to its pension obligations but more importantly a surging commercial aerospace backlog. We’ll be evaluating our long-term assumptions for Boeing, but we don’t expect to make a material change to our fair value estimate at this time.
Though we have little interest in opening up a position in Boeing at this time, given its fairly valued status and the substantial execution risk embedded in achieving its aggressive commercial delivery schedule (and its at-risk defense exposure due to impending budget cuts), we are closely watching its dividend should its yield become increasingly more attractive.
Boeing issued earnings-per-share guidance for 2012 that disappointed most investors due to higher pension expense, but we’re most interested in Boeing’s pace of orders and its ability to execute on higher production rates (think cash flow). Its commercial airplane segment booked 379 net orders during the quarter and 805 during the full year, pushing the backlog of unfulfilled deliveries to over 3,700 planes valued at $296 billion. To put this in perspective, Boeing delivered 477 commercial aircraft during 2011, so its backlog of unfulfilled deliveries is nearly 8 times current production rates, providing increased visibility through the next economic cycle. In 2012, Boeing expects to deliver between 585 and 600 airplanes, nearly 26% growth at the high end. In fact, delivery slots for 2012 are sold out, and we’ll likely witness 35 to 40 787 Dreamliner deliveries to customers.
We have an overweight position in aerospace in our Best Ideas Newsletter and view Boeing as the best income play for exposure to the coming boom in aerospace deliveries. The firm remains a key idea for our dividend-growth watch list, particularly with its 3.1 score on the Valuentum Dividend Cushion. We expect Boeing to increase its dividend further in 2012, to $1.80 per share (from $1.76 per share currently)—view table at the top right of page.
Altria Posts Decent Fourth-Quarter Results; Dividend Yield Still Attractive By Valuentum Analysts Altria (MO) posted fourth-quarter results that showed strength in its smokeless product volume and higher pricing in its cigarette segment. We continue to like the firm’s exceptional dividend yield at today’s prices and think Altria remains a key component of both our Best Ideas and Dividend Growth portfolios. Our fair value estimate for Altria remains unchanged.
Altria’s total fourth-quarter net revenues advanced 3.4% due to increased performance across all of its reportable segments. The company’s cigarette segment’s net revenue advanced about 3% thanks to higher list prices, offset in part by lower volume. Revenue in the
Altria Posts Decent Fourth Quarter Results… continued on next page
Boeing’s Backlog Increases in Fourth Quarter; Watching the Dividend for Further Strength By Valuentum Analysts

Valuentum’s Dividend Growth Newsletter Page 9
company’s smokeless products’ segment increased 6.6% thanks to both higher volume and pricing. Total combined shipment volume for its Copenhagen and Skoal products increased an impressive 13% from the same period a year ago. The cigars segment also saw nice growth, as net revenues advanced over 7% in the fourth quarter, and its wine segment experienced nearly 11% revenue growth.
Total operating companies income (OCI) at Altria, adjusted for asset impairment and exit costs, increased 5.8% in the fourth-quarter. The firm’s adjusted diluted earnings-per-share in the fourth quarter jumped 13.6%, to $0.50 per share, up from $0.44 per share in the same period a year ago. Adjusted cigarette segment income grew 13.7% in the fourth quarter primarily due to higher list prices, partially offset by lower volume in its ‘premium’ cigarette category, which fell over 7% in the quarter (volume for Marlboro cigarettes, however, dropped 0.6%). Adjusted cigarette segment margins increased 3.2 percentage points, to 38.8% in the fourth quarter. We continue to expect margin expansion in the cigarette segment as pricing initiatives continue to drive higher profitability. Adjusted segment income for its smokeless products increased 3.6% in the fourth quarter from the same period a year ago, though margins did decline a bit (1.9 percentage points) due to higher promotional activity. The cigar segment showed a nice improvement in adjusted income, and its wine segment revealed nearly 23% income expansion. On a full-year adjusted basis, earnings-per-share increased 7.9% to $2.05 per share in 2011, up from $1.90 per share last year.
Looking ahead, Altria expects 2012 full-year adjusted diluted earnings per share to be in the range of $2.17 to $2.23, representing a growth rate of about 6% to 9% from 2011 levels. The firm noted that it expects to continue to return a large amount of cash to shareholders in the form of dividends and maintained its target dividend payout ratio of 80% of its adjusted diluted earnings per share. By extension, we conservatively expect a dividend increase of 5% in 2012 to an annual payout of at least $1.72 per share for an annual dividend yield of 6.1%.
Johnson & Johnson Posts 4QResults; We Like JNJ's Dividend Growth Profile Johnson & Johnson (JNJ) reported mixed fourth-quarter results. Though we weren’t exactly enthralled by the firm’s performance, we believe JNJ to be a key holding in the portfolio of our Dividend Growth Newsletter. Our fair value estimate for JNJ is unchanged at this time.
The company’s fourth-quarter and full-year 2011 sales increased 3.9% and 5.6%, respectively, from the same period last year. Revenue increased in all three segments--consumer, pharmaceuticals, and medical devices/diagnostics--led by strong international growth. Drugs such as Stelara and Remicade continue to garner high demand, while new applications for Xarelto may contribute to expansion in coming quarters.
Though the top-line expansion was decent, recalls and related charges--including litigation and product liability--continued to plague JNJ’s bottom line, amounting to significant after-tax charges. Net earnings, as a result, fell to just $218 million in 2011 from $1.9 billion in 2010 (earnings per share of $0.08 versus $0.70 in the prior year). Excluding special items, net earnings came in at $3.1 billion, or $1.13 per share (about 9%-10% growth). The recall of hip replacement devices in the DePuy division as well as the shutdown of a manufacturing facility for consumer OTC are just a few of JNJ’s ongoing concerns.
Looking ahead, JNJ expects full-year 2012 earnings per share to come in between $5.05 and $5.15 per share, below consensus estimates. This is on the heels of operational growth of 3.5% and 5.5% for the year, offset in part by negative currency head winds. Despite the lower-than-expected profit levels for 2012, we think JNJ remains on track to achieve our long-term projections, so we won’t be making any changes to our fair value estimate at this time. JNJ remains one of our top dividend-growth picks, and the firm’s first-quarter dividend of $0.57 will be payable March 13.
By Valuentum Analysts
Altria Posts Decent Fourth Quarter Results… continued from previous page
Page 10 Valuentum’s Dividend Growth Newsletter
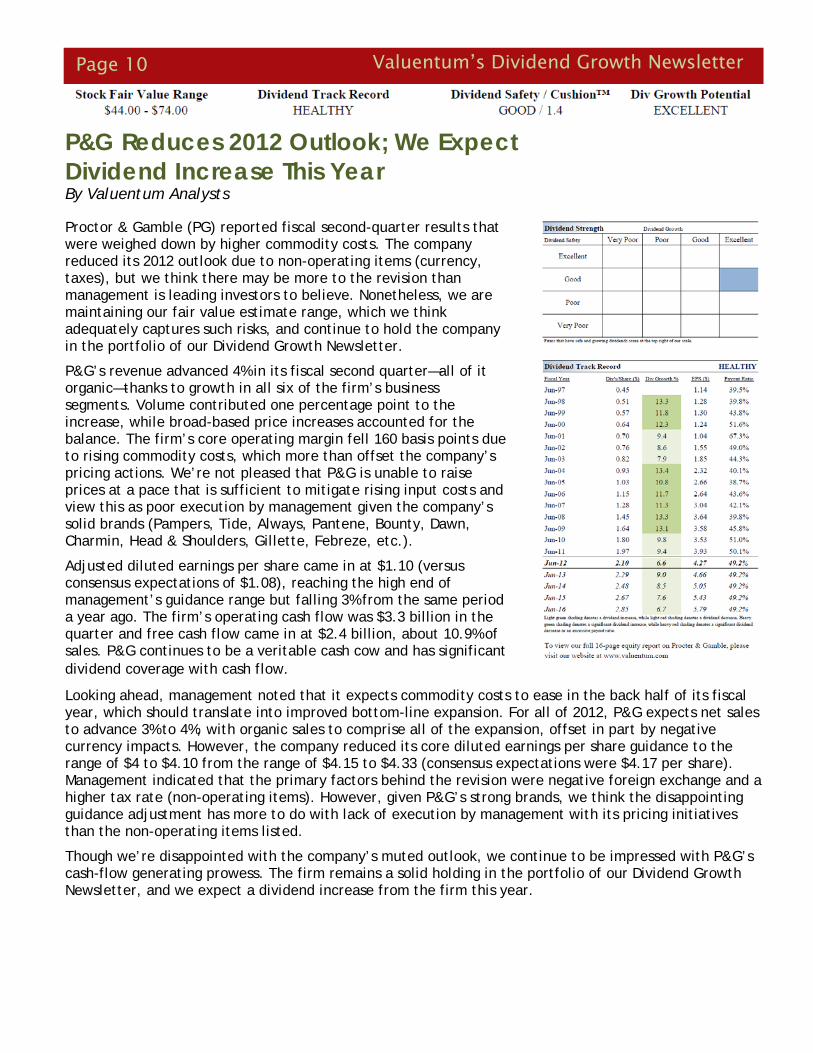
Proctor & Gamble (PG) reported fiscal second-quarter results that were weighed down by higher commodity costs. The company reduced its 2012 outlook due to non-operating items (currency, taxes), but we think there may be more to the revision than management is leading investors to believe. Nonetheless, we are maintaining our fair value estimate range, which we think adequately captures such risks, and continue to hold the company in the portfolio of our Dividend Growth Newsletter.
P&G’s revenue advanced 4% in its fiscal second quarter—all of it organic—thanks to growth in all six of the firm’s business segments. Volume contributed one percentage point to the increase, while broad-based price increases accounted for the balance. The firm’s core operating margin fell 160 basis points due to rising commodity costs, which more than offset the company’s pricing actions. We’re not pleased that P&G is unable to raise prices at a pace that is sufficient to mitigate rising input costs and view this as poor execution by management given the company’s solid brands (Pampers, Tide, Always, Pantene, Bounty, Dawn, Charmin, Head & Shoulders, Gillette, Febreze, etc.).
Adjusted diluted earnings per share came in at $1.10 (versus consensus expectations of $1.08), reaching the high end of management’s guidance range but falling 3% from the same period a year ago. The firm’s operating cash flow was $3.3 billion in the quarter and free cash flow came in at $2.4 billion, about 10.9% of sales. P&G continues to be a veritable cash cow and has significant dividend coverage with cash flow.
P&G Reduces 2012 Outlook; We Expect Dividend Increase This Year By Valuentum Analysts
Looking ahead, management noted that it expects commodity costs to ease in the back half of its fiscal year, which should translate into improved bottom-line expansion. For all of 2012, P&G expects net sales to advance 3% to 4%, with organic sales to comprise all of the expansion, offset in part by negative currency impacts. However, the company reduced its core diluted earnings per share guidance to the range of $4 to $4.10 from the range of $4.15 to $4.33 (consensus expectations were $4.17 per share). Management indicated that the primary factors behind the revision were negative foreign exchange and a higher tax rate (non-operating items). However, given P&G’s strong brands, we think the disappointing guidance adjustment has more to do with lack of execution by management with its pricing initiatives than the non-operating items listed.
Though we’re disappointed with the company’s muted outlook, we continue to be impressed with P&G’s cash-flow generating prowess. The firm remains a solid holding in the portfolio of our Dividend Growth Newsletter, and we expect a dividend increase from the firm this year.

Valuentum’s Dividend Growth Newsletter Page 11
Our Dividend Growth Watch List By Valuentum Analysts
Our dividend-growth watch list continues to be filled with potential ideas for your portfolio. We may replace firms held in our portfolio with companies found in the table below should their dividend growth potential (and/or total return potential) become relatively more attractive than portfolio constituents’. We continue to scour our coverage universe for firms to add to our dividend-growth watch list, which we update in every edition of our Dividend Growth Newsletter.
To access the dividend reports of companies on our watch list, please click here.
Could General Electric’s Dividend Return to Its Glory Days? By Valuentum Analysts
General Electric (GE) reported fourth-quarter results that showed strong organic revenue growth, a surge in infrastructure orders, and continued improvement at GE Capital. We continue to watch GE’s industrial backlog closely, and its continued growth to record levels suggests to us that the global economy is healthier than most pundits believe.
GE’s total revenue expanded 4% (excluding NBCU) in the quarter, and the firm’s industrial revenue growth came in at 10% on the heels of organic expansion of 5%. Infrastructure orders jumped 15% (organic orders increased 9%) during the quarter, with equipment orders up 23% and services up 7%. Notably, industrial segment emerging market orders increased a whopping 26% from the same period a year ago. GE had a book-to-bill of 1.23 in the quarter and ended the year with an impressive industrial backlog of $200 billion (up from $191 billion in the previous quarter), the largest in its history. Energy and aviation orders led the
Could General Electric’s Dividend…continued on page 13
DIVIDEND GROWTH WATCH LIST - as of January 30, 2012
Co mpany Name Yrly Div's P a id ($ ) / Shr Div Yie ld % Div Cus hio n™ Div Sa fe ty LT Div Gro wth Rate % Fair Value ($ ) VBI Sco re P rice /Fair Value Las t Clo s e ($ )
ADP (ADP ) 1.58 2.88% 2.3 GOOD 8.0 48.00 6 1.14 54.90
N EW : Analo g Devices (ADI) 1.00 2.56% 3.7 EXC 8.0 42.00 6 0.93 39.08
Avo n P ro ducts (AVP ) 0.92 5.12% 1.5 GOOD 4.0 26.00 6 0.69 17.98
Bemis (BMS) 0.96 3.04% UR UR UR 27.00 6 1.17 31.55
Bo eing (BA) 1.76 2.37% 3.1 EXC 7.0 77.00 3 0.96 74.16
N EW : Chicago Rivet (CVR) 0.60 3.24% 3.5 EXC 8.0 48.00 6 0.39 18.50
Co ca-Co la (KO) 1.88 2.79% 1.9 GOOD 6.0 65.00 3 1.04 67.46
Co lgate -P almo live (CL) 2.32 2.59% 1.9 EXC 8.0 75.00 3 1.19 89.51
Duke Energy (DUK) 1.00 4.73% UR GOOD UR 18.00 5 1.17 21.13
N EW : DuP o nt (DD) 1.64 3.22% 1.7 GOOD 5.0 60.00 4 0.85 50.97
N EW : Ea to n (ETN) 1.36 2.74% 1.6 GOOD UR 52.00 6 0.96 49.66
N EW : Exxo n (Mo bil (XOM) 1.88 2.20% 2.4 GOOD 5.0 78.00 6 1.10 85.49
Genera l Dynamics (GD) 1.88 2.72% 3.1 EXC 8.0 73.00 3 0.95 69.17
N EW : Genuine P arts (GP C) 1.80 2.80% 1.7 GOOD 5.0 47.00 4 1.37 64.26
N EW : Harris (HRS) 1.12 2.86% 2.1 GOOD 5.0 49.00 7 0.80 39.21
Ho neywell (HON) 1.49 2.56% UR GOOD UR 61.00 7 0.95 58.18
IBM (IBM) 3.00 1.56% 3.4 EXC 10.0 189.00 6 1.02 192.50
N EW : Lo rilla rd (LO) 5.20 4.84% 1.5 GOOD 7.0 101.00 6 1.06 107.48
Matte l (MAT) 0.92 3.12% 2.3 GOOD 8.0 29.00 6 1.02 29.53
McDo nalds (MCD) 2.80 2.84% 1.3 GOOD 5.5 88.00 7 1.12 98.69
Mo lex (MOLX) 0.80 3.04% 2.4 GOOD 7.0 26.00 6 1.01 26.35
No rthro p Grumman (NOC) 2.00 3.44% 3.1 EXC 5.0 70.00 3 0.83 58.20
N EW : Olin Co rp (OLN) 0.80 3.61% 1.8 GOOD UR 22.00 7 1.01 22.15
Owens & Mino r (OMI) 0.80 2.63% 2.0 GOOD 10.0 32.00 3 0.95 30.38
P aychex (P AYX) 1.28 4.05% 2.7 GOOD 5.0 30.00 6 1.05 31.57
N EW : P F Changs (P FCB) 1.00 3.03% 2.2 GOOD UR 26.00 6 1.27 32.96
P hillip Mo rris (P M) 3.08 4.11% 1.3 GOOD 5.0 56.00 3 1.34 74.90
Raytheo n (RTN) 1.72 3.58% 2.5 GOOD 8.0 38.00 7 1.26 48.00
St. J ude (STJ ) 0.84 2.03% 2.5 GOOD 10.0 46.00 6 0.90 41.37
N EW : Texas Ins tr (TXN) 0.68 2.11% 3.9 EXC 5.0 32.00 3 1.01 32.18
United Techno lo gies (UTX) 1.92 2.47% UR GOOD UR 101.00 6 0.77 77.61
UP S (UP S) 2.08 2.73% UR GOOD UR 72.00 3 1.06 76.15
N EW : Verizo n (VZ) 2.00 5.31% 1.7 GOOD 5.0 41.00 6 0.92 37.66
Was te Management (WMI) 1.36 3.91% 0.9 P OOR 2.0 40.00 3 0.87 34.76
UR = Under Review
Page 12 Valuentum’s Dividend Growth Newsletter
Dividend Spotlight: Microsoft continued from page 2
Mobile hasn’t been good…
We might be stating the obvious, but Microsoft’s mobile strategy hasn’t been good. While Apple decided to revolutionize the tablet by making it stylus-free, and all touch, Microsoft sat back and watched iPad essentially become the tablet market.
While Research-In-Motion (RIMM) and Samsung ran to market with copycat products, Microsoft has yet to release a similar product, even trailing Amazon (AMZN) in coming to market.
As far as smartphones go, Microsoft has been creating software for a long time, but it hasn’t really done much with it. It’s still a distant fourth place behind iOS, Android, and Blackberry. The company has yet to enter the market with a premium phone, although its Mango has been its closest attempt so far.
But it could get much better.
We actually don’t view this as a negative. While Apple grabbed the first mover advantage, we also think it has—by far—the most popular product on the market. It’s also the best. Research in Motion’s Playbook seems to be mostly collecting dust, Hewlett Packard (HP) already pulled out of the tablet market, as it could only sell them for a loss, and most Android tablets receive decent reviews, but don’t have the same appeal as the iPad. Amazon’s Kindle Fire seems to be selling reasonably well, but as Amazon noted, it is actually taking a loss on the product.
Ultimately, there’s no point for Microsoft to rush to market with a mediocre product, when it could take time to develop a better functioning, higher quality product running Windows 8. The firm may also time the release to coincide with the Windows 8 PC launch to grab consumers who end up liking the latest version of Windows, which is a divergence from previous products. Apple is the clear-cut winner thus far, but not everyone can afford an iPad, and we think Microsoft could grab those looking for lower price-points.
The smartphone market is a bit different. Several investors have speculated that Microsoft might buy Nokia (NOK), for whom they are the exclusive software provider, or even Research in Motion. Ultimately, we think Microsoft might prefer to remain hardware agnostic. It doesn’t have the expertise in manufacturing like other companies, and therefore, we think a hardware acquisition may be outside of their core competencies. However, with mounds of cash (over $50 billion), such a transformational move is not out of the realm of possibilities.
Regardless, we think there’s room for a third place (or new second place) player in the mobile phone space. For now, like tablets, Apple is the clear winner, but we do not think Android is a clear number two. Though Android is running neck-and-neck with Apple for market share, we don’t think people outside of the core Google fans are too excited about Android. Plus, we don’t think the Android platform is nearly as sticky as the iPhone. Aside from the fact that a lot of tech savvy consumers use Gmail, we don’t think switching costs to a Microsoft phone would be too high. If Microsoft can create a product that customers really want, the potential is enormous. We believe Android is a huge player only because it is on so many devices, not because it’s a great and sustainable platform.
Much like the Microsoft strategy, shareholders will need to remain patient. No one should expect an iPhone killer to show up tomorrow, but we think shareholders will be rewarded if they wait for this strategy to play out. In the meantime, Microsoft is returning huge amounts of cash to shareholders. With a payout ratio at about 30%, and a Valuentum Dividend Cushion in excess of 4, the company has a tremendous amount of room to increase dividends, assuming the core business continues to perform well and the firm eventually becomes a player in the mobile computing world.
Valuentum’s Dividend Growth Newsletter Page 13
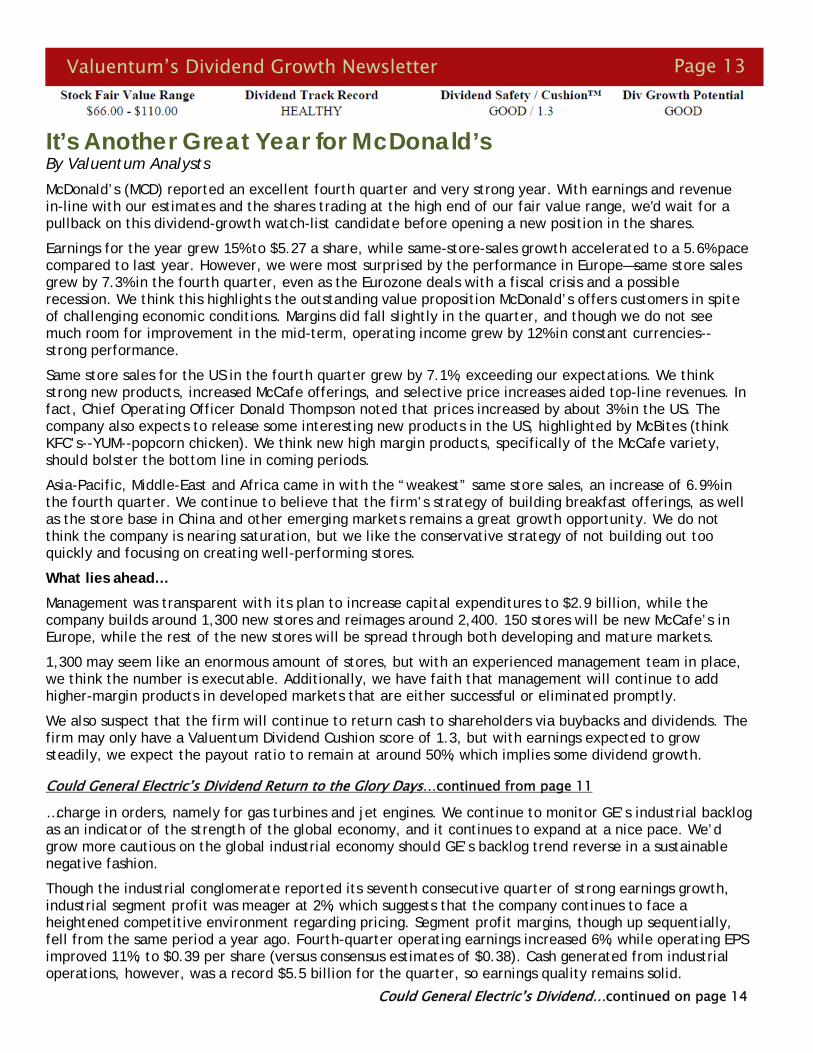
McDonald’s (MCD) reported an excellent fourth quarter and very strong year. With earnings and revenue in-line with our estimates and the shares trading at the high end of our fair value range, we'd wait for a pullback on this dividend-growth watch-list candidate before opening a new position in the shares.
Earnings for the year grew 15% to $5.27 a share, while same-store-sales growth accelerated to a 5.6% pace compared to last year. However, we were most surprised by the performance in Europe—same store sales grew by 7.3% in the fourth quarter, even as the Eurozone deals with a fiscal crisis and a possible recession. We think this highlights the outstanding value proposition McDonald’s offers customers in spite of challenging economic conditions. Margins did fall slightly in the quarter, and though we do not see much room for improvement in the mid-term, operating income grew by 12% in constant currencies--strong performance.
Same store sales for the US in the fourth quarter grew by 7.1%, exceeding our expectations. We think strong new products, increased McCafe offerings, and selective price increases aided top-line revenues. In fact, Chief Operating Officer Donald Thompson noted that prices increased by about 3% in the US. The company also expects to release some interesting new products in the US, highlighted by McBites (think KFC’s--YUM--popcorn chicken). We think new high margin products, specifically of the McCafe variety, should bolster the bottom line in coming periods.
Asia-Pacific, Middle-East and Africa came in with the “weakest” same store sales, an increase of 6.9% in the fourth quarter. We continue to believe that the firm’s strategy of building breakfast offerings, as well as the store base in China and other emerging markets remains a great growth opportunity. We do not think the company is nearing saturation, but we like the conservative strategy of not building out too quickly and focusing on creating well-performing stores.
What lies ahead…
Management was transparent with its plan to increase capital expenditures to $2.9 billion, while the company builds around 1,300 new stores and reimages around 2,400. 150 stores will be new McCafe’s in Europe, while the rest of the new stores will be spread through both developing and mature markets.
1,300 may seem like an enormous amount of stores, but with an experienced management team in place, we think the number is executable. Additionally, we have faith that management will continue to add higher-margin products in developed markets that are either successful or eliminated promptly.
We also suspect that the firm will continue to return cash to shareholders via buybacks and dividends. The firm may only have a Valuentum Dividend Cushion score of 1.3, but with earnings expected to grow steadily, we expect the payout ratio to remain at around 50%, which implies some dividend growth.
It’s Another Great Year for McDonald’s By Valuentum Analysts
Could General Electric’s Dividend Return to the Glory Days…continued from page 11
…charge in orders, namely for gas turbines and jet engines. We continue to monitor GE’s industrial backlog as an indicator of the strength of the global economy, and it continues to expand at a nice pace. We’d grow more cautious on the global industrial economy should GE’s backlog trend reverse in a sustainable negative fashion.
Though the industrial conglomerate reported its seventh consecutive quarter of strong earnings growth, industrial segment profit was meager at 2%, which suggests that the company continues to face a heightened competitive environment regarding pricing. Segment profit margins, though up sequentially, fell from the same period a year ago. Fourth-quarter operating earnings increased 6%, while operating EPS improved 11%, to $0.39 per share (versus consensus estimates of $0.38). Cash generated from industrial operations, however, was a record $5.5 billion for the quarter, so earnings quality remains solid.
Could General Electric’s Dividend…continued on page 14

Page 14 Valuentum’s Dividend Growth Newsletter
Yields to Avoid By Valuentum Analysts As many investors know, firms can often become cheap for good reasons. That is, they are not trading cheaply because of Mr. Market’s irrational behavior, but instead are trading at depressed levels due to deteriorating underlying fundamental characteristics that actually justify its current share price, even if traditional valuation techniques (read multiple analysis) suggest the firm’s shares are inexpensive. On a similar note, firms that boast high dividend yields may do so because the market has little confidence in the sustainability of its dividend and believes a cut may be just around the corner. Though we fall short of saying the following list of firms will slash their respective dividends anytime soon, our dividend-cut predictive indicator—the Valuentum Dividend Cushion™--indicates that the firms below are at significant risk for a dividend cut in coming years. We think the dividend-growth investor should steer clear of the following firms’ shares:
To access the full dividend reports on the above companies, please click the following link:
http://www.valuentum.com/categories/20111110
Could General Electric’s Dividend Return to Its Glory Days?…continued from page 13
GE Capital’s fourth-quarter earnings advanced nearly 60% from the same period a year ago. GE Capital volume grew 13% from the third-quarter on relatively healthy margins of 5.4%. Tier 1 common ratios also remain sufficient at 11.4% and 9.9%, revealing the firm has largely re-established its capital strength. GE Capital’s move to acquire MetLife’s US retail deposit business should also help to provide a source of low-cost deposit funding, bolstering lending spreads, and reducing its exposure to more expensive wholesale funding. The company also noted that it expects to restart the dividend from GE Capital to GE this year, which we view as a distinct positive.
All things considered, we continue to be impressed with GE’s industrial backlog growth and the ongoing recovery of GE Capital. Given our more constructive view on the banking sector and our positive view on the commercial aerospace cycle, GE is becoming much more of an attractive candidate for addition to the portfolio in our Dividend Growth Newsletter. With an annual payout of $0.68 per share (3.6% annual yield), GE could, in fact, return to the glory pre-Great Recession days. We continue to watch the firm closely for any sharp pullbacks that make its juicy yield simply irresistible.
Valuentum’s Dividend Growth Newsletter Page 15
Please select the following link to view the full 16-page report: http://www.valuentum.com/categories/20110609

Page 16 Valuentum’s Dividend Growth Newsletter
Please select the following link to view the full 16-page report: http://www.valuentum.com/categories/20110609

Valuentum’s Dividend Growth Newsletter Page 17
Please select the following link to view the full 16-page report: http://www.valuentum.com/categories/20110609
Page 18 Valuentum’s Dividend Growth Newsletter
Please select the following link to view the full 16-page report: http://www.valuentum.com/categories/20110609

Valuentum’s Dividend Growth Newsletter Page 19
But how, you will ask, does one decide what [stocks are] "attractive"? Most analysts feel they must choose between two approaches customarily thought to be in opposition: "value" and "growth,"...We view that as fuzzy thinking...Growth is always a component of value [and] the very term "value investing" is redundant.
-- Warren Buffett, Berkshire Hathaway annual report, 1993
At Valuentum, we take Buffett's thoughts one step further. We think the best opportunities arise from a complete understanding of all investing disciplines in order to identify the most attractive stocks at any given time. Valuentum therefore analyzes each stock across a wide spectrum of philosophies, from deep value through income through momentum investing. We think companies that are attractive from a number of investment perspectives--whether it be growth, value, income, momentum, etc.--have the greatest probability of capital appreciation and relative outperformance. The more investors that are interested in the stock for reasons based on their respective investment mandates, the more likely it will move higher.
As such, the Valuentum Buying Index (VBI) combines rigorous financial and valuation analysis with an evaluation of a firm's technicals and momentum indicators to derive a score between 1 and 10 for each company. The VBI places considerable emphasis on a firm's DCF valuation, its relative valuation versus peers (both forward PE and PEG ratios), as well as its technicals in order to help investors pick the best entry and exit points on the most interesting stocks. We believe our methodology helps identify the most attractive stocks at the best time to buy, helping to avoid value traps and lagging performance due to the opportunity cost of holding a stock with great potential but at an inopportune time.
Let's discuss how a firm can score a 10, the best mark on our index (a "Top Pick"). First, the company would need to be 'undervalued' on a DCF basis and 'attractive' on a relative 'value basis. The stock would also have to be exhibiting 'bullish' technicals. The firm would need a ValueCreation rating of 'good' or 'excellent', exhibit 'high' or 'aggressive' growth prospects, and generate at least a 'medium' or 'neutral' assessment for cash flow generation, financial leverage, and relative price strength.
This is a tall order for any company, but we're looking to deliver the very best of ideas to our clients and subscribers. Firms that don't make the cut for a 10 are ranked accordingly, with the least attractive stocks garnering a score of 1 ("We'd sell"). Most of our coverage universe falls between 3 and 7, but at any given time there could be large number of companies garnering either high or low scores, especially at market lows or tops, respectively.
Please view the flow chart on the next page regarding our Valuentum Buying Index.
Our Methodology – The Valuentum Buying Index By Valuentum Analysts
Our Methodology – The Valuentum Buying Index continued on next page

Page 20 Valuentum’s Dividend Growth Newsletter
Our Methodology – The Valuentum Buying Index
To subscribe to Valuentum, visit our website at www.valuentum.com.

Valuentum’s Dividend Growth Newsletter Page 21
Valuentum Dividend Growth Newsletter: Volume 1, Issue 2
Valuentum’s Dividend Growth Newsletter is published monthly. To
receive this newletter on a monthly basis, please subscribe to
Valuentum by visiting our website at http://www.valuentum.com.
Or contact us at [email protected].
© Valuentum Securities, Inc. All rights Reserved. The information contained in this report is not
represented or warranted to be accurate, correct, complete, or timely. This report is for informational
and educational purposes only and should not be considered a solicitation to buy or sell any security.
The securities mentioned herein may not be suitable for all types of investors. The information
contained in this report does not constitute any investment advice, but especially on the tax
consequences of making any particular investment decision. This material is not intended for any
specific type of investor and does not take into account an investor's particular investment objectives,
financial situation or needs.
This report is not intended as a recommendation of the securities highlighted or any particular
investment strategy. Before acting on any information found in this report, readers should consider
whether such an investment is suitable for their particular circumstances, perform their own due-
diligence, and if necessary, seek professional advice. This report has not been tailored to suit any
particular person’s portfolio or holdings.
Assumptions, opinions, and estimates are based on our judgment as of the date of the report and are
subject to change without notice. Valuentum is not responsible for any errors or omissions or for results
obtained from the use of this report and accepts no liability for how readers may choose to utilize the
content. In no event shall Valuentum be liable to any party for any direct, indirect, incidental,
exemplary, compensatory, punitive, special or consequential damages, costs, expenses, legal fees, or
losses (including, without limitation, lost income or lost profits and opportunity costs) in connection
with any use of the information contained in this document. Investors should consider this report as only
a single factor in making their investment decision. Redistribution is prohibited without written
permission.
Valuentum is not a registered investment advisor, has not given its consent to be deemed an “expert”
under the Federal Securities Act of 1933, does not offer brokerage or investment banking services, and
adheres to professional standards and abides by formal codes of ethics that put the interests of clients
and subscribers ahead of their own. As of the date of this report, Valuentum has not received any
compensation from companies highlighted in this report. Valuentum, its employees, and affiliates may
have long, short or derivative positions in the stock or stocks mentioned herein.
No warranty is made regarding the accuracy of any data or any opinions. The portfolio in the
Valuentum Dividend Growth Newsletter is hypothetical and does not represent real money.
Performance assessment of the Valuentum Buying Index™ is currently ongoing, and we intend to
update investors as soon as such results are available. Past performance is not a guarantee of future
results.
For general information about Valuentum's products and services, please contact us at