I. Spokesperson and Deputy Spokesperson Contact Information · 2017-06-20 · Among other...
81
Transcript of I. Spokesperson and Deputy Spokesperson Contact Information · 2017-06-20 · Among other...
-1- Annual Report 2010
I. Spokesperson and Deputy Spokesperson Contact Information
Spokesperson
Name: Daniel Chien
Title: Vice President & CFO
Tel: 886-3-5646600
Email: [email protected]
Deputy spokesperson
Name: Kurt Huang
Title: Director, Marketing Division
Tel: 886-3-5646600
Email: [email protected]
Deputy spokesperson
Name: Will Pei
Title: Manager, Finance Division
Tel: 886-3-5646600
Email: [email protected]
II. GUC Address and Telephone Number
Address: No. 10, Li-Hsin 6th Rd., Hsinchu Science Park, Taiwan, R.O.C.
Tel: 886-3-5646600
III. Common Share Transfer Agent and Registrar
Company: the Transfer Agency Department of Chinatrust Commercial Bank
Address: 5F, 83, Sec. 1, Chung-Ching S. Rd., Taipei, Taiwan 100, R.O.C.
Website: http://www.chinatrust.com.tw
Tel: 886-2-23613033
IV. Auditors
Auditors: Hung-Peng Lin、Shu-Chieh Huang
Company: Deloitte & Touche
Address: 6F, 2, Prosperity Rd. I, Hsinchu Science Park, Taiwan, R.O.C.
Website: http://www.deloitte.com.tw
Tel: 886-3-5780899
V. Company Website
Website: http://www.globalunichip.com

-2- Annual Report 2010
Table of Content
Letter to Shareholders····························································· 3
Company Profile ······································································ 6
Corporate Governance ·························································· 17
Operation Report··································································· 29
Consolidated Financial Highlights ······································· 43
Financial Report ·································································· 45

-3- Annual Report 2010
Dear Shareholders,
2010 was a fruitful year for GUC. Apart from prominent R&D results and
continuous performance improvement, GUC achieved a new record for revenue
dollars. Advanced process technologies, including 90-nanometer, 65-nanometer,
40-nanometer and 28-nanometer, accounted for 42% of total revenue in 2010, a rise of
8 percentage points compared to 34% of total revenue in the previous year. With
strong core competence and advanced high-end process design capabilities, GUC
commits itself to aggressively and relentlessly expanding international business as
well as capturing future business opportunities in the design service market.
Financial Performance
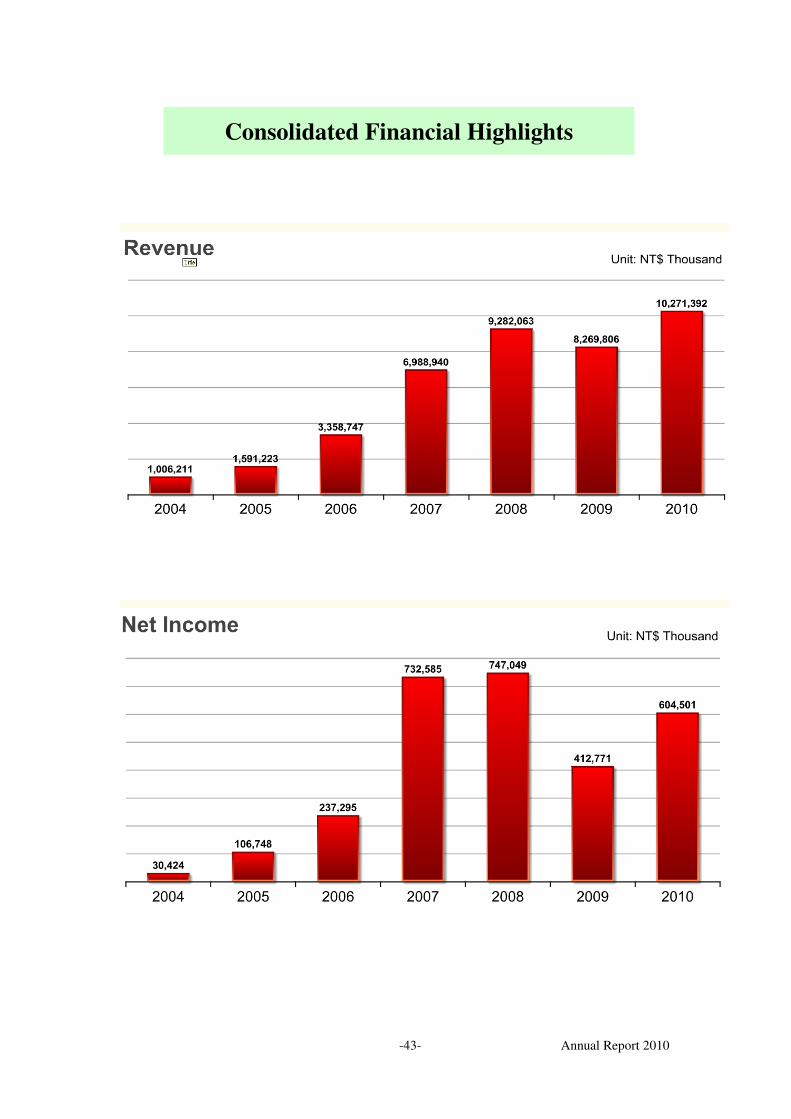
Total revenue for 2010 was NT$10.27 billion, a 24 percent increase compared with
NT$8.27 billion in 2009. Net income was NT$605 million, a 46 percent increase
compared with the previous year. 2010 EPS was NT$4.56, a 45 percent increase
compared with 2009 EPS of NT$3.15. Among other highlights in 2010, GUC
achieved gross margin of 18.87%, operating margin of 5.65% and ROE of 20.28%.
Technology Leadership
In 2010, advanced process technologies, including 90-nanometer, 65-nanometer,
40-nanometer and 28-nanometer, showed sequential annual growth, accounting for
42% of total revenue and 88% of NRE revenue. We made unremitting efforts to
invest in design methodologies of advanced process technology and IP, helping our
customers introduce the most advanced products into the market and making GUC
one of the advanced technology leaders in the IC design service market. GUC’s
significant technology breakthrough and innovative achievement in 2010 were as
follows:
1. Successful completion of NRE projects for several customers with verification
during the initial pilot run.
2. Lead the industry in successfully developing mass-production test methodology
of low-power chips.
3. Successful development of AVS low-power design flow.
Letter to Shareholders
-4- Annual Report 2010
4. With 3D SiP technique, we successfully helped customers develop 4G LTE (Long
Term Evolution) handset Baseband chip.
5. Successful development of low-power RF Turner IP for digital televisions on
40nm.
6. Cooperated with TSMC to complete USB3.0 solution: GUC’s Controller and
TSMC’s PHY.
7. Successfully developed 10G EPON chipsets for customers and succeeded on the
first-silicon pilot run.
Corporate Developments
1. Focus R&D resources on strengthening design capability for advanced technology
process. Closely cooperate with customers and prudently evaluate mid-to-long-term
corporate profit of customers’ projects.
2. Rapidly develop forward-looking technical solutions and high-performance/low-power
products for the demand of end markets to gradually improve corporate profitability.
3. GUC has established subsidiaries and branch offices in the U.S., Europe, Japan,
China and South Korea to meet the trends of globalization and outsourcing while
providing more regionalized professional support. Our branch offices and
subsidiaries fully expand and support the business opportunities of IC design
service outsourcing in these areas.
The Impact of External Competiveness, Regulatory,
Environment, and Macroeconomics
More customers are expected to request for high-end process design services which
will have positive impact to GUC’s business operation. However, due to the
international macroeconomic volatility in recent years and uncertain environmental
risks, our management team will be more prudent in facing the change of the impact
of external environment. Management will make unremitting efforts to improve
operation efficiency and competitiveness to achieve our goal of sustainable corporate
operation.
Prospect
The whole team at GUC will exert all its efforts to continuously provide the best
services to our customers and maintain our leading position in 2011. We will aim at

-5- Annual Report 2010
maximizing our shareholder’s value while pursuing mid-and-long-term corporate
growth.
Last but not least, we would like to sincerely thank our industrious employees, our
customers and our valuable shareholders. Your continuous support and trust are
deeply appreciated!
Global Unichip Corporat ion
F. C. Tseng
Chairman
Jim Lai
President and COO

-6- Annual Report 2010
Company Overview
Founded in 1998, Global Unichip Corporation (GUC) has since been a pioneer in the
SoC (System on Chip) Design Foundry industry. GUC is a publicly traded company
on the Taiwan Stock Exchange under the symbol 3443. The company is
headquartered in Hsinchu of Taiwan, with design centers and branch offices in China,
Europe, Japan, Korea and the U.S. GUC provides total solutions from silicon-proven
IPs to complex time-to-market SoC turnkey services. GUC is committed to providing
the most advanced and the best price-performance silicon solutions through close
partnership with TSMC, GUC’s major shareholder, and other key packaging and
testing power houses. With state of the art EDA tools, advanced methodologies, and
experienced technical team, GUC ensures the highest quality and lowest risks to
achieve first silicon success. GUC offers services to customers throughout the the
Greater China, Japan, Korea, North America, and Europe. Our track-record in
complex SoC designs has brought benefits to customers in time to revenue at the
lowest risk.
Organization
Company Profile
-7- Annual Report 2010
Board Member
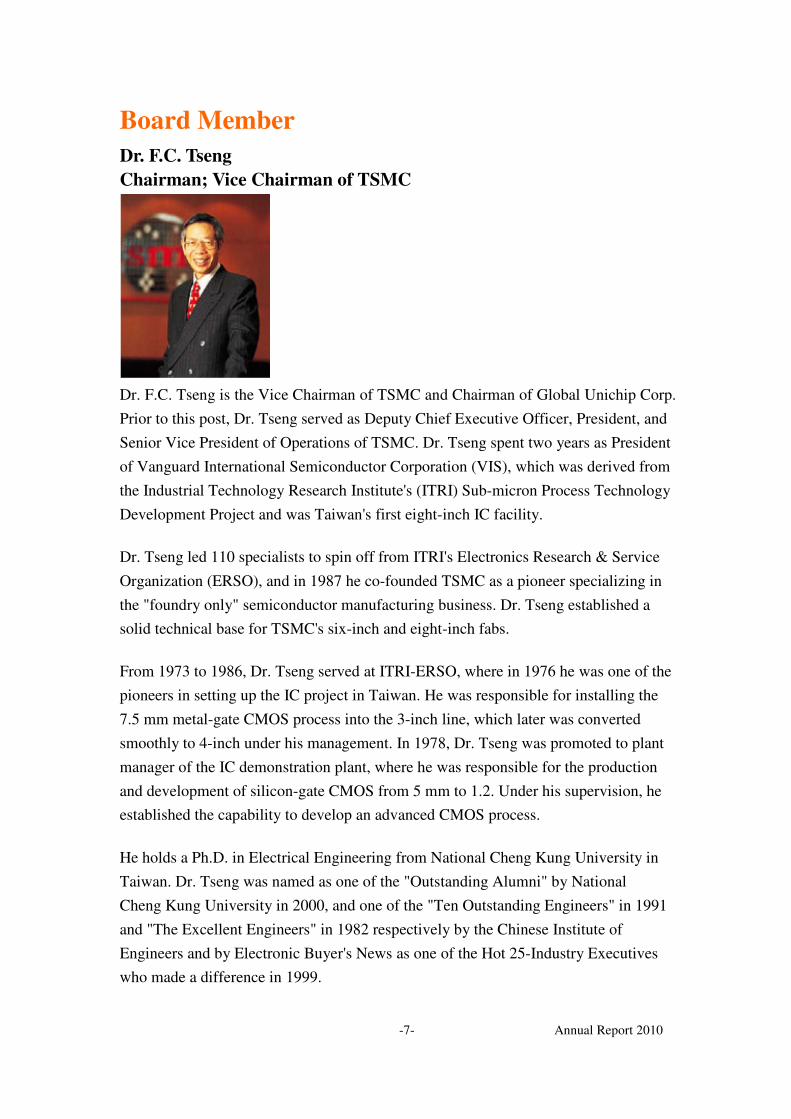
Dr. F.C. Tseng
Chairman; Vice Chairman of TSMC
Dr. F.C. Tseng is the Vice Chairman of TSMC and Chairman of Global Unichip Corp.
Prior to this post, Dr. Tseng served as Deputy Chief Executive Officer, President, and
Senior Vice President of Operations of TSMC. Dr. Tseng spent two years as President
of Vanguard International Semiconductor Corporation (VIS), which was derived from
the Industrial Technology Research Institute's (ITRI) Sub-micron Process Technology
Development Project and was Taiwan's first eight-inch IC facility.
Dr. Tseng led 110 specialists to spin off from ITRI's Electronics Research & Service
Organization (ERSO), and in 1987 he co-founded TSMC as a pioneer specializing in
the "foundry only" semiconductor manufacturing business. Dr. Tseng established a
solid technical base for TSMC's six-inch and eight-inch fabs.
From 1973 to 1986, Dr. Tseng served at ITRI-ERSO, where in 1976 he was one of the
pioneers in setting up the IC project in Taiwan. He was responsible for installing the
7.5 mm metal-gate CMOS process into the 3-inch line, which later was converted
smoothly to 4-inch under his management. In 1978, Dr. Tseng was promoted to plant
manager of the IC demonstration plant, where he was responsible for the production
and development of silicon-gate CMOS from 5 mm to 1.2. Under his supervision, he
established the capability to develop an advanced CMOS process.
He holds a Ph.D. in Electrical Engineering from National Cheng Kung University in
Taiwan. Dr. Tseng was named as one of the "Outstanding Alumni" by National
Cheng Kung University in 2000, and one of the "Ten Outstanding Engineers" in 1991
and "The Excellent Engineers" in 1982 respectively by the Chinese Institute of
Engineers and by Electronic Buyer's News as one of the Hot 25-Industry Executives
who made a difference in 1999.

-8- Annual Report 2010
Mr. K.C. Shih
Founder
K.C. Shih has more than 30 years of experience working in the high-tech industry. Mr.
Shih observed the emergence of the post-PC era when the demand for IC is migrating
from ASIC to SoC. In 1998, he founded Global Unichip Corp. with Dr. Nicky Lu and
Dr. Steve Lin, to be the world's first dedicated SoC Design Foundry. In recognition of
its leading market position and successful business model, TSMC invested and took
partnership with Global Unichip Corp. in 2003. Global Unichip Corp. has
successfully demonstrated its leadership in advanced SoC designs (i.e. 90nm, 65nm,
40nm and 28nm) and has listed on the Taiwan Stock Exchange in 2006.
In 1990, Mr. Shih was the President of Cadence Design Systems Inc. Mr. Shih then
founded Faraday Technology Corporation in partnership with UMC and served as the
Vice Chairman and CEO. Faraday is the first IC Design Service Company in the
world. Based on its ASIC expertise, Faraday provides ASIC technology and design
service to customers in Taiwan, the USA and other countries. In 1998, Faraday
successfully went public in Taiwan, its stock price was once the highest on the
Taiwan stock-exchange board.
In 1983, Mr. Shih founded Suntek to develop under-$1,000 UNIX PC with NS32000,
targeting college students on the college local area network. Evaluating from revenue
figures, one may say that Suntek did not make the grade; however, it has indeed made
a profound impact on Acer.
While at M.I.T., Mr. Shih was an original member of the MULTICS team. MULTICS
was the first multi-processing, multi-programming, network operating system running
on ARPAnet. It was later re-written to become UNIX at Bell Labs. He then worked at
DEC involving in the design of the famous VAX computer. In 1980, he joined

-9- Annual Report 2010
National Semiconductor as Director of the MESA project, in charge of the NS32000
32bit microprocessor development.
Mr. Shih earned his Bachelor of Science degree in Physics from Chung Yuan
Christian University, Taiwan, his Master of Science degree from University of
Massachusetts, and Ph.D. studies in Electrical Engineering at M.I.T.
Mr. Jim Lai
President
Jim Lai has 26 years of experience in semiconductor and ASIC industries. Jim
currently serves as president of Global Unichip Corp.
Mr. Lai was promoted from TSMC North America to GUC in 2003 when TSMC
became the major shareholder of GUC. From 1992 to 2003, Jim served various
positions at TSMC North America, including director of emerging account, director
of design services and business manager responsible for the ASIC business unit.
Prior to TSMC, Mr. Lai co-founded ASICtronics, one of the earliest design service
companies to provide ASIC design consultation and libraries in the USA. Prior to
ASICtronics, Mr. Lai worked at Toshiba America, Knights Technology and LSI
Logic in various engineering positions in ASIC and CAD groups.
Mr. Lai received his Master of Science degree in Electrical Engineering from
University of California, Santa Barbara in 1984 and his Bachelor of Science degree in
Electrical Engineering from National Taiwan University in 1981.
-10- Annual Report 2010
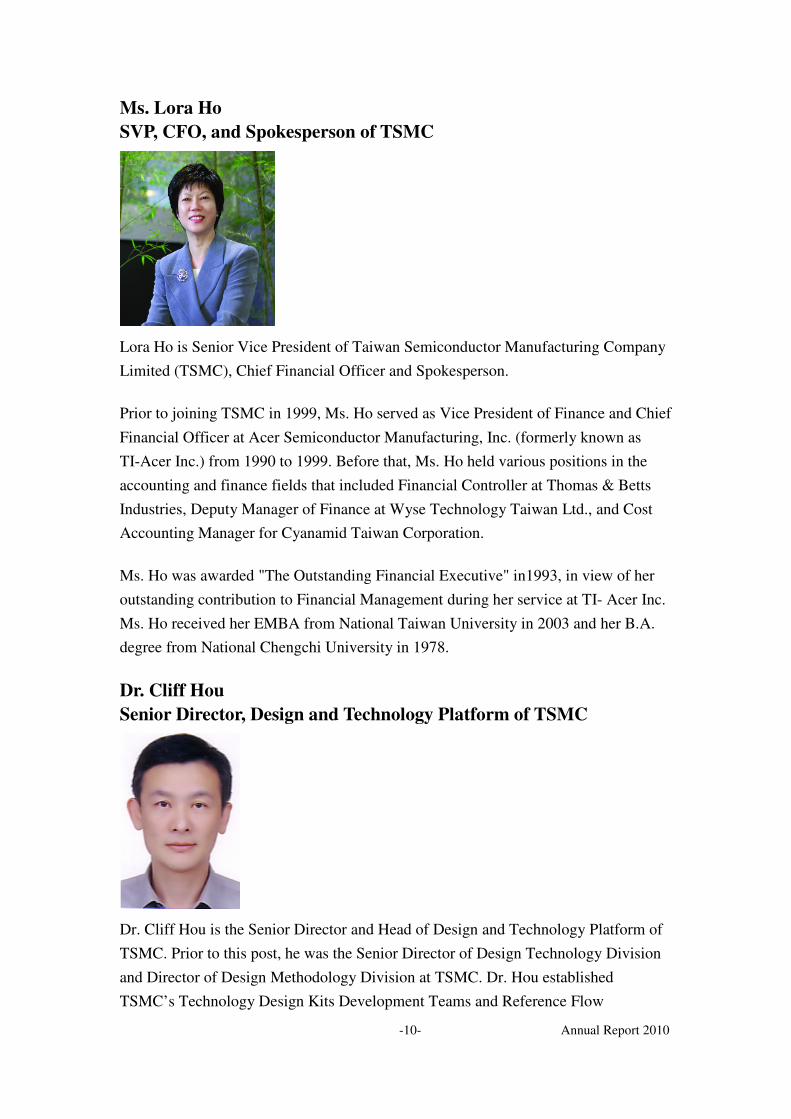
Ms. Lora Ho
SVP, CFO, and Spokesperson of TSMC
Lora Ho is Senior Vice President of Taiwan Semiconductor Manufacturing Company
Limited (TSMC), Chief Financial Officer and Spokesperson.
Prior to joining TSMC in 1999, Ms. Ho served as Vice President of Finance and Chief
Financial Officer at Acer Semiconductor Manufacturing, Inc. (formerly known as
TI-Acer Inc.) from 1990 to 1999. Before that, Ms. Ho held various positions in the
accounting and finance fields that included Financial Controller at Thomas & Betts
Industries, Deputy Manager of Finance at Wyse Technology Taiwan Ltd., and Cost
Accounting Manager for Cyanamid Taiwan Corporation.
Ms. Ho was awarded "The Outstanding Financial Executive" in1993, in view of her
outstanding contribution to Financial Management during her service at TI- Acer Inc.
Ms. Ho received her EMBA from National Taiwan University in 2003 and her B.A.
degree from National Chengchi University in 1978.
Dr. Cliff Hou
Senior Director, Design and Technology Platform of TSMC
Dr. Cliff Hou is the Senior Director and Head of Design and Technology Platform of
TSMC. Prior to this post, he was the Senior Director of Design Technology Division
and Director of Design Methodology Division at TSMC. Dr. Hou established
TSMC’s Technology Design Kits Development Teams and Reference Flow
-11- Annual Report 2010
Development Teams. He also leads Design-for-Manufacturability (DFM) task force at
TSMC.
Dr. Hou received his B. S. degree in 1983 from National Chiao-Tung University, and
his Ph.D. degree in Electrical and Computer Engineering from Syracuse University in
1992.
Prior to joining TSMC in 1997, Dr. Hou was an Associate Professor at Kaohsiung
Polytechnic Institute in 1992, and prior to that, he worked at ITRI/CCL for front-end
design environment development and integration from 1993 to 1995 and at a local
consulting company for 0.5um and 0.35um physical verification methodology and
flow development from 1995 to 1997.
Dr. Hou has 15 U.S. patents and also serves as Technical Committee Member of
VLSI Symposium.
Dr. John Hu
Vice President of Chung Yuan Christian University
Dr. John Hu has served as Vice President of Chung Yuan Christian University since
February 2007. Dr. Hu holds a Ph.D. in Finance from the University of Oklahoma.
-12- Annual Report 2010
Mr. Benson W. C. Liu
Independent Director; Former Chairman and CEO of Bristol-Myers
Squibb (Taiwan) Ltd
Mr. Benson W.C. Liu, Independent Director, was the Chairman and General Manager
of Bristol-Myers Squibb Taiwan (BMST) from Jan.1999 through March 2005. Mr.
Liu joined BMST in 1978 as Accounting Manager and he progressed within the
Company through Finance Manager, Controller, Finance Director, VP Finance and
Administration and finally Chairman and General Manager.
Mr. Liu retired from BMST in March 2005 after 28 years of dedicated services to this
leading global Pharmaceutical and Health Care Company. Prior to joining BMST, Mr.
Liu was an auditor of Deloitte, Taiwan for 5 years. He holds a bachelor degree in
Accounting from Soochow University, a master degree in International Business
Administration from Northrop University, USA.
Mr. Liu is active in participating public services through NPO organizations like
Chinese Corporate Governance Association and Chinese Professional Manager
Association. He was awarded Financial Manager of the Year by the Chinese
Professional Manager Association in 1985, Outstanding Alumni of the Accounting
Department of Soochow University in 1986 and Financial Manager of The Year of
Bristol-Myers Squibb Company International Group in 1989.

-13- Annual Report 2010
Dr. Chein-Wei Jen
Independent Director; Former Dean of Institute of Electronics at
National Chiao Tung University, Taiwan
Dr. Chein-Wei Jen has retired from the Department of Electronics Engineering,
National Chiao Tung University, Taiwan since 2004. During his academic career he
also served as the Chairman of the Department of Electronics Engineering, from 1989
to 1991 and the Director of the Institute of Electronics from 1991 to 1994 at the same
university.
He has supervised over 25 PhD students and many Master students in the area of
System-on-Chip design, processor architecture, and multimedia signal processing.
Most of his students are now working in the academic and IC Design industry in
Taiwan. He holds seven patents and published over 50 journal papers and 100
conference papers in these areas. He has also received numerous research paper
awards and service awards from technical societies.
From 2004 to 2007 he was invited to join ITRI which is a government-sponsored
R&D organization in Taiwan and served as the Director of SoC Technology Center in
ITRI. From 2002 to 2007 he also served as one of the Coordinators of the National
SoC Program in Taiwan.
Dr. Jen received his B.S. degree from National Chiao Tung University in 1970, his
M.S. degree from Stanford University in 1977, and his Ph. D. degree from National
Chiao Tung University in 1983.

-14- Annual Report 2010
Dr. Wen-Yeu Wang
Independent Director; Ph. D., Stanford Law School, Professor of
College of Law at National Taiwan University
Dr. Wang is professor of law and director, Center for Corporate and Financial Law,
College of Law, National Taiwan University. He received law degrees from NTU,
Columbia (LL.M.) and Stanford (J.S.D.), respectively. During his tenure, he visited
and taught at well known law schools, including National University of Singapore and
PRC’s Peking University. In addition, he was a visiting professor of law at Stanford
from 1995-96, teaching a seminar on financial transactions; in fall 2007 he taught
“Corporate Governance in Greater China” seminar at Columbia. Principal research
subjects include business associations, financial regulations, and law and economics.
Before pursuing an academic career, professor Wang had practiced commercial law at
the international law firms of Lee and Li, Taipei (from 1985-1989), and Sullivan &
Cromwell, a Wall Street firm in New York City (1989-1991), respectively. Areas of
specialty include corporate law and business transactions.
From 2004 to 2006, professor Wang served as a commissioner at the Fair Trade
Commission. In addition, he has served in many important public and private
functions, i.e., as director or supervisor of the Taiwan Stock Exchange, Taiwan
Futures Exchange, and Taiwan Cooperative Bank. He also served as independent
director or reorganization supervisor for Taiwanese public companies; as arbitrators or
mediators in various commercial disputes. He has also participated in the drafting or
amendment of major economic and financial legislation, such as the Company Law
and the Securities and Exchange Law.

-15- Annual Report 2010
Management Team
Mr. James Cheng
Senior Vice President
James currently serves as Senior Vice President in Sales Division.
Prior to joining GUC in 2003, Mr. Cheng served as Sales Deputy Director at TSMC
North America.
Mr. Cheng received his Master of Science degree in Electrical Engineering from
Columbia University, USA.
Mr. C. C. Hsieh
Vice President
C. C. currently serves as Vice President.
Prior to joining GUC in 2003, Mr. Hsieh served as Senior Technical Manager at
TSMC.
Mr. Hsieh received his Master of Science degree in Electrical Engineering from
National Tsing Hwa University, Taiwan.
Mr. Michael Chang
Vice President
Michael currently serves as Vice President in Engineering Division.
Mr. Chang possesses over twenty five years of designing ASIC and SoC experience,
and has served many key R&D positions.
Prior to joining GUC in 2006, Mr. Chang has served as Sr. Director of ASIC Design
in ESS, VP of VLSI design in Divio, and VP of R&D at Prolific Technology.
Mr. Chang received his Master of Science degree in Electrical Engineering and
Computer Science from Arizona State University, USA.
Mr. Jerry Tzou (Note 1)
Vice President
Jerry served as Vice President in Product Operations Division.
Prior to joining GUC in 2009, Mr. Tzou served as Deputy Director of Customer
Services Division at TSMC.
Mr. Tzou received his Master of Science degree in Materials Science & Engineering
from UC Berkeley, USA.

-16- Annual Report 2010
Mr. Lung Chu
Vice President
Lung currently serves as Vice President at GUC and President of GUC’s subsidiary in
China. Prior to joining GUC in 2009, Mr. Chu was the President of Cadence Asia
Pacific and Corporate VP of Cadence Design System Inc. Before Cadence, he
worked at Magma, KLA-Tencor, Avant!, General Electric, Philips Semiconductor,
Cupertino and Apple Computer in a variety of sales and senior management positions.
Mr. Chu possesses over 25 years of experience in the EDA industry.
Mr. Chu graduated from National Taiwan University with a B.S. He received his
Master of Science degree in Electrical Engineering from Case Western Reserve
University, USA. He earned his M.S. in Electrical Engineering and MBA degree from
San Jose State University.
Mr. Daniel Chien
Vice President & CFO
Daniel currently serves as CFO at GUC.
Prior to joining GUC in 2006, Mr. Chien served as CFO in Ali Corp.
Mr. Chien received his MBA degree from the University of Texas at Arlington, USA.
Ms. Amy Yang
Accounting Deputy Director
Amy currently serves as Accounting Deputy Director at GUC.
Prior to joining GUC in 2005, Mrs. Yang served as Senior Accounting Manager in
Altek Corp.
Mrs. Yang received her Bachelor of Science degree in Accounting from Providence
University, Taiwan.
Note 1: Mr. Jerry Tzou left GUC on November 5, 2010.
-17- Annual Report 2010
Statement of Internal Control System
Date: February 17, 2011
Based on the results of a thorough self-examination, GUC hereby makes the following statement with regard to the company’s internal control system during the period from January 1 to December 31, 2010:
1. GUC recognizes that the establishment, implementation and functioning of
an internal control system falls onto the responsibility of the Board of
Directors and the management. Such a control system has been established
in GUC, aiming to reasonably assure the achievement of the following
objectives:
(1) operational effectiveness and efficiency including the safeguard of
profitability, performance and assets;
(2) reliable financial reporting, and
(3) compliance with applicable laws and regulations.
2. It should be noted that any internal control system has its limits, no matter
how well designed. An effective internal control system serves to provide
reasonable assurance of the above-mentioned three objectives, yet the
effectiveness may be subject to changes of environment or circumstances.
To counter such limits, GUC has adopted an internal control system with
self-surveillance mechanism. Thus GUC is able to rectify as soon as a
deficiency is identified.
3. Based on the criteria set in the “Standards for Establishing an Internal
Control System by Public Companies” (hereafter mentioned as
“Standards”), GUC judges the effectiveness of its internal control system
in terms of design and implementation. Taken into account the process of
management control, the Standards identify five components of a
company’s internal control system:
(1) control environment; (2) risk assessment; (3) control activities; (4)
information and communication, and (5) monitoring.
Each component has several sub-items
4. GUC has adopted the above-mentioned criteria to evaluate the
effectiveness of its internal control system in terms of design and
implementation.
5. Based on the findings of the evaluation mentioned in the proceeding
paragraph, GUC asserts that, during the year 2010, the design and
implementation of its internal control system (including the supervision
and management of GUC subsidiaries) are effective and assure achieving
Corporate Governance
-18- Annual Report 2010
the objectives of operational effectiveness and efficiency, reliable
financial reporting and compliance with applicable laws and regulations.
6. This Statement serves as an integral part of GUC’s 2010 Annual Report
and Prospectus, and will be made public. Any falsehood, concealment or
illegality in contents made public will entail legal liability under Articles
20, 32, 171, and 174 of the Securities Exchange Law.
7. The Statement was passed by the Board of Directors’ meeting on February
17, 2011, with the consent of the nine attending Directors affirming the
contents of this Statement.
Global Unichip Corporat ion
F. C. Tseng
Chairman
Jim Lai
President and COO

-19- Annual Report 2010
Board and Audit Committee Meeting Status
Five regular board meetings were convened in 2010. The status of attendance by
board members was as following:
Note 1: On August 30, 2010, TSMC assigned Dr. Hou to replace Dr. Hsu
Note 2: On August 9, 2010, Kingwell Investment Corp. assigned Dr. Hu to replace Mr.
Shiue.
Six regular audit committee meetings were convened in 2010. The status of
attendance by committee members is as follows:
Title Name Attendance in person By proxy Attendance rate (%)
ChairmanDr. F.C. Tseng
Representative of TSMC5 0 100%
Director
K.C. Shih
Representative of
Global On Investment Corp.
5 0 100%
DirectorJim Lai
Representative of TSMC5 0 100%
DirectorLora Ho
Representative of TSMC4 1 80%
DirectorDr. Fu-Chieh Hsu
Representative of TSMC (Note 1)1 3
DirectorDr. Cliff Hou
Representative of TSMC1 0
Director
C. C. Shiue
Representative of
Kingwell Investment Corp. (Note 2)
3 0
Director
Dr. John Hu
Representative of
Kingwell Investment Corp.
1 1
Independent
DirectorBenson Liu 5 0 100%
Independent
DirectorDr. Chein-Wei Jen 5 0 100%
Independent
DirectorDr. Wen-Yeu Wang 5 0 100%
40%
80%
Title Name Attendance in person By proxy Attendance rate (%)Independent
DirectorBenson Liu 6 0 100%
Independent
DirectorDr. Chein-Wei Jen 6 0 100%
Independent
DirectorDr. Wen-Yeu Wang 6 0 100%

-20- Annual Report 2010
Corporate Social Responsibility
As a world-class design and turnkey services company and a good corporate citizen, GUC has always sought to fulfill its corporate social responsibilities (CSR). This is the right thing to do because we believe our success is deeply entwined with our stewardship of the natural environment, efficient use of resources and meeting the expectations of our shareholders. We would like to share with the public our progress made in social commitment, employee health enhancement, environment protection, and our environmental awards over the past few years.
Item Implementation Status
Deviations from “Corporate Social Responsibility Best
Practice Principles for TWSE/GTSM Listed
Companies” and reasons
1. Exercising Corporate
Governance (1)The company declares its
corporate social responsibility policy and examines the results of the implementation.
Even though GUC has not established Corporate Social Responsibility Best Practice Principles, GUC implements and complies with the contents of CSR Best Practice Principles.
GUC has not established Corporate Social Responsibility Best Practice Principles.
(2)The company establishes exclusively (or concurrently) dedicated units to be in charge of proposing and enforcing the corporate social responsibility policies.
GUC’s Employee Welfare Committee and Marketing Division are responsible for CSR. More details are provided on page 27 of 2010 Annual Report.
None.

-21- Annual Report 2010
Item Implementation Status
Deviations from “Corporate Social Responsibility Best
Practice Principles for TWSE/GTSM Listed
Companies” and reasons
(3)The company organizes regular training on business ethics and promotion of matters prescribed in the preceding Article for directors, supervisors and employees, and should incorporate the foregoing into its employee performance appraisal system to establish a clear and effective reward and discipline system.
GUC periodically holds seminars of corporate ethics and promotions of matters prescribed in the preceding Articles for employees. Attendance records and sheets are filed.
GUC periodically holds seminars of corporate ethics and promotions of matters prescribed in the preceding Articles for employees. GUC does not incorporate the foregoing into its employee performance appraisal system.
2. Fostering a Sustainable Environment
(1)The company endeavors to utilize all resources more efficiently and uses renewable materials which have a low impact on the environment.
GUC endeavors to utilize all resources more efficiently, implement plans for resource recycling and garbage separation, and reduce the usage of paper cups and disposable plastic tableware for environmental protection.
GUC is an IC design service company which outsources all of wafer fabrication and production to third parties. Therefore, there is no information regarding greenhouse gas emission and reduction.
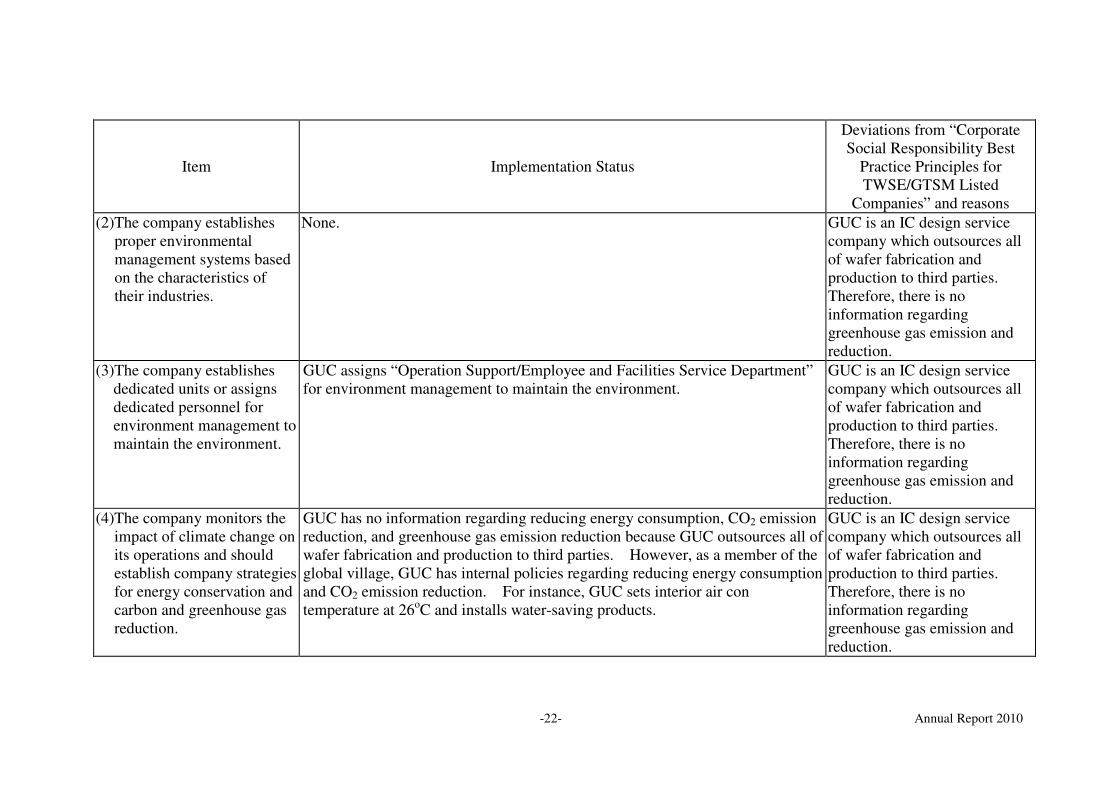
-22- Annual Report 2010
Item Implementation Status
Deviations from “Corporate Social Responsibility Best
Practice Principles for TWSE/GTSM Listed
Companies” and reasons
(2)The company establishes proper environmental management systems based on the characteristics of their industries.
None.
GUC is an IC design service company which outsources all of wafer fabrication and production to third parties. Therefore, there is no information regarding greenhouse gas emission and reduction.
(3)The company establishes dedicated units or assigns dedicated personnel for environment management to maintain the environment.
GUC assigns “Operation Support/Employee and Facilities Service Department” for environment management to maintain the environment.
GUC is an IC design service company which outsources all of wafer fabrication and production to third parties. Therefore, there is no information regarding greenhouse gas emission and reduction.
(4)The company monitors the impact of climate change on its operations and should establish company strategies for energy conservation and carbon and greenhouse gas reduction.
GUC has no information regarding reducing energy consumption, CO2 emission reduction, and greenhouse gas emission reduction because GUC outsources all of wafer fabrication and production to third parties. However, as a member of the global village, GUC has internal policies regarding reducing energy consumption and CO2 emission reduction. For instance, GUC sets interior air con temperature at 26oC and installs water-saving products.
GUC is an IC design service company which outsources all of wafer fabrication and production to third parties. Therefore, there is no information regarding greenhouse gas emission and reduction.
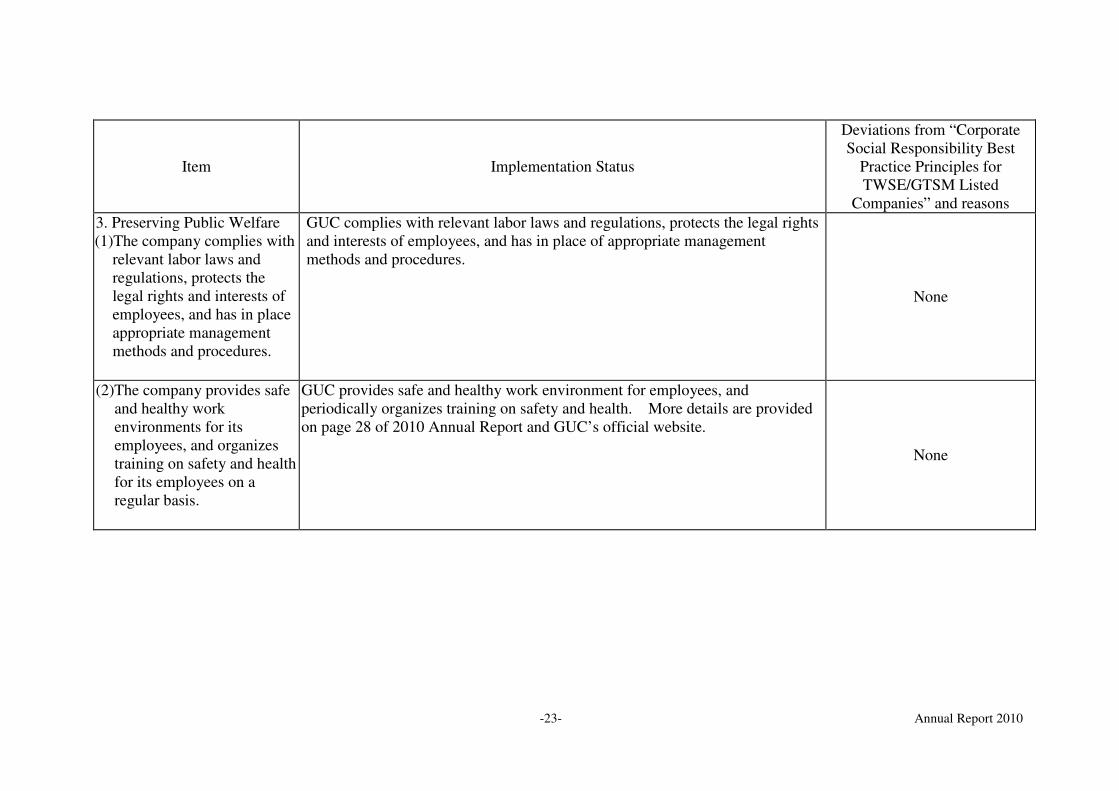
-23- Annual Report 2010
Item Implementation Status
Deviations from “Corporate Social Responsibility Best
Practice Principles for TWSE/GTSM Listed
Companies” and reasons
3. Preserving Public Welfare (1)The company complies with
relevant labor laws and regulations, protects the legal rights and interests of employees, and has in place appropriate management methods and procedures.
GUC complies with relevant labor laws and regulations, protects the legal rights and interests of employees, and has in place of appropriate management methods and procedures.
None
(2)The company provides safe and healthy work environments for its employees, and organizes training on safety and health for its employees on a regular basis.
GUC provides safe and healthy work environment for employees, and periodically organizes training on safety and health. More details are provided on page 28 of 2010 Annual Report and GUC’s official website.
None
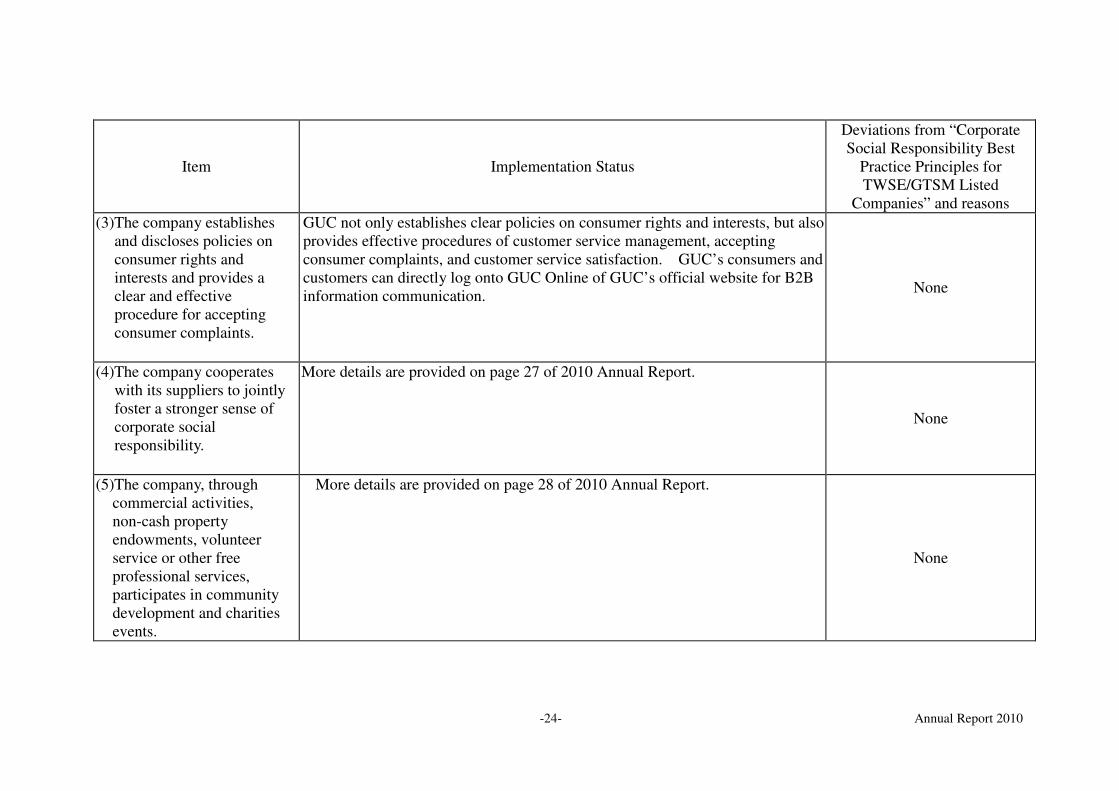
-24- Annual Report 2010
Item Implementation Status
Deviations from “Corporate Social Responsibility Best
Practice Principles for TWSE/GTSM Listed
Companies” and reasons
(3)The company establishes and discloses policies on consumer rights and interests and provides a clear and effective procedure for accepting consumer complaints.
GUC not only establishes clear policies on consumer rights and interests, but also provides effective procedures of customer service management, accepting consumer complaints, and customer service satisfaction. GUC’s consumers and customers can directly log onto GUC Online of GUC’s official website for B2B information communication.
None
(4)The company cooperates with its suppliers to jointly foster a stronger sense of corporate social responsibility.
More details are provided on page 27 of 2010 Annual Report.
None
(5)The company, through commercial activities, non-cash property endowments, volunteer service or other free professional services, participates in community development and charities events.
More details are provided on page 28 of 2010 Annual Report.
None
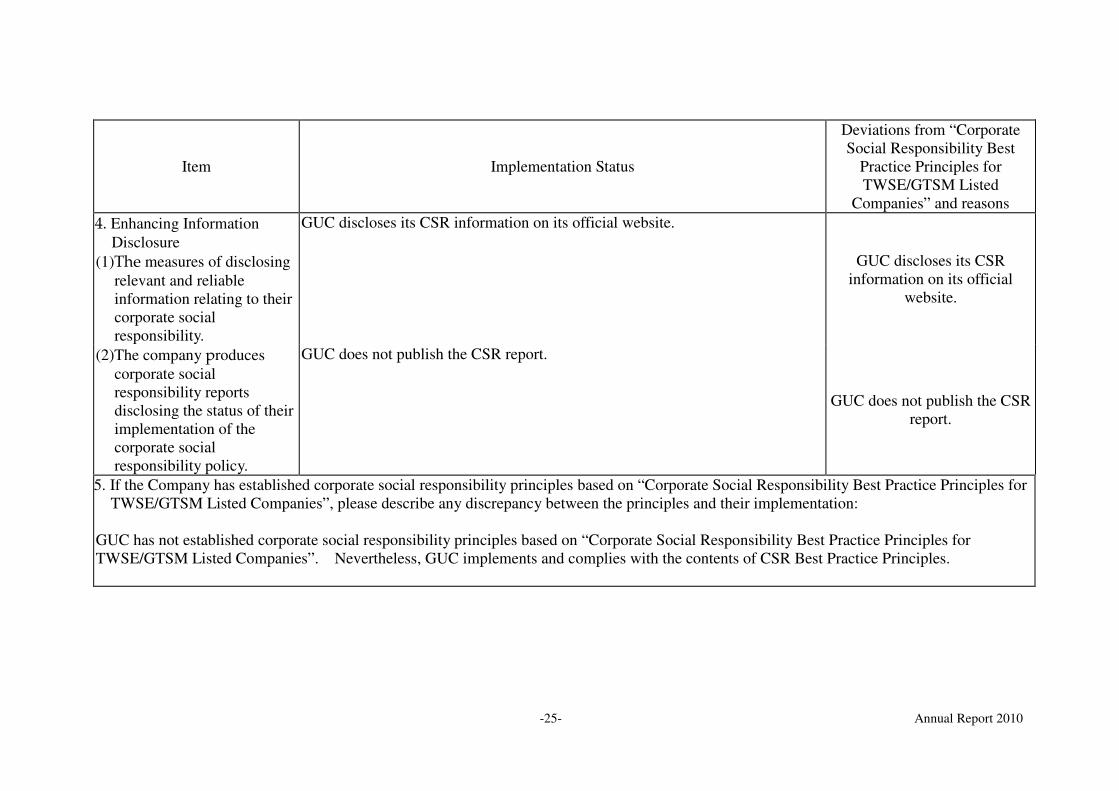
-25- Annual Report 2010
Item Implementation Status
Deviations from “Corporate Social Responsibility Best
Practice Principles for TWSE/GTSM Listed
Companies” and reasons
4. Enhancing Information Disclosure
(1)The measures of disclosing relevant and reliable information relating to their corporate social responsibility.
GUC discloses its CSR information on its official website.
GUC discloses its CSR
information on its official website.
(2)The company produces corporate social responsibility reports disclosing the status of their implementation of the corporate social responsibility policy.
GUC does not publish the CSR report.
GUC does not publish the CSR report.
5. If the Company has established corporate social responsibility principles based on “Corporate Social Responsibility Best Practice Principles for TWSE/GTSM Listed Companies”, please describe any discrepancy between the principles and their implementation:
GUC has not established corporate social responsibility principles based on “Corporate Social Responsibility Best Practice Principles for TWSE/GTSM Listed Companies”. Nevertheless, GUC implements and complies with the contents of CSR Best Practice Principles.

-26- Annual Report 2010
Item Implementation Status
Deviations from “Corporate Social Responsibility Best
Practice Principles for TWSE/GTSM Listed
Companies” and reasons
6. Other important information to facilitate better understanding of the Company’s corporate social responsibility practices (e.g., systems and measures that the company has adopted with respect to environmental protection, community participation, contribution to society, service to society, social and public interests, consumer rights and interests, human rights, safety and health, other corporate social responsibilities and
activities, and the status of implementation.):
More details are provided on pages 27 and 28 of 2010 Annual Report.
7. If the products or corporate social responsibility reports have received assurance from external institutions, they should state so below:
None.
-27- Annual Report 2010
Environmental protection
GUC believes its environmental protection should not only comply with domestic
legal requirements, but also implement governmental plans for resource recycling,
waste disposal and garbage separation. In addition, GUC reduces the usage of paper
cups and disposable plastic tableware for environmental protection and the best use of
resources. GUC has been committed to prevent pollution, ensure efficient use of
resources, prevent accidents, improve employee safety and health and protect property.
The aim is to create a work environment that upholds the well-beings of our
employees and communities.
GUC was recognized by the “Outstanding Achievement in Environmental Protection”
offered by the Hsinchu Science Park Administrations Bureau, and was certified as
“SONY Green Partner” and QC080000. Our commitments and implementations are
as follows:
1. Execute the standards of “Green Energy-saving Design” and provide
energy-saving products that comply with environmental protection regulations
and customers’ requirements.
2. Use package materials that comply with environmental protection regulations for
waste reduction and resource recycling.
3. Increase employees’ fundamental responsibility and awareness of environmental
protection, source recycling and energy saving through educational training and
propaganda.
4. Continue to execute energy-saving management and resource recycling.
5. Comply with governmental environmental protection regulations and fully assist
the authorities in carrying out environmental protection affairs.
Social Commitment
GUC’s activities of community involvement, social contribution, social work, public
welfare during the period from 1 January 2010 to the printing date of 2010 Annual
Report were as follows:
1. Encouraged GUC’s employees to donate blood.
2. Sponsored Taipei Symphony Orchestra to participate in Taipei Musical Festival of
Expo 2010 Shanghai China.
3. Sponsored the funds of installing the monitoring system for six unsafe bridges
caused by Typhoon Morakot in Hsinchu City and Hsinchu County, which could
sent out warning signals in advance to reduce casualties and loss.
4. Donated NT$50,000 respectively to Ye You Elementary School, Don Cing
Elementary School, Lang Dao Elementary School and Lan Yun Elementary
School in Lanyu Township, Taitung County, for equipment upgrade and campus

-28- Annual Report 2010
construction.
5. Helped the blind of Hsinchu Blind Welfare Association.
6. Participated in the public welfare activities hosted by Accton’s Public Welfare
House to donate Christmas gifts to the children.
7. Donated NT$650,000 to the victims of the March 11 earthquake and tsunami in
northeastern Japan through the Red Cross Society of The Republic of China.
Safety and Health-related Management
GUC employees enjoy complementary health management services such as annual
physical examinations and psychological consultations. In addition, GUC provides
employees subsidized clinical care services and massage programs. We make
available a fitness center with treadmills, exercise equipment, and aerobics classrooms
to encourage employees to do sports.

-29- Annual Report 2010
1. Business
1-1. Major Business
1-1.1. Main business activities of GUC:
(A) Engage in research & development, production, testing and sales of: � Embedded memory, logic, and analog components for various application ICs; � Cell libraries for various application ICs; and
� EDA tools for various application ICs.
(B) Provide technological support and consulting services related to the aforementioned products.
1-1.2. Revenue mix
Unit: Thousands of New Taiwan Dollars, except %
2009 2010 Sales breakdown
Amount % Amount %
ASIC& Wafers 6,376,624 77.11 7,981,521 77.71
NRE 1,731,808 20.94 1,995,122 19.42
Others 161,374 1.95 294,749 2.87
Total 8,269,806 100.00 10,271,392 100.00
1-1.3. Main products and services:
(A) ASIC & wafers: Provide complete services from design, wafer
manufacturing to packaging and testing.
(B) NRE (Non-Recurring Engineering): Provide circuit design cell library
and various IPs required in the process of product design; provide
circuit layouts needed for mask making; subcontract mask making,
wafer manufacturing, dicing and packaging to vendors; conduct final
testing to get prototype samples for customers.
(C) MPW (Multiple-Project Wafer): MPW integrates multiple design
projects of different customers on one single mask and by one wafer
engineer run. It is an effective and fast time-to-market chip
Operation Report
-30- Annual Report 2010
verification service with cost-sharing in masking and wafer
engineering run. Design engineers, before the phase of mass
production, are able to timely verify their prototype designs with
advanced process technologies and much lower costs.
(D) IP (Intellectual Property): These are silicon-verified reusable IC
designs with specific functions. With the rapid advancement of
semiconductor processing technologies, the design industry is
trending toward multi-functional chips and SoC (System on a Chip).
Reusable IP help customers avoid redundant designs and resources.
1-1.4. New product development plan
- To develop high-end and high-in-demand Intellectual Properties
(IPs): high speed interface like SerDes, XAUI, SATA, HDMI,
PCI-E, USB 3.0, USB Host Controller, USB OTG, H.264
Encoder/Decoder, AAC Encoder/Decoder, WMA Decoder, DDR
Memory Controller, LVDS, DC-DC Voltage Regulator, Power
Management Solution, ADC/DAC, etc.
- To offer complete IP for the multimedia, Solid State Drive, and
mobile TV application products.
- Continue to offer high-end design and turnkey services in 90nm,
65nm, 40nm, and 28nm technologies.
1-2. Industry Brief
1-2.1. Current status of the industry and future development
GUC is the first company dedicated in developing IP and providing SoC design and turnkey services in Taiwan. The IC design industry is characterized by the miniaturization in size, cost and time-to-market. SoC (System on a Chip), which encompasses multiple and powerful functions in one single tiny chip, is certainly the future to be. The design however involves much higher complexity and difficulties, wherein the concept of piling building blocks was introduced. SIPs are just like building blocks. With access to verified and reusable SIP, engineers are able to design and develop a complete system within short timeframe.
According to industrial estimation, in the near future, more than 90% of each ten-million gate level SoC design, excluding memory, will be formed by IP. Only the design firms who are able to acquire a quantity of high-performance IP within short time frame and successfully and rapidly integrate all IP into one design system will excel. The trend has given rise to a niche division-of-work in the semiconductor supply chain, that is, the supply of professional and commercialized IP.
Another industry trend is the closer than ever collaboration between foundries and design service firms. As the logic gate counts in IC design go higher,
-31- Annual Report 2010
they require much higher precision and expertise in the wafer manufacturing process. It is therefore critical for foundries and design service firms to tie-in Cell Library and manufacturing process together at the beginning of product development. Furthermore, as the process technology approaching nanometer scale, it will also enhance tie between foundries and design service firms.
The IC design industry in Taiwan has been enjoying great opportunities. The revenue of Taiwan’s fabless IC design firms rank second in the world, only after the US. There are more than 200 fabless IC design houses in Taiwan, well supported by the most advanced technologies provided from the world’s two leading foundries, TSMC and UMC. As more and more design houses adopt high-end process technologies to heighten the performance of their design products and the complexity increased has brought about various challenges for design service providers in the fields of IP synthesis and verification, and in DFT/DFM. Furthermore, the fees for their non-recurring engineering services, companies have to focus on their core design competence. In addition, IDM ASIC customers will adopt fabless ASIC companies while more and more IDMs are going fab-lite and the system companies’ differentiation is becoming a trend, those are design services providers committed to find commercial opportunities from these in the future.
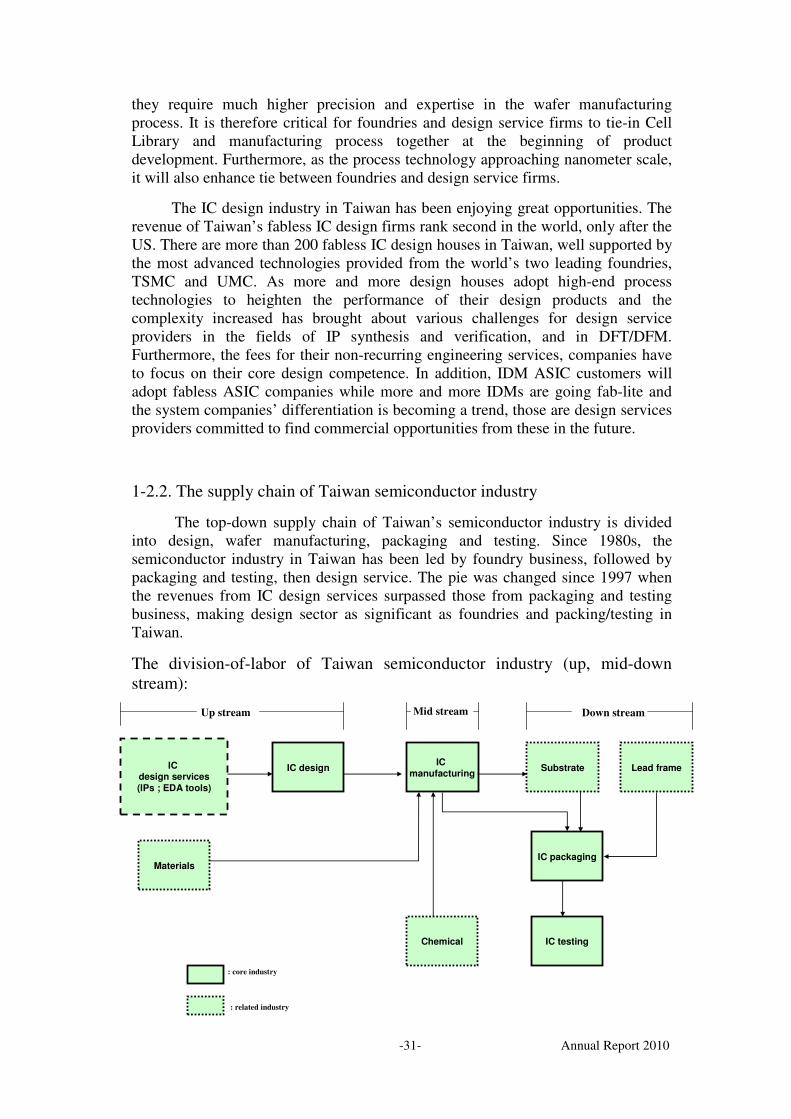
1-2.2. The supply chain of Taiwan semiconductor industry
The top-down supply chain of Taiwan’s semiconductor industry is divided into design, wafer manufacturing, packaging and testing. Since 1980s, the semiconductor industry in Taiwan has been led by foundry business, followed by packaging and testing, then design service. The pie was changed since 1997 when the revenues from IC design services surpassed those from packaging and testing business, making design sector as significant as foundries and packing/testing in Taiwan.
The division-of-labor of Taiwan semiconductor industry (up, mid-down stream):
IC designIC
manufacturingSubstrate Lead frame
IC packaging
IC testingChemical
Materials
IC design services
(IPs ; EDA tools)
: core industry
: related industry
Up stream Mid stream Down stream
-32- Annual Report 2010
1-2.3. Product development trend and competition
IC design used to be a simple task without the application of complex design methodologies. The picture has been changed along with the industry trending toward miniaturization and the convergence of system on a chip (SoC). To cope with the development of the technology changes, it is important for design service providers to exercise internal Design Reuse and apply abundant external IP to develop SoC.
Thanks to the semiconductor cluster in Taiwan with thorough supply chain of booming IC design houses, foundries, and packaging and testing support, design service providers have expanded significantly, with a current number of more than 20 in Taiwan. As most Taiwanese IC design companies have alliance either with TSMC or with UMC, accordingly design service providers belong to either one of the two groups. There are also some services providers choose to work with Korean wafer foundries or with the newly arisen foundries in China.
Along with the global IC projects migrate from 65nm to 40nm or even more advanced process technologies, wafer foundries must place significant emphasis on design services which have evolved from purely providing placement & routing toward executing register transfer level (RTL) and developing synthesis. That trend signals closer collaboration between foundries and design service providers. In the future, it will be the service providers who have the know-how and capabilities to develop IP platform for SoC applications and to synthesize process services, to stand out competition and take the lead.
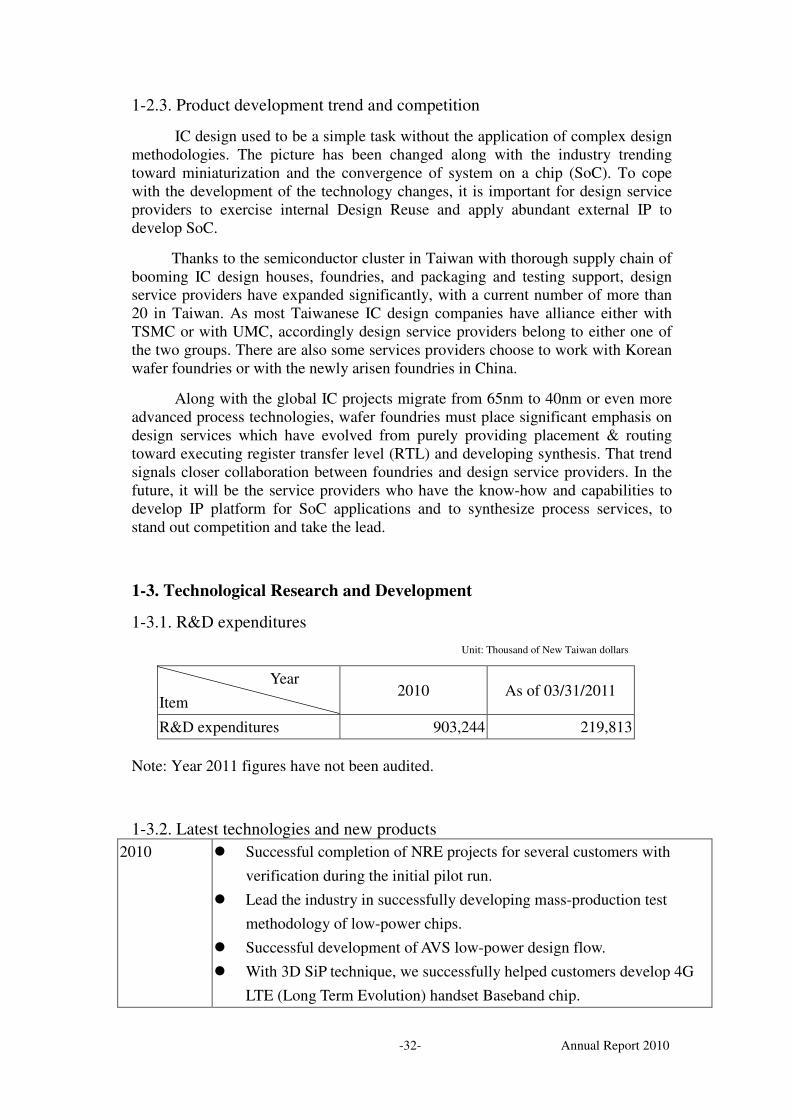
1-3. Technological Research and Development
1-3.1. R&D expenditures
Unit: Thousand of New Taiwan dollars
Note: Year 2011 figures have not been audited.
1-3.2. Latest technologies and new products
2010 � Successful completion of NRE projects for several customers with
verification during the initial pilot run.
� Lead the industry in successfully developing mass-production test
methodology of low-power chips.
� Successful development of AVS low-power design flow.
� With 3D SiP technique, we successfully helped customers develop 4G
LTE (Long Term Evolution) handset Baseband chip.
Year
Item 2010 As of 03/31/2011
R&D expenditures 903,244 219,813

-33- Annual Report 2010
� Successful development of low-power RF Turner IP for digital
televisions on 40nm.
� Cooperated with TSMC to complete USB3.0 solution: GUC’s
Controller and TSMC’s PHY.
� Successfully developed 10G EPON chipsets for customers and
succeeded on the first-silicon pilot run.
1-4. Long Term and Short Term Business Development Plan
1-4.1 Short-term
(A) Develop world-class flagship customers via GUC’s Europe, US,
China, Korea and Japan offices advantaged by geographical
proximity.
(B) Provide multiple platforms and total solutions to different
applications and markets to shorten customers’ time to market.
(C) Promote advanced technology MPW projects to lower customers’
risk.
(D) Raise entry barriers by developing advanced know-how and
product differentiation. Provide support services for the advanced
minus 90nm, 65nm, 40nm and 28nm below process technologies.
(E) Continuously provide quality service to existing customers to retain
long term collaboration.
(F) Enhance cooperation with upstream and downstream partners.
(G) Provide complete IP solutions and SoC development according to
product applications.
(H) Carry out one-stop shopping strategy and provide full services to
end customers.
1-4.1 Long-term
(A) Establish offices in global market to promote brand name and
worldwide market share.
(B) Enhance new business opportunities when more and more IDMs
are going fab-lite.
(C) Differentiate ourselves from competitors by providing high
value-added IP.
-34- Annual Report 2010
(D) Develop leading-edge process flow and products via closer
cooperation with foundries.
(E) Focus on core technologies and seek technological cooperation
with domestic and foreign system integrators.
(F) Continuously strengthen cooperation with vendors in the supply
chain.
(G) Focus on core technologies and seek technological cooperation
with domestic and foreign system integrators.
2. Market and Sales Distribution
2-1. Market Analysis
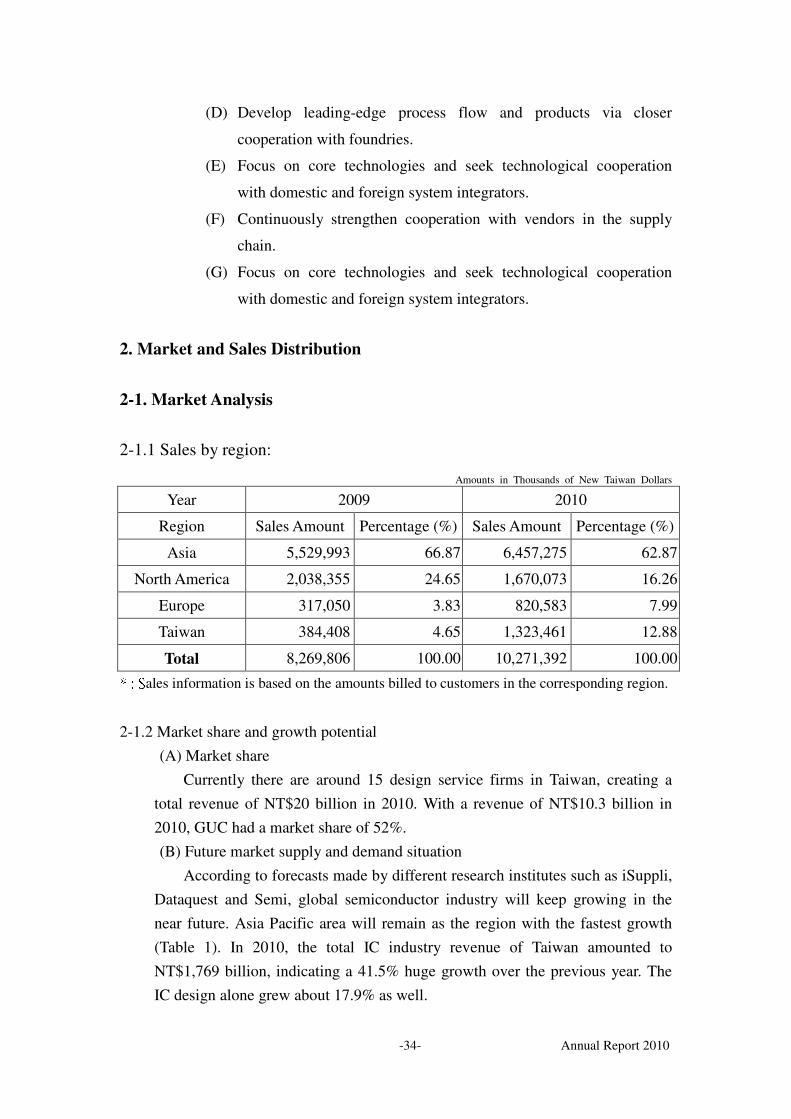
2-1.1 Sales by region:
Amounts in Thousands of New Taiwan Dollars
Year 2009 2010
Region Sales Amount Percentage (%) Sales Amount Percentage (%)
Asia 5,529,993 66.87 6,457,275 62.87
North America 2,038,355 24.65 1,670,073 16.26
Europe 317,050 3.83 820,583 7.99
Taiwan 384,408 4.65 1,323,461 12.88
Total 8,269,806 100.00 10,271,392 100.00 * : Sales information is based on the amounts billed to customers in the corresponding region.
2-1.2 Market share and growth potential
(A) Market share
Currently there are around 15 design service firms in Taiwan, creating a
total revenue of NT$20 billion in 2010. With a revenue of NT$10.3 billion in
2010, GUC had a market share of 52%.
(B) Future market supply and demand situation
According to forecasts made by different research institutes such as iSuppli,
Dataquest and Semi, global semiconductor industry will keep growing in the
near future. Asia Pacific area will remain as the region with the fastest growth
(Table 1). In 2010, the total IC industry revenue of Taiwan amounted to
NT$1,769 billion, indicating a 41.5% huge growth over the previous year. The
IC design alone grew about 17.9% as well.
-35- Annual Report 2010
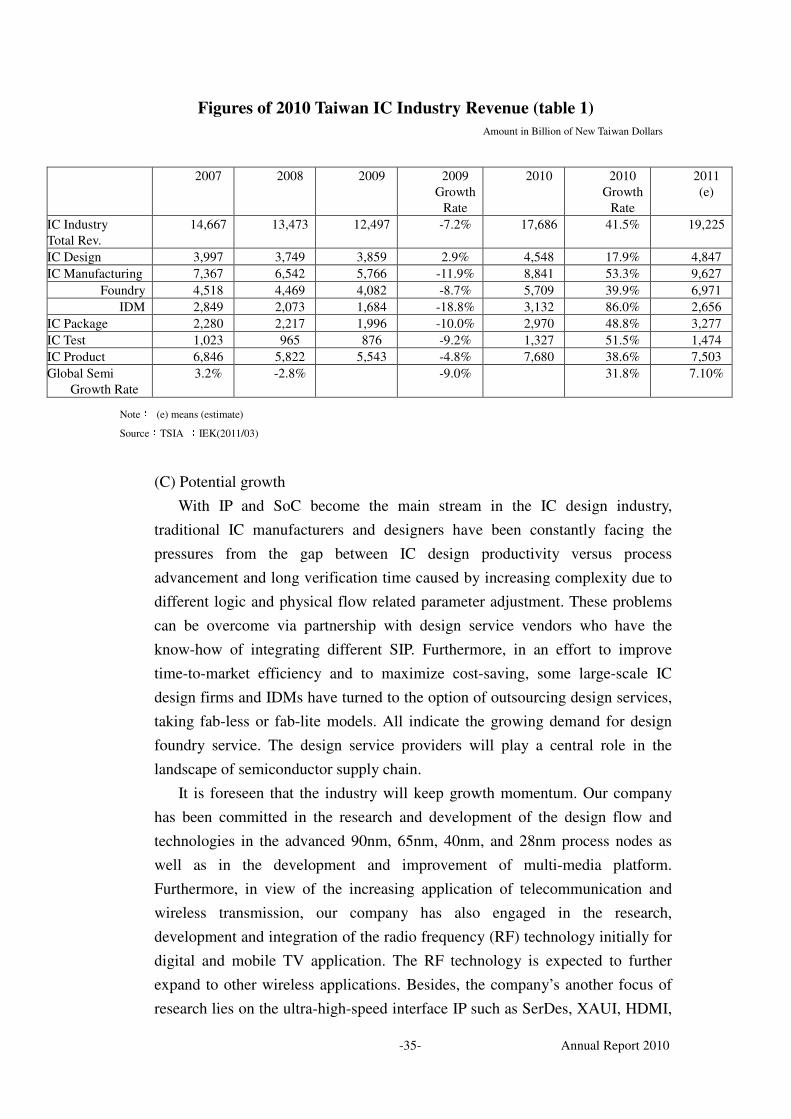
Figures of 2010 Taiwan IC Industry Revenue (table 1)
Amount in Billion of New Taiwan Dollars
2007 2008 2009 2009
Growth
Rate
2010 2010
Growth
Rate
2011
(e)
IC Industry
Total Rev.
14,667 13,473 12,497 -7.2% 17,686 41.5% 19,225
IC Design 3,997 3,749 3,859 2.9% 4,548 17.9% 4,847
IC Manufacturing 7,367 6,542 5,766 -11.9% 8,841 53.3% 9,627
Foundry 4,518 4,469 4,082 -8.7% 5,709 39.9% 6,971
IDM 2,849 2,073 1,684 -18.8% 3,132 86.0% 2,656
IC Package 2,280 2,217 1,996 -10.0% 2,970 48.8% 3,277
IC Test 1,023 965 876 -9.2% 1,327 51.5% 1,474
IC Product 6,846 5,822 5,543 -4.8% 7,680 38.6% 7,503
Global Semi
Growth Rate
3.2% -2.8% -9.0% 31.8% 7.10%
Note: (e) means (estimate)
Source:TSIA ;IEK(2011/03)
(C) Potential growth
With IP and SoC become the main stream in the IC design industry,
traditional IC manufacturers and designers have been constantly facing the
pressures from the gap between IC design productivity versus process
advancement and long verification time caused by increasing complexity due to
different logic and physical flow related parameter adjustment. These problems
can be overcome via partnership with design service vendors who have the
know-how of integrating different SIP. Furthermore, in an effort to improve
time-to-market efficiency and to maximize cost-saving, some large-scale IC
design firms and IDMs have turned to the option of outsourcing design services,
taking fab-less or fab-lite models. All indicate the growing demand for design
foundry service. The design service providers will play a central role in the
landscape of semiconductor supply chain.
It is foreseen that the industry will keep growth momentum. Our company
has been committed in the research and development of the design flow and
technologies in the advanced 90nm, 65nm, 40nm, and 28nm process nodes as
well as in the development and improvement of multi-media platform.
Furthermore, in view of the increasing application of telecommunication and
wireless transmission, our company has also engaged in the research,
development and integration of the radio frequency (RF) technology initially for
digital and mobile TV application. The RF technology is expected to further
expand to other wireless applications. Besides, the company’s another focus of
research lies on the ultra-high-speed interface IP such as SerDes, XAUI, HDMI,
-36- Annual Report 2010
PCI-E, SATA, and USB 3.0 widely applied in high value-added
telecommunication equipments. By way of developing and launching
above-mentioned new technologies and new applications, GUC is confident of
continuing revenue growth in the year of 2010.
2-1.3. Competitiveness, strength, weaknesses and counter strategies
(A) Competitive advantages
a. Abundant experience in IP development and integration
GUC has successfully developed a series of IP in accordance with
design reuse guidelines. GUC not only licenses its self-developed IP
to IC design houses and system houses at home and abroad, but also
provide services in integrating IP into customer projects.
b. Capability to design and develop application platform
With strong design capability, GUC can independently develop fully-verified application in multimedia, Solid State Drive, surveillance and mobile TV platform on which the number of IP can be modified according to customer demand. Customers can therefore rapidly prototype their product designs and shorten the time to market. In addition, GUC has further developed an ESL certification platform, Janus I, to speed up customers’ design flow. Such platform and accompanying design capabilities are only available in few large IDM or design houses.
c. Mature and complete design and verification flow
GUC’s design and verification flow has been proven by numerous
customer projects. Such flow serves to shorten the time needed for
IC verification, hence reducing risks. Customers are able to complete
product design within the shortest timeframe.
d. Keep hold on advanced process design technology
GUC has been committed in conducting advanced process
technology projects and have has successfully completed many 90nm
and 65nm projects. This year, we are proud to get several advanced
40nm design projects and to work on 28nm advance designs together
with important clients and strategic partners. Our abundant hands-on
experiences will support and guarantee the realization of our
customers’ advanced technology projects.
-37- Annual Report 2010
e. Technology-oriented R&D team
GUC has always been putting emphasis on developing its own
technologies. Over the past years, GUC has formed an
experience-rich R&D team with reliable design resources and
know-how. Customers are well-supported by our R&D force to
develop international-standard products.
f. Complete SIP partnership
In order to increase the quantity and types of SIP available for
customers, GUC in addition to developing home-grown SIP, also
collaborates closely with leading worldwide SIP vendors such as
ARM、MIPS、Synopsys、TCI、AnalogBits、CEVA、Silicon Image、
Imagination Technology、Cosmic、Dolphin、Cadence、GDA、
Transwitch、Snowbush、eMemory、Northwest、NScore、Sidence、
Elliptic、TSMC. GUC guarantees to provide complete IP solutions
for customers’ projects.
g. Multiple service model
GUC provides one-stop shopping service to customers with thorough
SoC solutions, and supports customers from design phase to mass
production phase. GUC has built up all the important service links in
the IC manufacturing flow. Customers are free to choose different
services and deliveries based on their technology capacity and needs.
h. Providing IP trading service through IP Mall
GUC offers a IP trading platform for our IP providers and users.
Customers therefore have accesses to information and services of
certain IP, as well as the verification information and quality
assurance of these IPs through a single contact window.
(B) Strength, weaknesses and counter strategy for long-term
development
a. Strength
a-1. Specialized division of work in the semiconductor industry
Taiwan’s IC industry has a unique infrastructure of vertical

-38- Annual Report 2010
disintegration, characterized by a cluster of IC design, advanced IC
foundry and back-end packaging and testing firms. The infrastructure
creates an extremely favorable environment for the development of
design services. For example, newly developed SIP can be rapidly
verified by the two world-class IC foundries to minimize failures and
risks. With the closely-tied cooperation between IC foundries and
service foundries, Taiwanese design service firms are able to offer
process-verified SIP to foreign customers who are accordingly very
likely to become the clients of the two IC foundries in Taiwan.
Taiwan has a good chance to become the international ISP trading
center.
a-2. Abundant IC design companies and downstream system
companies
There are a huge number of Taiwanese system manufacturers
engaged in ICT applications and consumer electronics. Whether these
system manufacturers are OEM vendors or own brand-name
developers, their systems in line with technology trend require
multiple and powerful functions integrated on one single chip. The
cooperation between design service firms and system integrators
plays a critical role in enhancing Taiwan’s SoC industry.
a-3. Government support
The Taiwanese government has been actively implementing the
policy of building Taiwan into a Green Silicon Island. Plans and
measures have been taken to successfully develop the ICT-related
and semiconductor industries. These efforts have created a pool of
qualified talents and well-established infrastructure raising Taiwan’s
global competitiveness.
b. Weaknesses and counter measures
b-1. Shortage of design talents
The IC industry boom in Taiwan is challenged by short of design
talents. The costs for design service firms are very high to find,
recruit and retain qualified talents.
Counter measures:
-39- Annual Report 2010
I. Provide internal and professional external trainings to cultivate
own talents. Strengthen cooperation and exchange with leading
industrial players and the academies to sustain our technology
competitive edge.
II. Strengthen project management capability and global logistics
operation.
III. Reduce dependence on manpower by applying innovative and
automate design and production flow.
b-2. Growth prospect causes fierce competition
As design service becomes the future to be, the industry has attracted
a great deal of new entries into competition.
Counter measures:
I. Develop niche and high value-added SIP to differentiate GUC
from competitors and to avoid price-cut competition.
II. Provide special-application platform in response to
time-to-market demands.
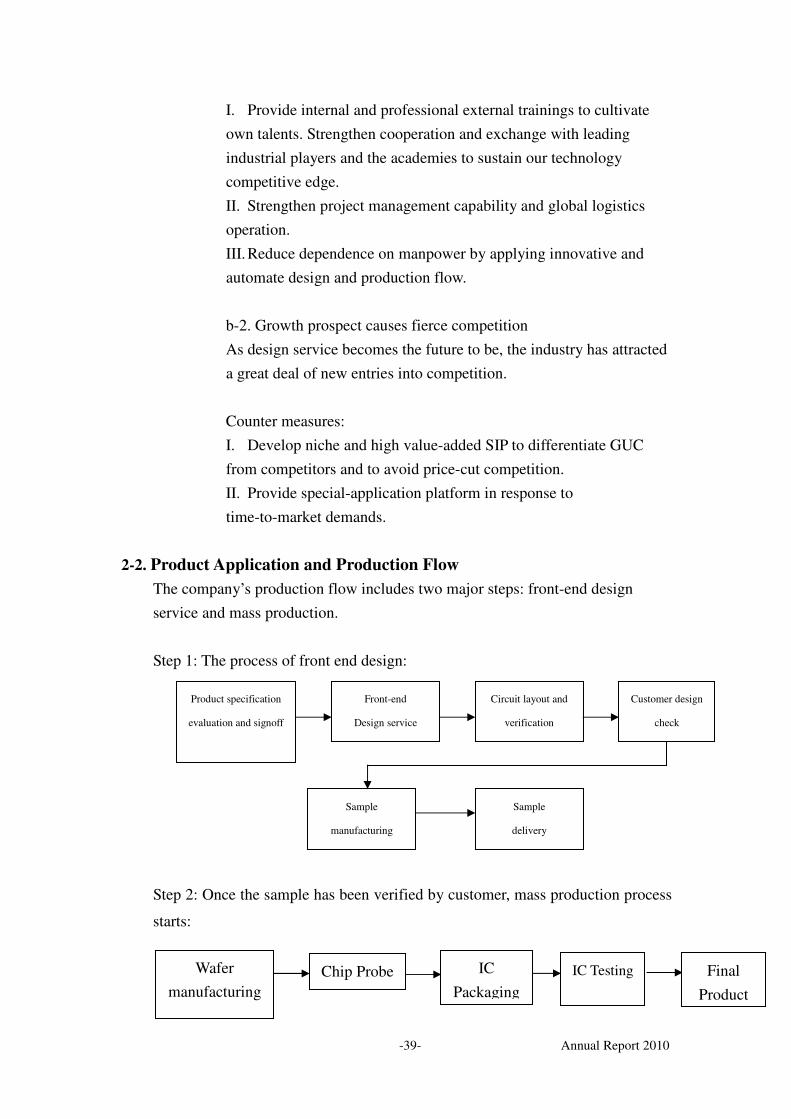
2-2. Product Application and Production Flow
The company’s production flow includes two major steps: front-end design
service and mass production.
Step 1: The process of front end design:
Step 2: Once the sample has been verified by customer, mass production process
starts:
Product specification
evaluation and signoff
Front-end
Design service
Circuit layout and
verification
Customer design
check
Sample
manufacturing
Sample
delivery
Wafer
manufacturing
Chip Probe IC
Packaging
IC Testing Final
Product
-40- Annual Report 2010
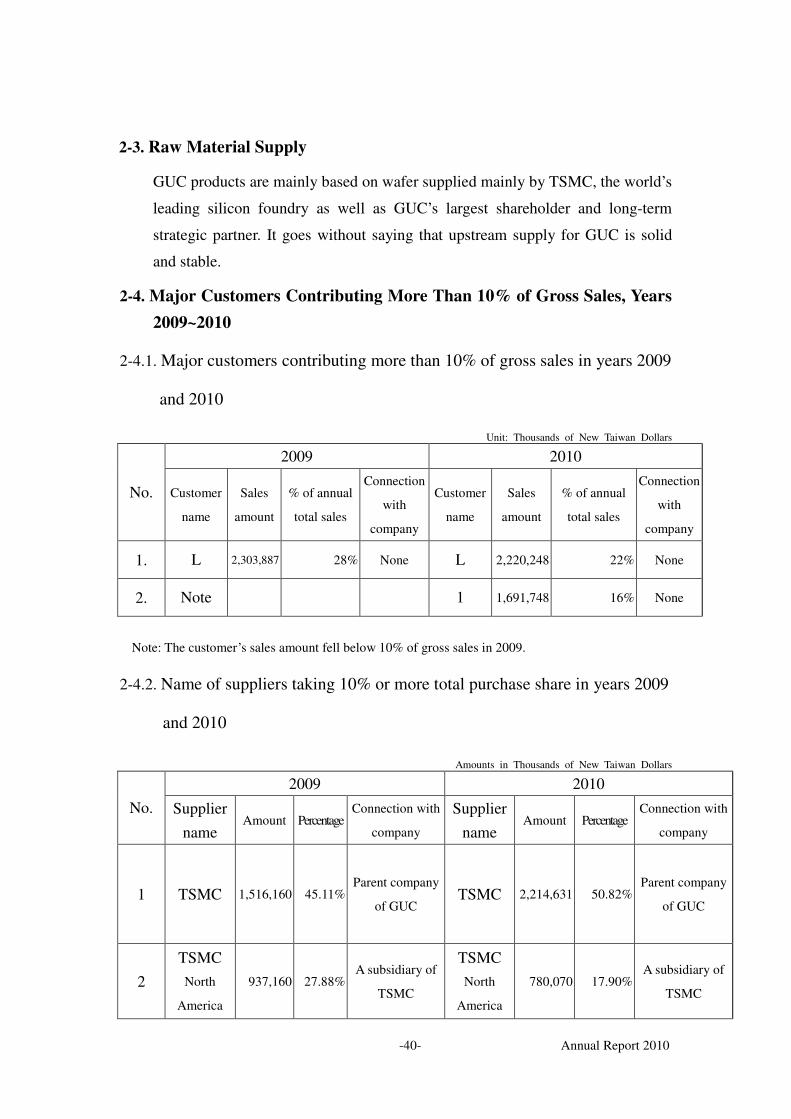
2-3. Raw Material Supply
GUC products are mainly based on wafer supplied mainly by TSMC, the world’s
leading silicon foundry as well as GUC’s largest shareholder and long-term
strategic partner. It goes without saying that upstream supply for GUC is solid
and stable.
2-4. Major Customers Contributing More Than 10% of Gross Sales, Years
2009~2010
2-4.1. Major customers contributing more than 10% of gross sales in years 2009
and 2010
Unit: Thousands of New Taiwan Dollars
2009 2010
No. Customer
name
Sales
amount
% of annual
total sales
Connection
with
company
Customer
name
Sales
amount
% of annual
total sales
Connection
with
company
1. L 2,303,887 28% None L 2,220,248 22% None
2. Note 1 1,691,748 16% None
Note: The customer’s sales amount fell below 10% of gross sales in 2009.
2-4.2. Name of suppliers taking 10% or more total purchase share in years 2009
and 2010
Amounts in Thousands of New Taiwan Dollars
2009 2010
No. Supplier
name Amount Percentage
Connection with
company
Supplier
name Amount Percentage
Connection with
company
1 TSMC 1,516,160 45.11% Parent company
of GUC TSMC 2,214,631 50.82%
Parent company
of GUC
2
TSMC
North
America
937,160 27.88% A subsidiary of
TSMC
TSMC
North
America
780,070 17.90% A subsidiary of
TSMC
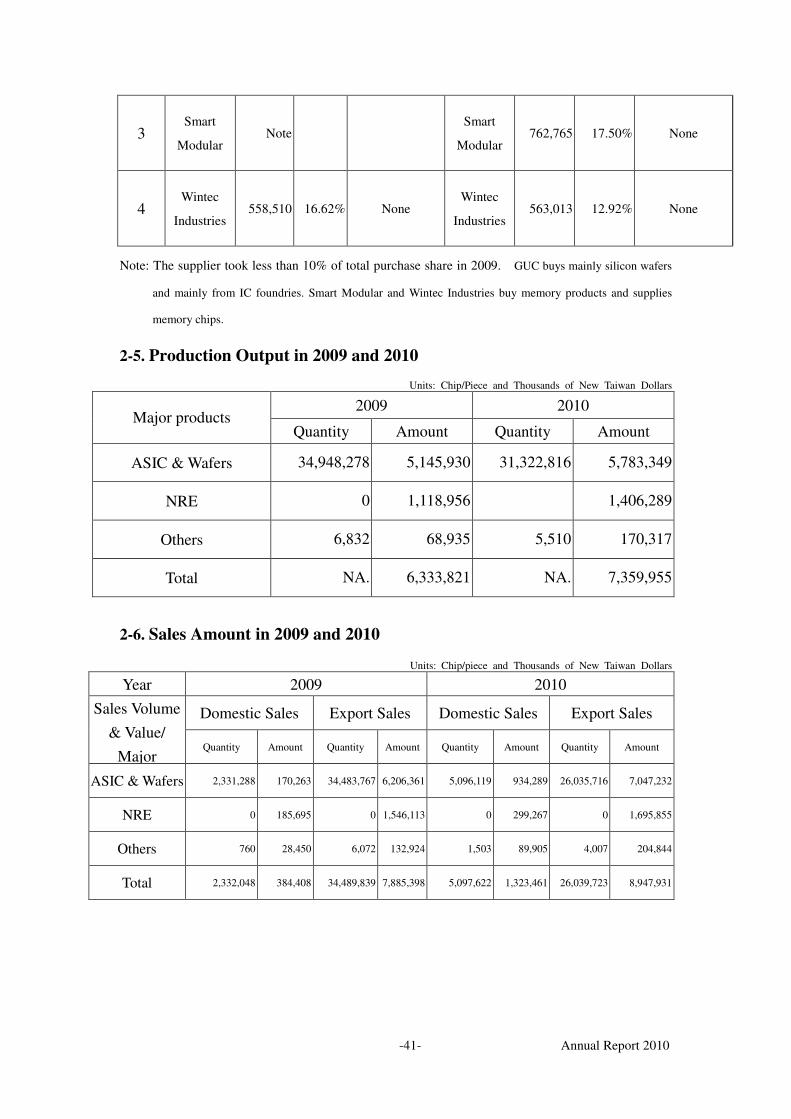
-41- Annual Report 2010
3 Smart
Modular Note
Smart
Modular 762,765 17.50% None
4 Wintec
Industries 558,510 16.62% None
Wintec
Industries 563,013 12.92% None
Note: The supplier took less than 10% of total purchase share in 2009. GUC buys mainly silicon wafers
and mainly from IC foundries. Smart Modular and Wintec Industries buy memory products and supplies
memory chips.
2-5. Production Output in 2009 and 2010
Units: Chip/Piece and Thousands of New Taiwan Dollars
2009 2010 Major products
Quantity Amount Quantity Amount
ASIC & Wafers 34,948,278 5,145,930 31,322,816 5,783,349
NRE 0 1,118,956 1,406,289
Others 6,832 68,935 5,510 170,317
Total NA. 6,333,821 NA. 7,359,955
2-6. Sales Amount in 2009 and 2010
Units: Chip/piece and Thousands of New Taiwan Dollars
Year 2009 2010
Domestic Sales Export Sales Domestic Sales Export Sales Sales Volume
& Value/
Major Quantity Amount Quantity Amount Quantity Amount Quantity Amount
ASIC & Wafers 2,331,288 170,263 34,483,767 6,206,361 5,096,119 934,289 26,035,716 7,047,232
NRE 0 185,695 0 1,546,113 0 299,267 0 1,695,855
Others 760 28,450 6,072 132,924 1,503 89,905 4,007 204,844
Total 2,332,048 384,408 34,489,839 7,885,398 5,097,622 1,323,461 26,039,723 8,947,931
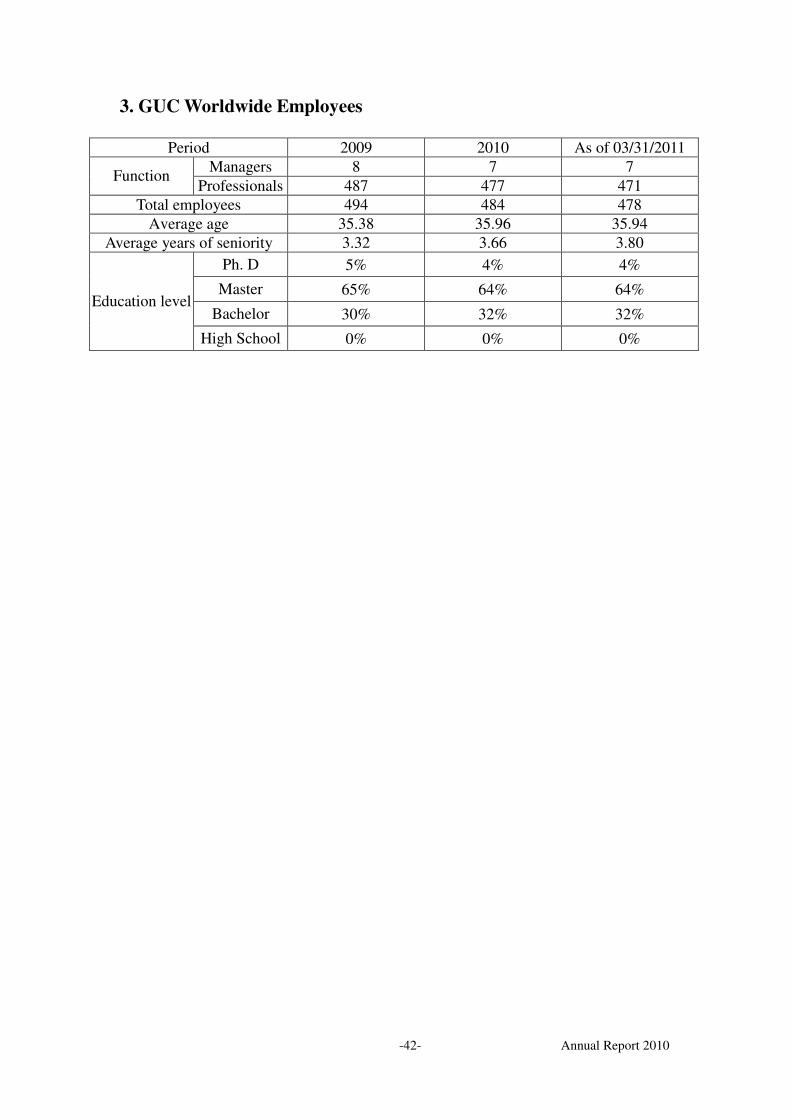
-42- Annual Report 2010
3. GUC Worldwide Employees
Period 2009 2010 As of 03/31/2011
Managers 8 7 7 Function
Professionals 487 477 471
Total employees 494 484 478
Average age 35.38 35.96 35.94
Average years of seniority 3.32 3.66 3.80
Ph. D 5% 4% 4%
Master 65% 64% 64%
Bachelor 30% 32% 32% Education level
High School 0% 0% 0%
-43- Annual Report 2010
Consolidated Financial Highlights

-44- Annual Report 2010

Global Unichip Corp. and Subsidiaries Consolidated Financial Statements for the Years Ended December 31, 2010 and 2009 and Independent Auditors’ Report
46
REPRESENTATION LETTER The entities that are required to be included in the combined financial statements of Global Unichip
Corp. as of and for the year ended December 31, 2010 under the Criteria Governing the Preparation
of Affiliation Reports, Consolidated Business Reports and Consolidated Financial Statements of
Affiliated Enterprises are the same as those included in the consolidated financial statements
prepared in conformity with the revised Statement of Financial Accounting Standards No. 7,
“Consolidated Financial Statements”. In addition, the information required to be disclosed in the
combined financial statements is included in the consolidated financial statements. Consequently,
Global Unichip Corp. and Subsidiaries do not prepare a separate set of combined financial
statements.
Very truly yours, GLOBAL UNICHIP CORP. By
DR. F. C. TSENG Chairman January 17, 2011

47
INDEPENDENT AUDITORS’ REPORT The Board of Directors and Shareholders Global Unichip Corp. We have audited the accompanying consolidated balance sheets of Global Unichip Corp. and subsidiaries as of December 31, 2010 and 2009, and the related consolidated statements of income, changes in shareholders’ equity and cash flows for the years then ended. These consolidated financial statements are the responsibility of the Company’s management. Our responsibility is to express an opinion on these consolidated financial statements based on our audits. We conducted our audits in accordance with the Rules Governing the Audit of Financial Statements by Certified Public Accountants and auditing standards generally accepted in the Republic of China. Those rules and standards require that we plan and perform the audit to obtain reasonable assurance about whether the financial statements are free of material misstatement. An audit includes examining, on a test basis, evidence supporting the amounts and disclosures in the financial statements. An audit also includes assessing the accounting principles used and significant estimates made by management, as well as evaluating the overall financial statement presentation. We believe that our audits provide a reasonable basis for our opinion. In our opinion, the consolidated financial statements referred to above present fairly, in all material respects, the consolidated financial position of Global Unichip Corp. and subsidiaries as of December 31, 2010 and 2009, and the consolidated results of their operations and their consolidated cash flows for the years then ended in conformity with the Guidelines Governing the Preparation of Financial Reports by Securities Issuers and accounting principles generally accepted in the Republic of China. As discussed in Note 3 to the consolidated financial statements, effective January 1, 2009, Global Unichip Corp. and subsidiaries adopted the newly revised Statement of Financial Accounting Standards No. 10, “Accounting for Inventories”. January 17, 2011
Notice to Readers
The accompanying consolidated financial statements are intended only to present the consolidated financial
position, results of operations and cash flows in accordance with accounting principles and practices generally
accepted in the Republic of China and not those of any other jurisdiction. The standards, procedures and
practices to audit such consolidated financial statements are those generally accepted and applied in the
Republic of China.
For the convenience of readers, the auditors’ report and the accompanying consolidated financial statements
have been translated into English from the original Chinese version prepared and used in the Republic of China.
If there is any conflict between the English version and the original Chinese version or any difference in the
interpretation of the two versions, the Chinese-language auditors’ report and consolidated financial statements
shall prevail.
48
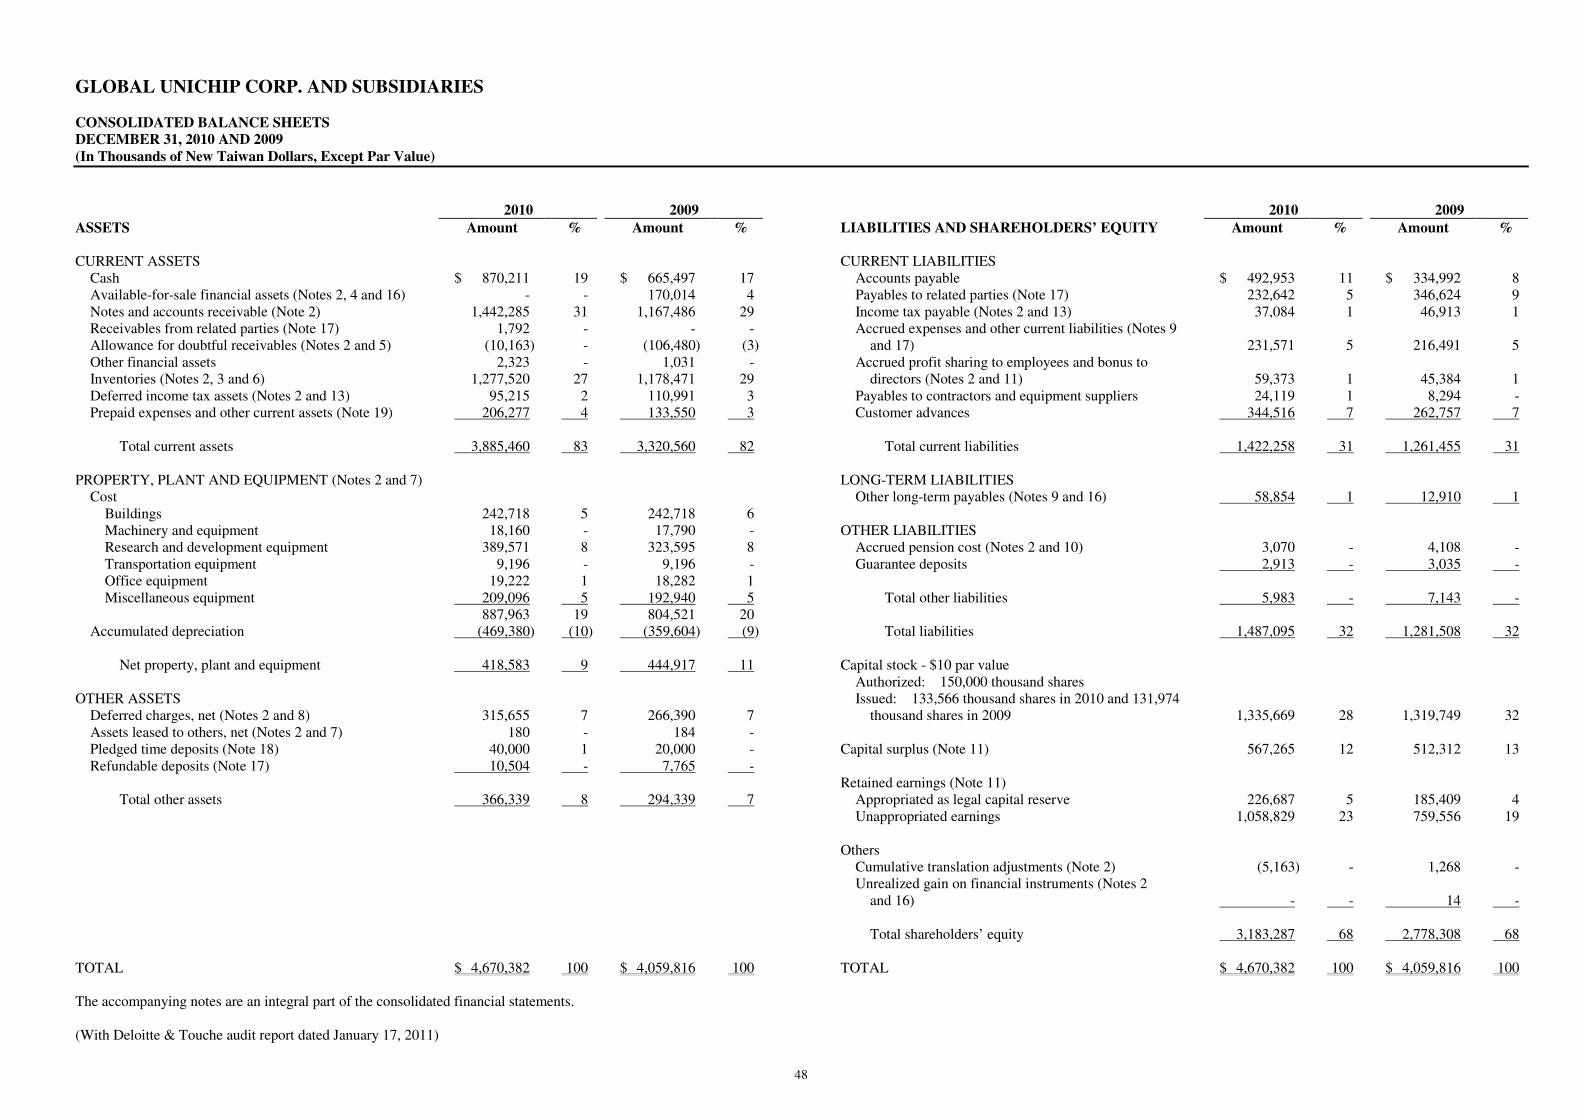
GLOBAL UNICHIP CORP. AND SUBSIDIARIES CONSOLIDATED BALANCE SHEETS
DECEMBER 31, 2010 AND 2009
(In Thousands of New Taiwan Dollars, Except Par Value)
2010 2009 2010 2009
ASSETS Amount % Amount % LIABILITIES AND SHAREHOLDERS’ EQUITY Amount % Amount %
CURRENT ASSETS CURRENT LIABILITIES
Cash $ 870,211 19 $ 665,497 17 Accounts payable $ 492,953 11 $ 334,992 8 Available-for-sale financial assets (Notes 2, 4 and 16) - - 170,014 4 Payables to related parties (Note 17) 232,642 5 346,624 9 Notes and accounts receivable (Note 2) 1,442,285 31 1,167,486 29 Income tax payable (Notes 2 and 13) 37,084 1 46,913 1 Receivables from related parties (Note 17) 1,792 - - - Accrued expenses and other current liabilities (Notes 9 Allowance for doubtful receivables (Notes 2 and 5) (10,163) - (106,480) (3) and 17) 231,571 5 216,491 5 Other financial assets 2,323 - 1,031 - Accrued profit sharing to employees and bonus to Inventories (Notes 2, 3 and 6) 1,277,520 27 1,178,471 29 directors (Notes 2 and 11) 59,373 1 45,384 1 Deferred income tax assets (Notes 2 and 13) 95,215 2 110,991 3 Payables to contractors and equipment suppliers 24,119 1 8,294 - Prepaid expenses and other current assets (Note 19) 206,277 4 133,550 3 Customer advances 344,516 7 262,757 7
Total current assets 3,885,460 83 3,320,560 82 Total current liabilities 1,422,258 31 1,261,455 31
PROPERTY, PLANT AND EQUIPMENT (Notes 2 and 7) LONG-TERM LIABILITIES
Cost Other long-term payables (Notes 9 and 16) 58,854 1 12,910 1 Buildings 242,718 5 242,718 6 Machinery and equipment 18,160 - 17,790 - OTHER LIABILITIES Research and development equipment 389,571 8 323,595 8 Accrued pension cost (Notes 2 and 10) 3,070 - 4,108 - Transportation equipment 9,196 - 9,196 - Guarantee deposits 2,913 - 3,035 - Office equipment 19,222 1 18,282 1 Miscellaneous equipment 209,096 5 192,940 5 Total other liabilities 5,983 - 7,143 -
887,963 19 804,521 20 Accumulated depreciation (469,380) (10) (359,604) (9) Total liabilities 1,487,095 32 1,281,508 32
Net property, plant and equipment 418,583 9 444,917 11 Capital stock - $10 par value
Authorized: 150,000 thousand shares OTHER ASSETS Issued: 133,566 thousand shares in 2010 and 131,974
Deferred charges, net (Notes 2 and 8) 315,655 7 266,390 7 thousand shares in 2009 1,335,669 28 1,319,749 32 Assets leased to others, net (Notes 2 and 7) 180 - 184 - Pledged time deposits (Note 18) 40,000 1 20,000 - Capital surplus (Note 11) 567,265 12 512,312 13 Refundable deposits (Note 17) 10,504 - 7,765 -
Retained earnings (Note 11) Total other assets 366,339 8 294,339 7 Appropriated as legal capital reserve 226,687 5 185,409 4
Unappropriated earnings 1,058,829 23 759,556 19 Others Cumulative translation adjustments (Note 2) (5,163) - 1,268 - Unrealized gain on financial instruments (Notes 2 and 16) - - 14 - Total shareholders’ equity 3,183,287 68 2,778,308 68 TOTAL $ 4,670,382 100 $ 4,059,816 100 TOTAL $ 4,670,382 100 $ 4,059,816 100 The accompanying notes are an integral part of the consolidated financial statements. (With Deloitte & Touche audit report dated January 17, 2011)

49
GLOBAL UNICHIP CORP. AND SUBSIDIARIES
CONSOLIDATED STATEMENTS OF INCOME
FOR THE YEARS ENDED DECEMBER 31, 2010 AND 2009
(In Thousands of New Taiwan Dollars, Except Consolidated Earnings Per Share)
2010 2009
Amount % Amount % GROSS SALES (Notes 2 and 17) $ 10,299,550 $ 8,310,381 SALES RETURNS AND ALLOWANCES (Note 2) 28,158 40,575 NET SALES 10,271,392 100 8,269,806 100 COST OF SALES (Notes 3, 6, 14 and 17) 8,278,860 81 6,510,591 79 GROSS PROFIT 1,992,532 19 1,759,215 21 OPERATING EXPENSES (Notes 14 and 17)
Sales and marketing 246,951 2 303,056 4 General and administrative 205,562 2 170,612 2 Research and development 955,097 9 878,833 10
Total operating expenses 1,407,610 13 1,352,501 16
INCOME FROM OPERATIONS 584,922 6 406,714 5 NON-OPERATING INCOME AND GAINS
Gain on reversal of bad debts (Note 5) 96,317 1 - - Interest income 5,766 - 5,040 - Gain on settlement and disposal of financial
instruments (Notes 2 and 16)
451 - 1,269 - Foreign exchange gain, net (Note 2) - - 18,539 - Others (Notes 2 and 17) 23,177 - 24,446 1
Total non-operating income and gains 125,711 1 49,294 1
NON-OPERATING EXPENSES AND LOSSES
Foreign exchange loss, net (Note 2) 46,323 - - - Others (Notes 2 and 7) 7 - 152 -
Total non-operating expenses and losses 46,330 - 152 -
INCOME BEFORE INCOME TAX 664,303 7 455,856 6 INCOME TAX EXPENSE (Notes 2 and 13) 59,802 1 43,085 1 NET INCOME $ 604,501 6 $ 412,771 5
(Continued)

50
GLOBAL UNICHIP CORP. AND SUBSIDIARIES
CONSOLIDATED STATEMENTS OF INCOME
FOR THE YEARS ENDED DECEMBER 31, 2010 AND 2009
(In Thousands of New Taiwan Dollars, Except Consolidated Earnings Per Share)
2010 2009
Before
Income
Tax
After
Income
Tax
Before
Income
Tax
After
Income
Tax
CONSOLIDATED EARNINGS PER SHARE
(Note 15)
Basic earnings per share $ 5.01 $ 4.56 $ 3.48 $ 3.15 Diluted earnings per share $ 4.94 $ 4.49 $ 3.40 $ 3.08
The accompanying notes are an integral part of the consolidated financial statements. (With Deloitte & Touche audit report dated January 17, 2011) (Concluded)

51
GLOBAL UNICHIP CORP. AND SUBSIDIARIES CONSOLIDATED STATEMENTS OF CHANGES IN SHAREHOLDERS' EQUITY
FOR THE YEARS ENDED DECEMBER 31, 2010 AND 2009
(In Thousands of New Taiwan Dollars Except Dividends Per Share)
Others
Unrealized
Capital Stock Retained Earnings Cumulative Gain on Total
Shares Legal Capital Special Capital Unappropriated Translation Financial Shareholders'
(In Thousands) Amount Capital Surplus Reserve Reserve Earnings Total Adjustments Instruments Equity
BALANCE, JANUARY 1, 2009 124,698 $ 1,246,985 $ 376,562 $ 110,704 $ 119 $ 901,460 $ 1,012,283 $ 3,065 $ - $ 2,638,895 Appropriations of prior year's earnings
Legal capital reserve - - - 74,705 - (74,705) - - - - Special capital reserve - - - - (119) 119 - - - - Stock dividends to shareholders - NT$0.40 per share 4,988 49,879 - - - (49,879) (49,879) - - - Cash dividends to shareholders - NT$3.43 per share - - - - - (430,210) (430,210) - - (430,210)
Bonus to employees - in stock 813 8,135 134,306 - - - - - - 142,441 Net income in 2009 - - - - - 412,771 412,771 - - 412,771 Issuance of stock from exercising stock options 1,475 14,750 1,444 - - - - - - 16,194 Adjustments in unrealized gain on available-for-sale
financial assets - - - - - - - - 14 14 Translation adjustments - - - - - - - (1,797) - (1,797) BALANCE, DECEMBER 31, 2009 131,974 1,319,749 512,312 185,409 - 759,556 944,965 1,268 14 2,778,308 Appropriations of prior year's earnings
Legal capital reserve - - - 41,278 - (41,278) - - - - Cash dividends to shareholders - NT$2.00 per share - - - - - (263,950) (263,950) - - (263,950)
Net income in 2010 - - - - - 604,501 604,501 - - 604,501 Proceeds from donations - - 49,021 - - - - - - 49,021 Issuance of stock from exercising stock options 1,592 15,920 5,932 - - - - - - 21,852 Adjustments in unrealized gain on available-for-sale
financial assets - - - - - - - - (14) (14) Translation adjustments - - - - - - - (6,431) - (6,431) BALANCE, DECEMBER 31, 2010 133,566 $ 1,335,669 $ 567,265 $ 226,687 $ - $ 1,058,829 $ 1,285,516 $ (5,163) $ - $ 3,183,287 The accompanying notes are an integral part of the financial statements. (With Deloitte & Touche audit report dated January 17, 2011)

52
GLOBAL UNICHIP CORP. AND SUBSIDIARIES
CONSOLIDATED STATEMENTS OF CASH FLOWS
FOR THE YEARS ENDED DECEMBER 31, 2010 AND 2009
(In Thousands of New Taiwan Dollars)
2010 2009
CASH FLOWS FROM OPERATING ACTIVITIES
Net income $ 604,501 $ 412,771 Adjustments to reconcile net income to net cash provided by operating
activities:
Depreciation 111,738 100,324 Amortization 174,837 187,330 Provision for (reversal of) doubtful receivables (96,317) 91,890 Deferred income tax 15,776 (15,223) Gain on settlement and disposal of financial instruments (451) (1,269) Net changes in operating assets and liabilities:
Decrease (increase) in: Notes and accounts receivable (274,799) (298,293) Receivables from related parties (1,792) 6,905 Other financial assets (1,292) 725 Inventories (99,049) (26,456) Prepaid expenses and other current assets (72,727) (16,145)
Increase (decrease) in: Accounts payable 157,961 (151,633) Payables to related parties (113,982) 88,901 Income tax payable (9,829) (35,481) Accrued expenses and other current liabilities (2,186) 54,088 Accrued profit sharing to employees and bonus to directors 13,989 (413) Customer advances 81,759 175,623 Accrued pension cost (1,038) (1,706)
Net cash provided by operating activities 487,099 571,938
CASH FLOWS FROM INVESTING ACTIVITIES
Acquisitions of: Available-for-sale financial assets (420,000) (1,120,000) Property, plant and equipment (70,133) (62,043)
Proceeds from disposal of: Available-for-sale financial assets 590,451 951,269
Increase in deferred charges (160,900) (158,508) Increase in pledged time deposits (20,000) - Increase in refundable deposits (2,739) (109)
Net cash used in investing activities (83,321) (389,391)
CASH FLOWS FROM FINANCING ACTIVITIES
Proceeds from donations 49,021 - Proceeds from exercise of employee stock options 21,852 16,194 Cash dividends (263,942) (430,203) Decrease in guarantee deposits (122) -
Net cash used in financing activities (193,191) (414,009)
(Continued)

53
GLOBAL UNICHIP CORP. AND SUBSIDIARIES
CONSOLIDATED STATEMENTS OF CASH FLOWS
FOR THE YEARS ENDED DECEMBER 31, 2010 AND 2009
(In Thousands of New Taiwan Dollars)
2010 2009
NET INCREASE (DECREASE) IN CASH $ 210,587 $ (231,462) EFFECT OF EXCHANGE RATE CHANGES (5,873) (1,688) CASH, BEGINNING OF YEAR 665,497 898,647 CASH, END OF YEAR $ 870,211 $ 665,497 SUPPLEMENTAL DISCLOSURES OF CASH FLOW INFORMATION
Interest paid $ - $ 1 Income tax paid $ 59,880 $ 89,726
NONCASH INVESTING AND FINANCING ACTIVITIES
Bonus to employees transferred to capital stock $ - $ 142,441 Current portion of other long-term payables (under accrued expenses
and other current liabilities)
$ 71,146 $ 53,888 INVESTING ACTIVITIES AFFECTING BOTH CASH AND
NON-CASH ITEMS
Acquisition of property, plant and equipment $ 85,958 $ 54,334 Decrease (increase) in payables to contractors and equipment suppliers (15,825) 7,709 Cash paid $ 70,133 $ 62,043 Acquisition of deferred charges $ 224,102 $ 87,934 Decrease (increase) in other long-term payables (63,202) 70,574 Cash paid $ 160,900 $ 158,508
The accompanying notes are an integral part of the consolidated financial statements. (With Deloitte & Touche audit report dated January 17, 2011) (Concluded)

54
GLOBAL UNICHIP CORP. AND SUBSI DIARIES
NOTES TO CONSOLIDATED FINANCIAL STATEMENTS
FOR THE YEARS ENDED DECEMBER 31, 2010 AND 2009
(Amounts in Thousands of New Taiwan Dollars, Unless Specified Otherwise)
1. GENERAL
Global Unichip Corp. (GUC), a Republic of China (R.O.C.) corporation, was incorporated on January 22, 1998. GUC is engaged mainly in researching, developing, production of, testing and sales of embedded memory and logic components for various application ICs, cell libraries for various application ICs, and EDA tools for various application ICs. On November 3, 2006, GUC’s shares were listed on the Taiwan Stock Exchange (TSE). As of December 31, 2010 and 2009, Taiwan Semiconductor Manufacturing Company Limited (TSMC) owned 35%, respectively, of GUC’s common shares. As of December 31, 2010 and 2009, GUC and its subsidiaries had 484 and 494 employees, respectively.
2. SIGNIFICANT ACCOUNTING POLICIES
The consolidated financial statements are presented in conformity with the Guidelines Governing the Preparation of Financial Reports by Securities Issuers, and accounting principles generally accepted in the R.O.C. Under these guidelines and principles, GUC and its subsidiaries should reasonably estimate the amounts of allowance for doubtful receivables, loss on inventories, depreciation of property, plant and equipment, amortization of deferred charges, impairment loss on assets, pension, bonuses to employees and directors, etc. Actual results may differ from those estimated by management. For the convenience of readers, the accompanying consolidated financial statements have been translated into English from the original Chinese version prepared and used in the R.O.C. If there is any conflict between the English version and the original Chinese version or any difference in the interpretation of the two versions, the Chinese-language consolidated financial statements shall prevail. Significant accounting policies are summarized as follows: Principles of Consolidation The accompanying consolidated financial statements include the accounts of all directly and indirectly majority owned subsidiaries of GUC. All significant intercompany balances and transactions have been eliminated upon consolidation. The consolidated entities were as follows:
Name of
Percentage of
Ownership
December 31
Investor Name of Investee 2010 2009 Remark
GUC Global Unichip Corp.-NA (GUC-NA) 100% 100% - Global Unichip Japan Co., Ltd. (GUC-Japan) 100% 100% - Global Unichip Corp. Europe B.V.
(GUC-Europe) 100% 100% -
Global Unichip (BVI) Corp. (GUC-BVI) 100% 100% - GUC-BVI Global Unichip (Shanghai) Company, Limited
(GUC-Shanghai) 100% - Newly established in
January 2010
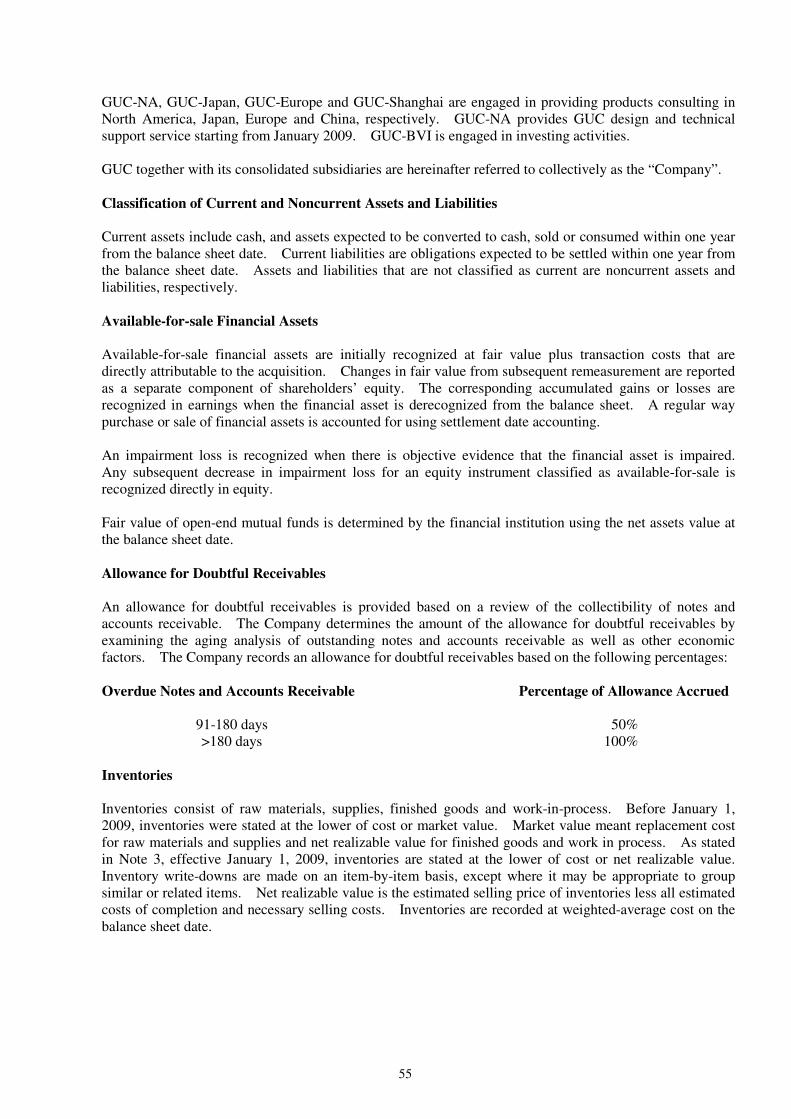
55
GUC-NA, GUC-Japan, GUC-Europe and GUC-Shanghai are engaged in providing products consulting in North America, Japan, Europe and China, respectively. GUC-NA provides GUC design and technical support service starting from January 2009. GUC-BVI is engaged in investing activities. GUC together with its consolidated subsidiaries are hereinafter referred to collectively as the “Company”. Classification of Current and Noncurrent Assets and Liabilities
Current assets include cash, and assets expected to be converted to cash, sold or consumed within one year from the balance sheet date. Current liabilities are obligations expected to be settled within one year from the balance sheet date. Assets and liabilities that are not classified as current are noncurrent assets and liabilities, respectively. Available-for-sale Financial Assets
Available-for-sale financial assets are initially recognized at fair value plus transaction costs that are directly attributable to the acquisition. Changes in fair value from subsequent remeasurement are reported as a separate component of shareholders’ equity. The corresponding accumulated gains or losses are recognized in earnings when the financial asset is derecognized from the balance sheet. A regular way purchase or sale of financial assets is accounted for using settlement date accounting. An impairment loss is recognized when there is objective evidence that the financial asset is impaired. Any subsequent decrease in impairment loss for an equity instrument classified as available-for-sale is recognized directly in equity. Fair value of open-end mutual funds is determined by the financial institution using the net assets value at the balance sheet date. Allowance for Doubtful Receivables
An allowance for doubtful receivables is provided based on a review of the collectibility of notes and accounts receivable. The Company determines the amount of the allowance for doubtful receivables by examining the aging analysis of outstanding notes and accounts receivable as well as other economic factors. The Company records an allowance for doubtful receivables based on the following percentages: Overdue Notes and Accounts Receivable Percentage of Allowance Accrued
91-180 days 50% >180 days 100%
Inventories
Inventories consist of raw materials, supplies, finished goods and work-in-process. Before January 1, 2009, inventories were stated at the lower of cost or market value. Market value meant replacement cost for raw materials and supplies and net realizable value for finished goods and work in process. As stated in Note 3, effective January 1, 2009, inventories are stated at the lower of cost or net realizable value. Inventory write-downs are made on an item-by-item basis, except where it may be appropriate to group similar or related items. Net realizable value is the estimated selling price of inventories less all estimated costs of completion and necessary selling costs. Inventories are recorded at weighted-average cost on the balance sheet date.
56
Property, Plant and Equipment and Assets Leased to Others Property, plant and equipment and assets leased to others are stated at cost less accumulated depreciation. When an indication of impairment is identified, any excess of the carrying amount of an asset over its recoverable amount is recognized as a loss. If the recoverable amount increases in a subsequent period, the amount previously recognized as impairment would be reversed and recognized as a gain. However, the adjusted amount may not exceed the carrying amount that would have been determined, net of depreciation, as if no impairment loss been recognized. Significant additions, renewals and betterments incurred during the construction period are capitalized. Maintenance and repairs are expensed as incurred. Depreciation is computed using the straight-line method over the following estimated service lives: buildings - 50 years, machinery and equipment - 3 to 5 years, research and development equipment - 3 to 5 years, transportation equipment - 5 years, office equipment - 3 to 5 years, miscellaneous equipment - 2 to 10 years and assets leased to others - 50 years. Property, plant and equipment and assets leased to others still in use beyond their original estimated useful lives are further depreciated over their newly estimated useful lives. Upon sale or disposal of property, plant and equipment and assets leased to others, the related cost and accumulated depreciation are deducted from the corresponding accounts, with any gain or loss recorded as non-operating gains or losses in the year of sale or disposal. Deferred Charges
Deferred charges consist of software, technology license fees and patents. The amounts are amortized over the following periods: Software - 2 to 5 years, technology license fees - the term of the technology transfer contract and patents - economic lives of the patents. When an indication of impairment is identified, any excess of the carrying amount of an asset over its recoverable amount is recognized as a loss. If the recoverable amount increases in a subsequent period, the previously recognized impairment loss would be reversed and recognized as a gain. However, the adjusted amount may not exceed the carrying amount that would have been determined, net of amortization, as if no impairment loss been recognized. Expenditure on research activities is recognized as an expense when incurred. An internally-generated intangible asset arising from development activities is capitalized and then amortized on a straight-line basis over its useful life if the recognition criteria for an intangible asset have been met; otherwise, the development expenditure is recognized as an expense when incurred. Pension Costs For employees under defined contribution pension plans, pension costs are recorded based on the actual contributions made to employees’ individual pension accounts during their service periods. For employees under defined benefit pension plan, pension costs are recorded based on actuarial calculations. Revenue Recognition and Provision for Sales Allowance The Company recognizes revenue when evidence of an arrangement exists, the rewards of ownership and significant risk of the goods have been transferred to the buyer, price is fixed or determinable, and collectibility is reasonably assured. Provisions for sales allowance are recorded based on the estimated amount to be incurred. Sales prices are determined using the fair value taking into account related sales discounts agreed by the Company and its customers. Since the receivables from sales are collectible within one year and such transactions are frequent, the fair value of receivables is equivalent to the nominal amount of cash received.
57
Income Tax The Company uses the inter-period tax allocation method. Deferred income tax assets and liabilities are recognized for the tax effects of temporary differences, operating loss carryforwards, and unused tax credits. Valuation allowances are provided to the extent, if any, that it is more likely than not that deferred income tax assets will not be realized. A deferred tax asset or liability is classified as current or noncurrent according to the classification of the related asset or liability. However, if a deferred tax asset or liability does not relate to an asset or liability in the financial statements, then it is classified as either current or noncurrent based on the expected length of time before it is realized or settled. Any tax credits arising from purchases of machinery, equipment and technology, research and development expenditures, personnel training expenditures are recognized using the flow-through method. Adjustments of prior years’ tax liabilities are added to or deducted from the current period’s tax provision. Income tax on unappropriated earnings at a rate of 10% is expensed in the year of shareholder approval which is the year subsequent to the year the earnings are generated. Income taxes of the Company are calculated based on tax laws of various countries and jurisdictions where respective subsidiary companies are incorporated. Income tax returns are filed by each entity separately and not on a combined basis. Income tax expense of the Company is the sum of each individual entity with respectively. Stock-based Compensation
Employee stock options that were granted or modified in the period from January 1, 2004 to December 31, 2007 are accounted for by the interpretations issued by the Accounting Research and Development Foundation (ARDF) of the Republic of China. The Company adopted the intrinsic value method and any compensation cost determined using this method is recognized in earnings over the employee vesting period. Employee stock option plans that were granted or modified after December 31, 2007 are accounted for using fair value method in accordance with Statement of Financial Accounting Standards No. 39, “Accounting for Share-based Payment.” The Company did not grant or modify any employee stock options since January 1, 2008. Profit Sharing to Employees and Bonus to Directors Effective January 1, 2008, the Company adopted Interpretation 2007-052, “Accounting for Bonuses to Employees, Directors and Supervisors,” which requires companies to record profit sharing to employees and bonus to directors as an expense rather than as an appropriation of earnings. Foreign-currency Transactions
Foreign-currency transactions other than derivative contracts are recorded in New Taiwan dollars at the rates of exchange in effect when the transactions occur. Exchange gains or losses derived from foreign-currency transactions or monetary assets and liabilities denominated in foreign currencies are recognized in earnings. At the balance sheet date, monetary assets and liabilities denominated in foreign currencies are revalued at prevailing exchange rates with the resulting gains or losses recognized in earnings.
Translation of Foreign-currency Financial Statements
The financial statements of foreign subsidiaries are translated into New Taiwan dollars at the following exchange rates: Assets and liabilities - spot rates at year-end, shareholders’ equity - historical rates, income and expenses - average rates during the year. The resulting translation adjustments are recorded as a separate component of shareholders’ equity.
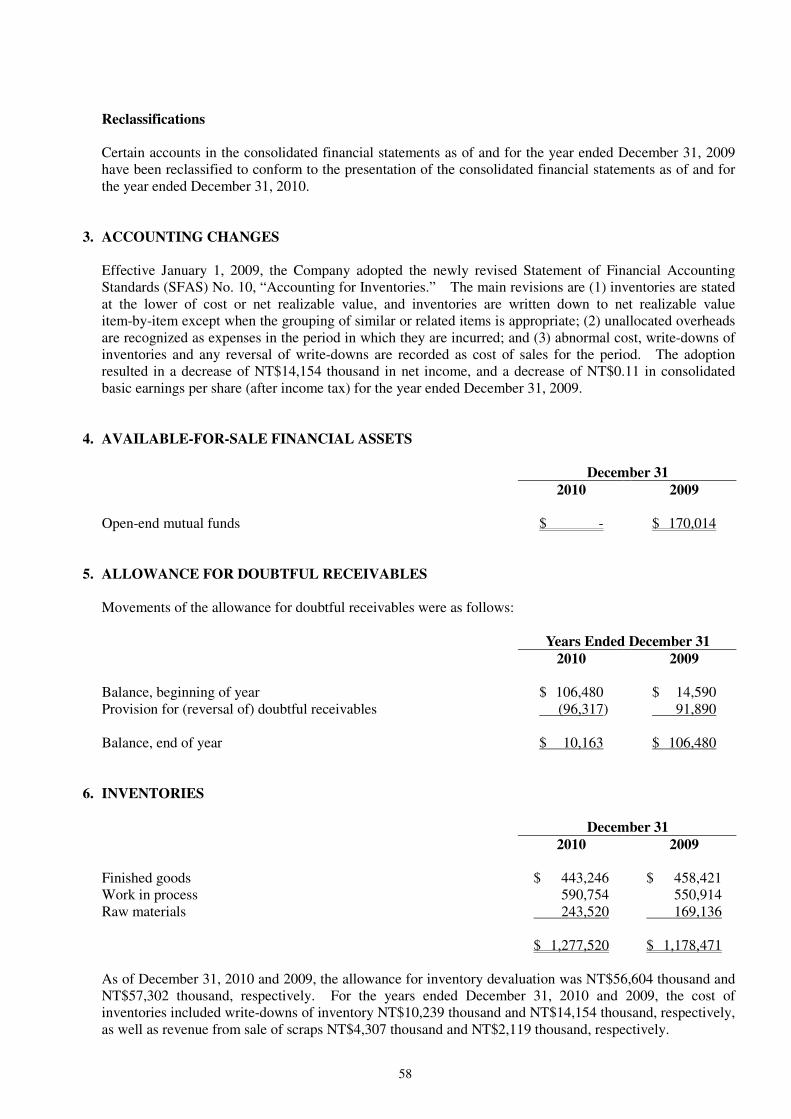
58
Reclassifications
Certain accounts in the consolidated financial statements as of and for the year ended December 31, 2009 have been reclassified to conform to the presentation of the consolidated financial statements as of and for the year ended December 31, 2010.
3. ACCOUNTING CHANGES
Effective January 1, 2009, the Company adopted the newly revised Statement of Financial Accounting Standards (SFAS) No. 10, “Accounting for Inventories.” The main revisions are (1) inventories are stated at the lower of cost or net realizable value, and inventories are written down to net realizable value item-by-item except when the grouping of similar or related items is appropriate; (2) unallocated overheads are recognized as expenses in the period in which they are incurred; and (3) abnormal cost, write-downs of inventories and any reversal of write-downs are recorded as cost of sales for the period. The adoption resulted in a decrease of NT$14,154 thousand in net income, and a decrease of NT$0.11 in consolidated basic earnings per share (after income tax) for the year ended December 31, 2009.
4. AVAILABLE-FOR-SALE FINANCIAL ASSETS
December 31
2010 2009
Open-end mutual funds $ - $ 170,014
5. ALLOWANCE FOR DOUBTFUL RECEIVABLES
Movements of the allowance for doubtful receivables were as follows:
Years Ended December 31
2010 2009
Balance, beginning of year $ 106,480 $ 14,590 Provision for (reversal of) doubtful receivables (96,317) 91,890 Balance, end of year $ 10,163 $ 106,480
6. INVENTORIES
December 31
2010 2009
Finished goods $ 443,246 $ 458,421 Work in process 590,754 550,914 Raw materials 243,520 169,136 $ 1,277,520 $ 1,178,471
As of December 31, 2010 and 2009, the allowance for inventory devaluation was NT$56,604 thousand and NT$57,302 thousand, respectively. For the years ended December 31, 2010 and 2009, the cost of inventories included write-downs of inventory NT$10,239 thousand and NT$14,154 thousand, respectively, as well as revenue from sale of scraps NT$4,307 thousand and NT$2,119 thousand, respectively.

59
7. PROPERTY, PLANT AND EQUIPMENT
Year Ended December 31, 2010
Buildings
Machinery and
Equipment
Research and
Development
Equipment
Transportation
Equipment
Office
Equipment
Miscellaneous
Equipment Total
Cost
Balance, beginning of year $ 242,718 $ 17,790 $ 323,595 $ 9,196 $ 18,282 $ 192,940 $ 804,521 Additions - 370 65,976 - 1,218 18,394 85,958 Disposals - - - - (95 ) (1,527 ) (1,622 ) Translation adjustment - - - - (183 ) (711 ) (894 ) Balance, end of year 242,718 18,160 389,571 9,196 19,222 209,096 887,963
Accumulated depreciation Balance, beginning of year 25,648 17,694 211,667 3,607 15,164 85,824 359,604 Additions 4,762 60 74,150 1,346 1,301 30,115 111,734 Disposals - - - - (95 ) (1,527 ) (1,622 ) Translation adjustment - - - - (59 ) (277 ) (336 ) Balance, end of year 30,410 17,754 285,817 4,953 16,311 114,135 469,380
Net book value, end of year $ 212,308 $ 406 $ 103,754 $ 4,243 $ 2,911 $ 94,961 $ 418,583
Year Ended December 31, 2009
Buildings
Machinery and
Equipment
Research and
Development
Equipment
Transportation
Equipment
Office
Equipment
Miscellaneous
Equipment
Total
Cost
Balance, beginning of year $ 242,718 $ 17,790 $ 289,884 $ 9,196 $ 19,669 $ 171,125 $ 750,382 Additions - - 33,711 - 937 19,686 54,334 Reclassification - - - - (2,312 ) 2,312 - Translation adjustment - - - - (12 ) (183 ) (195 ) Balance, end of year 242,718 17,790 323,595 9,196 18,282 192,940 804,521
Accumulated depreciation Balance, beginning of year 20,886 17,670 148,462 2,231 13,741 56,380 259,370 Additions 4,762 24 63,205 1,376 2,839 28,114 100,320 Reclassification - - - - (1,412 ) 1,412 - Translation adjustment - - - - (4 ) (82 ) (86 ) Balance, end of year 25,648 17,694 211,667 3,607 15,164 85,824 359,604
Net book value, end of year $ 217,070 $ 96 $ 111,928 $ 5,589 $ 3,118 $ 107,116 $ 444,917
The Company rents out certain floor space of its buildings under several operating lease arrangements. The related book value of the leased floor space has been reclassified to assets leased to others under other assets.
8. DEFERRED CHARGES, NET
Year Ended December 31, 2010
Software
Technology
License Fees
Patents
Total Balance, beginning of year $ 162,139 $ 103,901 $ 350 $ 266,390 Additions 215,802 8,300 - 224,102 Amortization (140,444) (34,365) (28) (174,837) Balance, end of year $ 237,497 $ 77,836 $ 322 $ 315,655
Year Ended December 31, 2009
Software
Technology
License Fees
Patents
Total Balance, beginning of year $ 214,376 $ 151,032 $ 378 $ 365,786 Additions 85,934 2,000 - 87,934 Amortization (138,171) (49,131) (28) (187,330) Balance, end of year $ 162,139 $ 103,901 $ 350 $ 266,390

60
9. OTHER LONG-TERM PAYABLES
The payables were primarily attributable to several agreements that GUC entered into for certain technology license and software. As of December 31, 2010, future payments for other long-term payables were as follows:
Year of Payment Amount
2011 (under accrued expenses and other current liabilities) $ 71,146 2012 58,854 $ 130,000
10. PENSION PLANS
The pension mechanism under the Labor Pension Act is deemed a defined contribution plan. Pursuant to the Act, GUC makes monthly contributions equal to 6% of each employee’s monthly salary to employees’ pension accounts. Furthermore, GUC-Shanghai is required by local regulations to make monthly contributions at certain percentages of the salary of their employees. Pursuant to the aforementioned Act and the local regulations, the Company recognized pension costs of NT$26,451 thousand and NT$24,803 thousand for the years ended December 31, 2010 and 2009, respectively. GUC has a defined benefit plan under the Labor Standards Law, which provides benefits based on an employee’s length of service and average monthly salary of the last six months prior to retirement. GUC contributes an amount equal to 2% of salaries paid each month to a pension fund (the Fund), which is administered by the Labor Pension Fund Supervisory Committee (the Committee) and deposited in the Committee’s name in the Bank of Taiwan. The Company recognized pension costs of NT$948 thousand and NT$439 thousand for the years ended December 31, 2010 and 2009, respectively. Information about the defined benefit plan is summarized as follows: a. Components of net periodic pension cost for the year
Years Ended December 31
2010 2009
Service cost $ 170 $ 20 Interest cost 777 662 Projected return on plan assets (443) (491) Amortization 444 248 Net periodic pension cost $ 948 $ 439
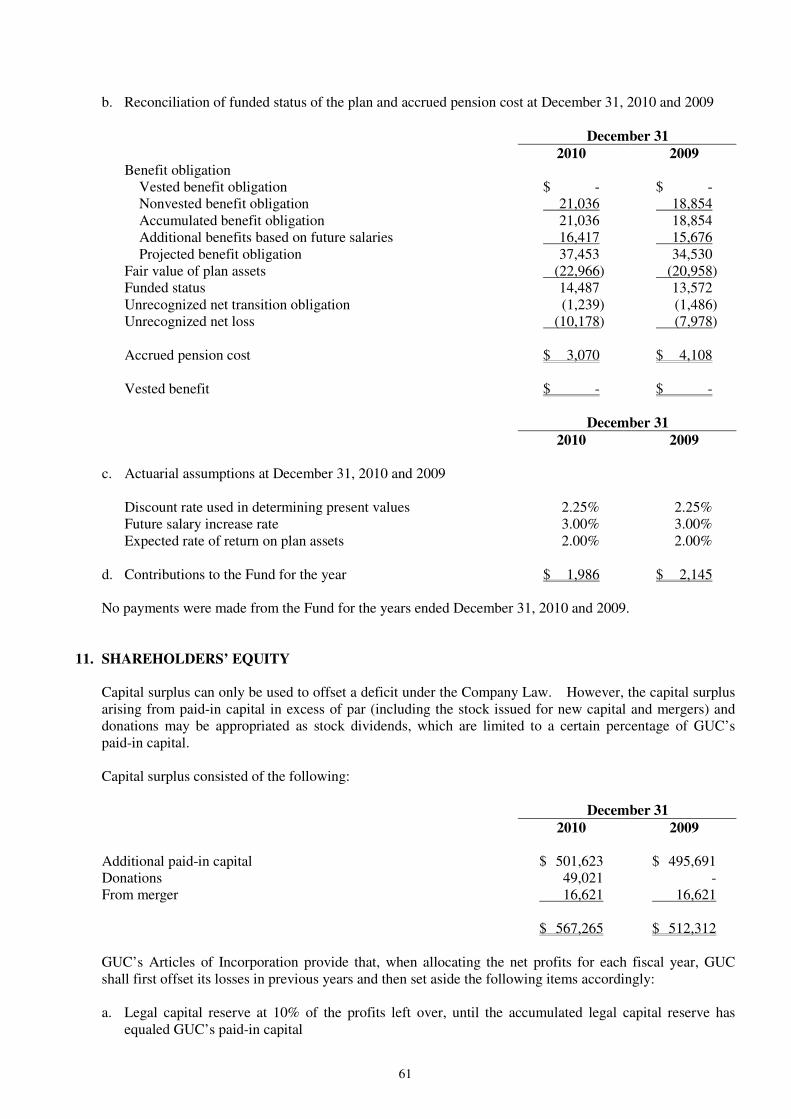
61
b. Reconciliation of funded status of the plan and accrued pension cost at December 31, 2010 and 2009
December 31
2010 2009
Benefit obligation Vested benefit obligation $ - $ - Nonvested benefit obligation 21,036 18,854 Accumulated benefit obligation 21,036 18,854 Additional benefits based on future salaries 16,417 15,676 Projected benefit obligation 37,453 34,530
Fair value of plan assets (22,966) (20,958) Funded status 14,487 13,572 Unrecognized net transition obligation (1,239) (1,486) Unrecognized net loss (10,178) (7,978) Accrued pension cost $ 3,070 $ 4,108 Vested benefit $ - $ -
December 31
2010 2009
c. Actuarial assumptions at December 31, 2010 and 2009
Discount rate used in determining present values 2.25% 2.25% Future salary increase rate 3.00% 3.00% Expected rate of return on plan assets 2.00% 2.00%
d. Contributions to the Fund for the year $ 1,986 $ 2,145
No payments were made from the Fund for the years ended December 31, 2010 and 2009.
11. SHAREHOLDERS’ EQUITY Capital surplus can only be used to offset a deficit under the Company Law. However, the capital surplus arising from paid-in capital in excess of par (including the stock issued for new capital and mergers) and donations may be appropriated as stock dividends, which are limited to a certain percentage of GUC’s paid-in capital. Capital surplus consisted of the following:
December 31
2010 2009 Additional paid-in capital $ 501,623 $ 495,691 Donations 49,021 - From merger 16,621 16,621 $ 567,265 $ 512,312
GUC’s Articles of Incorporation provide that, when allocating the net profits for each fiscal year, GUC shall first offset its losses in previous years and then set aside the following items accordingly: a. Legal capital reserve at 10% of the profits left over, until the accumulated legal capital reserve has
equaled GUC’s paid-in capital

62
b. Special capital reserve in accordance with the resolution of the shareholders’ meeting c. Bonus to directors of not more than 2% of the remainder after setting aside a and b above. Directors
who also serve as executive officers of GUC are not entitled to receive the bonus to directors d. Bonus to employees of not less than 2% of the remainder after setting aside a and b above. GUC may
issue stock bonuses to employees of an affiliated company meeting the conditions set by the Board of Directors or by the person duly authorized by the Board of Directors
e. Any balance left over shall be allocated according to the resolution of the shareholders’ meeting GUC at present is in a business growth stage. The proportion of dividends that will be paid in cash will depend on future expansion plans and cash needs. For profit distribution, the proportion of cash dividends shall not be lower than 10% of the total amount of dividends. The profit sharing to employees, which represents 8.75% and 10% of net income, and the bonus to directors, which represents 1.20% and 1.11% of net income (after deducting the legal capital reserve and special capital reserve) were recognized for the years ended December 31, 2010 and 2009, respectively. If the actual amounts subsequently resolved by the shareholders differ from the proposed amounts, the differences are recorded in the year of shareholders’ resolution as a change in accounting estimate. If bonus shares are resolved to be distributed to employees, the number of shares is determined by dividing the amount of profit sharing by the closing price (after considering the effect of cash and stock dividends) of the shares of the day preceding the shareholders’ meeting. A special capital reserve equivalent to the net debit balance of other components of shareholders’ equity (for example, cumulative translation adjustments and unrealized loss on financial instruments) shall be appropriated from unappropriated earnings pursuant to existing regulations promulgated by the Securities and Futures Bureau (SFB). Any special capital reserve appropriated may be reversed to the extent that the net debit balance reverses. The appropriation for legal capital reserve shall be made until the reserve equals GUC’s paid-in capital. The reserve may be used to offset a deficit, or be distributed as dividends and bonuses for the portion in excess of 50% of the paid-in capital if GUC has no unappropriated earnings and the reserve balance has exceeded 50% of GUC’s paid-in capital. The Company Law also prescribes that, when the reserve has reached 50% of GUC’s paid-in capital, up to 50% of the reserve may be transferred to capital. Any appropriations of earnings are recorded in the year of shareholder approval and given effect to in the financial statements of that year. Under the Integrated Income Tax system, R.O.C. resident shareholders are allowed a tax credit for their proportionate share of the income tax paid by GUC. The appropriations of earnings for 2009 and 2008 were approved in the shareholders’ meetings held on June 4, 2010 and June 3, 2009, respectively. The appropriations and dividends per share were as follows:
Appropriation of Earnings
Dividends Per Share
(NT$)
For Fiscal For Fiscal For Fiscal For Fiscal Year 2009 Year 2008 Year 2009 Year 2008
Legal capital reserve $ 41,278 $ 74,705 Special capital reserve - (119) Cash dividends to shareholders 263,950 430,210 $2.00 $3.43 Stock dividends to shareholders - 49,879 - 0.40 $ 305,228 $ 554,675

63
The profit sharing to employees that had been paid in cash as well as bonus to directors in the amounts of NT$41,254 thousand and NT$4,130 thousand, respectively, for 2009, and the profit sharing to employees that had been paid in cash and in stock as well as bonus to directors and supervisors in the amounts of NT$35,610 thousand, NT$142,441 thousand and NT$10,187 thousand, respectively, for 2008 had been approved in the shareholders’ meeting held on June 4, 2010 and June 3, 2009, respectively. The employees’ stock bonus of 813 thousand shares was determined by using the closing price of GUC’s common shares (after considering the effect of dividends) of the day immediately preceding the shareholders’ meeting, which was NT$175.1. The resolved amounts of the bonus to employees and to directors were consistent with the resolutions in the meeting of the Board of Directors held on February 11, 2010 and February 19, 2009, respectively, and same amounts had been charged against earnings of 2009 and 2008, respectively. GUC shareholders’ meeting held on June 3, 2009 also resolved to distribute stock dividends to shareholders and bonus to employees to be paid in stock in the amount of NT$49,879 thousand and NT$142,441 thousand, respectively. The aforementioned capital increase had taken effect on July 19, 2009. As of January 17, 2011, the Board of Directors has not resolved the appropriation of earnings of 2010. The information about appropriations of profit sharing to employees and bonus to directors is available at the Market Observation Post System website. During the shareholders’ meeting held on June 11, 2008, GUC replaced the supervisors with a newly formed Audit Committee. The required duties of the former supervisors are now being fulfilled by the Audit Committee.
12. STOCK-BASED COMPENSATION PLANS
GUC’s Employee Stock Option Plans, consisting of the GUC 2003 Plan and GUC 2002 Plan, were all approved by its Board of Directors on January 23, 2003 and July 1, 2002, respectively. The maximum number of options authorized to be granted under the GUC 2003 Plan and GUC 2002 Plan was 7,535 and 5,000, respectively, with each option eligible to subscribe for one thousand common shares when exercisable. The options may be granted to qualified employees of GUC. The options of the plans are valid for six years and exercisable at certain percentages subsequent to the second anniversary of the grant date. Moreover, the GUC 2007 Plan, GUC 2006 Plan and GUC 2004 Plan were approved by the SFB on November 28, 2007, July 3, 2006 and August 16, 2004 to grant a maximum of 1,999 options, 3,665 options and 2,500 options, respectively, with each option eligible to subscribe for one thousand common shares when exercisable. The options may be granted to qualified employees of GUC or any of its subsidiaries. The options of the GUC 2006 Plan are valid until August 15, 2011 and the options of the GUC 2007 Plan and GUC 2004 Plan are valid for six years. Options of the three Plans are exercisable at certain percentages subsequent to the second anniversary of the grant date.

64
Information about GUC’s outstanding stock options for the years ended December 31, 2010 and 2009 was as follows: Weighted-
average
Number of Exercise Price
Options (NT$)
Year ended December 31, 2010 Balance, beginning of year 3,810 $ 83.36 Options exercised (1,592) 13.70 Options canceled (431) 143.33 Balance, end of year 1,787 130.94 Year ended December 31, 2009 Balance, beginning of year 5,557 63.75 Options granted 87 13.61 Options exercised (1,475) 10.52 Options canceled (359) 62.22 Balance, end of year 3,810 83.36
The number of outstanding options and exercise prices had been adjusted to reflect the distribution of earnings by GUC in accordance with the plans. The options granted shown above included options that resulted from the aforementioned adjustment and options newly granted in accordance with the plans. As of December 31, 2010, information about GUC’s outstanding and exercisable options was as follows:
Options Outstanding
Weighted- Options Exercisable
Range of
Exercise
Price (NT$)
Number of
Options
average
Remaining
Contractual
Life (Years)
Weighted-
average
Exercise
Price (NT$)
Number of
Options
Weighted-
average
Exercise
Price (NT$)
$ 15.30 493 0.67 $ 15.30 493 $ 15.30 175.00 1,294 3.00 175.00 646 175.00 1,787 130.94 1,139 105.88
No compensation cost was recognized under the intrinsic value method for the years ended December 31, 2010 and 2009. Had the Company used the fair value based method to evaluate the options using the Black-Scholes model, the assumptions and pro forma results of the Company would have been as follows: Method Black-Scholes Model Assumptions:
Expected dividend yield 0%-0.6% Expected volatility 22.65%-45.47% Risk free interest rate 2.12%-2.56% Expected life 3-6 years Fair value per share (NT$) $3.22-$61.18

65
Years Ended December 31
2010 2009 Net income:
As reported $ 604,501 $ 412,771 Pro forma 593,615 373,453
Consolidated earnings per share (EPS) - after income tax (NT$): Basic EPS as reported $4.56 $3.15 Pro forma basic EPS 4.48 2.85 Diluted EPS as reported 4.49 3.08 Pro forma diluted EPS 4.41 2.78
13. INCOME TAX
a. A reconciliation of income tax expense based on “income before income tax” at statutory rate and income tax currently payable was as follows:
Years Ended December 31
2010 2009
Income tax expense based on “income before income tax” at
statutory rate
$ 113,506
$ 115,513 Tax effect of the following:
Tax-exempt income (26,249) (31,544) Temporary differences (8,945) 16,294 Permanent differences (45) (270)
Additional tax at 10% on unappropriated earnings 10,754 19,237 Investment tax credits used (42,852) (58,576) Income tax currently payable $ 46,169 $ 60,654
b. Income tax expense consisted of the following:
Years Ended December 31
2010 2009 Income tax currently payable $ 46,169 $ 60,654 Income tax adjustments on prior years and other income tax
adjustments
(2,143)
(2,346) Net change in deferred income tax assets
Investment tax credits 12,301 (106,335) Temporary differences 11,617 (7,786) Adjustments in valuation allowance (8,142) 98,898
Income tax expense $ 59,802 $ 43,085

66
c. Net deferred income tax assets consisted of the following:
December 31
2010 2009
Current deferred income tax assets, net Investment tax credits $ 78,131 $ 82,367 Temporary differences 17,084 28,624
$ 95,215 $ 110,991 Non-current deferred income tax assets, net
Investment tax credits $ 347,176 $ 355,241 Temporary differences (3,283) (3,206) Valuation allowance (343,893) (352,035)
$ - $ -
Effective in May 2009 and June 2010, the Article 5 of the Income Tax Law of the Republic of China was amended, in which the income tax rate of profit-seeking enterprises would be reduced from 25% to 20% and from 20% to 17%, respectively. The last amended income tax rate of 17% is retroactively applied on January 1, 2010. GUC had recalculated its deferred tax assets in accordance with the amended Article and adjusted the resulting difference as an income tax expense in 2010 and 2009, respectively. Under Article 10 of the Statute for Industrial Innovation (SII) passed by the Legislative Yuan in April 2010, a profit-seeking enterprise may deduct up to 15% of its research and development expenditures from its income tax payable for the fiscal year in which these expenditures are incurred, but this deduction should not exceed 30% of the income tax payable for that fiscal year. This incentive took effect from January 1, 2010 and is effective till December 31, 2019.
d. Integrated income tax information:
The balance of the imputation credit account of GUC as of December 31, 2010 and 2009 was NT$45,144 thousand and NT$34,205 thousand, respectively. The creditable ratios for distribution of earnings of 2010 and 2009 were 7.72% (estimated) and 10.78%, respectively. The imputation credit allocated to shareholders is based on its balance as of the date of dividend distribution. The estimated creditable ratio of GUC may change when the actual distribution of imputation credit is made.
e. All of GUC’s earnings generated prior to December 31, 1997 have been appropriated. f. As of December 31, 2010, the GUC’s investment tax credits consisted of the following:
Total Remaining
Creditable Creditable Expiry
Regulation Item Amount Amount Year Statute for Upgrading Purchase of machinery and $ 836 $ 836 2011 Industries equipment 518 518 2012 379 379 2013 $ 1,733 $ 1,733
(Continued)
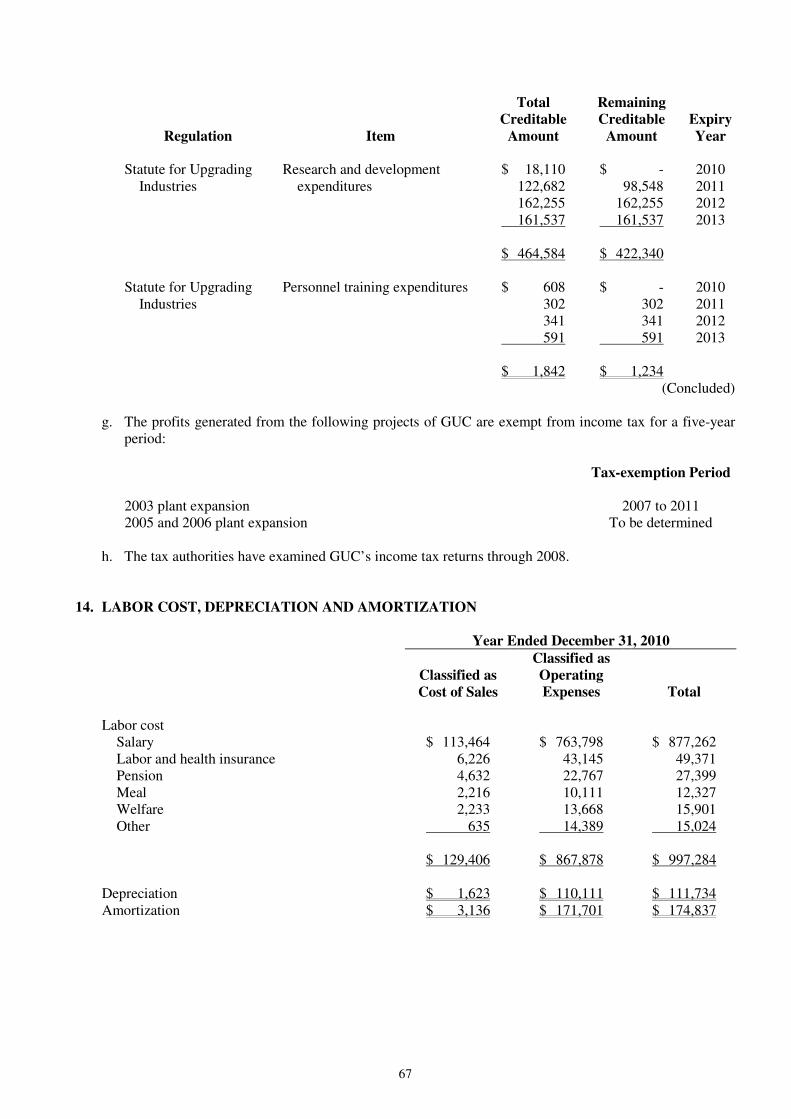
67
Total Remaining
Creditable Creditable Expiry
Regulation Item Amount Amount Year Statute for Upgrading Research and development $ 18,110 $ - 2010 Industries expenditures 122,682 98,548 2011 162,255 162,255 2012 161,537 161,537 2013 $ 464,584 $ 422,340 Statute for Upgrading Personnel training expenditures $ 608 $ - 2010 Industries 302 302 2011 341 341 2012 591 591 2013 $ 1,842 $ 1,234
(Concluded) g. The profits generated from the following projects of GUC are exempt from income tax for a five-year
period:
Tax-exemption Period 2003 plant expansion 2007 to 2011 2005 and 2006 plant expansion To be determined
h. The tax authorities have examined GUC’s income tax returns through 2008.
14. LABOR COST, DEPRECIATION AND AMORTIZATION
Year Ended December 31, 2010
Classified as
Cost of Sales
Classified as
Operating
Expenses
Total
Labor cost
Salary $ 113,464 $ 763,798 $ 877,262 Labor and health insurance 6,226 43,145 49,371 Pension 4,632 22,767 27,399 Meal 2,216 10,111 12,327 Welfare 2,233 13,668 15,901 Other 635 14,389 15,024
$ 129,406 $ 867,878 $ 997,284 Depreciation $ 1,623 $ 110,111 $ 111,734 Amortization $ 3,136 $ 171,701 $ 174,837
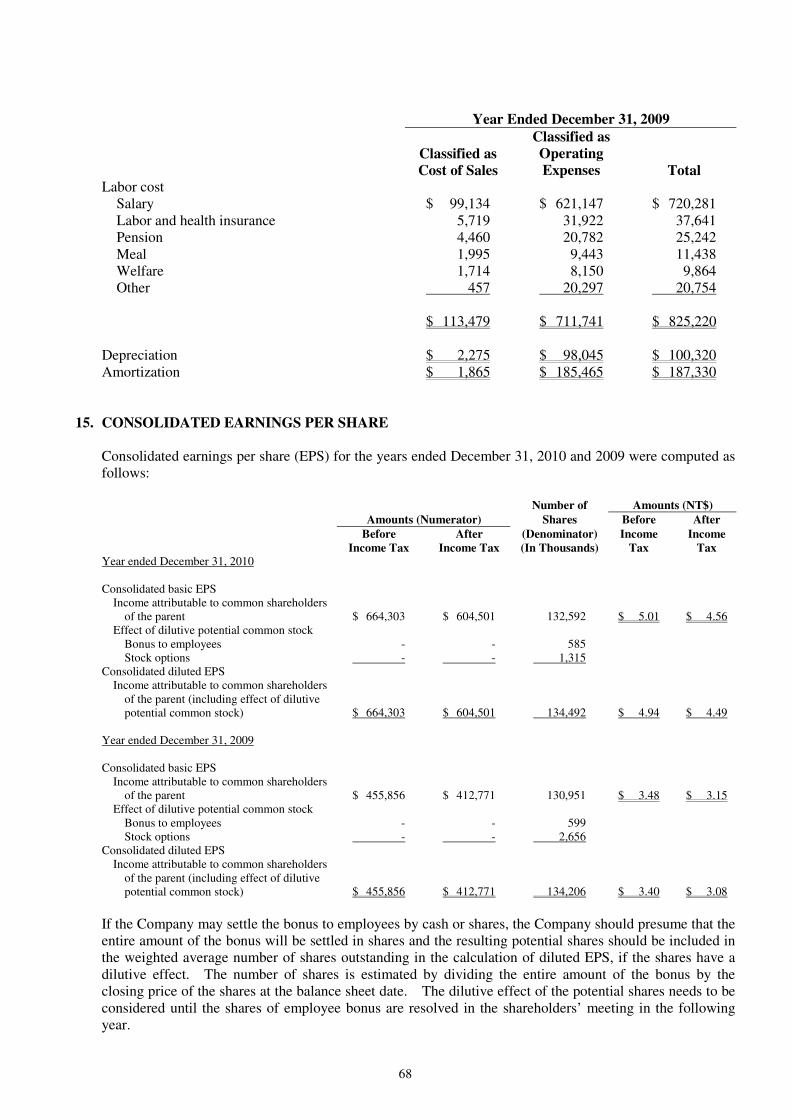
68
Year Ended December 31, 2009
Classified as
Cost of Sales
Classified as
Operating
Expenses
Total Labor cost
Salary $ 99,134 $ 621,147 $ 720,281 Labor and health insurance 5,719 31,922 37,641 Pension 4,460 20,782 25,242 Meal 1,995 9,443 11,438 Welfare 1,714 8,150 9,864 Other 457 20,297 20,754
$ 113,479 $ 711,741 $ 825,220 Depreciation $ 2,275 $ 98,045 $ 100,320 Amortization $ 1,865 $ 185,465 $ 187,330
15. CONSOLIDATED EARNINGS PER SHARE
Consolidated earnings per share (EPS) for the years ended December 31, 2010 and 2009 were computed as follows: Number of Amounts (NT$)
Amounts (Numerator) Shares Before After
Before After (Denominator) Income Income
Income Tax Income Tax (In Thousands) Tax Tax Year ended December 31, 2010 Consolidated basic EPS
Income attributable to common shareholders of the parent
$ 664,303
$ 604,501
132,592
$ 5.01
$ 4.56
Effect of dilutive potential common stock Bonus to employees - - 585 Stock options - - 1,315
Consolidated diluted EPS Income attributable to common shareholders
of the parent (including effect of dilutive potential common stock)
$ 664,303
$ 604,501
134,492
$ 4.94
$ 4.49 Year ended December 31, 2009 Consolidated basic EPS
Income attributable to common shareholders of the parent
$ 455,856
$ 412,771
130,951
$ 3.48
$ 3.15
Effect of dilutive potential common stock Bonus to employees - - 599 Stock options - - 2,656
Consolidated diluted EPS Income attributable to common shareholders
of the parent (including effect of dilutive potential common stock)
$ 455,856
$ 412,771
134,206
$ 3.40
$ 3.08
If the Company may settle the bonus to employees by cash or shares, the Company should presume that the entire amount of the bonus will be settled in shares and the resulting potential shares should be included in the weighted average number of shares outstanding in the calculation of diluted EPS, if the shares have a dilutive effect. The number of shares is estimated by dividing the entire amount of the bonus by the closing price of the shares at the balance sheet date. The dilutive effect of the potential shares needs to be considered until the shares of employee bonus are resolved in the shareholders’ meeting in the following year.
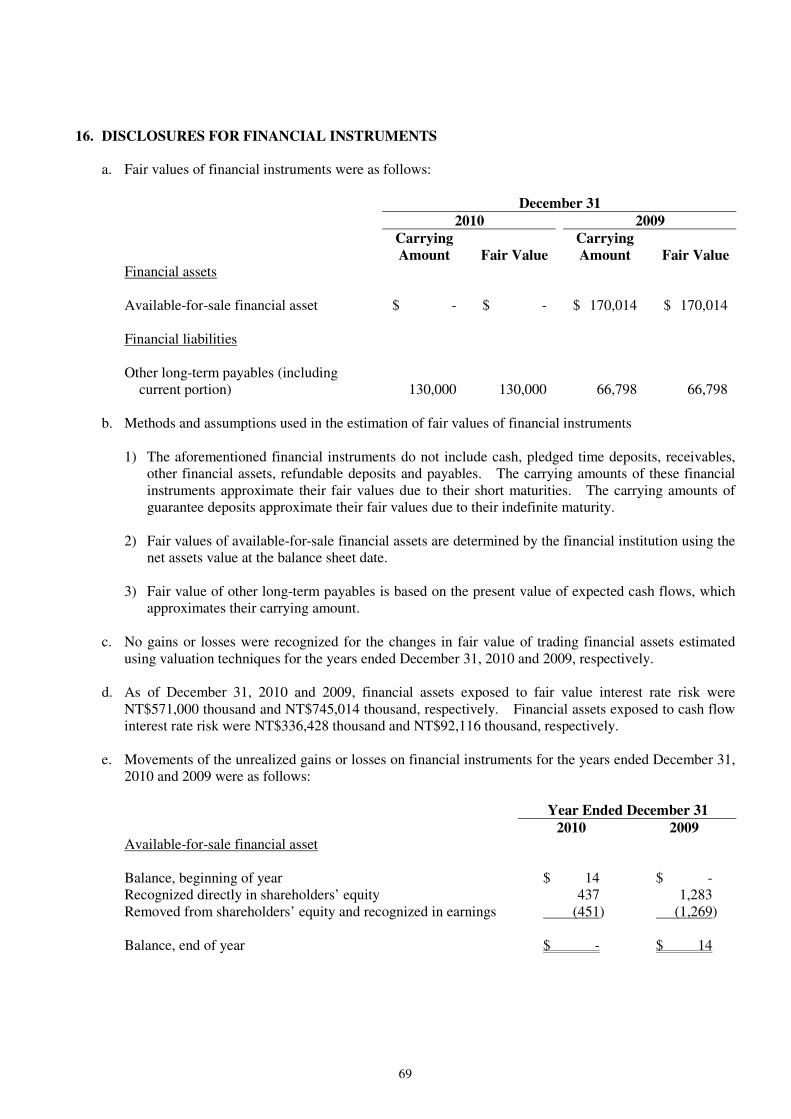
69
16. DISCLOSURES FOR FINANCIAL INSTRUMENTS
a. Fair values of financial instruments were as follows:
December 31
2010 2009
Carrying Carrying
Amount Fair Value Amount Fair Value Financial assets Available-for-sale financial asset $ - $ - $ 170,014 $ 170,014 Financial liabilities Other long-term payables (including
current portion) 130,000 130,000 66,798 66,798 b. Methods and assumptions used in the estimation of fair values of financial instruments
1) The aforementioned financial instruments do not include cash, pledged time deposits, receivables, other financial assets, refundable deposits and payables. The carrying amounts of these financial instruments approximate their fair values due to their short maturities. The carrying amounts of guarantee deposits approximate their fair values due to their indefinite maturity.
2) Fair values of available-for-sale financial assets are determined by the financial institution using the
net assets value at the balance sheet date.
3) Fair value of other long-term payables is based on the present value of expected cash flows, which approximates their carrying amount.
c. No gains or losses were recognized for the changes in fair value of trading financial assets estimated
using valuation techniques for the years ended December 31, 2010 and 2009, respectively. d. As of December 31, 2010 and 2009, financial assets exposed to fair value interest rate risk were
NT$571,000 thousand and NT$745,014 thousand, respectively. Financial assets exposed to cash flow interest rate risk were NT$336,428 thousand and NT$92,116 thousand, respectively.
e. Movements of the unrealized gains or losses on financial instruments for the years ended December 31,
2010 and 2009 were as follows:
Year Ended December 31
2010 2009 Available-for-sale financial asset Balance, beginning of year $ 14 $ - Recognized directly in shareholders’ equity 437 1,283 Removed from shareholders’ equity and recognized in earnings (451) (1,269) Balance, end of year $ - $ 14

70
f. Information about financial risks
1) Market risk. Available-for-sale financial assets held by the Company are open-end bond funds, which of the fair values are affected by changes in market interest rates. Management does not expect the Company’s exposure to market risk to be material.
2) Credit risk. Credit risk represents the potential loss that would be incurred by the Company if the
counter-parties breached contracts. Financial instruments with positive fair values at the balance sheet date are evaluated for credit risk. The counter-parties to the foregoing financial instruments are reputable financial institutions and business organizations. Management does not expect the Company’s exposure to defaults by those parties to be significant.
3) Liquidity risk. The Company’s operating capital is deemed sufficient to meet the cash demand,
therefore, liquidity risk is not considered to be significant. 4) Cash flow interest rate risk. The Company’s financial assets which has cash flow interest rate risk
is deposits in banks. When the market interest rate drop by one percentage point, the Company’s cash inflow will decrease by NT$336 thousand every year.
17. RELATED PARTY TRANSACTIONS
The Company engages in business transactions with the following related parties:
a. TSMC, which had a controlling interest over GUC b. TSMC-North America (TSMC-NA), a subsidiary of TSMC c. TSMC Korea, a subsidiary of TSMC d. TSMC Europe, a subsidiary of TSMC e. Vanguard International Semiconductor Corporation (VIS), an equity-method investee of TSMC f. VisEra Holding Company (VisEra), an equity-method indirect investee of TSMC
g. Etron Technology, Inc. (Etron), which is the parent company of one of GUC’s Board Directors h. Others - related parties over which the Company has substantial influence but without any material
transactions. Transactions with the aforementioned parties are summarized as follows:
2010 2009
Amount % Amount % For the year Sales
TSMC $ 8,734 - $ 26,034 - VIS 151 - 424 -
$ 8,885 - $ 26,458 -
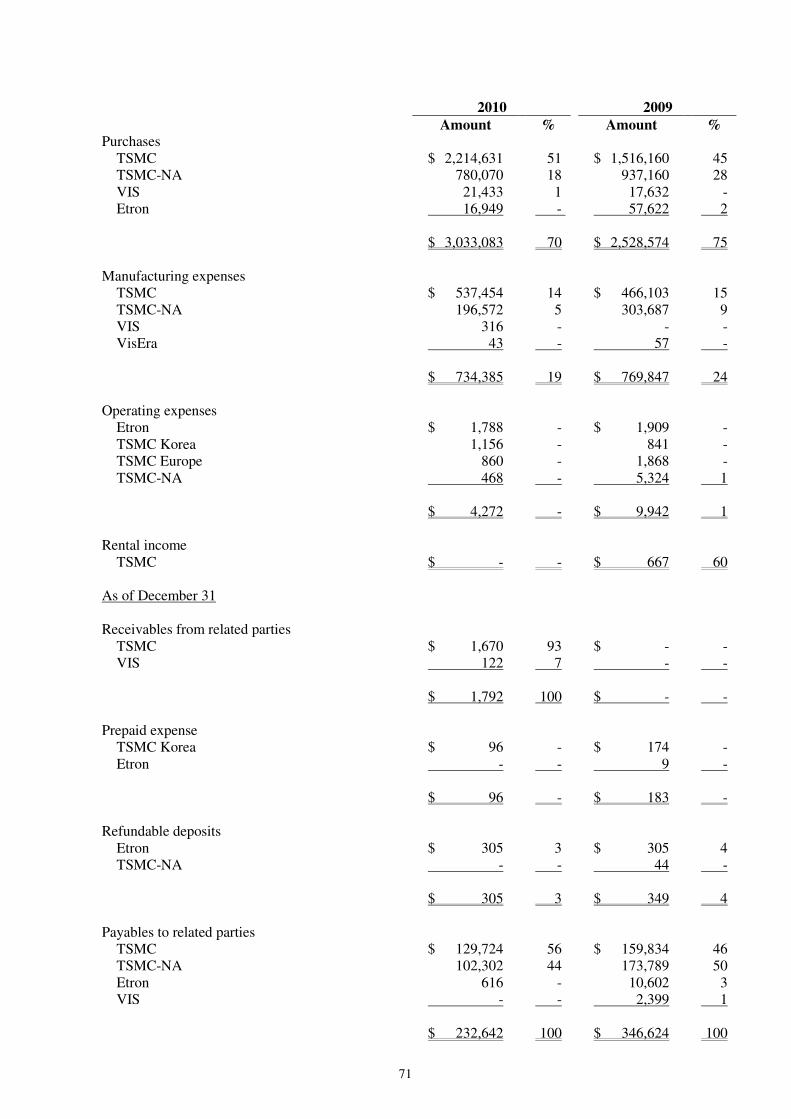
71
2010 2009
Amount % Amount % Purchases
TSMC $ 2,214,631 51 $ 1,516,160 45 TSMC-NA 780,070 18 937,160 28 VIS 21,433 1 17,632 - Etron 16,949 - 57,622 2
$ 3,033,083 70 $ 2,528,574 75 Manufacturing expenses
TSMC $ 537,454 14 $ 466,103 15 TSMC-NA 196,572 5 303,687 9 VIS 316 - - - VisEra 43 - 57 -
$ 734,385 19 $ 769,847 24 Operating expenses
Etron $ 1,788 - $ 1,909 - TSMC Korea 1,156 - 841 - TSMC Europe 860 - 1,868 - TSMC-NA 468 - 5,324 1 $ 4,272 - $ 9,942 1
Rental income TSMC $ - - $ 667 60
As of December 31 Receivables from related parties
TSMC $ 1,670 93 $ - - VIS 122 7 - -
$ 1,792 100 $ - - Prepaid expense
TSMC Korea $ 96 - $ 174 - Etron - - 9 -
$ 96 - $ 183 - Refundable deposits
Etron $ 305 3 $ 305 4 TSMC-NA - - 44 -
$ 305 3 $ 349 4 Payables to related parties
TSMC $ 129,724 56 $ 159,834 46 TSMC-NA 102,302 44 173,789 50 Etron 616 - 10,602 3 VIS - - 2,399 1
$ 232,642 100 $ 346,624 100
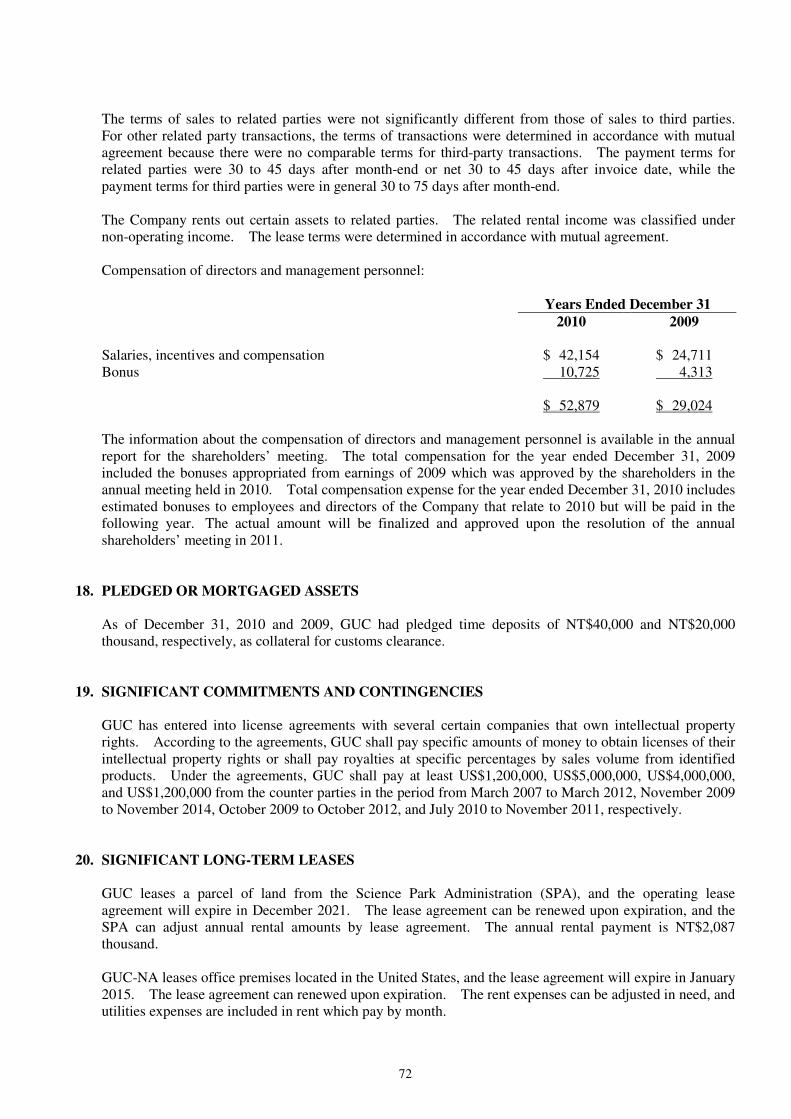
72
The terms of sales to related parties were not significantly different from those of sales to third parties. For other related party transactions, the terms of transactions were determined in accordance with mutual agreement because there were no comparable terms for third-party transactions. The payment terms for related parties were 30 to 45 days after month-end or net 30 to 45 days after invoice date, while the payment terms for third parties were in general 30 to 75 days after month-end. The Company rents out certain assets to related parties. The related rental income was classified under non-operating income. The lease terms were determined in accordance with mutual agreement. Compensation of directors and management personnel:
Years Ended December 31
2010 2009
Salaries, incentives and compensation $ 42,154 $ 24,711 Bonus 10,725 4,313 $ 52,879 $ 29,024
The information about the compensation of directors and management personnel is available in the annual report for the shareholders’ meeting. The total compensation for the year ended December 31, 2009 included the bonuses appropriated from earnings of 2009 which was approved by the shareholders in the annual meeting held in 2010. Total compensation expense for the year ended December 31, 2010 includes estimated bonuses to employees and directors of the Company that relate to 2010 but will be paid in the following year. The actual amount will be finalized and approved upon the resolution of the annual shareholders’ meeting in 2011.
18. PLEDGED OR MORTGAGED ASSETS
As of December 31, 2010 and 2009, GUC had pledged time deposits of NT$40,000 and NT$20,000 thousand, respectively, as collateral for customs clearance.
19. SIGNIFICANT COMMITMENTS AND CONTINGENCIES
GUC has entered into license agreements with several certain companies that own intellectual property rights. According to the agreements, GUC shall pay specific amounts of money to obtain licenses of their intellectual property rights or shall pay royalties at specific percentages by sales volume from identified products. Under the agreements, GUC shall pay at least US$1,200,000, US$5,000,000, US$4,000,000, and US$1,200,000 from the counter parties in the period from March 2007 to March 2012, November 2009 to November 2014, October 2009 to October 2012, and July 2010 to November 2011, respectively.
20. SIGNIFICANT LONG-TERM LEASES
GUC leases a parcel of land from the Science Park Administration (SPA), and the operating lease agreement will expire in December 2021. The lease agreement can be renewed upon expiration, and the SPA can adjust annual rental amounts by lease agreement. The annual rental payment is NT$2,087 thousand. GUC-NA leases office premises located in the United States, and the lease agreement will expire in January 2015. The lease agreement can renewed upon expiration. The rent expenses can be adjusted in need, and utilities expenses are included in rent which pay by month.

73
As of December 31, 2010, future rental payments were as follows: Year Amount 2011 $ 10,719 2012 11,080 2013 11,441 2014 11,802 2015 2,899 2016 and thereafter 12,521 $ 60,462
21. OTHERS
The significant foreign financial assets and liabilities denominated in New Taiwan (N.T.) currencies were as follows:
(Unit: Foreign Currency/N.T. Dollars in Thousands)
December 31, 2010 December 31, 2009
Foreign
Currencies
Exchange
Rate (Note)
New Taiwan
Dollars
Foreign
Currencies
Exchange
Rate (Note)
New Taiwan
Dollars
Financial asset
Monetary assets
US $ 56,458 29.13 $ 1,644,618 $ 35,858 31.99 $ 1,147,085
JPY 32,548 0.3582 11,659 184,160 0.3472 63,940
RMB 1,303 4.3985 5,730 - - - Financial liabilities
Monetary liabilities
US 23,180 29.13 675,219 21,168 31.99 677,160
JPY 4,062 0.3582 1,455 1,993 0.3472 692
RMB 26 4.3985 115 - - -
Note: Exchange rate represents the units each foreign currency could convert into New Taiwan dollars
22. ADDITIONAL DISCLOSURES
Following are the additional disclosures required by the SFB for GUC and its investees in which all significant intercompany balances and transactions are eliminated upon consolidation: a. Financings provided: None b. Endorsements/guarantees provided: None c. Marketable securities held: Please see Table 1 attached d. Marketable securities acquired or disposed of at costs or prices of at least NT$100 million or 20% of the
paid-in capital: Please see Table 2 attached e. Acquisition of individual real estate at costs of at least NT$100 million or 20% of the paid-in capital:
None f. Disposal of individual real estate at prices of at least NT$100 million or 20% of the paid-in capital:
None
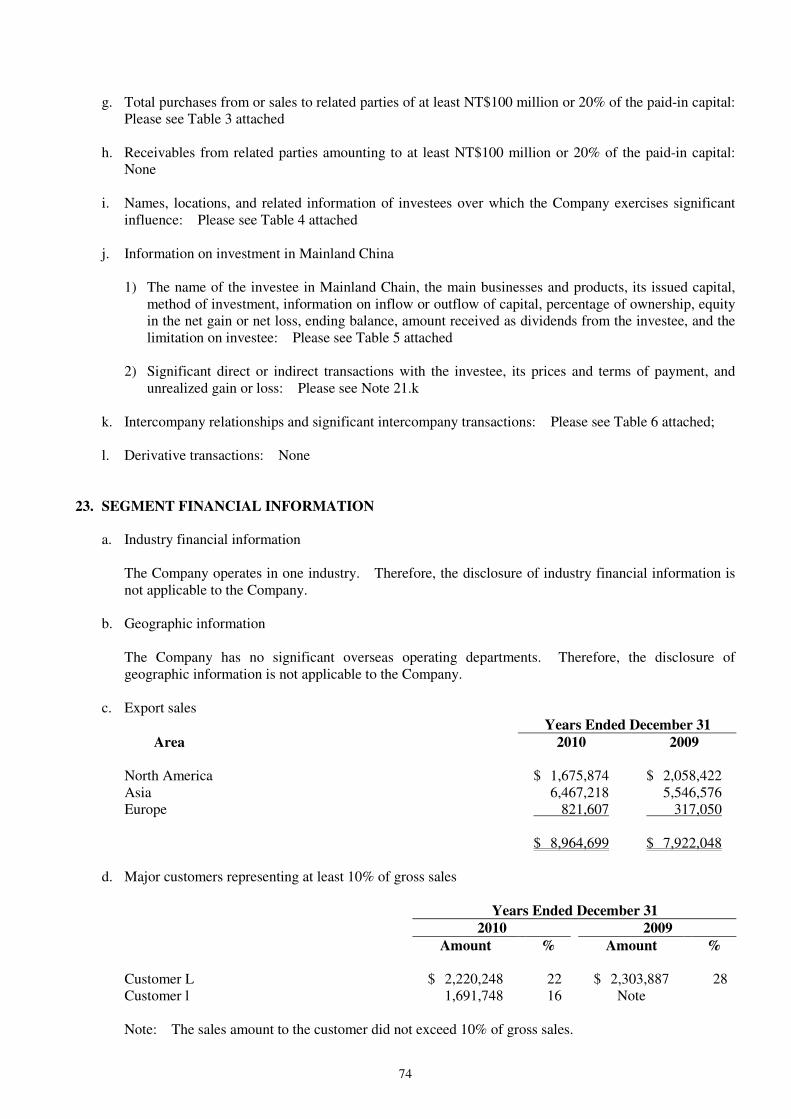
74
g. Total purchases from or sales to related parties of at least NT$100 million or 20% of the paid-in capital: Please see Table 3 attached
h. Receivables from related parties amounting to at least NT$100 million or 20% of the paid-in capital:
None i. Names, locations, and related information of investees over which the Company exercises significant
influence: Please see Table 4 attached j. Information on investment in Mainland China
1) The name of the investee in Mainland Chain, the main businesses and products, its issued capital, method of investment, information on inflow or outflow of capital, percentage of ownership, equity in the net gain or net loss, ending balance, amount received as dividends from the investee, and the limitation on investee: Please see Table 5 attached
2) Significant direct or indirect transactions with the investee, its prices and terms of payment, and
unrealized gain or loss: Please see Note 21.k k. Intercompany relationships and significant intercompany transactions: Please see Table 6 attached; l. Derivative transactions: None
23. SEGMENT FINANCIAL INFORMATION
a. Industry financial information
The Company operates in one industry. Therefore, the disclosure of industry financial information is not applicable to the Company.
b. Geographic information
The Company has no significant overseas operating departments. Therefore, the disclosure of geographic information is not applicable to the Company.
c. Export sales Years Ended December 31
Area 2010 2009
North America $ 1,675,874 $ 2,058,422 Asia 6,467,218 5,546,576 Europe 821,607 317,050 $ 8,964,699 $ 7,922,048
d. Major customers representing at least 10% of gross sales
Years Ended December 31
2010 2009
Amount % Amount % Customer L $ 2,220,248 22 $ 2,303,887 28 Customer l 1,691,748 16 Note
Note: The sales amount to the customer did not exceed 10% of gross sales.

75
TABLE 1
GLOBAL UNICHIP CORP. AND SUBSIDIARIES
MARKETABLE SECURITIES HELD
DECEMBER 31, 2010
(In Thousands of New Taiwan Dollars, Unless Specified Otherwise)
December 31, 2010 Holding Company
Name Marketable Securities Type and Name
Relationship with the
Company Financial Statement Account
Shares/Units Carrying
Amount
Percentage of
Ownership
Market Value or
Net Asset Value
Note
GUC Stock GUC-NA (common shares) Subsidiary Investments accounted for using equity method 800,000 $ 58,045 100 $ 58,045 Note 1 GUC-Japan (common shares) Subsidiary Investments accounted for using equity method 600 14,706 100 14,706 Note 2 GUC-BVI (common shares) Subsidiary Investments accounted for using equity method 550,000 8,761 100 8,761 Note 2 GUC-Europe (capital) Subsidiary Investments accounted for using equity method - 3,747 100 3,747 Note 2 GUC-BVI GUC-Shanghai Subsidiary Investments accounted for using equity method 7,468 100 7,468 Note 2
Note 1: Recognized on the basis of the audited financial statements for the same period. Note 2: Recognized on the basis of the unaudited financial statements for the same period. Note 3: As of December 31, 2010, the above marketable securities had not been pledged, mortgaged or restricted by contracts.

76
TABLE 2
GLOBAL UNICHIP CORP. AND SUBSIDIARIES
MARKETABLE SECURITIES ACQUIRED OR DISPOSED OF AT COSTS OR PRICES OF AT LEAST NT$100 MILLION OR 20% OF THE PAID-IN CAPITAL
FOR THE YEAR ENDED DECEMBER 31, 2010
(In Thousands of New Taiwan Dollars)
Beginning Balance Acquisition Disposal Ending Balance
Holding Company Marketable Securities Type and Name Financial Statement Account Nature of
Relationship Shares/Units Amount
(In Thousands) Shares/Units
Amount
(In Thousands) Shares/Units
Amount
(In Thousands)
Carrying
Amount
(In Thousands)
Gain (Loss) on
Disposal
(In Thousands)
Shares/Units
Amount
(In Thousands)
(Note)
GUC Jih Sun Bond Fund Available--for-sale financial
assets - 5,667,529 $ 80,008 7,072,736 $ 100,000 12,740,265 $ 180,192 $ 180,000 $ 192 - $ -
PCA Well Pool Fund Available--for-sale financial assets
- - - 7,691,834 100,000 7,691,834 100,075 100,000 75 - -
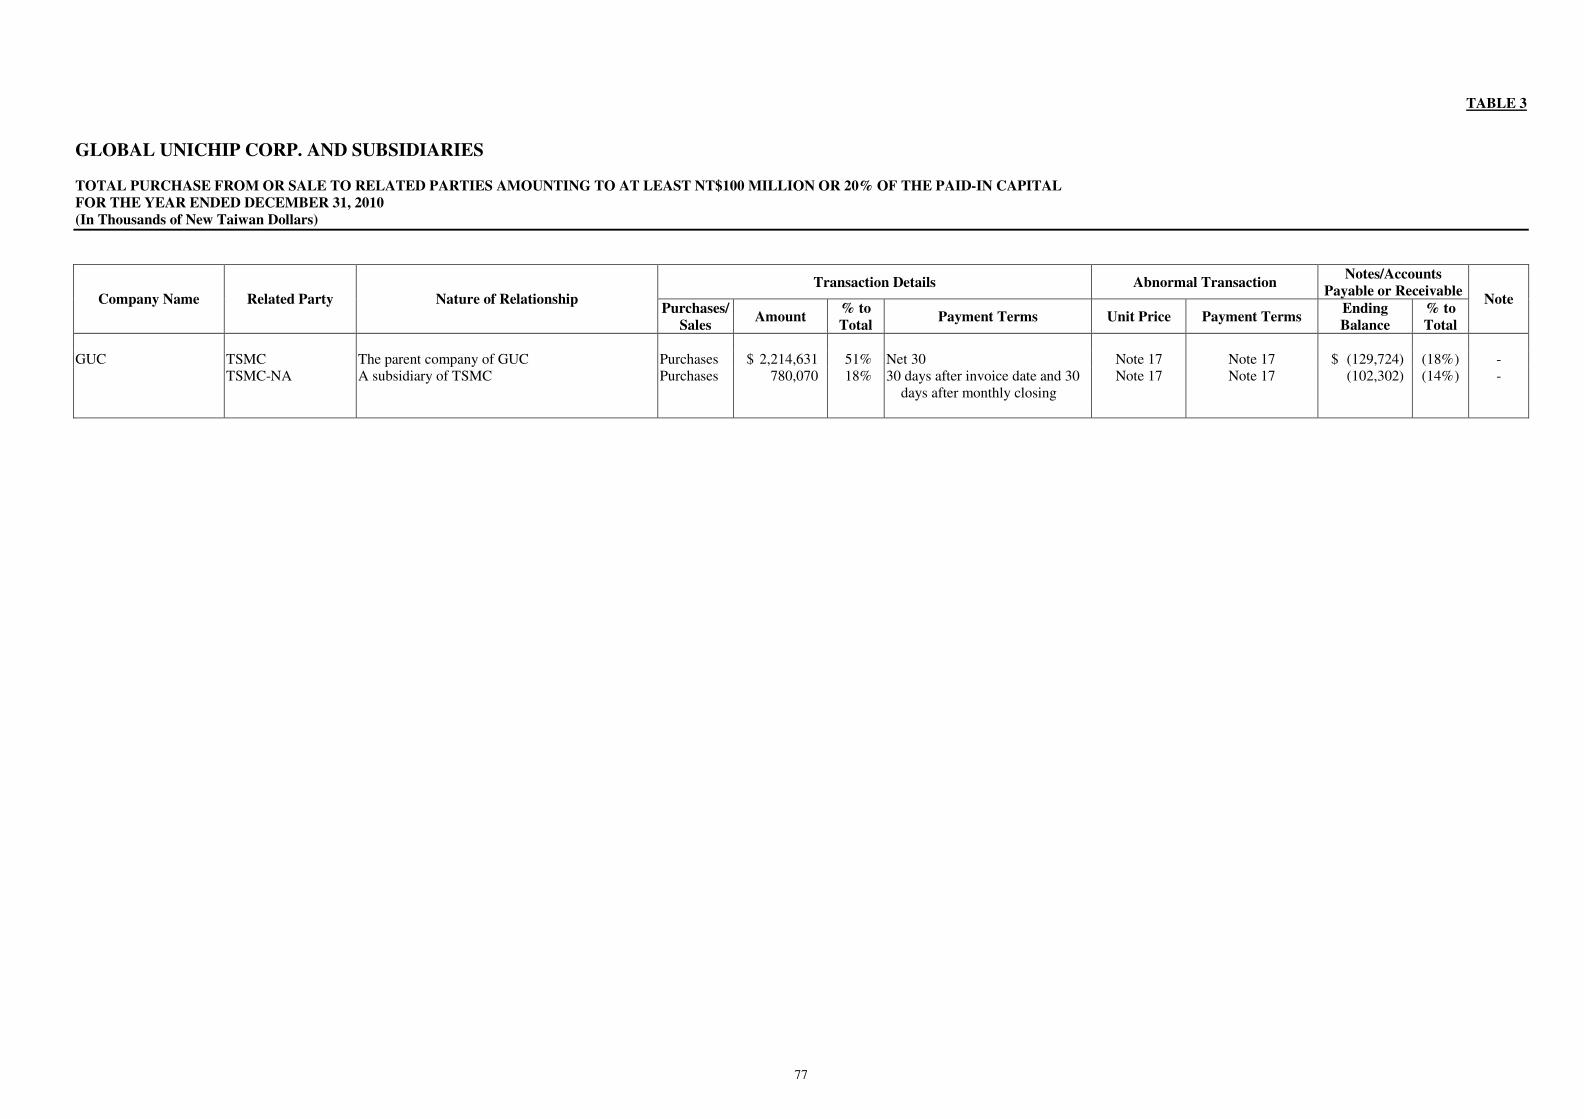
77
TABLE 3
GLOBAL UNICHIP CORP. AND SUBSIDIARIES
TOTAL PURCHASE FROM OR SALE TO RELATED PARTIES AMOUNTING TO AT LEAST NT$100 MILLION OR 20% OF THE PAID-IN CAPITAL
FOR THE YEAR ENDED DECEMBER 31, 2010
(In Thousands of New Taiwan Dollars)
Transaction Details Abnormal Transaction Notes/Accounts
Payable or Receivable Company Name Related Party Nature of Relationship
Purchases/
Sales Amount
% to
Total Payment Terms Unit Price Payment Terms
Ending
Balance
% to
Total
Note
GUC TSMC The parent company of GUC Purchases $ 2,214,631 51% Net 30 Note 17 Note 17 $ (129,724) (18% ) - TSMC-NA A subsidiary of TSMC Purchases 780,070 18% 30 days after invoice date and 30
days after monthly closing Note 17 Note 17 (102,302) (14% ) -

78
TABLE 4
GLOBAL UNICHIP CORP. AND SUBSIDIARIES
NAMES, LOCATIONS, AND RELATED INFORMATION OF INVESTEES OVER WHICH THE COMPANY EXERCISES SIGNIFICANT INFLUENCE
DECEMBER 31, 2010
(In Thousands of New Taiwan Dollars, Unless Specified Otherwise)
Original Investment Amount Balance as of December 31, 2010
Investor Company Investee
Company Location Main Businesses and Products December 31,
2010
December 31,
2009 Shares
Percentage of
Ownership
(%)
Carrying
Amount
Net Income
(Loss) of the
Investee
Investment
Income (Loss)
(Note) Note
GUC GUC-NA U.S.A. Products consulting, design and technical support
service US$ 1,249 thousand
US$ 800 thousand
800,000 100 $ 58,045 $ 10,599 $ 10,599 Subsidiary (Note 1)
GUC-Japan Japan Products consulting service YEN 30,000 thousand
YEN 30,000 thousand
600 100 14,706 1,404 1,404 Subsidiary (Note 2)
GUC-BVI British Virgin Islands Investing activities US$ 550 thousand
EUR 550 thousand
550,000 100 8,761 (8,021) (8,021) Subsidiary (Note 2)
GUC-Europe Netherlands Products consulting service EUR 100 thousand
EUR 100 thousand
- 100 3,747 (703) (703) Subsidiary (Note 2)
GUC-BVI GUC-Shanghai Shanghai, China Products consulting service EUR 500
thousand - - 100 7,468 (7,971) (7,971) Subsidiary
(Note 2)
Note 1: Equity in earnings was determined based on the audited financial statements for the same period. Note 2: Equity in earnings/losses was determined based on the unaudited financial statements for the same period.

79
TABLE 5
GLOBAL UNICHIP CORP. AND SUBSIDIARIES
INFORMATION OF INVESTMENT IN MAINLAND CHINA
FOR THE YEARS ENDED DECEMBER 31, 2010
(Amounts in Thousands of New Taiwan Dollars, Unless Specified Otherwise)
Investment Flows
Investee Company Main Businesses and Products
Total Amount of
Paid-in Capital
(US$ in
Thousands)
Method of
Investment
Accumulated
Outflow of
Investment from
Taiwan as of
January 1, 2010
(US$ in
Thousands)
Outflow
(US$ in
Thousands)
Inflow
(US$ in
Thousands)
Accumulated
Outflow of
Investment from
Taiwan as of
September 30,
2010 (US$ in
Thousands)
Percentage of
Ownership
Equity in the
Earnings
(Losses)
Carrying Value
as of
September 30,
2010
Accumulated
Inward
Remittance of
Earnings as of
September 30,
2010
GUC-Shanghai Products consulting service $ 16,160
(US$ 500) (Note 1) - $ 16,160
(US$ 500) - $ 16,160
(US$ 500) 100% $ (7,971) $ 7,468 $ -
Accumulated Investment in Mainland China
as of September 30, 2010
(US$ in Thousands)
Investment Amounts Authorized by
Investment Commission, MOEA
(US$ in Thousands)
Upper Limit on Investment
(US$ in Thousands)
$ 16,160 (US$ 500)
$ 16,160 (US$ 500)
$ 1,909,972 (Note 3)
Note 1: The Company’s investee with a controlling financial interest, indirectly invested in GUC-Shanghai through GUC-BVI. Note 2: Equity in earnings/losses was determined based on the unaudited financial statements. Note 3: Subject to 60% of net asset value of GUC according to the revised “Guidelines Governing the Approval of Investment or Technical Cooperation in Mainland China” issued by the Investment Commission.

80
TABLE 6
GLOBAL UNICHIP CORP. AND SUBSIDIARIES
INTERCOMPANY RELATIONSHIPS AND SIGNIFICANT INTERCOMPANY TRANSACTIONS
FOR THE YEARS ENDED DECEMBER 31, 2010 AND 2009
(In Thousands of New Taiwan Dollars)
For the year ended December 31, 2010
Intercompany Transactions
Company Name Counter Party Nature of Relationship
(Note 1) Financial Statement Account Amount Terms
(Note 2)
Percentage to
Consolidated Total Gross
Sales or Total Assets
GUC GUC-NA 1 Operating expenses $ 155,643 - 2% Manufacturing overhead 54,029 - - Accrued expenses 14,353 - - GUC-Japan 1 Operating expenses 45,927 - - Accrued expenses 9,706 - - GUC-Europe 1 Operating expenses 1,778 - - Accrued expenses 632 - - GUC-Shanghai 1 Operating expenses 22,146 - - Accrued expenses 1,945 - -
Note 1: Represents the transactions from parent company to subsidiaries. Note 2: The intercompany transactions, prices are determined in accordance with mutual agreements and no other similar transactions could be compared with. For the year ended December 31, 2009
Intercompany Transactions
Company Name Counter Party Nature of Relationship
(Note 1) Financial Statement Account Amount Terms
(Note 2)
Percentage to
Consolidated Total Gross
Sales or Total Assets
GUC GUC-NA 1 Operating expenses $ 157,345 - 2% Accrued expenses 14,618 - - GUC-Japan 1 Operating expenses 39,755 - - Accrued expenses 3,462 - - GUC-Europe 1 Operating expenses 7,305 - - Accrued expenses 838 - -
Note 1: Represents the transactions from parent company to subsidiaries. Note 2: The intercompany transactions, prices are determined in accordance with mutual agreements and no other similar transactions could be compared with.