I-NERI TECHNICAL PROGRESS REPORT Project Number: 2006 …
20
I-NERI TECHNICAL PROGRESS REPORT Project Number: 2006-003-F Project Title: Comparison of Characterization Methods for Anisotropy and Microstructure of TRISO Particle Layers Lead U.S. Investigating Organization: ORNL U.S. Principal Investigator: John D. Hunn Lead Collaborating Investigating Organization: CEA Lead Collaborating Principal Investigator: Olivier Dugne Other Collaborating Organizations: AREVA Reporting period: 6/1/2007 – 9/30/2007 NTD/SIM: David Petti Work Package #: G-IN07NG02 Project Status Summary: This INERI was created to support a comparative study between the newly developed two modulator generalized ellipsometry microscope (2-MGEM) at the Oak Ridge National Laboratory (ORNL) and the more traditional optical polarimeter (RAPAX) at the Commissariat à l’Énergie Atomique (CEA). These two systems are used to measure the anisotropy of the pyrocarbon layers in tri-isotropic (TRISO) coated particle fuel, which is an important parameter related to fuel performance. Although this project was only just started in June 2007, good progress has already been made. A kickoff meeting was held at ORNL on July 30-31, 2007 to present early progress and discuss details of the proposed work plan. This meeting was of great benefit to the participants, offering an opportunity to overcome the language barrier and more thoroughly communicate project relevant information. Each technical lead gave a presentation explaining the analysis techniques used in his task and presented data on early measurements of the German reference fuels. Plans were finalized regarding what work needed to be done and how to proceed with the comparative study. Possibilities for the inclusion of other coated particle samples, in addition to the two German reference fuels originally proposed, were also discussed. A list of these additional samples has now been generated and approved by the technical leads. Coating fragments from this series of different TRISO particle fuels have been sent from ORNL to the CEA and TEM analysis is in progress. Comparisons have already been made between the microstructure of the two German reference fuels which are the primary samples for this project. Specimens have also been prepared from the German reference fuels for comparative analysis between the 2-MGEM and RAPAX devices and initial measurements have been performed. Plans are to exchange specimens of the various fuel types in early FY08 for comparative analysis.
Transcript of I-NERI TECHNICAL PROGRESS REPORT Project Number: 2006 …

I-NERI TECHNICAL PROGRESS REPORT
Project Number: 2006-003-F Project Title: Comparison of Characterization Methods for Anisotropy and Microstructure of TRISO Particle Layers
Lead U.S. Investigating Organization: ORNL U.S. Principal Investigator: John D. Hunn
Lead Collaborating Investigating Organization: CEA Lead Collaborating Principal Investigator: Olivier Dugne
Other Collaborating Organizations: AREVA
Reporting period: 6/1/2007 – 9/30/2007 NTD/SIM: David Petti Work Package #: G-IN07NG02 Project Status Summary: This INERI was created to support a comparative study between the newly developed two modulator generalized ellipsometry microscope (2-MGEM) at the Oak Ridge National Laboratory (ORNL) and the more traditional optical polarimeter (RAPAX) at the Commissariat à l’Énergie Atomique (CEA). These two systems are used to measure the anisotropy of the pyrocarbon layers in tri-isotropic (TRISO) coated particle fuel, which is an important parameter related to fuel performance. Although this project was only just started in June 2007, good progress has already been made. A kickoff meeting was held at ORNL on July 30-31, 2007 to present early progress and discuss details of the proposed work plan. This meeting was of great benefit to the participants, offering an opportunity to overcome the language barrier and more thoroughly communicate project relevant information. Each technical lead gave a presentation explaining the analysis techniques used in his task and presented data on early measurements of the German reference fuels. Plans were finalized regarding what work needed to be done and how to proceed with the comparative study. Possibilities for the inclusion of other coated particle samples, in addition to the two German reference fuels originally proposed, were also discussed. A list of these additional samples has now been generated and approved by the technical leads. Coating fragments from this series of different TRISO particle fuels have been sent from ORNL to the CEA and TEM analysis is in progress. Comparisons have already been made between the microstructure of the two German reference fuels which are the primary samples for this project. Specimens have also been prepared from the German reference fuels for comparative analysis between the 2-MGEM and RAPAX devices and initial measurements have been performed. Plans are to exchange specimens of the various fuel types in early FY08 for comparative analysis.

Project Organization: ORNL Contributors John D. Hunn – Project oversight, reporting, sample preparation and data analysis G.E. “Jay” Jellison, Jr. – Anisotropy measurements using 2-MGEM ellipsometer CEA Contributors Olivier Dugne – Project oversight, reporting Francois Charollais – Anisotropy measurements using RAPAX polarimeter Cecile Garcia (Bordeaux University) – TEM and SEM analysis Julien Banchet (AREVA) – X-ray radiography

Element 1 – Evaluation of Pyrocarbon Anisotropy It has long been understood that structural stability of pyrolytic carbon under irradiation is sensitive to the degree of preferred orientation of the carbon basal planes. For this reason, limits on the level of pyrocarbon anisotropy are included in the criteria for coated particle fuel acceptance. However, full understanding of the relationship between fuel performance and pyrocarbon anisotropy has not been achieved due to limitations in the available technology. Current advances in material science analytical techniques have opened the door to further study.
ORNL and CEA have each developed a methodology for determination of pyrocarbon anisotropy on a micrometer-scale by reflecting polarized light from the surface of a polished cross-section. CEA’s technique is called RAPAX. It is based upon the use of an optical polarimeter, which has historically been used for determination of pyrocarbon anisotropy in coated particle fuel. The ORNL technique utilizes the 2-MGEM. This approach uses generalized ellipsometry to go beyond the capability of a simple optical polarimeter and fully determine the effect of reflection from the pyrocarbon surface on polarized light to accurately assess the pyrocarbon anisotropy. Although the ellipsometry approach is in many ways superior to optical polarimetry, there is a need to connect the results of the ellipsometer to historically reported values for anisotropy obtained using various polarimeter systems. Careful comparison of the two techniques using identical samples as well as available calibration standards will be of great value in making this connection and in validating the two techniques. In addition to the optical measurements discussed above, CEA has applied a selected area electron diffraction technique (SEAD) using a transmission electron microscope (TEM). TEM-SEAD can be used to evaluate pyrocarbon anisotropy on a nanometer-scale to obtain the microstructural resolution necessary for better understanding of the phenomenon. Furthermore, TEM analysis will help to strengthen the connection between the measured optical anisotropy and the underlying crystallographic anisotropy in the pyrocarbon. Task 1.1: Send TEM samples from ORNL to CEA - Hunn Objective – ORNL will separate coating fragments of their German reference material from the uranium bearing kernels for easy shipment to the CEA. These will be sent to the CEA for TEM sample preparation and analysis. Status – Complete Overview – Preparation of a sample of 20 coating fragments was completed in May 2006 and shipped in June. An additional 20 coating fragments were prepared and shipped in July. ORNL coated particle fuel sample AGR-06 is from the German proof test composite EUO 2358-2365.1 AGR-06 uses a TRISO coated particle design on 504-508 µm mean diameter 10.6% enriched UO2 kernels. Table 1 lists mean property values for the coatings, as measured by ORNL in 2004. The 95% confidence intervals were calculated from the mean and standard deviation of the measured sample using student-t statistics. The kernels are well formed and have a very smooth 1 J.D. Hunn, “Results from ORNL Characterization of Archive German Particles,” ORNL/TM-2005/546, 64 pages.

and non-porous surface. This makes it easy to separate the coatings from the nuclear material, as described below. Table 1. Mean properties of AGR-06.1
Property Mean 95% Confidence Interval Buffer thickness (µm) 94 92-96 IPyC thickness (µm) 39 38-40 SiC thickness (µm) 34 33-35 OPyC thickness (µm) 36 35-37 SiC sink/float density (g/cc) 3.201 3.200-3.202 OPyC sink/float density (g/cc) 1.926 1.919-1.933 IPyC optical anisotropy factora 1.028 1.026-1.030 OPyC optical anisotropy factora 1.016 1.015-1.017
aNote that the optical anisotropy factors reported here were measured at an early stage in the development of the ORNL ellipsometer and should be considered to be preliminary results. Improvements in sample preparation and measurement techniques will be applied when these properties are re-analyzed as part of this INERI. For the first shipment, ten particles were randomly selected from AGR-06-09 (a 0.47 g riffled sub-sample taken from AGR-06). Ten 800 µm diameter stainless steel ball bearings were placed into a cylindrical bullet press. The purpose of these ball bearings was to allow force to be applied to the larger TRISO particle to fracture the coatings but then stop the downward travel of the ram before it could contact the UO2 kernel or further fracture the coating fragments. One TRISO particle was added to the press. A small force was applied to the ram until the sound of the coating being fractured was heard. The press was then opened and the kernel was inspected to insure that it was not damaged and that the coatings were completely separated from the uranium bearing kernel (Figs. 1 and 2). The two largest coating fragments were then recovered (Figs. 3 and 4). These were between 1/3 to 1/2 of the TRISO shell. The process was repeated for each of the 10 particles. For the second shipment, ten particles were randomly selected from AGR-06-05-03. AGR-06-05 was a 4.9563 g sub-sample riffled from AGR-06. AGR-06-05-03 was a 2.1321 g subsample obtained from AGR-06-05 by taking the center bin of a rollermicrometer separation. AGR-06-05-03 is also being used for optical anisotropy samples. The process described above was used to separate 20 fragments.

Fig. 1. Ten intact kernels removed from AGR-06 TRISO particles. The white circles are reflections of stereoscope ring-light.
Fig. 2. SEM image of the smooth and non-porous UO2 kernel surface.

Fig. 3. Twenty coating fragments. Two were obtained from each TRISO particle.
Fig. 4. Nearly hemispherical coating fragment. All four coatings are present. The inside of the buffer layer is smooth and reflects the stereoscope ringlight.

Additional Planned Activities – In the overview of Task 1.4 below, tables are presented listing additional coated particle fuel samples that are being included in this study to expand the range of anisotropy covered by this comparative study. Coating fragments from the additional ORNL samples have already been prepared as described above and were sent to the CEA in September 2007 for TEM analysis. Some additional samples may need to be prepared, depending on the success of the TEM sample preparation. Task 1.2: Prepare TEM samples - Garcia Objective – The CEA will prepare samples from the two German reference fuels for analysis of the pyrocarbon layers using TEM. Status – Complete Overview – CEA has prepared TEM samples from the two German reference fuels for analysis of the pyrocarbon layers using a precise ion polishing system (PIPS) method developed specifically in CEMES (Toulouse). Fig. 5 shows an example of a specimen obtained from a TRISO particle.
Fig. 5. Example of thinned pyrolytic carbon layers obtained by PIPS preparation method. Additional Planned Activities – As mentioned above, additional samples of coated particle fuels with varying anisotropies have been sent from ORNL to the CEA. TEM specimens will be prepared from these additional samples. In addition, other to-be-determined samples available at the CEA that exhibit various anisotropies will also be prepared. Task 1.3: TEM-SEAD and SEM analysis - Garcia Objective – The CEA will perform TEM-SEAD analysis on the two German reference fuels. The results of these analyses will be compared to the results of the optical methods.

Status – Complete Overview – CEA has performed TEM-SEAD and SEM analysis on the two German particles for comparison between the two lots (AVR19 available from CEA and EUO 2358-2365/AVR21 available from ORNL). The SEAD results obtained on the outer pyrolytic carbon (OPyC) and inner pyrolytic carbon (IPyC) are reported in Fig. 7. The curves are obtained from 002-diffraction patterns carried out with four aperture values : 0.1, 0.4, 0.8 and 2.15 µm in diameter (see Fig. 6). The diffraction patterns show the misorientation of the carbon layers around the anisotropy plane. For an isotropic PyC, the pattern is characterized by a Debye-Scherrer 002-ring. In the case of a well organised PyC, the pattern exhibits two 002 arcs which appear perpendicular to the anisotropy plane. Diffraction pattern analysis is performed using image analysis software developed in Laboratoire des Composites Thermostructuraux (LCTS), Bordeaux University. It is possible to measure an Angular Opening (AO). The higher the value of the AO, the better the isotropy. From an AO value of 90°, one can consider that the coating begins to be isotropic.
Fig. 6. Upper image shows a low magnification TEM of IPyC layer with the scanned area for the four apertures used for SEAD superimposed in red (top). Lower image shows the diffraction patterns obtained for each aperture.
0.1 µm 0.4 µm 0.8 µm 2.0 µm

Fig. 7. Angular opening in degrees versus diaphragm size in µm for OPyC and IPyC. For the OPyC, the curves in Fig. 7 overlap, showing similar anisotropy. The OPyC also shows a lower anisotropy than the IPyC, as expected (see Tables 3 and 4). For the IPyC, there is a very small difference in anisotropy between the two samples. It may be possible to correlate this difference with the microstructure through TEM and SEM examination. In TEM examination (Fig. 8), the IPyC from the two German fuel samples show a similar structure with a polynucleated core (red circles) and a surrounding area that is more anisotropic and shows cracks. The two kinds of microstructure could be representative of different deposition mechanisms occurring during fabrication in the fluidized bed. One proposed growth mechanism of the pyrocarbon is based in a first step on a pre-growth clustering of free concentric nanoparticles in the gas phase (homogeneous growth). As both the nucleation and the growth occur in aerosol, the graphene planes arrange concentrically around the growth centers. As they reach a few tens of micrometers, the nanoparticle clusters deposit and cement to the surface of the fuel particles; then in a second step, there is a final densification around the polynucleated core by a direct deposit in an heterogeneous growth which induces a more oriented pyrocarbon until the definitive size of the final spheroid (yellow area).

Fig. 8. TEM bright field image of IPyC a) AVR19 b) AVR21. Complimentary SEM on fractography is also performed on the samples to look for further correlations between the anisotropy and the microstructure. TEM, SEM, and optical examination, combined together, allow for a multiscale examination of the pyrolytic carbon microstructure. The SEM examination on fractography doesn’t show any significant difference between the two German reference fuels (Figs. 9 and 10). The pyrocarbon is constituted of an aggregation of spheroids with noticeable porosity. A more quantitative comparison of the microstructure has been done with a statistical approach of the spheroid size based on 280 cases. The results are given on the histogram in Fig. 11 and Table 2. The statistical results confirm the similarity of the two lots in terms of size of spheroids. There is a measurable difference in the average and standard deviation between the IPyC and the OPyC layers.
Fig. 9. SEM Image of OPyC layers a) AVR19 b) AVR21.
Fig. 10. SEM Image of IPyC layers a) AVR19 b) AVR21.
a) b)
a) b)

IPyC
0
20
40
60
80
100
120
140
160
100-
200
300-
400
500-
600
700-
800
900-
1000
Taille (nm)
Sph
éro
lite
s co
mpt
ées
avr-21
avr-19
OPyC
0
20
40
60
80
100
120
140
160
100-
200
300-
400
500-
600
700-
800
900-
1000
Taille (nm)
Sph
éro
lite
s co
mpt
ées
avr-21
avr-19
Fig. 11. Size distribution of the spheroids for IPyC and OPyC (Diameter versus spheroid count). Table 2. Average Size and σ² of AVR19 and AVR21 Sample OPyC IPyC
AVR19 Sav = 322nm σ² = 141nm
Sav = 258nm σ² = 80nm
AVR21 Sav = 397nm σ² = 172nm
Sav = 241nm σ² = 69nm
Additional Planned Activities – As mentioned above, additional samples of coated particle fuels with varying anisotropies will be studied by TEM and SEM using the methodology described above. Task 1.4: Prepare optical samples – Hunn/Charollais Objective – ORNL and the CEA will each prepare optical samples of their German reference fuel. Each organization will mount 20-30 particles and polish to near midplane of the particles. As a modification to their standard materialographic process developed for preparation of samples for anisotropy analysis, the kernels will be removed from the particles to remove the nuclear material and facilitate sample exchange. Status –Complete Overview – ORNL and the CEA have prepared polished cross section specimens of AVR-19 (CEA) and German proof test composite EUO 2358-2365 (ORNL) for optical analysis by the 2-MGEM ellipsometer and the RAPAX polarimeter. As part of this preparation, the uranium bearing kernels were removed to simplify sample exchange. The specimen preparation technique at ORNL involves balancing between keeping the surface flat and obtaining a good polish. The physical structure of the TRISO fuel design makes it

difficult to obtain both conditions. With a hard SiC layer sandwiched between two softer pyrolytic carbon layers, there is a tendency when polishing to produce a non-flat surface for the cross sectioned particle that tapers away from the SiC layer. The 2-MGEM, is more sensitive to surface flatness than surface roughness. Surface roughness in the form of minor scratches and pits does not adversely effect the accuracy of ellipsometer measurement. However, if the pyrocarbon surface is not perpendicular to the optical axis of the device, this results in an unacceptable loss of signal over the entire sample. For this reason, the standard sample preparation technique purposefully produces a flat but only roughly polished surface. Unfortunately, the RAPAX system is not expected to be compatible with this specimen type. Therefore, ORNL has worked to develop an optimized specimen preparation technique that maximizes flatness while minimizing surface roughness. This has now been successfully accomplished and an additional specimen has been prepared from German proof test composite EUO 2358-2365. Additional Planned Activities – Task 1.4 of the INERI work plan states that, “In addition to the German reference materials, to be determined samples from the CEA and ORNL archives will also be prepared. These samples will be selected to increase the range of anisotropy spanned by this study.” ORNL and the CEA have each selected a number of appropriate samples to be used in this study. During the July 30-31, 2007 kick-off meeting at ORNL, these samples were discussed between the task leads from each organization. Table 3 shows the list of proposed ORNL specimens with a brief justification for each sample. ORNL proposes that the samples in Table 3 be included in this study because they will provide a well spaced range of optical anisotropies from 0.004 up to 0.02 on relevant coated particles. This extended anisotropy range will allow for a more complete comparison between the RAPAX and 2-MGEM measurements and will encompass the expected pyrocarbon anisotropy range for modern coated particle fuel. ORNL will mount and polish the samples and perform optical anisotropy measurements using the 2-MGEM. These sample will then be sent to the CEA for RAPAX analysis. Table 4 shows the list of proposed CEA specimens with a brief justification for each sample. These samples will be prepared for analysis by the CEA. Issues/Concerns – The high numerical aperture optics used in the RAPAX polarimeter allow for successful imaging of non-planar specimens. An initial test specimen will be sent by the CEA to ORNL to determine if the CEA specimen preparation technique is compatible with the ORNL 2-MGEM. It may be necessary for the CEA to also modify it’s specimen preparation method in order to get the best results from this comparative study.

Table 3. Additional ORNL samples for INERI collaboration
Sample description IPyC
diattenuation OPyC
diattenuation Reason for inclusion in study ORNL German reference fuel EUO 2358-2365 composite Sample ID: AGR-06
0.014 0.008 Primary sample for this study. This fuel demonstrated acceptable performance and is considered to be a starting point for modern coated particle fuel programs.
CEA German reference fuel AVR-19
? ? Primary sample for this study. This fuel demonstrated acceptable performance and is considered to be a starting point for modern coated particle fuel programs.
AGR-1 baseline fuel – pre compacting Sample ID: LEU01-46T
0.0074 0.0063 This is the baseline US fuel design and is currently being irradiated. It will provide the first available irradiation performance data on modern fuel and will be available for post-irradiation examination.
AGR-1 baseline fuel – post compacting Sample ID: LEU01-46T-Z
0.0109 0.0111 The pre-compacting AGR-1 baseline fuel can be compared more directly with the pre-compacting German reference fuels and is the fuel fabrication stage at which QC measurements are made. However, heat treatment during compacting increases the anisotropy of the pyrocarbon layers. Therefore, measurements on samples after compacting provide the true pre-irradiation data.
Heat treated ORNL German reference fuel Sample ID: AGR-06-Z
? ? Heat treatment at 1800°C for 1 hour will simulate the effect of compact fabrication on the coated particles. This heat treatment is expected to result in an increase in pyrocarbon diattenuation and will provide data more relevant to the actually pre-irradiated fuel condition.
AGR-1 variant 1 fuel – pre-compacting Sample ID: LEU01-47T
0.0047 0.0044 This high temperature pyrocarbon variant is also currently being irradiated. This sample possesses the lowest available pyrocarbon diattenuation in a relevant coated particle sample.
HRB-21 reference fuel Sample ID: AGR-10
0.0189 0.0125 This historic reference fuel was produced for the HRB-21 irradiation test (1988-1995). This sample possessed a high pyrocarbon diattenuation and did not perform well under irradiation.
Heat treated HRB-21 reference fuel Sample ID: AGR-10-Z
? ? Heat treatment at 1800°C for 1 hour will simulate the effect of compact fabrication on the coated particles. This heat treatment is expected to result in an increase in pyrocarbon diattenuation.
Aluminum mirror 0 Normalization standard. Allows for the first order cancellation of polarization effects in the system optics.
Rutile (single crystal TiO2) polished with c-axis in plane
0.087 Calibration standard. Provides a definitive check on the accuracy of the measurement system.
HOPG (Highly oriented pyrolytic graphite) polished with c-axis in plane
0.572 at 546 nm This is the closest thing available to single crystal graphite.
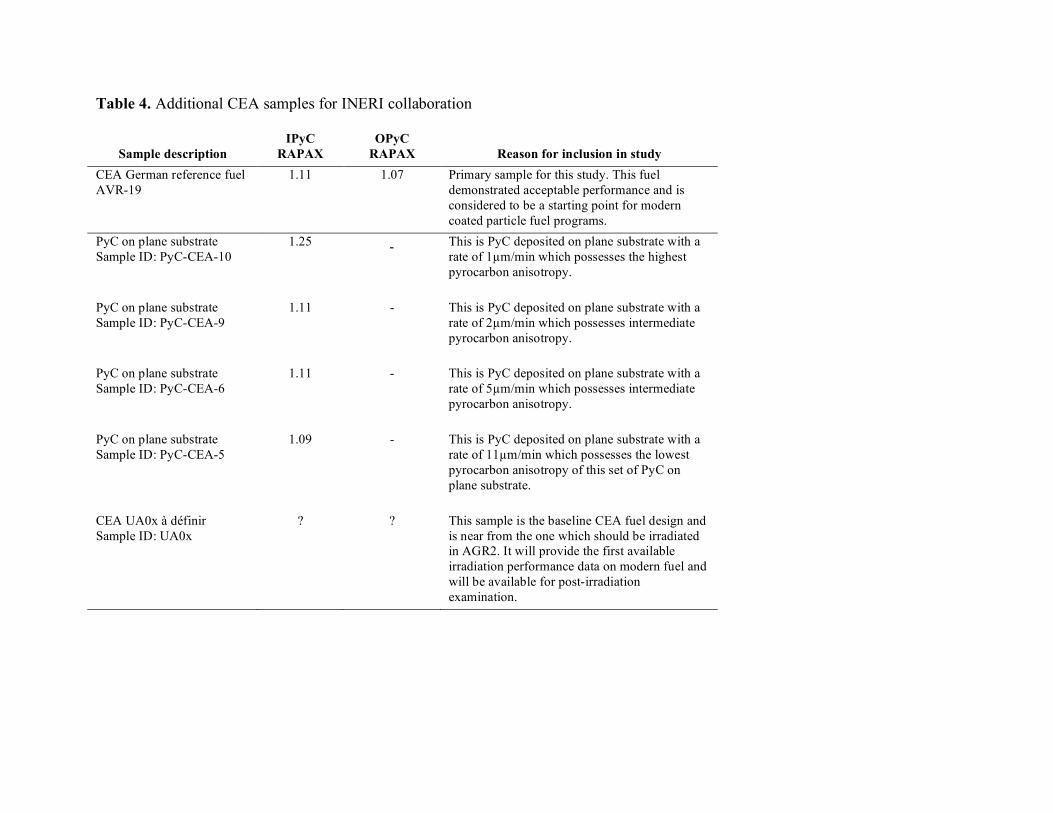
Table 4. Additional CEA samples for INERI collaboration
Sample description IPyC
RAPAX OPyC
RAPAX Reason for inclusion in study CEA German reference fuel AVR-19
1.11 1.07 Primary sample for this study. This fuel demonstrated acceptable performance and is considered to be a starting point for modern coated particle fuel programs.
PyC on plane substrate Sample ID: PyC-CEA-10
1.25
- This is PyC deposited on plane substrate with a rate of 1µm/min which possesses the highest pyrocarbon anisotropy.
PyC on plane substrate Sample ID: PyC-CEA-9
1.11 - This is PyC deposited on plane substrate with a rate of 2µm/min which possesses intermediate pyrocarbon anisotropy.
PyC on plane substrate Sample ID: PyC-CEA-6
1.11 - This is PyC deposited on plane substrate with a rate of 5µm/min which possesses intermediate pyrocarbon anisotropy.
PyC on plane substrate Sample ID: PyC-CEA-5
1.09 - This is PyC deposited on plane substrate with a rate of 11µm/min which possesses the lowest pyrocarbon anisotropy of this set of PyC on plane substrate.
CEA UA0x à définir Sample ID: UA0x
? ? This sample is the baseline CEA fuel design and is near from the one which should be irradiated in AGR2. It will provide the first available irradiation performance data on modern fuel and will be available for post-irradiation examination.

Task 1.5: Analyze optical samples – Jellison/Charollais Objective – ORNL and the CEA will each analyze the samples they have prepared to measure the anisotropy in the inner and outer pyrocarbon layers of each particle. Statistical analysis of the data will yield information on the mean, standard deviation, and distribution of measured anisotropy for each pyrocarbon layer of each particle. From the combined mean values for the 20-30 particles in the sample, a confidence interval on the average anisotropy of the two pyrocarbon layers in the particle lot will be determined. This confidence interval represents the final result that this analysis typically reports for feedback into coating development or for use in determination of product acceptance. Status – ORNL: In progress / CEA: Postponed until after Task 1.8 complete Overview – ORNL has completed 2-MGEM measurements on preliminary specimens of their German reference fuel (presented below). However, optimization of sample preparation as discussed above was performed to improve the analysis of the OPyC and provide a polished surface compatible with the CEA RAPAX technique. These optimized samples will ultimately be the specimens that are sent to CEA for comparative analysis. Tables 5 and 6 show the results of anisotropy measurements on 10 particles of the ORNL German reference fuel using the 2-MGEM ellipsometer. There is some variation from particle to particle in the average diattenuation. This illustrates the importance of making direct comparisons between the 2-MGEM and RAPAX measurements on the same particle. There are also variations in diattenuation within each particle pyrocarbon layer. For this reason, a scheme was worked out at the initial project planning meeting to allow for point to point comparison of the local average diattenuation on each polished cross section in addition to particle to particle comparison of the average diattenuation in each layer. The more commonly reported optical anisotropy factor (OPTAF) is calculated from the measured diattenuation (N) by the formula:
OPTAF = (1+N)/(1-N). The average OPTAF values for the samples in Tables 5 and 6 are 1.028 (IPyC) and 1.017 (OPyC). Table 5. German proof test composite EUO 2358-2365, IPyC diattenuation
Diattenuation Particle #
Average St. Dev. Ave. Error
1 0.0131 0.0033 0.0005 2 0.0151 0.0031 0.0005 3 0.0129 0.0029 0.0005 4 0.0147 0.0035 0.0005 5 0.0123 0.0029 0.0005 6 0.0173 0.0033 0.0007 7 0.0134 0.0036 0.0007 8 0.0136 0.0030 0.0006 9 0.0132 0.0028 0.0006 10 0.0149 0.0033 0.0006
Average 0.0141 0.0032 0.0006

Table 6. German proof test composite EUO 2358-2365, OPyC diattenuation
Diattenuation Particle #
Average St. Dev. Ave. Error
1 0.0078 0.0037 0.0007 2 0.0089 0.0037 0.0006 3 0.0076 0.0034 0.0006 4 0.0086 0.0036 0.0006 5 0.0076 0.0033 0.0006 6 0.0105 0.0036 0.0006 7 0.0073 0.0035 0.0007 8 0.0080 0.0035 0.0007 9 0.0078 0.0030 0.0006 10 0.0091 0.0030 0.0007
Average 0.0083 0.0034 0.0006
Task 1.6: Exchange samples Objective – After completion of Task 1.5, ORNL and the CEA will exchange samples. Because kernels have been removed during sample preparation, the shipment of samples between facilities will be greatly simplified. Status – No activity planned for FY07 Task 1.7: Analyze exchanged optical samples Objective – ORNL and the CEA will each analyze the samples prepared by the other organization and determine anisotropy of each pyrocarbon layer as in Task 1.5. Status – No activity planned for FY07 Task 1.8: Measurement of anisotropy standard – Jellison/Charollais Objective – In addition to the measurements performed on the German reference fuel from each organization, ORNL will prepare two anisotropy standards of aluminum and single crystal TiN (or TiO2) and each organization will perform measurements on the two standards. These two standards have well known values of diattenuation and will unambiguously provide a calibration check between the two systems. Status – In progress Overview – ORNL has performed measurements on aluminum and single crystal TiO2 (rutile) anisotropy standards. Aluminum has zero diattenuation under reflection and is used to normalize the 2-MGEM ellipsometer whenever measurements are taken. Rutile has a well defined theoretical diattenuation of 0.087 ± 0.001 at 577 nm when measured with the c-axis in the plane of the analyzed surface. The 2-MGEM was used to scan a 0.5 x 0.5 mm region of a rutile anisotropy standard. Fig. 12 shows a color scale image of the reflected intensity and diattenuation of the surface of the rutile crystal. Some minor spatial variation in reflected

intensity was observed due to surface imperfections. The spatial variation in the diattenuation is due to near surface defects. The average diattenuation of the sample was 0.0883 ± 0.0008 with a standard deviation of 0.0019. This is in good agreement with the theoretical diattenuation of rutile.
Fig. 12. Image of the surface of a rutile crystal anisotropy standard showing a) reflected intensity and b) diattenuation. Imaged area is 0.5 mm square. The color scale of the diattenuation image ranges from 0.074 (violet) to 0.100 (red). The average measured diattenuation was 0.0883. Additional Planned Activities – Anisotropy standards of aluminum and single crystal TiO2 will be sent by ORNL to the CEA for measurement with the RAPAX polarimeter. Task 1.9: Compare results Objective – ORNL and the CEA will exchange and compare results of the anisotropy analysis. Because measurements will be performed on the same samples, comparison can be made, not only of the confidence intervals on the average mean anisotropy for each layer, but also on the results for each individual particle. Thus measurement uncertainties and handling of coating irregularities can also be compared.
In addition to the comparison between the polarimeter and ellipsometer results, the TEM results will be correlated to the optical anisotropy measurements. Comparison will also be made between the two reference materials and between the current results and historical data available for those two lots of German fuel. Status – No activity planned for FY07 Task 1.10: Identify lessons learned Objective – ORNL and the CEA will identify lessons learned from this exercise. It is anticipated that the comparison will validate the accuracy of the analysis methodology developed by each
a) b)

organization, but any areas that can be identified for improvement, both in terms of sample preparation and analysis technique will be noted. It is also expected that the comparison between the two reference materials and other selected samples and the additional information from the TEM analysis will yield new insight into the phenomenon of pyrocarbon anisotropy and its affect on coated particle fuel performance. Status – No activity planned for FY07 Element 2 - Examination using X-ray imaging techniques (No activity planned in FY07) X-ray radiography is a non-destructive technique which can obtain structural information without introducing artifacts induced by metallographic preparation. Moreover, this technique can offer 3-D information about layer thickness, density, interface structure, and coating defects (cracks, voids, etc.). ORNL and the CEA each utilize x-ray radiography for coated particle characterization. In addition to standard x-ray systems, ORNL has developed a new system capable of x-ray radiography and 3 dimensional tomography with a resolution down to 1 µm. To shake down this new system and learn more about the relative capabilities of the various techniques, a number of particles from each reference fuel lot will be examined. Task 2.1: Analyze particles ORNL and the CEA will each image 10-20 particles from their German reference fuel lot using the various x-ray radiography methods available to them. In addition, some particles with known defects may be selected from the archives of the U.S. Advanced Gas Reactor Fuel Development and Qualification Program, to test the capabilities of the systems for defect detection and analysis. Task 2.2: Exchange particles After completion of Task 3.1, the particles will be exchanged. In this case, the samples will be whole particles still containing the fuel kernel, so the shipment will involve nuclear material. Task 2.3: Analyze particles ORNL and the CEA will each image the particles provided by the other organization using the same techniques as those used in Task 3.1. Task 2.4: Compare results ORNL and the CEA will exchange and compare results of the x-ray imaging. Task 2.5: Identify lessons learned ORNL and the CEA will identify the lessons learned from the x-ray image comparison and consider the applicability of this non-destructive technique for widespread use in coated particle fuel characterization and qualification.
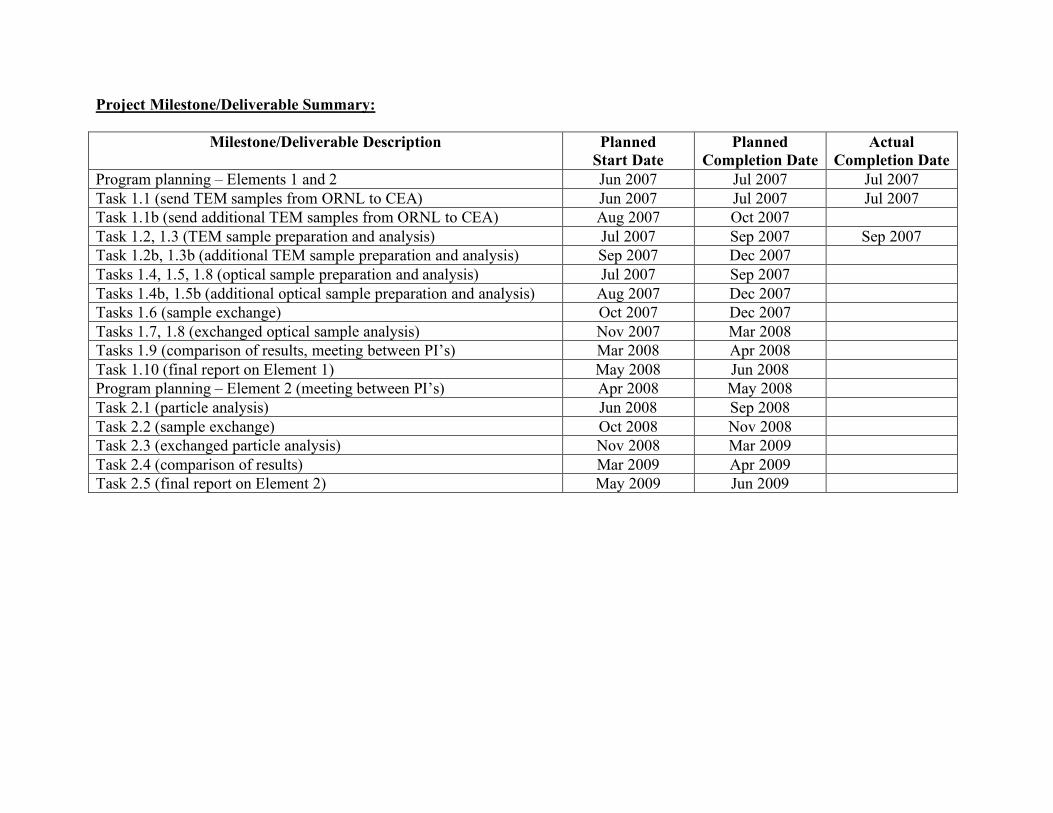
Project Milestone/Deliverable Summary:
Milestone/Deliverable Description Planned Start Date
Planned Completion Date
Actual Completion Date
Program planning – Elements 1 and 2 Jun 2007 Jul 2007 Jul 2007 Task 1.1 (send TEM samples from ORNL to CEA) Jun 2007 Jul 2007 Jul 2007 Task 1.1b (send additional TEM samples from ORNL to CEA) Aug 2007 Oct 2007 Task 1.2, 1.3 (TEM sample preparation and analysis) Jul 2007 Sep 2007 Sep 2007 Task 1.2b, 1.3b (additional TEM sample preparation and analysis) Sep 2007 Dec 2007 Tasks 1.4, 1.5, 1.8 (optical sample preparation and analysis) Jul 2007 Sep 2007 Tasks 1.4b, 1.5b (additional optical sample preparation and analysis) Aug 2007 Dec 2007 Tasks 1.6 (sample exchange) Oct 2007 Dec 2007 Tasks 1.7, 1.8 (exchanged optical sample analysis) Nov 2007 Mar 2008 Tasks 1.9 (comparison of results, meeting between PI’s) Mar 2008 Apr 2008 Task 1.10 (final report on Element 1) May 2008 Jun 2008 Program planning – Element 2 (meeting between PI’s) Apr 2008 May 2008 Task 2.1 (particle analysis) Jun 2008 Sep 2008 Task 2.2 (sample exchange) Oct 2008 Nov 2008 Task 2.3 (exchanged particle analysis) Nov 2008 Mar 2009 Task 2.4 (comparison of results) Mar 2009 Apr 2009 Task 2.5 (final report on Element 2) May 2009 Jun 2009