Types of Data, Descriptive Statistics, and Statistical Tests for ...
date post
19-Dec-2015Category
view
216download
0
CHAPTER-1

STATISTICS and DATAI need help!Applications in Business and Economics
Data
Data Sources
Descriptive Statistics
Statistical Inference
Computers & Statistical Analysis

Definition:
• Collection, summarization, analysis, and reporting of numerical findings
1.2. What is Statistics?

Statistics is concerned with DATA Collection; Organization; SummarizationPresentation and Scientific Analysis
· drawing valid conclusions· making informed decisions
1.1. What is Statistics? What are its Applications?

Applications of Statistics in
Business and Economics

Accounting
Applications in Business and Economics
Economics
Public accounting firms use statisticalsampling procedures when conductingaudits for their clients.
Economists use statistical informationin making forecasts about the future ofthe economy or some aspect of it.

Applications in Business and Economics
A variety of statistical quality control charts are used to monitorthe output of a production process.
Production
Electronic point-of-sale scanners atretail checkout counters are used tocollect data for a variety of marketingresearch applications.
Marketing

Applications in Business and Economics
Financial advisors use price-earnings ratios anddividend yields to guide their investmentrecommendations.
Finance

Data, Data Sets, Elements, Variables, and
Observations

Data are the facts and figures collected, summarized, analyzed, and interpreted.
Data and Data Sets
The data collected in a particular study are referred to as the data set.
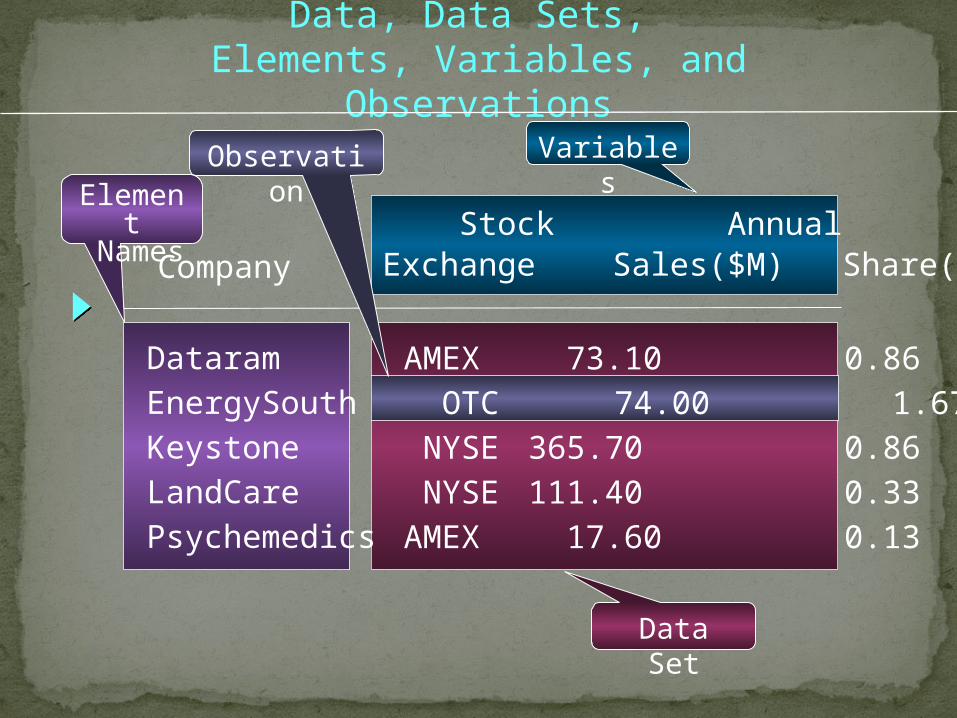
Stock Annual Earn/Exchange Sales($M) Share($)
Data, Data Sets, Elements, Variables, and Observations
Company
Dataram EnergySouth Keystone LandCare Psychemedics
AMEX 73.10 0.86 OTC 74.00 1.67 NYSE 365.70 0.86 NYSE 111.40 0.33 AMEX 17.60 0.13
Variables
Element
Names
Data Set
Observation

The elements are the entities on which data are collected.
A variable is a characteristic of interest for the elements.
The set of measurements collected for a particular element is called an observation.
The total number of data values in a data set is the number of elements multiplied by the number of variables.
Elements, Variables, and Observations
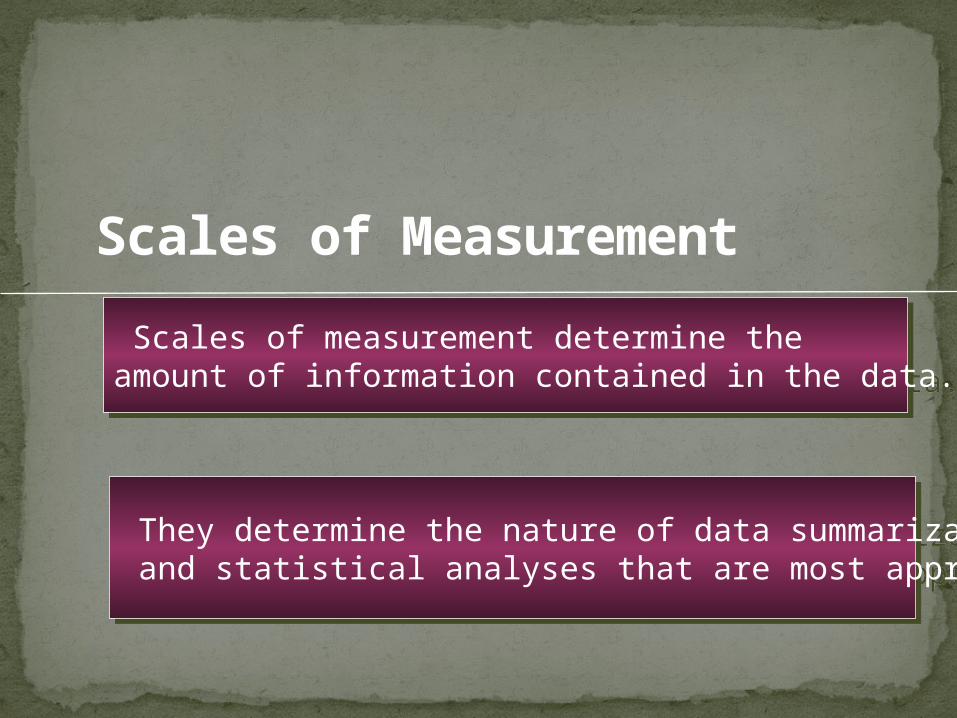
Scales of Measurement
Scales of measurement determine the amount of information contained in the data. Scales of measurement determine the amount of information contained in the data.
They determine the nature of data summarization and statistical analyses that are most appropriate. They determine the nature of data summarization and statistical analyses that are most appropriate.

Scales of Measurement
Four commonly used Scales of measurementFour commonly used Scales of measurementNominal
Ordinal
Interval
Ratio

Nominal ScalesScales of Measurement
A nonnumeric label or numeric code may be used. A nonnumeric label or numeric code may be used.
Data labels or names used to identify an attribute of the element. Data labels or names used to identify an attribute of the element.

Example: Classification of University students by the school in which they are enrolled using labels such as Business, Humanities, Education, and so on. (Non-numeric)
Alternatively, a numeric code could be used for the school variable (e.g. 1: denotes Business, 2: denotes Humanities, 3 : denotes Education, and so on).
Scales of Measurement
Nominal Scales

Ordinal ScalesScales of Measurement
A nonnumeric label or numeric code may be used. A nonnumeric label or numeric code may be used.
Data Measured using Ordinal scaleshave the properties of nominal data. However, the order or rank of the data is meaningful.
Data Measured using Ordinal scaleshave the properties of nominal data. However, the order or rank of the data is meaningful.

Ordinal ScalesScales of Measurement
Example: Classification of University students by their class standing using a nonnumeric label such as Freshman, Sophomore, Junior, or Senior.
Alternatively, a numeric code could be used for the class standing variable (e.g. 1 denotes Freshman, 2 denotes Sophomore, and so on).
Example: Classification of University students by their class standing using a nonnumeric label such as Freshman, Sophomore, Junior, or Senior.
Alternatively, a numeric code could be used for the class standing variable (e.g. 1 denotes Freshman, 2 denotes Sophomore, and so on).

Interval Scales
Scales of Measurement
Interval data are always numeric. Interval data are always numeric.
The data have the properties of ordinal data, and the interval between observations is expressed in terms of a fixed unit of measure.
The data have the properties of ordinal data, and the interval between observations is expressed in terms of a fixed unit of measure.

Interval Scales
Scales of Measurement
Example: Melissa has an SAT score of 1205, while Kevin has an SAT score of 1090. Melissa scored 115 points more than Kevin.
Example: Melissa has an SAT score of 1205, while Kevin has an SAT score of 1090. Melissa scored 115 points more than Kevin.

Ratio ScalesScales of Measurement
The data have all the properties of interval data and the ratio of two values is meaningful. The data have all the properties of interval data and the ratio of two values is meaningful.
Variables such as distance, height, weight, and time use the ratio scale. Variables such as distance, height, weight, and time use the ratio scale.
Ratio scale must contain a zero value that indicates that nothing exists for the variable at the zero point.Ratio scale must contain a zero value that indicates that nothing exists for the variable at the zero point.

Ratio Scales
Scales of Measurement
Example: Melissa’s college record shows 36 credit hours earned, while Kevin’s record shows 72 credit hours earned. Kevin has twice as many credit hours earned as Melissa.
Example: Melissa’s college record shows 36 credit hours earned, while Kevin’s record shows 72 credit hours earned. Kevin has twice as many credit hours earned as Melissa.
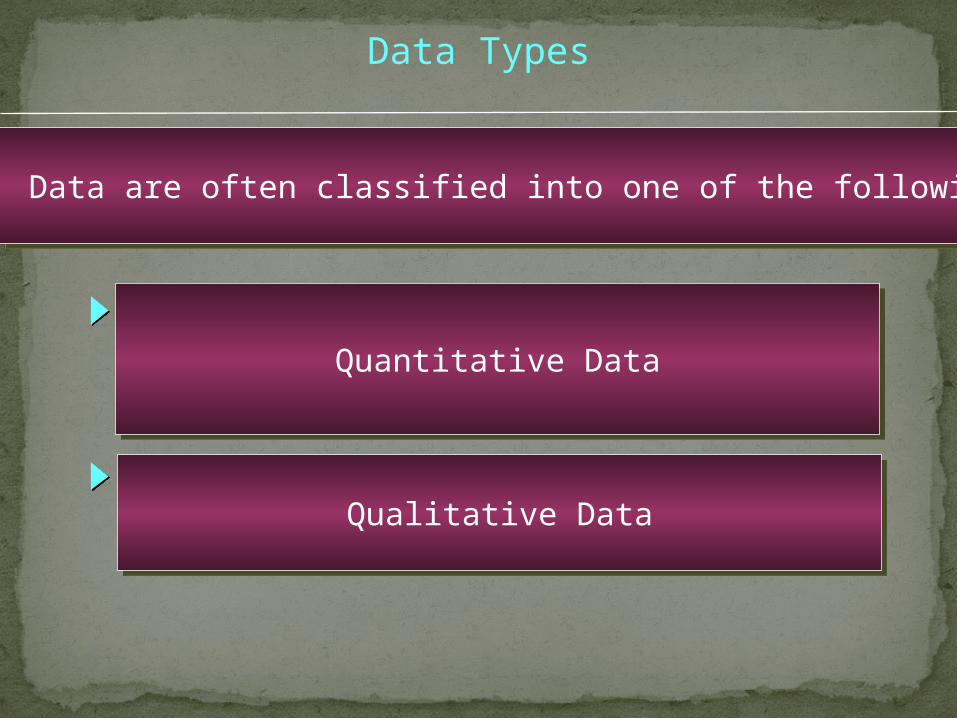
Data are often classified into one of the following two categories Data are often classified into one of the following two categories
Quantitative DataQuantitative Data
Qualitative DataQualitative Data
Data Types
The statistical analysis that is appropriate depends on whether the data for the variable are qualitative or quantitative.
The statistical analysis that is appropriate depends on whether the data for the variable are qualitative or quantitative.
In general, there are more alternatives for statistical analysis when the data are quantitative. In general, there are more alternatives for statistical analysis when the data are quantitative.
Qualitative and Quantitative Data

Features of Qualitative Data
Labels or names are used to identify an attribute of each element Labels or names are used to identify an attribute of each element
Often referred to as categorical data Often referred to as categorical data
Use either the nominal or ordinal scale of measurement Use either the nominal or ordinal scale of measurement
Can be either numeric or nonnumeric Can be either numeric or nonnumeric
Appropriate statistical analyses are rather limited Appropriate statistical analyses are rather limited

Features of Quantitative Data
Quantitative data indicate how many or how much: Quantitative data indicate how many or how much:
discrete, if measuring how many discrete, if measuring how many
continuous, if measuring how much continuous, if measuring how much
Quantitative data are always numeric. Quantitative data are always numeric.
Ordinary arithmetic operations are meaningful for quantitative data. Ordinary arithmetic operations are meaningful for quantitative data.

Data and Scales of Measurement: Summary
QualitativeQualitative Quantitative
Quantitative
NumericalNumerical NumericalNumericalNonnumericalNonnumerical
DataData
NominalNominal
OrdinalOrdinal
NominalNominal OrdinalOrdinal IntervalInterval RatioRatio

Data Arrangements
Three Basic Ones

1. Cross-Sectional Data
Cross-sectional data are collected at the same or approximately the same point in time over a range of different subjects.
Cross-sectional data are collected at the same or approximately the same point in time over a range of different subjects.
Example: data detailing the number of building permits issued in a given year in each of the counties of Minnesota
Example: data detailing the number of building permits issued in a given year in each of the counties of Minnesota

2. Time Series Data
Time series data are collected over several time periods. Time series data are collected over several time periods.
Example: data detailing the number of building permits issued in a given country of Minnesota during each of the last 5 years
Example: data detailing the number of building permits issued in a given country of Minnesota during each of the last 5 years

3. Panel (Longitudinal) Data
Panel (longitudinal) data are data collected over the same set of several Subjects for several time periods. Panel (longitudinal) data are data collected over the same set of several Subjects for several time periods.
Example: data detailing the number of building permits issued in each county in the state of Minnesota over the last 36 years
Example: data detailing the number of building permits issued in each county in the state of Minnesota over the last 36 years

Existing Sources (Secondary Sources)
Data Sources
Within a firm – almost any department
Business database services – Dow Jones & Co.
Government agencies - U.S. Department of Labor
Industry associations – Travel Industry Association of America
Special-interest organizations – Graduate Management Admission Council
Internet – more and more firms
Statistical Studies (Primary Sources)
Data Sources
In experimental studies the variables of interestare first identified. Then one or more factors arecontrolled so that data can be obtained about howthe factors influence the variables.
In experimental studies the variables of interestare first identified. Then one or more factors arecontrolled so that data can be obtained about howthe factors influence the variables.
In observational (non-experimental) studies no attempt is made to control or influence the variables of interest.
In observational (non-experimental) studies no attempt is made to control or influence the variables of interest.
a survey is agood
example

Important Considerations for Selecting Data Sources
Time Requirement
Cost of Acquisition
Data Errors
• Searching for information can be time consuming.• Information may no longer be useful by the time it
is available.
• Organizations often charge for information even when it is not their primary business activity.
• Using any data that happens to be available or that were acquired with little care can lead to poor and misleading information.

Data are acquired! What Next?
Extracting the Information Contained in the Data.
How Can we extract the information content of a data?

Three different methods:
1. Tabular Methods, 2. Graphical Methods,3. Numerical Methods
By Organizing/Summarizing the Data

Example: Hudson Auto Repair
The manager of Hudson Autowould like to have a betterunderstanding of the COST of PARTS used in the enginetune-ups performed at theshop.
She randomly selects 50 customer invoices for which tune-ups were performed.
Data in the following table refers to the costs of parts, rounded to the nearest dollar.

91 78 93 57 75 52 99 80 97 6271 69 72 89 66 75 79 75 72 76104 74 62 68 97 105 77 65 80 10985 97 88 68 83 68 71 69 67 7462 82 98 101 79 105 79 69 62 73
Example: Hudson Auto Repair
Sample of Parts Cost for 50 Tune-ups
The data presented here contains the information the manger needs, but is not in a usable format. The information content of the data needs to be extracted. How?

Tabular Summary: Frequency and Percent Frequency
50-59 60-69 70-79 80-89 90-99 100-109
2 13 16 7 7 5 50
4 26 32 14 14 10 100
(2/50)X100
Parts Cost ($)
Parts Frequency
PercentFrequency

Graphical Summary: Histogram
22
44
66
88
1010
1212
1414
1616
1818
PartsCost ($) PartsCost ($)
Fre
qu
en
cy
Fre
qu
en
cy
50-59 60-69 70-79 80-89 90-99 100-11050-59 60-69 70-79 80-89 90-99 100-110
Tune-up Parts Cost

Numerical Descriptive Statistics
Hudson’s average cost of parts, based on the 50 tune-ups studied, is $79 (found by summing the 50 cost values and then dividing by 50).
The most common numerical descriptive statistic is the average (or mean).

Statistical Inference
- the process of using data obtained from a sample to make estimates and test hypotheses about the characteristics of a population
What do we do with InformationExtracted from data?

Process of Statistical Inference
1.Population (All tune-ups). Average
cost of parts isunknown.
2. Sample (of 50engine tune-ups
is examined.)
3. The sample data Provides an average
parts costof $79 per tune-up.
4. The sample averageis used to make inference
about the population average.

Computers and Statistical Analysis

Computers and Statistical Analysis Statistical analysis often involves working with large amounts of data.
Computer software is typically used to conduct the analysis.
Statistical software packages such as Microsoft Excel and Minitab are capable of data management, analysis, and presentation.
Instructions for using Excel in chapter appendices.