2 - Guias Internacionales Est R y R - E. Tulcanaza - CRIRSCO

I N V E S T O R D A Y 2 6 F E B R U A R Y 2 0 2 1

Disclaimer
2
Statements in this presentation describing the objectives, projections, estimates and expectations of Jaguar Land Rover Automotive plc and its direct and indirect subsidiaries (the “Company”, “Group” or “JLR”) may be “forward-looking statements” within the meaning of applicable securities laws and regulations. Actual results could differ materially from those expressed or implied. Important factors that could make a difference to the Company’s operations include, among others, economic conditions affecting demand / supply and price conditions in the domestic and overseas markets in which the Company operates, the effects of the COVID-19 pandemic, changes in Government regulations, tax laws and other statutes and incidental factors. All forward-looking statements apply only as of the date hereof and we undertake no obligation to updated this information and do not assume any responsibility for the ultimate fairness, accuracy, correctness or completeness of any such information presented herein.
- Q1 represents the 3 month period from 1 April to 30 June- Q2 represents the 3 month period from 1 July to 30 September- Q3 represents the 3 month period from 1 October to 31 December- Q4 represents the 3 month period from 1 January to 31 March- FY represents the 12 month period from 1 April to 31 March of the following year
Unless stated otherwise sales volumes are expressed in thousand units, financial values are in GBP millions.
Consolidated results of Jaguar Land Rover Automotive plc and its subsidiaries contained in the presentation are unaudited and presented under IFRS as approved in the EU.
Retail volume data includes sales from the Company’s unconsolidated Chinese joint venture (“CJLR”), these are excluded from Wholesale volume data.
EBITDA is defined as profit before: income tax expense; exceptional items; finance expense (net of capitalised interest) and finance income; gains/losses on debt and unrealised derivatives, realised derivatives entered into for the purpose of hedging debt, and equity or debt investments held at fair value; foreign exchange gains/losses on other assets and liabilities, including short-term deposits and cash and cash equivalents; share of profit/loss from equity accounted investments; depreciation and amortisation.
EBIT is defined as EBITDA but including share of profit/loss from equity accounted investments, depreciation and amortisation.
Free cash flow is defined as net cash generated from operating activities less net cash used in automotive investing activities, excluding investments in consolidated entities and movements in financial investments, and after finance expenses and fees paid.
Certain analysis undertaken and represented in this document may constitute an estimate from the Company and may differ from the actual underlying results.
The information contained in his presentation is provided as of the date of this presentation and is subject to change without notice. The information contained in this document may be updated, completed, revised and amended and such information may change materially in the future. The Group is under no obligation to update or keep current the information contained in this document.

3

Agenda
T O P I C S T A R T T I M EP R E S E N T E R D U R A T I O N
Welcome 12.001. 5 minsBennett BirgbauerG R O U P T R E A S U R E R
Thierry BolloréC H I E F E X E C U T I V E O F F I C E R
Introduction2. 12.05 5 mins
Prof. Gerry McGovern OBEC H I E F C R E A T I V E O F F I C E R
Modern Luxury by Design3. 12.10 15 mins
Reimagine4. 12.25 30 minsThierry BolloréC H I E F E X E C U T I V E O F F I C E R
Frank LudwigC H I E F T R A N S F O R M A T I O N O F F I C E R
Refocus transformation5. 12.55 15 mins
Financial Outlook 13.10Adrian MardellC H I E F F I N A N C I A L O F F I C E R
6. 30 mins
Short Break 13.40- 10 mins
13.50 60 minsQ & A Session All Presenters7.
4

Thierry Bolloré
Chief Executive Officer
5

Land Rover Series I 1948 Land Rover Defender 90 2020
Two iconic aspirational brandsStrong heritage, modern desirable luxury products
6
Jaguar E-Type Series 1 Roadster 1967 Jaguar F-TYPE 2020

The creator of the world’s most desirable luxury
vehicles for the most discerning of customers
7

8

Three Pillar Strategy
9
D E S I G N
E N G I N E E R I N GI N T E G R I T Y
R E F I N E M E N T
V E R S A T I L I T Y
D U R A B I L I T Y
- D E S I G N A N D C A P A B I L I T Y -
O U R U N I Q U E A N D C O M P E L L I N G C O M B I N A T I O N
L E A D E R S H I P
R A N G E R O V E R D I S C O V E R Y D E F E N D E R
L E A D E R S H I P
L E A D E R S H I P
L E A D E R S H I P
L E A D E R S H I P
L E A D E R S H I P
L E A D E R S H I P
L E A D E R S H I P
L E A D E R S H I P

Land Rover brand attributesWorld’s most luxurious SUVs
10
C O N S I D E R E D
L I G H T W E I G H T
I N N O V A T I V E
S O P H I S T I C A T E D
S U S T A I N A B I L I T Y
E M O T I O N A L L Y E N G A G I N G
P E E R L E S S C H A R A C T E R
E L E V A T I O N O F T H E S P I R I T
D E L I G H T F U L
D E S I R A B I L I T Y
I N T U I T I V E
R E F I N E D
S A N C T U A R Y
S E N S E O F O C C A S I O N
R E L E V A N C E
A E S T H E T I C G R A C E
R E D U C T I V E
H O N E S T
C H A R M
M O D E R N I T Y
L A N D R O V E R F O U R K E Y E L E M E N T S
This will deliver a whole new character of vehicles

Compelling & Desirable Portfolio
11

12
V I S C E R A L
F I R S T G L A N C E D E S I R E
B E H A V I O U R A L
J O U R N E Y A N D E X P E R I E N C E
R E F L E C T I V E
U N W A V E R I N G A D V O C A C Y
Emotional Connection

13

Jaguar Vision
14
1. Modernise & reimagine Jaguar in the luxury space
2. Target wealthier, younger, urban, creatively minded group
3. Deliver experiences that create emotional engagement
4. All-electric cars from 2025
5. Customer service focus

Jaguar brand attributesRenaissance to emerge as a pure electric brand from 2025
15
A L L U R I N G
H U M A N
P H Y S I C A L
I N G E N I O U S
C O N N E C T E D
A R T
L U X U R I O U S
S P I R I T E D
C R A F T E D
A S P I R A T I O N A L
D I V E R S E
C R E A T I V E
D R A M A T I C
D I S T I N C T I V E
E X U B E R A N T
P U R E
R E F I N E D
S O P H I S T I C A T E D
D E S I R A B L E
M O D E R N
J A G U A R F O U R K E Y E L E M E N T S

16
M O D E R N L U X U R Y B Y D E S I G N

Jaguar Land Rover’s Reimagine Strategy
17
Brands - Responsible modern luxury by design
Products - World’s most desirable luxury cars and services
Architectures & Powertrain - Electrified, simplified, flexible
Collaboration - Synergies with Tata and other partnerships
Footprint - Retain, rightsize, repurpose and reorganise
Refocus - Focus on quality, sales, costs, digital transformation

The Reimagine strategy has been designed to address the key challenges facing the business
18
E X T E R N A L C H A L L E N G E S I N T E R N A L C H A L L E N G E S
Covid-19
Brexit
Emissions compliance
Electrification
Jaguar performance
High operating leverage & high variable costs
Product range proliferation & launch congestion
Quality / warranty cost
Supply chainForeign exchange
Supply disruptions

Reimagine is targeting faster growing luxury segments
0.5%
2.2%
2.8%
Total industryVolumes
CurrentSegments
ReimagineSegments
Source: IHS December 2020* JLR Reimagine segments include SUV 3-5 and other future Jaguar target segments
1.6%
(0.5%)(0.2%)
(0.4%)
0.9%
5.8%
1.4% 1.1%
1.4%
2.3%
China NorthAmerica
UK Europe Overseas
G L O B A L C A G R F Y 1 9 - 2 7 R E G I O N A L C A G R F Y 1 9 - 2 7
19

Reimagine will focus on increasing share in these most profitable segments
FY21
12% 18%
7% 15%
2% 1%
9% 16%T O T A L
M A R K E T S H A R E FY26
STRONGEST PROFITABILITY CARS
e.g. Range Rover
STRONG PROFITABILITY CARS*
e.g. Velar
LOWER PROFITABILITY CARS
e.g. XE
New modern luxury cars expected to drive growth in these segments
* Enhanced by introduction of EMA products and Discovery Sport entering segment
20

Significant opportunity to grow share of our more profitable products in China, UK and Europe
CHINA
FY21 → FY26 MARKET SHARE
UK EUROPE N. AMERICA OVERSEAS
3% → 12%
11% → 15%
36% → 58%
45% → 45%
11% → 21%
14% → 27%
7% → 8%
9% → 13%
9% → 15%
10% → 21%STRONGEST
PROFITABILITY CARSe.g. Range Rover
STRONG PROFITABILITY CARS*
e.g. Velar
* Enhanced by introduction of EMA products and Discovery Sport entering segment
21

Phase out of pure ICE variants by FY26, with total BEV mix rising to over 60% by FY30
3%
3%
J L R E V M I X
30%
10%
60%
FY30
73%
21%
65%
15%
20%
FY20 FY26
ICE MHEV / HEV PHEV BEV
22

Future Land Rover ShowroomDelivering modern luxury through its 3 families - 6 BEV variants in the next five years
23
Evoque
SUV4
SUV3
SUV5
Range Rover Sport
Range Rover
Defender
Discovery
Discovery Sport
Velar
DEFENDER DISCOVERY RANGE ROVER

Architectures to be rationalised with 3 new electric first architecturesWith range of electric options for both brands
– Modular Longitudinal Architecture– Electrified ICE and BEV propulsion
flexibility– Includes Range Rover, Range
Rover Sport– From FY22/FY23
MLA
Flex
– Electrified Modular Architecture– BEV native architecture– Additional electrified compact ICE – Includes Evoque, Discovery Sport– From 2024
EMA Native
BEV
L E G A C Y
D7u
PTA
D7a
D7e
D6a
D7x
– BEV only platform– Dedicated for Jaguar– From 2025
Pure
BEV
24

Modular Longitudinal Architecture (MLA) - Flexible Propulsion PlatformBEV and Electrified ICE for our large SUVs
25
MHEV > HEV
Electrified ICE
PHEV
New Range Rover SportThe most capable and dynamic sports SUV
New Range RoverThe most capable and refined
Land Rover ever
BEV

Electrified Modular Architecture (EMA) - Native BEV Architecture
26
– Engineered around the battery: the highest value commodity
– Simple body structure
– JLR engineered EDUs delivering 92% efficiency, enabling 4-4.5 miles / kWh
– JLR domain based electrical vehicle architecture: Always on, Always connected, Always up-to-date
Engineered with simplicity at its heart
Native BEV architecture -agnostic to cell chemistry
Flat floor, maximising cabin space
Future-proofed technology to deliver best in class performance

EMA – integrated electrified compact internal combustion engine optionsModern duality for mid and smaller SUVs
27
… A N D S I G N I F I C A N T C O S T S A V I N G S
– Rationalising multiple internal combustion engines to one simplified electrified compact ICE
– Eliminating diesel and costly after-treatment systems
H Y B R I D & P L U G I N H Y B R I D D E L I V E R I N G P E R F O R M A N C E , E F F I C I E N C Y & C O N V E N I E N C E …
– Electrified compact ICE propulsion systems with lean burn technology
– Enabling superior performance
H E V P H E V

Jaguar pure BEV - dedicated architecture
28
A D E S I G N L E D S O L U T I O N
M O D E R N L U X U R Y B Y D E S I G N
A L L U R I N G
H U M A N
P H Y S I C A L
I N G E N I O U S
C O N N E C T E D
A R T
L U X U R I O U S
S P I R I T E D
C R A F T E D
A S P I R A T I O N A L
D I V E R S E
C R E A T I V E
D R A M A T I C
D I S T I N C T I V E
E X U B E R A N T
P U R E
R E F I N E D
S O P H I S T I C A T E D
D E S I R A B L E
M O D E R N

Electrified vehicle technology
ELECTRIC DRIVE UNITSFUTURED BATTERIES HYDROGEN TECHNOLOGY
– Hydrogen fuel cell electric vehicles provide a lighter propulsion system, making them suitable for large SUVs
– Leveraging hydrogen fuel cells as range extender technology for advanced electric propulsion
– Future-proofed battery pack - agnostic to cell chemistry
– Fully integrated power electronics
– JLR in-house software development for battery control module, enabling system optimisation
– JLR designed and engineered efficient EDUs, for best in class performance
– Most torque dense in class
– 800V capable, coupled with state-of-the-art inverters
29

Jaguar Land Rover’s Electrical Vehicle Architecture continuumAlways on, Always connected, Always up-to-date
DOMAIN BASED ARCHITECTURE, ENABLING LATEST TECHNOLOGY
SIMPLIFICATION, ENABLING COST & WEIGHT OPTIMISATION
– State-of-the-art, domain based Electrical Vehicle Architecture with Ethernet backbone
– Software and Features Over-The-Air
– L2, L2+ and L4 ADAS capability
– V2X capability
– Off-board data management for predictive maintenance and prognostics
– JLR in-house engineered electrical distribution system enables significant cost and weight optimisation
– Domain based Electrical Vehicle Architecture enables consolidation and reduction of ECUs
– Hardware complexity reduction enables streamlining of full value chain
30

New MLA, EMA and pure-BEV architectures deliver c.80% of total Jaguar Land Rover volume by FY27
FY22 FY23 FY24 FY25 FY26 FY27 FY28 FY29
MLA
EMA
Jaguar pure-BEV
D7x
D7a
D7u
PTA
D6a & D7e100%
Sales

Reimagine electrification timelineFast electrification across models and new architecture roll out
32
1st BEV & new EMA
architecture introduced
2024 20392025 2026 2030
1st new Jaguar BEV on new
dedicated architecture
Total of 6 BEVs
BEV available on all models
60%sales BEV
2036
100% sales zero tailpipe emission
vehicles
2022
MLA architecture introduced
100%sales BEV
Net-zero carbon
emissions
2021

JLR has established a strong partnership ecosystemSupports a strong foundation of technology, knowledge and global reach
N E X T G E N E R A T I O N C Y B E R S E C U R I T Y
C H I N A C O N S U M E R T E C H N O L O G Y
E V S E R V I C E S & N E X T G E N E R A T I O N T E C H N O L O G I E S
F U T U R E M O B I L I T Y & A U T O N O M Y
F U T U R E D I G I T A L C U S T O M E R S E R V I C E S
L4 Urban Self-Driving Systems & Technology
Strategic EV Infrastructure Partner – UK Market
Collaboration on new digital-first platform for frictionless end-to-end services for customers
Strategic EV Infrastructure Partner – US Market
Latest real-time 3D navigation developed with AMAP from Alibaba
World 1st high-power (50KWh) wireless charging technology on I-PACE fleet
“Road Book” innovations & tech
Smart Parking Function collaboration featured in New Defender for China Market
Strategic EV Infrastructure Partner – UK Market
Long-term collaboration for vehicle cybersecurity, AI and ML for maintenance & threat prevention
(FutureMove)
33
TM’s and Brands owned or licensed by the respective entities named

Focused, data-driven collaborations with global industry leaders
B E Y O N D T A T A G R O U P . . .
Broaden value potential of wider Tata Group
Establish a broader, global data-driven ecosystem in key target areas:
MOTORS
TECHNOLOGIES COMMUNICATIONS
CONSULTANCY SERVICES
W I T H I N T A T A G R O U P
Form new models of partnership focused on mutual value creation across products, services & data
ADASNEXT-GEN
BATTERIES ENERGY SYSTEMS VEHICLE
ARCHITECTURESCONNECTIVITY
34
SERVICES
Future partnerships to enhance competencies, optimise capital allocation & speed to market

Our services strategy is underpinned by our established InMotion activities and expanding with digital offerings. This will be core to the future of Jaguar
Services strategy based on expanding from vehicle focused core to adjacent services to disruptive innovations
- Flexible car subscription service
- FY21 - UK growth 750%
- FY22 - global expansion
- Direct customer relationships
- On demand access; 5-star service
- FY21 - growth 23% despite CV19
- FY22 - global expansion
- Direct customer relationships
- Fund investing in early-stage technology, providing insights
V e n t u r e s
VEHICLE VEHICLE+ ADJACENT DISRUPTIVE
Integrated Data Platform & Digital First ApplicationsServices approach underpinned by digital and data with collaborations and platform integration to optimise customer offerings
FOTA / SOTA Financial bundling Curated digital media
Integrated MyJLR app Payment platforms Tailored brand experiences
35

Efficiency of focusRight-sized footprint and a single-minded, collaborative culture
60%
80%
100%
FY22 FY23 FY24 FY25 FY26 FY27
Global 2-shift capacity
Utilisation
M A N U F A C T U R I N G C A P A C I T YR E D U C T I O N O F 2 5 % O V E R 5 Y E A R S
C L A R I T Y O F P U R P O S E
Rationalise non-manufacturing facilities
Consolidation of UK warehouses£20m p.a. cost saving
50+ leases exited globally£18.5m p.a. cost saving
Exploring further opportunities
Flatter organisation
Trust and empower our peopleto deliver at speed
Resized, more agile businessStructured to succeed
36

Plan for CO2 compliance
37
2019 2020 2021 2022 2023 2024-29
✓£35m
Fines
✓ ✓ ✓ ✓
✓ ✓ ✓ ✓
✓ ✓ ✓ ✓ ✓ ✓
✓ ✓ ✓ ✓ ✓ ✓

Net Zero carbon emissions by 2039A sustainability rich reimagination of modern luxury
38
BEVs on all models by 2030 - Zero tailpipe emissions by 2036
Clean Hydrogen fuel cell test mules
Responsible sourcing
Reduction on operational CO2
N e t z e r o c a r b o n e m i s s i o n s b y 2 0 3 9a c r o s s o u r s u p p l y c h a i n , p r o d u c t p o r t f o l i o a n d o p e r a t i o n a l f o o t p r i n t
E n v i r o n m e n t a l S o c i a l G o v e r n a n c e

Frank Ludwig
Chief Transformation Officer
39

40
Refocus brings together existing and additional activity from across the organisation to deliver value, address pain points and find efficiencies
TRANSFORMATION OFFICE
QUALITYPROGRAMME
DELIVERY & PERFORMANCE
DELIVERED COST PER CAR
END-TO-END SUPPLY CHAIN
CUSTOMER & MARKET
PERFORMANCECHINA
1 2 3 4 65
Reduced warranty spend
Efficient programme delivery
Reduction in vehicle cost
Faster vehicle delivery times
Increased profitable market
share
Increased profitable market
share
AGILE ORGANISATION & CULTURE
Agile Organisation, Leadership, Capability, Culture
7
INDIGITAL
Powering the transformation
8
CHARGE+
Sustaining and increasing cost efficiency
9

Refocus builds on the success of Charge+ and is driven directly by the CEO
– Builds on success of Charge+
– Clear ownership, goals & tracking
– Cross-functional work at all levels
– Driven directly by CEO
– Cross-functional mentorship
– Enabled by InDigital
– Chief Transformation Officer reporting to CEO
– 35 workstreams launched, e.g.
– Strengthened China, Programme Delivery &Quality functions
– Agile in-car software delivery method
– Digital Lighthouse projects inflight
– Creation of InDigital as Centre of Excellence
Progress so far...
Continuing what works well...
+ New & different elements
Strong momentum built since initiation of Refocus programme in January...
41

InDigital is the central engine for delivering digital initiatives, enabled by IT, with prioritisation driven by the Refocus pillars
– Harnessing capability which has already enabled Charge+ savings, e.g. 100 person analytics and intelligent automation Centre of Excellence delivering >£150m p.a.
– Scaling up capability to underpin Refocus value creation
– Leveraging data and working in an agile way
– IT approach & required digital capability driven by Refocus
Transformation Office
InDigital
42

Refocus will deliver 3% incremental EBIT in our journey to double-digit margins
We have stabilised the business to provide a profitable core,
delivering 4% EBIT margin and break-even cashflow
Refocus will drive and underpin further profitabilityToday
Within 3 years, £2bn of value
Within 5 years, £4bn of value
3% incremental EBIT margin by FY26
43

F I N A N C I A L O U T L O O K
Adrian Mardell
Chief Financial Officer
44

Reimagine will enable JLR to achieve its financial potential
45
– Encouraging turnaround from weak FY19, despite Covid
– £6b of cash and profit improvements from Project Charge
– Significant improvement in China business and quality of sales
– Breakeven reduced from c. 600k units to c. 400k units
– Recent underlying EBIT margin of c. 4%
– Modern luxury by design
– Investment target c. £2.5b p.a.
– Positive cashflow from FY23
– Net cash from FY25
– Double-digit EBIT by FY26
– One-time non-cash write down of c.£1b; cash restructuring of c.£0.5b
R E I M A G I N E W I L L D E L I V E RW E H A V E D E L I V E R E D
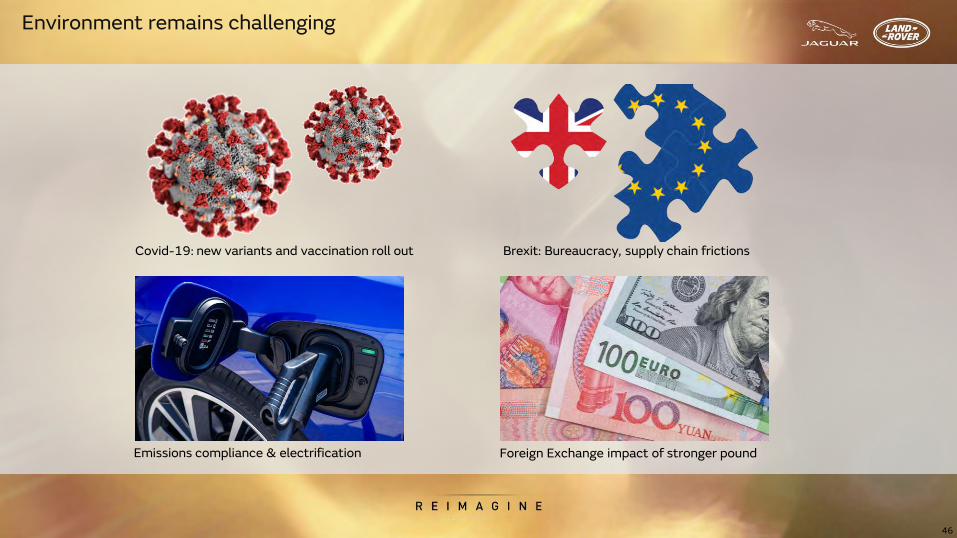
Environment remains challenging
46
Brexit: Bureaucracy, supply chain frictions Covid-19: new variants and vaccination roll out
Emissions compliance & electrification Foreign Exchange impact of stronger pound

JLR turnaround plan deliversCharge+, China and COVID sales recovery driving improvement
47
(1,746)
(604)(415)
1,469
(816)
(43) (5)105
(1,570)
463 562
Q1FY19
Q2FY19
Q3FY19
Q4FY19
Q1FY20
Q2FY20
Q3FY20
Q4FY20
Q1FY21
Q2FY21
Q3FY21
Free cash flow
(264) (90) (273) 269 (383) 166 318 (494) (413) 65 476PBT*
Start of Charge
China sales recovery COVID impact and recovery
(2.7)% (0.9)% (2.3)% 3.2% (4.8)% 4.5% 2.7% (3.2)% (13.6)% 0.3% 6.7%EBIT
IFRS, £m
* Excludes exceptional items

Lifetime Charge savings £6bDelivering cash and ongoing profit improvements
48
£2.7b
Investment savings
£1.0b
£2.0b
Cost & Profits improvements
Total Chargesavings by Q4 FY21
£5.7b
Working capital efficiencies
£0.2b
£0.2b
£0.4b
Forecast charge savings in Q4 FY21
Charge savings delivered to Q3 FY21
£6b

Significant China recovery from FY19 and CovidUnderpinned by improving quality of sales and dealer profitability
49
-17%-17%
-11%
FY19 FY20 FY21YTD
2.2
1.7
1.5
FY19 FY20 FY21YTD
72%
87%93%
FY19 FY20 FY21YTD
+ 35% - 32%
+ 30%
(0.4)%
(1.3)%
0.9%
CY 2019 FY20 FY21YTD
R E T A I L E R R E T U R N O N S A L E SL O C A L R E G I S T R A T I O N R A T E
R E T A I L E R S T O C K L E V E LS A L E S Q U A L I T Y
+ 2.2% points

Cash flow break-even reduced to c. 400k unitsTransformation supported by Charge and Refocus
50
425450
500550
575600
500
FY14 FY15 FY16 FY17 FY18 FY19 FY20 FY21 FY22
Units 000’s / £mils
Wholesales illustrated reflect approximate break-even levels
400 – 450k wholesales break-even range
Wholesales 471 509 535 545 508 565 476 Not guided Increasing Increasing
Cash flow £749 £502 £637 £(25) £(910) £(882) £(759) - - Positive
Sales growth, new models & capacity expansion
FY23 & Beyond
Breakeven Wholesales

3,433 3,649 3,772
3,413 3,276
2,514 2,535
FY14 FY15 FY16 FY17 FY18 FY19 FY20 FY21 FY22
Future cash flow to achieve net cash from FY25with investment significantly reduced to target £2.5b
51
£ mils
Operating cash flow before investment defined as free cash flow less total product & other investment (APM’s defined in our interim and annual reports)
Target c. £2,500
Operating cash flow before investment
Cash flow £749 £502 £637 £(25) £(910) £(882) £(759) - - Positive
Significant investment in new models and capacity expansion
FY23 & Beyond
Investment spending

One-time restructuring charges for ReimagineIncluding c. £1b non-cash write-off of prior investments
52
FY22 Cash flow
Non-cash asset write-offs
Reorganisation costs
Q4 FY21 Income statement
c. £1b
Total impact
c. £0.5b
c. £1.5b
c. £0.5b
-
c. £0.5b
– Exceptional one-time non-cash write down of c. £1 billion for higher previous spending and certain planned products that will not be completed
– Reflects more focused product portfolio under Reimagine and reduction in annual spending to about £2.5 billion
– c. £0.5b cash restructuring cost expected to be offset by positive free cash flow in FY22
– Lower D&A charge of c. £150m per annum will improve EBIT margin by c. 0.5%
Note: The financial impact above is an estimate and will be subject to our year-end accounting processes

Targeting ≥10% EBIT margin by FY26Driven by Refocus and Reimagine architecture strategy
53
For illustrative purposes only - not to scale
Expect >6% margin improvement (3% from Refocus and ≥3% from new architectures)
H2 FY21 From FY26FY23 FY25 FY26FY22 FY24
Quality of sales
MLA
EMA
Jaguar BEVEBIT
≥10%
New architectures
UnderlyingEBIT c.4%

Sales volume and financial targetsSales, profits and cash flow improving
54
FY26Key metrics FY21 FY22
*Excluding exceptionals
Revenue Not guided Increasing > £30bIncreasing
Net cash / (Net debt) Negative Negative Positive0
EBIT margin Positive ≥10%≥4%
Positive PBT* throughout
≥7%
Free cash flow Near break-even PositiveBreak-evenAfter ~£500m restructuring costs
Positive
Investment < £2.5b c. £2.5b c. £3bc. £2.5b
FY24

Strong liquidity profile£6.1b total liquidity pro-forma end December
55
4,196
-400 766 1,035
513900
366 476
4,457
235271
688 104586
1,884
500
1,935 undrawn RCF
1,935undrawn RCF
-
TotalLiquidity
CY21 CY22 CY23² CY24 CY25 CY26 CY27 CY28 TotalDebtBonds Bank facilities Leases (IFRS16)
D E B T M A T U R I T Y P R O F I L E
IFRS, £m
1 Includes £3m undrawn portion of Fleet Buyback facility2 Includes RMB 5b 3-year syndicated revolving loan facility, subject to annual confirmatory review3 Includes £33m comprising £30m Fair Value adjustment, and £40m of other debt, partially offset by £37m of capitalised fees
Total gross debt pro-forma
6,8743
Total liquidity
pro-forma 6,1341

Sustainable profit growth; net cash from FY25Focused luxury portfolio and new architectures
56
IMPROVED PROFIT IMPROVED CASHFLOW NET CASHPRODUCTS
Target stronger capital structure, and maintain strong liquidity
– Modern luxury by design
– MLA flex platform
– EMA BEV first
– Jaguar Pure BEV
– Double-digit EBIT margin by FY26
– 3% contribution from Refocus and ≥3% from architectures
– Reduced D&A and organisation costs
– Break-even cashflow in FY21 and FY22 post restructuring
– Strong cash generation from FY23
– Investment c.£2.5b p.a.
– Net debt decreases significantly from FY23
– Net cash positive from FY25