i LAYOUT OPTIMIZATION AND MANNING RATIO...
25
i LAYOUT OPTIMIZATION AND MANNING RATIO IMPROVEMENT YEONG WENG HARN UNIVERSITI TEKNOLOGI MALAYSIA
Transcript of i LAYOUT OPTIMIZATION AND MANNING RATIO...

i
LAYOUT OPTIMIZATION AND MANNING RATIO
IMPROVEMENT
YEONG WENG HARN
UNIVERSITI TEKNOLOGI MALAYSIA

i
LAYOUT OPTIMIZATION AND MANNING RATIO IMPROVEMENT
YEONG WENG HARN
A project report submitted in partial fulfillment
of the requirements for the award of the degree of
Master of Engineering (Industrial)
FACULTY OF MECHANICAL ENGINEERING
UNIVERSITI TEKNOLOGI MALAYSIA
MAY 2010

iii
To my beloved mother and father

iv
ACKNOWLEDGEMENT
Most importantly, I would like to express my greatest gratitude to my
supervisor, Assoc. Prof Dr Abd Rahman Abdul Rahim . His professional guidance
and support has certainly succeeded in bringing out the best in me during the
completion of this project.
I would also like to thank the Industrial Engineering panel of the Faculty of
Mechanical Engineering, Universiti Teknologi Malaysia for the fullest co -operation
in providing the necessary resourc es in completing this proj ect. My special thanks
goes to Prof Dr. Sha’ri bin Mohd. Yusof and Assoc . Prof Dr. Masine binti Md. Tap
for being the coordinators of the offshore Masters in IE program in Penang.
Last but not least, I would like to thank my beloved parents, Yeong Soon
Wooi and Lau Lai Chee for being the cheerleaders in my life. Not forgetting too are
colleagues of mine who have always been my source of encouragement. Thanks to
all of you.
v
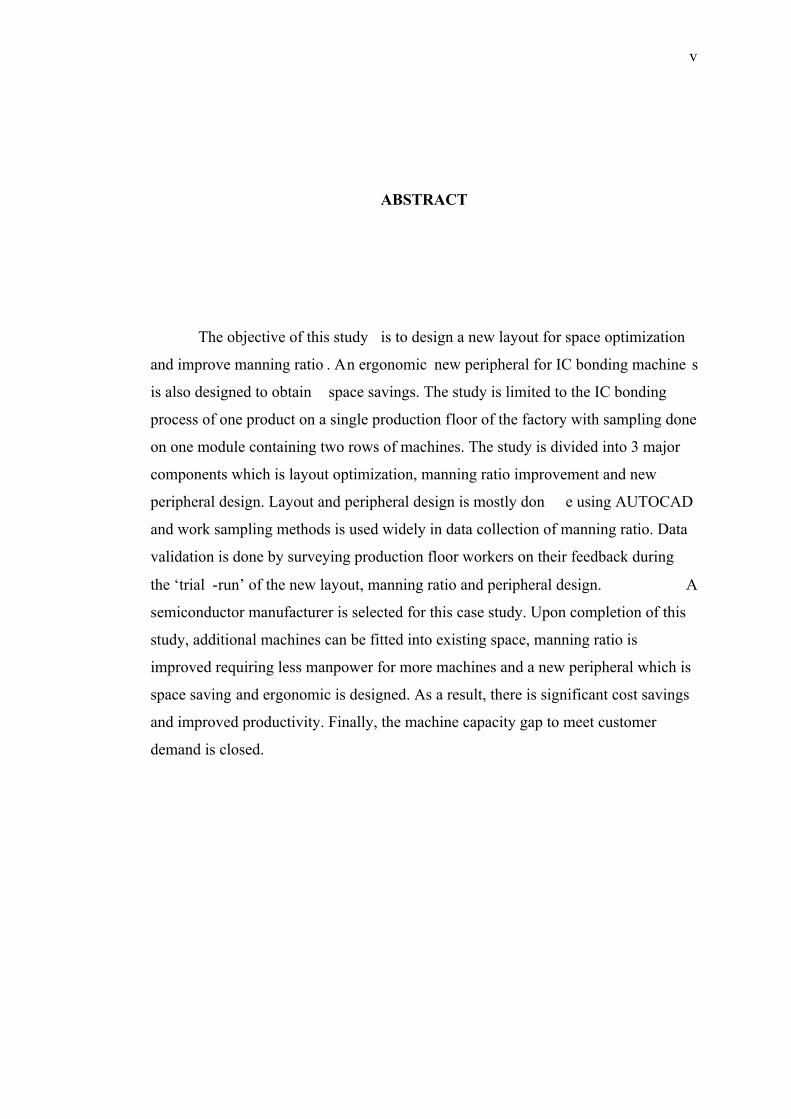
ABSTRACT
The objective of this study is to design a new layout for space optimization
and improve manning ratio . An ergonomic new peripheral for IC bonding machine s
is also designed to obtain space savings. The study is limited to the IC bonding
process of one product on a single production floor of the factory with sampling done
on one module containing two rows of machines. The study is divided into 3 major
components which is layout optimization, manning ratio improvement and new
peripheral design. Layout and peripheral design is mostly don e using AUTOCAD
and work sampling methods is used widely in data collection of manning ratio. Data
validation is done by surveying production floor workers on their feedback during
the ‘trial -run’ of the new layout, manning ratio and peripheral design. A
semiconductor manufacturer is selected for this case study. Upon completion of this
study, additional machines can be fitted into existing space, manning ratio is
improved requiring less manpower for more machines and a new peripheral which is
space saving and ergonomic is designed. As a result, there is significant cost savings
and improved productivity. Finally, the machine capacity gap to meet customer
demand is closed.

vi
ABSTRAK
Objektif utama kajian ini adalah untuk menghasilkan susun at ur mesin yang
baru dengan tujuan untuk mengoptimumkan ruang dan mem pertingkatkan nisbah
kerja. Rekabentuk baru yang ergonomik juga akan dihasilkan untuk perkakas bagi
tujuan melengkapi pengoptimuman ruang . Kajian ini terhad kepada proses IC
bonding untuk s alah satu produk yang diproses di satu tingkat dalam kilang.
Sampling dijalankan untuk satu modul yang mengandungi dua baris mesin. Kajian
ini dibahagikan kepada 3 komponen utama iaitu optimisasi ruang, peningkatan
nisbah kerja dan rekabentuk perkakas baru . Kebanyakan kerja susun atur dan
rekabentuk perkakas dijalankan dengan AUTOCAD manakala kaedah work
sampling digunakan semasa mengumpul data nisbah kerja. Pengesahan data
dijalankan dengan cara temubual dengan pekerja -pekerja kilang untuk mengetahui
maklum balas mereka terhadap sesi trial-run yang dijalankan dengan susun atur,
nisbah kerja dan rekabentuk perkakas yang baru. Sebuah kilang pembuatan
semikonduktor dipilih untuk kajian ini. Setelah menghabiskan kajian ini, didapati
bahawa lebihan mesin boleh d imuatkan dalam ruang yang sedia ada, nisbah kerja
dipertingkatkan dan rekabentuk perkakas yang baru dan ergonomik berjaya
dihasilkan. Secara kesimpulan, kapasiti mesin berjaya ditambah bagi tujuan
memenuhi kehendak pelanggan.

vii
TABLE OF CONTENTS
CHAPTER TITLE PAGE
TITLE PAGE i
DECLARATION ii
DEDICATION iii
ACKNOWLEDGEMENT iv
ABSTRACT v
ABSTRAK vi
TABLE OF CONTENTS vii
LIST OF TABLES xi
LIST OF FIGURES xii
LIST OF ABBREVIATIONS xiv
LIST OF APPENDICES xv
1 INTRODUCTION
1.1 Introduction 1
1.2 Productivity Improvement 1
1.3 Background and Rationale of the Project 2
viii
1.4 Research Problems and Hypothesis 2
1.4.1 Research Problems 3
1.4.2 Research Questions 3
1.4.3 Research Hypothesis 3
1.5 Justification of Research 4
1.6 Methodology 4
1.7 Research Objectives 5
1.8 Scope and Key Assumptions 5
1.9 Definition of Terms 5
1.10 Research Contributions 9
1.11 Outline of the Report 9
1.12 Conclusion 10
2 LITERATURE REVIEW
2.1 Introduction 11
2.2 Productivity Improvement 11
2.3 Plant Layout 14
2.4 Ergonomics in Workstation Design 15
2.5 Cost Analysis 16
2.6 Lean Manufacturing 19
2.7 Methodology 20
2.7.1 Cause and Effect (Ishikawa) Diagram 21
2.7.2 Plant Layout Procedures 22
2.7.3 Work sampling 23
2.7.4 Cost Modeling 23
2.7.5 Survey Techniques 24
2.8 Conclusion 25

ix
3 METHODOLOGY
3.1 Introduction 26
3.2 Justification for the Methodology 26
3.3 Research Procedures 27
3.3.1 Data Collection 29
3.3.2 Data Analysis 30
3.3.3 Data Validation 35
3.4 Conclusion 36
4 DATA COLLECTION AND ANALYSIS
4.1 Introduction 37
4.2 Data Collection 37
4.2.1 Background 38
4.2.2 Data Collection 39
4.3 Data Analysis 44
4.3.1 Dependent and Independent Variables 44
4.3.2 Conceptual Model 46
4.3.3 Data Analysis 46
4.4 Problem Identification 68
4.5 Conclusion 69
5 PROPOSED SOLUTIONS AND ANALYSIS
5.1 Introduction 70

x
5.2 Proposed Solutions and Analysis 70
5.2.1 Layout Improvement 71
5.2.2 Manning Ratio Improvement 74
5.2.3 New Peripheral Design 75
5.2.4 Final Proposed Solution 75
5.3 Validation 78
5.4 Cost Analysis 79
5.5 Conclusion 84
6 CONCLUSIONS AND FUTURE WORKS
6.1 Introduction 85
6.2 Conclusion 85
6.3 Research Implications and Contributions 86
6.4 Limitations 86
6.5 Future Works 86
REFERENCES 88
APPENDIX A ~B 91

xi
LIST OF TABLES
TABLE NO. TITLE PAGE
4.3 Floor space utilization 40
4.4 AUTOCAD simulation data by varying slanted angle and
machine distance 41
4.5 Operator distribution on the production floor 41
4.6 Time studies data 42
4.13 AUTOCAD simulation data for different slanted angles 50
4.16 AUTOCAD simulation data for different machine distances 52
4.25 Summary of operator-machine relationship 62
5.12 Productivity improvement measurement 84

xii
LIST OF FIGURES
FIGURE NO. TITLE PAGE
1.1 Report outline 10
2.1 Cause and effect (Ishikawa) diagram guideline 21
2.2 Reed’s Plant Layout Procedure 22
3.1 Research procedures 28
3.2 Sampling design 29
3.3 Comparison tables and graphs 31
3.4 Data recorded in a work sampling sheet 32
3.5 Operator-machine efficiency 33
3.6 Operator task breakdown 34
4.1 Semiconductor manufacturing process 38
4.2 IC bonding machine layout 39
4.7 WIP storage peripheral measurement 43
4.8 Arrangement of components in the work cell 43
4.9 Cause and effect diagram 46
4.10 AUTOCAD drawing with module measurement 47
4.11 Aisle requirements on existing layout 48
4.12 Layout of different slanted angles 50
4.14 Relationship between machine distance and slanted angle 51
4.15 Layout of different machine distances 52
4.17 Relationship between machine distance and number
of machines per row 53
4.18 1: 10 manning ratio chart for SU operator task breakdown analysis 54

xiii
4.19 1: 10 manning ratio chart for BU operator task breakdown analysis 55
4.20 1: 13 manning ratio chart for SU operator task breakdown analysis 56
4.21 1: 13 manning ratio chart for BU operator task breakdown analysis 57
4.22 4: 51 manning ratio chart for SU operator task breakdown analysis 58
4.23 4: 51 manning ratio chart for BSU operator task breakdown analysis
59
4.24 4: 51 manning ratio charts for BU operator task breakdown analysis
60
4.26 Operator-machine efficiency chart at 1:10 manning ratio 63
4.27 Operator-machine efficiency chart at 1:13 manning ratio 64
4.28 Operator-machine efficiency chart at 4:51 manning ratio 65
4.29 Ergonomics guideline based on SEMI S8-0308 66
4.30 Similar peripheral design in sister plant 67
4.31 Current peripheral design 68
5.1 AUTOCAD drawing shows the most optimum slanted angle 72
5.2 AUTOCAD drawing shows the most optimum distance between
slanted machine 73
5.3 Average % idle time for manning ratios of 1:10 and 1:13 74
5.4 Linear graph relating % idle time with number of
machines/operator 74
5.5 Clearance requirement defined in the ergonomics guideline
based on SEMI S8-0308 75
5.6 New peripheral design 76
5.7 Comparison between before and after improvement 77
5.8 Cost structure by product 78
5.9 Unit cost calculation for product C 81
5.10 Assumptions used in cost model 82
5.11 Payback analysis 83

xiv
LIST OF ABBREVIATIONS
ABC Activity Based Costing
JIT Just-In-Time
MRP Material Requirements Planning
OEE Overall Equipment Effectiveness
PPH Parts Per Hour
SMED Single Minute Exchange of Dies
SQFT Square Feet
VSM Value Stream Mapping

xv
LIST OF APPENDICES
APPENDIX TITLE PAGE
A Summary of journal review 89
B Excerpt from SEMI S8-0308 95

1
CHAPTER 1
INTRODUCTION
1.1 Introduction
This chapter describes the introduction to this project by giving an overview
of the importance and focus of the research. An overall picture and broad idea of
project framework will be included in this chapter.
1.2 Productivity Improvement
One of the major roles of Industrial Engineering in a factory is to perform
space planning according to the expansion plans for new machines to add capacity to
the plant. More often than not, the Industrial Engineer can be challenged when there
is a limitation to the space on a production floor. Particularly for cases where a
certain production floor or area is designated for a specific product, space becomes
an issue of greater concern when the product volume expands beyond the designated
area.

2
When there is a mismatch between demand and capacity from the planning
systems, it is time for the Industrial Engineer to seek actions needed for productivity
improvement to close the capacity gaps in order to meet the demand of customers in
a timely manner. By understanding the factors contributing to productivity losses, an
Industrial Engineer can then work with the operations and engineering teams to
identify the opportunities based on existing problems on the production floor. When
space optimization can be obtained through improved layout and manning ratio,
these gains can be further achieved with the implementation of an ergonomic and
safe working environment.
1.3 Background and Rationale of the Project
To meet the 4Q09 demand, a minimum increase of 5% in production is
required to increase machine capacity. Without the machine capacity in-house, the
plant may suffer losses as capital and time is required to manufacture the production
units at subcontractor plants. If the production units are not manufactured on-time,
the company will also risk suffering from loss of goodwill and future business. To
eliminate these losses, the plant needs to add machine capacity by purchasing new
equipment. With the new machines, space and manning capabilities will then become
issues of concern.
1.4 Research Problems and Hypothesis

3
1.4.1 Research Problems
How productivity improvement can be gained through space optimization and
manning ratio enhancement by incorporating layout and ergonomics?
1.4.2 Research Questions
1. How can more space be made available to accommodate new machines for
increased capacity?
2. How can the same number of production operators be used to man increased
number of machines?
3. How can safety and ergonomics be maintained without creating an
overcrowded situation?
1.4.3 Research Hypothesis
Layout is identified as one of the opportunities for improvement as this factor
becomes a bottleneck when new machines which are purchased for additional
capacity have no place due to space constraints. Therefore, layout optimization needs
to be performed if productivity improvement is required to close capacity gaps. By
laying out machines closer to each other, limited production floor space can be
optimized to add more machines.

4
Besides space optimization, manning ratio improvement is also another factor
which can help productivity improvement if the plant intends to use the same number
of production operators to man an increased number of machines. The tasks of
operators need to be scrutinized to identify areas for improvement and waste to
eliminate.
When there are more machines added and compressed on the limited floor
space, safety and ergonomics issues arise.
1.5 Justification of Research
This study becomes critical as it forms the basis for management decision
after evaluating the possibilities to optimize the space on the production floor by
adding new machines. Through space optimization, the management can obtain
productivity gains and cost savings. On top of that, manning ratio can also be
improved.
1.6 Methodology
The study will be divided into 3 phases which is layout implementation,
manning ratio improvement and peripheral design to achieve the desired productivity
improvement. Data collection, analysis and validation are performed in all 3 phases
using selected methodology. The slanted layout method is used to optimize the
layout. To improve manning ratio, time studies is conducted. New peripheral design
is done to complement the layout optimization efforts.

5
1.7 Research Objectives
This study is done with the objective of gaining productivity improvement in
a semiconductor manufacturing facility through layout optimization and manning
ratio improvement. Productivity improvement must be gained without neglecting the
ergonomics and safety aspects of the working environment on the production floor.
1.8 Scope and Key Assumptions
This study is limited to a specific process of one product on a single
production floor of the factory. The focus of this study is not linked to other
processes related to this product. A sample of one module containing 2 rows of
machines will be used to represent the entire process area on this production floor.
Cost evaluation will not be included in this study.
1.9 Definition of Terms
The following terms will be used to explain the case study done in the project.

6
ABC. Activity Based Costing, a method which models the relationships between
products and the resources used in their production at all stages.
Balanced Plant. A plant where capacity of all resources are balanced exactly
with market demand.
Bottleneck. Any resource whose capacity is equal to, or less than the demand
placed on it.
JIT. Just-In-Time manufacturing. A “pull” approach where a work center finishes
its operations and then requests the next job from the preceding work center.
JIT-Kaizen. Facilitated small group activities to address problems with quality,
cost and delivery (QCD). Also known as process flow study.
Kaizen. Facilitated small group activities to address problems with quality,
cost and delivery (QCD).
MRP. Material Requirements Planning. A ‘push’ system which schedules
the jobs in advance for a series of work centers and each work center pushes its
completed jobs to the succeeding work centers.
Non-Value Added. Activities or actions taken that add no real value to the product
or service, making such activities or action a form of waste.
OEE. Overall equipment effectiveness.
7
Operations. Work or steps taken to transform material to finished product.
Problem Solving. Facilitated small group activities to address problems using a
structured format (PDCA) with a formal close-off for outcomes.
Process. The flow of material in time and space. The accumulation of sub-
processes, or operations that transform material from raw material to finished
products.
PPH. A metric that indicates the amount of parts produced within one hour.
PPH is a good indicator of process efficiency.
Quality. Meeting expectation and requirements, stated and un-stated, of the
customer.
Resource Utilization. Using a resource in a way that increases throughput
Standard Work. Specifying tasks to the best way to get the job done in the
amount of time available while ensuring the job is done right the first time, every
time.
Standard Operations. The documented most efficient, safe method of
completing a task in the required time.

8
SMED. (Single Minute Exchange of Dies). A technique to reduce the time
taken to change any process from the last good part of the last product to the first
good part of the new product.
Sub-Processes. A series of operations combined. part of a process
Task. A task means one or more elements that constitute a distinct activity
that is a logical and necessary step in the performance of work by an employee.
Tasks are the smallest elements of work job evaluation should address.
Throughput. The rate the system generates money through sales.
Value Added. Activities or actions taken that add real value to the product or
service.
Visible Management. Clear (to the eye) control of the workplace with regards
to output and inputs without having to ask questions to determine the status.
VSM. Value Stream Mapping, a time-based study of an entire process to
establish the ratio of value-adding time to non-value-added time.
Waste. Anything that uses resources, but does not add real value to the
product or service.
Yield. Produced product related to scheduled product

9
1.10 Research Contributions
At the end of the project, a feasible solution in terms of machine layout with
improved manning ratio and space optimization through new peripheral design is
anticipated to gain the required productivity to close the capacity gaps to meet
customer demands. Key deliverables throughout the project are completion of an
optimized layout design, new manning ratio plan and new peripheral design.
1.11 Outline of the Report
The project is divided into 6 main chapters. The report starts with Chapter 1 -
Introduction which provides an overall picture and framework of the project. Chapter
2 - Literature Review discusses the journals, books and articles which relates to the
theoretical background of this project. Methods applied in areas of data collection,
analysis and validation are further discussed in Chapter 3. Chapters 4 and 5 contain
the core of the research where details of data collection, analysis and problem
identification, proposed solutions for each problem and validation are elaborated.
Chapter 6 wraps up the project with conclusion and discussion of research
implication, contribution, limitation and proposal of future works.
An overview of the entire project by chapter breakdown is shown in the Figure
1.1.

10
Item Description Details
Chapter 1 Introduction Overall picture and framework of project
Chapter 2 Literature Review Theoretical background to project
Chapter 3 Methodology Discussion of methods employed in research
Chapter 4 Data Collection & Analysis Data collection & analysis and problem identification
Chapter 5 Proposed Solutions & Analysis Proposed solutions for each problem & Validation
Chapter 6 Conclusion & Future WorksConclusion, research implication & contribution, limitation and future works
Figure 1.1 Report outline
1.12 Conclusion
This chapter has described the overview and the key objectives of the project.
The background and rationale to complete the project has been outlined with
statement of research problems. The objectives of the project are further explained
with justifications and understanding of how the project can contribute to the
company. The project scope, key assumptions and the most commonly used terms
are described.