I Just Called, To Say, I Love You Innovations in the Phonathonmarquette.edu/jaa2016/presentations/I...
26
Jenny Cooke Smith, Senior Solutions Consultant, Target Analytics Sara Harvey, Managing Director for Annual Giving, Marquette Patrick McCarthy, Senior Advancement Officer, Annual Giving, Marquette I JUST CALLED, TO SAY, I LOVE YOU INNOVATION IN THE PHONATHON
Transcript of I Just Called, To Say, I Love You Innovations in the Phonathonmarquette.edu/jaa2016/presentations/I...
Jenny Cooke Smith, Senior Solutions Consultant, Target Analytics
Sara Harvey, Managing Director for Annual Giving, Marquette
Patrick McCarthy, Senior Advancement Officer, Annual Giving, Marquette
I JUST CALLED, TO SAY, I LOVE YOU
INNOVATION IN THE PHONATHON
Session Objectives
To create a network of colleagues dedicated to
improving and sustaining telemarketing
To learn more about the data behind telemarketing
performance
To introduce some innovations both at Marquette and
at other institutions
The State of Telemarketing
Data from Target Analytics’ donorCentrics™ benchmarking service
o Actual transactional data (plus some self-reported for fun)
o Cash, hard credit data from Alumni
o $50K gift cap
o Source data only as good as its coded
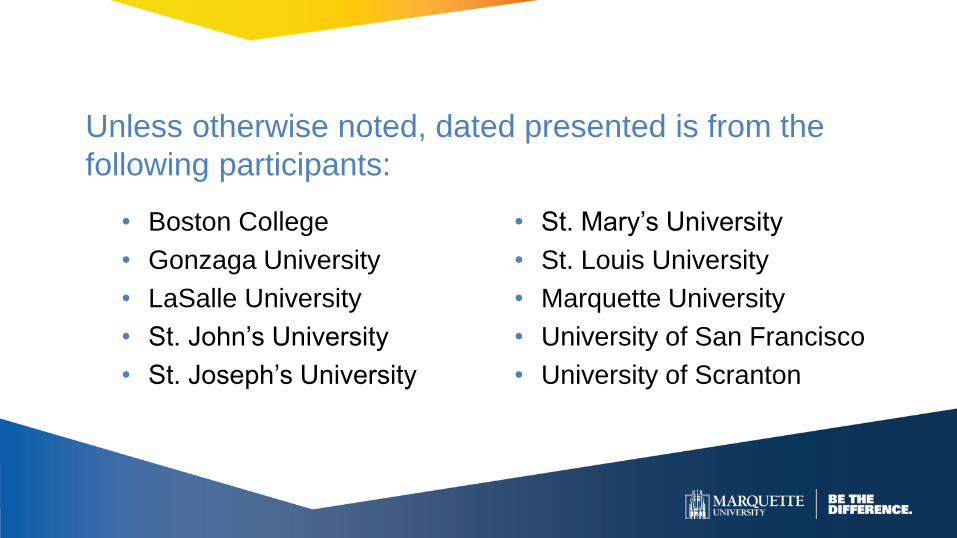
Unless otherwise noted, dated presented is from the
following participants:
• Boston College
• Gonzaga University
• LaSalle University
• St. John’s University
• St. Joseph’s University
• St. Mary’s University
• St. Louis University
• Marquette University
• University of San Francisco
• University of Scranton
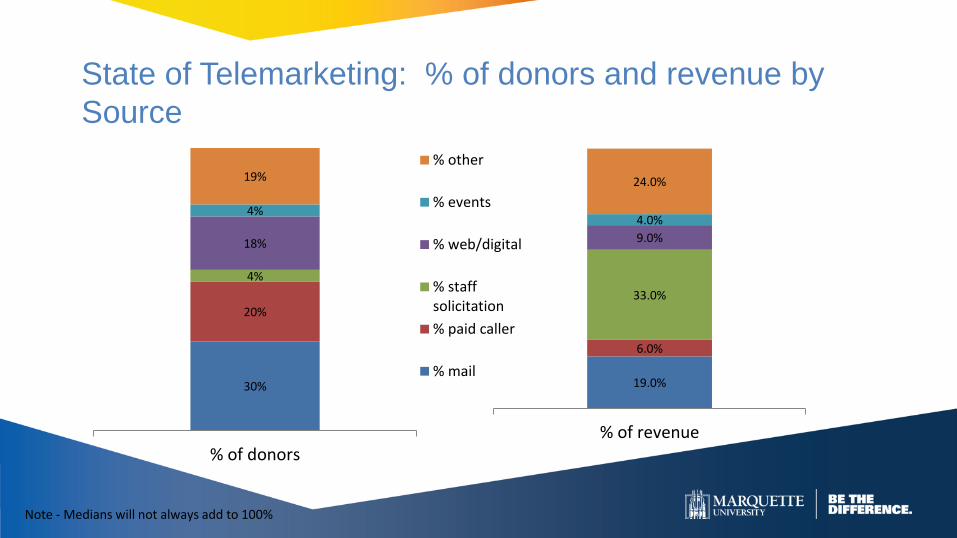
State of Telemarketing: % of donors and revenue by
Source
30%
20%
4%
18%
4%
19%
% of donors
% other
% events
% web/digital
% staffsolicitation
% paid caller
% mail19.0%
6.0%
33.0%
9.0%
4.0%
24.0%
% of revenue
Note - Medians will not always add to 100%
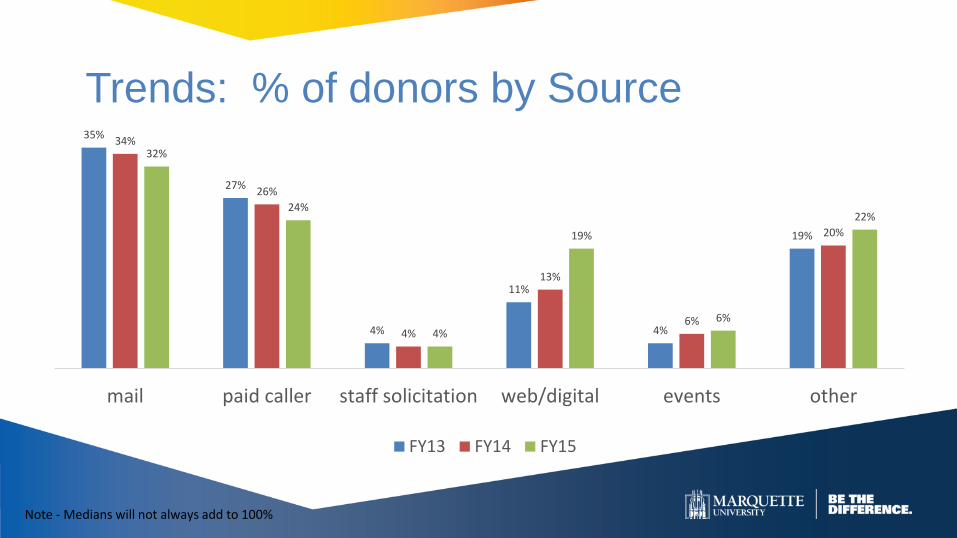
Trends: % of donors by Source
Note - Medians will not always add to 100%
35%
27%
4%
11%
4%
19%
34%
26%
4%
13%
6%
20%
32%
24%
4%
19%
6%
22%
mail paid caller staff solicitation web/digital events other
FY13 FY14 FY15
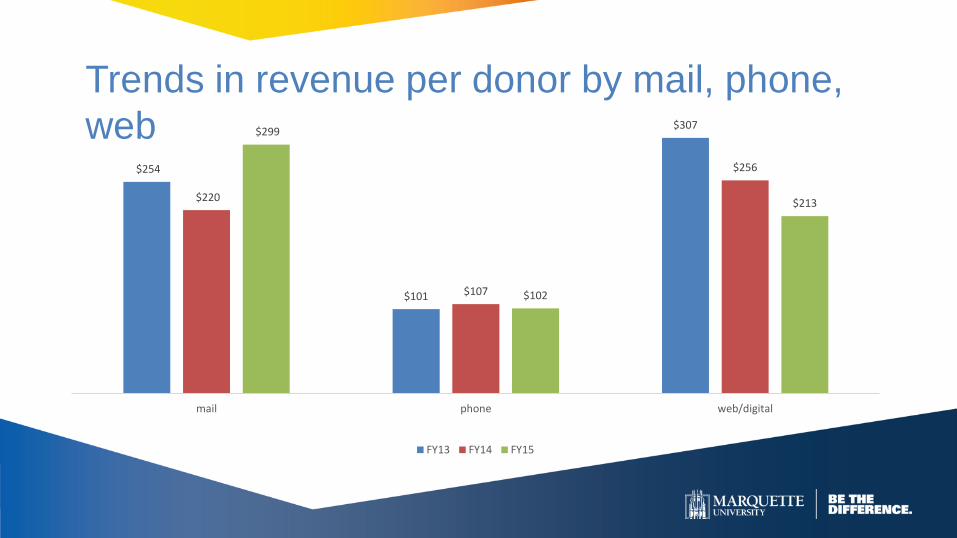
Trends in revenue per donor by mail, phone,
web$254
$101
$307
$220
$107
$256
$299
$102
$213
mail phone web/digital
FY13 FY14 FY15
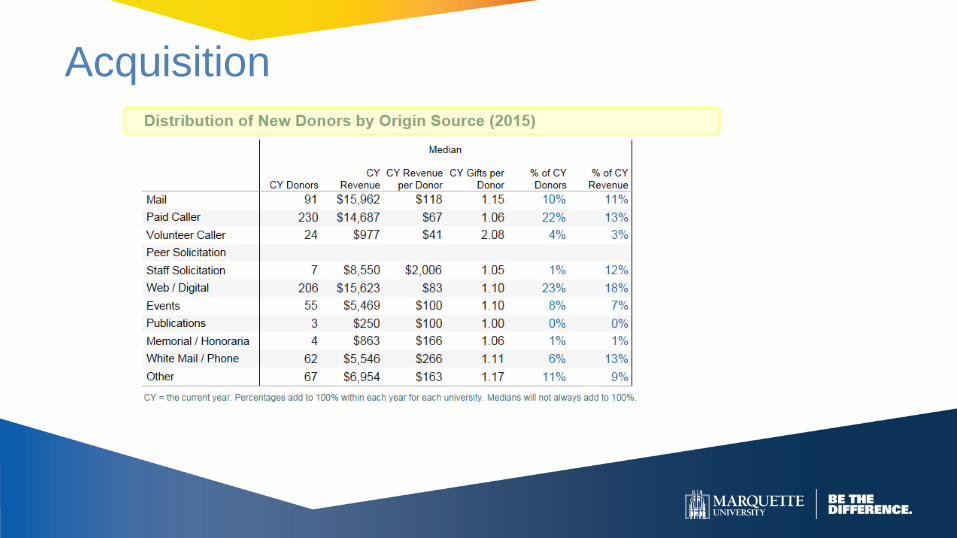
Acquisition
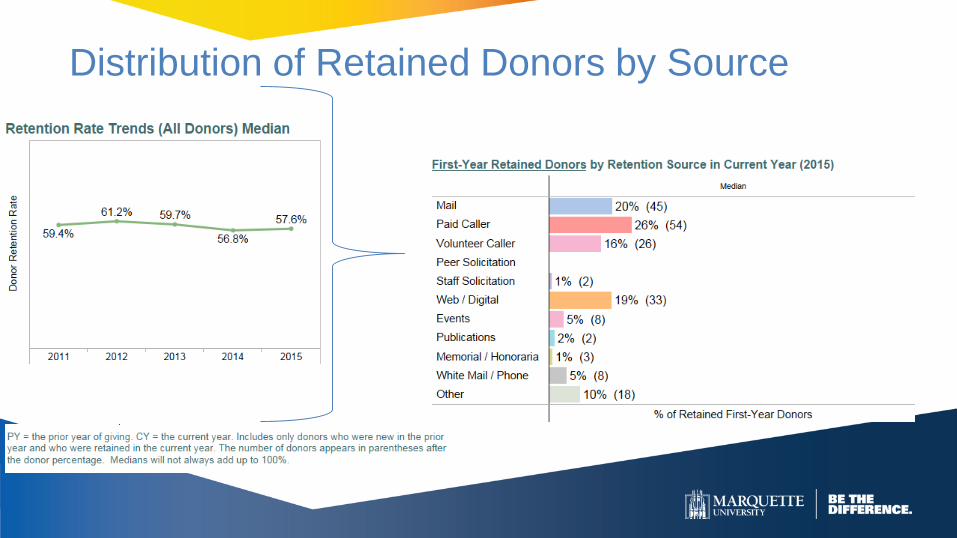
Distribution of Retained Donors by Source
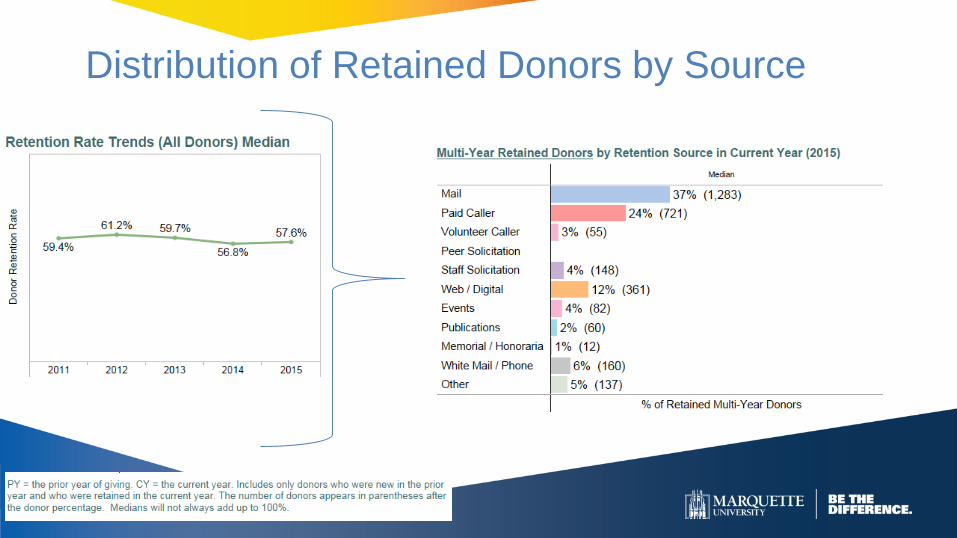
Distribution of Retained Donors by Source
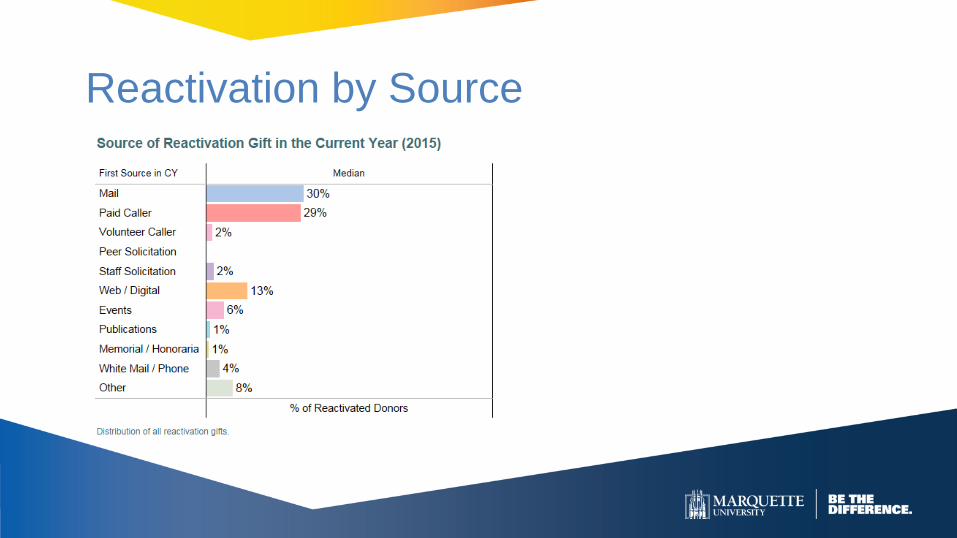
Reactivation by Source
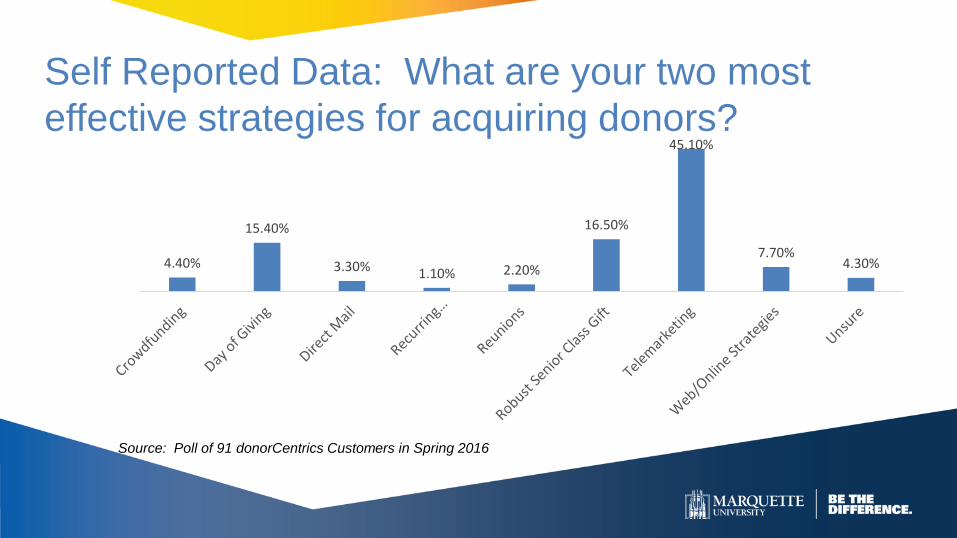
Self Reported Data: What are your two most
effective strategies for acquiring donors?
4.40%
15.40%
3.30% 1.10% 2.20%
16.50%
45.10%
7.70%4.30%
Source: Poll of 91 donorCentrics Customers in Spring 2016
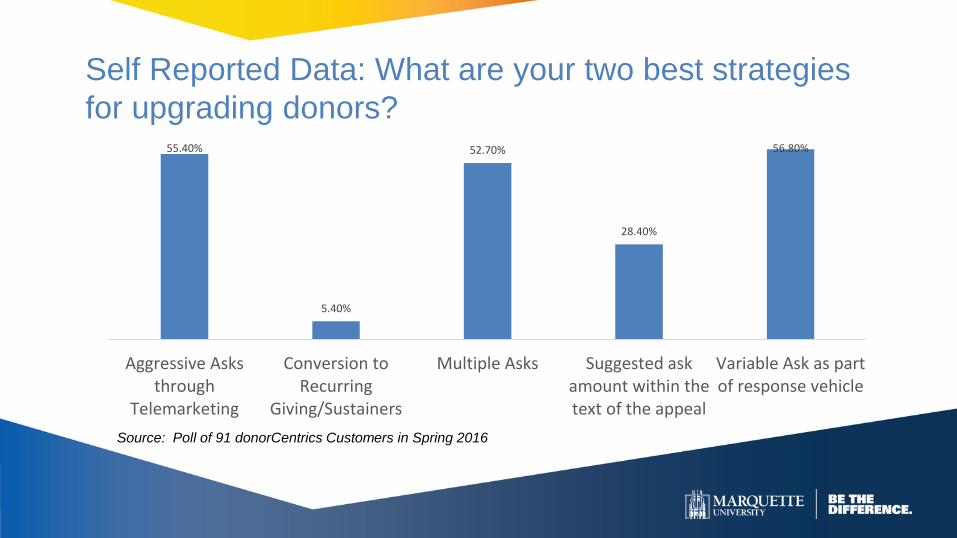
Self Reported Data: What are your two best strategies
for upgrading donors?55.40%
5.40%
52.70%
28.40%
56.80%
Aggressive Asksthrough
Telemarketing
Conversion toRecurring
Giving/Sustainers
Multiple Asks Suggested askamount within thetext of the appeal
Variable Ask as partof response vehicle
Source: Poll of 91 donorCentrics Customers in Spring 2016
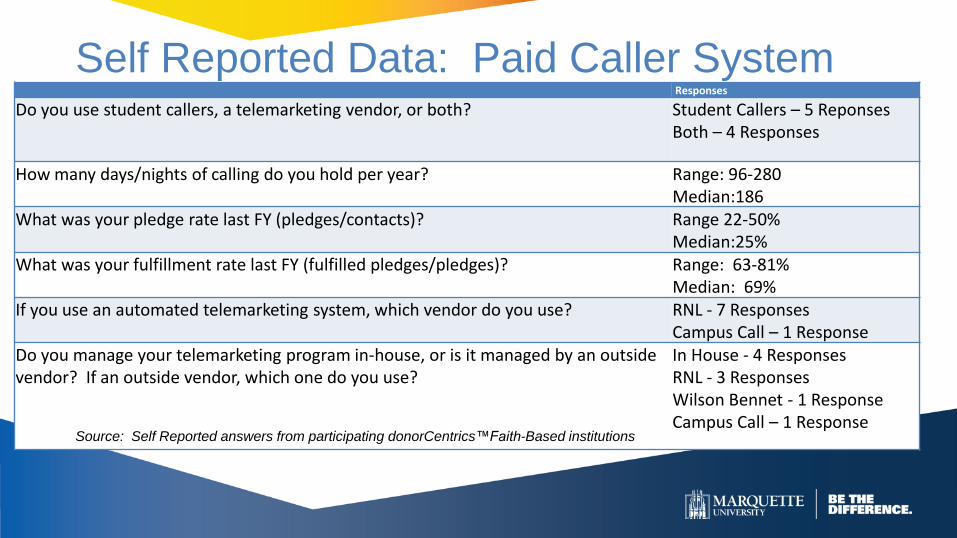
Self Reported Data: Paid Caller SystemResponses
Do you use student callers, a telemarketing vendor, or both? Student Callers – 5 ReponsesBoth – 4 Responses
How many days/nights of calling do you hold per year? Range: 96-280Median:186
What was your pledge rate last FY (pledges/contacts)? Range 22-50% Median:25%
What was your fulfillment rate last FY (fulfilled pledges/pledges)? Range: 63-81%Median: 69%
If you use an automated telemarketing system, which vendor do you use? RNL - 7 ResponsesCampus Call – 1 Response
Do you manage your telemarketing program in-house, or is it managed by an outside vendor? If an outside vendor, which one do you use?
In House - 4 ResponsesRNL - 3 ResponsesWilson Bennet - 1 ResponseCampus Call – 1 Response
Source: Self Reported answers from participating donorCentrics™Faith-Based institutions
Marquette Telemarketing
Automated, user of CampusCall software
Utilize our own student callers and student
managers
One full time professional staff member, as well as
substantial use of analytics staff member
Call approximately 40 weeks each year
Six shifts each week
Up to 30 callers per shift
Summer 2015
Really saw a drop in fulfillment revenue, while at
the same time, saw an increase in credit card
revenue
Pledge fulfillment was as high as 81% (FY 2010)
but had dropped to 64% in FY 2014 and FY 2015
Some pools had less than 50% fulfillment (Non-
Donors, Young Alumni, Long-Lapsed Donors)
Fall 2015
Decided to move to only accepting credit card gifts for certain pools o Non-Donors, Long-Lapsed and Young Alumni – about 40%
of our calling universe
Adjusted training to continue to re-emphasize how to “close” with a credit card
Results:o “Realized” dollars actually up slightly in Credit Card-only
pools
o Overall credit card giving up sharply, even in pools not designated as Credit Card-only

Spring 2016 Still disappointed with a decline in fulfillment for the remaining pools
Decided to accelerate fulfillment from next day, 30, 60, 90 to next day, 15, 30, 45, 60
Accelerated Phonathon write offs from one year to ½ year
Resultso Fulfillment up about 11% overall to 75%
o Continued increase in overall credit card rate – now 38% of gifts (24% in Spring FY 2014)
o Time and money spent on fulfillment down sharply
o Direct mail results up – write-offs move constituents back into mailings and e-solicitations faster
o Giving rates in Credit Card-only pools continue to rise – well above expectations
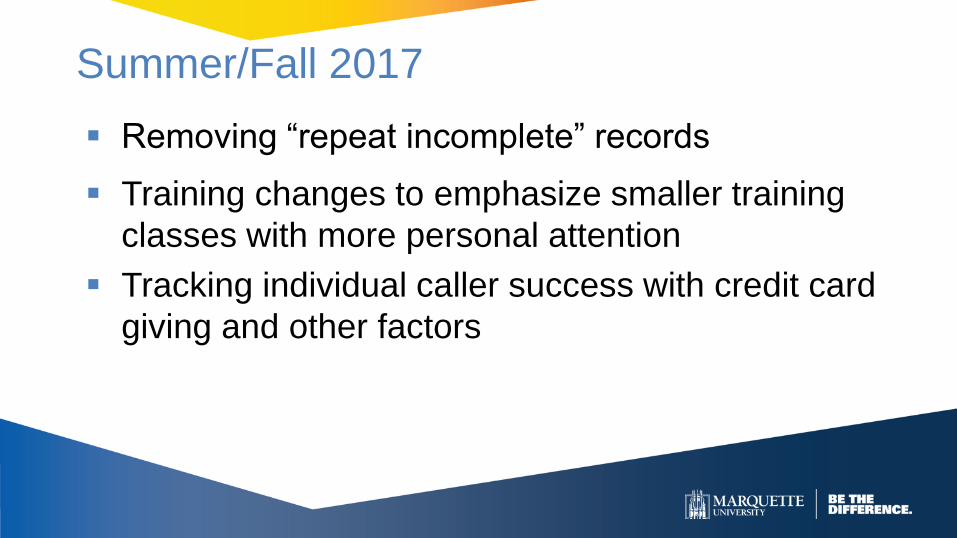
Summer/Fall 2017
Removing “repeat incomplete” records
Training changes to emphasize smaller training
classes with more personal attention
Tracking individual caller success with credit card
giving and other factors
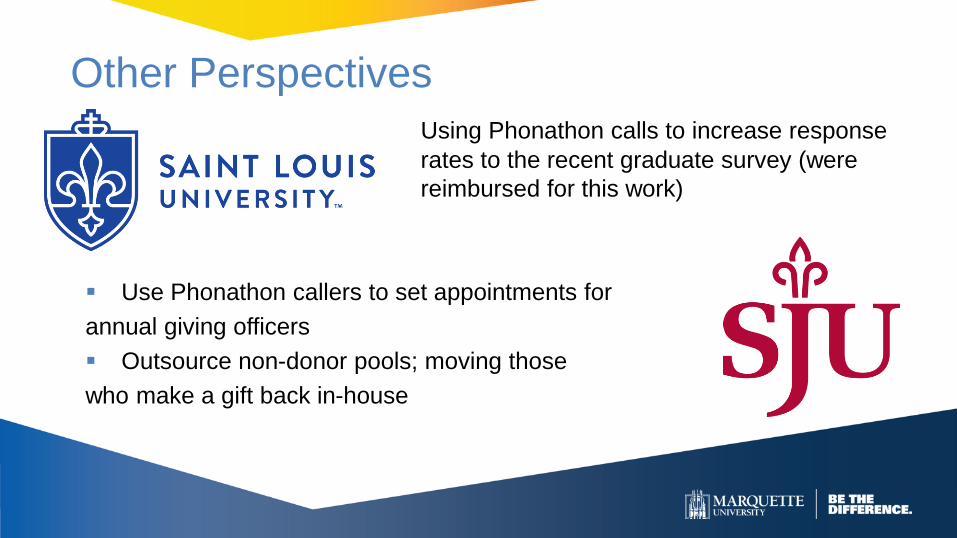
Other Perspectives
Using Phonathon calls to increase response
rates to the recent graduate survey (were
reimbursed for this work)
Use Phonathon callers to set appointments for
annual giving officers
Outsource non-donor pools; moving those
who make a gift back in-house
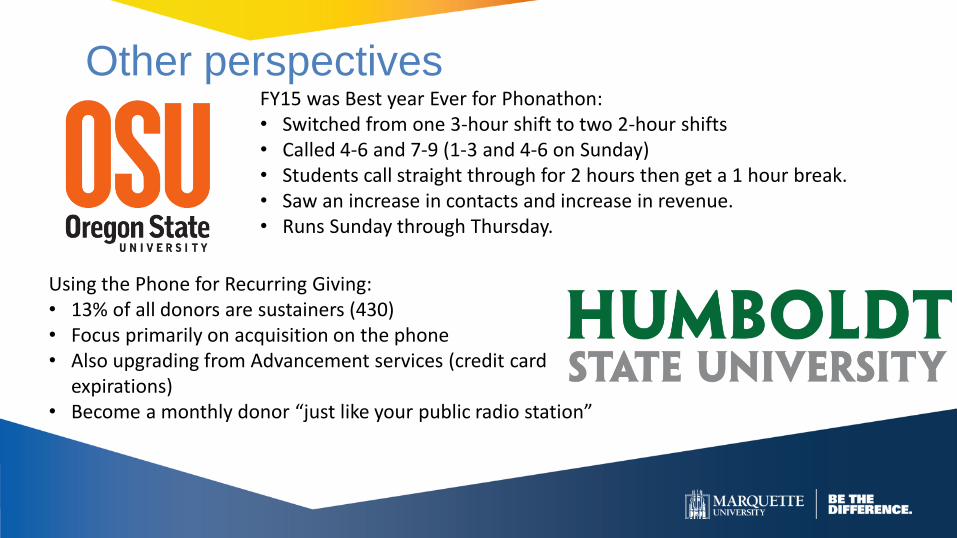
Other perspectivesFY15 was Best year Ever for Phonathon:• Switched from one 3-hour shift to two 2-hour shifts• Called 4-6 and 7-9 (1-3 and 4-6 on Sunday) • Students call straight through for 2 hours then get a 1 hour break. • Saw an increase in contacts and increase in revenue. • Runs Sunday through Thursday.
Using the Phone for Recurring Giving:• 13% of all donors are sustainers (430)• Focus primarily on acquisition on the phone • Also upgrading from Advancement services (credit card
expirations)• Become a monthly donor “just like your public radio station”
APPENDIX
TRENDS IN RECURRING GIVING
)
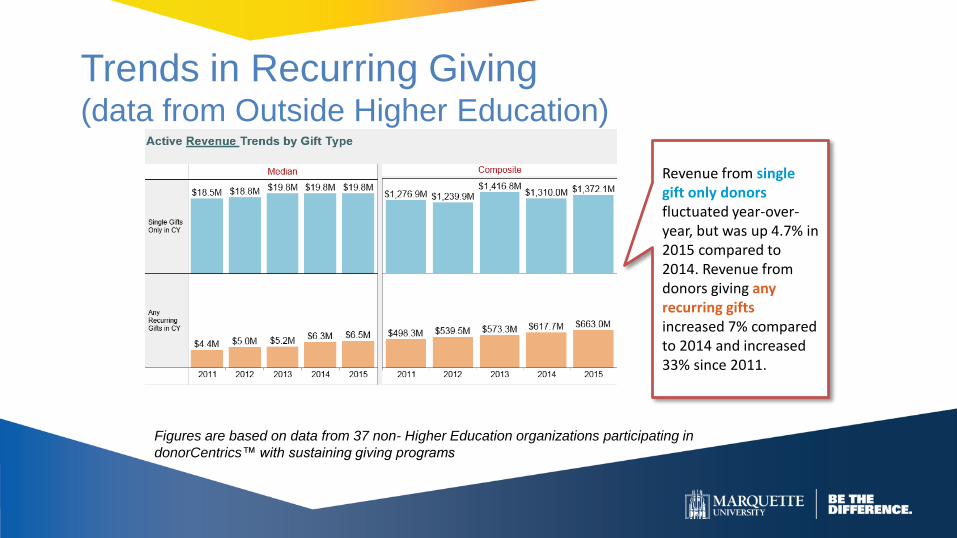
Trends in Recurring Giving (data from Outside Higher Education)
Figures are based on data from 37 non- Higher Education organizations participating in
donorCentrics™ with sustaining giving programs
Revenue from single gift only donorsfluctuated year-over-year, but was up 4.7% in 2015 compared to 2014. Revenue from donors giving any recurring giftsincreased 7% compared to 2014 and increased 33% since 2011.
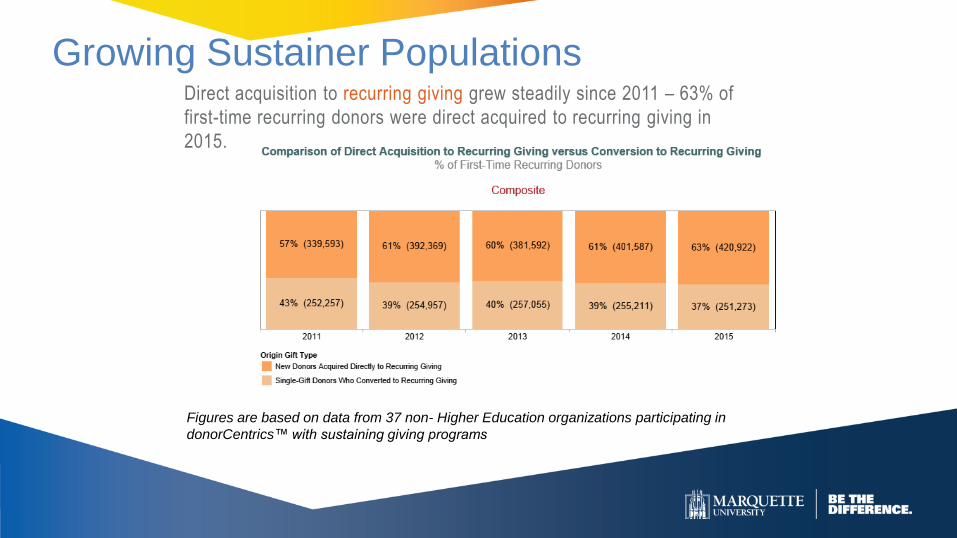
Growing Sustainer PopulationsDirect acquisition to recurring giving grew steadily since 2011 – 63% of
first-time recurring donors were direct acquired to recurring giving in
2015.
Figures are based on data from 37 non- Higher Education organizations participating in
donorCentrics™ with sustaining giving programs
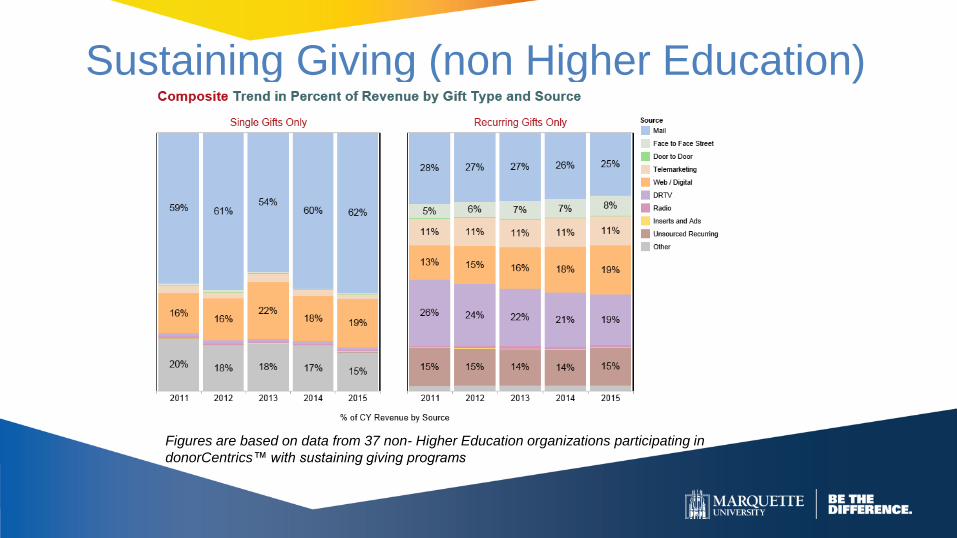
Sustaining Giving (non Higher Education)
Figures are based on data from 37 non- Higher Education organizations participating in
donorCentrics™ with sustaining giving programs
CLICK TO EDIT MASTER TITLE STYLE
Click to edit Master text styles