I= . -I WHEAT AND FLOUR TRADE
19
'YF49 Ws ro () -I // Pmo fo l. we of do. Canif.em an roc GOVERNENT PRINTING OFFi(g 1921 JAN 1- 12 / I, WHEAT AND FLOUR TRADE LETTER TO THE COMMITTEE ON FINANCE UNITED STATES SENATE SIXTY-SIXTH CONGRESS THIRD SESSION SUBMITTING SUPPLEMENTAL INFORMATION ON THE WHEAT AND FLOUR TRADE IN THE UNITED STATES PREPARED BY Tn UNITED STATES TARIFF COMMIS31ON Kw I= . - , llll l l i 1 , l , I l l ll l H I I ' I , J i l l L I I
Transcript of I= . -I WHEAT AND FLOUR TRADE
'YF49Ws ro
()-I//
Pmo fo l. we of do. Canif.em an roc
GOVERNENT PRINTING OFFi(g1921
JAN 1- 12/
I,
WHEAT AND FLOUR TRADE
LETTER TO THE
COMMITTEE ON FINANCEUNITED STATES SENATE
SIXTY-SIXTH CONGRESSTHIRD SESSION
SUBMITTING
SUPPLEMENTAL INFORMATION ON THEWHEAT AND FLOUR TRADE IN
THE UNITED STATES
PREPARED BY Tn UNITED STATES TARIFF COMMIS31ON
KwI= . -, llll l l i 1 , l , I l l ll l H I I ' I , J i l l L I I
COMMITEE ON FINANCE.
UNITED STATES SENATE.
SIXTY-SIXTH CONGRESS, THIRD SESSION.
BOIES PENROSE, Pennsylvania, Chairman.
PORTER J. McC1JMB21-, North Dakota.REED SMOOT, Utah.ROBERT M. LA FOLLETTE, Wisconsin.WILLIAM P. DILLINGHAM, Vermont.GEORGE P. McLEAN, Connecticut.CHARLES CURTIS, Kansam.JAMES E. WATSON, Indiana.WILLIAM M. CALDER, New York.HOWARD SUTHERLAND, West Virinia
FURNIFOLD M.'SIMMONS, North Carolina.JOHN SHARP WILLIAMS, Mlssisslppi.CHARLES S. THOMAS, Colorado.THOMAS P. GORE, Oklahoma.ANDRIEUS A. JONES, Now Mexico,PETER 0. GERRY, Rhode Island.JOHN It. NUGENT, Idabo.
LrjowroN C. TAYOtR, Cl rk.W B. $SwAxv. Au, an C4rk
2
/
Ak
UNITED STATES TARIFF COMMISSION,Wahington, January 4, 1921.
The COMMITTEE ON FINANCE OF THE UNITED STATES SENATE:-I have the honor to transmit herewith, in accordance with your
request, supplementary information compiled by the United StatesTariff Commission relative' to the wheat and flour trade.
Very respectfully, yours,THOMAS WALKER PAGE,
Clzirinan.3
nAl
A
'1
:f:1
II
I
J
9d.
SUPPLEMENTARY INFORMATION RELATIVE TO THE DEVELOP-MENTS IN THE WHEAT AND FLOUR TRADE.
In a former reportI the general characteristics of the tariff prob-lems in wheat and wheat flour were set forth in considerable detail.A copy of the summary chapter is attached. Recent developmentsmay be briefly indicated, for it is believed that no fundamentalchange has taken place in the character or conditions of foreign com-petition. In the severe price deflation which occurred during thesummer and fall of 1920 wheat played a conspicuous part and thefarmer, who produced bis crop under high war costs, sufferedseverely.
Until June 1, 1920, when Federal control of the wheat and flourtrade exp ired, there was virtually no opportunity for the effects offree trade in these products to make- themselves felt. There was aworld shortage of wheat, the shipping situation placed a premiumupon North American supplies, and imports were permitted onlyunder license. Ordinarily, prices in both the United States andCanada are upon an export basis, but during the closing years of theWorld War it was a sellers' market. On May 15, 1920, the Minne-apolis price of No. 1 Northern was $3.15, about I per bushel abovethe guaranteed minimum. Allowing for exchange and freight, thiswas equivalent to around $5 per bushel at Liverpool. Wheat pricesin the ehief importing countries, both to grower and consumer, werematerially below the North American levels. This loss on purchasesof imported wheat was paid by the respective governments in the,form of bread subsidies. In these countries war-time control of thewheat and *flour trade has continued. Their policies include pricefixation, concentrated buying by governmental agencies, restrictionof imports and the purchase of wheat in" preference to flour; thelatter partly to stimulate the domestic milling industries and alsoto obtain the mill feed received as a by-product.
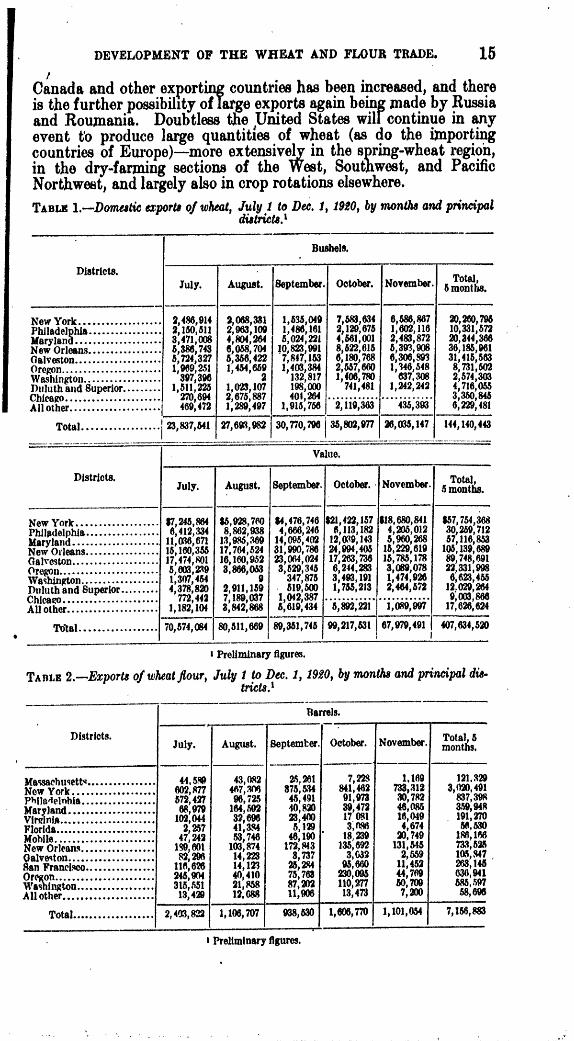
The exportable surplus of the United States for the crop year 1920has been generally estimated to be from 200,000,000 to 225,000,000bushels.' But during the first half of the crop year July 1 to De-cember 23, 1920, inclusive, there were exported fully 203,000,000bushels of wheat and its equivalent in flour. Official returns forJuly 1 to November 30, inclusive, report exports of 175 000,000bushels (wheat, 144,000,000 bushels; flour, 7,100,000 barrels).(Table 1.) Bradstreet estimates the exports during December 1 to23, inclusive, at approximately 28,000,000 bushels of wheat and flour,and commercial sources report further heavy export buying towardsthe close of December, for shipment in ' following months. If
Agricultual Staples and the Tariff. U. 5..Tariff Informationte No. 20. Completed as of Sept.15| 1920.Carry over from 1919 crop, 151,0u0,000 bushels (108,000,000 bushels of wheat and four equivalent to
42,000 bushels). The 1920 crop amounted to 790,000,000 bushels; normal carry over 80,000,000 bushels;domestic consumptIon for food, seed, and other purposes around W4000,000 bushels. 5
DEVELOPMENT OF THE WHEAT AND FLOUR TRADE.
during the remaining six months of the crop year, when normallyabout 40 per cent of the export movement occurs, the shipmentscontinue at a fraction of this rate, it is apparent that the JnitedStates must replace the exports by foreign wheat. And this is pre-cisely what appears to have been already in progress. Geographicalfactors, i. e., the channels of trade, the character of the milling demandfor different kinds of wheat and of the export trade in flour, are suchas to attract a considerable import movement from Canada. Thisserves to free for export approximately equivalent quantities ofdomestic grain and flour, for the most part of different classes orfrom sections other than those which absorb the imports. -
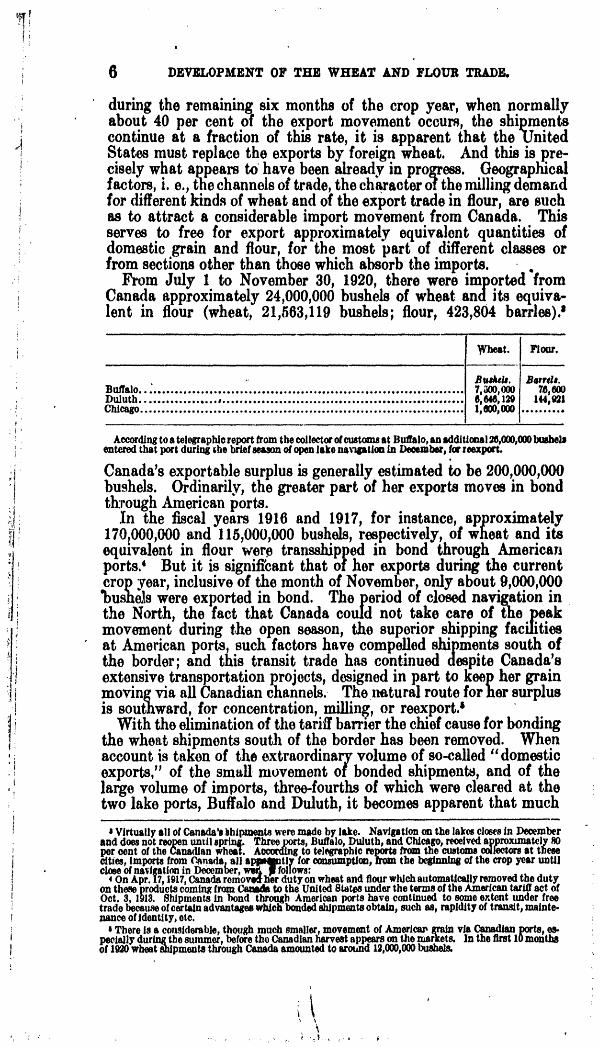
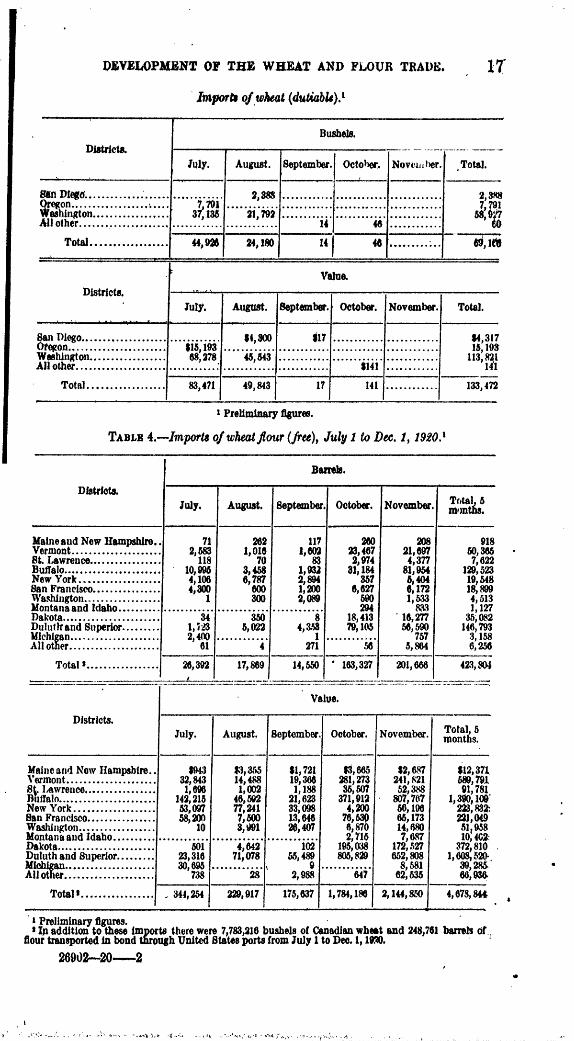
From July 1 to November 30, 1920, there were imported'fromCanada approximately 24,000,000 bushels of wheat and its equiva-lent in flour (wheat, 21,563,119 bushels; flour, 423,804 bariles).'
Wheat. Flour.
BuAes. Barrds.Buffalo.. ...................... 7,300,000 760,600Duluth ..................... #... 12 144921Chicago ..................................................................... 1, 0000 ..........
Acording to a telegraphic report from the collector of customs at Buffalo, an additional 20,000,00 bushel
entered that port during &he brief season of open lake navigation In December, for reexpom.
Canada's exportable surplus is generally estimated to be 200,000,000bushels. Ordinarily, the greater part of her exports moves in bondthrough American ports.
In the fiscal years 1916 and 1917, for instance, approximately170,000,000 and 115,000,000 bushels, respectively, of wheat and itsequivalent in flour were transshipped in bond through Americanports.' But it is significant that of her exports during the currentcrop year, inclusive of the month of November, only about 9,000,000'bushels were exported in bond. The period of closed navigation inthe North, the fact that Canada could not take care of the peakmovement during the open season, the superior shipping facilitiesat American ports, such factors have compelled shipments south ofthe border; and this transit trade has continued despite Canada'sextensive transportation projects, designed in part to keep her grainmoving via all Canadian channels. The natural route for her surplusis southward, for concentration, milling, or reexport.'
With the elimination of the tariff barrier the chief cause for bondingthe wheat shipments south of the border has been removed. Whenaccount is taken of the extraordinary volume of so-called "domesticexports," of the small movement of bonded shipments, and of thelarge volume of imports, three-fourths of which were cleared at thetwo lake ports, Buffalo and Duluth, it becomes apparent that much
' Virtually all of Canada's shipments were made by lake. Navigation on the lakes closes in Decemberand does not reopen until spring. Three ports, Buffalo, Duluth, and Chicago, received approximately 8Oper cent of the Cnadlan wheat. According to telegraphic reports from the custom Wolectors at thesecities, Imports from CAnada all a Pl1tly for consumption, = the beginning of the crop year untilclose of navigation in December, w0P40 follows:
4 On Apr. 17,1917, Canada removeher duty on wheat and flour which automatically removed the dutyon these products coming from Cava& to the United States under the terms of the American tari# act ofOct. 3, 1913. Shipments in bond through American ports have continued to some extent under freetrade because of certain advantages which bonded shipments obtain, such as, rapidity of transit, mainte.nance of identity, etc.
G There is a considerable, though much smaller, movement of America grain via Canadian ports, es-ecifally during the sunmer, before the Canadian harvest appears on the nArkets. In the first 10 moAths
of 920 wheat shipments through Canada amounted to around 12,000,000 bushel&
6
Iof the foreign wheat is reexported. It loses its identity after arrivalat the elevators. These reexports are for the most part indirect, i. e.,they may take the form of flour composed in whole or in part ofCanadian wheat; domestic wheat of other classes and grades arereleased for export, or, finally, they may permit of larger exports fromsections which formerly shipped to the importing region.
Thus much of this year's domestic hard spring wheat crop is ofinferior quality, in the face of a domestic demand which desiresespecially the better grades. Commercial advices indicate that theNorthwestern mills are blending much Canadian hard spring wheatwith the lower grades of domestic spring, thereby affording a bettermarket for much of the inferior domestic product. In Canada, amuch larger proportion is usually of the better grades. Spring wheatmillers are frequently faced with a shortage of the better grades ofsuch wheat and have been compelled to draw increasing quantitiesof hard winter wheats from the States to the South.
Recent increases in freight rates, which have emphasized the im-portance of short rail hauls and of water transportation, are tendingto change the channels of trade. Ii consequence, much of the South-western wheat which formerly moved northward appears to be goingfor export through Gulf ports. In the five months July to Novem-ber, inclusive, ekports through Gulf ports aggregated over 72,000.A00bushels, nearly fialf the total exports, an& two or three timi-s. asheavy a movement as normally occurs through these ports uir'mgthe entire fiscal year. On the other hand, flour exports from theGulf ports constitute only 15 per cent of the total flour exports.This fact is especially noteworthy when considered in connection withthe heavy flour exports from North Atlantic ports, originating fromthe regions which absorbed the Canadian wheat. Lake ports, fur-thermore, whose share in the direct export trade had greatly declined,are again assuming importance. Over 8,000,000 bushels appear tohave -been shipped from Duluth and Chicago on through bills oflading.
This free movement of wheat between the United States andCanada, making the North American crop a common source of sup-ply, has certain demonstrable advantages. Its disadvantages areless certain. American lake vessels, which under the Canadian navi-gation laws, can not operate between Canadian ports, transport alarge part of the Canadian grain; American elevators, distributinginterests, and rail and ocean lines enjoy the benefits accruing fromthis larger volume of tarffic; domestic mills, which had been losingground to Canada in the export flour trade, are able to meet thiscompetition through importing Canadian wheat for blending andmilling; a larger volume of mill feed is available to the dairy industry,which consumes more mill feed than is yielded as a by-product ofdomestic flour consumption. Furthermore, the balance of trade,even in agricultural products, is heavily against Canada in her com-merce with the States, and the resulting unfavorable rates of ex-change are handicapping the American sales to Canada, at the sametime that European shippers are enjoying an advantage by reasonof unfavorable exchange with that country. Wheat is Canada'sprincipal asset and her chief means of equalizing exchange rates.
Stillanother advantage is afforded by the practice of blending theheavier Canadian hard spring wheat with thelighter domestic wheats
DEVELOPMENT OF THE WHEAT AND FLOUR TRADA. 7l
DEVELOPMENT OF THE WHEAT AND FLOUR TRADE.
of the same class. Test weight per bushel is one of the chief stand-ards which determines whether wheat shall be graded as No. 1or falls under lower grades. By an admixture of a proper proportionof the Canadian product, domestic wheat which fails to grade as No. 1,solely by reason of deficient weight, may be classed under the highergrade and receive a correspondingly high price. It is true that ele-vators and millers chiefly profit by this practice, but doubtlessgrowers likewise profit to some extent through a more active domesticdemand for the lower grades and through a lowering of the pricespread between grades. In this connection it is worthy of note thatthe price in Liverpool of Manitoba No. 1 Northern is materiallyabovethat of American No. 1 Northern.
Against these advantages may be set off the possible disadvantagesincident to the competition of Canadian flpur in domestic marketsand the possible infuence of Canadian wheat upon the Americanfarmers' price. However, the United States normally exportednearly three times as much flour as any other country, and the Cana-dian competition in flour is relatively not of large dimensions. ,Nordo Canadian mills possess obvious advantages over those operatingsouth of the border. Buffalo mills, for instance, which are well sit-uated with respect to the hard spring wheat producing sections ofboth countries, and also with respect to the hard winter and softwheats, can compete with Canadian mills not only .in the markets ofthe North Atlantic States but also in foreign markets for flour. Itremains to consider, therefore, the possible effect of Canadian im-ports upon farmers' prices.
The causes of the recent decline in wheat prices have been the sub-ject of an extensive investigation by the Federal Trade Commissionand the United States Department of Agriculture, acting under direc-tions of the President. In the published summary of the report ofthe Federal Trade Commission, seven causes are given for this de-cline: (1) Conditions of world supply; (2) concentrated governmentalbuying by European powers; (3) imports from Canada; (4) record-breaking harvests of corn and oats; (5) a decided falling off in thedomestic demand for flour during the latter part of 1920; (6) thegeneral price deflation; (7) credit conditions.
It is impossible precisely to determine how important an influenceCanadian imports have exerted on the price of wheat in the Americanmarket in recent months; but some points in this connection may beindicated.
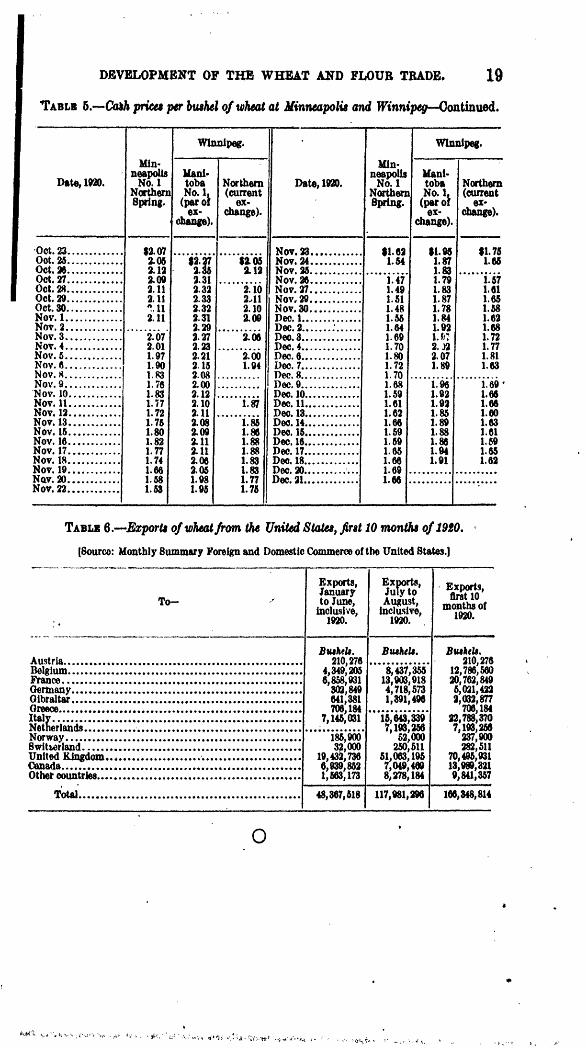
Canadian wheat did not come on the market until about September1, but the price decline had set in some months previously (seeTable 5); from a high point of about $3.15 per bushel on June 1, theprice declined to $2.65 on August 20. It is possible that the prospectof an exceptionally large harvest in Canada may have been a con-tributing factor in this decline, but it should be noted that in thePacific States, whose wheat enters into a somewhat distinct trade,prices also declined, although Canadian competition is not an impor-tant factor in Pacific markets.
Another point that should be considered is the fact that in each ofthe fiscal years 1917 and 1918 there were imported around 25,000 000bushels of wheat, almost entirely from Canada. It is true that thesepurchases were made by the United States Grain Corporation, withthe understanding that equivalent quantities of wheat or flour should

DEVELOPMENT OF THE WHEAT AND FLOUR TRADE. 9
be exported. But these imports were made to meet sectional shortr-ages, either of all kinds or of different classes of wheat; and, beingmade c' lower price levels than existed in the United States, mighthave been due to commercial influences had they been free to operate.During these years, however the imports were without apparenteffect because of conditions of international demand. The imports,therefore, were somewhat of the same character as those which tookplace in 1920.
In addition to these factors there are others comected with theeffect on prices of Canadian imports which are brought out in. thetables submitted below.
From the tables of imports and exports of wheat and from com-mercial estimates for the early part of December it appears that theAmerican exports htve been roughly 200,000,000 bushels since July 1,1920, whereas the imports, chiefly from Canada, have been about25,000,000 in the same period. In normal times a preponderance ofexports over imports as great' as that indicated here means thatAmerican prices follow the international market for wheat. Indeed,this is almost axiomatic if trade is unobstructed. Liverpool isusually the center of the world market and when a given country ison an exporting basis the price of wheat there is usually lower thanthat of Liverpool by the amount of transportation and other handlingcharges between the two markets.
At the present time, however, this rule is not subject to statisticalproof because the European prices are largely artificially fixed. Noopen-market quotations for Liverpool are available; only the Britishissue prices fixed by the Royal Commission pn Supplies are published,and for present purposes these are not significant. A further dis-turbing factor is illustrated in Table 6, in which it is shown that thereare heavy exports directly to continental Europe rather than throughthe usual clearing markets of Liverpool and London.
In view of these disturbing factors-arbitrary prices abroad andheavy direct shipments to the Continent-care should be exercisedin a9suming that the American market is now following the Europeanpurchase price.
Aside from the question-of price levels, however, it may be saidwith some certainty that inasmuch as the United States is on anexporting basis, any wheat that is imported from Canada (aside fromthe question of special cases to meet special needs) releases an equalamount of American wheat for export. This being truo, it is not amatter of great importance whether the Canadian wheat reachesEurope directly or indirectly through the United States either in theform of flour or by releasing similar American wheat. Indeed, if wemay assume that the European demand is controlling our market, asit does in normal times when we are on an exporting basis, there is apossibility that if the Canadian wheat had been thrown on the Englishmarket before the close of lake navigation, instead of filtering slowlythrough the United States, the world price level, and therefore ourown market, would have been depressed more than it was in the fallof 1920. From this point of view it seems fortunate for Americanproducers that there was a buffer between the groat Canadian surplusand the Liverpool market.
A further important point is the exchange situation between theUnited States and Canada. Recently Canadian exchange has been
10 DEVELOPMENT OF THE WHEAT AND FLOUR TRADE
at a discount of 8 to 15 per cent and this has disturbed the generaltrade. between the two countries.
It is often assumed that American purchasers get the full advan-tage of the exchange rates when the American dollar is at a premium.This by no means follows, however, in every case. From Table 5,appended below, it is seen that the Winnipeg price of wheat con-verted into American money is almost the same as that for similarwheat in Minneapolis.
This identity of prices in the two markets is of importance in con-nection with the exchange situation. It is obvious that the Americanpurchaser of Canadian wheat can not get it any cheaper than he canbuy the same grades of the domesticproduct; in other word, thereis no special inducement for buying Canadian wheat offered by theexchange situation. It does not appear that the individual sellerhas a greater incentive to sell in Minneapolis than in Winnipeg,because as a matter of fact the prices are about the same in the twomarkets.
If this country were on a net importing basis the prices obviouslywould be depressed by. the imports Yrom Canada, but at a time whenheavy exports are going out of the country the relatively smallimports probably do not alter the general rule that it is of no greatimportance whether Canadian wheat reaches the European marketsdirectly or indirectly through the United States.
Statistical data upon which the foregoing discussion is based areshown in the accompanying table.
WHET AND WHEAT FLOUL
SUMMARY AND CONCLUSIONS.
In the tariff act now in force-that of October 3, 1913-reciprocalfree trade is offered in wheat and wheat flour. The principal export-i'g nations that are likely to ship to this country (Canada, Argentina, and Australia) have removed their customs duties upon Ameri-can wheat and flour; in consequence their product enters this countryduty free and in growing volume. Except for relatively smallexports to Canada, no American wheat or flour is shipped to thesecountries.
The wheat consumption of the United States is much greater thanthat of any other country. Its potential production likewise is farin excess of domestic requirements. But whether wheat or alterna-tive farm products a'e raised is largely a matter of price and com-parative advantage. It is on relatively low-priced land, in sparselypopulated regions far distant from the ultimate markets, that muchof the world's crop is ordinarily grown.
The great increase in the American production (during the 30years preceding the World War) had been primarily due to the newlands that were brought under cultivation. It coincided with adiminishing proportion of older arable lands sown to wheat, even inthe grain belt, In the older regions wheat culture had lost groundbecause of the competition of other crops and of more productiveand cheaper land elsewhere available. From such unoccupied areasas may hereafter be cultivated no large contribution is to be antici-pated. Moreover, the increase in production has not kept pace with
the growth of population and consumption. Most of the States nowconsume more wheat than they produce.
In the years immediately preceding the World War Americanexports of wheat, in the grain, had come to consist largely of theexports of the Pacific Northwest, which ordinarily can ship morecheaply to the Orient and to Europe than to the distant Americanconsuming markets, and of durum wheat, for which there was thenonly a small domestic demand. Only in the last two of the nine fiscalyears, 1906-1914, did exports of Pacific and durum wheat constituteless than 40 per cent of the total wheat shipments. Of the remainingAtlantic and Gulf exports a considerable proportion probably con-sisted of the lower grades of hard and soft wheat, which are ordi-narily not desired by American millers.
Flour constituted an increasing proportion of the exports, andflour shipments consisted in large part of "clears" and low grades,for which there is only a relatively small domestic market. Of com-bined wheat and flour, exports had declined from between 30 and 40percent of the crop during 1891-1902 to between 10 and 20 per centduring 1902-1914.
Since 1914, however, the United States has been the dominatingfactor in the world's wheat and flour trade. For an indefinite periodgthe World War has eliminated the surplus of Russia, formerly thelargest exporter, and of Rumania. The shipping situation alsoplaced a premium upon North American supplies, and the farmerwas guaranteed k mmimum price over twice as high as the prewarlevel. In consequence, wheat cultivation has been maintained andincreased in the American regions producing at higher costs. Butit is significant that in the crop year 1919-20 a reduction of 20,000,000acres occutred in the area sown to wheat.
Imports, on the other hand, though still far less than exports, areincreasing in volume. Canadian shipments, which constitute thegreat bulk of the importations, ranged from 1,000,000 to 3,000,000bushels during the years 1910-1914; in each of the years 1017 and1918 they amounted to nearly 25,000,000 bushels, valued at $40,000,-000 to $50,000,000. In 1919 and 1920 they fell to 4,750 000 and4,000,000 bushels, respectively. From 1917 on, likewise, substantialimportations, free of duty, were made from Argentina and Australia.The receipts during the fiscal years 1918, 1919, and 1920 were ar-ranged by the United States Gram Corporation to meet sectionalshortages. Equivalent quantities of flour were exported from othersections. Mill feed to te value of around $2,000,000 annually hasalso been imported during the last three years, almost exclusivelyfrom Canada.The imports of the past have supplemented the domestic croprather than competed with it. In part, they have been due to localor general shortages of the different kinds of wheat, or of the bettergrades, either for milling or for seed. The demand is not for wheatin general, but fdr specific classes and qualities to meet particularuses. Imports from Canada consist almost exclusively of hird springwheat from the western Provinces; from Argentina, of hard andsemihard wheats; and from Australia, of soft wheat.
Again, American flour generally sold under brand; it has anestablished domestic and foreign trade as opposed to the general andfluctuating demand for wheat. In some foreign markets, also, it
I DEVELOPMENT OF THE WHEAT AND FLOUR TRADE. 11
12 DEVELOPMENT OF THE WHEAT AND FLOUR TRADE.
enjoys preferential tariff treatment. Such influences promote theimportation of foreign wheat for reexport in the form of flour, espe-cially as theie is an enormous domestic market for the milling y-products-.
More important, as a cause of imports, is the geographical situa-tion. The entire region east of the Mississippi, and the southerntier of Western States from Texas to California, is a deficiency sec-tion; it is dependent upon 12 of the remaining Western States forabout 200,000,000 bushels of its wheat requirements. But these sur-plus-producing trans-Mississippi States are over a thousand milesfrom the principal deficiency markets along the Atlantic and Gulfcoasts, and in California.
Prewar ocean freights from Argentina, to Atlantic and Gulf mar-kets, were about half the rail rates from Kansas City and Minne-apolis. Ocean freights from, Australia to California, likewise, wereno higher than the rail rates from the surplus-progucing sections ofthe Pacific Northwest. Although ocean freights since 1914 havegreatly exceeded rail rates from the interior, they have been deolin-ing. Rail rates have more than doubled. Of greater moment isthe pressure of Canadian wheat on the north, for Europe is the chiefmarket for the Argentine and Australian surpluses. Because of thetransportation situation, the bulk of the Dominion's growing exportsis shipped in bond through the North Atlantic consuming markets;the removal of the American tariff barriers renders this surplusavailable for domestic consumption.
In Canada, both production and exports have been rapidly in-creasing, and there are still large areas available for settlement andcultivation. Between 1915 and 1920 Canada's exports of wheat andflour ranged between 80,000,000 and 223,000,000 bushels, valued at$100,000,000 to $450,000,000. On account of the favorable climate ofthe western Provinces for the production of hard spring wheat, andof the abundance of fresh fertile land (available at much lower pricesthan wheat lands south of the border) the cost of production is lessthan in the United States, and the quality of her spring wheat isbetter on the whole than the quality of the American spring.
The cost of production is likely to remain lower in Canada, for al-though the superiority of Canadian land may eventually disappear,there will still remain a favorable climate' for the growing of hardspring wheat. Moreover, Canada's climate, distance from markets,and sparse population greatly restrict the choice of other.crops thatma profitably be raised.
Ihile the great increase in Canadian production has occurred inthe western Provinces, it is possible that the removal of the tariffbarriers may also stimulate production in the soft-wheat producingsections of eastern Canada. Rail rates from these sections to thegreat consuming markets in the North Atlantic States are consider-ably lower than from domestic regions of surplus production.
There is a small countercurrenit of American soft wheat and flourto western Canada, either for blending purposes or for the manu-facture of biscuits and pastry.
An important phase of the traffic between the two countries hasbeen the competition of railroads, lake vessels, primary and exportmarkets for the grain trade. Barred until recently by prohibitiveimport duties from making large shipments to the great consuming

DEVELOPMENT OF THE WHEAT AND FLOUR TRADE.
markets south of the border, Canada has embarked upon extensivetransportation and shipping projects designed in part to keep herexport grain moving via aFl-anadian routes, and her facilities haveattracted a considerable transit trade of American grain. But thecountercurrent of Canadian grain has been far larger. Americanports have shipped most of the Dominion's wheat exports, becauseof their superior shipping facilities, the closed winter season ofnavigation in the Nort, and because Canada could not take care of
the peak movement during the autumn and spring, before the closeof navigation and after its reopening. American lake vessels alsocarry much of the Canadian grain.
The natural route for Canada's grain surplus is southward andeastward, for concentration, milling, consumption, or export. Thisis due to a number of factors; the transportation situation; a wheatconsumption only about one-tenth as large as in the United States;the dimensions and efficiency of the American milling industry; thewider domestic and foreign markets for American flour and its by-products; the fact that Canada's grain is otherwise thrown on theworld's market at the most unfavorable season; and to the heavy re-turn movement of eastern products. The import duties have pre-vented a larger American participation in tne carrying and distribu-tion of Canadian grain, except with respect to the in-bond movement.If the mills hi ad free access to the hard spring wheat of westernCanada, a larger import trade would probably have developed. Theexport flour trade, likewise, might have been increased.
Both Canadian and American wheat prices have in general re-flected quotations in the world markets. But while Winnipeg pricesof hard spring wheat were always or an export basis, Minneapolisprices were frequently above the export point. Moreover Minne-apolis prices were consistently higher, though the spread dimin-ished after the reduction and subsequent removal of the duty onCanada's wheat. The differential in favor of Minneapolis was par-ticularly large 'in years when the harvest of American hard springwheats was short or of poor quality. This price disparity is espe-cially noteworthy in view of the fact that during 1906-1916 theCanadian wheat was worth several cents more per bushel because ofdifferences in grading.
When the higher price levels fn Minneapolis are considered in con-nection with the equality in freight rates from producing sections inwestern Canada to Minneapolis, Fort William, Port Arthur, andDuluth, and with the further fact that the costs of transportationfrom Fort William or Port Arthur to Liverpool via Montreal are,if different at all, slightly lower than from comparable points southof the border, it is evident that the import duties have preventedthe equalization of prices in American and Canadian markets througha flow of Canadian grain to the former.6 Thus, the import dutieshave been of especial benefit to the American grower in the years ofshortage of hard wheat, when domestic prices rose above the exportpoint. The domestic supply. ' of hard spring wheats is grown chieflyIn the Dakotas and Minnesota; of hard winter, in Kansas, Nebraska,and Oklahoma. These two classes-hard spring and hard winter-are directly competitive. To a lesser degree, also, they compete with
I It is true that Minneapolis is a great cash market, while Winnipeg is essentially a future market, andthat cash or "rpot" prices are frequently higher than "to-arrive' quotation, but such price differenceare seldom great or long sustained.
18
a i
14 DEVELOPMENT OF THE WHEAT AND FLOUR TRADE.
soft wheats. In durum wheat, raised chiefly in the Dakotas andMontana, there, is virtually no competition. .
East of thb Mississippi the crop consists almost entirely of softwheat. This class is also extensively produced in the trans-Missis-sippi regions. With respect to soft wheats, it may be noted: (1)That the import duties doubtless have contributed to the decline ofsoft-wheat production in eastern Canada, which can produce at leastas cheaply as can domestic regions of surplus production, and whichhas besides the advantage in rail rates to New England and NorthAtlantic markets; (2) that a larger importation of Canadian hardspring wheats may result in an invasion by northern millers of thehard and soft winter wheat markets in the South; and (3) that theregions of deficient production east of the Mississippi have tht pro-tection of freight rates from the surplus-producing sections.
The Pacific States are little affected by- Canadian competition.Ordinarily they ship their surplus to Europe and the Orient. Infact, free trade with Canada provides an additional *though smallmarket for their soft wheat and flour. In return, some hard springwheat may be imported for blending purposes.
Some authorities maintain that the Americali farmer would like-wise benefit bjr free trade with Canada. Roughly, at least, pricesin both countries reflect'Liverpool prices, less costs of transportation.The storage and consuming capacity of Liverpool and other Euro-pean markets has rather definite limitations; moreover, wheat har-vests are in progress every month of the year, giving promise offurther large supplies.. For these reasons a hood ol Canadian wheatin the fall and spring is likel' to cause severe price depressions, whichin turn would adversely affect American price levels.. Once thislower level is established it would be more difficult to advance later.If the Canadian wheat were allowed access to the large markets southof the border, with their great absorbing capacity and large volumeof hedging operations, it wQuld be more easily absorbed, and, it isasserted, lesslikel' to depress American prices through pressure uponthe final markets. This consideration, however, presupposes a con-siderable American surplus. It would not apply. in case of a domesticshortage, in which even,. the tariff barrier obviously would advancedomestic prices.
In conclusion, a larger volume of supplemental imports, especiallyfrom Canada, is to be anticipated. Geographic factors, local orgeneral shortages of different kinds of wheat, and the character ofthe milling demand-such forces draw foreign supplies for domesticconsumption even when large exports of Almerican wheat and flourare moving forward.! As yet they are potential rather than actualcauses of foreign competition. Whether free trade will result inlarge imports, how soon or how severe this competition, dependslargely upon unstable factors in the international demand and supply.In the chief importing countries national control still prevails.Not only do their policies include national buying, bread subsidies,fixed prices below the world level, and the purchase of wheat ratherthan of flour, but also the stimdlation of production and reduction ofimports. In wheat, however, constant national self-sufficiency cannot be assured, for climate is much more important than variationsin acreage. And in case of need the acreage may be readily increased,though of course largely at the expense of other farm products. Inopposition to this attempted curtailment of imports, the surplus of
DEVELOPMENT OF THE WHEAT AND FLOUR TRADE. 15
Canada and other exporting countries has been increased, and thereis the further possibility of large exports again being made by Russiaand Roumania. Doubtless the United States will continue in anyevent to produce large quantities of wheat (as do the inportingcountries of Europe)-more extensively in the spring-wheat region,in the dry-farming sections of the West, Southwest, and PacificNorthwest, and largely also in crop rotations elsewhere.TABLE 1.-Domestic sports of wheat, July I to Dec. 1, 1920, by months and principal
districts.
Bushels.
Districts.July. August. September. October. November. 5
New York .................. 2,488,914 2,068,381 1,535,049 7,683,634 6,588,867 20,280,796Philadelphia ................ 2,150,511 2,963,109 1,486,161 2,120,675 1,802,116 10,331,572Maryland ................... 3,471,008 4,804,264 8,024,221 4,561,001 2,483,872 20,344,366New Orleans ............ 5,388,743 6,058,704 10,823, 991 8,622,615 5,393,908 36,185,961Galveston........... 5,724,327 5,356,422 7,847,153 8,180,788 8,300,9 31,415,583Oregon ..................... 1,9 0,251 1,454,669 1,403,384 2,57,8 80 1,346,648 8,731,502Washington ............... 397,396 2 132,817 1,40,780 837,30 2,574,303Duluth and Superior ......... 1,511,225 1,023,107 198,000 741,481 1,242,242 4,716,055Chicago ...................... 270,694 2,676,887 401,264 ............ .. 3,30,845Allother ..................... 469,472 1,289,497 1,915,756 2,119,363 436,393 6,229,481
Total ....... ..... 23,837,541 27,693,9U 30,770,790 35,802,977 28,036,147 144,140,443
Value.
Distrcts.TOtsl,District& July. August. September. October. November. months.
New York ............. $7,245,864 $5,928,70 $4,476,746 $21,422,157 $18.680,841 $57,754,368Philadelphia ................. 6,412,334 8,862,938 4,666,246 6,113,182 4,206,012 30,269,712Maryland .................... 11,03 671 13,986,39 14,095,402 12,039,143 5,960,288 67,116,853New Orleans ............ 18,100,355 17,764,524 31,990,786 24,994,405 18,229,619 105,139,689Galveston .................... 17,474,801 16,160,952 23,064,024 17,263,738 15,785,178 89,748,691Oregon ....................... 5,003,239 3,868,058 3,529,345 6,244,283 3,089,078 22,331,998Washington ............. 1,307,454 9 347,875 3,493,191 1,474,928 6,623,455Duluth and Superior ....... 4,378,820 2,911,159 5 19,500 1, ,213 2,464,672 12.029,264Chicago ...................... 772,442 7,189,037 1,042,387 ............ ....... 9003,86Allother .................... 1,182,104 3,842,868 619,434 6,892,221 1,089,997 17,628,624
Total .................. 70,574,084 80,611,669 89,351,746 99,217,531 67,979,491 407,634,520
IPreliminary figures.
TABLE 2.-Ezport. of wheat flour, July I to Dec. 1, 1990, by montAs and principal dis.triess'
Districts.
MaRsachuettq ...............Now York ..................Phliftlelnhis ................Maryland ...................Vire|niA .....................Florida ................Mobile ................New Orlean .................Oalveqton ............San Francisco .......Oregon .......................Wasington ..................All other .....................
Total ...................
Barels.
Total 5July. August. September. October. November. months.
44, 69 43,082 25,261 7,228 1,169 121.329602,877 467,306 875,634 841,462 733,312 3,020,491572,427 96,725 45,491 91,973 0, 72 837,398
8,979 164,502 40,820 39,472 46,085 3.59,948102,044 32,696 23,40 17 081 16,049 191,270
2,257 41,384 5,129 3,088 4,674 M ,&3047,242 53,746 40,190 18,239 20, 749 180, 18
139,601 103,874 172,843 135,692 131,R5 733,52582,298 14,223 8,737 3,032 2,569 105,847
118,626 14,123 25,284 95,660 11,452 263,145245,904 40,410 75,763 230,095 44,709 63,9413115.61 21,858 87,202 110,277 50,709 585,59713,429 12,088 11,906 13,473 7,200 58,896
2,403,822 1,106,707 938,530 1, 06, 770 1,101,054 7,156, 883
I Preliminary figures.

16 DEVELOPMENT OF THE WHEAT AND FLOUR TRADE.
TABL 2.--Export. of wheas flour, July 1 to Det. 1, 1920, by month* and principaldistrict-Continued.
. -Value.
Districts. III
July. August. September. October. November. Total 5rnonltis.
Masehusetts ................ $491,&5 $473,379 $283,148 w,102 $12,388 $1,320,702New York .............. 8 63,615 5,788,732 4,727,513 10,(42,960 8,617,584 35,814,404Phila~lephi ................. 8,421,216 l,205,3.5 597,032 1,045,740 0o4,177 9, 573, 50Mrvand .......... . 737,84 1,700,109 473,006 443, 20 462,612 3,877,176Virginia ...................... 1,136,246 439,901 309,644 200,753 194,601 2,290,145Florida ...................... 31,191 58,322 60,873 39,473 58,384 784.223Mobile ................. 5 0, 198 676,469 5M,335 09,771 241,5 2,251,768New Orleanq ................. 2,253,430 1,300,946 2,093,50 1,682, 445 1,537,398 8,Sb7,722Oalvc~ton .................... 44 , 9O 170,458 50,145 39,822 38,547 743,741San Francisro ................ 1,207,558 178,723 299,604 1,100,54 124,456 2,970,889Oregon ....................... 2,628,446 441,271 919,99 2,365,201 459,607 6,814,523Washington .................. 3,778380 274,313 976,908 1,174,614 548,992 0,750,207All other ..................... 2oW.525 149, 56 143,707 157,710 81,28 732, 720
Total .................. 26,590,304 13,445,914 11,487,436 18,501,149 12,679,907 82,794,770
TABLE 3.-Importm of wheat (free), July 1 to Dec. 1, 1920.1
Bushels.
District&. Tot,IJuly. August. September. October. November. 5 months.
Vermont ................... 62 5,897 7. 9 15,487 23,228 52,640St. Lawrence ................ 1............ 12,662 12,553 5,704 30,920Buffalo ............................... 12,407 772,232 3,327, 109 4,675,100 8,788,848New York .................. 1g,607 170,312 ............ 539,163 213,859 941,941Philadelphia ..................................... . 25000 ........... 25,009Ban Diego .............................. .......... .. 185 ,8Washington .................. 3 171............ 1,150. . . 1,178Montana and Idaho .......... 966 12,005 7,40 5,500 89,283 115,214Dakota ....................... 21,954 7,164 268,596 424,538 208,253 930,503Minnesota .............. 13,782 63,127 185,264 480,588 462,199 1,174,958Duluth and Superior ....... ........... 29,655 632,408 3,318,927 2,470,412 6349,402Wisconsin ............... ....................... . 115,50 235,044 350,544Michigan ................................ 35,518 302,350 111,932 449,800Cicago ............................ 50,000........... 310,000 358,758 716,75Ohio .......... .... .. .,277 944,577 870,80 1,635,85All other .............. ................................... 9
Total .............. 55, 340,647 1,823 9,802,103 9,522,578 21,563,119
Value. N
District. Total,July. August. September. October. November. 5 months.
Vermont... .............. $125 $13,314 818,815 836,350 848,274 $114 878St. Lawrence8 ............ .35343 29,306 11,84 76A11Buffalo ............. 30,347 1,961,715 7,766,787 9,308,060 19,066,909New York ......... 18,488 127,407 ........... 1,224,388 475,100 1,845,381Philadelphia ..................................... .59,683 ............ 59, 083Bali Diego ..... ............ ....................... 2988 .......... 2,8Washington........ ......... 11 30 ........... 2,71 2,822Montana andlIdbo.......... 2,88 30 582 15,528 9,422 150,694 214,124Dakota ....................... 55,470 17,833 8 5,732 947,255 418,700 2,090,990Minnesota .................... 40,128 144,076 491,377 1,094,814 997,593 2,767,788Duluth and Superior ........... 77,348 1362,653 7,528,8 5,275,063 14,243,720Wisconsin... .......................... .... 253,151 450,718 703,869Michi -...................... .......... .. 8813H4 629344 222,782 940,430Chicago............. ............ 12000 ........... 786:425 74 050 1,675,475Ohio .... ..... 45,"1 2,284,76 1,437,692 3,767,79All other.............. ....- - 114 .. ..... ....................... 157
Total' ..................... 566,049 4,872,906 22,855,89 19,501,60 47,5730524
Preliminary figures.In addition to these imports there were 7,793,216 bushels of Canadian wheat and 248,761 barrels of flour
transported in bond through United States ports from July I to Doe. 1, 1920.
17DVELOPMENT OF THE WHEAT AND FLOUR TRADE.
Imports of weat (dutiablk)'
Bushels.District&
July. August. September.J October. Noveih ber. Total.
R n D eg . ............. .... .. 2,388 ............ ............ ............ 2,~ eon. 779 .
14 4 0!il o he ......... 7 71............ ............ ..[ .......... 7,79Allot .......... ....... ..... . .. ,ioI( e......... 14, 6
Total .......... 4928 24,180 141 48........ 00
Districts. ....
July. August. September. October. November. Total.
San Diego ................................ 14,300 117 ........................ $4,317Oteon. $1,9........... ............ .......... ............ 15,19aWashinton .. 6,8 45, ............. 82 4,3........ 113,)All other ..................... ........... ............ " 1..... iii*"
Total .................. 83,471 49,843 17 141 ............ 133,472
'Preliminary figures.
TABLz 4.-Imports of wheat flour (fee), July 1 to Dec. 1, 1920.1
Barrels.
Districts.July. August. September. October. November. Total 5
mmtfi.
Maine and New Hampshire. 71 262 117 280 208 918Vermont................... 28 1,016 1,602 23,467 21,697 50,365St. Lawrence................ 118 70 83 2,974 4,377 7,622Buffalo .......... 1 31,184 81,954 129,523New York ................ 4,108 6t787 2,894 57 5,404 19, 548San Francisco .............. 4 3 800 1,20o ,827 6,172 18, 899Washington .................. 1 300 2,089 590 1,533 4,513Montana and Idaho ......... . ........................ 294 8W 1,127Dakota ....................... 34 350 8 18,413 18,277 36,082Dulutirand Superior ........ . 1,723 5,022 4,3.53 79,105 5,590 146, 793Michigan .................... 2,400 17 3........ 158All other .............. ..... 61 4 271 "58 5,864 6,256
Totals ... . . . . . . . . . . . . . . 2,392 17,89 14,550 163,327 201,606 4Z3,804
Value.
Districts.July. August. September. October. November. Total, 5
months.
Maine and New Ilamlpsbre.. $943 $3,355 $1,721 13,685 $2,687 $12,371.Vermont ................ 32,843 14,488 19,368 281,273 241,821 589, 791St. Lawrence ................ 1, 89 1,002 1,188 35,507 52,388 91,781Buffalo ................. 142,215 46,592 21,623 371,912 80,707 1, 300 10"New York .............. .53,097 77,241 33,098 4,200 50,198 2Z, 832San Francisco ................ 58200 7,500 13,846 7, 530 65,173 221,049Washington .................. 10 i,091 26,407 8,.870 14, W8 511938Montana and Idaho .................................. ........... .767 10,402Dakota ....................... 501 4,642 102 195,038 172,527 372,810Duluth and Superior......... 23,316 71,078 55,489 805,829 652,808 1,0 2Michigan.................... 30,695 9 8,581 392All other................. .738 28 2,988 647 02,535 6,9
Total s ................. 344,254 229,917 175,637 1, 784,180 2,144, W 4,878,844
'Preliminary figures.'In addition to these imports there were 7,783,216 bushels of Canadian wheat and 248,761 barmls of.
flour transported in bond through United States ports from July I to Dec. 1, 10.
26902-20-2
a

18 DEVELOPMENT OF THE WHEAT AND FLOUR TRADE.
Imports of wheat/lour (dutiable).
Barrels.
Districts.July. August. September. October. November. Total
months.
El Paso ..................................... 6 ............ .LosAngeles. .............. 2............. ......... 2Fan rnis.................... 51 ............ ............ ............. 6All other ................ .................................... 1............ 1
Total ................ 6 2 8 1 14
Value.
Districts.July. August. September. October. November. Totals
Months.
El Paso ......... S50 ..................... ..Ls Angel............. ..... ...... $. 41.... ............ .41San F. cso.....7 ............ ......... ......... * 47.All other .................. ................ ......... ............ 16
Total............. ...... .47 41 so 101.. ... ....... 54
TABLE 5.-Cash price per bshl of wheat at Minneapolis and Winnipeg.
Minneapolis prices are for No. 1, Northern Spring wheat, compiled from the Northwestern Miller(Median of high and low.)
Winnipeg prices are for Manitoba No. 1, Northern wheat, at Fort William and Port Arthur, compiledfrom theNorthwestem Miller.
Winnipeg prices are converted Into United States currency at the rate of exchange prevailing on thedate of the quotation.
Date, 1920.
May I ..............May 15 .............June 4 .............June 18 ............July 3 ..............July 17 .............Aug. 5 .............Aug. 20...........Aug. 25 ............Aug. 26 ............Aug. 27 ............Aug. 28 ............Aug. 30 ............Aug. 31 ...........Sept. 1 .............Sept. 2 .............Sept. 3 .............Se- t. .............Set .............$ep t.7 .............Be t. 8 .............Sept.9 .............Sept. io .........
ep t. 11 .........Sep t. 13 ............Bept. 14 ............Sept. 15 ............Sept. 18.......Sept. 17 ...........Sept. 18 ............
Min-neapolls
No. 1,NorthernSpring.
$3.073.153.123.002.862.952.622.652.492.4'2.482.472.482.402.502.682.622.60
2.512.612'642.622.622.822.572.572.67
2.682.56
Winnipeg.
Mani-tobs NorthernNo. I (current
(par of ex-ex- change).
change).
. ...... ,...
..........
$2.702.712.79
2.762.772.812.822.762.77
2.772.822.802812.8652.832.802.822.782.812.79
$2.39
2.48i46i2.472522.56
2.642.54264
2.572.55
2.63
2.52
, Date, 1920.
Sept. 20 ............Sept. 21 ............_ept. 22 ............Sept. 23 ............Sept. 24 ............Sept.2 ............Sept. 27 ............Sept. 28 .............Sept. 29 ............Bept. 30 ............Oct..............Oct. 2 .........Oct.4 ........Oct. 5 .........Oct. .........Oct. 7 ..............Oct. 8 ........Oct. 9 ........Oct. 13 .........Oct. 12 .............Oct. 13 .............Oct. 14 .............Oct. 17 .............Oct. 16 .............Oct. 17 .............Oct. 18 .............Oct. 19 .............Oct. 20 .............Oct. 21 .............Oct. 22 .............
Min-neapolis
No. 1,NorthernSpring.
$2.582.452.492.492.82.312.382.362.392.302.232242.042.002.082.102.052.0812. 72.182.222.182.272.272.232.202.132.112.052.09
Winnipeg.
Maul.itoba NorthernNo. 1 (current
(par of ex-ex- change).
change).
82.782.682.732.702.642.542.552.572.582.482.422.382.242.172.212.222.202.282.352.342.382.362.45
,..........
,..........
,..........
2.362.382.292.33
$2.602.412.462.432.382.202.30
2.242.192.142031.97
2.022.082.16
2.122.21
2.142.142.07211
DEVELOPMENT OF THE WHEAT AND FLOUR TRADE. 19
TABL85.-Ca prie per bushel of wheat at Minneapolis and Winnipeg-Continued.
Winnipeg. Winnipe".
Mn- Mln-neaol Mani- neapois Mani-
Date, 120. No.1 toba Northern Date, 120. No.1 toba NorthernNorthern No. , (current Northern No. 1 (currentSpring. (par of ex- Spring. (par oi ex-
ex- change), ex- change).change) change).
Oct.23 ............ $2.07 .......... Nov. 23 ............ $1.62 $1.95 $1.75oot.25 ............. 2o06 $2.o .o. .............O o . 5 20 27 $106 Nov. 24............ 1.54 1.87 1.65
Oct. 26 ............. 2.12 23 2.12 Nov. 25 ...................... 1.83 ......Oct. 27 ............ 2.09 2.31 .......... Nov. 26 ............ 1.47 1.79 1.67Oct. 28 ............. 2.11 2.32 2.10 Nov. 27 ............ 1.49 1.83 1.61Oct. 29 ............. 2.11 2.33 2,11 Nov.29 ............ 1.51 1.87 1.65Oct. 30 ............. 1.11 2.32 2.10 Nov. 30 ............ 1.48 1.78 1.58Nov. I ............. 2.11 2.31 2.00 Dec. I .............. 1.56 1.84 1.62Nov. 2 ................... 2.29 .......... Dec. 2 ............ 1.64 1.92 1.68Nov. 3 ............. 2.07 2.27 2.05 Dec.8 .............. 1.69 1. PJ 1.72Nov. 4 ............. 2.01 2.23 .......... Dec. 4 ............. 1.70 2.)2 1.77Nov. 5 ............. 1.97 2.21 2.00 Dec.6 .............. 1.80 2.07 1.81Nov. 6 ............. 1.90 2.15 1.94 Dec. 7 .............. 1.72 1.89 1.63Nov. g ............. 1.83 2.08 ........ Pee. 8 .............. 1.70 ...... ........Nov. 9 ............. 1.76 2.00 .......... Dec.9 .............. 1.68 1.96 1.89Nov. 10 ............ 1.83 2.12 .......... Dec. 10 ............. 1.59 1.92 1.66Nov. 11 ............ 1.77 2.10 1.87 Dec. 11 ............. 1.61 1.92 1.66Nov. 12 ............ 1.72 2.11 .......... Dec. 13 ............. 1.62 1.85 1.60Nov. 13 ............ 1.75 2.08 1.85 Dec. 14 ............. 1.66 1.89 1.63Nov. 15 ............ 1.80 2.09 1.86 Dec. 15 ............. 1.59 1.88 1.61Nov. 16 ............ 1.82 2.11 1.88 Dec. 16 ............. 1.59 1.86 1.50Nov. 17 ............ 1.77 2.11 1.88 Dec. 17 ............ 1.65 1.94 1.65Nov. 18 ............ 1.74 2.06 1.83 Dec. 18........... 1.66 1.91 1.62Nov. 19 ........... 1.66 2.05 1.83 Dec. 20........... 1.9 ..............Nov. 20 ............ 1.58 1.98 1.77 Dec. 21 ............. 1.66.Nov. 22 ............ 1.53 1.95 1.76
TABLz 6.-xport of wheat from the United Staes, first 10 months of 1900.
(Source: Monthly Summary Foreign and Domestic Commerce of the United States.]
Exports, Exportso ExportJanuary July to flstl 10
To- to June, August, months ofinclusive, Inclusive, 19ts.•.1920. 1920. 10.
Bwhe., Bushe. Buthel.Austria. ....................................... 210,278............. . 210,276Belgium .............. ....................... 4,349,2D6 8,437,366 12,786,560France ...................................................... 888,931 13,908,918 20,762,849Germany ................................................... .302, 849 4,718,573 5,021 422Gibraltar .................................................... 841381 1,391,49 2,0832,877Gre ..................................................... 70,184 .............. 7 184Italy ....................................... 7,14,031 15,643,339 22,788,370Netherlands 7t 1 ...................................... .... 77,1,26Norway ...................................................... 185,90 52,000 237 900Switzerland .................................................. 32,000 250, 511 282,511United Kingdom ........ ....................... 19,432,738 61,063,195 70,495,931Canada .................................................... 6,9852 7,049,469 13,98321Other countries ............................................... 1,53,173 8,278,184 9,841,357
Total.................................................. 48,387,518 117,981,296 166,M 8,814
0