I have the honour of submitting the - Ellipsis · I have the honour of submitting the ... PIDA...
236
Transcript of I have the honour of submitting the - Ellipsis · I have the honour of submitting the ... PIDA...

I have the honour of submitting the
2015/16 Annual Report of the Department
in terms of the Public Finance Management Act, 1999
JOE MJWARA
Acting Director General
31 August 2016

Contents
PART A: GENERAL INFORMATION 1
1. DEPARTMENT GENERAL INFORMATION 2
2. LIST OF ABBREVIATIONS/ACRONYMS 3
3. FOREWORD BY THE MINISTER 7
4. STATEMENT BY THE DEPUTY MINISTER 9
5. REPORT OF THE ACCOUNTING OFFICER 11
6. STATEMENT OF RESPONSIBILITY AND CONFIRMATION OF ACCURACY FOR THE ANNUAL REPORT 18
7. STRATEGIC OVERVIEW 19
7.1 Vision 19
7.2 Mission 19
7.3 Values 19
8. LEGISLATIVE AND OTHER MANDATES 19
9. ORGANISATIONAL STRUCTURE 22
10. ENTITIES REPORTING TO THE MINISTER 23
PART B: PERFORMANCE INFORMATION 25
1. AUDITOR GENERAL’S REPORT: PREDETERMINED OBJECTIVES 26
2. OVERVIEW OF DEPARTMENTAL PERFORMANCE 26
2.1 Service Delivery Environment 26
2.2 Service Delivery Improvement Plan 28
2.3 Organisational Environment 28
2.4 Key Policy Developments and Legislative Changes 29
3. STRATEGIC OUTCOME ORIENTED GOALS 29
4. PERFORMANCE INFORMATION BY PROGRAMME 31
4.1 Programme 1: Administration 31
4.2 Programme 2: ICT International Affairs 33
4.3 Programme 3: ICT Policy, Research and Capacity Development 38
4.4 Programme 4: ICT Enterprise Development and SOE Oversight 61
4.5 Programme 5: ICT Infrastructure Support 69
5. TRANSFER PAYMENTS 77
5.1 Transfer Payments to Public Entities 77
5.2 Transfer Payments to all Organisations other than Public Entities 78
6. CONDITIONAL GRANTS 78
6.1 Conditional Grants and Earmarked Funds Paid 78
6.2 Conditional Grants and Earmarked Funds Received 78
7. DONOR FUNDS 79
7.1 Donor Funds Received 79
8. CAPITAL INVESTMENT 79
8.1 Capital Investment, Maintenance and Asset Management Plan 79
PART C: GOVERNANCE 81
1. INTRODUCTION 82
2. RISK MANAGEMENT 83
3. FRAUD AND CORRUPTION 85
4. MINIMISING CONFLICT OF INTEREST 86
5. CODE OF CONDUCT 86
6. HEALTH, SAFETY AND ENVIRONMENTAL ISSUES 86
7. PORTFOLIO COMMITTEES 87
8. SCOPA RESOLUTIONS 88
9. PRIOR MODIFICATIONS TO AUDIT REPORTS 88
10. INTERNAL CONTROL UNIT 89
11. INTERNAL AUDIT AND AUDIT COMMITTEES 90
12. AUDIT COMMITTEE REPORT 91
PART D: HUMAN RESOURCE MANAGEMENT 94
1. INTRODUCTION 95
2. OVERVIEW OF HUMAN RESOURCES 95
3. HUMAN RESOURCES OVERSIGHT STATISTICS 96
PART E: FINANCIAL INFORMATION 126
1. REPORT OF THE AUDITOR GENERAL 127
2. ANNUAL FINANCIAL STATEMENTS 137

PART A GENERAL
INFORMATION
page 1

1. DEPARTMENT GENERAL INFORMATION
PHYSICAL ADDRESS: IParioli Office Park
1166 Park Street
Hatfield, Pretoria
POSTAL ADDRESS: Private Bag X860
Pretoria
0001
TELEPHONE NUMBER/S: 027 12 427 8000
FAX NUMBER: 027 12 427 8561
EMAIL ADDRESS: [email protected]
WEBSITE ADDRESS: www.dtps.gov.za
page 2
2. LIST OF ABBREVIATIONS/ACRONYMS.za DNA Domain Name Authority
AC Audit Committee
AG Auditor-General
AGSA Auditor General of South Africa
AO Accounting Officer
APP Annual Performance Plan
ATU Africa Telecommucations Union
AU African Union
BBBEE Broad-Based Black Economic Empowerment
BBI Broadband Infraco
BDM Broadcasting Digital Migration
BEE Black Economic Empowerment
BRICS Brazil, Russia, India, China and South Africa
CA Council of Administration
CD Chief Director
CFO Chief Financial Officer
CIPC Companies and Intellectual Property Commission
COIDA Compensation for Occupational Injuries and Diseases Act
COP Communities of Practice
CPOs Chief Procurement Officers
CSIR Council for Scientific and Industrial Research
CTO Commonwealth Telecommunication Organization
DBAC Departmental Bid Adjudication Committee
DBE Department of Basic Education
DDG Deputy Director-General
DDGs Deputy Directors-General
DEC Departmental Executive Committee
DG Director General
DoC Department of Communications
DPSA Department of Public Service and Administration
Dr Doctor
DTI Department of Trade and Industry
DTPS Department of Telecommunications and Postal Services
DTT Digital Terrestrial Television
page 3
EAP Employee Assistance Program
ECA Electronic Communications Act
ECT Electronic Communications and Transactions Act
EE Employment Equity
ESEID Economic Sectors, Employment and Infrastructure Development Cluster
ETOE’s Extra-terrestrial Offices of Exchange
EXCO Executive Committee
FOSAD Forum of South African Director Generals
GITO Government Information Technology Officers
GTAC Government Technical Advisory Centre
HDIs Historically Disadvantaged Individuals
HIV Human Immunodeficiency Virus
HR Human Resources
HRD Human Resources Development
HRM Human Resources Management
i.t.o In terms of
ICASA Independent Communications Authority of South Africa
ICT Information Communications and Technology
ICTs Information Communications and Technologies
INeSI Ikamva National eSkills Institute
ISSA Information Systems Security Association
IT Information Technology
ITU International Telecommunications Union
KIM Knowledge and Information Management
KZN Kwa-Zulu Natal
LLB Latin Legum Baccalaureus
LLD Doctor of Law
Ltd Limited
MEC Member of Executive Council
MMS Middle Management Service
MoA Memorandum of Agreement
MoI Memorandum of Incorporation
MoU Memorandum of Understanding
MP Member of Parliament
MPAT Management Performance Assessment Tool
page 4

MTEC Medium Term Expenditure Committee
MTEF Medium Term Expenditure Framework
MTN Mobile Telephone Networks
MVNCs Marcus Vinicius
NDP National Development Plan
NEMISA National Electronic Media Institute of South Africa
NHI National Health Insurance
NRF National Retail Federation
OPSCOM Operations Committee
PA Public Audit
PAPU Pan African Postal Union
PFMA Public Finance Management Act
PIDA Project of Infrastructure Development in Africa
PMO Project Management Office
PoPs Points of Presence
PSC Public Service Commission
PSCBC Public Service Commission Bargaining Council
Pty Proprietary
R&D Research and Development
RFI Request for Information
RMC Risk Management Committee
RSA Republic of South Africa
SA EU South African European Union
SA South Africa
SABC South African Broadcasting Corporation
SADC South African Development Community
SAPO South African Post Office
SARB South African Reserve Bank
SBD Standard Bidding Document
SCM Supply Chain Management
SDIP Service Delivery Improvement Plan
SEIAS Socio-Economic Impact Assessment System
SETA Sector Education and Training Authority
SHERQ Safety, Health, Environment, Risk & Quality
SITA State Information Technology Agency
page 5
SIU Special Investigation Unit
SMME Small Medium and Micro Enterprise
SMMEs Small Medium and Micro Enterprises
SMS Senior Management Service
SOC State Owned Company
SOCs State Owned Companies
SOE State Owned Enterprise
SOEs State Owned Enterprises
SSA State Security Agency
STB Set Top Boxes
TMC Top Management Committee
TV Television
UPU Universal Postal Union
USAASA Universal Service and Access Agency of South Africa
USAF Universal Service and Access Fund
USO United Service Organization
WRC World Radio Conference
page 6
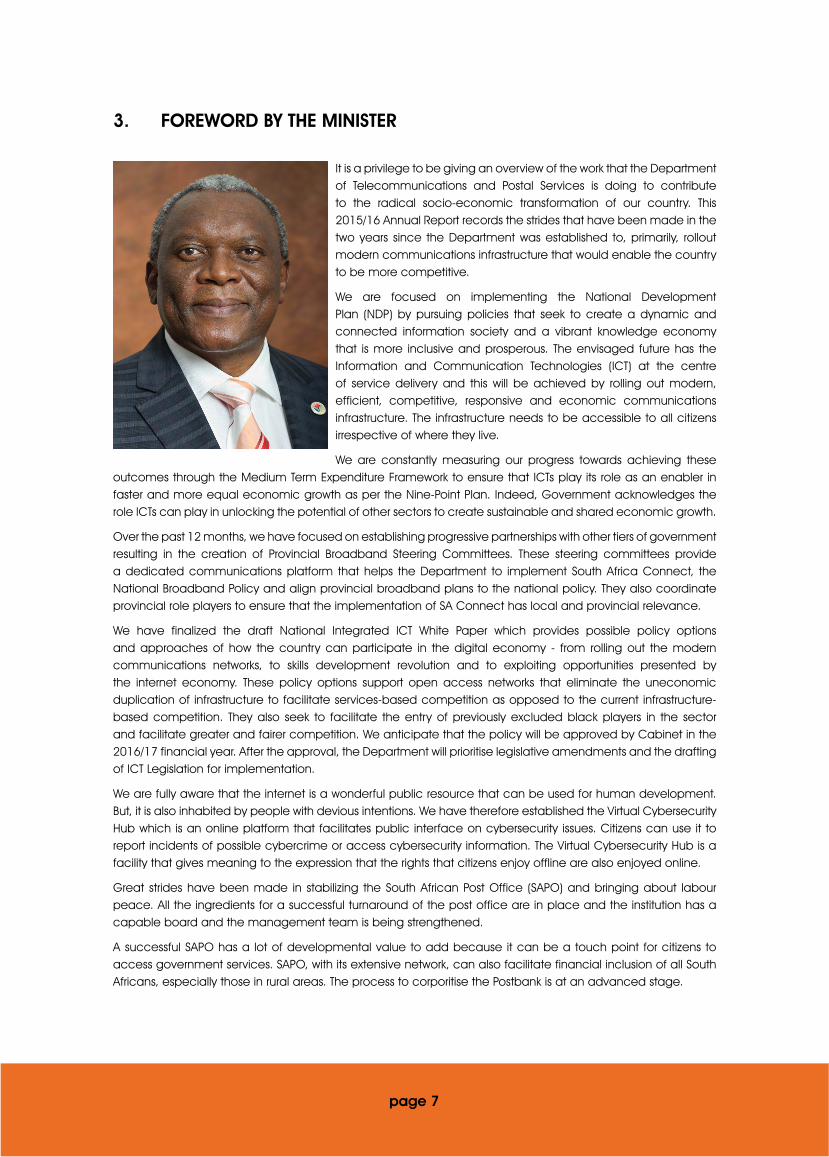
3. FOREWORD BY THE MINISTER
It is a privilege to be giving an overview of the work that the Department of Telecommunications and Postal Services is doing to contribute to the radical socio-economic transformation of our country. This 2015/16 Annual Report records the strides that have been made in the two years since the Department was established to, primarily, rollout modern communications infrastructure that would enable the country to be more competitive.
We are focused on implementing the National Development Plan (NDP) by pursuing policies that seek to create a dynamic and connected information society and a vibrant knowledge economy that is more inclusive and prosperous. The envisaged future has the Information and Communication Technologies (ICT) at the centre of service delivery and this will be achieved by rolling out modern, efficient, competitive, responsive and economic communications infrastructure. The infrastructure needs to be accessible to all citizens irrespective of where they live.
We are constantly measuring our progress towards achieving these outcomes through the Medium Term Expenditure Framework to ensure that ICTs play its role as an enabler in faster and more equal economic growth as per the Nine-Point Plan. Indeed, Government acknowledges the role ICTs can play in unlocking the potential of other sectors to create sustainable and shared economic growth.
Over the past 12 months, we have focused on establishing progressive partnerships with other tiers of government resulting in the creation of Provincial Broadband Steering Committees. These steering committees provide a dedicated communications platform that helps the Department to implement South Africa Connect, the National Broadband Policy and align provincial broadband plans to the national policy. They also coordinate provincial role players to ensure that the implementation of SA Connect has local and provincial relevance.
We have finalized the draft National Integrated ICT White Paper which provides possible policy options and approaches of how the country can participate in the digital economy - from rolling out the modern communications networks, to skills development revolution and to exploiting opportunities presented by the internet economy. These policy options support open access networks that eliminate the uneconomic duplication of infrastructure to facilitate services-based competition as opposed to the current infrastructure-based competition. They also seek to facilitate the entry of previously excluded black players in the sector and facilitate greater and fairer competition. We anticipate that the policy will be approved by Cabinet in the 2016/17 financial year. After the approval, the Department will prioritise legislative amendments and the drafting of ICT Legislation for implementation.
We are fully aware that the internet is a wonderful public resource that can be used for human development. But, it is also inhabited by people with devious intentions. We have therefore established the Virtual Cybersecurity Hub which is an online platform that facilitates public interface on cybersecurity issues. Citizens can use it to report incidents of possible cybercrime or access cybersecurity information. The Virtual Cybersecurity Hub is a facility that gives meaning to the expression that the rights that citizens enjoy offline are also enjoyed online.
Great strides have been made in stabilizing the South African Post Office (SAPO) and bringing about labour peace. All the ingredients for a successful turnaround of the post office are in place and the institution has a capable board and the management team is being strengthened.
A successful SAPO has a lot of developmental value to add because it can be a touch point for citizens to access government services. SAPO, with its extensive network, can also facilitate financial inclusion of all South Africans, especially those in rural areas. The process to corporitise the Postbank is at an advanced stage.
page 7

Decisive steps have been taken to stabilize the leadership of the Department. Over the course of the year we sought to understand the underlying causes of instability in the Department. As you may recall, two Deputy Directors-General (DDGs) were expelled by the Director-General (DG) last year. We are grateful for the support we received from the staff of the Department and all partners in these processes, especially the Public Service Commission (PSC) and the Special Investigating Unit. The Department is implementing the recommendations that came out of these processes. The PSC recommended that we take disciplinary steps against the DG who was expelled as the outcome of that disciplinary process. We are in the process of filling the DG’s post.
We have filled the vacancies that existed at the top management structure of the Department, particularly two DDG’s, i.e. for Administration and State-Owned-Enterprises Oversight branches and the Chief Financial Officer. This financial year, the Department is prioritizing aligning its structure to enable it to deliver more efficiently on its mandate.
The Department exists to increase the use and uptake of technology in the delivery of government services in a manner that improves the lives of our citizens. It is supported by entities such as Broadband Infraco, SITA, Sentech, SAPO, the National Electronic Media Institute of South Africa and the Universal Service and Access Agency of SA.
As always, we have noted and accepted the recommendation of the Auditor-General and the Audit Committee. In this regard, we have directed the Department to fully implement the recommendations as a matter of priority.
page 8
4. STATEMENT BY THE DEPUTY MINISTER
During the month of September last year, the world leaders welcomed
the adoption of the 2030 Agenda for Sustainable Development, which
includes 17 Sustainable Developmental Goals (SDGs). Whilst ICTs are
not identified as a specific goal, it is referred to as the ghost goal,
which underpins the achievement of all 17 goals. Information and
communication technologies (ICTs), including access to internet, are
key enablers of development and also are a catalyst for accelerating
the outcomes of all three pillars of sustainable development, economic
development, social inclusion and environmental protection. What this
means is that, as a Department we have a critical role of ensuring
affordable, equitable access and usage of broadband through the
creation of an enabling policy and regulatory framework, which puts
ICTs at the core of its agenda, to create a more vibrant society and
knowledge economy that is inclusive, equitable and prosperous.
The World Summit on Information Society has developed action lines which are linked to the Sustainable
Development Goals.
Our progressive policies and strategies as well as the potential of our ICT Sector and the economy as the
whole has attracted international players and Original Equipment Manufacturers to want to invest more in
our country, particularly in the ICT applications for education and health. These multinationals realized that
we are a developing country which is part of the countries with more than 4 billion unconnected people. Our
advanced ICT Sector has made companies to want to hold technology expositions based on our policies,
services, applications and innovations in the education and the health sector.
As we facilitate broadband rollout, we are equally facilitating strategies for e-Government and e-Skills. We have
continued with our work on e-Strategies in partnership with other government departments and our own State
Owned Companies. Our work on developing a coherent National e-Strategy continues and is seen as a step
which will provide a clear direction for the implementation of e-Government in the public service. Due to rapid
developments in technology, the skills requirement has become a moving target, and we have to keep abreast
of developments in the country and abroad to ensure that the country produces the skills required in this new
technology environment.
Whilst ensuring that our people have access to fast reliable Internet we need to also ensure their safety online.
We have established the virtual Cybersecurity Hub as a point of reference for citizens in as far as cybersecurity
issues are concerned providing a repository of information regarding the do’s and don’ts of Internet for children,
best practice guide for parenting on the Internet and how the average South Africans can protect themselves
against malicious attacks, identity theft and experiance online financial security.
To promote socio-economic development, we have given special attention to our SMMEs. We have engaged
in the process of developing the ICT SMME Strategy in consultation with relevant stakeholders with a view to
promoting transformation of the ICT Sector. The Department has succeeded in the process of establishing
the ICT B-BBEE Charter Council to support the Government’s priority of using Broad-Based Black Economic
Empowerment to transform our sector and society. We are delighted in the fact that the Council will take
responsibility for the annual monitoring and reporting on the implementation of the ICT B-BBEE Sector Code.
page 9
Although it has been over two decades since the introduction of the ICT Sector in our economy, there is still a lack
of information on the actual use of Information and Communications Technology for economic development.
We have in this case continued with awareness campaigns on the use of ICTs for economic inclusion especially
to the vulnerable groups such as women, children and people with disabilities. We have also been pushing the
transformation agenda aggressively in the sector through initiatives such as the Dr. Ivy Matsepe-Cassaburi Annual
Memorial Lecture whereby we focus on women development and empowerment.
HON. PROF. HLENGIWE BUHLE MKHIZE, MP
Deputy Minister
Republic of South Africa
page 10
5. REPORT OF THE ACTING ACCOUNTING OFFICER
OVERVIEW OF THE OPERATIONS OF THE DEPARTMENT
During the 2015/16 financial year, the Department of Telecommunications
and Postal Services (DTPS) continued with the implementation of its key
strategic priorities, in line with its new mandate following the National
Macro Organisation of the State which took place after the 2014 National
Elections. Such priorities as outlined below, were aligned to the Medium
Terms Strategic Framework (MTSF) and hence fully embraced Government’s
outcomes-based approach so as to meaningfully contribute to the growth
of the ICT Sector and broader socio-economic development as a whole.
South Africa Connect
South Africa Connect, the National Broadband Policy and the associated
strategy and plan, gives expression to South Africa’s vision in the National
Development Plan (NDP) of “a seamless information infrastructure by 2030
that will underpin a dynamic and connected vibrant information society
and a knowledge economy that is more inclusive, equitable and prosperous”. In this regard, the Department
contributes to Government Outcome 6 which is focused on the development of an efficient, competitive, and
responsive economic infrastructure network.
In the 2015/16 financial year, the Department planned to provide connectivity to 1296 identified government
institutions through the implementation of Phase 1 of the Digital Development Plan. However, the Department was
unable to fully achieve the set target. Although the Department established the Project Management Office to
manage the SA Connect project as well as developed a draft Programme Implementation Plan and a Project
Management Plan, the actual connectivity was severely hampered by delays in appointing the connectivity
service provider as planned. However, in order to address this challenge, the Department is engaging with relevant
stakeholders as well as exploring all available options to ensure that going forward, the planned connectivity is
rolled out in line with allocated resources. In terms of the implementation of Phase 2 of the Digital Development
Plan, during the reporting period the Department developed a Phase 2 business case document which was
submitted to National Treasury. However, due to fiscal constraints Treasury only allocated funding for Phase 2 to
commence in 2018/19, with an allocation of approximately R60 million.
ICT Policy Review
The National Integrated ICT White Paper replaces the separate White Papers on Telecommunications (1996) and
Postal Services (1998). It responds to the development of technology including convergence, digitisation, the
increasing use of the Internet, and how South Africans communicate, work and interact with Government. The
policy is a strategic instrument to implement what is envisaged by the National Development Plan as it introduces
a range of interventions to ensure everyone in South Africa, irrespective where they live or their socio-economic
status can access the benefits of participating in the digital society. Therefore, the White Paper lays the foundation
for realising the NDP vision for the ICT sector to create “a seamless information infrastructure by 2030 that will
underpin a dynamic and connected vibrant information society and a knowledge economy that is more inclusive,
equitable and prosperous”.
During the reporting period, the Department briefed relevant stakeholders, including the Portfolio Committee
on Telecommunications and Postal Services on the ICT Policy Review Panel’s Policy Recommendations Report
which highlights a range of policy options and possible policy approaches to inform the development of the
White Paper. The Department formally established the extended Project Management Office (PMO) Research
and Analysis team and additional areas of research were identified, scoped and coordinated. The draft National
Integrated ICT Policy White Paper was thereafter developed, approved and tabled at the Cabinet (Economic
page 11

Sectors, Employment and Infrastructure Development Cluster (ESEID) Cabinet Committee).
Cybersecurity
Cyberspace comes with new types of challenges to the governments of the world and it therefore introduces
a further dimension to National Security. It is a borderless platform that enables more sophisticated threats such
as cybercrime, cyber terrorism, cyber war and cyber espionage. For this reason, the cyber threats need to be
addressed at both the global and national levels.
During the reporting period the Department ensured that the ICT Infrastructure of the Virtual Cybersecurity Hub was
reconfigured and hardened after which the Department commissioned and launched the virtual Cybersecurity
Hub on 30 October 2015. The Cybersecurity Hub offers alerts and warnings, announcements, security related
information dissemination, incident handling and incident response support as services to its constituents. These
services can be categorised as proactive, reactive and social services. With regards to incident handling, incidents
are logged via the Cybersecurity Hub website and depending on their evaluation, incidents that can be handled
by the Cybersecurity Hub are timeously resolved or else relevant incidents are escalated to other agencies for
further investigation.
Overview of the financial results of the Department:- Departmental receipts
Departmental receipts
2015/2016 2014/2015
EstimateActual
Amount Collected
(Over)/Under Collection Estimate Actual
Amount Collected
(Over)/Under Collection
R’000 R’000 R’000 R’000 R’000 R’000
Tax Receipts - - - - -
Casino taxes - - - - -
Horse racing taxes - - - - -
Liquor licences - - - - -
Motor vehicle licences - - - - -
Sale of goods and services other than capital assets 55 52 3 60 57 3
Transfers received - - - 728 728 -
Fines, penalties and forfeits - - - - - -
Interest, dividends and rent on land 2,165,531 1,335,925 829,606 1,744,509 1,669,514 74,995
Sale of capital assets - - - - - -
Financial transactions in assets and liabilities 25,196,171 25,468,458 (272,287) 1,710 1,705 5
Total 27,361,757 26,804,435 557,322 1,747,007 1,672,004 75,003
page 12
The Departmental revenue comprises mainly of dividends received from Telkom and Vodacom. The sale of goods
and services other than capital assets is mainly administration fees. The decline in transfers received is due to an
insurance claim received in the 2014/15 financial year for a vehicle written off. The under collection of dividends
is as a result of the sale of Vodacom shares by the Department.
The increase in Financial Transactions in assets and liabilities is in respect of the sale of Vodacom shares. The
Department does not render free services.
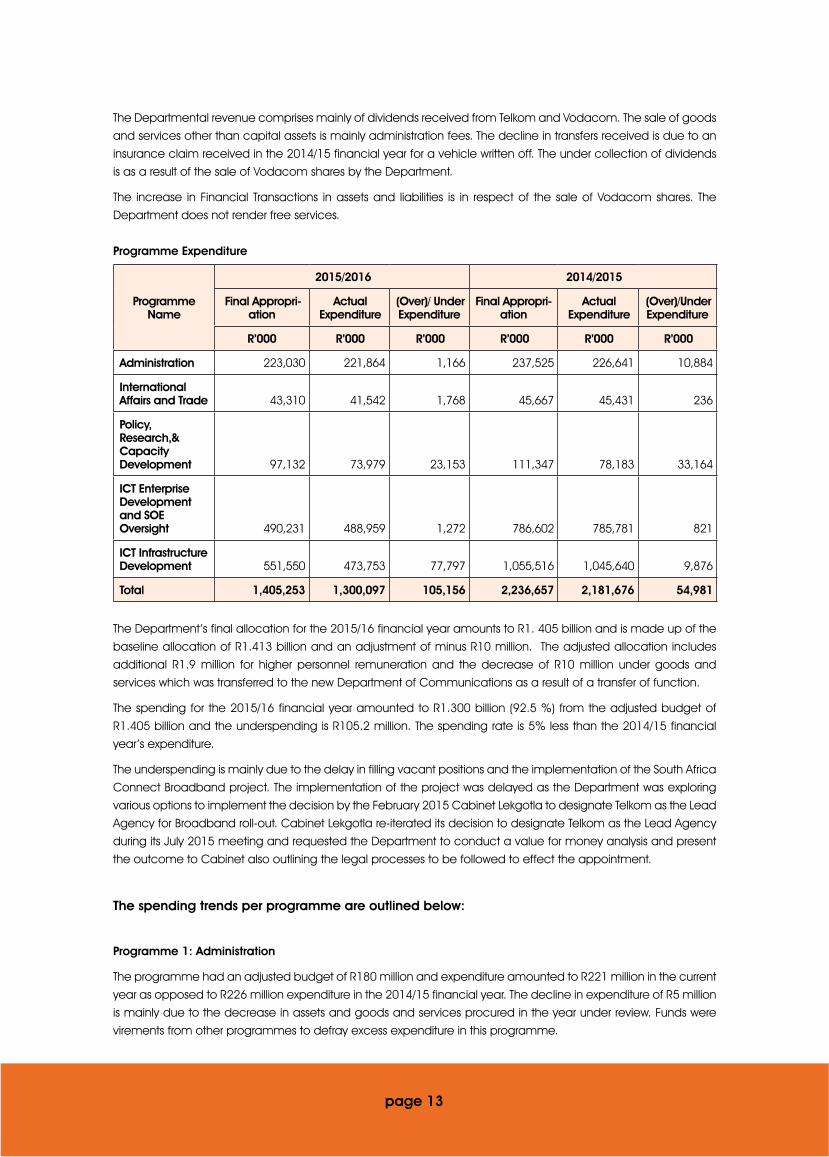
Programme Expenditure
Programme Name
2015/2016 2014/2015
Final Appropri-ation
Actual Expenditure
(Over)/ Under Expenditure
Final Appropri-ation
Actual Expenditure
(Over)/Under Expenditure
R’000 R’000 R’000 R’000 R’000 R’000
Administration 223,030 221,864 1,166 237,525 226,641 10,884
International Affairs and Trade 43,310 41,542 1,768 45,667 45,431 236
Policy, Research,& Capacity Development 97,132 73,979 23,153 111,347 78,183 33,164
ICT Enterprise Development and SOE Oversight 490,231 488,959 1,272 786,602 785,781 821
ICT Infrastructure Development 551,550 473,753 77,797 1,055,516 1,045,640 9,876
Total 1,405,253 1,300,097 105,156 2,236,657 2,181,676 54,981
The Department’s final allocation for the 2015/16 financial year amounts to R1. 405 billion and is made up of the
baseline allocation of R1.413 billion and an adjustment of minus R10 million. The adjusted allocation includes
additional R1.9 million for higher personnel remuneration and the decrease of R10 million under goods and
services which was transferred to the new Department of Communications as a result of a transfer of function.
The spending for the 2015/16 financial year amounted to R1.300 billion (92.5 %) from the adjusted budget of
R1.405 billion and the underspending is R105.2 million. The spending rate is 5% less than the 2014/15 financial
year’s expenditure.
The underspending is mainly due to the delay in filling vacant positions and the implementation of the South Africa
Connect Broadband project. The implementation of the project was delayed as the Department was exploring
various options to implement the decision by the February 2015 Cabinet Lekgotla to designate Telkom as the Lead
Agency for Broadband roll-out. Cabinet Lekgotla re-iterated its decision to designate Telkom as the Lead Agency
during its July 2015 meeting and requested the Department to conduct a value for money analysis and present
the outcome to Cabinet also outlining the legal processes to be followed to effect the appointment.
The spending trends per programme are outlined below:
Programme 1: Administration
The programme had an adjusted budget of R180 million and expenditure amounted to R221 million in the current
year as opposed to R226 million expenditure in the 2014/15 financial year. The decline in expenditure of R5 million
is mainly due to the decrease in assets and goods and services procured in the year under review. Funds were
virements from other programmes to defray excess expenditure in this programme.
page 13
Programme 2: International Affairs
The programme had an adjusted budget of R43 million and expenditure amounted to R42 million in the current
year as opposed to R45 million expenditure in the 2014/15 financial year. There is a decline in spending of R4
million under compensation of employees. 51% of the adjusted budget of the programme is transfer payments for
membership fees to foreign governments and international organisations. The allocation for these fees increased
by R6 million in the year under review due to rand depreciation against the foreign currencies in which the
membership fees had to be paid.
Programme 3: ICT Policy, Research, & Capacity Development
The programme had an adjusted budget of R106 million and the expenditure in this programme totalled R74
million in the current financial year which is a decrease of R4 million from the 2014/15 financial year. The decrease
is mainly due to the decline of R4 million under goods and services due to the implementation of austerity
measures.
Programme 4: ICT Enterprise Development and SOE Oversight
The programme had an adjusted budget of R448 million and the expenditure in this programme totalled R489
million in the current financial year which is a decrease of R297 million from the 2014/15 financial year. This is
mainly due to the decrease of R269 million under transfer payments to Departmental agencies and accounts as
well as to public corporations and private enterprises. The goods and services expenditure amounted to R4 million
in the current year as opposed to R35 million in the 2014/15 financial year. This was mainly due to the decline in
the use of consultants.
Programme 5: ICT Infrastructure Support
The programme had an adjusted budget of R628 million and the expenditure in this programme totalled R474
million in the current financial year which is a decline of R572 million from the 2014/15 financial year. This mainly
due to the decrease of R602 million under transfer payments to Departmental agencies and accounts as well as
to public corporations and private enterprises and an increase in goods and services expenditure amounting to
R65 million in the current year as opposed to R35 million in the 2014/15 financial year.
Virements/roll overs
Virements as reflected on the Appropriation Statement amounting to R85 million was applied in terms of section
43(1) of the Public Finance Management Act, 1999 (Act 1 of 1999). The virement of R85 million, from Programme
2, 3 and 5 to Programme 1 and 4, is made to defray excess expenditure. The funds viremented from programmes
were used mainly to fund the shortfall on compensation of employees, office accommodation and Software
licences.
The request for rollovers were for Digital Terrestrial Television awareness campaign, the upgrading of the
IT infrastructure, the Government Technical Advisory Centre (GTAC) to provide support services for various
Departmental projects, which would operate under the broadband framework and for the national roaming
study. The request was not approved by National Treasury.
Unauthorised Expenditure
The Department did not incur any unauthorised expenditure during the period under review.
Fruitless and Wasteful expenditure
The fruitless and wasteful expenditure incurred in the year under review amounted to R46 000. R352 000 from
the previous years was written off during the current period and the amount recovered amounted to R2 000. The
page 14

Department maintains a register of fruitless and wasteful expenditure and the Policy on Losses and Debt were
reviewed in the year under review. Losses are written off in accordance with the losses and debt policies and
chapters 9, 11 and 12 of the Treasury Regulations.
There are punitive measures against perpetrators and awareness campaigns are carried out to avoid recurrence
of fruitless and wasteful expenditure.
Future plans of the Department
Broadband Roll-out
In the 2016/17 financial year the Department will prioritise the appointment of the Broadband connectivity service
provider in line with due process so as to speedily ensure the commencement of connectivity to identified sites. In
so doing, the Department will project manage the connectivity of identified sites (Phase 1), in line with allocated
funding, towards connecting 2700 sites in the 2016/17 financial year. As part of its project management role, the
Department will capacitate the Broadband Connectivity Project Management Office to manage the planning
and implementation of SA Connect projects. The Department will also finalise the Broadband Connectivity
Implementation Plan that will list the activities, costs, identified risks, and schedules that are required to achieve the
objectives of broadband plans. In order to achieve the annual connectivity target, the Department has committed
to project manage and monitor the connectivity of 675 identified sites per quarter.
ICT Policy Review
In the 2015/16 financial year, the Department made great strides with regards to the ICT Policy Review
process. The Department conducted briefings to relevant stakeholders, including the Portfolio Committee on
Telecommunications and Postal Services on the ICT Policy Review Panel’s Policy Recommendations Report which
highlighted a range of policy options and possible policy approaches to inform the development of the White
Paper. The Department thereafter developed the draft National Integrated ICT Policy White Paper. The National
Integrated ICT Policy White Paper was approved by the Minister for tabling at Cabinet (ESEID Cabinet Committee).
Subsequent to the tabling, the White Paper was deferred for additional input and will be re-submitted to Cabinet
in the first quarter of the 2016/17 financial year, focusing on the identification and prioritisation of legislative
amendments followed by the drafting of ICT Legislation.
Organisational Restructuring
During the reporting period, the Department functioned under the approved structure of the former Department of
Communications, which was not aligned to its newly assigned mandate and functions. Therefore, in the 2016/17
financial year, the Department will focus on the process of reviewing the current organisational structure with
the aim to create an organisational structure followed by related process, functions and systems which are fully
aligned to the revised organisational strategy and mandate. Together with the Department of Public Service
and Administration (DPSA), the structural review process has commenced through the development of the
Department’s Service Delivery Model.
Public Private Partnerships
None
Discontinued activities / activities to be discontinued
None
New or proposed activities
page 15
During the period under review, the Department commenced with the process of Organisational Restructuring
so as to align the organisational structure with the new mandate and strategy of the Department following the
National Macro Organisation of the State.
Supply Chain Management
The Department did not have unsolicited bid proposals during the year under review. The irregular expenditure
has been dealt with as per the guidelines from National Treasury. The Supply Chain Management policies and
delegations are effective and also addresses the prevention of irregular expenditure. Furthermore the Supply
Chain Management (SCM) function is centralized and all bid committees are in place. The challenge of SCM was
due to capacity constraints, however the Department is in the process of filling critical vacant positions.
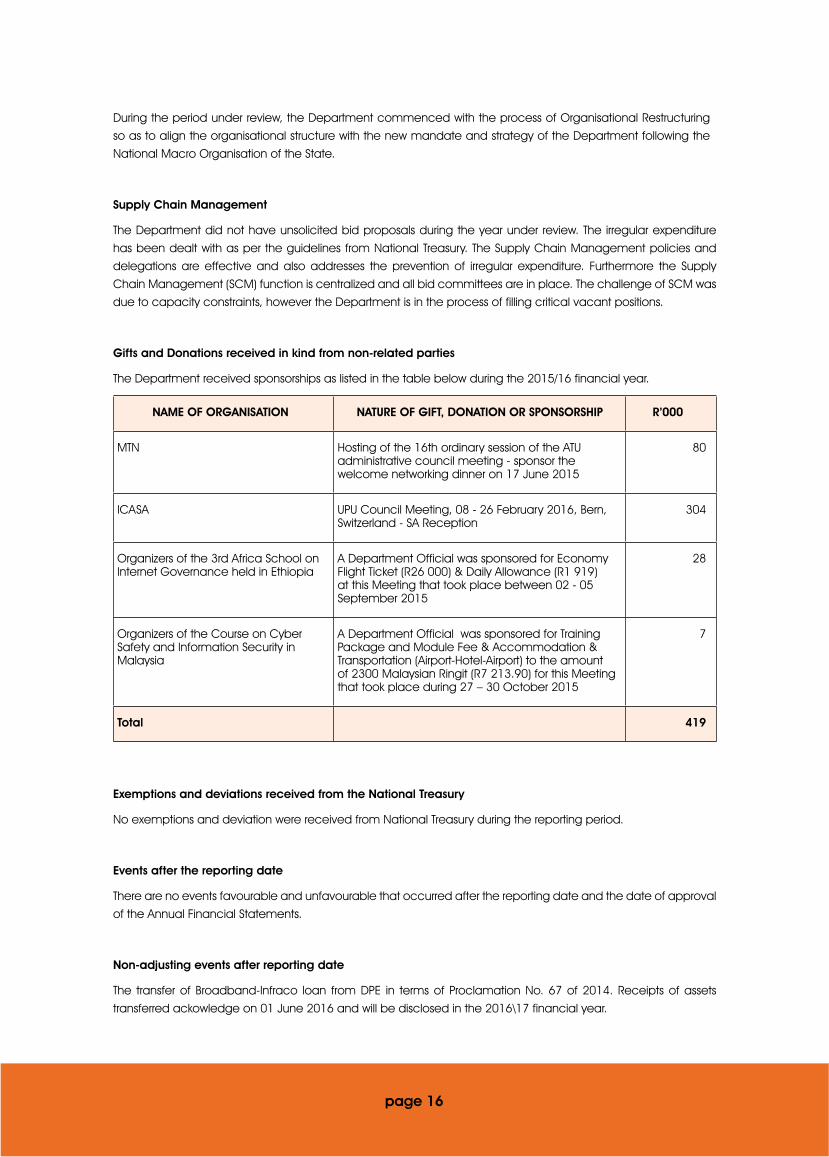
Gifts and Donations received in kind from non-related parties
The Department received sponsorships as listed in the table below during the 2015/16 financial year.
NAME OF ORGANISATION NATURE OF GIFT, DONATION OR SPONSORSHIP R’000
MTN Hosting of the 16th ordinary session of the ATU administrative council meeting - sponsor the welcome networking dinner on 17 June 2015
80
ICASA UPU Council Meeting, 08 - 26 February 2016, Bern, Switzerland - SA Reception
304
Organizers of the 3rd Africa School on Internet Governance held in Ethiopia
A Department Official was sponsored for Economy Flight Ticket (R26 000) & Daily Allowance (R1 919) at this Meeting that took place between 02 - 05 September 2015
28
Organizers of the Course on Cyber Safety and Information Security in Malaysia
A Department Official was sponsored for Training Package and Module Fee & Accommodation & Transportation (Airport-Hotel-Airport) to the amount of 2300 Malaysian Ringit (R7 213.90) for this Meeting that took place during 27 – 30 October 2015
7
Total 419
Exemptions and deviations received from the National Treasury
No exemptions and deviation were received from National Treasury during the reporting period.
Events after the reporting date
There are no events favourable and unfavourable that occurred after the reporting date and the date of approval
of the Annual Financial Statements.
Non-adjusting events after reporting date
The transfer of Broadband-Infraco loan from DPE in terms of Proclamation No. 67 of 2014. Receipts of assets
transferred ackowledge on 01 June 2016 and will be disclosed in the 2016\17 financial year.
page 16
Conclusion
I would like to express my sincere appreciation to the Minister and the Deputy Minister for their strategic leadership
and guidance so as to ensure that the Department delivers on its mandate in line with government priorities
and contributes to a vibrant ICT Sector that ensures all South Africans have access to affordable and accessible
ICT services. I would like to take this opportunity to thank “TEAM DTPS” and members of various Committees and
our State Owned Companies (SOCs) for their contribution to the performance of the Department over the past
financial year.
Approval and sign off
Mr J Mjwara
Acting Accounting Officer
Department of Telecommunications and Postal Services
Date: 31 August 2016
page 17

6. STATEMENT OF RESPONSIBILITY AND CONFIRMATION OF ACCURACY FOR THE ANNUAL REPORT
To the best of my knowledge and belief, I confirm the following:
All information and amounts disclosed throughout the annual report are consistent.
The annual report is complete, accurate and is free from any omissions.
The annual report has been prepared in accordance with the guidelines on the annual report as issued
by National Treasury.
The Annual Financial Statements (Part E) have been prepared in accordance with the modified cash
standard and the relevant frameworks and guidelines issued by the National Treasury.
The Accounting Officer is responsible for the preparation of the annual financial statements and for the
judgements made in this information.
The Accounting Officer is responsible for establishing, and implementing a system of internal control that
has been designed to provide reasonable assurance as to the integrity and reliability of the performance
information, the human resources information and the annual financial statements.
The external auditors are engaged to express an independent opinion on the annual financial statements.
In my opinion, the annual report fairly reflects the operations, the performance information, the human resources information and the financial affairs of the Department for the financial year ended 31 March 2016.
Yours faithfully
Mr J Mjwara
Acting Accounting Officer
Department of Telecommunications and Postal Services
Date: 31 August 2016
page 18

7. STRATEGIC OVERVIEW
7.1 VISION
South Africa as a global leader in the development and use of information and communication technologies for socio-economic development.
7.2 MISSION
Building a better life for all through an enabling and sustainable world class information and communication technologies environment.
7.3 VALUES
• Transparency;
• Respect;
• Accountability;
• Fairness;
• Integrity;
• Excellence; and
• Innovation
8. LEGISLATIVE AND OTHER MANDATES
8.1 Constitutional Mandates
Following the May 2014 National Elections, the President pronounced the establishment of the National
Department of Telecommunications and Postal Services. Accordingly, the following Presidential
Proclamations in Government Gazette No. 37839 dated 15 July 2014 and Government Gazette No.
38280 dated 02 December 2014, confirmed the transfer of administration, powers and functions
entrusted by specific legislation to the Ministry of Telecommunications and Postal Services and the newly
formed Ministry of Communications. In order to fulfil the mandate of the newly established Department
of Telecommunications and Postal Services the following States Owned Companies report to the Ministry:
National Electronic Media Institute of South Africa (NEMISA), Universal Service and Access Agency of
South Africa (USAASA), Universal Service and Access Fund (USAF), .za Domain Name Authority (za DNA),
State Information and Technology Agency (SITA), Sentech, Broadband Infraco (BBI) and South African Post
Office (SAPO), as a result of the above-mentioned Presidential Proclamations.
8.2 Legislative mandates
The legislative mandate of the Department is embedded in the following pieces of Legislation as reflected in the table below:
Name of Act Purpose
Sentech Act, 1996 (Act No. 63 of 1996) To provide for the transfer of all the shares of the South African Broadcasting Corporation in Sentech (Pty.) Ltd. to the State; for the conversion of Sentech (Pty.) Ltd. from a private to a public company, Sentech Ltd.; for the control of Sentech Ltd.; and for matters connected therewith.
page 19

Name of Act Purpose
Former States Posts and Telecommunications Act, 1996 (Act No. 5 of 1996)
To provide for the integration of the Departments of Posts and Telecommunications of the former Republics of Transkei, Bophuthatswana, Venda and Ciskei with Telkom SA Limited and the South African Post Office Limited; and to provide for the transfer of the postal and the telecommunications enterprises conducted by those Departments as well as certain land used by them for that purpose to the said companies; and to provide for matters connected therewith.
Former States Broadcasting Reorganisation Act, 1996 (Act No. 91 of 1996
To provide for the integration of the Departments of Posts and Telecommunications of the former Republics of Transkei, Bophuthatswana, Venda and Ciskei with Telkom SA Limited and the South African Post Office Limited; and to provide for the transfer of the postal and the telecommunications enterprises conducted by those Departments as well as certain land used by them for that purpose to the said companies; and to provide for matters connected therewith
Postal Service Act, 1998 (Act No. 124 of 1998) To make new provision for the regulation of postal services; for the operational functions of the postal company, including its universal service obligations; for structural matters relating to postal services as well as the operation of the Postbank and National Savings Certificates; and to consolidate certain provisions relating to the postal company and amend or repeal others; and to provide for matters connected therewith.
Department of Communications Rationalisation Act, 1998 (Act No. 10 of 1998)
To provide for the rationalisation of the Department of Communications; and to provide for matters connected therewith.
Electronic Communications and Transactions Act, 2002 (Act No. 25 of 2002)
To provide for the facilitation and regulation of electronic communications and transactions; to provide for the development of a national e-strategy for the Republic; to promote universal access to electronic communications and transactions and the use of electronic transactions by Small, Medium and Micro-sized Enterprises (SMMEs); to provide for human resource development in electronic transactions; to prevent abuse of information systems; to encourage the use of e-government services; and to provide for matters connected therewith
Electronic Communications Act, 2005 (Act No. 36 of 2005)
To promote convergence in the broadcasting, broadcasting signal distribution and telecommunications sectors and to provide the legal framework for convergence of these sectors; to make new provision for the regulation of electronic communications services, electronic communications network services and broadcasting services; to provide for the granting of new licenses and new social obligations; to provide for the control of the radio frequency spectrum; to provide for the continued existence of the Universal Service Agency and the Universal Service Fund; and to provide for matters incidental thereto. (NB: The DTPS is responsible for the administration of the Act, with the exception of the following sections [Section 4(5), Section 5(6), and Chapter 9]
page 20
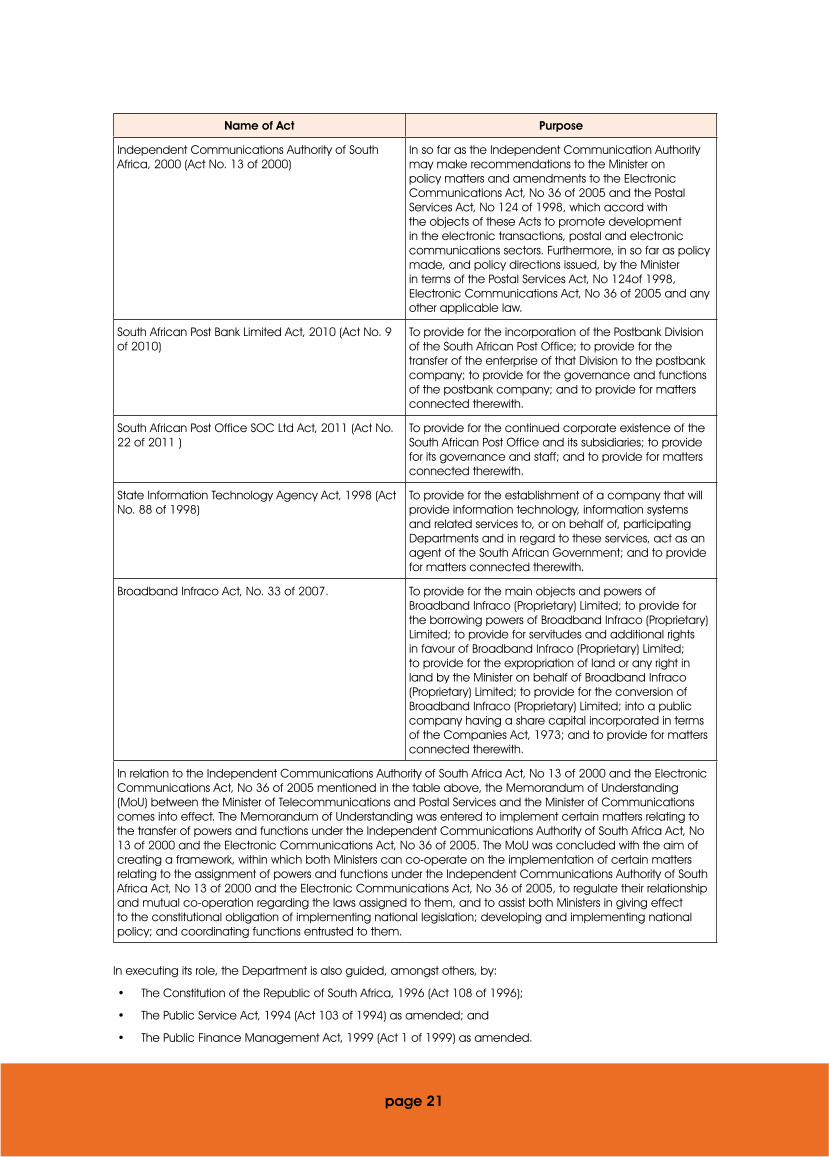
Name of Act Purpose
Independent Communications Authority of South Africa, 2000 (Act No. 13 of 2000)
In so far as the Independent Communication Authority may make recommendations to the Minister on policy matters and amendments to the Electronic Communications Act, No 36 of 2005 and the Postal Services Act, No 124 of 1998, which accord with the objects of these Acts to promote development in the electronic transactions, postal and electronic communications sectors. Furthermore, in so far as policy made, and policy directions issued, by the Minister in terms of the Postal Services Act, No 124of 1998, Electronic Communications Act, No 36 of 2005 and any other applicable law.
South African Post Bank Limited Act, 2010 (Act No. 9 of 2010)
To provide for the incorporation of the Postbank Division of the South African Post Office; to provide for the transfer of the enterprise of that Division to the postbank company; to provide for the governance and functions of the postbank company; and to provide for matters connected therewith.
South African Post Office SOC Ltd Act, 2011 (Act No. 22 of 2011 )
To provide for the continued corporate existence of the South African Post Office and its subsidiaries; to provide for its governance and staff; and to provide for matters connected therewith.
State Information Technology Agency Act, 1998 (Act No. 88 of 1998)
To provide for the establishment of a company that will provide information technology, information systems and related services to, or on behalf of, participating Departments and in regard to these services, act as an agent of the South African Government; and to provide for matters connected therewith.
Broadband Infraco Act, No. 33 of 2007. To provide for the main objects and powers of Broadband Infraco (Proprietary) Limited; to provide for the borrowing powers of Broadband Infraco (Proprietary) Limited; to provide for servitudes and additional rights in favour of Broadband Infraco (Proprietary) Limited; to provide for the expropriation of land or any right in land by the Minister on behalf of Broadband Infraco (Proprietary) Limited; to provide for the conversion of Broadband Infraco (Proprietary) Limited; into a public company having a share capital incorporated in terms of the Companies Act, 1973; and to provide for matters connected therewith.
In relation to the Independent Communications Authority of South Africa Act, No 13 of 2000 and the Electronic Communications Act, No 36 of 2005 mentioned in the table above, the Memorandum of Understanding (MoU) between the Minister of Telecommunications and Postal Services and the Minister of Communications comes into effect. The Memorandum of Understanding was entered to implement certain matters relating to the transfer of powers and functions under the Independent Communications Authority of South Africa Act, No 13 of 2000 and the Electronic Communications Act, No 36 of 2005. The MoU was concluded with the aim of creating a framework, within which both Ministers can co-operate on the implementation of certain matters relating to the assignment of powers and functions under the Independent Communications Authority of South Africa Act, No 13 of 2000 and the Electronic Communications Act, No 36 of 2005, to regulate their relationship and mutual co-operation regarding the laws assigned to them, and to assist both Ministers in giving effect to the constitutional obligation of implementing national legislation; developing and implementing national policy; and coordinating functions entrusted to them.
In executing its role, the Department is also guided, amongst others, by:
• The Constitution of the Republic of South Africa, 1996 (Act 108 of 1996);
• The Public Service Act, 1994 (Act 103 of 1994) as amended; and
• The Public Finance Management Act, 1999 (Act 1 of 1999) as amended.
page 21

page 22
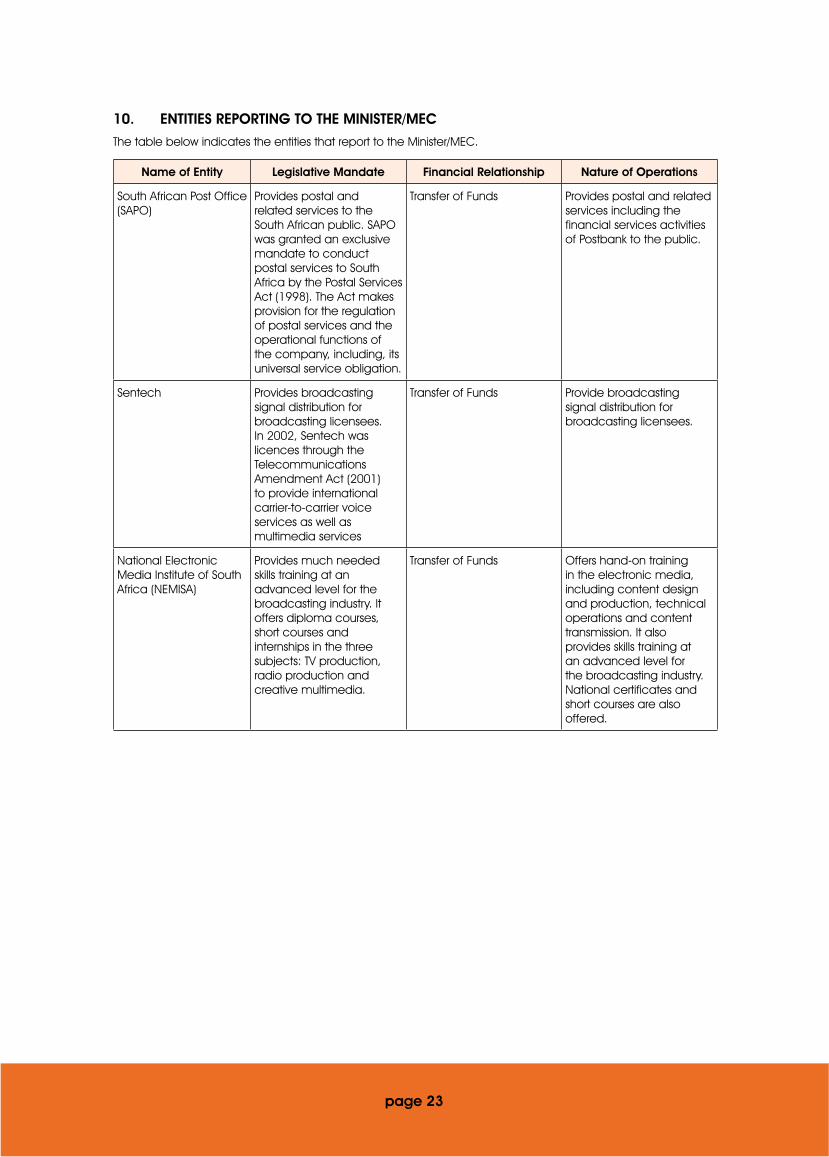
10. ENTITIES REPORTING TO THE MINISTER/MEC
The table below indicates the entities that report to the Minister/MEC.
Name of Entity Legislative Mandate Financial Relationship Nature of Operations
South African Post Office (SAPO)
Provides postal and related services to the South African public. SAPO was granted an exclusive mandate to conduct postal services to South Africa by the Postal Services Act (1998). The Act makes provision for the regulation of postal services and the operational functions of the company, including, its universal service obligation.
Transfer of Funds Provides postal and related services including the financial services activities of Postbank to the public.
Sentech Provides broadcasting signal distribution for broadcasting licensees. In 2002, Sentech was licences through the Telecommunications Amendment Act (2001) to provide international carrier-to-carrier voice services as well as multimedia services
Transfer of Funds Provide broadcasting signal distribution for broadcasting licensees.
National Electronic Media Institute of South Africa (NEMISA)
Provides much needed skills training at an advanced level for the broadcasting industry. It offers diploma courses, short courses and internships in the three subjects: TV production, radio production and creative multimedia.
Transfer of Funds Offers hand-on training in the electronic media, including content design and production, technical operations and content transmission. It also provides skills training at an advanced level for the broadcasting industry. National certificates and short courses are also offered.
page 23

Name of Entity Legislative Mandate Financial Relationship Nature of Operations
Universal Service and Access Agency of South Africa (USAASA)
The Universal Service and Access Agency is mandated by law to oversee, advocate and initiate all matters universal service and access related within ICT. To this end, the Agency interprets policy as it relates to the universality of ICTs in the country and advises the Minister and the nation on progress on closure of ICT access gapsThrough Universal Service and Access Fund, the Agency is mandated to subsidise licensed operators to address issues of connectivity in pre-defined under-serviced and unserved areas of the country
Transfer of Funds Through research USAASA advises on policy matters. Through the disbursement of project subsidies, it actions universal access obligations in under-serviced areas
.za Domain Name Authority
The .za Domain Name Authority (.za DNA) was established to assume responsibility for the .za Domain Name Space. The .za DNA was established in terms of Chapter 10 of the Electronic Communications and Transactions Act (ECT), 2002.
Transfer of Funds To administer and manage the .za domain name space in compliance with international best practice. .zaDNA also licenses and regulates registries.
SITA The object of the Agency is to improve service delivery to the public through the provision of information technology, information systems and related services in a maintained information systems security environment to Departments and public bodies;
Transfer of Funds Procure IT on behalf of the state and offer services to government Departments and public bodies
Broadband Infraco (BBI) To expand the availability of access to electronic communications networks and services, including but not limited to underdeveloped and underservices areas
Transfer of Funds Provision of electronic communications network services to licensed and licence exempted operators.
page 24

page 25
PART B PERFORMANCE
INFORMATION
1. AUDITOR GENERAL’S REPORT: PREDETERMINED OBJECTIVES
The Auditor General of South Africa (AGSA) currently performs certain audit procedures on the performance
information to provide reasonable assurance in the form of an audit conclusion. The audit conclusion on
the performance against predetermined objectives is included in the report to management, with material
findings being reported under the Predetermined Objectives heading in the Report on other legal and
regulatory requirements section of the auditor’s report.
Refer to page 127 of the Report of the Auditor General, published as Part E: Financial Information.
2. OVERVIEW OF DEPARTMENTAL PERFORMANCE
2.1 Service Delivery Environment
The Department of Telecommunications and Postal Services (DTPS) which was established following the
2014 National Elections, focused on specific high impact priorities as informed by the Medium Term
Strategic Framework and the National Development plan. The Department also took into consideration the
current challenges and opportunities within the ICT Sector as well as ways to address such challenges and
leverage on identified opportunities.
Broadband
South Africa boasts one of the most developed broadband markets in Africa. On the access services side,
the market offers myriad wireless and fixed broadband services and has in the past five years seen notable
growth in the number of market players. However, mobile platforms have emerged as the primary mode
for consumer last mile broadband access while the fixed broadband options have stagnated mainly
due to slow fixed infrastructure rollout, relatively high costs of fixed broadband services and fixed-mobile
substitution. According to Research ICT Africa, South Africa remains one of the most expensive countries
in the African Broadband Price Index (Research ICT Africa Broadband, Policy Brief No. 3, June 2014). Growth in South Africa’s ICT sector has not been accompanied by a realisation of the primary policy
objective of affordable access, for all, to the full range of communications services that characterise
modern economies. So much so that as per SA Connect, broadband penetration is lower than 4,5 million
from a total of 54 million people which is about 8% of the population.
SA Connect states that the high prices charged for communications services are identified as one of the
primary factors hampering South Africa’s competitiveness. It further emphasizes that access to broadband
must be affordable to lead to economic growth. The vision for broadband is that by 2020, 100% of SA
citizens will have access to broadband services at 2, 5% or less of the population’s average monthly
income.
Current broadband infrastructure roll-out is mainly duplicated and concentrated in urban areas. Broadband
is crucial for economic development and must be extended to rural areas and townships to minimize
the digital divide. There is a need to leverage on existing infrastructure and aggregate Government’s
demand for broadband services in order to stimulate investment by operators and enable sharing of such
infrastructure.
South Africa Connect, the National Broadband Policy and the associated strategy and plan, gives expression
to South Africa’s vision in the National Development Plan (NDP) of “a seamless information infrastructure by
2030 that will underpin a dynamic and connected vibrant information society and a knowledge economy
that is more inclusive, equitable and prosperous”. In this regard, the Department contributes to Government
Outcome 6 which is focused on the development of an efficient, competitive, and responsive economic
infrastructure network.
page 26

Despite the efforts made to provide connectivity to 1296 identified government institutions through the
implementation of Phase 1 of the Digital Development Plan, the Department was unable to fully achieve
the set target. Although the Department established the Project Management Office to manage the SA
Connect project as well as developed a draft Programme Implementation Plan and a Project Management
Plan, the actual connectivity was severely hampered by delays in appointing the connectivity service
provider as planned. However, in order to address this challenge, the Department is engaging with
relevant stakeholders as well as exploring all available options to ensure that going forward, the planned
connectivity is rolled out in line with allocated resources. In terms of the implementation of Phase 2 of the
Digital Development Plan, during the reporting period the Department developed a Phase 2 business
case document which was submitted to National Treasury. However, due to fiscal constraints Treasury only
allocated funding for Phase 2 to commence in 2018/19, with an allocation of approximately R60 million.
ICT Policy Review
South Africa currently has in place distinct and separate policy frameworks for addressing the various ICT sub-
sectors inclusive of telecommunications, broadcasting and postal amongst others. These policy frameworks
assisted the country, to a certain extent, to create a conducive policy environment so as to provide universal
service and access to information and communications technologies. Global technological advances
has demonstrated that Information and Communication Technology is now considered as a basic service
to citizens. Hence, the review of all ICT policies to establish the National ICT Policy is both a necessity and
an opportunity to accelerate the development an Inclusive Information Society and Knowledge Economy
which will also provide a global competitiveness edge for South Africa.
The National Integrated ICT White Paper replaces the separate White Papers on Telecommunications
(1996) and Postal Services (1998). It responds to the development of technology including convergence,
digitisation, the increasing use of the Internet, and how South Africans communicate, work and interact
with Government. The policies contained herein are in line with the National Development Plan (NDP) in
conjunction that an integrated ICT policy should be developed outlining how Government will ensure
that the sector fulfils its potential to facilitate inclusive social and economic transformation in South Africa.
The White Paper lays the foundation for realising the NDP vision for the ICT sector to create “a seamless
information infrastructure by 2030 that will underpin a dynamic and connected vibrant information society
and a knowledge economy that is more inclusive, equitable and prosperous”.
The National Integrated ICT Policy White Paper includes, among other things:
• Interventions to ensure universal service and access to ICTs and postal services to address existing
and potential new digital divides in South Africa. The digital divide refers to the extent of the gap
between those who have access to a range of communications platforms, networks, services and
content; and those that do not have this access.
• Supply-side interventions including a new Spectrum Policy; a Rapid Deployment Policy; and proposals
on establishing the Open Access Wireless Network and incorporates interventions to maintain the
Open Internet (based on open standards) to facilitate innovation. Furthermore, it introduces a new
market structure for Postal Services recognising the changed environment and includes proposals
on stimulating industry growth.
• Demand-side interventions to transform the public service through the digitisation of services, promote
ICT industry growth and proposes mechanisms to fund universal service and access through the ICT
Development Fund.
During the reporting period, the Department briefed relevant stakeholders, including the Portfolio
Committee on Telecommunications and Postal Services on the ICT Policy Review Panel’s Policy
Recommendations Report which highlighted a range of policy options and possible policy approaches
to inform the development of the White Paper. The Department formally established the extended PMO.
page 27
Research and Analysis team and additional areas of research were identified, scoped and coordinated.
The draft National Integrated ICT Policy White Paper was thereafter developed, approved and tabled at the
Cabinet (ESEID Cabinet Committee).
Cybersecurity
According to the National Cybersecurity Policy Framework for South Africa, the numerous cyber-attacks
launched in recent years against advanced information societies aimed at undermining the functioning
of public and private sector information systems have placed the abuse of cyberspace high on the list
of international and also local security threats. Given the seriousness of cyber threats and of the interests
at stake, it is therefore imperative that the comprehensive use of information communication technology
solutions be supported by a high level of security measures and be embedded in a broad and sophisticated
Cybersecurity culture. Cyberspace comes with new types of challenges to the governments of the world
and it therefore introduces a further dimension to National Security. It is a borderless platform that enables
more sophisticated threats such as cybercrime, cyber terrorism, cyber war and cyber espionage. For this
reason, the cyber threats need to be addressed at both the global and national levels.
During the reporting period the Department ensured that the ICT Infrastructure of the Virtual Cybersecurity
Hub was reconfigured and hardened after which the Department commissioned and launched the virtual
Cybersecurity Hub on 30 October 2015. The Cybersecurity Hub offers alerts and warnings, announcements,
security related information dissemination, incident handling and incident response support as services to
its constituents. These services can be categorised as proactive, reactive and social services.
With regards to incident handling, incidents are logged via the Cybersecurity Hub website and depending
on their evaluation, incidents that can be handled by the Cybersecurity Hub are timeously resolved or else
relevant incidents are escalated to other agencies for further investigation.
2.2 Service Delivery Improvement Plan
The Department has developed a draft Service Delivery Improvement Plan (SDIP) following extensive
consultation with the Department of Public Service and Administration as well as relevant internal
stakeholders. The draft SDIP was developed in compliance with the requirements of the Public Service
Regulation 2001 and the White Paper on the Transformation of Service Delivery (Batho Pele).
In developing the SDIP, the Department collated and analysed information on the performance levels
of the main services offered by the Department to identified beneficiaries as well as the actual and the
desired standards of such services. Following approval of the draft SDIP, the Department will commence
with its implementation and the monitoring and evaluation of such implementation.
Furthermore, as part of further improving service delivery, in the 2016/17 financial year, the Department has
embarked on the identification, documenting and mapping of identified core business processes so as to
enable process automation in the medium term.
2.3 Organisational environment
Following the 2014 National Elections, the Department of Telecommunications and Postal Services was
established with the following States Owned Companies within its Portfolio: National Electronic Media
Institute of South Africa, Universal Service and Access Agency of South Africa, Universal Service and Access
Fund, .za Domain Name Authority, State Information and Technology Agency, Sentech, Broadband Infraco
and South African Post Office.
The establishment of the Department of Telecommunications and Postal Services necessitated a major
change in both the functions and related personnel within the Department. However throughout the
reporting period, the Department functioned under the approved structure of the former Department
page 28
of Communications, which was not aligned to its newly assigned mandate and functions. Therefore, a
significant initiative which the Department has embarked on is the revision of the current Organisational
Structure in line with the revised Strategic Plan and mandate of the Department of Telecommunications
and Postal Services. The structural review will ensure that the Organisational Structure and related process,
functions and systems are fully aligned to the revised organisational strategy and mandate. Together with
the Department of Public Service and Administration, the structural review process has commenced through
the development of the Department’s Service Delivery Model. It is envisaged that the entire organisational
restructuring process will be concluded in the 2016/17 financial year.
Furthermore, during the reporting period, the Department has experienced challenges related to instability
at a leadership level which was largely created by the poor management of disciplinary processes within
the Department. This also resulted in the Minister approaching the Public Service Commission (PSC) to
undertake a fact finding inquiry in terms of Section 10(1) of the Public Service Commission Act, 1997
regarding the alleged paralysis within the Department. Following the PSC inquiry, the report was produced
and its recommendations accepted by the Department which are in the process of being implemented.
During the majority of the reporting period the Department functioned without a full leadership complement
due to critical leadership vacancies which included that of the Director-General (DG) and several Deputy
Directors-General (DDGs) as well as the Chief Financial Officer (CFO). However, during the reporting period,
several of these vacant posts were filled which did make a positive impact on the overall performance of
the Department.
2.4 Key policy developments and legislative changes
During the reporting period, the Department developed the National Integrated ICT White Paper which in
essence replaces the separate White Papers on Telecommunications (1996) and Postal Services (1998).
This White Paper outlines the overarching policy framework for the transformation of South Africa into an
inclusive and innovative digital and knowledge society. It reinforces and extends existing strategies such
as South Africa Connect, the National Broadband Policy, the National Cybersecurity Policy Framework,
2012 and the National Information Society and Development Plan. It responds to the development of
technology including convergence, digitisation, the increasing use of the Internet, and how South Africans
communicate, work and interact with Government.
Furthermore, the White Paper lays the foundation for realising the NDP vision for the ICT sector to create “a
seamless information infrastructure by 2030 that will underpin a dynamic and connected vibrant information
society and a knowledge economy that is more inclusive, equitable and prosperous”. The core philosophy
informing all of the revised policies introduced in this White Paper is a move towards facilitating “openness”
– open access, open Internet and open Government.
3. STRATEGIC OUTCOME ORIENTED GOALS
Broadband connectivity that provides secure and affordable access for all citizens to education,
health and other government services and stimulates economic development.
The Department through its objective of implementing the Digital Development and Digital Future
programmes in line with SA Connect, during the reporting period, established the Project Management
Office to manage the SA Connect project. The Department also developed a draft Programme
Implementation Plan as well as draft technical specifications which will form the basis for the procurement
plan for the implementation of Phase 1 of the Digital Development Plan.
Furthermore the Rapid Deployment Policy was developed and included in Chapter 8 of the National
Integrated ICT Policy White Paper which was approved and tabled at Cabinet (ESEID Cabinet committee).
In pursuit of implementing the Information Ethics Programme in NHI sites prioritizing schools and health
centres, the Department commenced with implementation of the programme in Limpopo Province and
page 29
consultations were done through Provincial Governing structures in the Eastern Cape, Northern Cape
and North West after which the Information Ethics workshops were conducted by the African Centre of
Excellence for Information Ethics through a partnership with the Department which targeted young people
and people working as community health workers.
As part of ensuring that citizens have access to Government services through ICTs, the Department finalised
the e-Government Exchange Programme, enhancing government service delivery, with SITA being the
central agency. The Department also developed an Implementation Plan on e-Government for identified
pilot sites and as a follow up on the Cooperation Partnership between China and SA, the Department
facilitated a bilateral meeting between SITA and INSPUR on the e-Government Programme, and a proposal
is being explored by the two parties on an e-Government Programme of Action.
The Department established and fully operationalised Virtual Cybersecurity Hub in support of a secure
cyberspace in the interest of citizens, private and public sectors. A Virtual Cybersecurity Hub was
commissioned and launched on 30 October 2015, which is currently fully operational. With regards to
creating an effective National Spectrum Framework to ensure that citizens realise socioeconomic benefits
from the use of spectrum, the Department developed Policy recommendations which were included
in the Open Access Chapter (Chapter 8) of the National Integrated ICT Policy White Paper which was
approved and tabled at Cabinet (ESEID Cabinet committee).
The Department, in its effort to implement the cost to communicate Programme of Action focused at
affordability and quality of ICTs, developed and included a Roaming Policy in the National Integrated
ICT Policy White Paper. Furthermore a Draft Local Loop Strategy, as well as Policy Direction on data cost
were incorporated into the National Integrated ICT Policy White Paper. The Department also developed
a monitoring and evaluation framework to assess implementation of interventions to reduce the cost to
communicate.
Stable ICT Policy and Regulatory Environment that contributes to socio-economic development of the
country.
The Department in its effort to create a stable ICT Policy and regulatory environment that contribute to the
socio-economic development of the country developed and tabled the National Integrated ICT Policy
White Paper at Cabinet (ESEID Cabinet committee). Furthermore the Department developed the draft ICT
SMME support programme. As part of ensuring the availability of updated and relevant ICT Research and
ICT statistics to inform evidence based policy making the ICT Research Framework was developed with a
focus on competitiveness and innovation. Moreover the Department developed the ICT Research Agenda
through consultation with relevant stakeholders. Following the development of the draft ICT indicators
Framework for the Statistical Compendium, the ICT Statistical Compendium was produced and sample
copies were published.
South Africa has a modern, sustainable and competitive postal and telecommunications sector.
As part of facilitating the corporatization of the Postbank, the Department coordinated the licensing of
the Postbank and progress reports were developed in this regards. The Department also facilitated and
monitored the deployment of Postal Infrastructure. The Department engaged SAPO in relation to the
Deployment of Post Offices/ Points of Presence (PoPs) infrastructure in line with the SAPO roll-out plan.
With regard to the objective of developing and implementing the National Address System Policy, the
Department developed the National Address System Policy which was included in Chapter 10 of the
National Integrated ICT Policy White Paper. The Policy directive on regulation of Extra-terrestrial Offices of
Exchange (ETOEs) & Re-mailing and the strategy on Philatelic Product was also developed and incorporated
in Chapter 10 of the National Integrated ICT Policy White Paper.
page 30

page 31
Furthermore with regards to International cooperation to strengthen national and regional capacity in
the Postal Sector, the Department developed a Programme of Action on the SA ITU-UPU Cooperation
Agreement which was aimed at implementing e-Services, addressing connectivity and electrification
through innovation. This project is done in partnership with SAPO and 5 Post Offices have been identified in
rural areas for the roll-out of this project.
Inclusive Information society and knowledge economy
During the reporting period, the Department in its quest to develop and implement the National e-Strategy
undertook consultation with Provinces on the National e-Strategy Framework. Such consultations were
conducted through the Provincial Broadband Steering Committee in North West, Limpopo and Northern
Cape Province. Further consultation took place with the State Information Technology Agency (SITA) and
the National ICT Forum Working Committee on e-Commerce so as to provide for institutional mechanisms
to be used for the development of the e-Strategy.
Optimally functional Department and SOCs that effectively deliver on their respective mandates
As part of conducting proactive and stringent oversight to improve the performance and sustainability
of the State Owned Companies, oversight was conducted and Quarterly progress reports against the
SAPO’s Strategic Turnaround Plan were analysed. Furthermore, an Oversight Model for the State Owned
Companies was developed and approved for implementation.
In line with Outcome 12: an efficient, effective and development of oriented public service and an empowered, fair and inclusive citizenship, the Department developed a revised Information Technology
& Knowledge and Information Management Strategy and implemented the planned initiatives within
Phase 1 and 2, which entailed the creation of Enterprise Admin Accounts, development of the Enterprise
Architecture including Business Architecture, identified Applications, Data and Technology solutions as well
as the Technology Architecture.
4. PERFORMANCE INFORMATION BY PROGRAMME
4.1 Programme 1: Administration
The purpose of Programme 1 is to provide strategic leadership, management and support services to the
Department. The Programme consists of the following 6 sub-programmes:
Ministry
Departmental Management
Internal Audit
Corporate Services
Financial Management
Office Accommodation
The Strategic Objective for the 2015/16 Financial Year is listed below:-
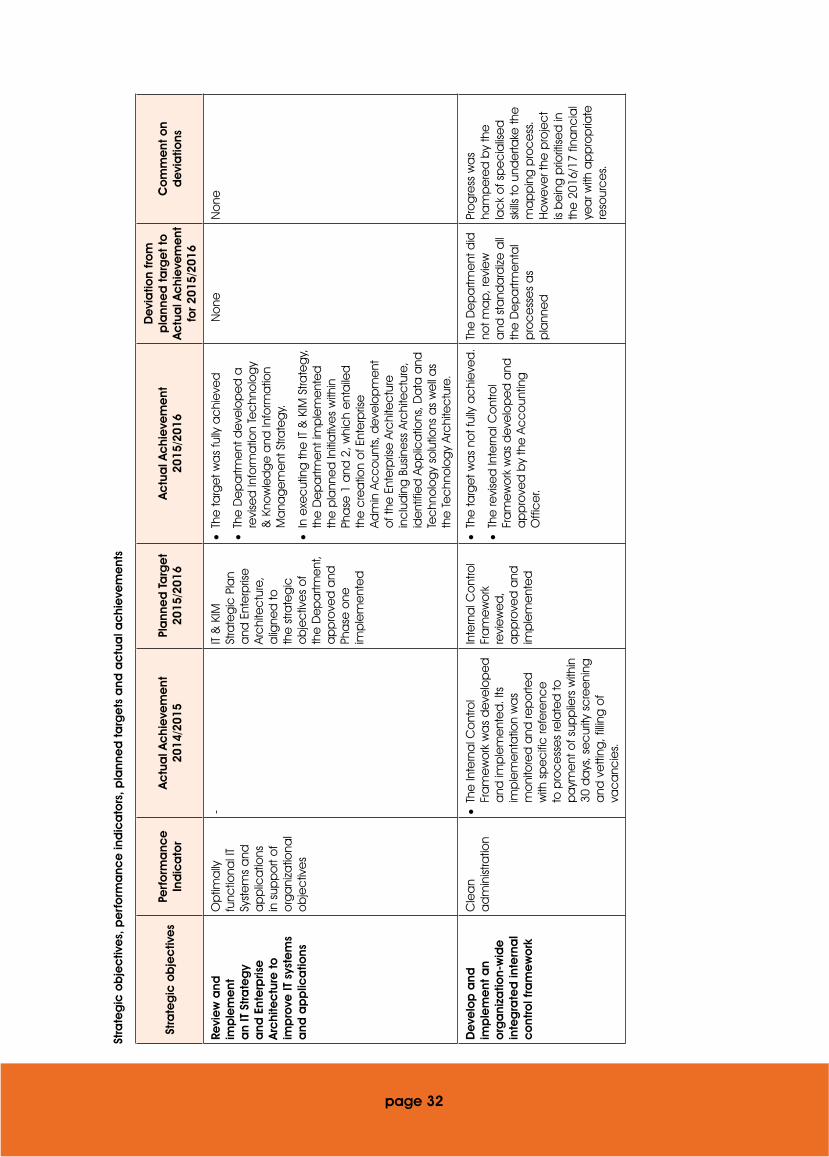
Review and implement an IT Strategy and Enterprise Architecture to improve IT systems and applications.
Develop and implement an organisational-wide integrated internal control framework.
Stra
teg
ic o
bje
ctiv
es,
pe
rfo
rma
nce
ind
ica
tors
, pla
nne
d t
arg
ets
and
ac
tua
l ac
hie
vem
ent
s
Stra
teg
ic o
bje
ctiv
es
Perf
orm
anc
e
Ind
ica
tor
Ac
tua
l Ac
hie
vem
ent
20
14/2
015
Pla
nne
d T
arg
et
2015
/201
6A
ctu
al A
chi
eve
me
nt20
15/2
016
De
via
tion
fro
m
pla
nne
d t
arg
et
to
Ac
tua
l Ac
hie
vem
ent
fo
r 201
5/20
16
Co
mm
ent
on
de
via
tions
Revi
ew
and
im
ple
me
nt
an
IT S
tra
teg
y a
nd E
nte
rpris
e
Arc
hite
ctu
re t
o
imp
rove
IT s
yste
ms
and
ap
plic
atio
ns
Op
tima
lly
func
tiona
l IT
Syst
em
s a
nd
ap
plic
atio
ns
in s
upp
ort
of
org
ani
zatio
nal
ob
jec
tive
s
-IT
& K
IM
Stra
teg
ic P
lan
and
Ent
erp
rise
Ar
chi
tec
ture
, a
ligne
d to
th
e s
trate
gic
o
bje
ctiv
es
of
the
De
pa
rtme
nt,
ap
pro
ved
and
Ph
ase
one
im
ple
me
nte
d
•Th
e ta
rge
t wa
s fu
lly a
chi
eve
d
•Th
e D
ep
artm
ent
de
velo
pe
d a
re
vise
d In
form
atio
n Te
chn
olo
gy
& K
now
led
ge
and
Info
rma
tion
Ma
nag
em
ent
Stra
teg
y.
•In
exe
cut
ing
the
IT &
KIM
Stra
teg
y,
the
De
pa
rtme
nt im
ple
me
nte
d
the
pla
nne
d In
itia
tive
s w
ithin
Ph
ase
1 a
nd 2
, whi
ch
ent
aile
d
the
cre
atio
n o
f Ent
erp
rise
Ad
min
Ac
co
unts
, de
velo
pm
ent
o
f the
Ent
erp
rise
Arc
hite
ctu
re
inc
lud
ing
Bus
ine
ss A
rchi
tec
ture
, id
ent
ifie
d A
pp
lica
tions
, Da
ta a
nd
Tec
hno
log
y so
lutio
ns a
s w
ell
as
the
Te
chn
olo
gy
Arc
hite
ctu
re.
No
neN
one
De
velo
p a
nd
imp
lem
ent
an
org
ani
zatio
n-w
ide
in
teg
rate
d in
tern
al
co
ntro
l fra
me
wo
rk
Cle
an
ad
min
istra
tion
•Th
e In
tern
al C
ont
rol
Fra
me
wo
rk w
as
de
velo
pe
d
and
imp
lem
ent
ed
. Its
im
ple
me
nta
tion
wa
s m
oni
tore
d a
nd re
po
rted
w
ith s
pe
cifi
c re
fere
nce
to
pro
ce
sse
s re
late
d to
p
aym
ent
of s
upp
liers
with
in
30 d
ays
, se
cur
ity s
cre
eni
ng
and
ve
tting
, filli
ng o
f va
ca
ncie
s.
Inte
rna
l Co
ntro
l Fr
am
ew
ork
re
vie
we
d,
ap
pro
ved
and
im
ple
me
nte
d
•Th
e ta
rge
t wa
s no
t ful
ly a
chi
eve
d.
•Th
e re
vise
d In
tern
al C
ont
rol
Fra
me
wo
rk w
as
de
velo
pe
d a
nd
ap
pro
ved
by
the
Ac
co
untin
g
Offi
ce
r.
The
De
pa
rtme
nt d
id
not m
ap,
revi
ew
a
nd s
tand
ard
ize a
ll th
e D
ep
artm
ent
al
pro
ce
sse
s a
s p
lann
ed
Pro
gre
ss w
as
ham
pe
red
by
the
la
ck
of s
pe
cia
lise
d
skills
to u
nde
rtake
the
m
ap
pin
g p
roc
ess
. H
ow
eve
r the
pro
jec
t is
be
ing
prio
ritise
d in
th
e 2
016/
17 fi
nanc
ial
yea
r with
ap
pro
pria
te
reso
urc
es.
page 32

Strategy to overcome areas of under-performance
The Department does acknowledge its areas of under-performance with regards to the mapping, reviewing and standardising of the Departmental processes. Going forward the Department has ensured the allocation of adequate capacity to this significant project in the 2016/17 financial year. Furthermore, specific focus will be given to planning in line with the availability of requisite skills to achieve a specific target.
Changes to planned targets
There were no changes to the planned targets during the reporting period.
Linking performance with budgets
There was no significant increase in compensation of employees from the 2014/15 financial year due to critical vacant positions not being filled on time. Under goods and services the increase was mainly in the Departmental Management for external audit fees due to the Special Investigation Unit (SIU) for various investigations performed in the Department. The programme also experienced a decrease in travel and advertising due to the austerity measures being implemented.
Sub-programme expenditure
Sub- Programme Name
2015/2016 2014/2015
Final Appro-priation
ActualExpenditure
(Over)/Under Expenditure
Final Appropriation
ActualExpenditure
(Over)/Under Ex-penditure
R’000 R’000 R’000 R’000 R’000 R’000
Ministry 4 211 4 211 - 4 103 4 056 47
Departmental Management 73 332 73 332 - 65 781 65 781 -
Internal Audit 5 245 5 245 - 5 708 5 708 -
Corporate Services 63 756 62 590 1 166 80 334 70 163 10 171
Financial Management 70 357 70 357 - 75 583 74 918 665
Office Accommodation 6 129 6 129 - 6 016 6 016 -
Total 223 030 221 864 1 166 237 525 226 641 10 884
4.2 Programme 2: International Affairs
The purpose of Programme 2 is to ensure alignment between South Africa’s international activities and agreements in the field of ICT and South Africa’s foreign policy. ICT International Affairs Programme consists of the following sub programmes:
• International Affairs coordinates the functions and responsibilities of the Department to meet South Africa’s international ICT obligations through bi-laterals, multi-laterals and tri-laterals; and
• ICT Trade/Partnerships develop and advance the country’s interests in international trade forums through participation in World Trade Organisation ICT related initiatives and other international trade agreements, such as South African European Union Trade Agreement and bilateral agreements with counterpart countries. South Africa’s national interests are also promoted in these forums.
The Strategic Objectives for the 2015/16 Financial Year are listed below:
• Ensure that citizens have access to Government services through ICTs;
• Create an effective national spectrum framework to ensure citizens realize socio-economic benefits from the use of spectrum; and
• Facilitate International cooperation to strengthen national and regional capacity in the postal sector.
page 33
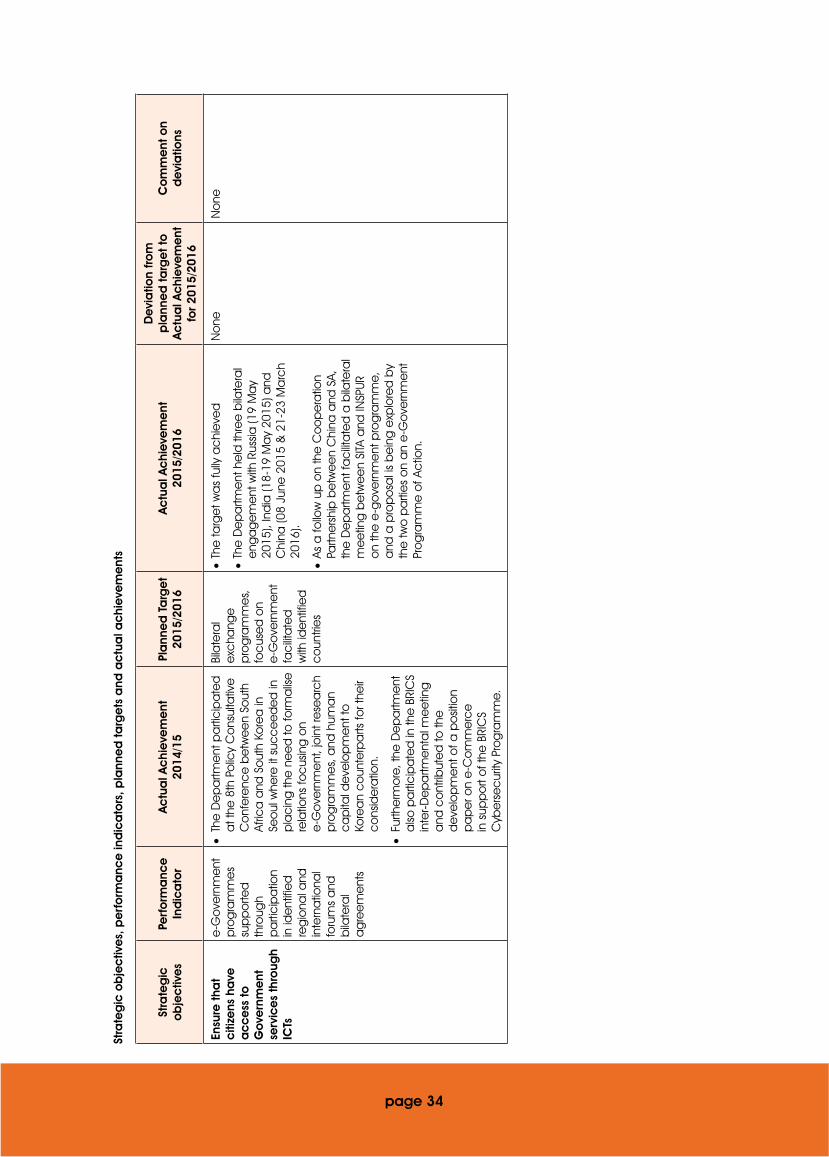
Stra
teg
ic o
bje
ctiv
es,
pe
rfo
rma
nce
ind
ica
tors
, pla
nne
d t
arg
ets
and
ac
tua
l ac
hie
vem
ent
s
Stra
teg
ic
ob
jec
tive
sPe
rfo
rma
nce
In
dic
ato
rA
ctu
al A
chi
eve
me
nt20
14/1
5Pl
ann
ed
Ta
rge
t20
15/2
016
Ac
tua
l Ac
hie
vem
ent
2015
/201
6
De
via
tion
fro
m
pla
nne
d t
arg
et
to
Ac
tua
l Ac
hie
vem
ent
fo
r 201
5/20
16
Co
mm
ent
on
de
via
tions
Ensu
re t
hat
citi
zens
ha
ve
ac
ce
ss t
o
Go
vern
me
nt
serv
ice
s th
roug
h IC
Ts
e-G
ove
rnm
ent
p
rog
ram
me
s su
pp
orte
d
thro
ugh
pa
rtic
ipa
tion
in id
ent
ifie
d
reg
iona
l and
in
tern
atio
nal
foru
ms
and
b
ilate
ral
ag
ree
me
nts
•Th
e D
ep
artm
ent
pa
rtic
ipa
ted
a
t the
8th
Po
licy
Co
nsul
tativ
e
Co
nfe
renc
e b
etw
ee
n So
uth
Afric
a a
nd S
out
h Ko
rea
in
Seo
ul w
here
it s
ucc
ee
de
d in
p
lac
ing
the
ne
ed
to fo
rma
lise
re
latio
ns fo
cus
ing
on
e-G
ove
rnm
ent
, jo
int r
ese
arc
h p
rog
ram
me
s, a
nd h
uma
n c
ap
ital d
eve
lop
me
nt to
Ko
rea
n c
oun
terp
arts
for t
heir
co
nsid
era
tion.
•Fu
rthe
rmo
re, t
he D
ep
artm
ent
a
lso p
arti
cip
ate
d in
the
BRI
CS
inte
r-De
pa
rtme
nta
l me
etin
g
and
co
ntrib
ute
d to
the
d
eve
lop
me
nt o
f a p
osit
ion
pa
pe
r on
e-C
om
me
rce
in
sup
po
rt o
f the
BRI
CS
Cyb
ers
ec
urity
Pro
gra
mm
e.
Bila
tera
l e
xcha
nge
p
rog
ram
me
s,
foc
use
d o
n e
-Go
vern
me
nt
fac
ilita
ted
w
ith id
ent
ifie
d
co
untri
es
•Th
e ta
rge
t wa
s fu
lly a
chi
eve
d
•Th
e D
ep
artm
ent
he
ld th
ree
bila
tera
l e
nga
ge
me
nt w
ith R
ussia
(19
Ma
y 20
15),
Ind
ia (1
8-19
Ma
y 20
15) a
nd
Chi
na (0
8 Ju
ne 2
015
& 2
1-23
Ma
rch
2016
).
•As
a fo
llow
up
on
the
Co
op
era
tion
Partn
ers
hip
be
twe
en
Chi
na a
nd S
A,
the
De
pa
rtme
nt fa
cilit
ate
d a
bila
tera
l m
ee
ting
be
twe
en
SITA
and
INSP
UR
on
the
e-g
ove
rnm
ent
pro
gra
mm
e,
and
a p
rop
osa
l is
be
ing
exp
lore
d b
y th
e tw
o p
arti
es
on
an
e-G
ove
rnm
ent
Pr
og
ram
me
of A
ctio
n.
No
ne
No
ne
page 34
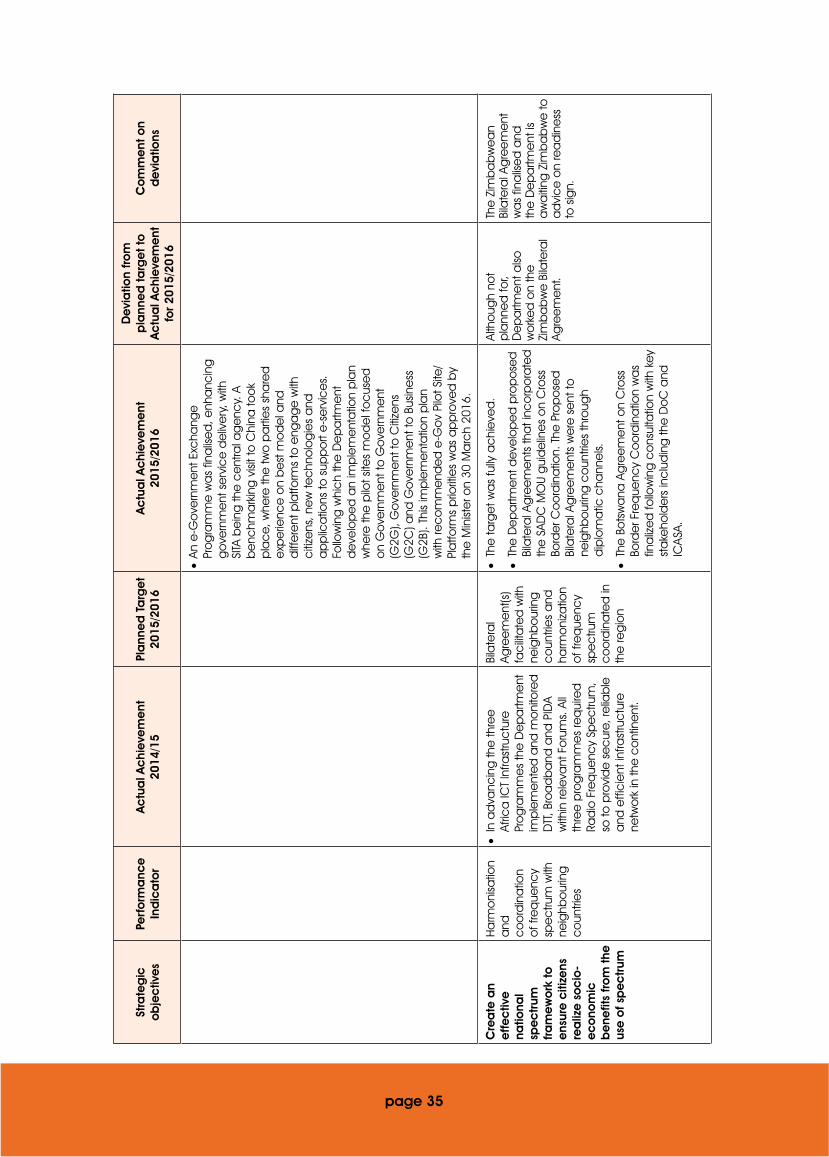
Stra
teg
ic
ob
jec
tive
sPe
rfo
rma
nce
In
dic
ato
rA
ctu
al A
chi
eve
me
nt20
14/1
5Pl
ann
ed
Ta
rge
t20
15/2
016
Ac
tua
l Ac
hie
vem
ent
2015
/201
6
De
via
tion
fro
m
pla
nne
d t
arg
et
to
Ac
tua
l Ac
hie
vem
ent
fo
r 201
5/20
16
Co
mm
ent
on
de
via
tions
•An
e-G
ove
rnm
ent
Exc
hang
e
Pro
gra
mm
e w
as
fina
lise
d, e
nha
ncin
g
go
vern
me
nt s
erv
ice
de
live
ry, w
ith
SITA
be
ing
the
ce
ntra
l ag
enc
y. A
b
enc
hma
rkin
g v
isit t
o C
hina
too
k p
lac
e, w
here
the
two
pa
rtie
s sh
are
d
exp
erie
nce
on
be
st m
od
el a
nd
diff
ere
nt p
latfo
rms
to e
nga
ge
with
c
itize
ns, n
ew
tec
hno
log
ies
and
a
pp
lica
tions
to s
upp
ort
e-s
erv
ice
s.
Follo
win
g w
hic
h th
e D
ep
artm
ent
d
eve
lop
ed
an
imp
lem
ent
atio
n p
lan
whe
re th
e p
ilot s
ites
mo
de
l fo
cus
ed
o
n G
ove
rnm
ent
to G
ove
rnm
ent
(G
2G),
Go
vern
me
nt to
Citi
zens
(G
2C) a
nd G
ove
rnm
ent
to B
usin
ess
(G
2B).
This
imp
lem
ent
atio
n p
lan
with
rec
om
me
nde
d e
-Go
v Pi
lot S
ite/
Pla
tform
s p
riorit
ies
wa
s a
pp
rove
d b
y th
e M
inist
er o
n 30
Ma
rch
2016
.
Cre
ate
an
effe
ctiv
e
natio
nal
spe
ctr
um
fra
me
wo
rk t
o
ens
ure
citi
zens
re
aliz
e s
oc
io-
ec
ono
mic
b
ene
fits
fro
m t
he
use
of s
pe
ctr
um
Ha
rmo
nisa
tion
and
c
oo
rdin
atio
n o
f fre
que
ncy
spe
ctru
m w
ith
neig
hbo
urin
g
co
untri
es
•In
ad
vanc
ing
the
thre
e
Afric
a IC
T In
frast
ruc
ture
Pr
og
ram
me
s th
e D
ep
artm
ent
im
ple
me
nte
d a
nd m
oni
tore
d
DTT
, Bro
ad
ba
nd a
nd P
IDA
with
in re
leva
nt F
oru
ms.
All
thre
e p
rog
ram
me
s re
qui
red
Ra
dio
Fre
que
ncy
Spe
ctru
m,
so to
pro
vid
e s
ec
ure,
relia
ble
a
nd e
ffic
ient
infra
stru
ctu
re
netw
ork
in th
e c
ont
ine
nt.
Bila
tera
l Ag
ree
me
nt(s
) fa
cilit
ate
d w
ith
neig
hbo
urin
g
co
untri
es
and
ha
rmo
niza
tion
of f
req
uenc
y sp
ec
trum
c
oo
rdin
ate
d in
th
e re
gio
n
•Th
e ta
rge
t wa
s fu
lly a
chi
eve
d.
•Th
e D
ep
artm
ent
de
velo
pe
d p
rop
ose
d
Bila
tera
l Ag
ree
me
nts
tha
t inc
orp
ora
ted
th
e S
ADC
MO
U g
uid
elin
es
on
Cro
ss
Bord
er C
oo
rdin
atio
n. T
he P
rop
ose
d
Bila
tera
l Ag
ree
me
nts
we
re s
ent
to
neig
hbo
urin
g c
oun
trie
s th
roug
h d
iplo
ma
tic c
hann
els.
•Th
e B
ots
wa
na A
gre
em
ent
on
Cro
ss
Bord
er F
req
uenc
y C
oo
rdin
atio
n w
as
fina
lize
d fo
llow
ing
co
nsul
tatio
n w
ith k
ey
sta
keho
lde
rs in
clu
din
g th
e D
oC
and
IC
ASA
.
Alth
oug
h no
t p
lann
ed
for,
De
pa
rtme
nt a
lso
wo
rke
d o
n th
e
Zim
ba
bw
e B
ilate
ral
Agre
em
ent
.
The
Zim
ba
bw
ea
n Bi
late
ral A
gre
em
ent
w
as
fina
lise
d a
nd
the
De
pa
rtme
nt is
a
wa
iting
Zim
ba
bw
e to
a
dvi
ce
on
rea
din
ess
to
sig
n.
page 35
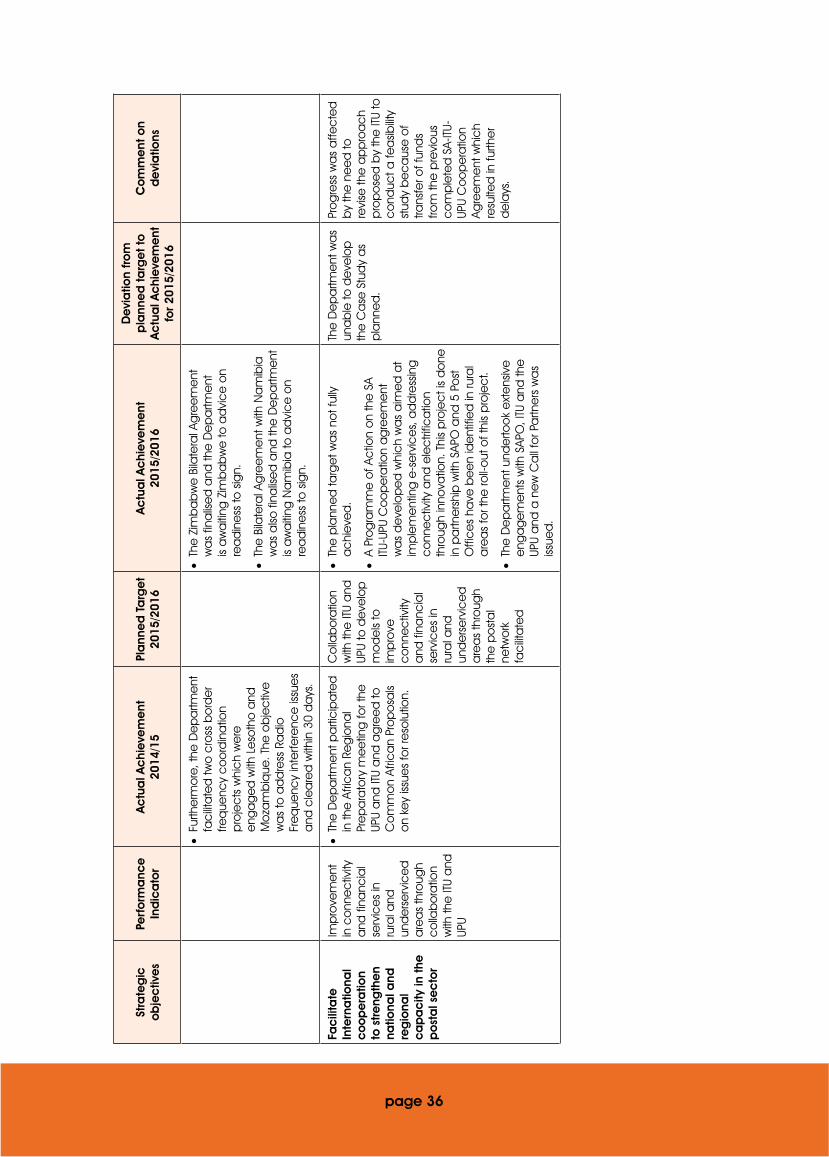
Stra
teg
ic
ob
jec
tive
sPe
rfo
rma
nce
In
dic
ato
rA
ctu
al A
chi
eve
me
nt20
14/1
5Pl
ann
ed
Ta
rge
t20
15/2
016
Ac
tua
l Ac
hie
vem
ent
2015
/201
6
De
via
tion
fro
m
pla
nne
d t
arg
et
to
Ac
tua
l Ac
hie
vem
ent
fo
r 201
5/20
16
Co
mm
ent
on
de
via
tions
•Fu
rthe
rmo
re, t
he D
ep
artm
ent
fa
cilit
ate
d tw
o c
ross
bo
rde
r fre
que
ncy
co
ord
ina
tion
pro
jec
ts w
hic
h w
ere
e
nga
ge
d w
ith L
eso
tho
and
M
oza
mb
ique
. The
ob
jec
tive
w
as
to a
dd
ress
Ra
dio
Fr
eq
uenc
y in
terfe
renc
e is
sue
s a
nd c
lea
red
with
in 3
0 d
ays
.
•Th
e Z
imb
ab
we
Bila
tera
l Ag
ree
me
nt
wa
s fin
alis
ed
and
the
De
pa
rtme
nt
is a
wa
iting
Zim
ba
bw
e to
ad
vic
e o
n re
ad
ine
ss to
sig
n.
•Th
e B
ilate
ral A
gre
em
ent
with
Na
mib
ia
wa
s a
lso fi
nalis
ed
and
the
De
pa
rtme
nt
is a
wa
iting
Na
mib
ia to
ad
vic
e o
n re
ad
ine
ss to
sig
n.
Fac
ilita
te
Inte
rna
tiona
l c
oo
pe
ratio
n to
str
eng
the
n na
tiona
l and
re
gio
nal
ca
pa
city
in t
he
po
sta
l se
cto
r
Imp
rove
me
nt
in c
onn
ec
tivity
a
nd fi
nanc
ial
serv
ice
s in
ru
ral a
nd
und
ers
erv
ice
d
are
as
thro
ugh
co
llab
ora
tion
with
the
ITU
and
UP
U
•Th
e D
ep
artm
ent
pa
rtic
ipa
ted
in
the
Afri
ca
n Re
gio
nal
Pre
pa
rato
ry m
ee
ting
for t
he
UPU
and
ITU
and
ag
ree
d to
C
om
mo
n Af
rica
n Pr
op
osa
ls o
n ke
y iss
ues
for r
eso
lutio
n.
Co
llab
ora
tion
with
the
ITU
and
UP
U to
de
velo
p
mo
de
ls to
im
pro
ve
co
nne
ctiv
ity
and
fina
ncia
l se
rvic
es
in
rura
l and
un
de
rse
rvic
ed
a
rea
s th
roug
h th
e p
ost
al
netw
ork
fa
cilit
ate
d
•Th
e p
lann
ed
targ
et w
as
not f
ully
a
chi
eve
d.
•A
Pro
gra
mm
e o
f Ac
tion
on
the
SA
ITU-U
PU C
oo
pe
ratio
n a
gre
em
ent
w
as
de
velo
pe
d w
hic
h w
as
aim
ed
at
imp
lem
ent
ing
e-s
erv
ice
s, a
dd
ress
ing
c
onn
ec
tivity
and
ele
ctri
fica
tion
thro
ugh
inno
vatio
n. T
his
pro
jec
t is
do
ne
in p
artn
ers
hip
with
SAP
O a
nd 5
Po
st
Offi
ce
s ha
ve b
ee
n id
ent
ifie
d in
rura
l a
rea
s fo
r the
roll-
out
of t
his
pro
jec
t.
•Th
e D
ep
artm
ent
und
erto
ok
ext
ens
ive
e
nga
ge
me
nts
with
SAP
O, I
TU a
nd th
e
UPU
and
a n
ew
Ca
ll fo
r Pa
rtne
rs w
as
issue
d.
The
De
pa
rtme
nt w
as
una
ble
to d
eve
lop
th
e C
ase
Stu
dy
as
pla
nne
d.
Pro
gre
ss w
as
affe
cte
d
by
the
ne
ed
to
revi
se th
e a
pp
roa
ch
pro
po
sed
by
the
ITU
to
co
nduc
t a fe
asib
ility
stud
y b
ec
aus
e o
f tra
nsfe
r of f
und
s fro
m th
e p
revi
ous
c
om
ple
ted
SA-
ITU-
UPU
Co
op
era
tion
Agre
em
ent
whi
ch
resu
lted
in fu
rthe
r d
ela
ys.
page 36
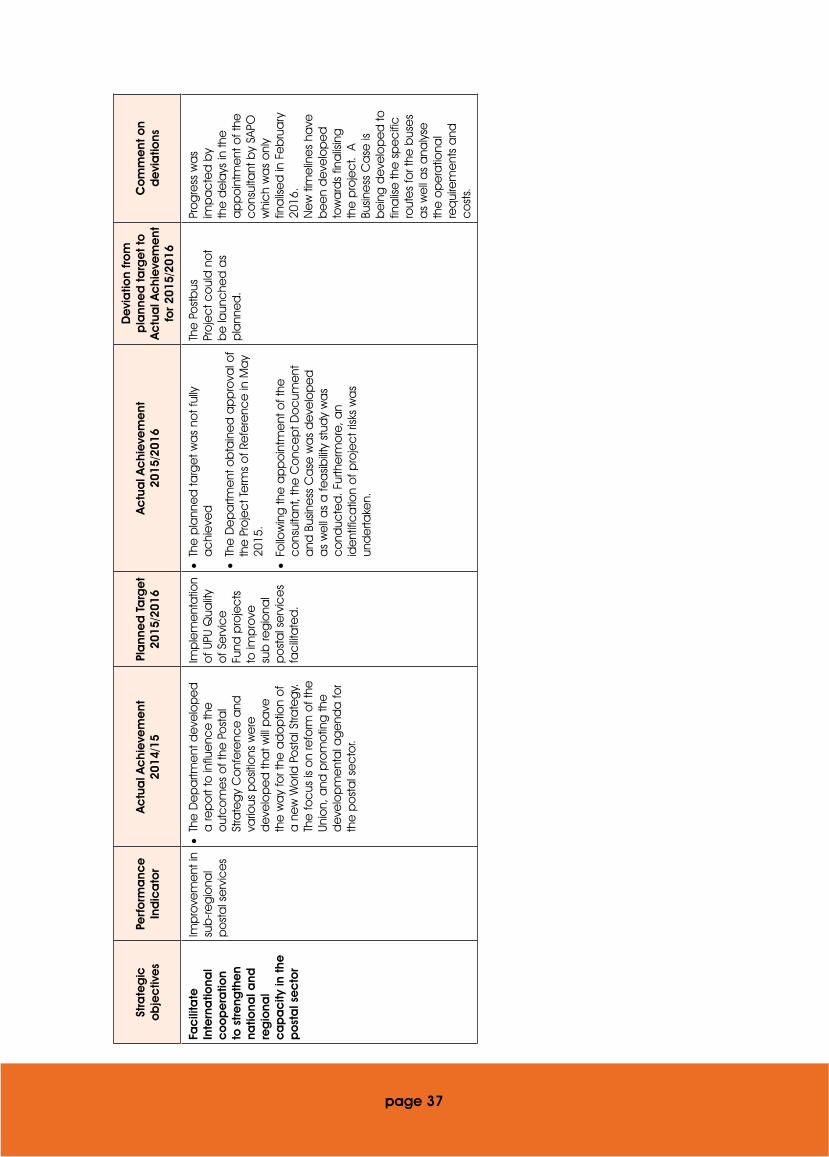
Stra
teg
ic
ob
jec
tive
sPe
rfo
rma
nce
In
dic
ato
rA
ctu
al A
chi
eve
me
nt20
14/1
5Pl
ann
ed
Ta
rge
t20
15/2
016
Ac
tua
l Ac
hie
vem
ent
2015
/201
6
De
via
tion
fro
m
pla
nne
d t
arg
et
to
Ac
tua
l Ac
hie
vem
ent
fo
r 201
5/20
16
Co
mm
ent
on
de
via
tions
Fac
ilita
te
Inte
rna
tiona
l c
oo
pe
ratio
n to
str
eng
the
n na
tiona
l and
re
gio
nal
ca
pa
city
in t
he
po
sta
l se
cto
r
Imp
rove
me
nt in
su
b-re
gio
nal
po
sta
l se
rvic
es
•Th
e D
ep
artm
ent
de
velo
pe
d
a re
po
rt to
influ
enc
e th
e
out
co
me
s o
f the
Po
sta
l St
rate
gy
Co
nfe
renc
e a
nd
vario
us p
osit
ions
we
re
de
velo
pe
d th
at w
ill p
ave
th
e w
ay
for t
he a
do
ptio
n o
f a
ne
w W
orld
Po
sta
l Stra
teg
y.
The
foc
us is
on
refo
rm o
f the
Un
ion,
and
pro
mo
ting
the
d
eve
lop
me
nta
l ag
end
a fo
r th
e p
ost
al s
ec
tor.
Imp
lem
ent
atio
n o
f UPU
Qua
lity
of S
erv
ice
Fu
nd p
roje
cts
to
imp
rove
su
b re
gio
nal
po
sta
l se
rvic
es
fac
ilita
ted
.
•Th
e p
lann
ed
targ
et w
as
not f
ully
a
chi
eve
d
•Th
e D
ep
artm
ent
ob
tain
ed
ap
pro
val o
f th
e P
roje
ct T
erm
s o
f Re
fere
nce
in M
ay
2015
.
•Fo
llow
ing
the
ap
po
intm
ent
of t
he
co
nsul
tant
, the
Co
nce
pt D
oc
ume
nt
and
Bus
ine
ss C
ase
wa
s d
eve
lop
ed
a
s w
ell
as
a fe
asib
ility
stud
y w
as
co
nduc
ted
. Fur
the
rmo
re, a
n id
ent
ific
atio
n o
f pro
jec
t risk
s w
as
und
erta
ken.
The
Po
stb
us
Pro
jec
t co
uld
no
t b
e la
unc
hed
as
pla
nne
d.
Pro
gre
ss w
as
imp
ac
ted
by
the
de
lays
in th
e
ap
po
intm
ent
of t
he
co
nsul
tant
by
SAPO
w
hic
h w
as
onl
y fin
alis
ed
in F
eb
rua
ry
2016
.N
ew
tim
elin
es
have
b
ee
n d
eve
lop
ed
to
wa
rds
fina
lisin
g
the
pro
jec
t. A
Bu
sine
ss C
ase
is
be
ing
de
velo
pe
d to
fin
alis
e th
e s
pe
cifi
c
rout
es
for t
he b
use
s a
s w
ell
as
ana
lyse
th
e o
pe
ratio
nal
req
uire
me
nts
and
c
ost
s.
page 37

Strategy to overcome areas of underperformance
The Department does acknowledge its areas of under-performance with regards to specific targets for
which project specific reasons have been provided under “comment on deviation”, where applicable.
The challenges that impacted on the achievement of targets were largely related to external stakeholders
over whom the Department did not have direct control. Going forward, extensive stakeholder engagement
is undertaken with relevant external stakeholders involved prior to committing to such projects as well as
during implementation of such projects.
Changes to planned targets
There were no changes to the planned targets during the reporting period.
Linking performance with budgets
The decrease in expenditure in this programme from R45.4 million to R41.5 million is due to vacant positions
that were not filled and the enforcement of the austerity measures. Funds were shifted within the programme
from compensation of employees and goods and services to cover the shortfall in transfer payments to
International Organisations for membership fees.
Sub-programme expenditure
Sub- Programme Name
2015/2016 2014/2015
Final Appro-priation
ActualExpenditure
(Over)/Under Expenditure
Final Appropriation
ActualExpenditure
(Over)/Under Expenditure
R’000 R’000 R’000 R’000 R’000 R’000
International Affairs 11 514 10 511 1 003 13 126 13 125 1
ICT Trade/Partnership 31 796 31 031 765 32 541 32 306 235
Total 43 310 41 542 1 768 45 667 45 431 236
4.3 Programme 3: ICT Policy, Research and Capacity Building Branch
The purpose of Programme 3 is to develop ICT policies and legislation that support the development of
an ICT sector that creates favourable conditions for the accelerated and shared growth of the economy.
Develop strategies that increase the uptake and usage of ICT by the majority of the South African population,
in order to bridge the digital divide.
The Policy, Research and Capacity Development Programme consist of the following sub programmes:
• ICT Policy Development drafts legislation, regulations, policy and guidelines that govern the
broadcasting, telecommunications, postal and IT sectors, thus ensuring broad-based economic
development within the ICT sector;
• Economic and Market Analysis is responsible for economic analysis and growth projections. This sub-
programme also undertakes market research to explore areas that require policy intervention;
• Research is responsible for understanding the ICT landscape and delivering a National ICT Strategy;
• Information Society Development renders delivery management services in support of an ICT
information society, development and usage; and
page 38

• Capacity Development provides direction for the advancement of e-Skills graduates and society in
general to function effectively in the emerging information society.
The Strategic Objectives for the 2015/16 Financial Year are listed below:
• Implement the Digital Readiness Programme in line with SA Connect;
• Implement the Digital Opportunities Programme in line with SA Connect;
• Implement the Cost to Communicate Programme of Action focused at affordability and quality of ICTs;
• Implement the Policy and legislative programme;
• Promote transformation of the ICT Sector through ICT SMME development and implementation of the
ICT B-BBEE Sector Code
• Ensure the availability of updated and relevant ICT research and ICT statistics to inform evidence-based
policy making.
• Develop and implement the National Address System Policy.
• Develop and implement the Strategy on Philatelic Products.
• Develop and implement policy directive on the regulation of ETOEs and Re-mailing; and
• Develop and implement the National e-Strategy
page 39

Stra
teg
ic o
bje
ctiv
es,
pe
rfo
rma
nce
ind
ica
tors
, pla
nne
d t
arg
ets
and
ac
tua
l ac
hie
vem
ent
s
Stra
teg
ic
ob
jec
tive
sPe
rfo
rma
nce
In
dic
ato
rA
ctu
al A
chi
eve
me
nt
2014
/201
5Pl
ann
ed
Ta
rge
t20
15/2
016
Ac
tua
l Ac
hie
vem
ent
2015
/201
6
De
via
tion
fro
m p
lann
ed
ta
rge
t to
Ac
tua
l A
chi
eve
me
nt fo
r 20
15/2
016
Co
mm
ent
on
de
via
tions
Imp
lem
ent
the
D
igita
l Re
ad
ine
ss
Pro
gra
mm
e in
line
w
ith S
A C
onn
ec
t
App
rove
d R
ap
id
De
plo
yme
nt P
olic
y th
at p
rom
ote
d IC
T in
frast
ruc
ture
roll-
out
•Pr
oje
ct s
co
pin
g p
lan
de
velo
pe
d. P
roje
ct T
ea
m
wa
s id
ent
ifie
d a
nd a
1st
c
ons
ulta
tive
me
etin
g
wa
s he
ld w
ith d
esig
nate
d
Go
vern
me
nt D
ep
artm
ent
s.
•W
ork
bre
akd
ow
n st
ruc
ture
d
eve
lop
ed
.
•Te
rms
of R
efe
renc
e fo
r the
a
pp
oin
tme
nt o
f Se
rvic
e
Pro
vid
er t
o d
eve
lop
a n
atio
nal
rap
id d
ep
loym
ent
po
licy
has
be
en
de
velo
pe
d.
•M
otiv
atio
n su
bm
itte
d fo
r a
pp
oin
tme
nt o
f a S
erv
ice
Pr
ovi
de
r to
de
velo
p R
ap
id
De
plo
yme
nt P
olic
y.
Rap
id
De
plo
yme
nt
Polic
y d
eve
lop
ed
a
nd a
pp
rove
d
•Th
e D
ep
artm
ent
fully
ac
hie
ved
the
se
t ta
rge
t.
•As
pa
rt o
f co
nduc
ting
sta
keho
lde
r c
ons
ulta
tion,
the
Ro
und
Ta
ble
d
iscus
sions
and
Sta
keho
lde
r w
ork
sho
p w
ith E
CN
S Lic
ens
ee
s a
nd
Go
vern
me
nt D
ep
artm
ent
s w
as
co
nclu
de
d in
the
se
co
nd q
uarte
r of
the
rep
orti
ng.
•D
raft
Rap
id D
ep
loym
ent
Po
licy
wa
s d
eve
lop
ed
and
wa
s su
bm
itte
d to
ES
EID
Clu
ste
r in
Oc
tob
er 2
015.
•Th
e fi
nal R
ap
id D
ep
loym
ent
Po
licy
wa
s c
om
ple
ted
and
inc
lud
ed
in
Cha
pte
r 8 o
f the
Na
tiona
l Int
eg
rate
d
ICT
Polic
y W
hite
Pa
pe
r.
•Th
e N
atio
nal I
nte
gra
ted
ICT
Polic
y W
hite
Pa
pe
r wa
s a
pp
rove
d a
nd
tab
led
at C
ab
ine
t (ES
EID
Ca
bin
et
co
mm
itte
e).
No
neN
one
page 40
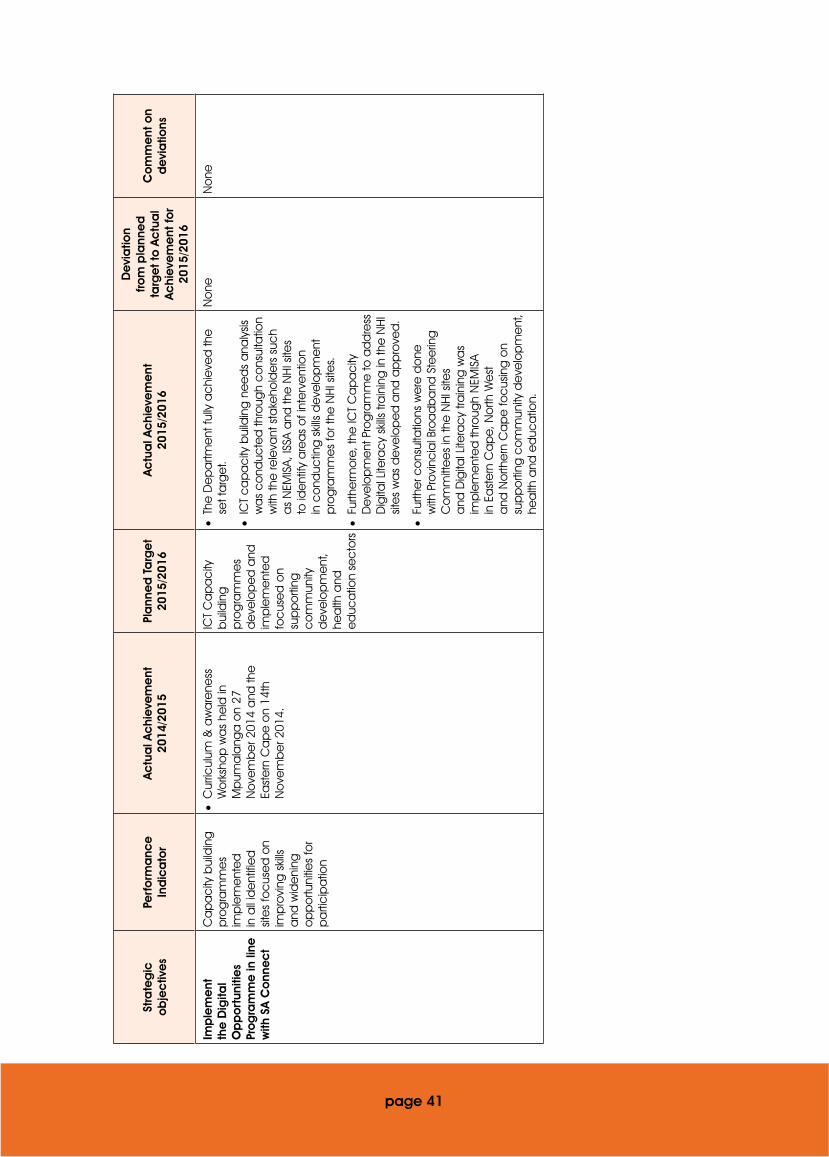
Stra
teg
ic
ob
jec
tive
sPe
rfo
rma
nce
In
dic
ato
rA
ctu
al A
chi
eve
me
nt
2014
/201
5Pl
ann
ed
Ta
rge
t20
15/2
016
Ac
tua
l Ac
hie
vem
ent
2015
/201
6
De
via
tion
fro
m p
lann
ed
ta
rge
t to
Ac
tua
l A
chi
eve
me
nt fo
r 20
15/2
016
Co
mm
ent
on
de
via
tions
Imp
lem
ent
th
e D
igita
l O
pp
ort
uniti
es
Pro
gra
mm
e in
line
w
ith S
A C
onn
ec
t
Ca
pa
city
bui
ldin
g
pro
gra
mm
es
imp
lem
ent
ed
in
all
ide
ntifi
ed
sit
es
foc
use
d o
n im
pro
ving
skil
ls a
nd w
ide
ning
o
pp
ortu
nitie
s fo
r p
arti
cip
atio
n
•C
urric
ulum
& a
wa
rene
ss
Wo
rksh
op
wa
s he
ld in
M
pum
ala
nga
on
27
No
vem
be
r 201
4 a
nd th
e
East
ern
Ca
pe
on
14th
N
ove
mb
er 2
014.
ICT
Ca
pa
city
b
uild
ing
p
rog
ram
me
s d
eve
lop
ed
and
im
ple
me
nte
d
foc
use
d o
n su
pp
orti
ng
co
mm
unity
d
eve
lop
me
nt,
hea
lth a
nd
ed
uca
tion
sec
tors
•Th
e D
ep
artm
ent
fully
ac
hie
ved
the
se
t ta
rge
t.
•IC
T c
ap
ac
ity b
uild
ing
ne
ed
s a
naly
sis
wa
s c
ond
ucte
d th
roug
h c
ons
ulta
tion
with
the
rele
vant
sta
keho
lde
rs s
uch
as
NEM
ISA,
ISSA
and
the
NH
I site
s to
ide
ntify
are
as
of i
nte
rve
ntio
n in
co
nduc
ting
skil
ls d
eve
lop
me
nt
pro
gra
mm
es
for t
he N
HI s
ites.
•Fu
rthe
rmo
re, t
he IC
T C
ap
ac
ity
De
velo
pm
ent
Pro
gra
mm
e to
ad
dre
ss
Dig
ital L
itera
cy
skills
tra
inin
g in
the
NH
I sit
es
wa
s d
eve
lop
ed
and
ap
pro
ved
.
•Fu
rthe
r co
nsul
tatio
ns w
ere
do
ne
with
Pro
vinc
ial B
roa
db
and
Ste
erin
g
Co
mm
itte
es
in th
e N
HI s
ites
and
Dig
ital L
itera
cy
train
ing
wa
s im
ple
me
nte
d th
roug
h N
EMIS
A in
Ea
ste
rn C
ap
e, N
orth
We
st
and
No
rthe
rn C
ap
e fo
cus
ing
on
sup
po
rting
co
mm
unity
de
velo
pm
ent
, he
alth
and
ed
uca
tion.
No
neN
one
page 41

Stra
teg
ic
ob
jec
tive
sPe
rfo
rma
nce
In
dic
ato
rA
ctu
al A
chi
eve
me
nt
2014
/201
5Pl
ann
ed
Ta
rge
t20
15/2
016
Ac
tua
l Ac
hie
vem
ent
2015
/201
6
De
via
tion
fro
m p
lann
ed
ta
rge
t to
Ac
tua
l A
chi
eve
me
nt fo
r 20
15/2
016
Co
mm
ent
on
de
via
tions
Imp
lem
ent
th
e D
igita
l O
pp
ort
uniti
es
Pro
gra
mm
e in
line
w
ith S
A C
onn
ec
t
Info
rma
tion
Ethi
cs
Pro
gra
mm
es
imp
lem
ent
ed
in
all
ide
ntifi
ed
sit
es
foc
use
d a
t c
onn
ec
ting
so
cie
ty
and
inc
rea
sing
e
-lite
rac
y
•Th
e D
ep
artm
ent
thro
ugh
the
p
artn
ers
hip
with
the
Afri
ca
n C
ent
re o
f Exc
elle
nce
for
Info
rma
tion
Ethi
cs
org
ani
sed
a
Go
vern
me
nt In
form
atio
n Et
hic
s w
ork
sho
p in
Ap
ril 2
014
at C
arn
arv
on,
No
rthe
rn C
ap
e
Pro
vinc
e.
•Th
e In
form
atio
n Et
hic
s C
onf
ere
nce
wa
s fa
cilit
ate
d
by
the
Afri
ca
n C
ent
re o
f Ex
ce
llenc
e fo
r Inf
orm
atio
n Et
hic
s o
n 2n
d to
4th
Jul
y 20
14
at U
ga
nda
.
Info
rma
tion
Ethi
cs
Pro
gra
mm
e
imp
lem
ent
ed
in
NH
I site
s p
riorit
izing
sc
hoo
ls a
nd h
ea
lth
ce
ntre
s
•Th
e D
ep
artm
ent
did
no
t ful
ly a
chi
eve
th
e s
et t
arg
et.
•In
pur
suit
of d
eliv
erin
g o
n th
is ta
rge
t th
e D
ep
artm
ent
ha
d c
ons
ulta
tive
m
ee
ting
s w
ith a
ll th
e P
rovi
nce
s in
Ap
ril 2
015
and
pre
sent
ed
the
In
form
atio
n Et
hic
s p
rog
ram
me
a
s a
pro
jec
t or p
illar o
f the
Dig
ital
Op
po
rtuni
ties
Pro
gra
mm
e.
•D
urin
g th
e s
ec
ond
qua
rter o
f the
re
po
rting
pe
riod
, the
De
pa
rtme
nt
imp
lem
ent
ed
the
Info
rma
tion
Ethi
cs
Pro
gra
mm
e in
Lim
po
po.
•D
urin
g th
e fo
urth
qua
rter f
urth
er
co
nsul
tatio
ns w
ere
do
ne th
roug
h Pr
ovi
ncia
l Go
vern
ing
stru
ctu
res
in
the
Ea
ste
rn C
ap
e, N
orth
ern
Ca
pe
a
nd N
orth
We
st a
fter w
hic
h th
e
Info
rma
tion
Ethi
cs
wo
rksh
op
s w
ere
c
ond
ucte
d b
y th
e A
fric
an
Ce
ntre
o
f Exc
elle
nce
for I
nfo
rma
tion
Ethi
cs
thro
ugh
a p
artn
ers
hip
with
the
D
ep
artm
ent
whi
ch
targ
ete
d y
oun
g
pe
op
le a
nd p
eo
ple
wo
rkin
g a
s c
om
mun
ity h
ea
lth w
ork
ers
.
The
Info
rma
tion
Ethi
cs
Pro
gra
mm
e
wa
s no
t im
ple
me
nte
d
in F
ree
Sta
te,
Mp
uma
lang
a a
nd
Kwa
-Zul
u N
ata
l as
pla
nne
d
The
Mo
U w
ith th
e
Afric
an
Ce
ntre
o
f Exc
elle
nce
fo
r Inf
orm
atio
n Et
hic
s w
as
onl
y c
onc
lud
ed
in
be
gin
ning
o
f the
four
th
qua
rter,
henc
e a
ll Pr
ovi
nce
s c
oul
d
not b
e ta
rge
ts a
s p
lann
ed
.H
ow
eve
r, th
e
rem
ain
ing
Pr
ovi
nce
s a
re
be
ing
prio
ritise
d
by
the
Afri
ca
n C
ent
re o
f Ex
ce
llenc
e fo
r In
form
atio
n Et
hic
s.
page 42
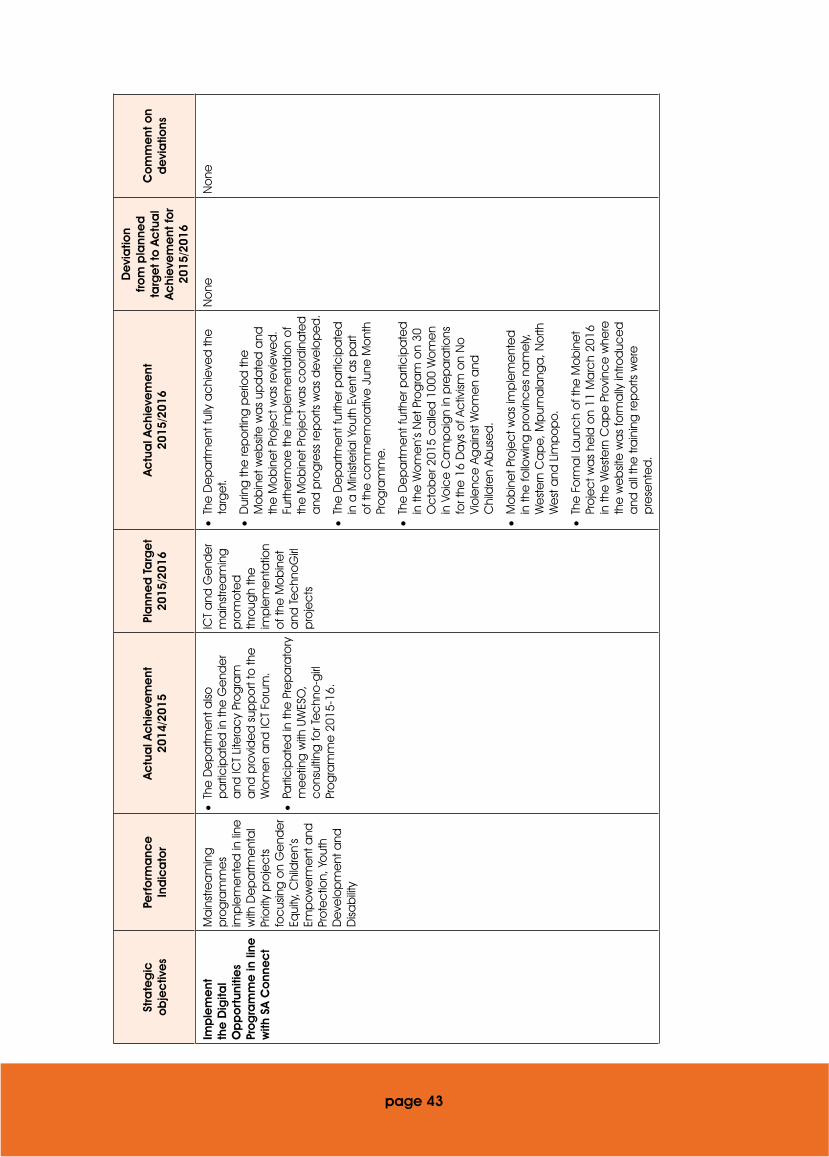
Stra
teg
ic
ob
jec
tive
sPe
rfo
rma
nce
In
dic
ato
rA
ctu
al A
chi
eve
me
nt
2014
/201
5Pl
ann
ed
Ta
rge
t20
15/2
016
Ac
tua
l Ac
hie
vem
ent
2015
/201
6
De
via
tion
fro
m p
lann
ed
ta
rge
t to
Ac
tua
l A
chi
eve
me
nt fo
r 20
15/2
016
Co
mm
ent
on
de
via
tions
Imp
lem
ent
th
e D
igita
l O
pp
ort
uniti
es
Pro
gra
mm
e in
line
w
ith S
A C
onn
ec
t
Ma
inst
rea
min
g
pro
gra
mm
es
imp
lem
ent
ed
in li
ne
with
De
pa
rtme
nta
l Pr
iorit
y p
roje
cts
fo
cus
ing
on
Ge
nde
r Eq
uity
, Chi
ldre
n’s
Emp
ow
erm
ent
and
Pr
ote
ctio
n, Y
out
h D
eve
lop
me
nt a
nd
Disa
bilit
y
•Th
e D
ep
artm
ent
also
p
arti
cip
ate
d in
the
Ge
nde
r a
nd IC
T Lit
era
cy
Pro
gra
m
and
pro
vid
ed
sup
po
rt to
the
W
om
en
and
ICT
Foru
m.
•Pa
rtic
ipa
ted
in th
e P
rep
ara
tory
m
ee
ting
with
UW
ESO
, c
ons
ultin
g fo
r Te
chn
o-g
irl
Pro
gra
mm
e 2
015-
16.
ICT
and
Ge
nde
r m
ain
stre
am
ing
p
rom
ote
d
thro
ugh
the
im
ple
me
nta
tion
of t
he M
ob
ine
t a
nd T
ec
hno
Girl
p
roje
cts
•Th
e D
ep
artm
ent
fully
ac
hie
ved
the
ta
rge
t.
•D
urin
g th
e re
po
rting
pe
riod
the
M
ob
ine
t we
bsit
e w
as
upd
ate
d a
nd
the
Mo
bin
et P
roje
ct w
as
revi
ew
ed
. Fu
rthe
rmo
re th
e im
ple
me
nta
tion
of
the
Mo
bin
et P
roje
ct w
as
co
ord
ina
ted
a
nd p
rog
ress
rep
orts
wa
s d
eve
lop
ed
.
•Th
e D
ep
artm
ent
furth
er p
arti
cip
ate
d
in a
Min
iste
rial Y
out
h Ev
ent
as
pa
rt o
f the
co
mm
em
ora
tive
Jun
e M
ont
h Pr
og
ram
me.
•Th
e D
ep
artm
ent
furth
er p
arti
cip
ate
d
in th
e W
om
en’
s N
et P
rog
ram
on
30
Oc
tob
er 2
015
ca
lled
100
0 W
om
en
in V
oic
e C
am
pa
ign
in p
rep
ara
tions
fo
r the
16
Da
ys o
f Ac
tivism
on
No
Vi
ole
nce
Ag
ain
st W
om
en
and
C
hild
ren
Abus
ed
.
•M
ob
ine
t Pro
jec
t wa
s im
ple
me
nte
d
in th
e fo
llow
ing
pro
vinc
es
nam
ely,
W
est
ern
Ca
pe,
Mp
uma
lang
a, N
orth
W
est
and
Lim
po
po.
•Th
e F
orm
al L
aun
ch
of t
he M
ob
ine
t Pr
oje
ct w
as
held
on
11 M
arc
h 20
16
in th
e W
est
ern
Ca
pe
Pro
vinc
e w
here
th
e w
eb
site
wa
s fo
rma
lly in
trod
uce
d
and
all
the
tra
inin
g re
po
rts w
ere
p
rese
nte
d.
No
neN
one
page 43

Stra
teg
ic
ob
jec
tive
sPe
rfo
rma
nce
In
dic
ato
rA
ctu
al A
chi
eve
me
nt
2014
/201
5Pl
ann
ed
Ta
rge
t20
15/2
016
Ac
tua
l Ac
hie
vem
ent
2015
/201
6
De
via
tion
fro
m p
lann
ed
ta
rge
t to
Ac
tua
l A
chi
eve
me
nt fo
r 20
15/2
016
Co
mm
ent
on
de
via
tions
•Th
e T
ec
hno
Girl
Pro
gra
mm
e
wa
s im
ple
me
nte
d in
Ga
ute
ng
Mp
uma
lang
a a
nd E
ast
ern
Ca
pe
Pr
ovi
nce
s d
urin
g th
e re
po
rting
pe
riod
.
Imp
lem
ent
th
e D
igita
l O
pp
ort
uniti
es
Pro
gra
mm
e in
line
w
ith S
A C
onn
ec
t
Ma
inst
rea
min
g
pro
gra
mm
es
imp
lem
ent
ed
in li
ne
with
De
pa
rtme
nta
l Pr
iorit
y p
roje
cts
fo
cus
ing
on
Ge
nde
r Eq
uity
, Chi
ldre
n’s
Emp
ow
erm
ent
and
Pr
ote
ctio
n, Y
out
h D
eve
lop
me
nt a
nd
Disa
bilit
y
•Th
e C
hild
Onl
ine
Pro
tec
tion
Pro
gra
mm
e w
as
imp
lem
ent
ed
in E
ers
teru
st
Hig
h Sc
hoo
l (Ee
rste
rust
) and
Ik
usa
sa C
om
pre
hens
ive
Hig
h Sc
hoo
l (Th
em
bisa
).
•Th
e C
hild
Onl
ine
Pro
tec
tion
Pro
gra
m w
as
also
suc
ce
ssfu
lly
imp
lem
ent
ed
in th
e E
ast
ern
C
ap
e.
ICT
and
Chi
ldre
n m
ain
stre
am
ing
p
rom
ote
d
thro
ugh
the
im
ple
me
nta
tion
of C
hild
Onl
ine
Pr
ote
ctio
n p
rog
ram
me
s a
cro
ss a
ll Pr
ovi
nce
s
•Th
e D
ep
artm
ent
fully
ac
hie
ved
the
p
lann
ed
targ
et.
• S
cho
ols
for t
he C
hild
Onl
ine
Pr
ote
ctio
n Pr
og
ram
me
we
re
ide
ntifi
ed
for E
ast
ern
Ca
pe,
Fre
e
Sta
te, N
orth
We
st a
nd W
est
ern
Ca
pe.
•Th
e C
hild
Onl
ine
Pro
tec
tion
Awa
rene
ss W
ork
sho
p fo
r Ea
ste
rn
Ca
pe
wa
s c
ond
ucte
d a
t No
nge
ke
Hig
h Sc
hoo
l in
Ma
rch
2015
and
St
eyn
rus
Hig
h Sc
hoo
l in
the
Fre
e
Sta
te in
Ap
ril 2
015.
De
smo
nd M
pilo
Tu
tu S
eni
or S
ec
ond
ary
Sc
hoo
l at
Paa
rl w
as
sele
cte
d fo
r the
We
ste
rn
Ca
pe
Pro
vinc
e a
nd a
Wo
rksh
op
wa
s c
ond
ucte
d in
Ap
ril 2
015.
•Th
e E
arly
chi
ldho
od
De
velo
pm
ent
Ac
ce
ss T
ec
hno
log
y p
rog
ram
wa
s im
ple
me
nte
d a
t tw
o E
arly
Chi
ldho
od
D
eve
lop
me
nt C
ent
res
in V
irgin
ia;
Fre
e S
tate
Pro
vinc
e in
Elim
, We
ste
rn
Ca
pe
Pro
vinc
e in
Ap
ril 2
015.
•D
urin
g th
e re
po
rting
pe
riod
the
Chi
ld
Onl
ine
Pro
tec
tion
Awa
rene
ss P
roje
cts
w
ere
imp
lem
ent
ed
in a
n in
all
pla
nne
d P
rovi
nce
s.
No
neN
one
page 44
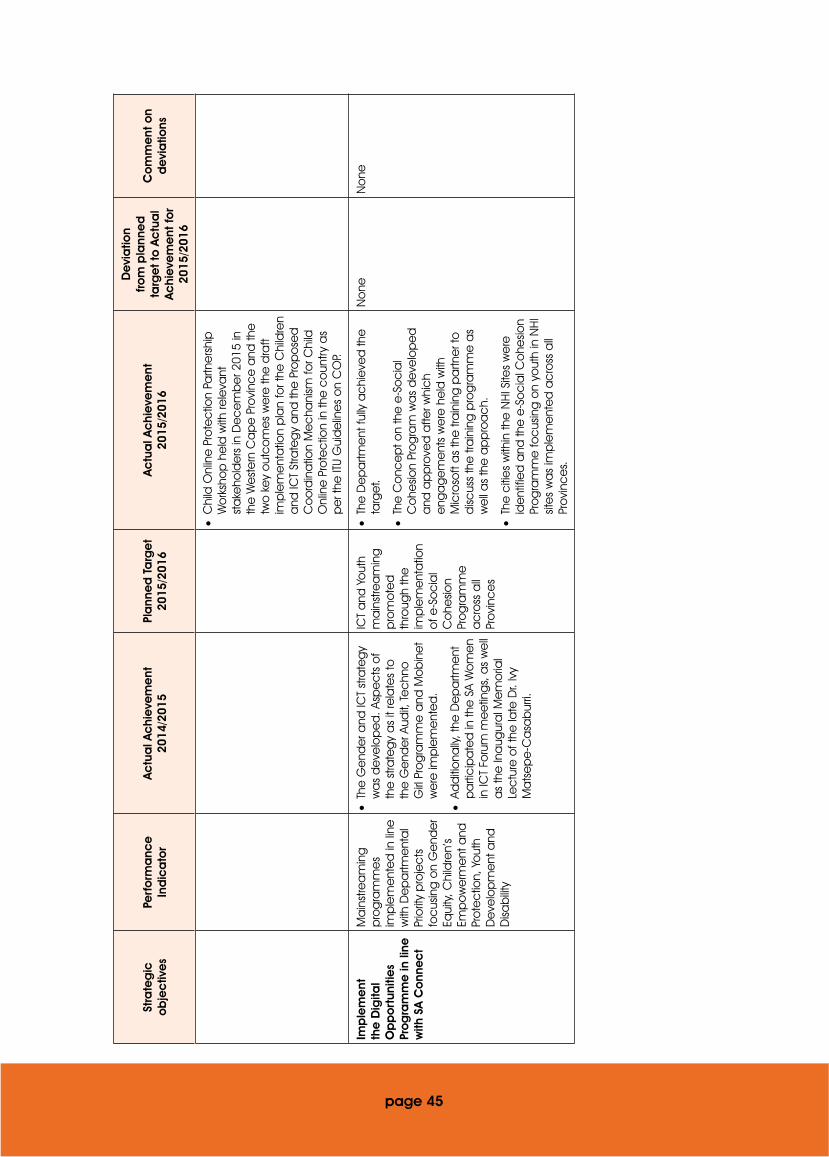
Stra
teg
ic
ob
jec
tive
sPe
rfo
rma
nce
In
dic
ato
rA
ctu
al A
chi
eve
me
nt
2014
/201
5Pl
ann
ed
Ta
rge
t20
15/2
016
Ac
tua
l Ac
hie
vem
ent
2015
/201
6
De
via
tion
fro
m p
lann
ed
ta
rge
t to
Ac
tua
l A
chi
eve
me
nt fo
r 20
15/2
016
Co
mm
ent
on
de
via
tions
•C
hild
Onl
ine
Pro
tec
tion
Partn
ers
hip
W
ork
sho
p h
eld
with
rele
vant
st
ake
hold
ers
in D
ec
em
be
r 201
5 in
th
e W
est
ern
Ca
pe
Pro
vinc
e a
nd th
e
two
ke
y o
utc
om
es
we
re th
e d
raft
imp
lem
ent
atio
n p
lan
for t
he C
hild
ren
and
ICT
Stra
teg
y a
nd th
e P
rop
ose
d
Co
ord
ina
tion
Me
cha
nism
for C
hild
O
nlin
e P
rote
ctio
n in
the
co
untry
as
pe
r the
ITU
Gui
de
line
s o
n C
OP.
Imp
lem
ent
th
e D
igita
l O
pp
ort
uniti
es
Pro
gra
mm
e in
line
w
ith S
A C
onn
ec
t
Ma
inst
rea
min
g
pro
gra
mm
es
imp
lem
ent
ed
in li
ne
with
De
pa
rtme
nta
l Pr
iorit
y p
roje
cts
fo
cus
ing
on
Ge
nde
r Eq
uity
, Chi
ldre
n’s
Emp
ow
erm
ent
and
Pr
ote
ctio
n, Y
out
h D
eve
lop
me
nt a
nd
Disa
bilit
y
•Th
e G
end
er a
nd IC
T st
rate
gy
wa
s d
eve
lop
ed
. Asp
ec
ts o
f th
e s
trate
gy
as
it re
late
s to
th
e G
end
er A
udit,
Te
chn
o
Girl
Pro
gra
mm
e a
nd M
ob
ine
t w
ere
imp
lem
ent
ed
.
•Ad
diti
ona
lly, t
he D
ep
artm
ent
p
arti
cip
ate
d in
the
SA
Wo
me
n in
ICT
Foru
m m
ee
ting
s, a
s w
ell
as
the
Ina
ugur
al M
em
oria
l Le
ctu
re o
f the
late
Dr.
Ivy
Ma
tse
pe
-Ca
sab
urri.
ICT
and
Yo
uth
ma
inst
rea
min
g
pro
mo
ted
th
roug
h th
e
imp
lem
ent
atio
n o
f e-S
oc
ial
Co
hesio
n Pr
og
ram
me
a
cro
ss a
ll Pr
ovi
nce
s
•Th
e D
ep
artm
ent
fully
ac
hie
ved
the
ta
rge
t.
•Th
e C
onc
ep
t on
the
e-S
oc
ial
Co
hesio
n Pr
og
ram
wa
s d
eve
lop
ed
a
nd a
pp
rove
d a
fter w
hic
h e
nga
ge
me
nts
we
re h
eld
with
M
icro
soft
as
the
tra
inin
g p
artn
er t
o
disc
uss
the
tra
inin
g p
rog
ram
me
as
we
ll a
s th
e a
pp
roa
ch.
•Th
e c
itie
s w
ithin
the
NH
I Site
s w
ere
id
ent
ifie
d a
nd th
e e
-So
cia
l Co
hesio
n Pr
og
ram
me
foc
usin
g o
n yo
uth
in N
HI
site
s w
as
imp
lem
ent
ed
ac
ross
all
Pro
vinc
es.
No
neN
one
page 45
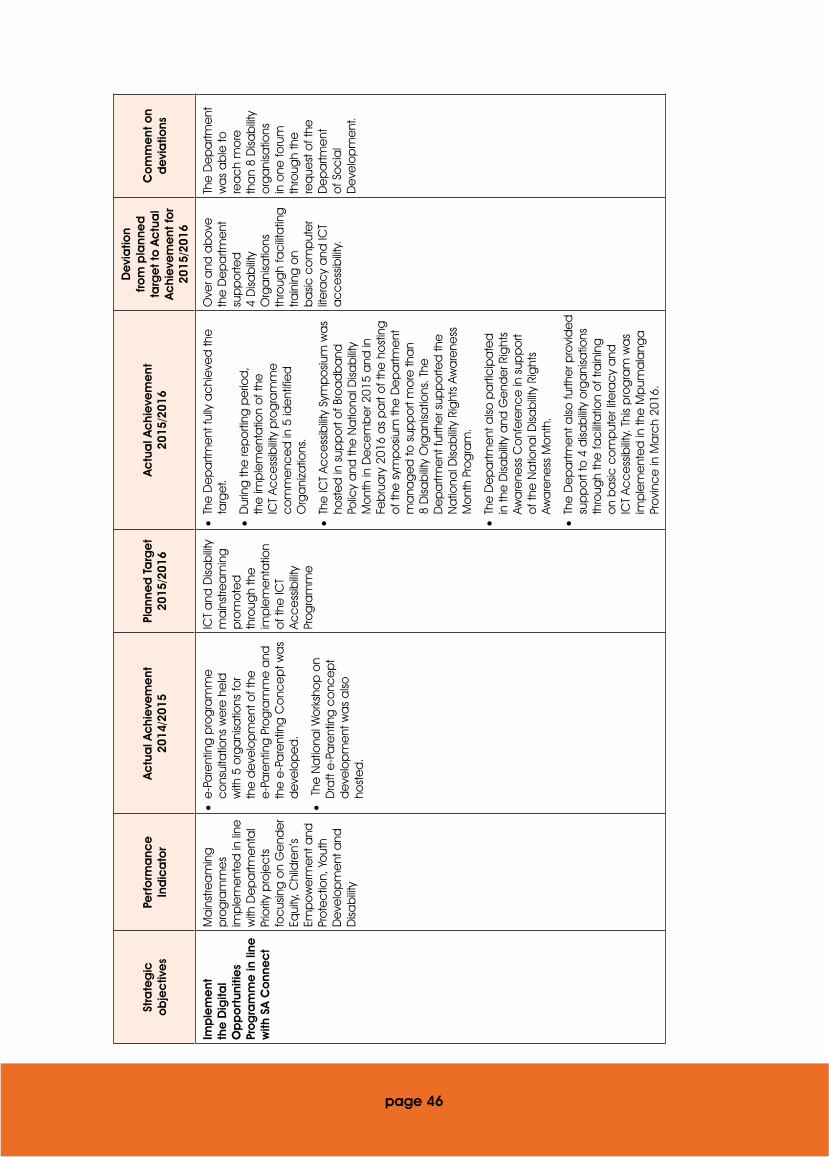
Stra
teg
ic
ob
jec
tive
sPe
rfo
rma
nce
In
dic
ato
rA
ctu
al A
chi
eve
me
nt
2014
/201
5Pl
ann
ed
Ta
rge
t20
15/2
016
Ac
tua
l Ac
hie
vem
ent
2015
/201
6
De
via
tion
fro
m p
lann
ed
ta
rge
t to
Ac
tua
l A
chi
eve
me
nt fo
r 20
15/2
016
Co
mm
ent
on
de
via
tions
Imp
lem
ent
th
e D
igita
l O
pp
ort
uniti
es
Pro
gra
mm
e in
line
w
ith S
A C
onn
ec
t
Ma
inst
rea
min
g
pro
gra
mm
es
imp
lem
ent
ed
in li
ne
with
De
pa
rtme
nta
l Pr
iorit
y p
roje
cts
fo
cus
ing
on
Ge
nde
r Eq
uity
, Chi
ldre
n’s
Emp
ow
erm
ent
and
Pr
ote
ctio
n, Y
out
h D
eve
lop
me
nt a
nd
Disa
bilit
y
•e
-Pa
rent
ing
pro
gra
mm
e
co
nsul
tatio
ns w
ere
he
ld
with
5 o
rga
nisa
tions
for
the
de
velo
pm
ent
of t
he
e-P
are
ntin
g P
rog
ram
me
and
th
e e
-Pa
rent
ing
Co
nce
pt w
as
de
velo
pe
d.
• T
he N
atio
nal W
ork
sho
p o
n D
raft
e-P
are
ntin
g c
onc
ep
t d
eve
lop
me
nt w
as
also
ho
ste
d.
ICT
and
Disa
bilit
y m
ain
stre
am
ing
p
rom
ote
d
thro
ugh
the
im
ple
me
nta
tion
of t
he IC
T Ac
ce
ssib
ility
Pro
gra
mm
e
•Th
e D
ep
artm
ent
fully
ac
hie
ved
the
ta
rge
t.
•D
urin
g th
e re
po
rting
pe
riod
, th
e im
ple
me
nta
tion
of t
he
ICT
Acc
ess
ibilit
y p
rog
ram
me
c
om
me
nce
d in
5 id
ent
ifie
d
Org
ani
zatio
ns.
•Th
e IC
T Ac
ce
ssib
ility
Sym
po
sium
wa
s ho
ste
d in
sup
po
rt o
f Bro
ad
ba
nd
Polic
y a
nd th
e N
atio
nal D
isab
ility
Mo
nth
in D
ec
em
be
r 201
5 a
nd in
Fe
bru
ary
201
6 a
s p
art
of t
he h
ost
ing
o
f the
sym
po
sium
the
De
pa
rtme
nt
ma
nag
ed
to s
upp
ort
mo
re th
an
8 D
isab
ility
Org
ani
satio
ns. T
he
De
pa
rtme
nt fu
rthe
r sup
po
rted
the
N
atio
nal D
isab
ility
Rig
hts
Awa
rene
ss
Mo
nth
Pro
gra
m.
•Th
e D
ep
artm
ent
also
pa
rtic
ipa
ted
in
the
Disa
bilit
y a
nd G
end
er R
ight
s Aw
are
ness
Co
nfe
renc
e in
sup
po
rt o
f the
Na
tiona
l Disa
bilit
y Ri
ght
s Aw
are
ness
Mo
nth.
•Th
e D
ep
artm
ent
also
furth
er p
rovi
de
d
sup
po
rt to
4 d
isab
ility
org
ani
satio
ns
thro
ugh
the
fac
ilita
tion
of t
rain
ing
o
n b
asic
co
mp
ute
r lite
rac
y a
nd
ICT
Acc
ess
ibilit
y. T
his
pro
gra
m w
as
imp
lem
ent
ed
in th
e M
pum
ala
nga
Pr
ovi
nce
in M
arc
h 20
16.
Ove
r and
ab
ove
th
e D
ep
artm
ent
su
pp
orte
d
4 D
isab
ility
Org
ani
satio
ns
thro
ugh
fac
ilita
ting
tra
inin
g o
n b
asic
co
mp
ute
r lit
era
cy
and
ICT
ac
ce
ssib
ility.
The
De
pa
rtme
nt
wa
s a
ble
to
rea
ch
mo
re
tha
n 8
Disa
bilit
y o
rga
nisa
tions
in
one
foru
m
thro
ugh
the
re
que
st o
f the
D
ep
artm
ent
o
f So
cia
l D
eve
lop
me
nt.
page 46

Stra
teg
ic
ob
jec
tive
sPe
rfo
rma
nce
In
dic
ato
rA
ctu
al A
chi
eve
me
nt
2014
/201
5Pl
ann
ed
Ta
rge
t20
15/2
016
Ac
tua
l Ac
hie
vem
ent
2015
/201
6
De
via
tion
fro
m p
lann
ed
ta
rge
t to
Ac
tua
l A
chi
eve
me
nt fo
r 20
15/2
016
Co
mm
ent
on
de
via
tions
•Th
e D
ep
artm
ent
furth
er h
ost
ed
the
3r
d D
isab
ility
and
ICT
Cha
mb
er
Me
etin
g in
Ma
rch
2016
whe
re
the
Disa
bilit
y a
nd IC
T St
rate
gy
wa
s p
rese
nte
d.
Imp
lem
ent
th
e c
ost
to
c
om
mun
ica
te
Pro
gra
mm
e o
f A
ctio
n fo
cus
ed
at
affo
rda
bili
ty a
nd
qua
lity
of I
CTs
App
rove
d ro
am
ing
p
olic
y d
irec
tion
aim
ed
at v
isib
ly
red
ucin
g th
e c
ost
to
co
mm
unic
ate
•St
udy
rep
ort
on
natio
nal
roa
min
g a
nd th
e T
erm
s o
f Re
fere
nce
we
re d
eve
lop
ed
a
nd a
pp
rove
d b
y th
e T
end
er
Co
mm
itte
e a
fter w
hic
h th
e
ap
po
intm
ent
of t
he s
erv
ice
p
rovi
de
r wa
s c
onc
lud
ed
.
Roa
min
g P
olic
y / P
olic
y D
irec
tion
de
velo
pe
d a
nd
ap
pro
ved
•Th
e D
ep
artm
ent
fully
ac
hie
ved
the
ta
rge
t.
•Ro
am
ing
stu
dy
wa
s d
one
and
the
Ro
am
ing
rep
ort
pro
duc
ed
.
•Th
e R
oa
min
g re
po
rt w
as
sub
seq
uent
ly u
sed
to d
raft
the
N
atio
nal R
oa
min
g P
olic
y (in
clu
din
g
roa
min
g b
y M
VNO
s) w
hic
h w
as
inc
lud
ed
in th
e O
pe
n Ac
ce
ss
Cha
pte
r (c
hap
ter 8
) of t
he N
atio
nal
Inte
gra
ted
ICT
Polic
y W
hite
Pa
pe
r.
•Th
e N
atio
nal I
nte
gra
ted
ICT
Polic
y W
hite
Pa
pe
r wa
s a
pp
rove
d b
y th
e
Min
iste
r fo
r ta
blin
g a
t Ca
bin
et (
ESEI
D
Ca
bin
et C
om
mitt
ee
).
•Su
bse
que
nt to
the
tab
ling
, the
Whi
te
Pap
er w
as
de
ferre
d fo
r ad
diti
ona
l in
put
and
will
be
re-s
ubm
itte
d to
C
ab
ine
t in
the
firs
t qua
rter o
f the
20
16/1
7 fin
anc
ial y
ea
r.
No
neN
one
page 47

Stra
teg
ic
ob
jec
tive
sPe
rfo
rma
nce
In
dic
ato
rA
ctu
al A
chi
eve
me
nt
2014
/201
5Pl
ann
ed
Ta
rge
t20
15/2
016
Ac
tua
l Ac
hie
vem
ent
2015
/201
6
De
via
tion
fro
m p
lann
ed
ta
rge
t to
Ac
tua
l A
chi
eve
me
nt fo
r 20
15/2
016
Co
mm
ent
on
de
via
tions
Imp
lem
ent
th
e c
ost
to
c
om
mun
ica
te
Pro
gra
mm
e o
f A
ctio
n fo
cus
ed
at
affo
rda
bili
ty a
nd
qua
lity
of I
CTs
App
rove
d L
oc
al
Loo
p S
trate
gy
aim
ed
at r
ed
ucin
g
co
mm
unic
atio
n c
ost
s a
cro
ss
mul
tiple
pla
tform
s
-D
raft
Loc
al
Loo
p S
trate
gy
de
velo
pe
d
•Th
e D
ep
artm
ent
fully
ac
hie
ved
the
ta
rge
t.
•Re
sea
rch
tow
ard
s Lo
ca
l Lo
op
st
rate
gy
wa
s c
onc
lud
ed
in th
e th
ird
qua
rter o
f the
rep
orti
ng p
erio
d a
nd a
re
sea
rch
rep
ort
pro
duc
ed
.
•A
Dra
ft Lo
ca
l Lo
op
Stra
teg
y w
as
de
velo
pe
d a
nd in
co
rpo
rate
d
into
the
Na
tiona
l Int
eg
rate
d IC
T Po
licy
Whi
te P
ap
er.
The
stra
teg
y re
co
mm
end
atio
ns o
f the
Dra
ft Lo
ca
l Lo
op
Stra
teg
y ha
ve b
ee
n in
clu
de
d
in v
ario
us d
iffe
rent
pa
rts o
f the
Whi
te
Pap
er.
•Th
e N
atio
nal I
nte
gra
ted
ICT
Polic
y W
hite
Pa
pe
r wa
s a
pp
rove
d b
y th
e
Min
iste
r fo
r ta
blin
g a
t Ca
bin
et (
ESEI
D
Ca
bin
et C
om
mitt
ee
).
•Su
bse
que
nt to
the
tab
ling
, the
Whi
te
Pap
er w
as
de
ferre
d fo
r ad
diti
ona
l in
put
and
will
be
re-s
ubm
itte
d to
C
ab
ine
t in
the
firs
t qua
rter o
f the
20
16/1
7 fin
anc
ial y
ea
r.
No
neN
one
page 48
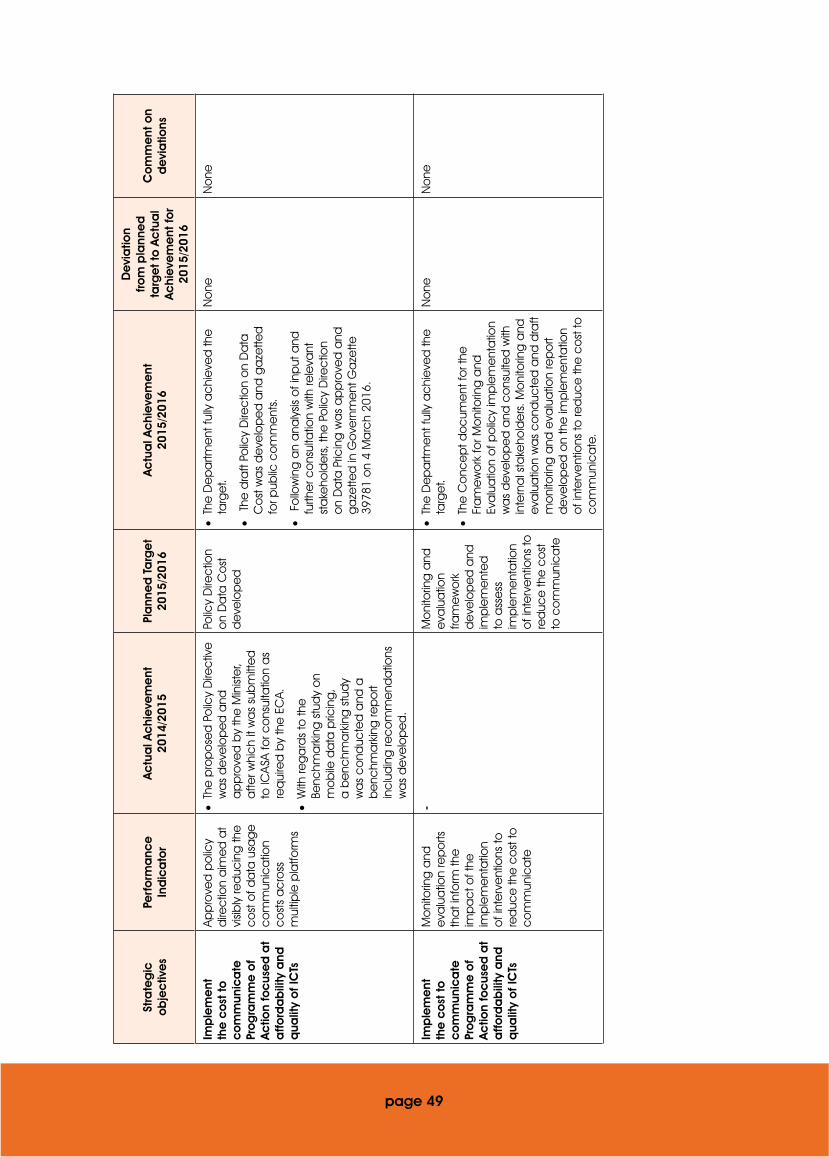
Stra
teg
ic
ob
jec
tive
sPe
rfo
rma
nce
In
dic
ato
rA
ctu
al A
chi
eve
me
nt
2014
/201
5Pl
ann
ed
Ta
rge
t20
15/2
016
Ac
tua
l Ac
hie
vem
ent
2015
/201
6
De
via
tion
fro
m p
lann
ed
ta
rge
t to
Ac
tua
l A
chi
eve
me
nt fo
r 20
15/2
016
Co
mm
ent
on
de
via
tions
Imp
lem
ent
th
e c
ost
to
c
om
mun
ica
te
Pro
gra
mm
e o
f A
ctio
n fo
cus
ed
at
affo
rda
bili
ty a
nd
qua
lity
of I
CTs
App
rove
d p
olic
y d
irec
tion
aim
ed
at
visib
ly re
duc
ing
the
c
ost
of d
ata
usa
ge
c
om
mun
ica
tion
co
sts
ac
ross
m
ultip
le p
latfo
rms
•Th
e p
rop
ose
d P
olic
y D
irec
tive
w
as
de
velo
pe
d a
nd
ap
pro
ved
by
the
Min
iste
r, a
fter w
hic
h it
wa
s su
bm
itte
d
to IC
ASA
for c
ons
ulta
tion
as
req
uire
d b
y th
e E
CA.
•W
ith re
ga
rds
to th
e
Benc
hma
rkin
g s
tud
y o
n m
ob
ile d
ata
pric
ing
, a
be
nchm
ark
ing
stu
dy
wa
s c
ond
ucte
d a
nd a
b
enc
hma
rkin
g re
po
rt in
clu
din
g re
co
mm
end
atio
ns
wa
s d
eve
lop
ed
.
Polic
y D
irec
tion
on
Da
ta C
ost
d
eve
lop
ed
•Th
e D
ep
artm
ent
fully
ac
hie
ved
the
ta
rge
t.
• T
he d
raft
Polic
y D
irec
tion
on
Da
ta
Co
st w
as
de
velo
pe
d a
nd g
aze
tted
fo
r pub
lic c
om
me
nts.
• F
ollo
win
g a
n a
naly
sis o
f inp
ut a
nd
furth
er c
ons
ulta
tion
with
rele
vant
st
ake
hold
ers
, the
Po
licy
Dire
ctio
n o
n D
ata
Pric
ing
wa
s a
pp
rove
d a
nd
ga
zette
d in
Go
vern
me
nt G
aze
tte
3978
1 o
n 4
Ma
rch
2016
.
No
neN
one
Imp
lem
ent
th
e c
ost
to
c
om
mun
ica
te
Pro
gra
mm
e o
f A
ctio
n fo
cus
ed
at
affo
rda
bili
ty a
nd
qua
lity
of I
CTs
Mo
nito
ring
and
e
valu
atio
n re
po
rts
tha
t inf
orm
the
im
pa
ct o
f the
im
ple
me
nta
tion
of i
nte
rve
ntio
ns to
re
duc
e th
e c
ost
to
co
mm
unic
ate
-M
oni
torin
g a
nd
eva
lua
tion
fram
ew
ork
d
eve
lop
ed
and
im
ple
me
nte
d
to a
sse
ss
imp
lem
ent
atio
n o
f int
erv
ent
ions
to
red
uce
the
co
st
to c
om
mun
ica
te
•Th
e D
ep
artm
ent
fully
ac
hie
ved
the
ta
rge
t.
•Th
e C
onc
ep
t do
cum
ent
for t
he
Fra
me
wo
rk fo
r Mo
nito
ring
and
Ev
alu
atio
n o
f po
licy
imp
lem
ent
atio
n w
as
de
velo
pe
d a
nd c
ons
ulte
d w
ith
inte
rna
l sta
keho
lde
rs. M
oni
torin
g a
nd
eva
lua
tion
wa
s c
ond
ucte
d a
nd d
raft
mo
nito
ring
and
eva
lua
tion
rep
ort
de
velo
pe
d o
n th
e im
ple
me
nta
tion
of i
nte
rve
ntio
ns to
red
uce
the
co
st to
c
om
mun
ica
te.
No
neN
one
page 49

Stra
teg
ic
ob
jec
tive
sPe
rfo
rma
nce
In
dic
ato
rA
ctu
al A
chi
eve
me
nt
2014
/201
5Pl
ann
ed
Ta
rge
t20
15/2
016
Ac
tua
l Ac
hie
vem
ent
2015
/201
6
De
via
tion
fro
m p
lann
ed
ta
rge
t to
Ac
tua
l A
chi
eve
me
nt fo
r 20
15/2
016
Co
mm
ent
on
de
via
tions
•Fi
nal M
oni
torin
g a
nd E
valu
atio
n Fr
am
ew
ork
wa
s d
eve
lop
ed
and
fin
alis
ed
.
•In
ad
diti
on,
a M
oni
torin
g a
nd
Eva
lua
tion
Rep
ort
on
the
im
ple
me
nta
tion
of C
ost
to
Co
mm
unic
ate
Pro
gra
mm
e w
as
ge
nera
ted
.
Imp
lem
ent
th
e P
olic
y a
nd
leg
isla
tive
p
rog
ram
me
App
rove
d W
hite
Pa
pe
r on
Na
tiona
l In
teg
rate
d IC
T Po
licy
tha
t inf
orm
s th
e le
gisl
ativ
e
pro
gra
mm
e
•Th
e D
ep
artm
ent
thro
ugh
the
ICT
Polic
y Re
vie
w
Pane
l de
velo
pe
d a
Re
co
mm
end
atio
ns R
ep
ort.
•Th
e IC
T Po
licy
Rec
om
me
nda
tions
Re
po
rt w
ill in
form
the
fina
lisa
tion
and
sub
seq
uent
ga
zetti
ng o
f th
e W
hite
Pa
pe
r on
Na
tiona
l In
teg
rate
d IC
T Po
licy.
Whi
te P
ap
er
on
Na
tiona
l In
teg
rate
d IC
T Po
licy
fina
lize
d
and
ga
zette
d
•Th
e D
ep
artm
ent
did
no
t ful
ly a
chi
eve
th
e s
et t
arg
et.
•D
urin
g th
e re
po
rting
pe
riod
brie
fing
s w
ere
do
ne to
the
Exe
cut
ive
as
we
ll th
e P
ortf
olio
Co
mm
itte
e o
n Te
lec
om
mun
ica
tions
and
Po
sta
l Se
rvic
es
on
the
ICT
Polic
y Re
vie
w
Pane
l’s P
olic
y Re
co
mm
end
atio
ns
Rep
ort.
•Th
e e
xte
nde
d P
MO
Re
sea
rch
and
An
aly
sis te
am
wa
s e
sta
blis
hed
fo
rma
lly b
y th
e D
ep
artm
ent
and
a
dd
itio
nal a
rea
s o
f re
sea
rch
ide
ntifi
ed
, sc
op
ed
and
co
ord
ina
ted
.
• T
he N
atio
nal I
nte
gra
ted
ICT
Polic
y W
hite
Pa
pe
r wa
s a
pp
rove
d b
y th
e
Min
iste
r fo
r ta
blin
g a
t Ca
bin
et (
ESEI
D
Ca
bin
et C
om
mitt
ee
).
•Su
bse
que
nt to
the
tab
ling
, the
Whi
te
Pap
er w
as
de
ferre
d fo
r ad
diti
ona
l in
put
and
will
be
re-s
ubm
itte
d to
C
ab
ine
t in
the
firs
t qua
rter o
f the
20
16/1
7 fin
anc
ial y
ea
r.
The
De
pa
rtme
nt
did
no
t Ga
zette
th
e W
hite
Pa
pe
r as
pla
nne
d
Due
to th
e
req
uire
me
nt
from
Ca
bin
et
Co
mm
itte
e fo
r m
ino
r cha
nge
s to
be
ma
de
in
the
Whi
te P
ap
er,
it w
as
not g
aze
tted
a
s p
lann
ed
. The
D
ep
artm
ent
ha
s m
ad
e
the
req
uire
d
am
end
me
nts
and
pla
ns to
re-
sub
mit
to C
ab
ine
t in
the
201
6/17
fin
anc
ial y
ea
r.
page 50
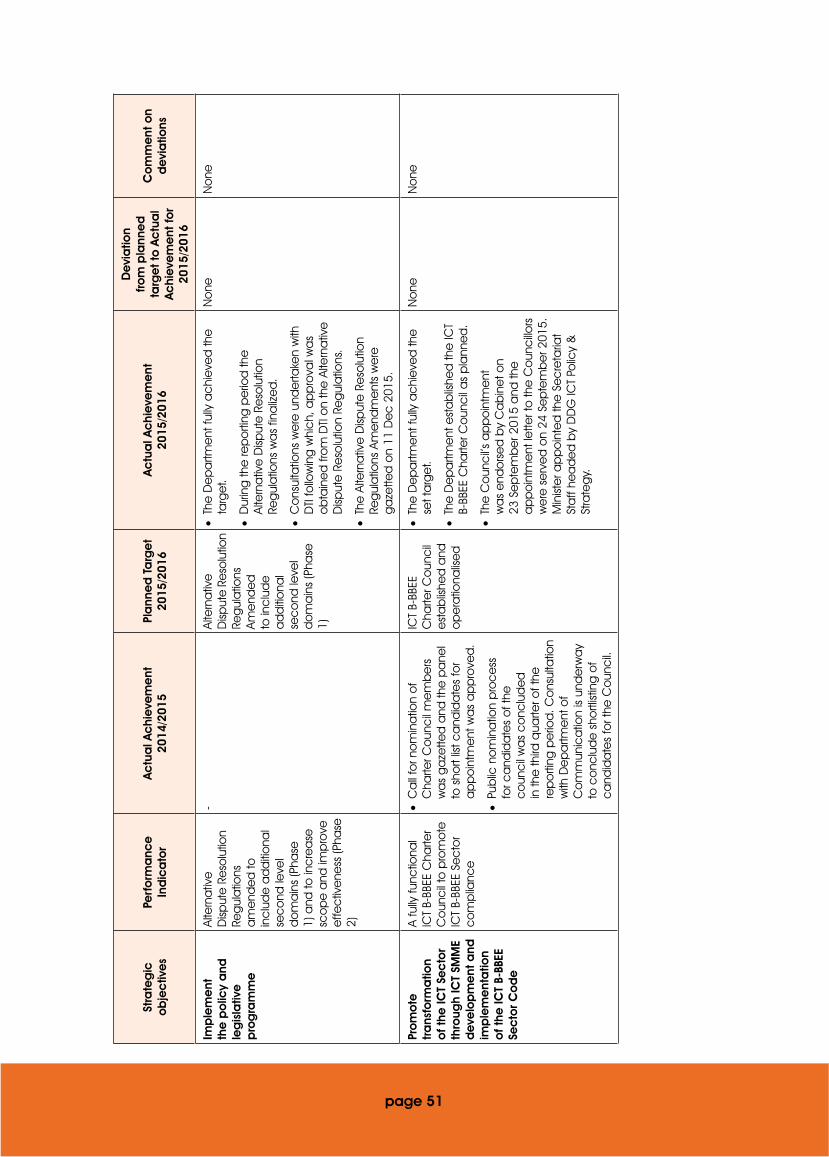
Stra
teg
ic
ob
jec
tive
sPe
rfo
rma
nce
In
dic
ato
rA
ctu
al A
chi
eve
me
nt
2014
/201
5Pl
ann
ed
Ta
rge
t20
15/2
016
Ac
tua
l Ac
hie
vem
ent
2015
/201
6
De
via
tion
fro
m p
lann
ed
ta
rge
t to
Ac
tua
l A
chi
eve
me
nt fo
r 20
15/2
016
Co
mm
ent
on
de
via
tions
Imp
lem
ent
th
e p
olic
y a
nd
leg
isla
tive
p
rog
ram
me
Alte
rna
tive
D
isput
e R
eso
lutio
n Re
gul
atio
ns
am
end
ed
to
inc
lud
e a
dd
itio
nal
sec
ond
leve
l d
om
ain
s (P
hase
1)
and
to in
cre
ase
sc
op
e a
nd im
pro
ve
effe
ctiv
ene
ss (P
hase
2)
-Al
tern
ativ
e
Disp
ute
Re
solu
tion
Reg
ula
tions
Am
end
ed
to
inc
lud
e
ad
diti
ona
l se
co
nd le
vel
do
ma
ins
(Pha
se
1)
•Th
e D
ep
artm
ent
fully
ac
hie
ved
the
ta
rge
t.
•D
urin
g th
e re
po
rting
pe
riod
the
Al
tern
ativ
e D
isput
e R
eso
lutio
n Re
gul
atio
ns w
as
fina
lize
d.
•C
ons
ulta
tions
we
re u
nde
rtake
n w
ith
DTI
follo
win
g w
hic
h, a
pp
rova
l wa
s o
bta
ine
d fr
om
DTI
on
the
Alte
rna
tive
D
isput
e R
eso
lutio
n Re
gul
atio
ns.
•Th
e A
ltern
ativ
e D
isput
e R
eso
lutio
n Re
gul
atio
ns A
me
ndm
ent
s w
ere
g
aze
tted
on
11 D
ec
201
5.
No
neN
one
Pro
mo
te
tra
nsfo
rma
tion
of t
he IC
T Se
cto
r th
roug
h IC
T SM
ME
de
velo
pm
ent
and
im
ple
me
nta
tion
of t
he IC
T B-
BBEE
Se
cto
r Co
de
A fu
lly fu
nctio
nal
ICT
B-BB
EE C
harte
r C
oun
cil
to p
rom
ote
IC
T B-
BBEE
Se
cto
r c
om
plia
nce
•C
all
for n
om
ina
tion
of
Cha
rter C
oun
cil
me
mb
ers
w
as
ga
zette
d a
nd th
e p
ane
l to
sho
rt lis
t ca
ndid
ate
s fo
r a
pp
oin
tme
nt w
as
ap
pro
ved
.
•Pu
blic
no
min
atio
n p
roc
ess
fo
r ca
ndid
ate
s o
f the
c
oun
cil
wa
s c
onc
lud
ed
in
the
third
qua
rter o
f the
re
po
rting
pe
riod
. Co
nsul
tatio
n w
ith D
ep
artm
ent
of
Co
mm
unic
atio
n is
und
erw
ay
to c
onc
lud
e s
hortl
istin
g o
f c
and
ida
tes
for t
he C
oun
cil.
ICT
B-BB
EE
Cha
rter C
oun
cil
est
ab
lishe
d a
nd
op
era
tiona
lise
d
•Th
e D
ep
artm
ent
fully
ac
hie
ved
the
se
t ta
rge
t.
•Th
e D
ep
artm
ent
est
ab
lishe
d th
e IC
T B-
BBEE
Cha
rter C
oun
cil
as
pla
nne
d.
•Th
e C
oun
cil’s
ap
po
intm
ent
w
as
end
ors
ed
by
Ca
bin
et o
n 23
Se
pte
mb
er 2
015
and
the
a
pp
oin
tme
nt le
tter t
o th
e C
oun
cillo
rs
we
re s
erv
ed
on
24 S
ep
tem
be
r 201
5.
Min
iste
r ap
po
inte
d th
e S
ec
reta
riat
Sta
ff he
ad
ed
by
DD
G IC
T Po
licy
&
Stra
teg
y.
No
neN
one
page 51
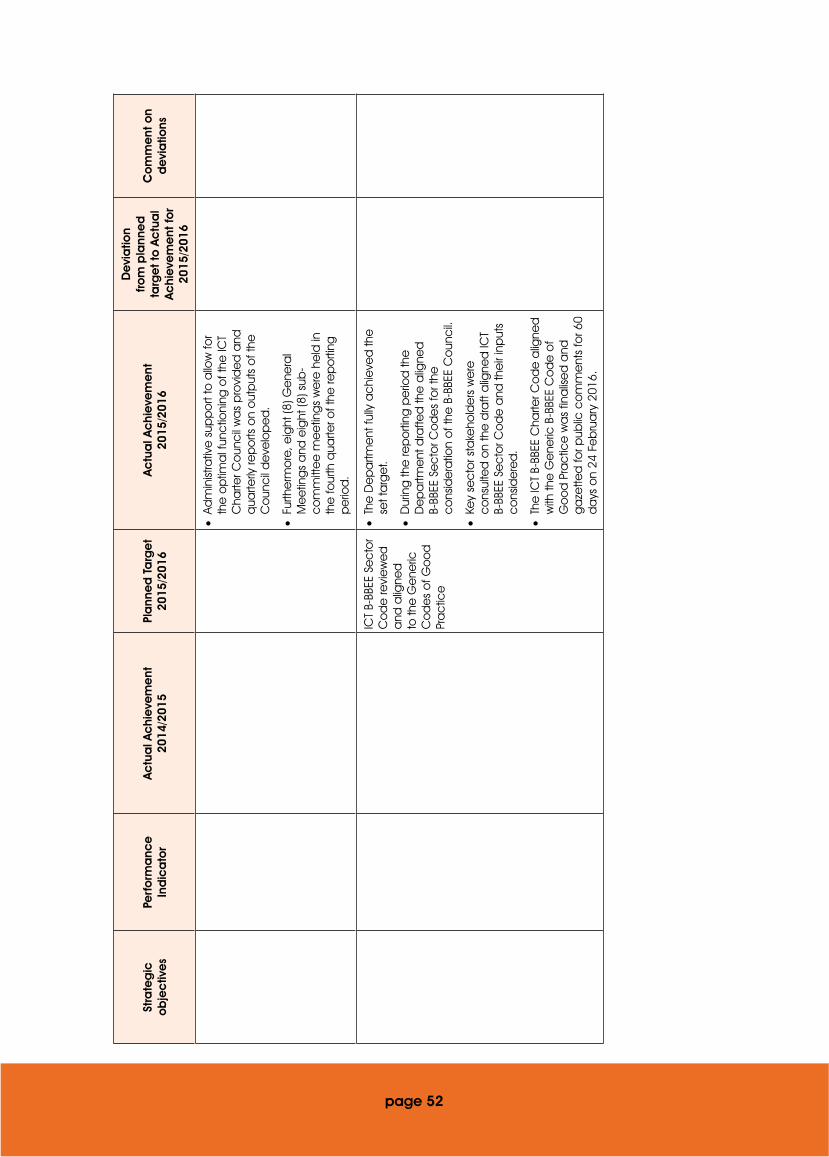
Stra
teg
ic
ob
jec
tive
sPe
rfo
rma
nce
In
dic
ato
rA
ctu
al A
chi
eve
me
nt
2014
/201
5Pl
ann
ed
Ta
rge
t20
15/2
016
Ac
tua
l Ac
hie
vem
ent
2015
/201
6
De
via
tion
fro
m p
lann
ed
ta
rge
t to
Ac
tua
l A
chi
eve
me
nt fo
r 20
15/2
016
Co
mm
ent
on
de
via
tions
•Ad
min
istra
tive
sup
po
rt to
allo
w fo
r th
e o
ptim
al f
unc
tioni
ng o
f the
ICT
Cha
rter C
oun
cil
wa
s p
rovi
de
d a
nd
qua
rterly
rep
orts
on
out
put
s o
f the
C
oun
cil
de
velo
pe
d.
•Fu
rthe
rmo
re, e
ight
(8) G
ene
ral
Me
etin
gs
and
eig
ht (8
) sub
-c
om
mitt
ee
me
etin
gs
we
re h
eld
in
the
four
th q
uarte
r of t
he re
po
rting
p
erio
d.
ICT
B-BB
EE S
ec
tor
Co
de
revi
ew
ed
a
nd a
ligne
d
to th
e G
ene
ric
Co
de
s o
f Go
od
Pr
ac
tice
•Th
e D
ep
artm
ent
fully
ac
hie
ved
the
se
t ta
rge
t.
•D
urin
g th
e re
po
rting
pe
riod
the
D
ep
artm
ent
dra
fted
the
alig
ned
B-
BBEE
Se
cto
r Co
de
s fo
r the
c
ons
ide
ratio
n o
f the
B-B
BEE
Co
unc
il.
•Ke
y se
cto
r sta
keho
lde
rs w
ere
c
ons
ulte
d o
n th
e d
raft
alig
ned
ICT
B-BB
EE S
ec
tor C
od
e a
nd th
eir
inp
uts
co
nsid
ere
d.
•Th
e IC
T B-
BBEE
Cha
rter C
od
e a
ligne
d
with
the
Ge
neric
B-B
BEE
Co
de
of
Go
od
Pra
ctic
e w
as
fina
lise
d a
nd
ga
zette
d fo
r pub
lic c
om
me
nts
for 6
0 d
ays
on
24 F
eb
rua
ry 2
016.
page 52

page 53
Stra
teg
ic
ob
jec
tive
sPe
rfo
rma
nce
In
dic
ato
rA
ctu
al A
chi
eve
me
nt
2014
/201
5Pl
ann
ed
Ta
rge
t20
15/2
016
Ac
tua
l Ac
hie
vem
ent
2015
/201
6
De
via
tion
fro
m p
lann
ed
ta
rge
t to
Ac
tua
l A
chi
eve
me
nt fo
r 20
15/2
016
Co
mm
ent
on
de
via
tions
Annu
al I
CT
B-BB
EE S
ec
tor
Co
mp
lianc
e
Rep
ort
de
velo
pe
d
•Th
e D
ep
artm
ent
did
no
t ful
ly a
chi
eve
th
e s
et t
arg
et.
•Th
e A
nnua
l IC
T B-
BBEE
Co
mp
lianc
e
Rep
ort
wa
s d
eve
lop
ed
and
fina
lise
d.
The
ap
pro
val a
nd
sub
miss
ion
of t
he
fina
l Ann
ual I
CT
B-BB
EE C
om
plia
nce
Re
po
rt to
DTI
too
k p
lac
e a
fter t
he
rep
orti
ng p
erio
d.
De
lays
in th
e
ap
po
intm
ent
o
f the
Co
unc
il re
qui
red
the
C
oun
cil
to
prio
ritize
the
a
lignm
ent
of
the
Se
cto
r Co
de
a
hea
d o
f the
d
eve
lop
me
nt
of t
he S
ec
tor
Co
mp
lianc
e
Rep
ort.
Al
tho
ugh
the
An
nua
l IC
T B-
BBEE
C
om
plia
nce
Re
po
rt w
as
fina
lize
d b
y 31
M
arc
h 20
16, t
he
fina
l ap
pro
val
by
Min
iste
r and
su
bm
issio
n to
the
D
TI w
as
ac
hie
ved
o
n 13
Ap
ril 2
016.

page 54
Stra
teg
ic
ob
jec
tive
sPe
rfo
rma
nce
In
dic
ato
rA
ctu
al A
chi
eve
me
nt
2014
/201
5Pl
ann
ed
Ta
rge
t20
15/2
016
Ac
tua
l Ac
hie
vem
ent
2015
/201
6
De
via
tion
fro
m p
lann
ed
ta
rge
t to
Ac
tua
l A
chi
eve
me
nt fo
r 20
15/2
016
Co
mm
ent
on
de
via
tions
Pro
mo
te
tra
nsfo
rma
tion
of t
he IC
T Se
cto
r th
roug
h IC
T SM
ME
de
velo
pm
ent
and
im
ple
me
nta
tion
of t
he IC
T B-
BBEE
Se
cto
r Co
de
App
rove
d D
igita
l e
ntre
pre
neur
ship
p
rog
ram
me
im
ple
me
nte
d fo
r all
ide
ntifi
ed
site
s
Req
uest
for I
nfo
rma
tion
(RFI
) fro
m S
MM
Es, a
ba
selin
e
rese
arc
h re
po
rt o
n IC
T SM
MEs
w
as
de
velo
pe
d.
Dig
ital
ent
rep
rene
ursh
ip
pro
gra
mm
e to
e
nha
nce
ICT
ad
op
tion
and
us
ag
e b
y SM
MEs
d
eve
lop
ed
•Th
e D
ep
artm
ent
did
no
t ful
ly a
chi
eve
th
e s
et t
arg
et.
•D
urin
g th
e fi
rst q
uarte
r of t
he
rep
orti
ng p
erio
d th
e D
ep
artm
ent
c
ond
ucte
d c
ons
ulta
tive
se
ssio
ns
with
NH
I Site
s w
here
in th
e D
igita
l O
pp
ortu
nitie
s fra
me
wo
rk w
as
pre
sent
ed
so
as
to in
clu
de
ele
me
nts
of t
he D
igita
l ent
rep
rene
ursh
ip
ca
pa
city
de
velo
pm
ent
Pro
gra
mm
e.
The
Dig
ital
ent
rep
rene
ursh
ip
pro
gra
mm
e c
oul
d
not b
e d
eve
lop
ed
a
nd a
pp
rove
d a
s p
lann
ed
.
The
ac
hie
vem
ent
o
f the
targ
et
wa
s a
ffec
ted
b
y a
lac
k o
f HR
ca
pa
city
due
to
the
ext
end
ed
a
bse
nce
of t
he
pro
jec
t ma
nag
er
ow
ing
to il
l he
alth
.G
oin
g
forw
ard
, Dig
ital
ent
rep
rene
ursh
ip,
is b
ein
g
imp
lem
ent
ed
th
roug
h th
e D
igita
l O
pp
ortu
nitie
s Pr
og
ram
me
w
hic
h is
cur
rent
ly
und
er w
ay.

page 55
Stra
teg
ic
ob
jec
tive
sPe
rfo
rma
nce
In
dic
ato
rA
ctu
al A
chi
eve
me
nt
2014
/201
5Pl
ann
ed
Ta
rge
t20
15/2
016
Ac
tua
l Ac
hie
vem
ent
2015
/201
6
De
via
tion
fro
m p
lann
ed
ta
rge
t to
Ac
tua
l A
chi
eve
me
nt fo
r 20
15/2
016
Co
mm
ent
on
de
via
tions
Ensu
re t
he
ava
ilab
ility
of
upd
ate
d a
nd
rele
vant
ICT
rese
arc
h a
nd IC
T st
atis
tics
to in
form
e
vid
enc
e-b
ase
d
po
licy
ma
king
Upd
ate
d, r
ele
vant
IC
T re
sea
rch
and
st
atis
tics
tha
t inf
orm
s a
nd s
upp
orts
po
licy
de
velo
pm
ent
•Th
e R
ese
arc
h p
rog
ram
me
w
as
de
velo
pe
d th
roug
h c
ons
ulta
tion
with
rele
vant
st
ake
hold
ers
inc
lud
ing
a
ca
de
mia
, go
vern
me
nt a
nd
sec
tor e
xpe
rts o
n p
ote
ntia
l a
rea
s o
f re
sea
rch
in th
e IC
T fie
ld.
•Th
e D
ep
artm
ent
c
om
miss
ione
d a
se
ries
of
co
mp
rehe
nsiv
e re
sea
rch
stud
ies,
whi
ch
pro
vid
ed
b
ase
line
info
rma
tion
for
the
form
ula
tion
of p
olic
y p
osit
ions
by
the
ICT
Polic
y Re
vie
w P
ane
l. Th
e re
sea
rch
co
vere
d a
rea
s th
at i
nclu
de
c
ybe
rse
cur
ity, e
-Go
vern
me
nt,
bro
ad
ca
stin
g, p
ost
al s
erv
ice
s,
op
en
ac
ce
ss p
olic
y re
gim
e
and
tele
co
mm
unic
atio
ns.
ICT
Rese
arc
h Fr
am
ew
ork
d
eve
lop
ed
fo
cus
ing
on
co
mp
etit
ive
ness
a
nd in
nova
tion
•Th
e D
ep
artm
ent
did
no
t ful
ly
ac
hie
ve th
e s
et t
arg
et
•D
urin
g th
e re
po
rting
pe
riod
the
D
ep
artm
ent
de
velo
pe
d th
e
ICT
Rese
arc
h Ag
end
a th
roug
h c
ons
ulta
tion
with
rele
vant
st
ake
hold
ers
.
The
De
pa
rtme
nt
wa
s no
t ab
le
to d
eve
lop
the
IC
T Re
sea
rch
Fra
me
wo
rk
as
pla
nne
d.
Furth
erm
ore
the
e
sta
blis
hme
nt
of t
he R
ese
arc
h Ex
pe
rts R
efe
renc
e
Gro
up d
id n
ot t
ake
p
lac
e h
enc
e th
e
rese
arc
h re
po
rts
foc
usin
g o
n c
om
pe
titiv
ene
ss
and
inno
vatio
n w
ere
no
t d
eve
lop
ed
as
pla
nne
d.
The
ac
hie
vem
ent
o
f the
pla
nne
d
targ
et w
as
larg
ely
im
pa
cte
d b
y th
e
resig
natio
n o
f the
Pr
oje
ct M
ana
ge
r w
hic
h re
sulte
d
in H
R c
ap
ac
ity
co
nstra
ints
.H
ow
eve
r, in
th
e 2
015/
16
fina
ncia
l ye
ar,
ICT
Rese
arc
h is
be
ing
p
riorit
ised
with
th
e a
pp
rop
riate
H
R c
ap
ac
ity in
p
lac
e.

page 56
Stra
teg
ic
ob
jec
tive
sPe
rfo
rma
nce
In
dic
ato
rA
ctu
al A
chi
eve
me
nt
2014
/201
5Pl
ann
ed
Ta
rge
t20
15/2
016
Ac
tua
l Ac
hie
vem
ent
2015
/201
6
De
via
tion
fro
m p
lann
ed
ta
rge
t to
Ac
tua
l A
chi
eve
me
nt fo
r 20
15/2
016
Co
mm
ent
on
de
via
tions
Upd
ate
d, r
ele
vant
IC
T re
sea
rch
and
st
atis
tics
tha
t inf
orm
s a
nd s
upp
orts
po
licy
de
velo
pm
ent
•D
iag
nost
ic d
esk
top
rese
arc
h to
de
term
ine
fac
tors
in
flue
ntia
l to
SA’
s ra
nkin
gs
and
pe
rform
anc
e w
as
und
erta
ken.
Thi
s w
ill b
e a
b
asis
for t
he d
eve
lop
me
nt o
f a
Pro
gra
mm
e o
f Ac
tion.
•Th
e e
-Ba
rom
ete
r ind
ica
tors
w
ere
pub
lishe
d a
nd
uplo
ad
ed
on
the
ICT
Info
rma
tion
Rep
osit
ory
.
Annu
al S
out
h Af
rica
n IC
T St
atis
tica
l C
om
pe
ndiu
m
pro
duc
ed
•Th
e D
ep
artm
ent
fully
ac
hie
ved
the
se
t ta
rge
t.
•D
urin
g th
e re
po
rting
pe
riod
, da
ta
to s
upp
ort
the
ICT
Ind
ica
tors
C
om
pe
ndiu
m w
as
sour
ce
d a
nd
ass
ess
ed
with
rele
vant
sta
keho
lde
rs
whe
re th
e d
ata
ga
p w
as
de
term
ine
d
and
a re
po
rt w
as
de
velo
pe
d.
•Fo
llow
ing
the
de
velo
pm
ent
of t
he
dra
ft IC
T in
dic
ato
rs F
ram
ew
ork
for
the
Sta
tistic
al C
om
pe
ndiu
m, t
he
ICT
Sta
tistic
al C
om
pe
ndiu
m w
as
pro
duc
ed
and
sa
mp
le c
op
ies
we
re
pub
lishe
d.
No
neN
one
De
velo
p a
nd
imp
lem
ent
the
N
atio
nal A
dd
ress
Sy
ste
m P
olic
y
App
rove
d a
nd
Imp
lem
ent
ed
N
atio
nal A
dd
ress
Sy
ste
m P
olic
y
•D
ep
artm
ent
de
velo
pe
d
and
ob
tain
ed
ap
pro
val o
f th
e c
onc
ep
t pa
pe
r on
the
N
atio
nal A
dd
ress
Sys
tem
w
hic
h w
as
pre
sent
ed
to
the
So
cia
l Clu
ste
r Te
chn
ica
l G
roup
in S
ep
tem
be
r 201
4.
•A
pro
ce
ss w
as
und
erw
ay
to
de
velo
p a
Na
tiona
l Ad
dre
ss
Polic
y a
s re
co
mm
end
ed
by
the
Na
tiona
l IC
T Po
licy
Revi
ew
Re
po
rt.
Na
tiona
l Ad
dre
ss
Syst
em
Po
licy
de
velo
pe
d a
nd
ap
pro
ved
•Th
e D
ep
artm
ent
fully
ac
hie
ved
the
ta
rge
t.
•Be
nchm
ark
rese
arc
h w
as
co
nduc
ted
a
nd d
raft
be
nchm
ark
rep
ort
de
velo
pe
d o
n th
e N
atio
nal a
dd
ress
Sy
ste
m.
•Th
e N
atio
nal A
dd
ress
Sys
tem
C
onc
ep
t pa
pe
r wa
s d
eve
lop
ed
a
nd a
pp
rove
d b
y th
e S
oc
ial
Pro
tec
tion,
Co
mm
unity
and
Hum
an
De
velo
pm
ent
Clu
ste
r.
•Th
e d
raft
Na
tiona
l Ad
dre
ss S
yste
m
Polic
y w
as
de
velo
pe
d in
the
se
co
nd
qua
rter o
f the
rep
orti
ng p
erio
d a
nd
wa
s c
ons
ulte
d o
n w
ith S
APO
and
IC
ASA
.
No
neN
one

page 57
Stra
teg
ic
ob
jec
tive
sPe
rfo
rma
nce
In
dic
ato
rA
ctu
al A
chi
eve
me
nt
2014
/201
5Pl
ann
ed
Ta
rge
t20
15/2
016
Ac
tua
l Ac
hie
vem
ent
2015
/201
6
De
via
tion
fro
m p
lann
ed
ta
rge
t to
Ac
tua
l A
chi
eve
me
nt fo
r 20
15/2
016
Co
mm
ent
on
de
via
tions
•Th
e d
raft
Na
tiona
l Ad
dre
ss S
yste
m
Polic
y w
as
inc
lud
ed
in C
hap
ter 1
0 o
f the
Na
tiona
l Int
eg
rate
d IC
T Po
licy
Whi
te P
ap
er.
•Th
e N
atio
nal I
nte
gra
ted
ICT
Polic
y W
hite
Pa
pe
r wa
s a
pp
rove
d b
y th
e
Min
iste
r fo
r ta
blin
g a
t Ca
bin
et (
ESEI
D
Ca
bin
et C
om
mitt
ee
).
•Su
bse
que
nt to
the
tab
ling
, the
Whi
te
Pap
er w
as
de
ferre
d fo
r ad
diti
ona
l in
put
and
will
be
re-s
ubm
itte
d to
C
ab
ine
t in
the
firs
t qua
rter o
f the
20
16/1
7 fin
anc
ial y
ea
r.
De
velo
p a
nd
imp
lem
ent
the
St
rate
gy
on
Phila
telic
Pro
duc
ts
App
rove
d
Phila
telic
Stra
teg
y fo
r Ann
ual a
nd
Co
mm
em
ora
tive
St
am
p P
rog
ram
me
-Ph
ilate
lic S
trate
gy
and
Ann
ual a
nd
Co
mm
em
ora
tive
St
am
p
Pro
gra
mm
e
de
velo
pe
d a
nd
ap
pro
ved
•Th
e D
ep
artm
ent
fully
ac
hie
ved
the
se
t ta
rge
t.
•Re
sea
rch
wa
s c
ond
ucte
d a
nd D
raft
Phila
telic
Stra
teg
y w
as
de
velo
pe
d
and
co
nsul
ted
with
SAP
O a
nd IC
ASA
•Th
e P
hila
telic
Stra
teg
y w
as
fina
lise
d
and
inc
lud
ed
in C
hap
ter 1
0 o
f the
N
atio
nal I
nte
gra
ted
ICT
Polic
y W
hite
Pa
pe
r.
•Th
e N
atio
nal I
nte
gra
ted
ICT
Polic
y W
hite
Pa
pe
r wa
s a
pp
rove
d b
y th
e
Min
iste
r fo
r ta
blin
g a
t Ca
bin
et (
ESEI
D
Ca
bin
et C
om
mitt
ee
).
No
neN
one

page 58
Stra
teg
ic
ob
jec
tive
sPe
rfo
rma
nce
In
dic
ato
rA
ctu
al A
chi
eve
me
nt
2014
/201
5Pl
ann
ed
Ta
rge
t20
15/2
016
Ac
tua
l Ac
hie
vem
ent
2015
/201
6
De
via
tion
fro
m p
lann
ed
ta
rge
t to
Ac
tua
l A
chi
eve
me
nt fo
r 20
15/2
016
Co
mm
ent
on
de
via
tions
•Su
bse
que
nt to
the
tab
ling
, the
Whi
te
Pap
er w
as
de
ferre
d fo
r ad
diti
ona
l in
put
and
will
be
re-s
ubm
itte
d to
C
ab
ine
t in
the
firs
t qua
rter o
f the
20
16/1
7 fin
anc
ial y
ea
r.
•An
nua
l Sta
mp
Pro
gra
mm
e fo
r 201
5 w
as
de
velo
pe
d a
nd a
pp
rove
d. T
he
sta
mp
pro
gra
mm
e is
de
velo
pe
d
afte
r re
ce
ivin
g p
rop
osa
l fro
m S
APO
ho
we
ver n
o p
rop
osa
ls w
ere
rec
eiv
ed
fo
r 201
6
•C
om
me
mo
rativ
e S
tam
p fo
r the
O
xfo
rd U
nive
rsity
Pre
ss S
out
hern
Afri
ca
w
as
de
velo
pe
d a
nd la
unc
hed
by
the
DTP
S a
nd D
BE M
inist
er o
n 08
D
ec
em
be
r 201
5
De
velo
p a
nd
imp
lem
ent
po
licy
dire
ctiv
e o
n th
e
reg
ula
tion
of
ETO
Es a
nd R
e-
ma
iling
App
rove
d a
nd
imp
lem
ent
ed
po
licy
dire
ctiv
e o
n th
e
reg
ula
tion
of E
TOEs
a
nd R
e-
ma
iling
-Po
licy
dire
ctiv
e
on
reg
ula
tion
of E
TOEs
and
Re
-ma
iling
d
eve
lop
ed
and
a
pp
rove
d
•Th
e D
ep
artm
ent
fully
ac
hie
ved
the
se
t ta
rge
t.
•D
urin
g th
e re
po
rting
pe
riod
the
D
ep
artm
ent
co
nduc
ted
rese
arc
h a
nd d
eve
lop
ed
a b
enc
hma
rk re
po
rt w
ith re
ga
rds
to th
e re
gul
atio
n o
f ET
OEs
and
Re
-ma
iling
.
•A
dra
ft p
olic
y (D
iscus
sion
Do
cum
ent
) fo
cus
ing
on
reg
ula
tion
of E
TOEs
w
as
de
velo
pe
d a
nd in
co
rpo
rate
d
in C
hap
ter 1
0 o
f the
Na
tiona
l In
teg
rate
d IC
T Po
licy
Whi
te P
ap
er.
No
neN
one

page 59
Stra
teg
ic
ob
jec
tive
sPe
rfo
rma
nce
In
dic
ato
rA
ctu
al A
chi
eve
me
nt
2014
/201
5Pl
ann
ed
Ta
rge
t20
15/2
016
Ac
tua
l Ac
hie
vem
ent
2015
/201
6
De
via
tion
fro
m p
lann
ed
ta
rge
t to
Ac
tua
l A
chi
eve
me
nt fo
r 20
15/2
016
Co
mm
ent
on
de
via
tions
•Th
e N
atio
nal I
nte
gra
ted
ICT
Polic
y W
hite
Pa
pe
r wa
s a
pp
rove
d b
y th
e
Min
iste
r fo
r ta
blin
g a
t Ca
bin
et (
ESEI
D
Ca
bin
et C
om
mitt
ee
).
•Su
bse
que
nt to
the
tab
ling
, the
Whi
te
Pap
er w
as
de
ferre
d fo
r ad
diti
ona
l in
put
and
will
be
re-s
ubm
itte
d to
C
ab
ine
t in
the
firs
t qua
rter o
f the
20
16/1
7 fin
anc
ial y
ea
r.
De
velo
p a
nd
imp
lem
ent
th
e N
atio
nal
e-S
tra
teg
y
ICT
upta
ke
and
usa
ge
by
go
vern
me
nt,
ind
ivid
uals
and
e
nte
rpris
es
imp
rove
d
•Th
e D
ep
artm
ent
revi
sed
the
e
-Stra
teg
y Fr
am
ew
ork
to
inc
lud
e s
take
hold
er i
nput
re
ce
ive
d d
urin
g th
e re
po
rting
p
erio
d.
•Th
e D
raft
Na
tiona
l e-S
trate
gy
wa
s su
bst
ant
ially
revi
sed
in
line
with
the
inp
uts
of t
he In
ter-
De
pa
rtme
nta
l Wo
rkin
g G
roup
.
Na
tiona
l e
-Stra
teg
y d
eve
lop
ed
and
a
pp
rove
d
•Th
e D
ep
artm
ent
did
no
t ful
ly a
chi
eve
th
e s
et t
arg
et.
•D
urin
g th
e re
po
rting
pe
riod
the
D
ep
artm
ent
und
erto
ok
co
nsul
tatio
n w
ith P
rovi
nce
s o
n th
e N
atio
nal
e-S
trate
gy
Fra
me
wo
rk. S
uch
co
nsul
tatio
ns w
ere
co
nduc
ted
th
roug
h th
e P
rovi
ncia
l Bro
ad
ba
nd
Ste
erin
g C
om
mitt
ee
in N
orth
We
st,
Limp
op
o a
nd N
orth
ern
Ca
pe
Pr
ovi
nce.
•Fu
rthe
r co
nsul
tatio
n to
ok
pla
ce
with
th
e S
tate
Info
rma
tion
Tec
hno
log
y Ag
enc
y (S
ITA) a
nd th
e N
atio
nal
ICT
Foru
m W
ork
ing
Co
mm
itte
e o
n e
-Co
mm
erc
e s
o a
s to
pro
vid
e
for i
nstit
utio
nal m
ec
hani
sms
to b
e
use
d fo
r the
de
velo
pm
ent
of t
he
e-S
trate
gy.
The
Na
tiona
l e
-Stra
teg
y w
as
not g
aze
tted
a
nd a
pp
rove
d a
s p
lann
ed
Due
to a
c
hang
e in
the
a
pp
roa
ch
on
the
d
eve
lop
me
nt
of t
he N
atio
nal
e-S
trate
gy,
the
re
we
re d
ela
ys in
a
chi
evi
ng th
e
targ
et.
Ho
we
ver t
he
de
velo
pm
ent
of
the
e-S
trate
gy
has
be
en
ide
ntifi
ed
as
a
prio
rity
pro
jec
t in
the
201
6/17
fin
anc
ial y
ea
r.

Strategy to overcome areas of under-performance
The Department does acknowledge its areas of under-performance with regards to specific targets for
which project specific reasons have been provided under “comment on deviation”, where applicable.
The challenge experienced with the implementation of the Information Ethics Programme in remaining
Provinces has been overcome through the signing of the MoU with the African Centre of Excellence for
Information Ethics. This will ensure that all remaining Provinces are prioritised and speedily concluded.
With regards to the Annual ICT B-BBEE Sector Compliance Report, there should not be any challenges
going forward as the ICT B-BBEE Council has been appointed and the Council is fully operational and
optimally supported by the Department. Lastly, with regards to HR capacity constraints experienced on
certain projects due to resignation and ill-health, the Department will ensure the availability of additional
resources should such a challenges arise in the future.
Changes to planned targets
There were no changes to the planned targets during the reporting period.
Linking performance with budgets
The underspending in this programme was due to vacant positions not being filled on time. Under goods
and services the under spending was mostly under consultants due to the Department reducing reliance
on consultants as well as the decline on travelling.
Sub-programme expenditure
Sub- Programme Name
2015/2016 2014/2015
Final Appro-priation
ActualExpenditure
(Over)/Under Expenditure
Final Appropriation
ActualExpenditure
(Over)/Under Expenditure
R’000 R’000 R’000 R’000 R’000 R’000
ICT Policy Development 20 561 14 397 6 164 39 278 20 254 19 024
Economic And Market Analysis 5 855 4 392 1 463 6 163 6 162 1
Research 5 279 4 183 1 096 7 491 4 021 3 470
Information Society Development 52 488 41 397 11 091 43 515 35 137 8 378
Capacity Development 12 949 9 610 3 339 14 900 12 610 2 290
Total 97 132 73 979 23 153 111 347 78 183 33 164
page 60

page 61
4.4 Programme 4: ICT Enterprise Development and SOC Oversight
The purpose of Programme 4 is to oversee and manage Government’s shareholding interest in the ICT
public entities. Facilitate growth and development of Small, Medium and Micro Enterprises (SMMEs) in the
ICT sector.
The ICT Enterprise Development and SOE Oversight Programme consist of the following sub programmes:
• Public Entity Oversight provides oversight relating to State Owned Companies by managing
Government’s shareholder interests in public enterprises to support the attainment of key national goals
and strategic priorities;
• Small, Medium and Micro Enterprise (SMME) Development facilitates the growth and development
of ICT SMMEs; and
• ICT Support oversees and manages transfers to public entities and state owned companies responsible
for the management and protection of South Africa’s ICT environment.
The Strategic Objectives for the 2015/16 Financial Year are listed below:
• Promote transformation of the ICT Sector through ICT SMME development and implementation of the
ICT B-BBEE Sector Code;
• Facilitate the Corporatisation of the Postbank;
• Facilitate and monitor the deployment of Postal Infrastructure; and
• Conduct pro-active and stringent oversight to improve performance and sustainability of SOCs.
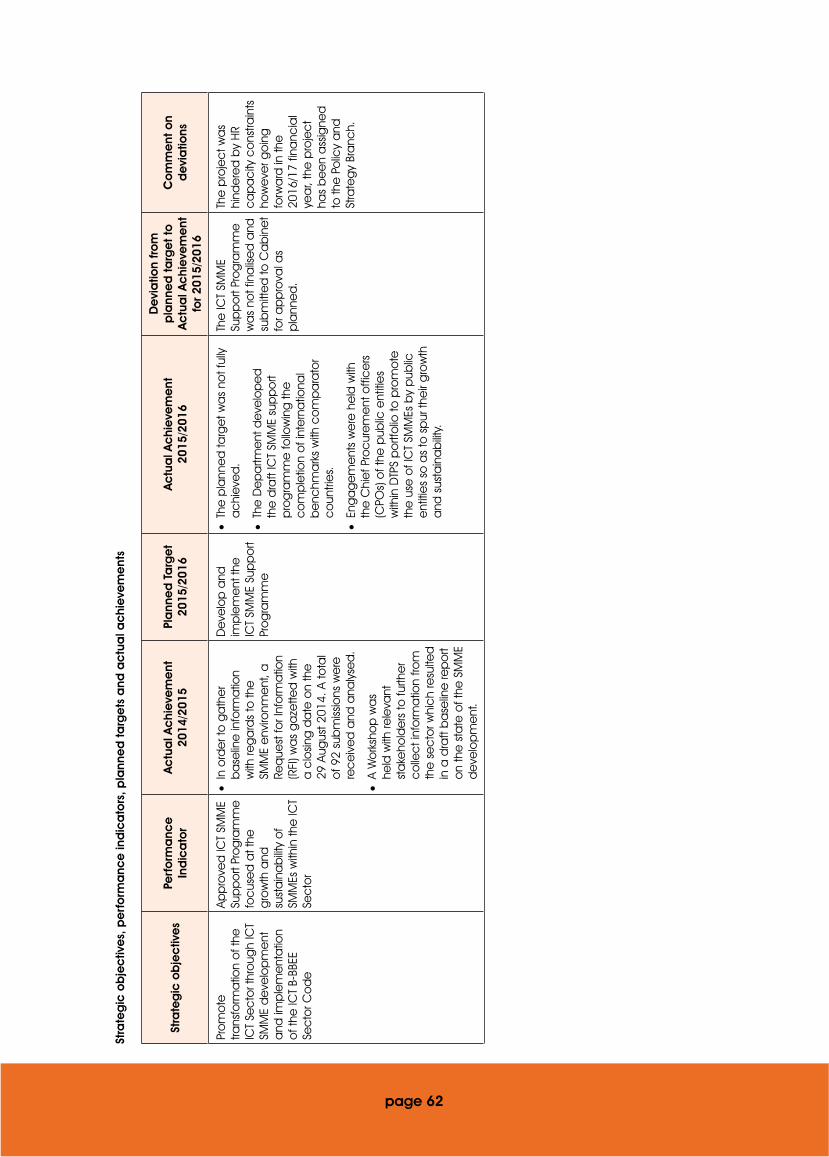
Stra
teg
ic o
bje
ctiv
es,
pe
rfo
rma
nce
ind
ica
tors
, pla
nne
d t
arg
ets
and
ac
tua
l ac
hie
vem
ent
s
Stra
teg
ic o
bje
ctiv
es
Perf
orm
anc
e
Ind
ica
tor
Ac
tua
l Ac
hie
vem
ent
20
14/2
015
Pla
nne
d T
arg
et
2015
/201
6A
ctu
al A
chi
eve
me
nt20
15/2
016
De
via
tion
fro
m
pla
nne
d t
arg
et
to
Ac
tua
l Ac
hie
vem
ent
fo
r 201
5/20
16
Co
mm
ent
on
de
via
tions
Pro
mo
te
trans
form
atio
n o
f the
IC
T Se
cto
r thr
oug
h IC
T SM
ME
de
velo
pm
ent
a
nd im
ple
me
nta
tion
of t
he IC
T B-
BBEE
Se
cto
r Co
de
App
rove
d IC
T SM
ME
Sup
po
rt Pr
og
ram
me
fo
cus
ed
at t
he
gro
wth
and
su
sta
ina
bilit
y o
f SM
MEs
with
in th
e IC
T Se
cto
r
•In
ord
er t
o g
ath
er
ba
selin
e in
form
atio
n w
ith re
ga
rds
to th
e
SMM
E e
nviro
nme
nt, a
Re
que
st fo
r Inf
orm
atio
n (R
FI) w
as
ga
zette
d w
ith
a c
losin
g d
ate
on
the
29
Aug
ust 2
014.
A to
tal
of 9
2 su
bm
issio
ns w
ere
re
ce
ive
d a
nd a
naly
sed
.
•A
Wo
rksh
op
wa
s he
ld w
ith re
leva
nt
sta
keho
lde
rs to
furth
er
co
llec
t inf
orm
atio
n fro
m
the
se
cto
r whi
ch
resu
lted
in
a d
raft
ba
selin
e re
po
rt o
n th
e s
tate
of t
he S
MM
E d
eve
lop
me
nt.
De
velo
p a
nd
imp
lem
ent
the
IC
T SM
ME
Sup
po
rt Pr
og
ram
me
•Th
e p
lann
ed
targ
et w
as
not f
ully
a
chi
eve
d.
•Th
e D
ep
artm
ent
de
velo
pe
d
the
dra
ft IC
T SM
ME
sup
po
rt p
rog
ram
me
follo
win
g th
e
co
mp
letio
n o
f int
ern
atio
nal
be
nchm
ark
s w
ith c
om
pa
rato
r c
oun
trie
s.
•En
ga
ge
me
nts
we
re h
eld
with
th
e C
hie
f Pro
cur
em
ent
offi
ce
rs
(CPO
s) o
f the
pub
lic e
ntiti
es
with
in D
TPS
po
rtfo
lio to
pro
mo
te
the
use
of I
CT
SMM
Es b
y p
ublic
e
ntiti
es
so a
s to
sp
ur th
eir
gro
wth
a
nd s
usta
ina
bilit
y.
The
ICT
SMM
E Su
pp
ort
Pro
gra
mm
e
wa
s no
t fin
alis
ed
and
su
bm
itte
d to
Ca
bin
et
for a
pp
rova
l as
pla
nne
d.
The
pro
jec
t wa
s hi
nde
red
by
HR
ca
pa
city
co
nstra
ints
ho
we
ver g
oin
g
forw
ard
in th
e
2016
/17
fina
ncia
l ye
ar,
the
pro
jec
t ha
s b
ee
n a
ssig
ned
to
the
Po
licy
and
St
rate
gy
Bra
nch.
page 62
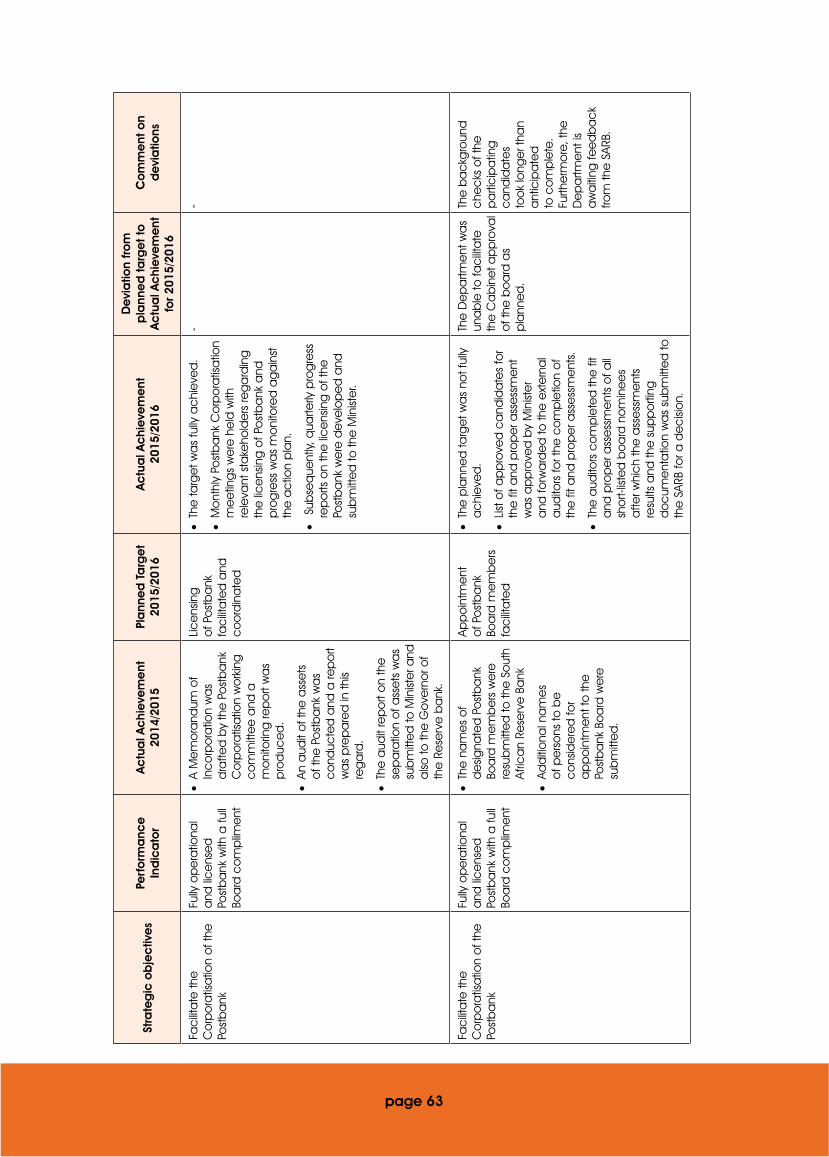
Stra
teg
ic o
bje
ctiv
es
Perf
orm
anc
e
Ind
ica
tor
Ac
tua
l Ac
hie
vem
ent
20
14/2
015
Pla
nne
d T
arg
et
2015
/201
6A
ctu
al A
chi
eve
me
nt20
15/2
016
De
via
tion
fro
m
pla
nne
d t
arg
et
to
Ac
tua
l Ac
hie
vem
ent
fo
r 201
5/20
16
Co
mm
ent
on
de
via
tions
Fac
ilita
te th
e
Co
rpo
ratis
atio
n o
f the
Po
stb
ank
Fully
op
era
tiona
l a
nd li
ce
nse
d
Post
ba
nk w
ith a
full
Boa
rd c
om
plim
ent
•A
Me
mo
rand
um o
f In
co
rpo
ratio
n w
as
dra
fted
by
the
Po
stb
ank
C
orp
ora
tisa
tion
wo
rkin
g
co
mm
itte
e a
nd a
m
oni
torin
g re
po
rt w
as
pro
duc
ed
.
•An
aud
it o
f the
ass
ets
o
f the
Po
stb
ank
wa
s c
ond
ucte
d a
nd a
rep
ort
wa
s p
rep
are
d in
this
reg
ard
.
•Th
e a
udit
rep
ort
on
the
se
pa
ratio
n o
f ass
ets
wa
s su
bm
itte
d to
Min
iste
r and
a
lso to
the
Go
vern
or o
f th
e R
ese
rve
ba
nk.
Lice
nsin
g
of P
ost
ba
nk
fac
ilita
ted
and
c
oo
rdin
ate
d
•Th
e ta
rge
t wa
s fu
lly a
chi
eve
d.
•M
ont
hly
Post
ba
nk C
orp
ora
tisa
tion
me
etin
gs
we
re h
eld
with
re
leva
nt s
take
hold
ers
reg
ard
ing
th
e li
ce
nsin
g o
f Po
stb
ank
and
p
rog
ress
wa
s m
oni
tore
d a
ga
inst
th
e a
ctio
n p
lan.
• S
ubse
que
ntly,
qua
rterly
pro
gre
ss
rep
orts
on
the
lic
ens
ing
of t
he
Post
ba
nk w
ere
de
velo
pe
d a
nd
sub
mitt
ed
to th
e M
inist
er.
--
Fac
ilita
te th
e
Co
rpo
ratis
atio
n o
f the
Po
stb
ank
Fully
op
era
tiona
l a
nd li
ce
nse
d
Post
ba
nk w
ith a
full
Boa
rd c
om
plim
ent
•Th
e n
am
es
of
de
signa
ted
Po
stb
ank
Bo
ard
me
mb
ers
we
re
resu
bm
itte
d to
the
So
uth
Afric
an
Rese
rve
Ba
nk
•Ad
diti
ona
l na
me
s o
f pe
rso
ns to
be
c
ons
ide
red
for
ap
po
intm
ent
to th
e
Post
ba
nk B
oa
rd w
ere
su
bm
itte
d.
App
oin
tme
nt
of P
ost
ba
nk
Boa
rd m
em
be
rs
fac
ilita
ted
•Th
e p
lann
ed
targ
et w
as
not f
ully
a
chi
eve
d.
•Lis
t of a
pp
rove
d c
and
ida
tes
for
the
fit a
nd p
rop
er a
sse
ssm
ent
w
as
ap
pro
ved
by
Min
iste
r a
nd fo
rwa
rde
d to
the
ext
ern
al
aud
itors
for t
he c
om
ple
tion
of
the
fit a
nd p
rop
er a
sse
ssm
ent
s.
•Th
e a
udito
rs c
om
ple
ted
the
fit
and
pro
pe
r ass
ess
me
nts
of a
ll sh
ort-
liste
d b
oa
rd n
om
ine
es
afte
r whi
ch
the
ass
ess
me
nts
resu
lts a
nd th
e s
upp
orti
ng
do
cum
ent
atio
n w
as
sub
mitt
ed
to
the
SAR
B fo
r a d
ec
isio
n.
The
De
pa
rtme
nt w
as
una
ble
to fa
cilit
ate
th
e C
ab
ine
t ap
pro
val
of t
he b
oa
rd a
s p
lann
ed
.
The
ba
ckg
roun
d
che
cks
of t
he
pa
rtic
ipa
ting
c
and
ida
tes
too
k lo
nge
r tha
n a
ntic
ipa
ted
to
co
mp
lete
. Fu
rthe
rmo
re, t
he
De
pa
rtme
nt is
a
wa
iting
fee
db
ac
k fro
m th
e S
ARB.
page 63
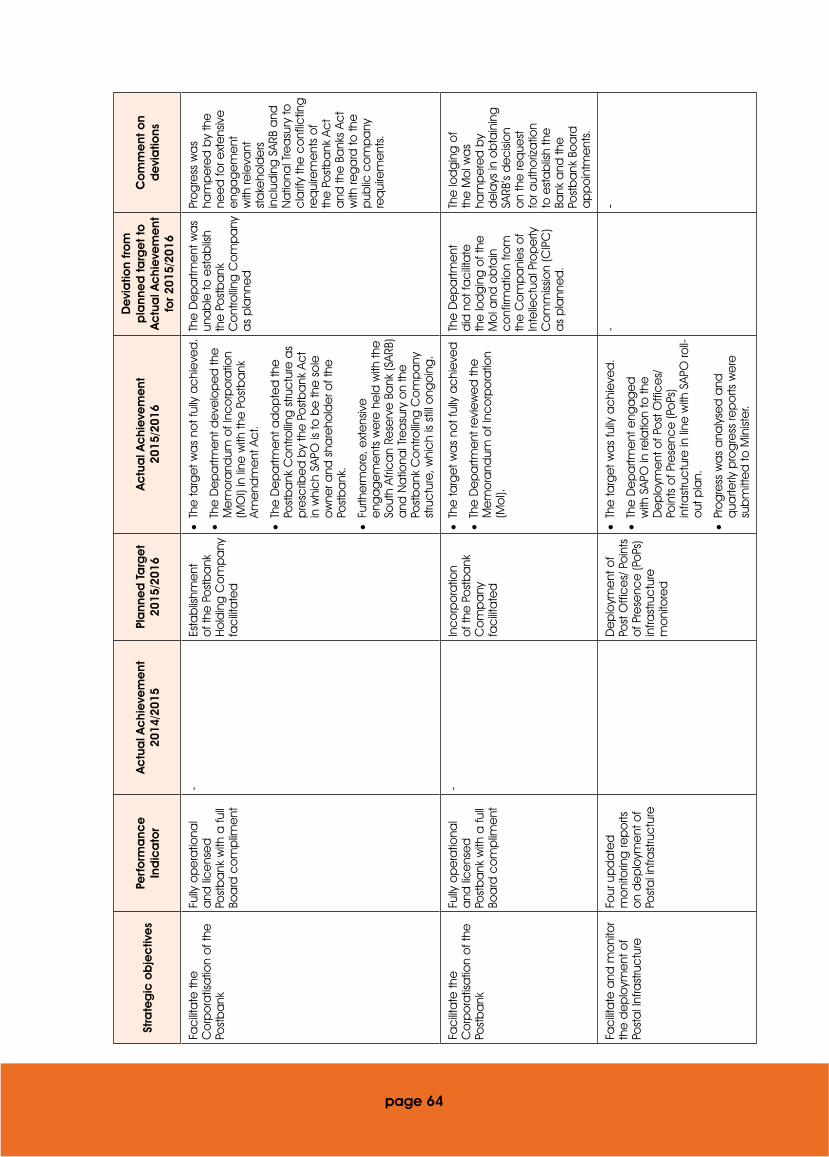
Stra
teg
ic o
bje
ctiv
es
Perf
orm
anc
e
Ind
ica
tor
Ac
tua
l Ac
hie
vem
ent
20
14/2
015
Pla
nne
d T
arg
et
2015
/201
6A
ctu
al A
chi
eve
me
nt20
15/2
016
De
via
tion
fro
m
pla
nne
d t
arg
et
to
Ac
tua
l Ac
hie
vem
ent
fo
r 201
5/20
16
Co
mm
ent
on
de
via
tions
Fac
ilita
te th
e
Co
rpo
ratis
atio
n o
f the
Po
stb
ank
Fully
op
era
tiona
l a
nd li
ce
nse
d
Post
ba
nk w
ith a
full
Boa
rd c
om
plim
ent
-Es
tab
lishm
ent
o
f the
Po
stb
ank
H
old
ing
Co
mp
any
fa
cilit
ate
d
•Th
e ta
rge
t wa
s no
t ful
ly a
chi
eve
d.
•Th
e D
ep
artm
ent
de
velo
pe
d th
e
Me
mo
rand
um o
f Inc
orp
ora
tion
(MO
I) in
line
with
the
Po
stb
ank
Am
end
me
nt A
ct.
•Th
e D
ep
artm
ent
ad
op
ted
the
Po
stb
ank
Co
ntro
lling
stru
ctu
re a
s p
resc
ribe
d b
y th
e P
ost
ba
nk A
ct
in w
hic
h SA
PO is
to b
e th
e s
ole
o
wne
r and
sha
reho
lde
r of t
he
Post
ba
nk.
•Fu
rthe
rmo
re, e
xte
nsiv
e
eng
ag
em
ent
s w
ere
he
ld w
ith th
e
Sout
h Af
rica
n Re
serv
e B
ank
(SAR
B)
and
Na
tiona
l Tre
asu
ry o
n th
e
Post
ba
nk C
ont
rollin
g C
om
pa
ny
stru
ctu
re, w
hic
h is
still
ong
oin
g.
The
De
pa
rtme
nt w
as
una
ble
to e
sta
blis
h th
e P
ost
ba
nk
Co
ntro
lling
Co
mp
any
a
s p
lann
ed
Pro
gre
ss w
as
ham
pe
red
by
the
ne
ed
for e
xte
nsiv
e
eng
ag
em
ent
w
ith re
leva
nt
sta
keho
lde
rs
inc
lud
ing
SAR
B a
nd
Na
tiona
l Tre
asu
ry to
c
larif
y th
e c
onf
lictin
g
req
uire
me
nts
of
the
Po
stb
ank
Ac
t a
nd th
e B
ank
s Ac
t w
ith re
ga
rd to
the
p
ublic
co
mp
any
re
qui
rem
ent
s.
Fac
ilita
te th
e
Co
rpo
ratis
atio
n o
f the
Po
stb
ank
Fully
op
era
tiona
l a
nd li
ce
nse
d
Post
ba
nk w
ith a
full
Boa
rd c
om
plim
ent
-In
co
rpo
ratio
n o
f the
Po
stb
ank
C
om
pa
ny
fac
ilita
ted
•Th
e ta
rge
t wa
s no
t ful
ly a
chi
eve
d
•Th
e D
ep
artm
ent
revi
ew
ed
the
M
em
ora
ndum
of I
nco
rpo
ratio
n (M
oI).
The
De
pa
rtme
nt
did
no
t fa
cilit
ate
th
e lo
dg
ing
of t
he
Mo
I and
ob
tain
c
onf
irma
tion
from
th
e C
om
pa
nie
s o
f In
telle
ctu
al P
rop
erty
C
om
miss
ion
(CIP
C)
as
pla
nne
d.
The
lod
gin
g o
f th
e M
oI w
as
ham
pe
red
by
de
lays
in o
bta
inin
g
SARB
’s d
ec
isio
n o
n th
e re
que
st
for a
utho
riza
tion
to e
sta
blis
h th
e
Bank
and
the
Po
stb
ank
Bo
ard
a
pp
oin
tme
nts.
Fac
ilita
te a
nd m
oni
tor
the
de
plo
yme
nt o
f Po
sta
l Inf
rast
ruc
ture
Four
up
da
ted
m
oni
torin
g re
po
rts
on
de
plo
yme
nt o
f Po
sta
l inf
rast
ruc
ture
De
plo
yme
nt o
f Po
st O
ffic
es/
Po
ints
o
f Pre
senc
e (P
oPs
) in
frast
ruc
ture
m
oni
tore
d
•Th
e ta
rge
t wa
s fu
lly a
chi
eve
d.
•Th
e D
ep
artm
ent
eng
ag
ed
w
ith S
APO
in re
latio
n to
the
D
ep
loym
ent
of P
ost
Offi
ce
s/
Poin
ts o
f Pre
senc
e (P
oPs
) in
frast
ruc
ture
in li
ne w
ith S
APO
roll-
out
pla
n.
•Pr
og
ress
wa
s a
naly
sed
and
q
uarte
rly p
rog
ress
rep
orts
we
re
sub
mitt
ed
to M
inist
er.
--
page 64
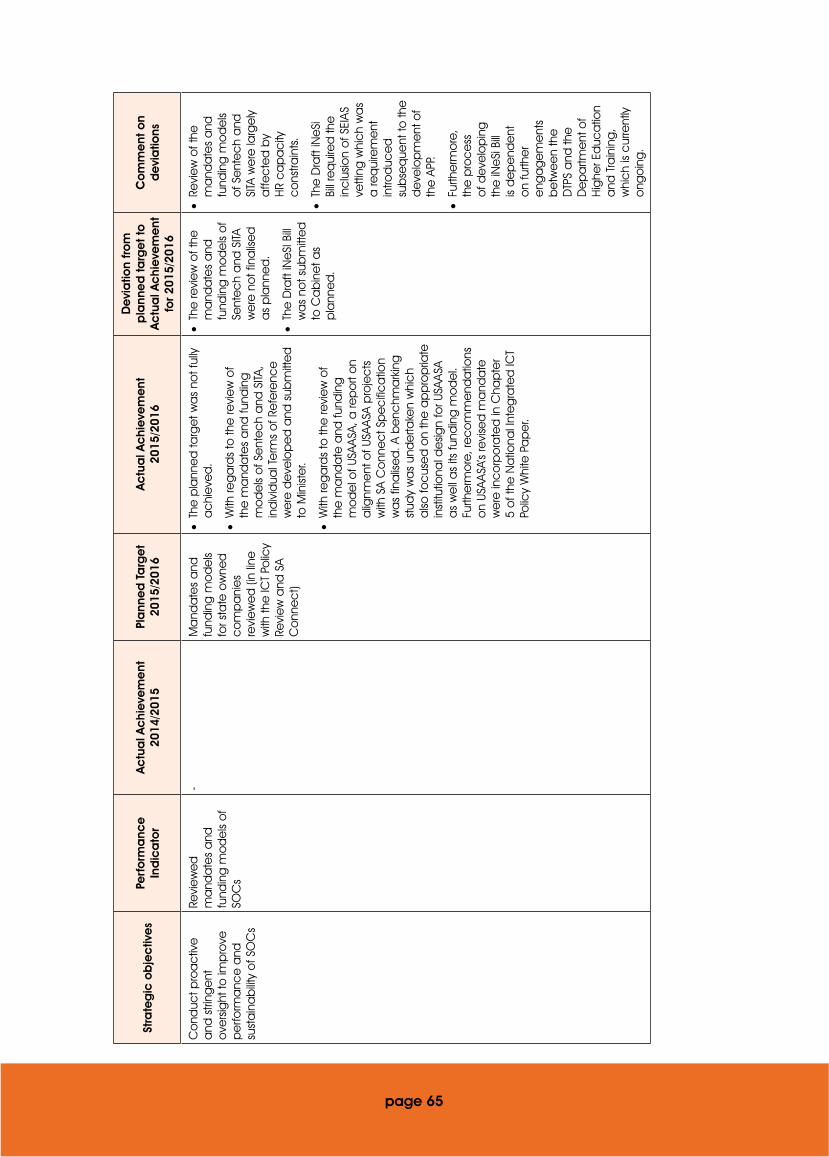
Stra
teg
ic o
bje
ctiv
es
Perf
orm
anc
e
Ind
ica
tor
Ac
tua
l Ac
hie
vem
ent
20
14/2
015
Pla
nne
d T
arg
et
2015
/201
6A
ctu
al A
chi
eve
me
nt20
15/2
016
De
via
tion
fro
m
pla
nne
d t
arg
et
to
Ac
tua
l Ac
hie
vem
ent
fo
r 201
5/20
16
Co
mm
ent
on
de
via
tions
Co
nduc
t pro
ac
tive
a
nd s
tring
ent
o
vers
ight
to im
pro
ve
pe
rform
anc
e a
nd
sust
ain
ab
ility
of S
OC
s
Revi
ew
ed
m
and
ate
s a
nd
fund
ing
mo
de
ls o
f SO
Cs
-M
and
ate
s a
nd
fund
ing
mo
de
ls fo
r sta
te o
wne
d
co
mp
ani
es
revi
ew
ed
(in
line
w
ith th
e IC
T Po
licy
Revi
ew
and
SA
Co
nne
ct)
•Th
e p
lann
ed
targ
et w
as
not f
ully
a
chi
eve
d.
•W
ith re
ga
rds
to th
e re
vie
w o
f th
e m
and
ate
s a
nd fu
ndin
g
mo
de
ls o
f Se
nte
ch
and
SITA
, in
div
idua
l Te
rms
of R
efe
renc
e
we
re d
eve
lop
ed
and
sub
mitt
ed
to
Min
iste
r.
•W
ith re
ga
rds
to th
e re
vie
w o
f th
e m
and
ate
and
fund
ing
m
od
el o
f USA
ASA
, a re
po
rt o
n a
lignm
ent
of U
SAA
SA p
roje
cts
w
ith S
A C
onn
ec
t Sp
ec
ific
atio
n w
as
fina
lise
d. A
be
nchm
ark
ing
st
udy
wa
s un
de
rtake
n w
hic
h a
lso fo
cus
ed
on
the
ap
pro
pria
te
inst
itutio
nal d
esig
n fo
r USA
ASA
a
s w
ell
as
its fu
ndin
g m
od
el.
Furth
erm
ore
, re
co
mm
end
atio
ns
on
USAA
SA’s
revi
sed
ma
nda
te
we
re in
co
rpo
rate
d in
Cha
pte
r 5
of t
he N
atio
nal I
nte
gra
ted
ICT
Polic
y W
hite
Pa
pe
r.
•Th
e re
vie
w o
f the
m
and
ate
s a
nd
fund
ing
mo
de
ls o
f Se
nte
ch
and
SITA
w
ere
no
t fin
alis
ed
a
s p
lann
ed
.
•Th
e D
raft
iNe
SI B
ill w
as
not s
ubm
itte
d
to C
ab
ine
t as
pla
nne
d.
•Re
vie
w o
f the
m
and
ate
s a
nd
fund
ing
mo
de
ls o
f Se
nte
ch
and
SI
TA w
ere
larg
ely
a
ffec
ted
by
HR
ca
pa
city
c
ons
train
ts.
•Th
e D
raft
iNe
Si
Bill
req
uire
d th
e
inc
lusio
n o
f SEI
AS
vetti
ng w
hic
h w
as
a re
qui
rem
ent
in
trod
uce
d
sub
seq
uent
to th
e
de
velo
pm
ent
of
the
APP
.
•Fu
rthe
rmo
re,
the
pro
ce
ss
of d
eve
lop
ing
th
e iN
eSi
Bill
is d
ep
end
ent
o
n fu
rthe
r e
nga
ge
me
nts
be
twe
en
the
D
TPS
and
the
D
ep
artm
ent
of
Hig
her E
duc
atio
n a
nd T
rain
ing
, w
hic
h is
cur
rent
ly
ong
oin
g.
page 65
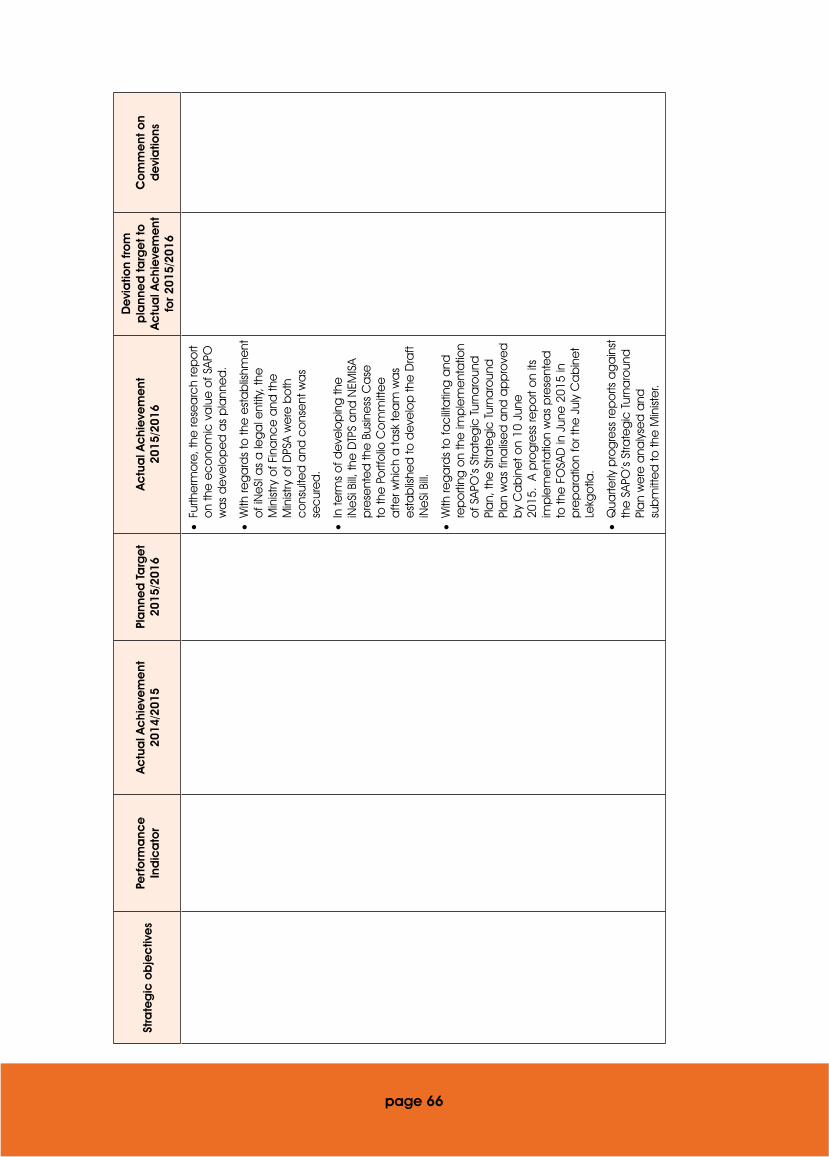
Stra
teg
ic o
bje
ctiv
es
Perf
orm
anc
e
Ind
ica
tor
Ac
tua
l Ac
hie
vem
ent
20
14/2
015
Pla
nne
d T
arg
et
2015
/201
6A
ctu
al A
chi
eve
me
nt20
15/2
016
De
via
tion
fro
m
pla
nne
d t
arg
et
to
Ac
tua
l Ac
hie
vem
ent
fo
r 201
5/20
16
Co
mm
ent
on
de
via
tions
•Fu
rthe
rmo
re, t
he re
sea
rch
rep
ort
on
the
ec
ono
mic
va
lue
of S
APO
w
as
de
velo
pe
d a
s p
lann
ed
.
•W
ith re
ga
rds
to th
e e
sta
blis
hme
nt
of i
Ne
SI a
s a
leg
al e
ntity
, the
M
inist
ry o
f Fin
anc
e a
nd th
e
Min
istry
of D
PSA
we
re b
oth
c
ons
ulte
d a
nd c
ons
ent
wa
s se
cur
ed
.
•In
term
s o
f de
velo
pin
g th
e
iNe
Si B
ill, th
e D
TPS
and
NEM
ISA
pre
sent
ed
the
Bus
ine
ss C
ase
to
the
Po
rtfo
lio C
om
mitt
ee
a
fter w
hic
h a
task
tea
m w
as
est
ab
lishe
d to
de
velo
p th
e D
raft
iNe
Si B
ill.
•W
ith re
ga
rds
to fa
cilit
atin
g a
nd
rep
orti
ng o
n th
e im
ple
me
nta
tion
of S
APO
’s St
rate
gic
Tur
naro
und
Pl
an,
the
Stra
teg
ic T
urna
roun
d
Pla
n w
as
fina
lise
d a
nd a
pp
rove
d
by
Ca
bin
et o
n 10
Jun
e
2015
. A
pro
gre
ss re
po
rt o
n its
im
ple
me
nta
tion
wa
s p
rese
nte
d
to th
e F
OSA
D in
Jun
e 2
015
in
pre
pa
ratio
n fo
r the
Jul
y C
ab
ine
t Le
kgo
tla.
•Q
uarte
rly p
rog
ress
rep
orts
ag
ain
st
the
SAP
O’s
Stra
teg
ic T
urna
roun
d
Pla
n w
ere
ana
lyse
d a
nd
sub
mitt
ed
to th
e M
inist
er.
page 66

Stra
teg
ic o
bje
ctiv
es
Perf
orm
anc
e
Ind
ica
tor
Ac
tua
l Ac
hie
vem
ent
20
14/2
015
Pla
nne
d T
arg
et
2015
/201
6A
ctu
al A
chi
eve
me
nt20
15/2
016
De
via
tion
fro
m
pla
nne
d t
arg
et
to
Ac
tua
l Ac
hie
vem
ent
fo
r 201
5/20
16
Co
mm
ent
on
de
via
tions
Co
nduc
t pro
-a
ctiv
e a
nd s
tring
ent
o
vers
ight
to im
pro
ve
pe
rform
anc
e a
nd
sust
ain
ab
ility
of S
OC
s
App
rove
d o
vers
ight
m
od
els
tha
t p
rom
ote
pro
ac
tive
a
nd s
tring
ent
o
vers
ight
Ove
rsig
ht
mo
de
l fo
r the
st
ate
ow
ned
c
om
pa
nie
s d
eve
lop
ed
and
a
pp
rove
d
The
targ
et w
as
fully
ac
hie
ved
.Th
e O
vers
ight
mo
de
l fo
r the
sta
te
ow
ned
co
mp
ani
es
wa
s d
eve
lop
ed
a
nd a
pp
rove
d fo
r im
ple
me
nta
tion.
No
ne
No
ne
page 67

Strategy to overcome areas of under-performance
The Department does acknowledge its areas of under-performance with regards to specific targets for
which project specific reasons have been provided under “comment on deviation”, where applicable. The
HR capacity constraint experienced with the ICT SMME Support Programme has been resolved through the
transfer of the project to the ICT Policy and Strategy Branch.
The achievement of targets related to the Postbank were largely related to dependency on external
stakeholders which was not in the direct control of the Department. Extensive stakeholder engagements
are underway to ensure that existing commitments are realised however, going forward, such external
dependencies have been taken into consideration during the planning phase.
Changes to planned targets
There were no changes to the planned targets during the reporting period.
Linking performance with budgets
The increase in compensation of employees is attributed to the filling of critical vacant positions. There is
a decline of R268.7 million under transfer payments to Independent Communications Authority of South
Africa (ICASA) and the South African Broadcasting Corporation that were shifted to the Department of
Communications. The goods and services expenditure amounted to R4 million in the current year as
opposed to R35 million in the 2014/15 financial year. This was mainly due to the decline in the costs
incurred for the funeral of the former President Nelson Mandela.
Sub-programme expenditure
Sub- Programme Name
2015/2016 2014/2015
Final Appro-priation
ActualExpenditure
(Over)/Under Expenditure
Final Appropriation
ActualExpenditure
(Over)/Under Expenditure
R’000 R’000 R’000 R’000 R’000 R’000
Public Entity Oversight 481 355 480 088 1 267 778 524 777 703 821
Small, Medium And Micro Enterprise Development 2 545 2 545 - 2 077 2 077 -
ICT Support 6 331 6 326 5 6 001 6 001 -
Total 490 231 488 959 1 272 786 602 785 781 821
page 68

4.5 Programme 5: ICT Infrastructure Support
The purpose of Programme 5 is to promote investment in robust, reliable, secure and affordable ICT
infrastructure that supports the provision of a multiplicity of applications and services.
The ICT Infrastructure Support Programme consists of the following sub-programmes:
• Broadband is responsible for developing and facilitating the implementation of the ICT infrastructure
broadband strategy and implementation plan, and ensures that broadband goals are achieved; and
• Digital Terrestrial Television is responsible for making transfers to Sentech to roll out ICT infrastructure for
the migration of signal distribution from analogue to digital.
The Strategic Objectives for the 2015/16 Financial Year are listed below:
• Implement the Digital Development and Digital Future Programmes in line with SA Connect;
• Establish Cyber Security institutional capacity; and
• Create an effective National Spectrum Framework to ensure citizens realize socio-economic benefits
from the use of spectrum.
page 69
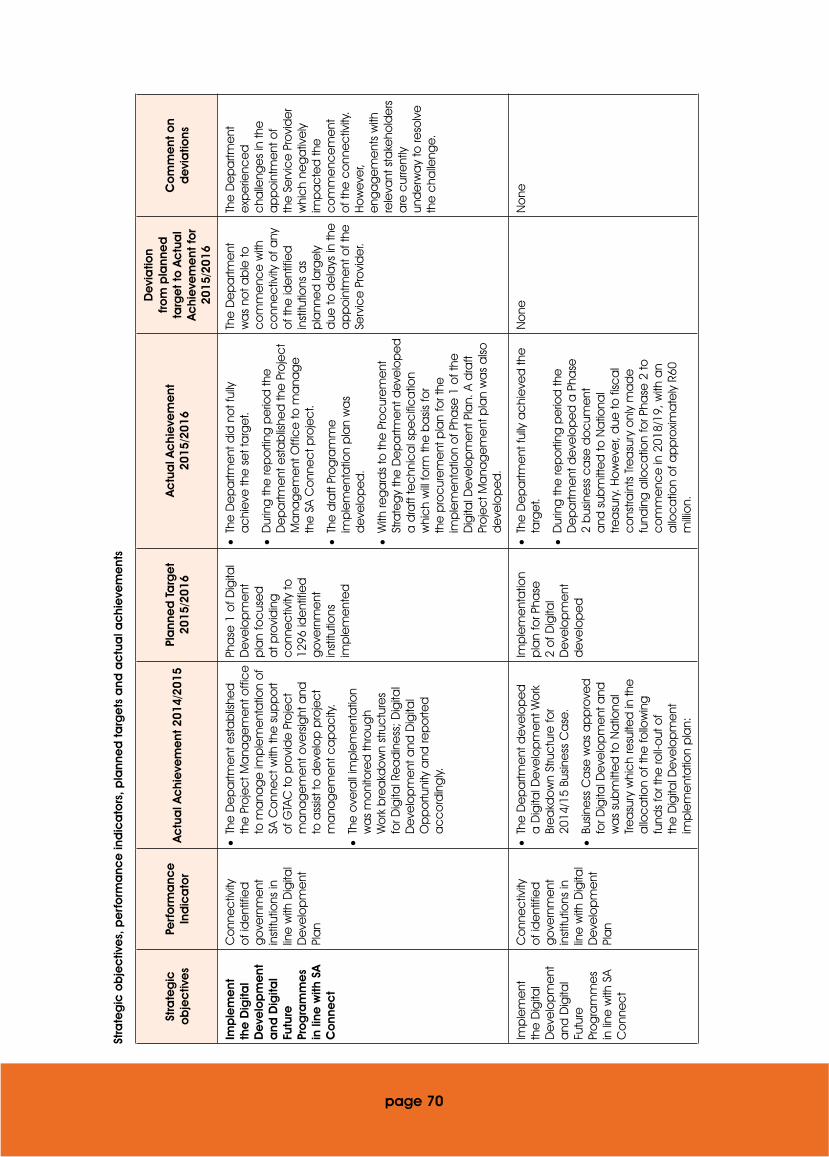
Stra
teg
ic o
bje
ctiv
es,
pe
rfo
rma
nce
ind
ica
tors
, pla
nne
d t
arg
ets
and
ac
tua
l ac
hie
vem
ent
s
Stra
teg
ic
ob
jec
tive
sPe
rfo
rma
nce
In
dic
ato
rA
ctu
al A
chi
eve
me
nt 2
014/
2015
Pla
nne
d T
arg
et
2015
/201
6A
ctu
al A
chi
eve
me
nt20
15/2
016
De
via
tion
fro
m p
lann
ed
ta
rge
t to
Ac
tua
l A
chi
eve
me
nt fo
r 20
15/2
016
Co
mm
ent
on
de
via
tions
Imp
lem
ent
th
e D
igita
l D
eve
lop
me
nt
and
Dig
ital
Futu
re
Pro
gra
mm
es
in li
ne w
ith S
A
Co
nne
ct
Co
nne
ctiv
ity
of i
de
ntifi
ed
g
ove
rnm
ent
in
stitu
tions
in
line
with
Dig
ital
De
velo
pm
ent
Pl
an
•Th
e D
ep
artm
ent
est
ab
lishe
d
the
Pro
jec
t Ma
nag
em
ent
offi
ce
to
ma
nag
e im
ple
me
nta
tion
of
SA C
onn
ec
t with
the
sup
po
rt o
f GTA
C to
pro
vid
e P
roje
ct
ma
nag
em
ent
ove
rsig
ht a
nd
to a
ssist
to d
eve
lop
pro
jec
t m
ana
ge
me
nt c
ap
ac
ity.
•Th
e o
vera
ll im
ple
me
nta
tion
wa
s m
oni
tore
d th
roug
h W
ork
bre
akd
ow
n st
ruc
ture
s fo
r Dig
ital R
ea
din
ess
; Dig
ital
De
velo
pm
ent
and
Dig
ital
Op
po
rtuni
ty a
nd re
po
rted
a
cc
ord
ing
ly.
Pha
se 1
of D
igita
l D
eve
lop
me
nt
pla
n fo
cus
ed
a
t pro
vid
ing
c
onn
ec
tivity
to
1296
ide
ntifi
ed
g
ove
rnm
ent
in
stitu
tions
im
ple
me
nte
d
•Th
e D
ep
artm
ent
did
no
t ful
ly
ac
hie
ve th
e s
et t
arg
et.
•D
urin
g th
e re
po
rting
pe
riod
the
D
ep
artm
ent
est
ab
lishe
d th
e P
roje
ct
Ma
nag
em
ent
Offi
ce
to m
ana
ge
th
e S
A C
onn
ec
t pro
jec
t.
•Th
e d
raft
Pro
gra
mm
e
imp
lem
ent
atio
n p
lan
wa
s d
eve
lop
ed
.
•W
ith re
ga
rds
to th
e P
roc
ure
me
nt
Stra
teg
y th
e D
ep
artm
ent
de
velo
pe
d
a d
raft
tec
hnic
al s
pe
cifi
ca
tion
whi
ch
will
form
the
ba
sis fo
r th
e p
roc
ure
me
nt p
lan
for t
he
imp
lem
ent
atio
n o
f Pha
se 1
of t
he
Dig
ital D
eve
lop
me
nt P
lan.
A d
raft
Pro
jec
t Ma
nag
em
ent
pla
n w
as
also
d
eve
lop
ed
.
The
De
pa
rtme
nt
wa
s no
t ab
le to
c
om
me
nce
with
c
onn
ec
tivity
of a
ny
of t
he id
ent
ifie
d
inst
itutio
ns a
s p
lann
ed
larg
ely
d
ue to
de
lays
in th
e
ap
po
intm
ent
of t
he
Serv
ice
Pro
vid
er.
The
De
pa
rtme
nt
exp
erie
nce
d
cha
lleng
es
in th
e
ap
po
intm
ent
of
the
Se
rvic
e P
rovi
de
r w
hic
h ne
ga
tive
ly
imp
ac
ted
the
c
om
me
nce
me
nt
of t
he c
onn
ec
tivity
. H
ow
eve
r, e
nga
ge
me
nts
with
re
leva
nt s
take
hold
ers
a
re c
urre
ntly
un
de
rwa
y to
reso
lve
th
e c
halle
nge.
Imp
lem
ent
th
e D
igita
l D
eve
lop
me
nt
and
Dig
ital
Futu
re
Pro
gra
mm
es
in li
ne w
ith S
A C
onn
ec
t
Co
nne
ctiv
ity
of i
de
ntifi
ed
g
ove
rnm
ent
in
stitu
tions
in
line
with
Dig
ital
De
velo
pm
ent
Pl
an
•Th
e D
ep
artm
ent
de
velo
pe
d
a D
igita
l De
velo
pm
ent
Wo
rk
Bre
akd
ow
n St
ruc
ture
for
2014
/15
Busin
ess
Ca
se.
•Bu
sine
ss C
ase
wa
s a
pp
rove
d
for D
igita
l De
velo
pm
ent
and
w
as
sub
mitt
ed
to N
atio
nal
Trea
sury
whi
ch
resu
lted
in th
e
allo
ca
tion
of t
he fo
llow
ing
fu
nds
for t
he ro
ll-o
ut o
f th
e D
igita
l De
velo
pm
ent
im
ple
me
nta
tion
pla
n:
Imp
lem
ent
atio
n p
lan
for P
hase
2
of D
igita
l D
eve
lop
me
nt
de
velo
pe
d
•Th
e D
ep
artm
ent
fully
ac
hie
ved
the
ta
rge
t.
•D
urin
g th
e re
po
rting
pe
riod
the
D
ep
artm
ent
de
velo
pe
d a
Pha
se
2 b
usin
ess
ca
se d
oc
ume
nt
and
sub
mitt
ed
to N
atio
nal
trea
sury
. Ho
we
ver,
due
to fi
sca
l c
ons
train
ts T
rea
sury
onl
y m
ad
e
fund
ing
allo
ca
tion
for P
hase
2 to
c
om
me
nce
in 2
018/
19, w
ith a
n a
lloc
atio
n o
f ap
pro
xima
tely
R60
m
illio
n.
No
ne
No
ne
page 70

Stra
teg
ic
ob
jec
tive
sPe
rfo
rma
nce
In
dic
ato
rA
ctu
al A
chi
eve
me
nt 2
014/
2015
Pla
nne
d T
arg
et
2015
/201
6A
ctu
al A
chi
eve
me
nt20
15/2
016
De
via
tion
fro
m p
lann
ed
ta
rge
t to
Ac
tua
l A
chi
eve
me
nt fo
r 20
15/2
016
Co
mm
ent
on
de
via
tions
– R
200
mil
(201
5/16
)
– R
268
mil
(201
6/17
)
– R
271
mil
(201
7/18
)
•An
imp
lem
ent
atio
n p
lan
for p
hase
2
of D
igita
l De
velo
pm
ent
wa
s d
eve
lop
ed
in li
ne w
ith fu
ndin
g
allo
ca
ted
.
Imp
lem
ent
th
e D
igita
l D
eve
lop
me
nt
and
Dig
ital
Futu
re
Pro
gra
mm
es
in li
ne w
ith S
A
Co
nne
ct
App
rove
d
roa
dm
ap
fo
cus
ed
on
imp
lem
ent
atio
n o
f Dig
ital F
utur
e
Stra
teg
y in
lin
e w
ith O
pe
n Ac
ce
ss N
etw
ork
•Th
e D
igita
l Fut
ure
im
ple
me
nta
tion
wa
s d
eve
lop
ed
and
ap
pro
ved
. W
ith re
ga
rds
to th
e fe
asib
ility
stud
y o
n W
hole
sale
Op
en
Acc
ess
Ne
two
rk, t
he
De
pa
rtme
nt u
nde
rtoo
k a
M
ark
et S
truc
ture
Stu
dy.
•Th
e D
ep
artm
ent
de
velo
pe
d
thre
e re
po
rts o
n th
e fr
am
ew
ork
fo
r Ma
rke
t Stru
ctu
re a
nd O
pe
n Ac
ce
ss M
od
els
inc
lud
ing
re
leva
nt re
co
mm
end
atio
ns.
Roa
dm
ap
for t
he
est
ab
lishm
ent
of
a w
hole
sale
op
en
ac
ce
ss n
etw
ork
d
eve
lop
ed
•Th
e D
ep
artm
ent
fully
ac
hie
ved
the
ta
rge
t.
•D
urin
g th
e re
po
rting
pe
riod
th
e S
oC
s w
ere
req
uest
ed
to
eva
lua
te th
eir
ass
ets
va
lue
to
info
rm th
e ra
tiona
lisa
tion
pro
ce
ss
and
eng
ag
em
ent
s a
s p
art
of
ratio
nalis
atio
n.
•A
Who
lesa
le O
pe
n Ac
ce
ss
fram
ew
ork
wa
s d
eve
lop
ed
whi
ch
wa
s in
co
rpo
rate
d in
the
Op
en
Acc
ess
Cha
pte
r (C
hap
ter 8
) of t
he
Na
tiona
l Int
eg
rate
d IC
T Po
licy
Whi
te
Pap
er.
•Th
e N
atio
nal I
nte
gra
ted
ICT
Polic
y W
hite
Pa
pe
r wa
s a
pp
rove
d b
y th
e
Min
iste
r fo
r ta
blin
g a
t Ca
bin
et (
ESEI
D
Ca
bin
et C
om
mitt
ee
).
•Su
bse
que
nt to
the
tab
ling
, the
Whi
te
Pap
er w
as
de
ferre
d fo
r ad
diti
ona
l in
put
and
will
be
re-s
ubm
itte
d to
C
ab
ine
t in
the
firs
t qua
rter o
f the
20
16/1
7 fin
anc
ial y
ea
r.
No
neN
one
page 71

Stra
teg
ic
ob
jec
tive
sPe
rfo
rma
nce
In
dic
ato
rA
ctu
al A
chi
eve
me
nt 2
014/
2015
Pla
nne
d T
arg
et
2015
/201
6A
ctu
al A
chi
eve
me
nt20
15/2
016
De
via
tion
fro
m p
lann
ed
ta
rge
t to
Ac
tua
l A
chi
eve
me
nt fo
r 20
15/2
016
Co
mm
ent
on
de
via
tions
Imp
lem
ent
th
e D
igita
l D
eve
lop
me
nt
and
Dig
ital
Futu
re
Pro
gra
mm
es
in li
ne w
ith S
A C
onn
ec
t
App
rove
d p
olic
y d
irec
tion
on
spe
ctru
m fo
r b
roa
db
and
-Po
licy
dire
ctio
n o
n sp
ec
trum
fo
r bro
ad
ba
nd
de
velo
pe
d
•Th
e D
ep
artm
ent
fully
ac
hie
ved
the
p
lann
ed
targ
et.
•Th
e D
raft
Polic
y D
irec
tion
on
Spe
ctru
m fo
r Bro
ad
ba
nd w
as
de
velo
pe
d in
the
firs
t qua
rter o
f the
re
po
rting
pe
riod
.
•Th
e P
olic
y re
co
mm
end
atio
ns w
ere
in
clu
de
d in
the
Op
en
Acc
ess
C
hap
ter (
Cha
pte
r 8) o
f the
Na
tiona
l In
teg
rate
d IC
T Po
licy
Whi
te P
ap
er.
•Th
e N
atio
nal I
nte
gra
ted
ICT
Polic
y W
hite
Pa
pe
r wa
s a
pp
rove
d b
y th
e
Min
iste
r fo
r ta
blin
g a
t Ca
bin
et (
ESEI
D
Ca
bin
et C
om
mitt
ee
).
•Su
bse
que
nt to
the
tab
ling
, the
Whi
te
Pap
er w
as
de
ferre
d fo
r ad
diti
ona
l in
put
and
will
be
re-s
ubm
itte
d to
C
ab
ine
t in
the
firs
t qua
rter o
f the
20
16/1
7 fin
anc
ial y
ea
r.
Esta
blis
h C
ybe
r Se
cur
ity
inst
itutio
nal
ca
pa
city
Op
era
tiona
l c
ybe
r se
cur
ity
hub
tha
t p
rovi
de
s a
b
ouq
uet o
f re
qui
red
se
rvic
es
•Th
e D
ep
artm
ent
in c
onj
unc
tion
with
CSI
R ha
s c
om
ple
ted
th
e d
eve
lop
me
nt o
f IC
T In
frast
ruc
ture
and
sys
tem
s fo
r th
e V
irtua
l Cyb
ers
ec
urity
Hub
.
Virtu
al
Cyb
ers
ec
urity
Hub
e
sta
blis
hed
and
o
pe
ratio
nalis
ed
in
sup
po
rt o
f a s
ec
ure
c
ybe
rsp
ac
e in
the
in
tere
st o
f citi
zens
, p
riva
te a
nd p
ublic
se
cto
rs
•Th
e D
ep
artm
ent
fully
ac
hie
ved
the
se
t ta
rge
t.
•Th
e V
irtua
l Cyb
ers
ec
urity
Hub
ICT
Infra
stru
ctu
re w
as
rec
onf
igur
ed
, ha
rde
ned
and
rele
vant
sta
keho
lde
rs
co
nsul
ted
.
•Th
e D
ep
artm
ent
co
mm
issio
ned
and
la
unc
hed
the
virt
ual c
ybe
rse
cur
ity
on
30 O
cto
be
r 201
6, w
hic
h is
fully
o
pe
ratio
nal.
No
neN
one
page 72

Stra
teg
ic
ob
jec
tive
sPe
rfo
rma
nce
In
dic
ato
rA
ctu
al A
chi
eve
me
nt 2
014/
2015
Pla
nne
d T
arg
et
2015
/201
6A
ctu
al A
chi
eve
me
nt20
15/2
016
De
via
tion
fro
m p
lann
ed
ta
rge
t to
Ac
tua
l A
chi
eve
me
nt fo
r 20
15/2
016
Co
mm
ent
on
de
via
tions
•Th
e fr
am
ew
ork
to s
upp
ort
me
mb
ers
hip
to th
e fo
rum
of
Inc
ide
nt R
esp
ons
e S
ec
urity
Te
am
s w
as
de
velo
pe
d. I
n a
dd
itio
n a
n a
dd
end
um to
the
M
OA
has
also
be
en
signe
d w
ith
CSI
R a
nd fu
nds
trans
ferre
d fo
r th
e e
sta
blis
hme
nt o
f the
Virt
ual
Cyb
ers
ec
urity
Hub
.
•O
pe
ratio
ns o
f Virt
ual C
ybe
rse
cur
ity
Hub
are
ma
nag
ed
and
mo
nito
ring
o
f the
Cyb
ers
ec
urity
Hub
op
era
tions
w
ere
dul
y c
ond
ucte
d a
nd q
uarte
rly
rep
orts
de
velo
pe
d.
•W
ith re
ga
rds
to fa
cilit
atio
n o
f th
e d
eve
lop
me
nt o
f SO
C’s
Cyb
ers
ec
urity
stra
teg
ies,
the
D
ep
artm
ent
ha
s d
eve
lop
ed
a
Fra
me
wo
rk o
f Eng
ag
em
ent
with
SO
C’s.
•Im
ple
me
nta
tion
of S
OC
C
ybe
rse
cur
ity s
trate
gie
s ha
s b
ee
n m
oni
tore
d th
roug
h a
sur
vey
tha
t w
as
co
nduc
ted
to e
sta
blis
h w
hic
h e
ntiti
es
have
stra
teg
ies
as
we
ll a
s th
e e
xte
nt o
f im
ple
me
nta
tion
of t
he
exis
ting
stra
teg
ies.
•Fu
rthe
rmo
re, S
ITA h
as
de
velo
pe
d
the
ir d
raft
Cyb
ers
ec
urity
Stra
teg
y.
Esta
blis
h C
ybe
r Se
cur
ity
inst
itutio
nal
ca
pa
city
Cyb
ers
ec
urity
a
wa
rene
ss
pla
n fo
cus
ed
o
n ra
ising
a
wa
rene
ss w
ithin
c
ybe
r sp
ac
e
-C
ybe
rse
cur
ity
Awa
rene
ss
imp
lem
ent
atio
n p
lan
ap
pro
ved
and
im
ple
me
nta
tion
co
mm
enc
ed
•Th
e s
et t
arg
et w
as
fully
ac
hie
ved
.
•D
urin
g th
e re
po
rting
pe
riod
th
e D
ep
artm
ent
de
velo
pe
d
and
ob
tain
ed
ap
pro
val o
f th
e C
ybe
rse
cur
ity A
wa
rene
ss
Imp
lem
ent
atio
n Pl
an
and
Me
dia
St
rate
gy
and
co
mm
enc
ed
with
its
imp
lem
ent
atio
n th
roug
h va
rious
in
itia
tive
s.
No
neN
one
page 73

Stra
teg
ic
ob
jec
tive
sPe
rfo
rma
nce
In
dic
ato
rA
ctu
al A
chi
eve
me
nt 2
014/
2015
Pla
nne
d T
arg
et
2015
/201
6A
ctu
al A
chi
eve
me
nt20
15/2
016
De
via
tion
fro
m p
lann
ed
ta
rge
t to
Ac
tua
l A
chi
eve
me
nt fo
r 20
15/2
016
Co
mm
ent
on
de
via
tions
•C
ybe
rse
cur
ity a
wa
rene
ss
pro
gra
mm
e lo
go
s w
ere
de
velo
pe
d
and
ap
pro
ved
; as
we
ll a
s m
ark
etin
g
bo
okle
ts d
eve
lop
ed
.
•D
urin
g th
e la
unc
h o
f the
C
ybe
rse
cur
ity h
ub, t
here
wa
s e
lec
troni
c a
nd p
rint m
ed
ia
co
vera
ge.
•Fu
rthe
rmo
re a
Pub
lic A
wa
rene
ss
ca
mp
aig
n b
y D
ep
uty
Min
iste
r wa
s ho
ste
d.
•In
pa
rtne
rshi
p w
ith M
ob
ine
t, ro
ad
sh
ow
s w
ere
und
erta
ken
in L
imp
op
o,
No
rth W
est
, Mp
uma
lang
a a
nd
We
ste
rn C
ap
e w
here
am
ong
st
oth
ers
ge
nera
l cyb
ers
ec
urity
a
wa
rene
ss w
as
pre
sent
ed
.
•Th
e D
ep
artm
ent
pa
rtic
ipa
ted
in th
e
Cyb
ers
ec
urity
foru
m a
nd q
uarte
rly
pro
gre
ss re
po
rts w
ere
de
velo
pe
d.
Esta
blis
h C
ybe
r Se
cur
ity
inst
itutio
nal
ca
pa
city
App
rove
d
Inte
rne
t Stra
teg
y a
ime
d a
t in
cre
asin
g
soc
ioe
co
nom
ic
gro
wth
•Th
e in
tern
et S
trate
gy
wa
s im
ple
me
nte
d th
roug
h th
e
scho
ol c
onn
ec
tivity
pro
jec
t th
at i
s b
ein
g u
nde
rtake
n b
y D
ep
artm
ent
as
pa
rt o
f SA
Co
nne
ct.
Inte
rne
t stra
teg
y d
eve
lop
ed
a
nd s
ubm
itte
d
to C
ab
ine
t fo
r a
pp
rova
l
•Th
e D
ep
artm
ent
fully
ac
hie
ved
the
ta
rge
t.
•D
urin
g th
e re
po
rting
pe
riod
the
D
ep
artm
ent
de
velo
pe
d th
e In
tern
et
Stra
teg
y a
nd p
rese
nte
d it
to M
inist
er.
•Ba
sed
on
co
nsul
tatio
n w
ith
Min
iste
r, th
e In
tern
et s
trate
gy
wa
s re
vie
we
d a
nd c
ons
ulte
d w
ith
crit
ica
l sta
keho
lde
rs, i
nclu
din
g th
e
Cyb
ers
ec
urity
Re
spo
nse
Co
mm
itte
e.
No
neN
one
page 74

Stra
teg
ic
ob
jec
tive
sPe
rfo
rma
nce
In
dic
ato
rA
ctu
al A
chi
eve
me
nt 2
014/
2015
Pla
nne
d T
arg
et
2015
/201
6A
ctu
al A
chi
eve
me
nt20
15/2
016
De
via
tion
fro
m p
lann
ed
ta
rge
t to
Ac
tua
l A
chi
eve
me
nt fo
r 20
15/2
016
Co
mm
ent
on
de
via
tions
•Th
e In
tern
et S
trate
gy
wa
s in
co
rpo
rate
d in
the
Na
tiona
l In
teg
rate
d IC
T Po
licy
Whi
te P
ap
er.
•Th
e N
atio
nal I
nte
gra
ted
ICT
Polic
y W
hite
Pa
pe
r wa
s a
pp
rove
d b
y th
e
Min
iste
r fo
r ta
blin
g a
t Ca
bin
et (
ESEI
D
Ca
bin
et C
om
mitt
ee
).
•Su
bse
que
nt to
the
tab
ling
, the
Whi
te
Pap
er w
as
de
ferre
d fo
r ad
diti
ona
l in
put
and
will
be
re-s
ubm
itte
d to
C
ab
ine
t in
the
firs
t qua
rter o
f the
20
16/1
7 fin
anc
ial y
ea
r.
Cre
ate
an
effe
ctiv
e
natio
nal
spe
ctr
um
fra
me
wo
rk t
o
ens
ure
citi
zens
re
aliz
e s
oc
io-
ec
ono
mic
b
ene
fits
fro
m
the
use
of
spe
ctr
um
Parti
cip
atio
n p
lan
and
fra
me
wo
rk
for W
RC
tha
t ens
ure
s st
ruc
ture
d
pre
pa
ratio
n a
nd
imp
lem
ent
atio
n o
f WRC
o
utc
om
es
-SA
Po
sitio
ns a
nd
pro
po
sals
for
WRC
-15
ag
end
a
item
s fin
alis
ed
and
a
pp
rove
d in
line
w
ith p
arti
cip
atio
n p
lan
and
fra
me
wo
rk
•Th
e D
ep
artm
ent
fully
ac
hie
ved
the
se
t ta
rge
t.
•D
urin
g th
e p
erio
d u
nde
r re
vie
w th
e
De
pa
rtme
nt d
eve
lop
ed
dra
ft SA
Po
sitio
ns w
hic
h w
ere
be
nch-
ma
rke
d
with
SAD
C p
osit
ions
.
•Th
e S
A p
osit
ion
and
pro
po
sals
we
re
sub
mitt
ed
to C
ab
ine
t.
•Th
e d
raft
Co
nfe
renc
e o
utc
om
es
rep
ort
wa
s d
eve
lop
ed
follo
win
g
pa
rtic
ipa
tion
at W
RC-1
5.
•Fi
nal c
onf
ere
nce
rep
ort
to in
form
im
ple
me
nta
tion
of t
he re
leva
nt
out
co
me
s o
f WRC
-15
wa
s d
eve
lop
ed
and
issu
ed
to IC
ASA
.
No
neN
one
page 75

Strategy to overcome areas of under-performance
The Department does acknowledge its areas of under-performance with regards to specific targets for
which project specific reasons have been provided under “comment on deviation”, where applicable.
With regards to appointing the broadband connectivity service provider, engagements with relevant
stakeholders are currently underway to resolve the challenge as well as all alternative options are being
explored so as to ensure that going forward, connectivity is rolled out in line with the implementation plan.
Changes to planned targets
There were no changes to the planned targets during the reporting period.
Linking performance with budgets
There was a decline in compensation of employees due to resignations and vacant positions not being
filled. Under goods and services consultants increased from R35 million to R59.8 million. The under
spending in the Digital Terrestrial Television Sub Programme is due to ICASA and The SABC reporting to the
new Department of Communications as a result of function shift. The budgets of the said entities where
transferred to the Department of Communications.
Sub-programme expenditure
Sub- Programme Name
2015/2016 2014/2015
Final Appropriation
ActualExpenditure
(Over)/Under Expenditure
Final Appropriation
ActualExpenditure
(Over)/Under Expenditure
R’000 R’000 R’000 R’000 R’000 R’000
Broadband 161 254 83 540 77 714 59 844 49 968 9 876
Digital Terrestrial Television 390 296 390 213 83 995 672 995 671 1
Total 551 550 473 753 77 797 1 055 516 1 045 640 9 876
page 76
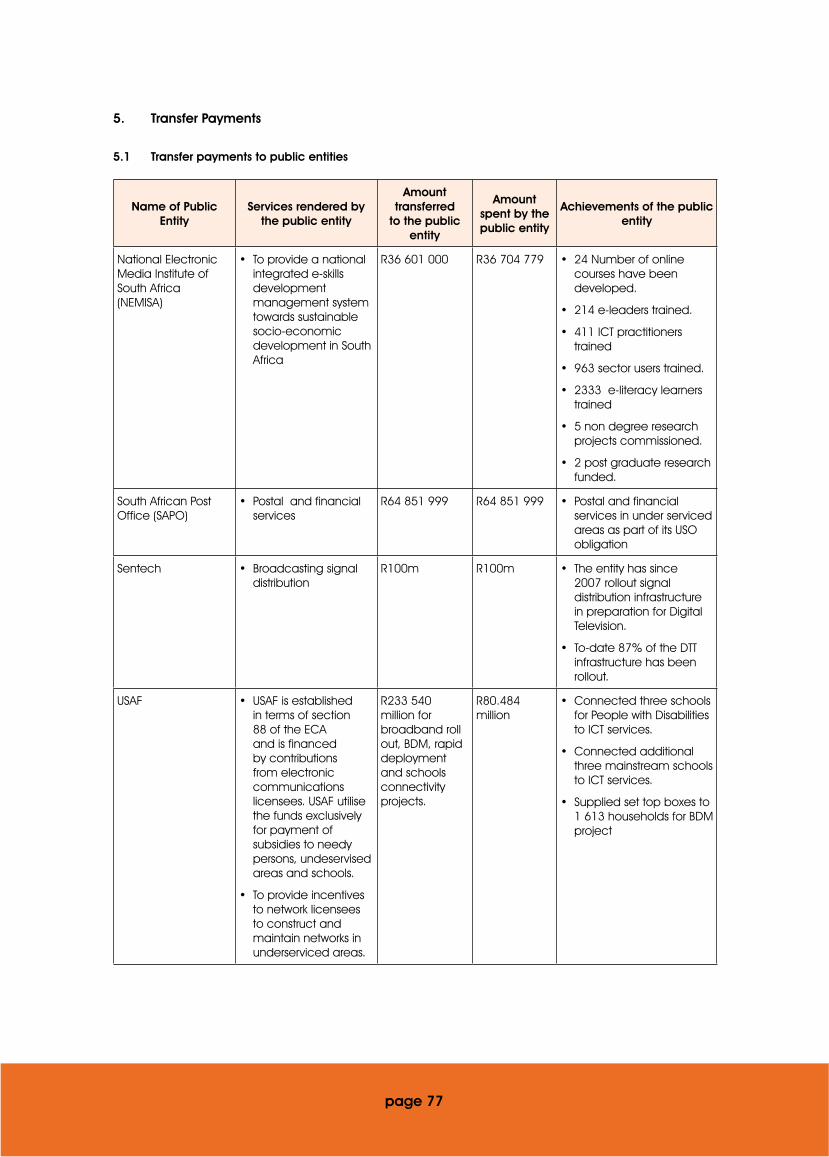
5. Transfer Payments
5.1 Transfer payments to public entities
Name of Public Entity
Services rendered by the public entity
Amount transferred
to the public entity
Amount spent by the public entity
Achievements of the public entity
National Electronic Media Institute of South Africa(NEMISA)
•Toprovideanationalintegrated e-skills development management system towards sustainable socio-economic development in South Africa
R36 601 000 R36 704 779 •24Numberofonlinecourses have been developed.
•214e-leaderstrained.
•411ICTpractitionerstrained
•963sectoruserstrained.
•2333e-literacylearnerstrained
•5nondegreeresearchprojects commissioned.
•2postgraduateresearchfunded.
South African Post Office (SAPO)
•Postalandfinancialservices
R64 851 999 R64 851 999 •Postalandfinancialservices in under serviced areas as part of its USO obligation
Sentech •Broadcastingsignaldistribution
R100m R100m •Theentityhassince2007 rollout signal distribution infrastructure in preparation for Digital Television.
•To-date87%oftheDTTinfrastructure has been rollout.
USAF •USAFisestablishedin terms of section 88 of the ECA and is financed by contributions from electronic communications licensees. USAF utilise the funds exclusively for payment of subsidies to needy persons, undeservised areas and schools.
•Toprovideincentivesto network licensees to construct and maintain networks in underserviced areas.
R233 540 million for broadband roll out, BDM, rapid deployment and schools connectivity projects.
R80.484 million
•Connectedthreeschoolsfor People with Disabilities to ICT services.
•Connectedadditionalthree mainstream schools to ICT services.
•Suppliedsettopboxesto1 613 households for BDM project
page 77
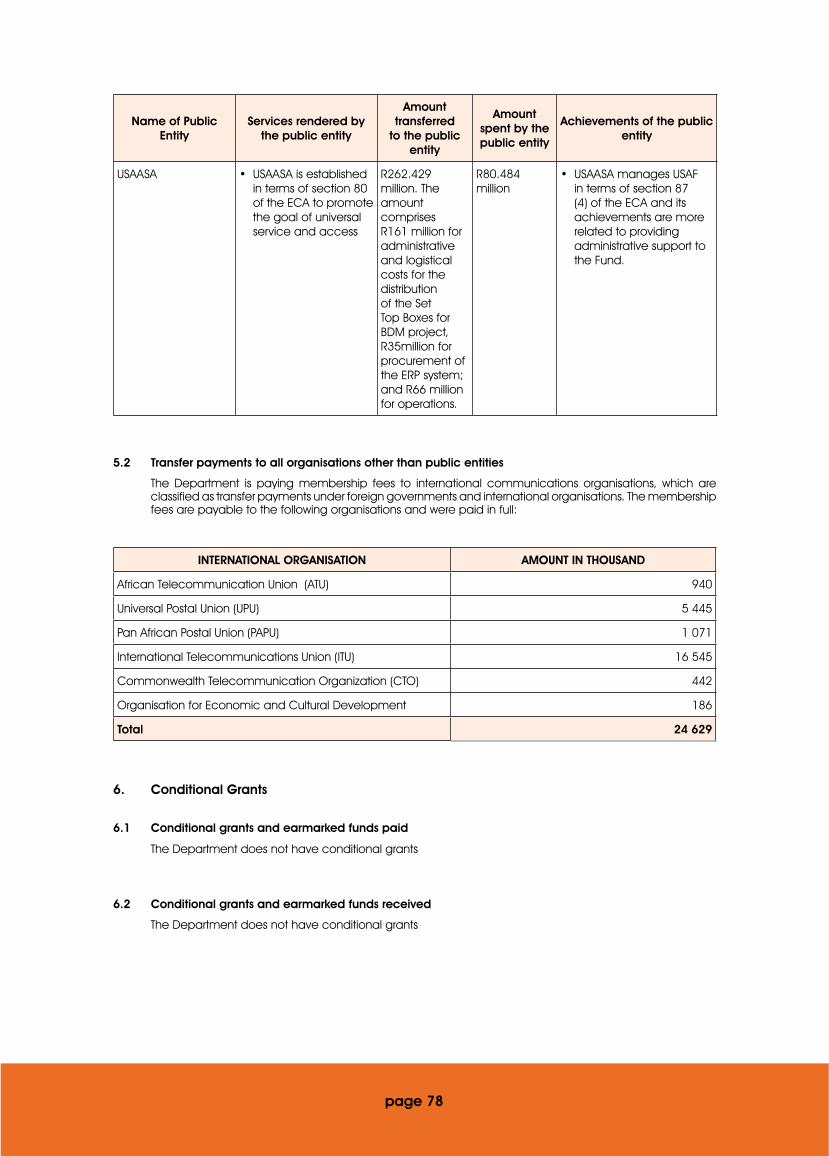
page 78
Name of Public Entity
Services rendered by the public entity
Amount transferred
to the public entity
Amount spent by the public entity
Achievements of the public entity
USAASA •USAASAisestablishedin terms of section 80 of the ECA to promote the goal of universal service and access
R262.429 million. The amount comprises R161 million for administrative and logistical costs for the distribution of the Set Top Boxes for BDM project, R35million for procurement of the ERP system; and R66 million for operations.
R80.484 million
•USAASAmanagesUSAFin terms of section 87 (4) of the ECA and its achievements are more related to providing administrative support to the Fund.
5.2 Transfer payments to all organisations other than public entities
The Department is paying membership fees to international communications organisations, which are classified as transfer payments under foreign governments and international organisations. The membership fees are payable to the following organisations and were paid in full:
INTERNATIONAL ORGANISATION AMOUNT IN THOUSAND
African Telecommunication Union (ATU) 940
Universal Postal Union (UPU) 5 445
Pan African Postal Union (PAPU) 1 071
International Telecommunications Union (ITU) 16 545
Commonwealth Telecommunication Organization (CTO) 442
Organisation for Economic and Cultural Development 186
Total 24 629
6. Conditional Grants
6.1 Conditional grants and earmarked funds paid
The Department does not have conditional grants
6.2 Conditional grants and earmarked funds received
The Department does not have conditional grants

7. Donor Funds
7.1 Donor Funds Received
Donor assistance in-kind contributions for the 2015/16 financial year are as per the table below.
NAME OF ORGANISATION NATURE OF GIFT, DONATION OR SPONSORSHIPAmount in thousand
Broadband Infraco Hosting of the 16th ordinary session of the ATU administrative council meeting - sponsor 120 bags
-
MTN Hosting of the 16th ordinary session of the ATU administrative council meeting - sponsor the welcome networking dinner on 17 June 2015
80
Sentech Hosting of the 16th ordinary session of the ATU administrative council meeting - sponsor 120 cups
-
SITA Hosting of the 16th ordinary session of the ATU administrative council meeting - sponsor a heavy duty copier loaned from SITA, Durban for the duration of the meeting
-
Telkom SA SOC Ltd Hosting of the 16th ordinary session of the ATU administrative council meeting - sponsor 100 memory sticks
-
USAASA Hosting of the 16th ordinary session of the ATU administrative council meeting - sponsor Wi-Fi installation at the conference venue
25
ICASA UPU Council Meeting, 08 - 26 February 2016, Bern, Switzerland - SA Reception
304
Organizers of the 3rd Africa School on Internet Governance held in Ethiopia, 02 - 05 September 2015
An official of the Department was sponsored for Economy Flight Ticket (R26 000) & Daily Allowance (R1 919) at this Meeting
28
8. Capital Investment
8.1 Capital investment, maintenance and asset management plan
No Capital investments were made or maintained by the Department of Telecommunications and Postal
Services.
The Department maintained an updated and accurate Asset Register which adheres to the requirements
of National Treasury, and the Department’s Maintenance and Asset Management Plan was also updated
and revised.
Due to a proper strategy of replacing and disposing of old and redundant equipment that no longer
support effective service delivery in the Department there were no major changes in the Department
holdings over the period of review.
All assets that could not be cost effectively repaired or refurbished were disposed by means of scraping in
an environmentally healthy manner by Desco Electronic Recyclers which is an e-waste recycling company
dedicated to eradicating electronic waste.
All assets stolen and lost were dealt with in line with Departmental Policy on the Management of Losses.
During the period under review all losses due to theft were investigated and recommendations were made
whether to recover the loss or to write it off, the number of losses due to theft were relatively low. All losses
were removed from the asset register after authorization was obtained.
page 79
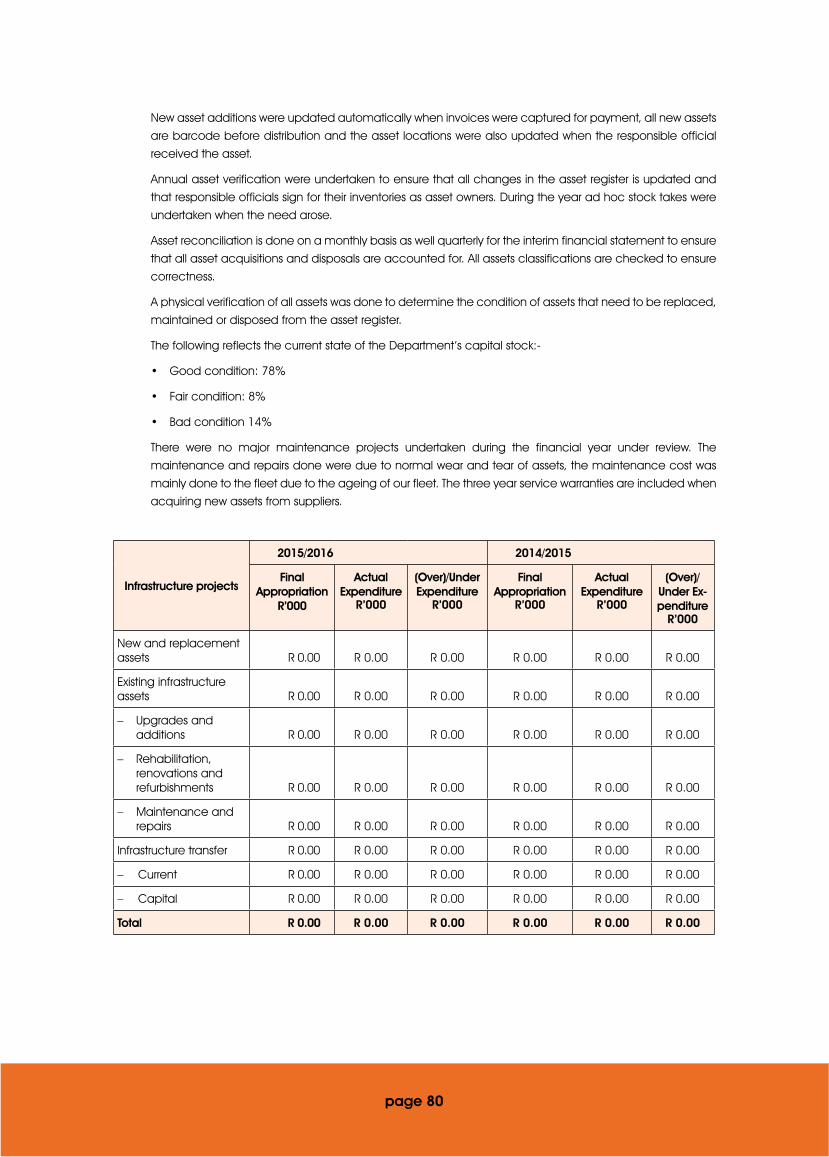
New asset additions were updated automatically when invoices were captured for payment, all new assets
are barcode before distribution and the asset locations were also updated when the responsible official
received the asset.
Annual asset verification were undertaken to ensure that all changes in the asset register is updated and
that responsible officials sign for their inventories as asset owners. During the year ad hoc stock takes were
undertaken when the need arose.
Asset reconciliation is done on a monthly basis as well quarterly for the interim financial statement to ensure
that all asset acquisitions and disposals are accounted for. All assets classifications are checked to ensure
correctness.
A physical verification of all assets was done to determine the condition of assets that need to be replaced,
maintained or disposed from the asset register.
The following reflects the current state of the Department’s capital stock:-
• Good condition: 78%
• Fair condition: 8%
• Bad condition 14%
There were no major maintenance projects undertaken during the financial year under review. The
maintenance and repairs done were due to normal wear and tear of assets, the maintenance cost was
mainly done to the fleet due to the ageing of our fleet. The three year service warranties are included when
acquiring new assets from suppliers.
Infrastructure projects
2015/2016 2014/2015
Final Appropriation
R’000
ActualExpenditure
R’000
(Over)/Under Expenditure
R’000
Final Appropriation
R’000
ActualExpenditure
R’000
(Over)/Under Ex-penditure
R’000
New and replacement assets R 0.00 R 0.00 R 0.00 R 0.00 R 0.00 R 0.00
Existing infrastructure assets R 0.00 R 0.00 R 0.00 R 0.00 R 0.00 R 0.00
- Upgrades and additions R 0.00 R 0.00 R 0.00 R 0.00 R 0.00 R 0.00
- Rehabilitation, renovations and refurbishments R 0.00 R 0.00 R 0.00 R 0.00 R 0.00 R 0.00
- Maintenance and repairs R 0.00 R 0.00 R 0.00 R 0.00 R 0.00 R 0.00
Infrastructure transfer R 0.00 R 0.00 R 0.00 R 0.00 R 0.00 R 0.00
- Current R 0.00 R 0.00 R 0.00 R 0.00 R 0.00 R 0.00
- Capital R 0.00 R 0.00 R 0.00 R 0.00 R 0.00 R 0.00
Total R 0.00 R 0.00 R 0.00 R 0.00 R 0.00 R 0.00
page 80

page 81
PART C GOVERNANCE

1. Introduction
The Department is committed to maintain the highest standards of governance and recognizes the need
for good governance to ensure the following:
• Convergence of the work of different programmes to implement the mandate of the Department.
• Alignment of different functions aimed at achieving similar outcomes, to alleviate duplications and
resource wastages.
• Internalisation of a compliance culture to circumvent fraud, corruption and the abuse of State resources.
• Accountable management, monitoring and reporting on the implementation of commitments entailed
in the Strategic Plan and Annual Performance Plan of the Department.
The Department has the following governance structures in place:
• Executive Committee (EXCO). The EXCO is attended by the Minister (Chairperson), Deputy Minister,
Director-General and Deputy Directors-General (DDGs). The EXCO deals with strategic policy issues
that form the basis for the Executive Authority’s engagement with Cabinet, Parliament and other
key stakeholders. It also addresses matters elevated by the Departmental Executive Committee for
resolution and decisions-making. Three (3) EXCO meetings were held during the 2015/16 financial year.
In addition to these meetings Minister has continuously engaged with Branches to provide guidance
and to be apprised of key issues relating to decisions he was required to take.
• Departmental Executive Committee (DEC). The DEC is attended by the Director-General (Chairperson)
and DDGs. The DEC monitors the implementation of the Department’s Strategic Plan and addresses
constraints relating to the implementation thereof. Their role includes processing and providing direction
and guidance on strategic operational issues. Seven (7) ordinary and four (4) Special DEC meetings
were held during the 2015/16 financial year.
• Top Management Committee (TMC), attended by the Director-General (Chairperson), DDGs, Chief
Directors as well as Directors. The TMC monitors the implementation and reporting on the Department’s
Annual Performance Plan and identifies constraints that require decisions and resolution by the DEC.
Nine (9) ordinary and two (2) Special TMC meetings were held during the 2015/16 financial year.
• Organizational Performance Assessment Board (OPAB), chaired by the Director-General and attended
by DDGs. The OPAB is responsible for monitoring the Department’s quarterly performance against the
APP and processing and resolving constraints to implementation.
• Operations Committee (OPSCOM), attended by DDG: Administration (Chairperson), the Chief
Audit Executive, Chief Director: HRM, Chief Financial Officer, Chief Director: Communications and
representatives from all Branches. The OPSCOM is responsible for the management of the Department’s
internal Policy Register, ensuring that all internal operations policies are reviewed annually and changes
are effected to comply with legislative and other changes that support the objectives of the Department
to ensure an aligned and supportive policy environment. OPSCOM convened four meetings in the
2015/16 financial year, during which twenty (20) policies were reviewed.
page 82

2. Risk Management
2.1 Risk Management Approach
In terms of its robust and comprehensive ‘top down’ risk management approach, the Department assesses,
manages and reports on all significant risks and related mitigation plans consistently, in accordance with
its defined risk management and reporting protocols. A top-down approach is followed which foster the
management of risks from the Top (Executive and SMS Level managing strategic risks) to the Bottom (MMS
Level managing operational risks) within respective Branches.
As part of its journey to become more proactive and responsive, the Department has developed a Risk
Appetite and Tolerance Framework and Levels for all key risks so as to enhance the review and monitoring
of key trends in relation to each risk exposure(s).
2.2 Risk Management Policy and Strategy
The Risk Management Directorate had managed to revise and update the Risk Management Framework
(Policy, Strategy, Risk Identification & Assessment Methodology and Implementation Plan). These documents
were presented to and approved by the Operations and Risk Management Committees and signed-off by
the Accounting Officer during the period under review.
The approved Departmental Risk Appetite and Tolerance Framework and Levels have assisted with
the determination of the point at which risks are considered significant and requires mitigations to be
implemented to manage the risk exposures to acceptable levels.
2.3 Risk Aware Culture
There are various processes to ensure the commitment of the entire Department e.g. awareness workshops
throughout the Department, awareness on induction of new employees, risk management posters and
brochures in all the Department’s premises and uploading of enabling documents in the intranet for ease
of access by internal officials.
2.4 Risk Management Structure
Risk Management Directorate comprises of two positions; Director and Deputy Director that are currently
filled.
2.5 Risk Assessments
A Top Down Approach to risk assessments is followed which requires strategic risk assessment to be
completed first and thereafter operational risks assessment completed on the basis of the risks and appetite
levels identified and assessed at the strategic level.
The 2015/16 strategic risks assessments were completed on time with relevant reports presented to Opscom
and Risk Management Committees for consideration and approval, and also to the Audit Committee for
noting and the Accounting Officer for sign-off.
2.6 Risk Management Committee (RMC)
To ensure the integrity and reliability of the Risk Management processes, the Department has established
RMC to assist the Accounting Officer by overseeing the effectiveness of the Department’s risk management
systems, practices and procedures and to provide recommendations for improvement.
page 83
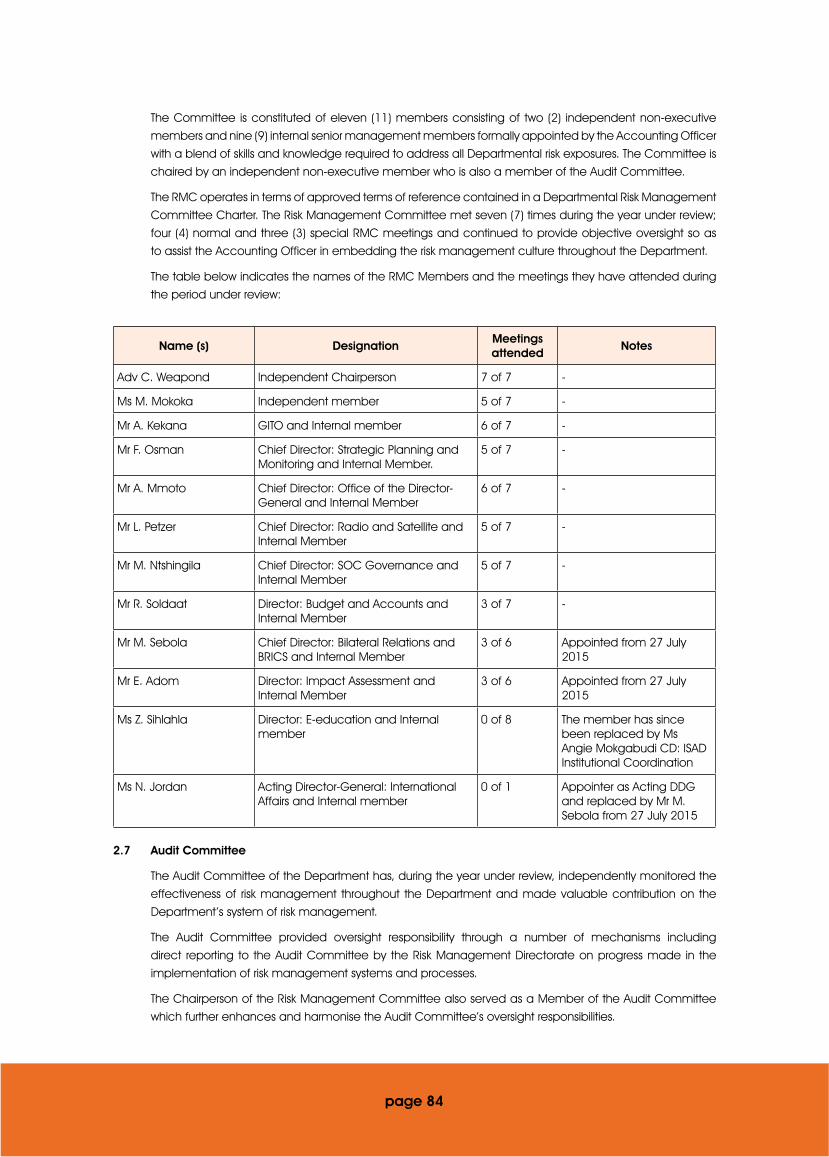
The Committee is constituted of eleven (11) members consisting of two (2) independent non-executive
members and nine (9) internal senior management members formally appointed by the Accounting Officer
with a blend of skills and knowledge required to address all Departmental risk exposures. The Committee is
chaired by an independent non-executive member who is also a member of the Audit Committee.
The RMC operates in terms of approved terms of reference contained in a Departmental Risk Management
Committee Charter. The Risk Management Committee met seven (7) times during the year under review;
four (4) normal and three (3) special RMC meetings and continued to provide objective oversight so as
to assist the Accounting Officer in embedding the risk management culture throughout the Department.
The table below indicates the names of the RMC Members and the meetings they have attended during
the period under review:
Name (s) DesignationMeetings attended
Notes
Adv C. Weapond Independent Chairperson 7 of 7 -
Ms M. Mokoka Independent member 5 of 7 -
Mr A. Kekana GITO and Internal member 6 of 7 -
Mr F. Osman Chief Director: Strategic Planning and Monitoring and Internal Member.
5 of 7 -
Mr A. Mmoto Chief Director: Office of the Director-General and Internal Member
6 of 7 -
Mr L. Petzer Chief Director: Radio and Satellite and Internal Member
5 of 7 -
Mr M. Ntshingila Chief Director: SOC Governance and Internal Member
5 of 7 -
Mr R. Soldaat Director: Budget and Accounts and Internal Member
3 of 7 -
Mr M. Sebola Chief Director: Bilateral Relations and BRICS and Internal Member
3 of 6 Appointed from 27 July 2015
Mr E. Adom Director: Impact Assessment and Internal Member
3 of 6 Appointed from 27 July 2015
Ms Z. Sihlahla Director: E-education and Internal member
0 of 8 The member has since been replaced by Ms Angie Mokgabudi CD: ISAD Institutional Coordination
Ms N. Jordan Acting Director-General: International Affairs and Internal member
0 of 1 Appointer as Acting DDG and replaced by Mr M. Sebola from 27 July 2015
2.7 Audit Committee
The Audit Committee of the Department has, during the year under review, independently monitored the
effectiveness of risk management throughout the Department and made valuable contribution on the
Department’s system of risk management.
The Audit Committee provided oversight responsibility through a number of mechanisms including
direct reporting to the Audit Committee by the Risk Management Directorate on progress made in the
implementation of risk management systems and processes.
The Chairperson of the Risk Management Committee also served as a Member of the Audit Committee
which further enhances and harmonise the Audit Committee’s oversight responsibilities.
page 84

2.8 Value Add
Risk Management systems and processes have assisted the Department in the achievement of objectives
by ensuring that the following are taken into account in the management of the Department’s service
delivery mandate:
a. Influencing the strategic planning process – The strategic planning process considered the risk universe
of the Department in the development of the 2016/17 and mid-term planning period strategic goals
and objectives; and
b. Key root causes or challenges have also been considered in the determination of the current and mid-
term strategic goals and objectives, e.g. availability of resources (financial, human and other relevant
resources), etc.
Plans to improve the value add includes but are not limited to the following:
a. Sign-off by Risk Owners (DDGs) of their Branches risks and mitigation plans;
b. Quarterly progress reporting on the management of risks and implementation of risk mitigation strategies
by the Risk Owners;
c. Incorporating risk management section in the Departmental Reporting Template; and
d. Procurement of risk management system to modernise the current manual system.
3. Fraud and Corruption
3.1 Fraud Prevention Plan and Implementation
Revised Fraud Prevention Framework (Strategy, Policy, Investigation Procedure, Implementation Plan and
Whistle Blowing Policy) has been approved by relevant structures and implemented throughout the year.
3.2 Mechanisms to report fraud and corruption
• Fraud Prevention awareness was provided to ensure that all Department officials and external
stakeholders are aware of the systems and protocols to be followed when reporting any allegations
of fraud or corruption. The awareness included, among other things, the fraud prevention posters
displayed in all the Department’s premises, induction of new employees, etc.
• The Department used the National Anti-Corruption Hotline for whistle blowing purposes that is operated
and managed by the Public Services Commission (PSC). Employees were encouraged to report any
suspected corrupt, fraudulent, criminal or unethical practices using the Hotline number.
• Implementation of the Fraud Prevention Plan was monitored through Quarterly Fraud Prevention
Implementation Reports that were presented to the Risk Management Committee on a quarterly basis.
3.3 Reporting of cases and actions
• The Risk Management and Audit Committees provided oversight over the fraud prevention systems and
processes within the Department.
• Cases were reported to these structures on a regular basis for advice and recommendation on the
actions that can be taken.
• Where officials were convicted, the necessary processes were followed in accordance with the
Department’s policies and procedures including disciplinary procedures and/or SIU investigations where
warranted.
page 85
4. Minimising Conflict of Interest
The Department has systems and processes implemented to ensure that all SMS Members throughout
the Department completed Financial Disclosures electronically in terms of Chapter 3 of the Public Service
Regulations, 2001. In terms of the aforementioned regulation, completed disclosure must be submitted
to DPSA by the 31st of May each year. The Department has managed to complete and submit financial
disclosures through the e-disclosures system within set timeframe (31 May 2015).
Other measures implemented to prevent conflict of interest include:
a. Systems and processes implemented to prevent conflict of interest in SCM such as:
• All Bid Evaluation Committee Members signed code of conduct and declaration of interest;
• Departmental Bid Adjudication Committee members signed declaration of interest in all meetings.
Where conflict of interest was declared regarding a matter(s) to be considered, the affected
Members were requested to recuse themselves in the consideration and decisions taken on the
matter at hand; and
• SBD 4 Documents were signed by all prospective bidders to declare any interest.
b. Systems and processes implemented to prevent conflict of interest in governance structures:
• Members of governance structures were required to disclose any interests on matters discussed in
meetings/workshops and where conflict of interest is disclosed, the affected Members were asked
to recuse themselves from the decisions taken; and
• Appointments of members into governance structures were made taking any potential or actual
conflict of interest into account.
Any conflict of interest identified was considered and dealt with in terms of the Department’s policies and
procedures and where necessary taking into account provisions of the DPSA’s guidelines were considered.
5. Code of Conduct
The Department adheres to the Public Service Code of Conduct contained in the Public Service Regulations,
2001. The code was communicated to all new and old employees of the Department and formed part of
the induction programmes to ensure awareness and adherence. The Department also promotes the code
of conduct through internal communication networks. Contravention of the code of conduct constitutes
misconduct and therefore addressed through normal disciplinary procedures of the Department.
6. Health, Safety and Environmental Issues
The Department has approved a SHERQ (Safety, Health, Environment, Risk and Quality) Policy aimed at the
provision of a healthy and safe working environment. Service providers have been appointed to ensure
that the work environment is kept clean at all times and uphold safety in the form of security provision. Pest
control companies were occasionally contracted to fumigate office. Procedures and processes are in
place to address Incidents of work related injuries as and when they arise in line with the COID Act.
page 86
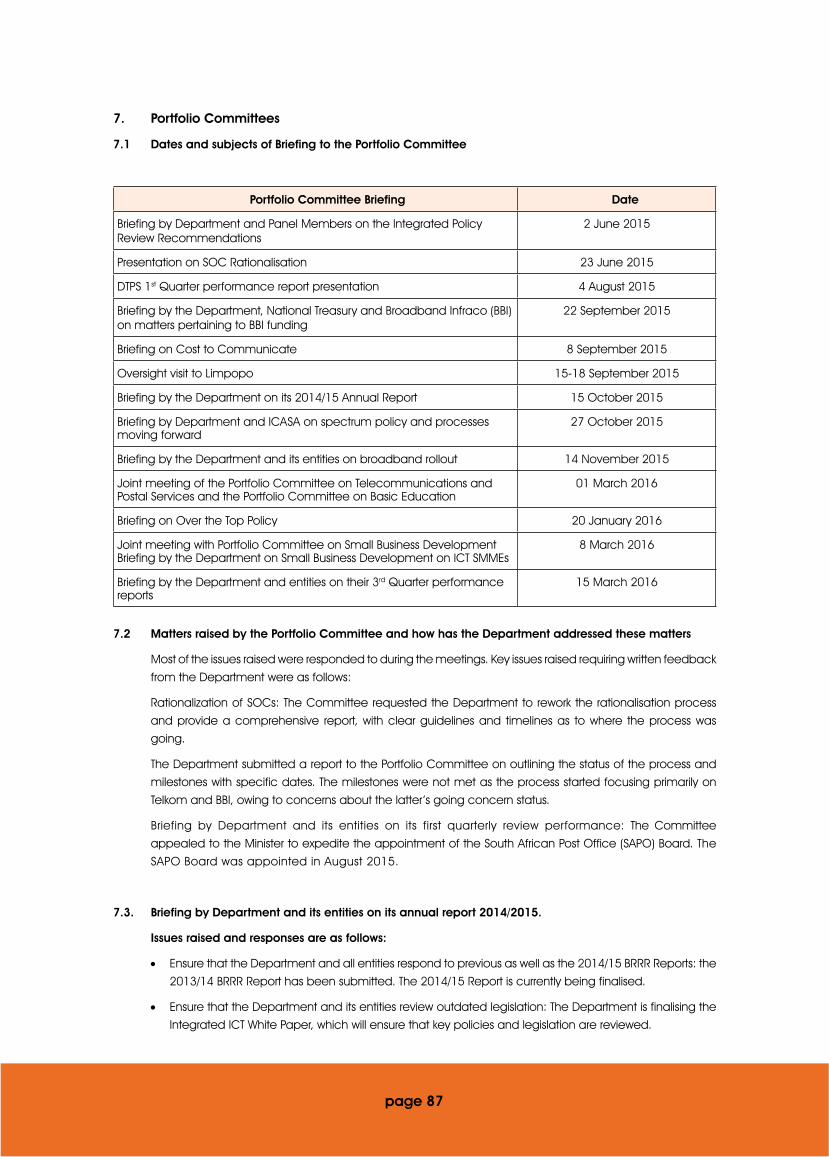
page 87
7. Portfolio Committees
7.1 Dates and subjects of Briefing to the Portfolio Committee
Portfolio Committee Briefing Date
Briefing by Department and Panel Members on the Integrated Policy Review Recommendations
2 June 2015
Presentation on SOC Rationalisation 23 June 2015
DTPS 1st Quarter performance report presentation 4 August 2015
Briefing by the Department, National Treasury and Broadband Infraco (BBI) on matters pertaining to BBI funding
22 September 2015
Briefing on Cost to Communicate 8 September 2015
Oversight visit to Limpopo 15-18 September 2015
Briefing by the Department on its 2014/15 Annual Report 15 October 2015
Briefing by Department and ICASA on spectrum policy and processes moving forward
27 October 2015
Briefing by the Department and its entities on broadband rollout 14 November 2015
Joint meeting of the Portfolio Committee on Telecommunications and Postal Services and the Portfolio Committee on Basic Education
01 March 2016
Briefing on Over the Top Policy 20 January 2016
Joint meeting with Portfolio Committee on Small Business Development Briefing by the Department on Small Business Development on ICT SMMEs
8 March 2016
Briefing by the Department and entities on their 3rd Quarter performance reports
15 March 2016
7.2 Matters raised by the Portfolio Committee and how has the Department addressed these matters
Most of the issues raised were responded to during the meetings. Key issues raised requiring written feedback
from the Department were as follows:
Rationalization of SOCs: The Committee requested the Department to rework the rationalisation process
and provide a comprehensive report, with clear guidelines and timelines as to where the process was
going.
The Department submitted a report to the Portfolio Committee on outlining the status of the process and
milestones with specific dates. The milestones were not met as the process started focusing primarily on
Telkom and BBI, owing to concerns about the latter’s going concern status.
Briefing by Department and its entities on its first quarterly review performance: The Committee
appealed to the Minister to expedite the appointment of the South African Post Office (SAPO) Board. The
SAPO Board was appointed in August 2015.
7.3. Briefing by Department and its entities on its annual report 2014/2015.
Issues raised and responses are as follows:
• Ensure that the Department and all entities respond to previous as well as the 2014/15 BRRR Reports: the
2013/14 BRRR Report has been submitted. The 2014/15 Report is currently being finalised.
• Ensure that the Department and its entities review outdated legislation: The Department is finalising the
Integrated ICT White Paper, which will ensure that key policies and legislation are reviewed.
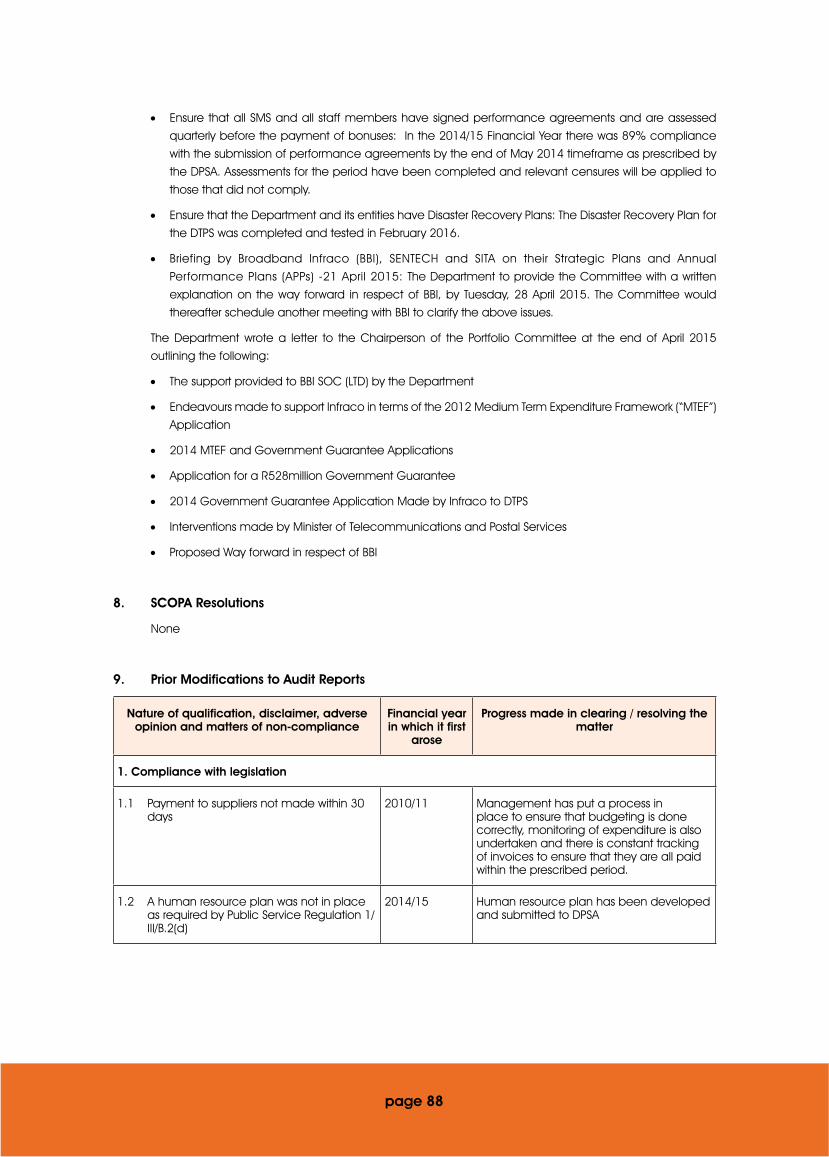
• Ensure that all SMS and all staff members have signed performance agreements and are assessed
quarterly before the payment of bonuses: In the 2014/15 Financial Year there was 89% compliance
with the submission of performance agreements by the end of May 2014 timeframe as prescribed by
the DPSA. Assessments for the period have been completed and relevant censures will be applied to
those that did not comply.
• Ensure that the Department and its entities have Disaster Recovery Plans: The Disaster Recovery Plan for
the DTPS was completed and tested in February 2016.
• Briefing by Broadband Infraco (BBI), SENTECH and SITA on their Strategic Plans and Annual
Performance Plans (APPs) -21 April 2015: The Department to provide the Committee with a written
explanation on the way forward in respect of BBI, by Tuesday, 28 April 2015. The Committee would
thereafter schedule another meeting with BBI to clarify the above issues.
The Department wrote a letter to the Chairperson of the Portfolio Committee at the end of April 2015
outlining the following:
• The support provided to BBI SOC (LTD) by the Department
• Endeavours made to support Infraco in terms of the 2012 Medium Term Expenditure Framework (“MTEF”)
Application
• 2014 MTEF and Government Guarantee Applications
• Application for a R528million Government Guarantee
• 2014 Government Guarantee Application Made by Infraco to DTPS
• Interventions made by Minister of Telecommunications and Postal Services
• Proposed Way forward in respect of BBI
8. SCOPA Resolutions
None
9. Prior Modifications to Audit Reports
Nature of qualification, disclaimer, adverse opinion and matters of non-compliance
Financial year in which it first
arose
Progress made in clearing / resolving the matter
1. Compliance with legislation
1.1 Payment to suppliers not made within 30 days
2010/11 Management has put a process in place to ensure that budgeting is done correctly, monitoring of expenditure is also undertaken and there is constant tracking of invoices to ensure that they are all paid within the prescribed period.
1.2 A human resource plan was not in place as required by Public Service Regulation 1/III/B.2(d)
2014/15 Human resource plan has been developed and submitted to DPSA
page 88
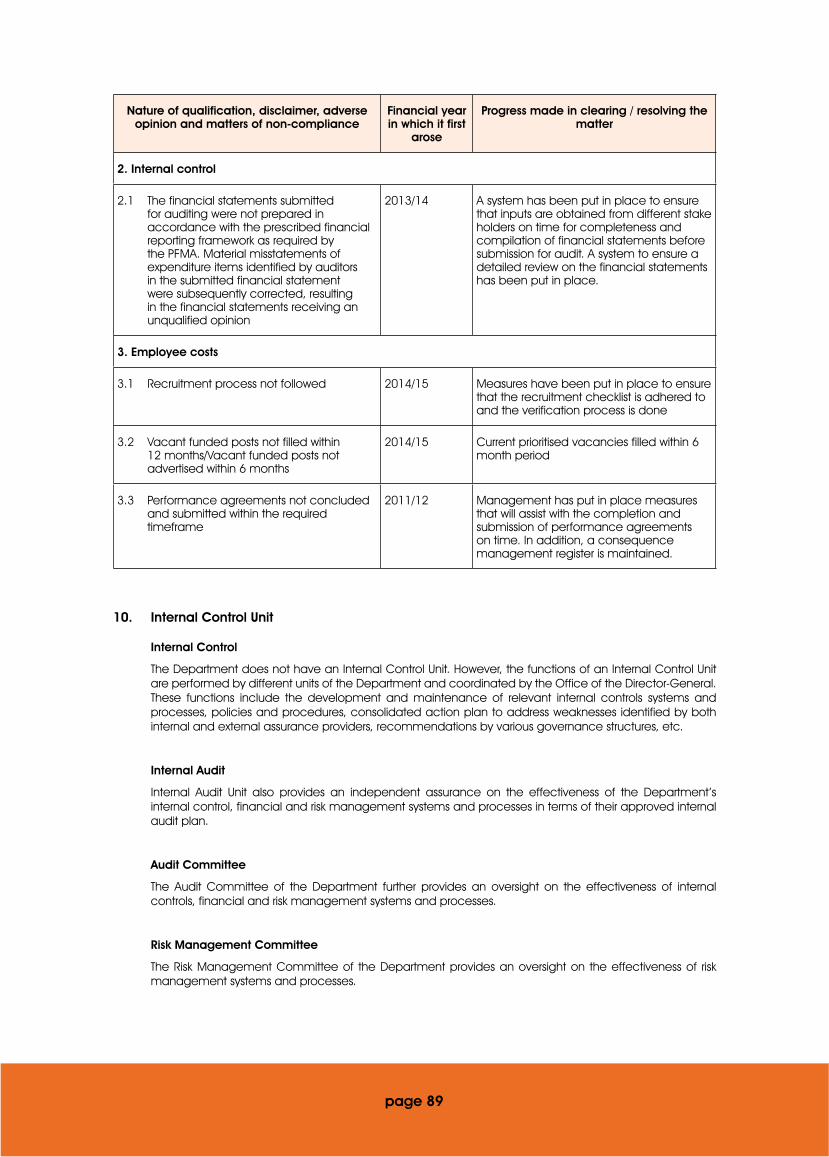
Nature of qualification, disclaimer, adverse opinion and matters of non-compliance
Financial year in which it first
arose
Progress made in clearing / resolving the matter
2. Internal control
2.1 The financial statements submitted for auditing were not prepared in accordance with the prescribed financial reporting framework as required by the PFMA. Material misstatements of expenditure items identified by auditors in the submitted financial statement were subsequently corrected, resulting in the financial statements receiving an unqualified opinion
2013/14 A system has been put in place to ensure that inputs are obtained from different stake holders on time for completeness and compilation of financial statements before submission for audit. A system to ensure a detailed review on the financial statements has been put in place.
3. Employee costs
3.1 Recruitment process not followed 2014/15 Measures have been put in place to ensure that the recruitment checklist is adhered to and the verification process is done
3.2 Vacant funded posts not filled within 12 months/Vacant funded posts not advertised within 6 months
2014/15 Current prioritised vacancies filled within 6 month period
3.3 Performance agreements not concluded and submitted within the required timeframe
2011/12 Management has put in place measures that will assist with the completion and submission of performance agreements on time. In addition, a consequence management register is maintained.
10. Internal Control Unit
Internal Control
The Department does not have an Internal Control Unit. However, the functions of an Internal Control Unit are performed by different units of the Department and coordinated by the Office of the Director-General. These functions include the development and maintenance of relevant internal controls systems and processes, policies and procedures, consolidated action plan to address weaknesses identified by both internal and external assurance providers, recommendations by various governance structures, etc.
Internal Audit
Internal Audit Unit also provides an independent assurance on the effectiveness of the Department’s internal control, financial and risk management systems and processes in terms of their approved internal audit plan.
Audit Committee
The Audit Committee of the Department further provides an oversight on the effectiveness of internal controls, financial and risk management systems and processes.
Risk Management Committee
The Risk Management Committee of the Department provides an oversight on the effectiveness of risk management systems and processes.
page 89
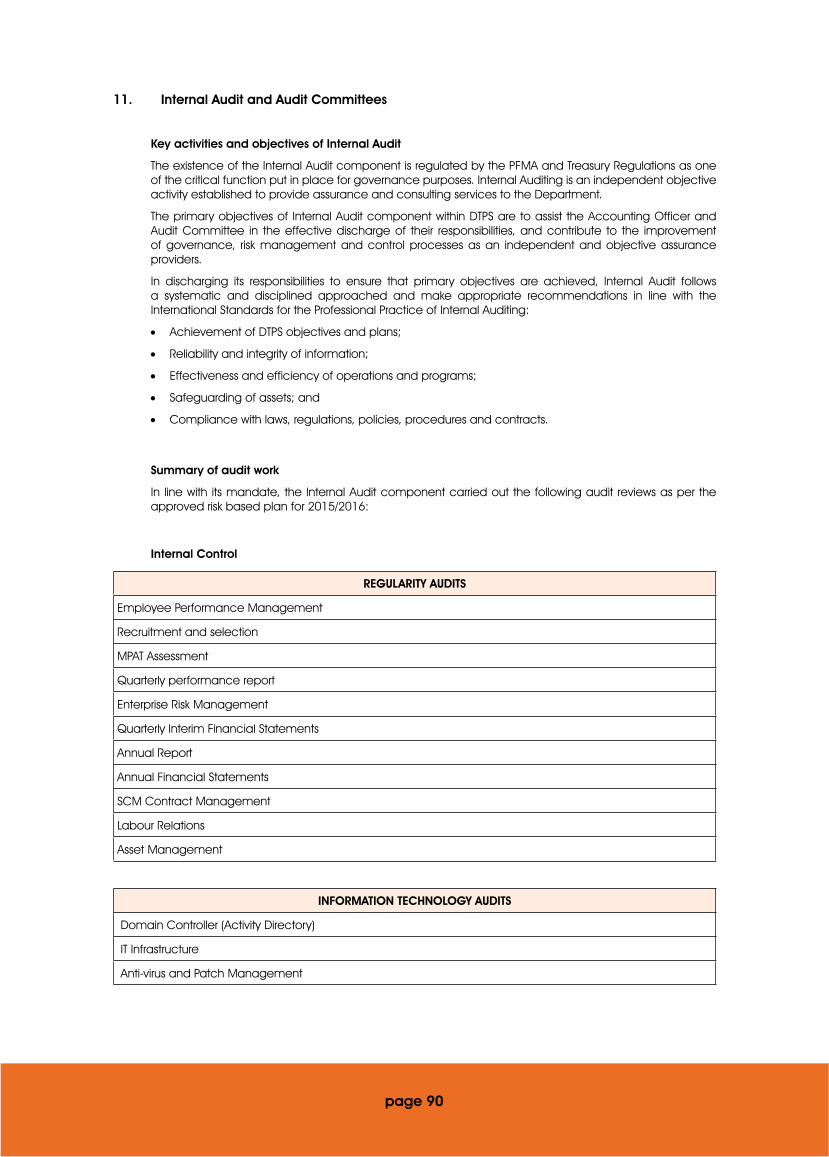
11. Internal Audit and Audit Committees
Key activities and objectives of Internal Audit
The existence of the Internal Audit component is regulated by the PFMA and Treasury Regulations as one of the critical function put in place for governance purposes. Internal Auditing is an independent objective activity established to provide assurance and consulting services to the Department.
The primary objectives of Internal Audit component within DTPS are to assist the Accounting Officer and Audit Committee in the effective discharge of their responsibilities, and contribute to the improvement of governance, risk management and control processes as an independent and objective assurance providers.
In discharging its responsibilities to ensure that primary objectives are achieved, Internal Audit follows a systematic and disciplined approached and make appropriate recommendations in line with the International Standards for the Professional Practice of Internal Auditing:
• Achievement of DTPS objectives and plans;
• Reliability and integrity of information;
• Effectiveness and efficiency of operations and programs;
• Safeguarding of assets; and
• Compliance with laws, regulations, policies, procedures and contracts.
Summary of audit work
In line with its mandate, the Internal Audit component carried out the following audit reviews as per the approved risk based plan for 2015/2016:
Internal Control
REGULARITY AUDITS
Employee Performance Management
Recruitment and selection
MPAT Assessment
Quarterly performance report
Enterprise Risk Management
Quarterly Interim Financial Statements
Annual Report
Annual Financial Statements
SCM Contract Management
Labour Relations
Asset Management
INFORMATION TECHNOLOGY AUDITS
Domain Controller (Activity Directory)
IT Infrastructure
Anti-virus and Patch Management
page 90

The review of IT general controls, disaster recovery and business continuity were performed by the AGSA and Internal Audit conducted a follow up through a finding register.
Key activities and objectives of the audit committee
The Audit Committee is an independent governance structure established in terms of section 76 and 77 of the PFMA, and its key function is to provide oversight over the Department’s compliance with applicable laws and regulations, governance process and continuously assess the performance of Internal Audit Activity to determine the level of its effectiveness within the Department.
The Audit Committee operates in accordance with written terms of reference (Audit Committee Charter), which deals adequately with its membership, authority and responsibility. The Committee meets as and when necessary with the Executive Authority and the Auditor General.
The Audit Committee held four (4) ordinary meetings and four (4) special meetings during 2015/16 financial year and the table below discloses relevant information on the Committee Members:
Relevant information on the Audit Committee Members
Name QualificationsInternal or external
If internal, position in the
Department
Date appointed
Date Resigned
No. of Meetings attended
Mr W. Huma(Chairperson)
B.Proc, Bachelor of Laws (LLB), Master of Laws (LLM), Fellow Institute of Directors and Post Graduate Diploma: Company Direction (Governance).
External N/A 09/09/2011 N/A 8
Adv Collen Weapond(Member)
LLB, Mtech (forensic investigation)
External N/A 01/07/2011 N/A 8
Ms P Mvulane(Member)
CA (SA) External N/A 01/11/2014 N/A 8
Ms K Selane(Member)
CA (SA) External N/A 01/11/2014 N/A 7
page 91
12. Audit Committee Report
We are pleased to present our report for the financial year ended 31 March 2016.
Audit Committee Responsibility
The Audit Committee reports that it has complied with its responsibilities arising from Section 38 (1) (a) (ii) of the Public Finance Management Act and Treasury Regulation 3.1.13.
The Audit Committee also reports that it has adopted appropriate formal terms of reference as its Audit Committee Charter, has conducted its affairs in compliance with this charter and has discharged all its responsibilities as contained therein.
The effectiveness of Internal Control
The systems of internal control was adequate, although not entirely effective, for the year under review. This is indicated by internal audit and AGSA findings on issues relating to non-compliance with laws, regulations and prescripts. The number of repeat findings has reduced significantly relative to the previous financial years. However, the Audit Committee will continue to monitor progress against the corrective action plans implemented by management of DTPS to address all findings by AGSA and Internal Audit.
The performance management area needs close supervision to ensure that the Department improves its performance information reporting mechanisms. This continues to be an area of concern to the Audit Committee, and to this end Internal Audit reviews the quarterly performance information to ensure that the results are supported by a credible portfolio of evidence.
The risk management system complies with the basic legislative requirements and efforts are being implemented to advance towards the expected levels of efficiency, effectiveness and transparency. Special attention is, however, needed for risk management to function optimally.
The quality of in-year Management and Quarterly Reports submitted in terms of the PFMA and the Division of Revenue Act
The Audit Committee is satisfied with the content and quality of quarterly reports prepared and issued by the Accounting Officer during the year under review. The reports are, however submitted late to the Audit Committee and therefore the Audit Committee could not provide adequate oversight on these reports.
Evaluation of Financial Statements
The Audit Committee has:
• reviewed and discussed the draft audited annual financial statements submitted to the AGSA with Management;
• reviewed the Auditor General’s management report and managements responses thereto;
• reviewed changes in accounting policies and practices;
• reviewed the Department’s compliance with legal and regulatory provisions;
• reviewed significant adjustments resulting from the audit; and
• reviewed information on pre-determined objectives to be included in the annual report.
Internal Audit
The Audit Committee has reviewed the performance of the Internal Audit Activity and the adequacy of its resources. The Audit Committee is of the opinion that the Internal Audit Activity is not performing at an optimum level due to capacity constraints.
page 92

Auditor General - South Africa
The Audit Committee did meet with the Auditor General - South Africa during the 2015/2016 financial year to ensure that there were no unresolved issues.
Conclusion
The Audit Committee concurs and accepts the conclusion of the AGSA on the annual financial statements and on the performance information and is of the opinion that the audited financial statements and the performance information be accepted and be read in conjunction with the report of the AGSA.
The Audit Committee wishes to thank the Director-General and the relevant staff of DTPS for their continued commitment to good governance within the Department. Our appreciation is also extended to the finance team for their efforts regarding the preparation of the financial statements for the year under review and to the team from AGSA for the value they continue to add to the Department.
_______________________
Mr William Huma
Chairperson of the Audit Committee
Department of Telecommunications and Postal Services
12 August 2016
page 93

page 94
PART D HUMAN RESOURCE
MANAGEMENT

1. Introduction
The information contained in this part of the annual report has been prescribed by the Minister for the
Public Service and Administration for all Departments in the public service.
2. Overview of Human Resources
The status of Human Resources in the Department.
The Department has an approved structure that is implemented. As on 31 March 2016, the total
establishment for the Department was 333 funded positions, of which 275 positions are filled and 58
are vacant. Of the 58 vacant positions it is envisaged that 18 positions will be filled by 31 May 2016.
Human Resource priorities for the year under review and the impact of these.
• Filling of critical vacant positions, especially SMS positions.
• Verification of Qualifications and Personal Information of employees complete.
Workforce planning and key strategies to attract and recruit a skilled and capable workforce.
• The Department has an approved HR Plan.
• Vacancies were filled according to funds available and prioritized needs.
• Training and development are done in line with the Workplace Skills Plan.
Employee Performance Management.
• The Department has a Performance Management System that is implemented successfully. Quality
Assurance is done by HRD for alignment of Performance Agreements to the Annual Performance
Plan and Business Plans.
• Performance Review documents, bi-annual and annual, are also quality assured for alignment with
the Performance Agreements.
Employee Wellness Programmes.
The Department has engaged the services of a Service Provider to provide Employee Assistance
Programmes. The Department subscribes to the National Calendar of Events. During this period there
was a 2.2% utilization of the Program.
Achievements and Challenges.
Achievements
• Priority positions filled.
• Appointment of the CFO and 2 Deputy Director-General’s.
• 8 Policies reviewed and approved.
• EE Plan was filed with Department of Labour.
• The Department on 31 March 2016 has a 57% female representation.
• HR Plan compiled and submitted.
page 95
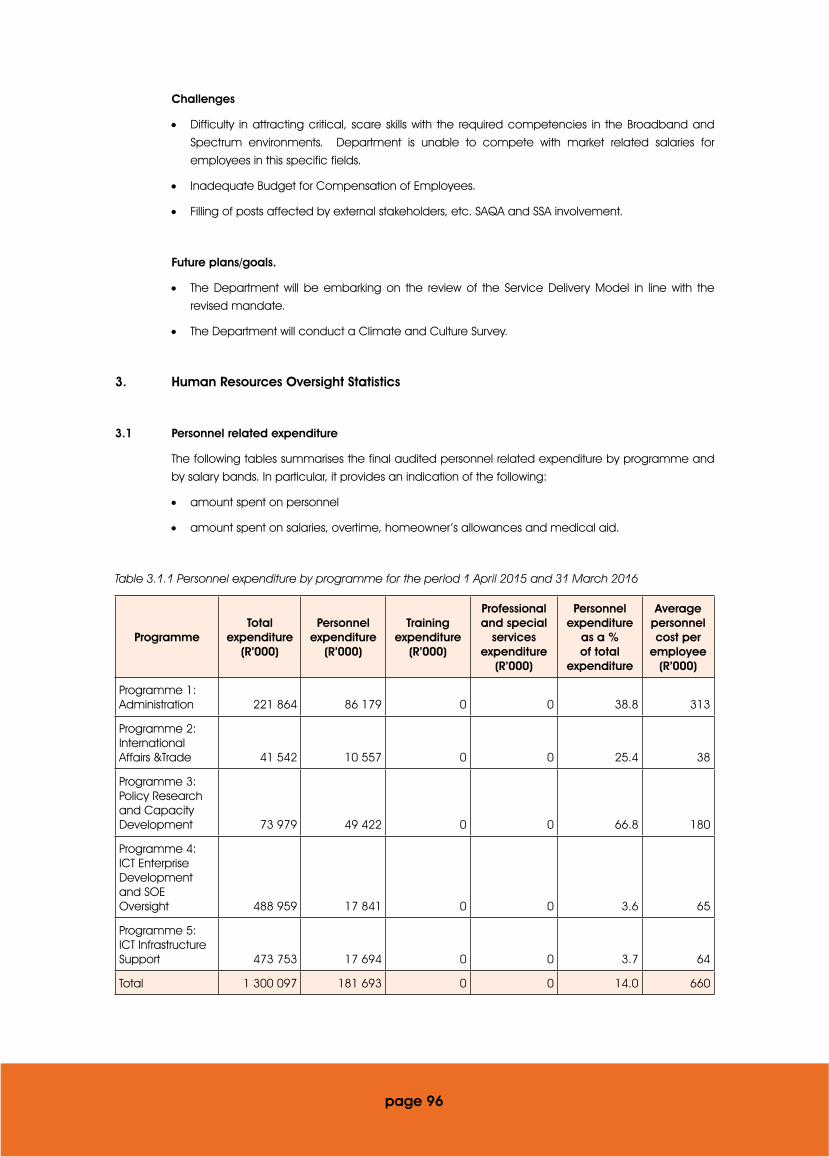
Challenges
• Difficulty in attracting critical, scare skills with the required competencies in the Broadband and
Spectrum environments. Department is unable to compete with market related salaries for
employees in this specific fields.
• Inadequate Budget for Compensation of Employees.
• Filling of posts affected by external stakeholders, etc. SAQA and SSA involvement.
Future plans/goals.
• The Department will be embarking on the review of the Service Delivery Model in line with the
revised mandate.
• The Department will conduct a Climate and Culture Survey.
3. Human Resources Oversight Statistics
3.1 Personnel related expenditure
The following tables summarises the final audited personnel related expenditure by programme and
by salary bands. In particular, it provides an indication of the following:
• amount spent on personnel
• amount spent on salaries, overtime, homeowner’s allowances and medical aid.
Table 3.1.1 Personnel expenditure by programme for the period 1 April 2015 and 31 March 2016
ProgrammeTotal
expenditure (R’000)
Personnel expenditure
(R’000)
Training expenditure
(R’000)
Professional and special
services expenditure
(R’000)
Personnel expenditure
as a % of total
expenditure
Average personnel cost per
employee (R’000)
Programme 1: Administration 221 864 86 179 0 0 38.8 313
Programme 2: International Affairs &Trade 41 542 10 557 0 0 25.4 38
Programme 3: Policy Research and Capacity Development 73 979 49 422 0 0 66.8 180
Programme 4: ICT Enterprise Development and SOE Oversight 488 959 17 841 0 0 3.6 65
Programme 5: ICT Infrastructure Support 473 753 17 694 0 0 3.7 64
Total 1 300 097 181 693 0 0 14.0 660
page 96

Table 3.1.2 Personnel costs by salary band for the period 1 April 2015 and 31 March 2016
Salary bandPersonnel
expenditure (R’000)% of total
personnel costNo. of
employees
Average personnel cost per employee
(R’000)
Lower skilled (Levels 1-2) 0 0 0 0
Skilled (level 3-5) 2 815 1.5 12 235
Highly skilled production (levels 6-8) 25 005 13.8 73 343
Highly skilled supervision (levels 9-12) 57 411 31.6 94 611
Senior and Top management (levels 13-16) 81 459 44.8 81 1 006
Contract (Levels 3-5) 229 0.1 1 229
Contract (Levels 6-8) 895 0.5 3 298
Contract (Levels 9-12) 2 070 1.1 4 518
Contract (Levels 13-16) 10 180 5.6 7 1 454
Abnormal Appointment 1 629 0.9 3 543
Total 181 693 100 278 654
Table 3.1.3 Salaries, Overtime, Home Owners Allowance and Medical Aid by programme for the period 1 April 2015 and 31 March 2016
Programme
Salaries OvertimeHome Owners
AllowanceMedical Aid
Amount (R’000
Salaries as a % of personnel
costs
Amount (R’000)
Overtime as a % of personnel
costs
Amount (R’000)
HOA as a % of
personnel costs
Amount (R’000)
Medical aid as a % of
personnel costs
Programme 1: Administration 72 398 84 391 0.5 1 433 1.6 2 144 2.5
Programme 2: International Affairs &Trade 8 202 77.7 11 0.1 254 2.4 264 2.5
Programme 3: Policy Research and Capacity Development 34 132 69.1 34 0.1 735 1.5 969 2
Programme 4: ICT Enterprise Development and SOE Oversight 14 617 81.9 2 0 142 0.8 335 1.9
Programme 5: ICT Infrastructure Support 14 887 84.1 2 0 179 1 380 2
Total 144 236 79.4 440 0.2 2 743 1.5 4 092 2.3
page 97

Table 3.1.4 Salaries, Overtime, Home Owners Allowance and Medical Aid by salary band for the period 1 April 2015 and 31 March 2016
Salary band
SalariesOvertime Home Owners
AllowanceMedical Aid
Amount (R’000
Salaries as a % of personnel
costs
Amount (R’000)
Overtime as a % of personnel
costs
Amount (R’000)
HOA as a % of
personnel costs
Amount (R’000)
Medical aid as a % of
personnel costs
Skilled (level 1-2) 0 0 0 0 0 0 0 0
Skilled (level 3-5) 1 866 66.3 1 0 170 6 238 8.4
Highly skilled production (levels 6-8) 17 694 70.8 256 1 893 3.6 1 159 4.6
Highly skilled supervision (levels 9-12 45 098 78.6 178 0.3 778 1.4 1 451 2.5
Senior man-agement (lev-el 13-16) 68 241 83.8 0 0 858 1.1 1 098 1.3
Contract (Levels 3-5) 179 78.2 0 0 14 6.1 9 3.9
Contract (Levels 6-8) 651 72.7 0 0 27 3 51 5.7
Contract (Levels 9-12) 1 585 76.6 6 0.3 4 0.2 3 0.1
Contract (Levels 13-16) 8 922 87.6 0 0 0 0 81 0.8
Total 144 236 80.1 441 0.2 2 744 1.5 4 090 2.3
3.2 Employment and Vacancies
The tables in this section summarise the position with regard to employment and vacancies.
The following tables summarise the number of posts on the establishment, the number of employees,
the vacancy rate, and whether there are any staff that are additional to the establishment.
This information is presented in terms of three key variables:
• programme
• salary band
• critical occupations (see definition in notes below).
Departments have identified critical occupations that need to be monitored. In terms of current
regulations, it is possible to create a post on the establishment that can be occupied by more than
one employee. Therefore, the vacancy rate reflects the percentage of posts that are not filled.
page 98
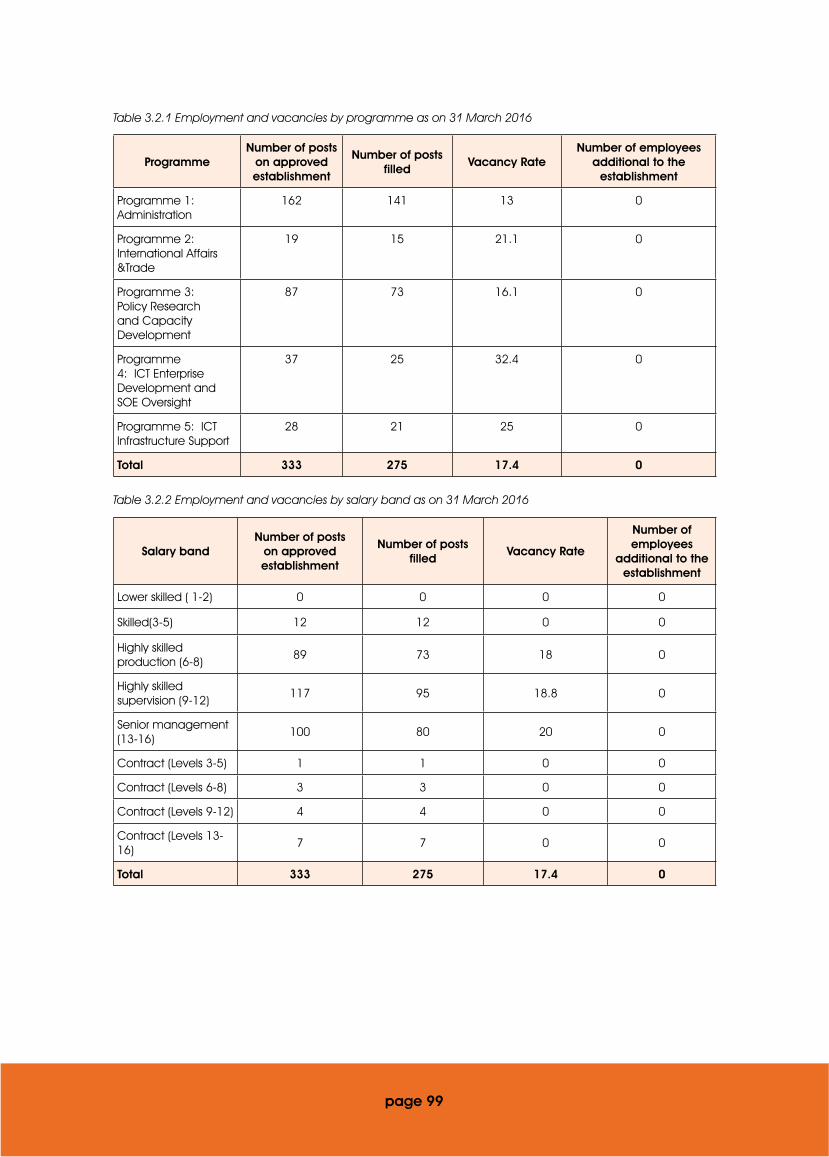
Table 3.2.1 Employment and vacancies by programme as on 31 March 2016
ProgrammeNumber of posts
on approved establishment
Number of posts filled
Vacancy RateNumber of employees
additional to the establishment
Programme 1: Administration
162 141 13 0
Programme 2: International Affairs &Trade
19 15 21.1 0
Programme 3: Policy Research and Capacity Development
87 73 16.1 0
Programme 4: ICT Enterprise Development and SOE Oversight
37 25 32.4 0
Programme 5: ICT Infrastructure Support
28 21 25 0
Total 333 275 17.4 0
Table 3.2.2 Employment and vacancies by salary band as on 31 March 2016
Salary bandNumber of posts
on approved establishment
Number of posts filled
Vacancy Rate
Number of employees
additional to the establishment
Lower skilled ( 1-2) 0 0 0 0
Skilled(3-5) 12 12 0 0
Highly skilled production (6-8)
89 73 18 0
Highly skilled supervision (9-12)
117 95 18.8 0
Senior management (13-16)
100 80 20 0
Contract (Levels 3-5) 1 1 0 0
Contract (Levels 6-8) 3 3 0 0
Contract (Levels 9-12) 4 4 0 0
Contract (Levels 13-16)
7 7 0 0
Total 333 275 17.4 0
page 99

Table 3.2.3 Employment and vacancies by critical occupations as on 31 March 2016
Critical occupationNumber of posts
on approved establishment
Number of posts filled
Vacancy Rate
Number of employees
additional to the establishment
Administrative Related 74 57 23 0
Communication and Information Related 5 4 20 0
Finance and Economics Related 3 2 33.3 0
Financial and Related Professionals 10 8 20 0
Human Resources and Organisational Development 7 7 0 0
Human Resources Related 8 7 12.5 0
Information Technology Related 4 4 0 0
Language Practitioners Interpreters and Other Communication Related 5 5 0 0
Library Mail and Related Clerks 8 8 0 0
Logistical Support Personnel 16 13 18.8 0
Messengers, Porters and Deliverers 3 3 0 0
Other Administrative and Related Clerks and Organisers 54 50 7.4 0
Other Information Technology Personnel 7 6 14.3 0
Other occupations 2 2 0 0
Risk Management and Security Services 1 1 0 0
Secretaries and Other Keyboard Operating Clerks 29 22 24.1 0
Senior Management 97 76 21.6 0
Total 333 275 17.4 0
page 100

3.3 Filling of SMS Posts
The tables in this section provide information on employment and vacancies as it relates to members
of the Senior Management Service by salary level. It also provides information on advertising and filling
of SMS posts, reasons for not complying with prescribed timeframes and disciplinary steps taken.
Table 3.3.1 SMS post information as on 31 March 2016
SMS LevelTotal number of funded SMS
posts
Total number of SMS posts filled
% of SMS posts filled
Total number of SMS posts
vacant
% of SMS posts vacant
Salary Level 16 (Include DG, Minister, Deputy Minister and Special Advisors) 5 5 100 0 0
Salary Level 15 6 3 50 3 50
Salary Level 14 29 25 86.2 4 13.8
Salary Level 13 67 54 80.6 13 19.4
Total 107 87 81.3 20 18.7
Table 3.3.2 SMS post information as on 30 September 2015
SMS LevelTotal number of funded SMS
posts
Total number of SMS posts filled
% of SMS posts filled
Total number of SMS posts
vacant
% of SMS posts vacant
Salary Level 16 (Include DG, Minister, Deputy Minister and Special Advisors) 5 5 100 0 0
Salary Level 15 6 2 33.3 4 66.7
Salary Level 14 29 23 79.3 6 20.7
Salary Level 13 64 58 90.6 6 9.4
Total 104 88 84.6 16 15.4
Table 3.3.3 Advertising and filling of SMS posts for the period 1 April 2015 and 31 March 2016
SMS Level Advertising Filling of posts
Number of vacancies per level advertised in 6 months of becoming
vacant (FUNDED PRIORITIZED POSTS ADVERTISED DURING
THIS PERIOD)
Number of vacancies per level filled in 6 months of
becoming funded
Number of vacancies per level not filled in 6 months
but filled in 12 months
Salary Level 16 (Include DG, Minister, Deputy Minister and Special Advisors) 0 0 0
page 101
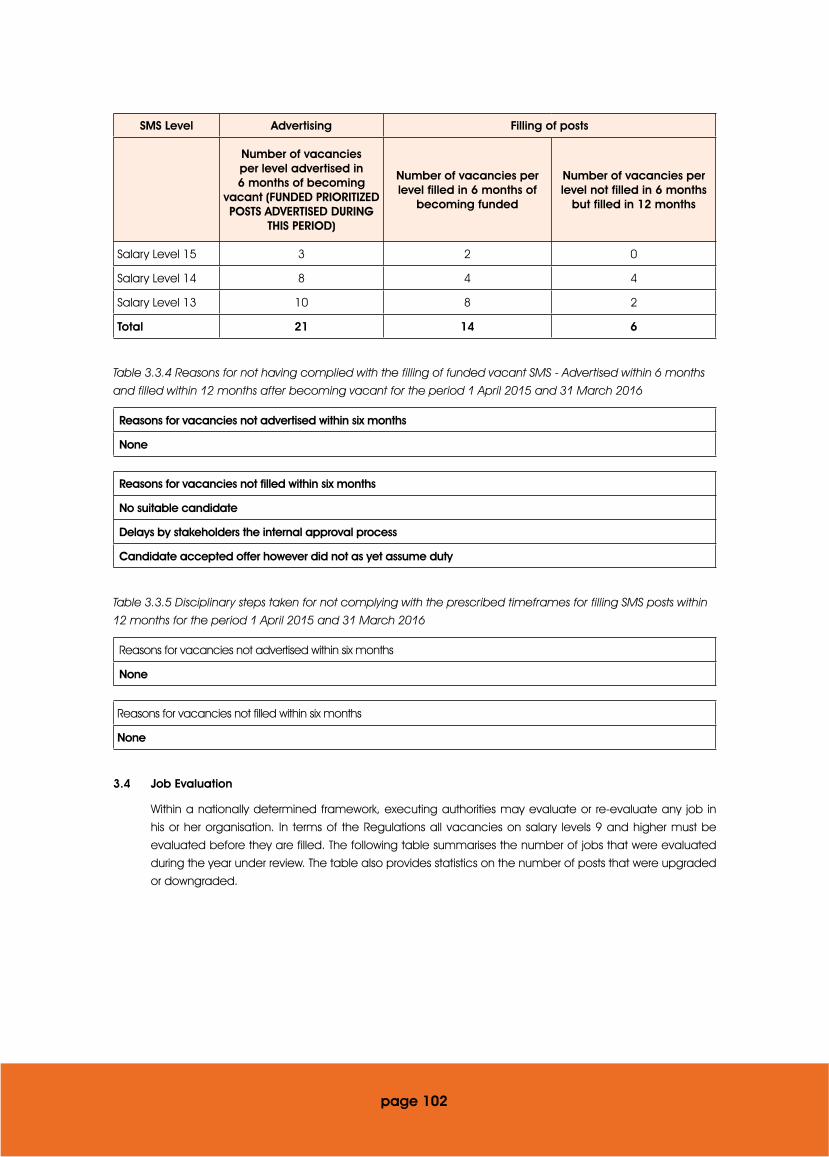
SMS Level Advertising Filling of posts
Number of vacancies per level advertised in 6 months of becoming
vacant (FUNDED PRIORITIZED POSTS ADVERTISED DURING
THIS PERIOD)
Number of vacancies per level filled in 6 months of
becoming funded
Number of vacancies per level not filled in 6 months
but filled in 12 months
Salary Level 15 3 2 0
Salary Level 14 8 4 4
Salary Level 13 10 8 2
Total 21 14 6
Table 3.3.4 Reasons for not having complied with the filling of funded vacant SMS - Advertised within 6 months and filled within 12 months after becoming vacant for the period 1 April 2015 and 31 March 2016
Reasons for vacancies not advertised within six months
None
Reasons for vacancies not filled within six months
No suitable candidate
Delays by stakeholders the internal approval process
Candidate accepted offer however did not as yet assume duty
Table 3.3.5 Disciplinary steps taken for not complying with the prescribed timeframes for filling SMS posts within 12 months for the period 1 April 2015 and 31 March 2016
Reasons for vacancies not advertised within six months
None
Reasons for vacancies not filled within six months
None
3.4 Job Evaluation
Within a nationally determined framework, executing authorities may evaluate or re-evaluate any job in
his or her organisation. In terms of the Regulations all vacancies on salary levels 9 and higher must be
evaluated before they are filled. The following table summarises the number of jobs that were evaluated
during the year under review. The table also provides statistics on the number of posts that were upgraded
or downgraded.
page 102

Table 3.4.1 Job Evaluation by Salary band for the period 1 April 2015 and 31 March 2016
Salary band
Number of posts on
approved establish-
ment
Number of Jobs
Evaluated
% of posts evaluated by salary
bands
Posts Upgraded Posts downgraded
Number% of posts evaluated
Number% of posts evaluated
Lower Skilled (Levels1-2) 0 0 0 0 0 0 0
Skilled (Levels 3-5) 12 4 33.3 0 0 0 0
Highly skilled production (Levels 6-8) 89 0 0 0 0 0 0
Highly skilled supervision(Levels 9-12) 117 54 46.2 21 38.9 0 0
Senior Management Service Band A 63 0 0 0 0 0 0
Senior Management Service Band B 29 0 0 0 0 0 0
Senior Management Service Band C 6 0 0 0 0 0 0
Senior Management Service Band D (Include DG, Minister, Deputy Minister and Special Advisors) 2 0 0 0 0 0 0
Contract (Levels 3-5) 1 0 0 0 0 0 0
Contract (Levels 6-8) 3 0 0 0 0 0 0
Contract (Levels 9-12) 4 0 0 0 0 0 0
Contact (Band A) 4 0 0 0 0 0 0
Contract (Band D) (Include DG, Minister, Deputy Minister and Special Advisors) 3 0 0 0 0 0 0
Total 333 58 17.4 21 36.2 0 0
The following table provides a summary of the number of employees whose positions were upgraded due to
their post being upgraded. The number of employees might differ from the number of posts upgraded since not
all employees are automatically absorbed into the new posts and some of the posts upgraded could also be
vacant.
page 103

Table 3.4.2 Profile of employees whose positions were upgraded due to their posts being upgraded for the period 1 April 2015 and 31 March 2016
Gender African Asian Coloured White Total
Female 10 0 0 0 10
Male 10 0 0 1 11
Total 20 0 0 1 21
Employees with a disability 1
The following table summarises the number of cases where remuneration bands exceeded the grade determined
by job evaluation. Reasons for the deviation are provided in each case.
Table 3.4.3 Employees with salary levels higher than those determined by job evaluation by occupation for the period 1 April 2015 and 31 March 2016
Total number of Employees whose salaries exceeded the grades determine by job evaluation
None
The following table summarises the beneficiaries of the above in terms of race, gender, and disability.
Table 3.4.4 Profile of employees who have salary levels higher than those determined by job evaluation for the period 1 April 2015 and 31 March 2016
Total number of Employees whose salaries exceeded the grades determine by job evaluation
None
3.5 Employment Changes
This section provides information on changes in employment over the financial year. Turnover rates
provide an indication of trends in the employment profile of the Department. The following tables
provide a summary of turnover rates by salary band and critical occupations (see definition in notes
below).
Table 3.5.1 Annual turnover rates by salary band for the period 1 April 2015 and 31 March 2016
Salary band
Number of employees at beginning of period-1 April
2015
Appointments and transfers into the Department
Terminations and transfers out of
the DepartmentTurnover rate
Lower skilled ( Levels 1-2) 0 0 0 0
Skilled (Levels3-5) 14 0 2 14.3
Highly skilled production (Levels 6-8) 79 5 11 14
Highly skilled supervision (Levels 9-12) 105 1 13 12.4
Senior Management Service Bands A 58 9 8 13.8
page 104
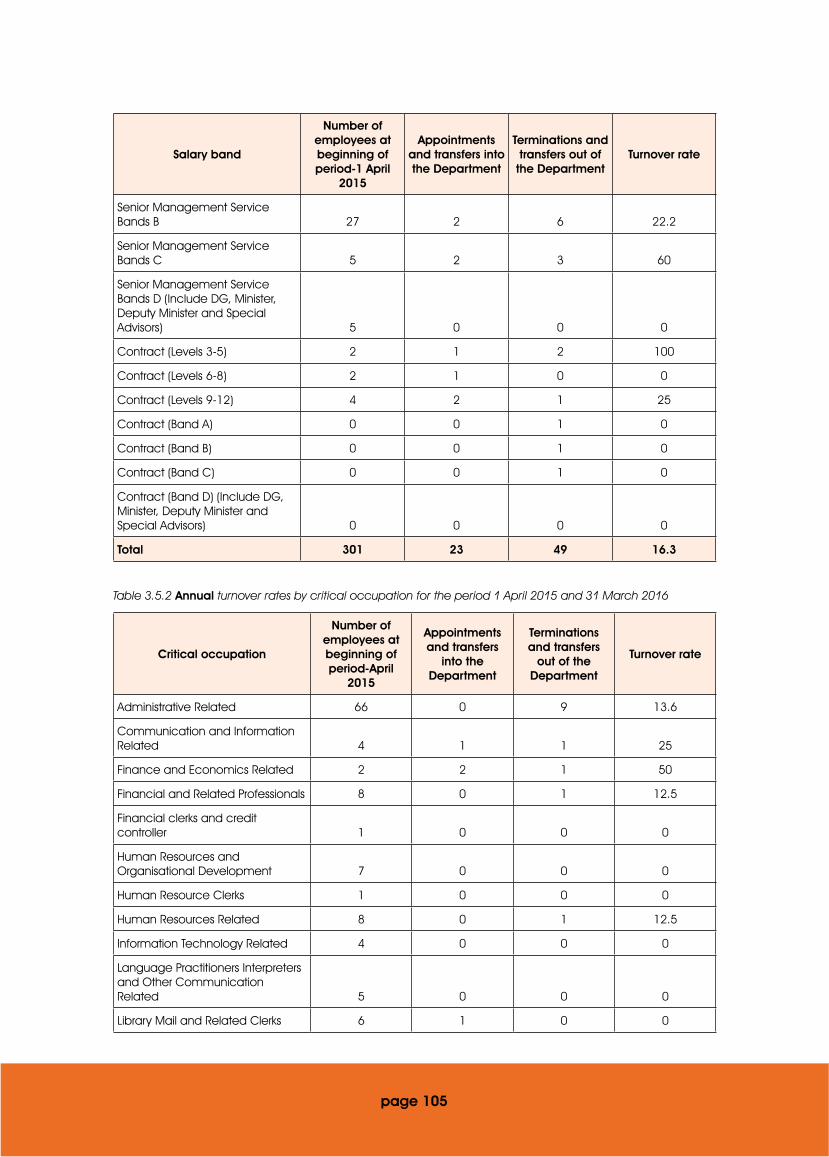
Salary band
Number of employees at beginning of period-1 April
2015
Appointments and transfers into the Department
Terminations and transfers out of
the DepartmentTurnover rate
Senior Management Service Bands B 27 2 6 22.2
Senior Management Service Bands C 5 2 3 60
Senior Management Service Bands D (Include DG, Minister, Deputy Minister and Special Advisors) 5 0 0 0
Contract (Levels 3-5) 2 1 2 100
Contract (Levels 6-8) 2 1 0 0
Contract (Levels 9-12) 4 2 1 25
Contract (Band A) 0 0 1 0
Contract (Band B) 0 0 1 0
Contract (Band C) 0 0 1 0
Contract (Band D) (Include DG, Minister, Deputy Minister and Special Advisors) 0 0 0 0
Total 301 23 49 16.3
Table 3.5.2 Annual turnover rates by critical occupation for the period 1 April 2015 and 31 March 2016
Critical occupation
Number of employees at beginning of period-April
2015
Appointments and transfers
into the Department
Terminations and transfers
out of the Department
Turnover rate
Administrative Related 66 0 9 13.6
Communication and Information Related 4 1 1 25
Finance and Economics Related 2 2 1 50
Financial and Related Professionals 8 0 1 12.5
Financial clerks and credit controller 1 0 0 0
Human Resources and Organisational Development 7 0 0 0
Human Resource Clerks 1 0 0 0
Human Resources Related 8 0 1 12.5
Information Technology Related 4 0 0 0
Language Practitioners Interpreters and Other Communication Related 5 0 0 0
Library Mail and Related Clerks 6 1 0 0
page 105
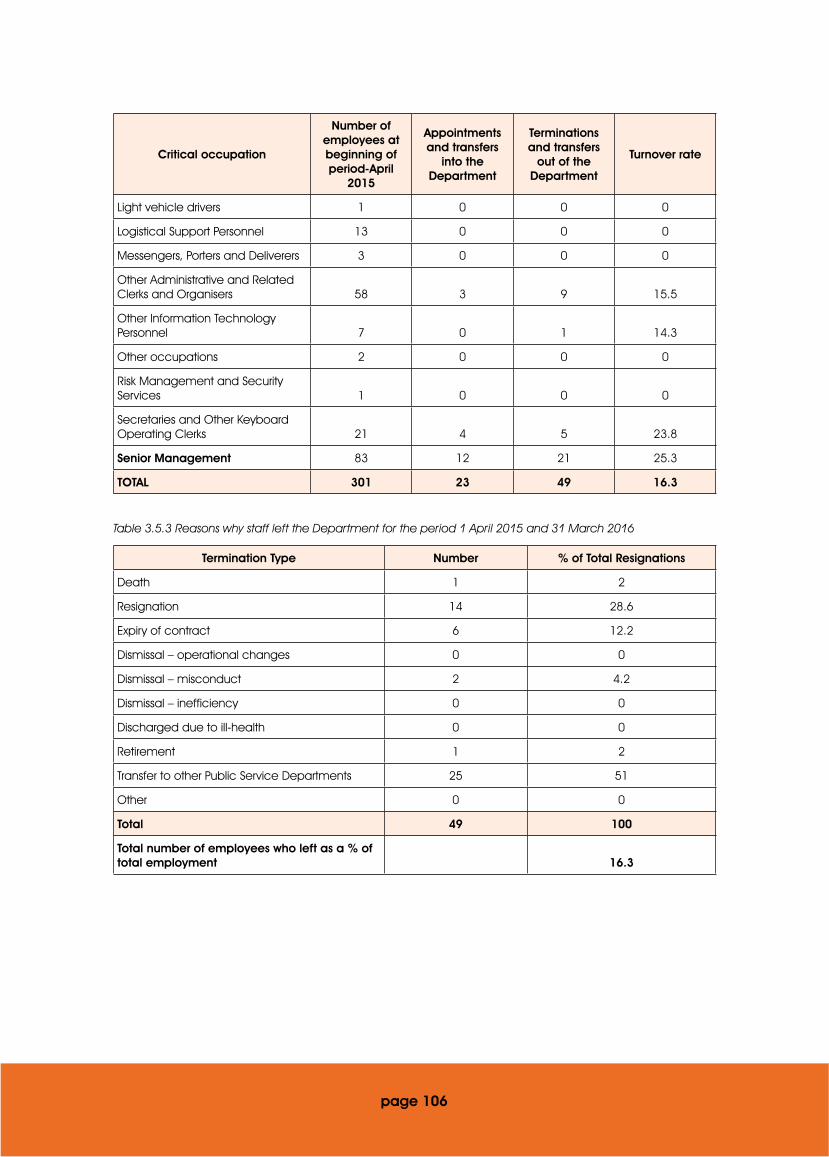
Critical occupation
Number of employees at beginning of period-April
2015
Appointments and transfers
into the Department
Terminations and transfers
out of the Department
Turnover rate
Light vehicle drivers 1 0 0 0
Logistical Support Personnel 13 0 0 0
Messengers, Porters and Deliverers 3 0 0 0
Other Administrative and Related Clerks and Organisers 58 3 9 15.5
Other Information Technology Personnel 7 0 1 14.3
Other occupations 2 0 0 0
Risk Management and Security Services 1 0 0 0
Secretaries and Other Keyboard Operating Clerks 21 4 5 23.8
Senior Management 83 12 21 25.3
TOTAL 301 23 49 16.3
Table 3.5.3 Reasons why staff left the Department for the period 1 April 2015 and 31 March 2016
Termination Type Number % of Total Resignations
Death 1 2
Resignation 14 28.6
Expiry of contract 6 12.2
Dismissal – operational changes 0 0
Dismissal – misconduct 2 4.2
Dismissal – inefficiency 0 0
Discharged due to ill-health 0 0
Retirement 1 2
Transfer to other Public Service Departments 25 51
Other 0 0
Total 49 100
Total number of employees who left as a % of total employment 16.3
page 106
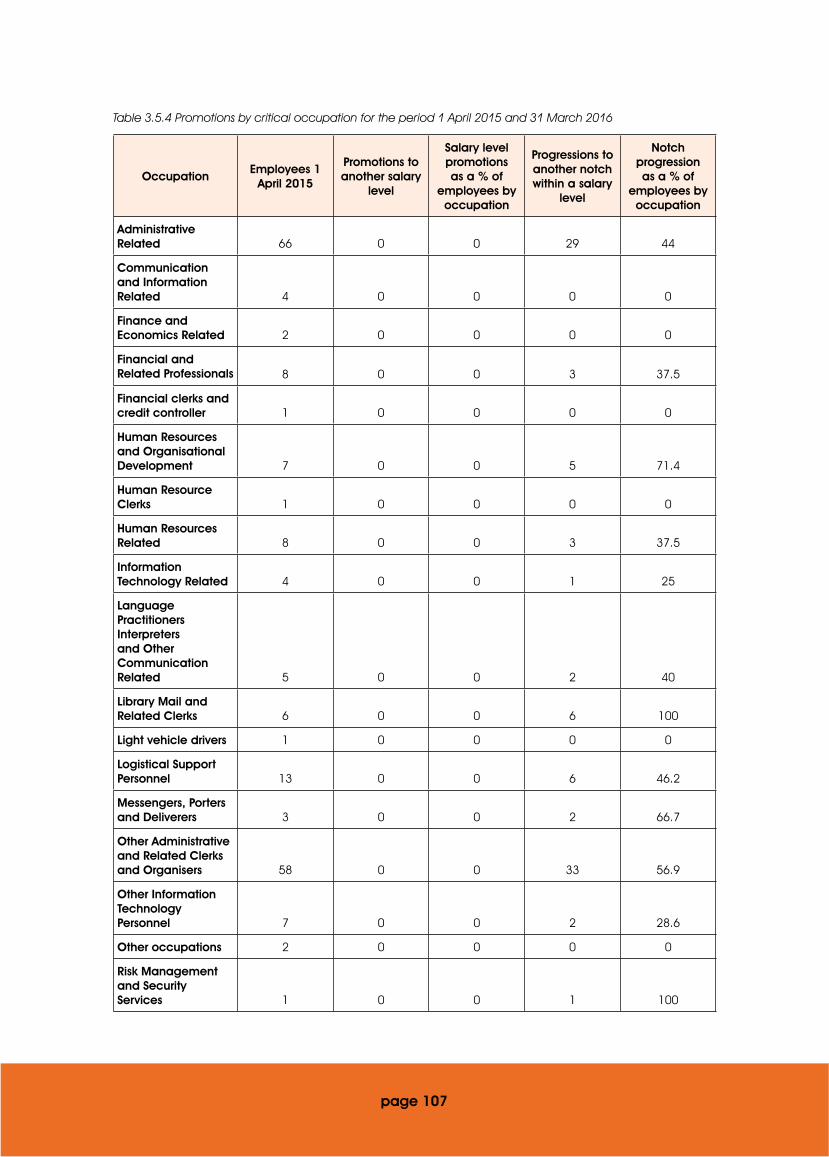
Table 3.5.4 Promotions by critical occupation for the period 1 April 2015 and 31 March 2016
OccupationEmployees 1
April 2015
Promotions to another salary
level
Salary level promotions as a % of
employees by occupation
Progressions to another notch within a salary
level
Notch progression as a % of
employees by occupation
Administrative Related 66 0 0 29 44
Communication and Information Related 4 0 0 0 0
Finance and Economics Related 2 0 0 0 0
Financial and Related Professionals 8 0 0 3 37.5
Financial clerks and credit controller 1 0 0 0 0
Human Resources and Organisational Development 7 0 0 5 71.4
Human Resource Clerks 1 0 0 0 0
Human Resources Related 8 0 0 3 37.5
Information Technology Related 4 0 0 1 25
Language Practitioners Interpreters and Other Communication Related 5 0 0 2 40
Library Mail and Related Clerks 6 0 0 6 100
Light vehicle drivers 1 0 0 0 0
Logistical Support Personnel 13 0 0 6 46.2
Messengers, Porters and Deliverers 3 0 0 2 66.7
Other Administrative and Related Clerks and Organisers 58 0 0 33 56.9
Other Information Technology Personnel 7 0 0 2 28.6
Other occupations 2 0 0 0 0
Risk Management and Security Services 1 0 0 1 100
page 107

OccupationEmployees 1
April 2015
Promotions to another salary
level
Salary level promotions as a % of
employees by occupation
Progressions to another notch within a salary
level
Notch progression as a % of
employees by occupation
Secretaries and Other Keyboard Operating Clerks 21 0 0 16 76.2
Senior Management 83 3 3.6 2 2.4
TOTAL 301 3 1 111 36.9
Table 3.5.5 Promotions by salary band for the period 1 April 2015 and 31 March 2016
Salary BandEmployees 1
April 2015
Promotions to another salary
level
Salary bands promotions as a % of employees by salary level
Progressions to another notch within a salary
level
Notch progression as a % of employees by salary bands
Lower skilled ( Levels 1-2) 0 0 0 0 0
Skilled (Levels3-5) 14 0 0 11 78.6
Highly skilled production (Levels 6-8) 79 0 0 51 64.6
Highly skilled supervision (Levels 9-12) 105 0 0 46 43.8
Senior Management (Level 13-16) (Include DG, Minister, Deputy Minister and Special Advisors) 95 3 3.2 2 2.1
Contract (Levels 3-5) 2 0 0 0 0
Contract (Levels 6-8) 2 0 0 1 50
Contract (Levels 9-12) 4 0 0 0 0
TOTAL 301 3 1 111 36.9
page 108
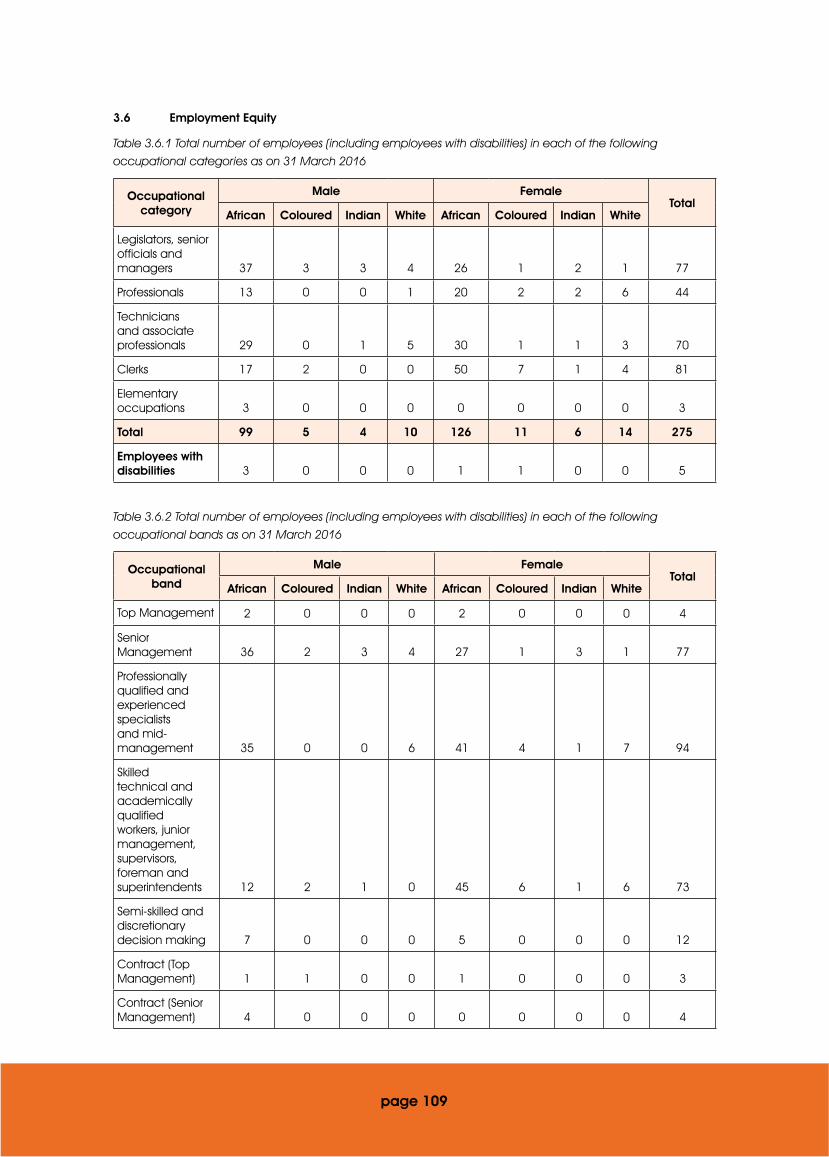
3.6 Employment Equity
Table 3.6.1 Total number of employees (including employees with disabilities) in each of the following occupational categories as on 31 March 2016
Occupational category
Male FemaleTotal
African Coloured Indian White African Coloured Indian White
Legislators, senior officials and managers 37 3 3 4 26 1 2 1 77
Professionals 13 0 0 1 20 2 2 6 44
Technicians and associate professionals 29 0 1 5 30 1 1 3 70
Clerks 17 2 0 0 50 7 1 4 81
Elementary occupations 3 0 0 0 0 0 0 0 3
Total 99 5 4 10 126 11 6 14 275
Employees with disabilities 3 0 0 0 1 1 0 0 5
Table 3.6.2 Total number of employees (including employees with disabilities) in each of the following occupational bands as on 31 March 2016
Occupational band
Male FemaleTotal
African Coloured Indian White African Coloured Indian White
Top Management 2 0 0 0 2 0 0 0 4
Senior Management 36 2 3 4 27 1 3 1 77
Professionally qualified and experienced specialists and mid-management 35 0 0 6 41 4 1 7 94
Skilled technical and academically qualified workers, junior management, supervisors, foreman and superintendents 12 2 1 0 45 6 1 6 73
Semi-skilled and discretionary decision making 7 0 0 0 5 0 0 0 12
Contract (Top Management) 1 1 0 0 1 0 0 0 3
Contract (Senior Management) 4 0 0 0 0 0 0 0 4
page 109

Occupational band
Male FemaleTotal
African Coloured Indian White African Coloured Indian White
Contract (Professionally Qualified) 0 0 0 0 3 0 1 0 4
Contract (Skilled Technical) 2 0 0 0 1 0 0 0 3
Contract (Semi-skilled) 0 0 0 0 1 0 0 0 1
Total 99 5 4 10 126 11 6 14 275
Table 3.6.3 Recruitment for the period 1 April 2015 to 31 March 2016
Occupational band
Male FemaleTotal
African Coloured Indian White African Coloured Indian White
Top Management 0 0 0 0 0 0 0 0 0
Senior Management 8 0 0 0 3 0 1 1 13
Professionally qualified and experienced specialists and mid-management 1 0 0 0 0 0 0 0 1
Skilled technical and academically qualified workers, junior management, supervisors, foreman and superintendents 0 0 0 0 5 0 0 0 5
Semi-skilled and discretionary decision making 0 0 0 0 0 0 0 0 0
Unskilled and defined decision making 0 0 0 0 0 0 0 0 0
Contract (Professionally Qualified) 0 0 0 0 1 0 1 0 2
Contract (Skilled) 1 0 0 0 0 0 0 0 1
Contract (Semi-skilled) 0 0 0 0 1 0 0 0 1
Total 10 0 0 0 10 0 2 1 23
Employees with disabilities 0 0 0 0 0 0 0 0 0
page 110

Table 3.6.4 Promotions for the period 1 April 2015 to 31 March 2016
Occupational bandMale Female
TotalAfrican Coloured Indian White African Coloured Indian White
Top Management 0 0 0 0 0 0 0 0 0
Senior Management 1 0 0 0 2 0 0 0 3
Professionally qualified and experienced specialists and mid-management 0 0 0 0 0 0 0 0 0
Skilled technical and academically qualified workers, junior management, supervisors, foreman and superintendents 0 0 0 0 0 0 0 0 0
Semi-skilled and discretionary decision making 0 0 0 0 0 0 0 0 0
Unskilled and defined decision making 0 0 0 0 0 0 0 0 0
Total 1 0 0 0 2 0 0 0 3
Employees with disabilities 0 0 0 0 0 0 0 0 0
Table 3.6.5 Terminations for the period 1 April 2015 to 31 March 2016
Occupational bandMale Female
TotalAfrican Coloured Indian White African Coloured Indian White
Top Management 0 0 0 0 0 0 0 0 0
Senior Management 9 0 0 1 6 0 1 0 17
Professionally qualified and experienced specialists and mid-management 6 0 0 0 6 0 1 0 13
Skilled technical and academically qualified workers, junior management, supervisors, foreman and superintendents 3 0 0 0 8 0 0 0 11
Semi-skilled and discretionary decision making 0 0 0 0 1 1 0 0 2
Unskilled and defined decision making 0 0 0 0 0 0 0 0 0
Contract (Senior Management) 2 0 0 0 0 0 0 1 3
page 111
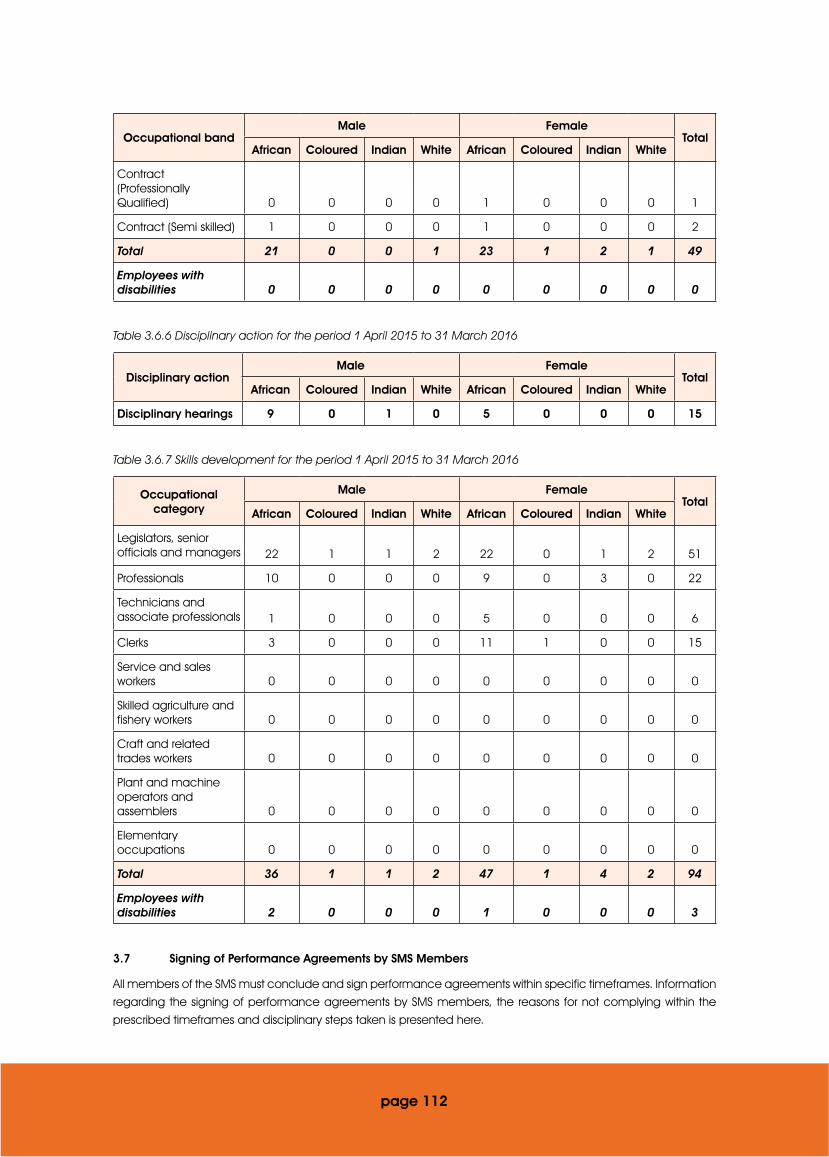
Occupational bandMale Female
TotalAfrican Coloured Indian White African Coloured Indian White
Contract (Professionally Qualified) 0 0 0 0 1 0 0 0 1
Contract (Semi skilled) 1 0 0 0 1 0 0 0 2
Total 21 0 0 1 23 1 2 1 49
Employees with disabilities 0 0 0 0 0 0 0 0 0
Table 3.6.6 Disciplinary action for the period 1 April 2015 to 31 March 2016
Disciplinary actionMale Female
TotalAfrican Coloured Indian White African Coloured Indian White
Disciplinary hearings 9 0 1 0 5 0 0 0 15
Table 3.6.7 Skills development for the period 1 April 2015 to 31 March 2016
Occupational category
Male FemaleTotal
African Coloured Indian White African Coloured Indian White
Legislators, senior officials and managers 22 1 1 2 22 0 1 2 51
Professionals 10 0 0 0 9 0 3 0 22
Technicians and associate professionals 1 0 0 0 5 0 0 0 6
Clerks 3 0 0 0 11 1 0 0 15
Service and sales workers 0 0 0 0 0 0 0 0 0
Skilled agriculture and fishery workers 0 0 0 0 0 0 0 0 0
Craft and related trades workers 0 0 0 0 0 0 0 0 0
Plant and machine operators and assemblers 0 0 0 0 0 0 0 0 0
Elementary occupations 0 0 0 0 0 0 0 0 0
Total 36 1 1 2 47 1 4 2 94
Employees with disabilities 2 0 0 0 1 0 0 0 3
3.7 Signing of Performance Agreements by SMS Members
All members of the SMS must conclude and sign performance agreements within specific timeframes. Information
regarding the signing of performance agreements by SMS members, the reasons for not complying within the
prescribed timeframes and disciplinary steps taken is presented here.
page 112
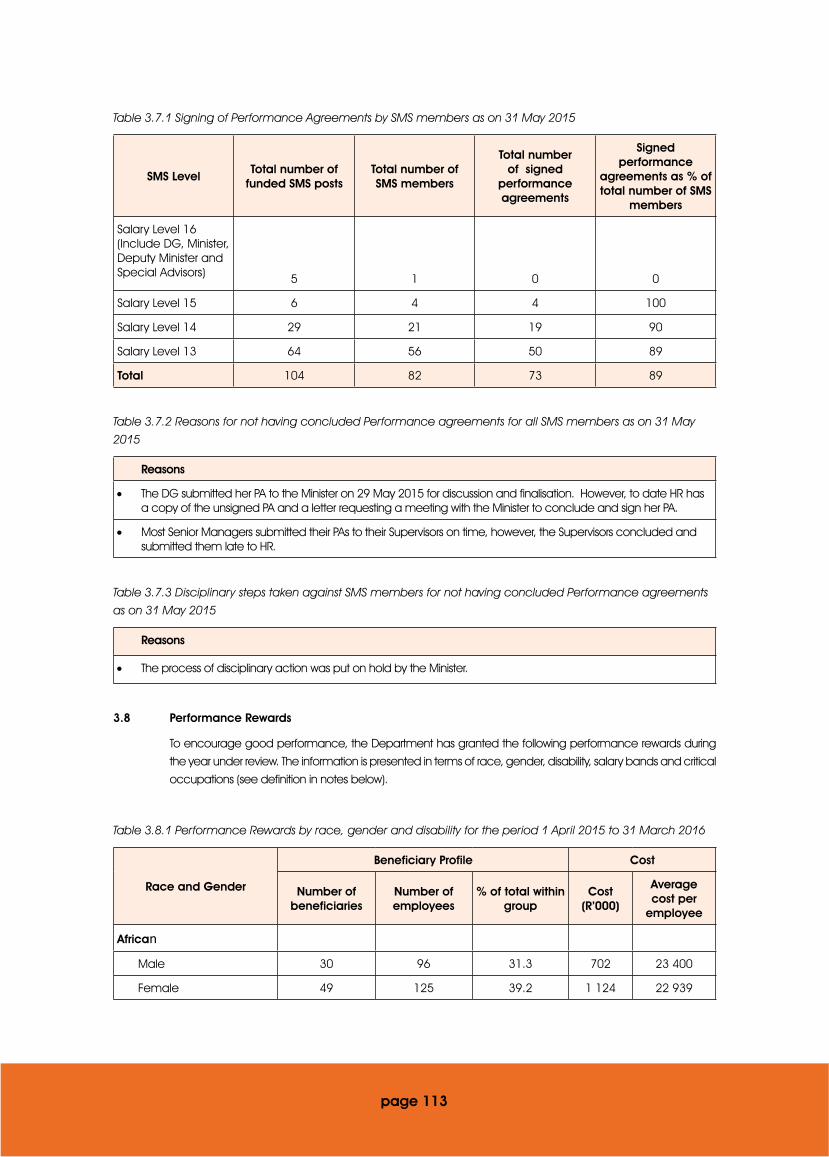
Table 3.7.1 Signing of Performance Agreements by SMS members as on 31 May 2015
SMS LevelTotal number of
funded SMS postsTotal number of SMS members
Total number of signed
performance agreements
Signed performance
agreements as % of total number of SMS
members
Salary Level 16 (Include DG, Minister, Deputy Minister and Special Advisors) 5 1 0 0
Salary Level 15 6 4 4 100
Salary Level 14 29 21 19 90
Salary Level 13 64 56 50 89
Total 104 82 73 89
Table 3.7.2 Reasons for not having concluded Performance agreements for all SMS members as on 31 May 2015
Reasons
• The DG submitted her PA to the Minister on 29 May 2015 for discussion and finalisation. However, to date HR has a copy of the unsigned PA and a letter requesting a meeting with the Minister to conclude and sign her PA.
• Most Senior Managers submitted their PAs to their Supervisors on time, however, the Supervisors concluded and submitted them late to HR.
Table 3.7.3 Disciplinary steps taken against SMS members for not having concluded Performance agreements as on 31 May 2015
Reasons
• The process of disciplinary action was put on hold by the Minister.
3.8 Performance Rewards
To encourage good performance, the Department has granted the following performance rewards during
the year under review. The information is presented in terms of race, gender, disability, salary bands and critical
occupations (see definition in notes below).
Table 3.8.1 Performance Rewards by race, gender and disability for the period 1 April 2015 to 31 March 2016
Race and Gender
Beneficiary Profile Cost
Number of beneficiaries
Number of employees
% of total within group
Cost (R’000)
Average cost per
employee
African
Male 30 96 31.3 702 23 400
Female 49 125 39.2 1 124 22 939
page 113
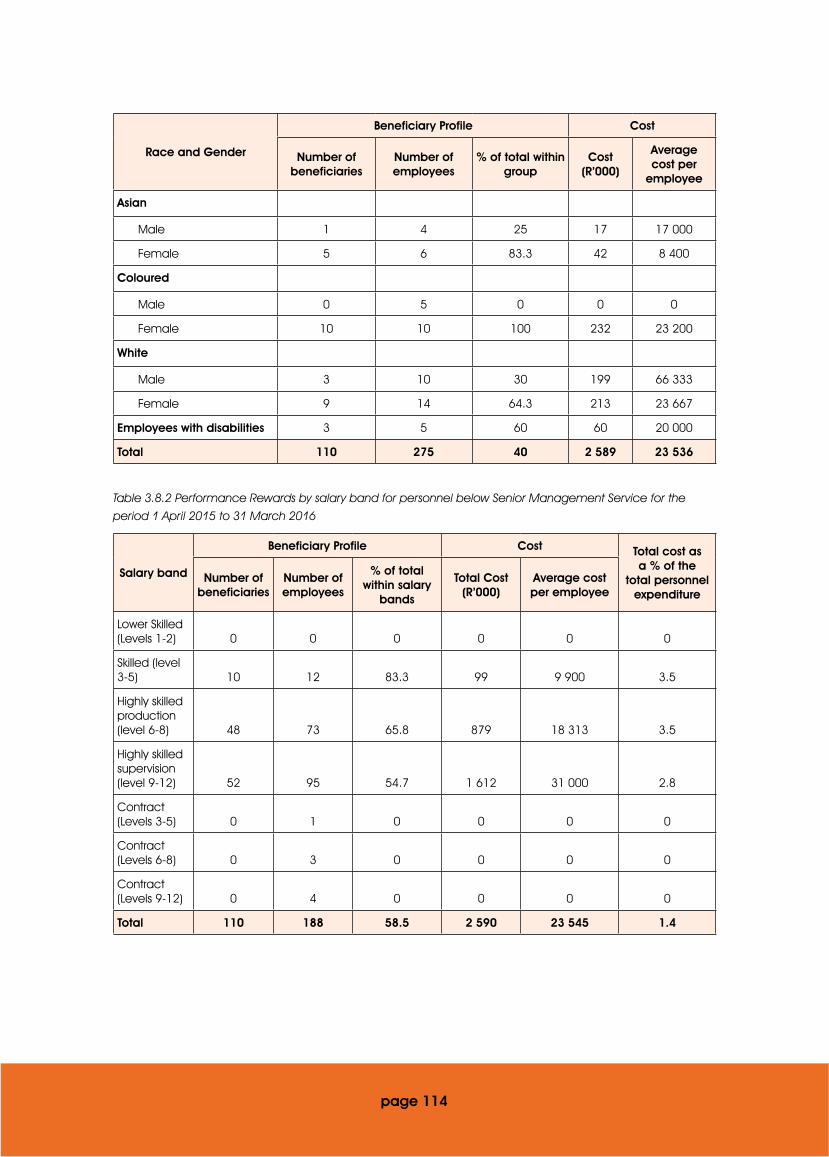
Race and Gender
Beneficiary Profile Cost
Number of beneficiaries
Number of employees
% of total within group
Cost (R’000)
Average cost per
employee
Asian
Male 1 4 25 17 17 000
Female 5 6 83.3 42 8 400
Coloured
Male 0 5 0 0 0
Female 10 10 100 232 23 200
White
Male 3 10 30 199 66 333
Female 9 14 64.3 213 23 667
Employees with disabilities 3 5 60 60 20 000
Total 110 275 40 2 589 23 536
Table 3.8.2 Performance Rewards by salary band for personnel below Senior Management Service for the period 1 April 2015 to 31 March 2016
Salary band
Beneficiary Profile Cost Total cost as a % of the
total personnel expenditure
Number of beneficiaries
Number of employees
% of total within salary
bands
Total Cost (R’000)
Average cost per employee
Lower Skilled (Levels 1-2) 0 0 0 0 0 0
Skilled (level 3-5) 10 12 83.3 99 9 900 3.5
Highly skilled production (level 6-8) 48 73 65.8 879 18 313 3.5
Highly skilled supervision (level 9-12) 52 95 54.7 1 612 31 000 2.8
Contract (Levels 3-5) 0 1 0 0 0 0
Contract (Levels 6-8) 0 3 0 0 0 0
Contract (Levels 9-12) 0 4 0 0 0 0
Total 110 188 58.5 2 590 23 545 1.4
page 114
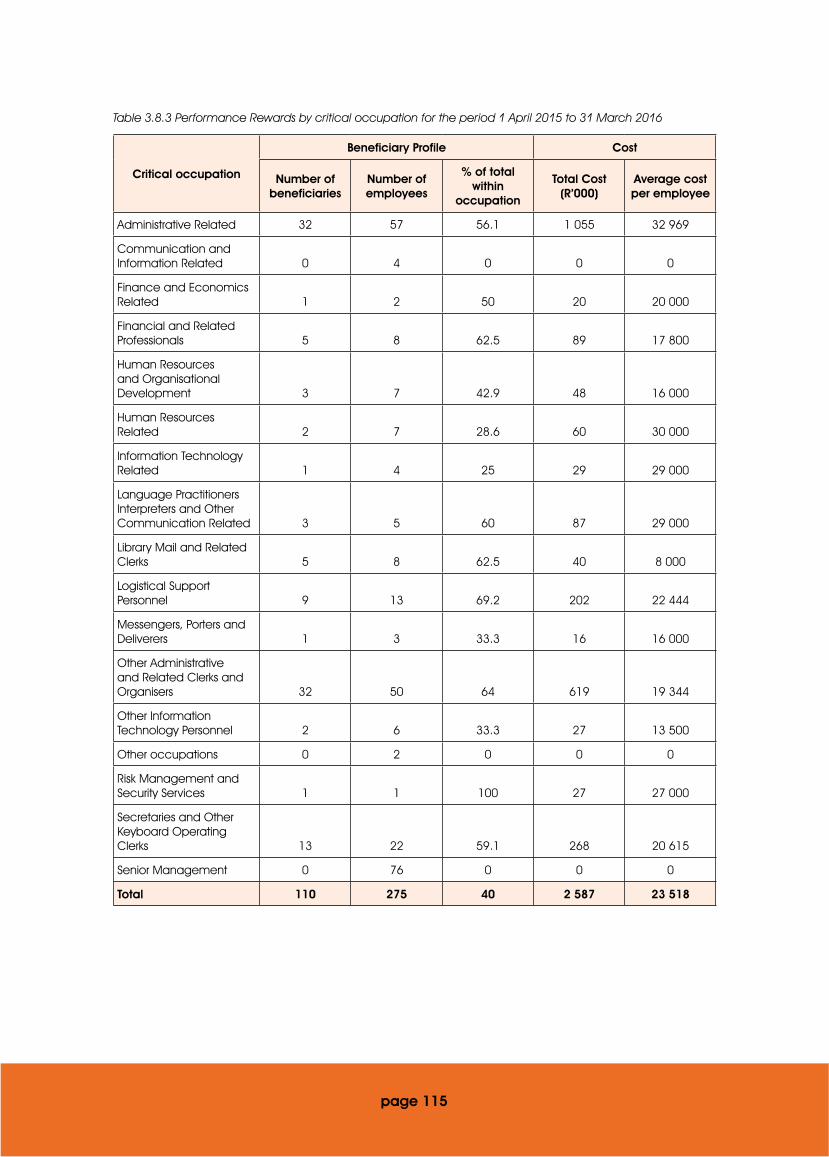
Table 3.8.3 Performance Rewards by critical occupation for the period 1 April 2015 to 31 March 2016
Critical occupation
Beneficiary Profile Cost
Number of beneficiaries
Number of employees
% of total within
occupation
Total Cost (R’000)
Average cost per employee
Administrative Related 32 57 56.1 1 055 32 969
Communication and Information Related 0 4 0 0 0
Finance and Economics Related 1 2 50 20 20 000
Financial and Related Professionals 5 8 62.5 89 17 800
Human Resources and Organisational Development 3 7 42.9 48 16 000
Human Resources Related 2 7 28.6 60 30 000
Information Technology Related 1 4 25 29 29 000
Language Practitioners Interpreters and Other Communication Related 3 5 60 87 29 000
Library Mail and Related Clerks 5 8 62.5 40 8 000
Logistical Support Personnel 9 13 69.2 202 22 444
Messengers, Porters and Deliverers 1 3 33.3 16 16 000
Other Administrative and Related Clerks and Organisers 32 50 64 619 19 344
Other Information Technology Personnel 2 6 33.3 27 13 500
Other occupations 0 2 0 0 0
Risk Management and Security Services 1 1 100 27 27 000
Secretaries and Other Keyboard Operating Clerks 13 22 59.1 268 20 615
Senior Management 0 76 0 0 0
Total 110 275 40 2 587 23 518
page 115

Table 3.8.4 Performance related rewards (cash bonus), by salary band for Senior Management Service for the period 1 April 2015 to 31 March 2016
Salary band
Beneficiary Profile Cost Total cost as a % of the
total personnel expenditure
Number of beneficiaries
Number of employees
% of total within salary
bands
Total Cost (R’000)
Average cost per employee
Band A 0 54 0 0 0 0
Band B 0 25 0 0 0 0
Band C 0 3 0 0 0 0
Band D(Include DG, Minister, Deputy Minister and Special Advisors) 0 5 0 0 0 0
Total 0 87 0 0 0 0
3.9 Foreign Workers
The tables below summarise the employment of foreign nationals in the Department in terms of salary band and major occupation.
Table 3.9.1 Foreign workers by salary band for the period 1 April 2015 and 31 March 2016
Salary band01 April 2015 31 March 2016 Change
Number % of total Number % of total Number % Change
None
Table 3.9.2 Foreign workers by major occupation for the period 1 April 2015 and 31 March 2016
Major occupation
01 April 2015 31 March 2016 Change
Number % of total Number % of total Number % Change
None
3.10 Leave utilisation
The Public Service Commission identified the need for careful monitoring of sick leave within the public service. The following tables provide an indication of the use of sick leave and disability leave. In both cases, the estimated cost of the leave is also provided.
page 116
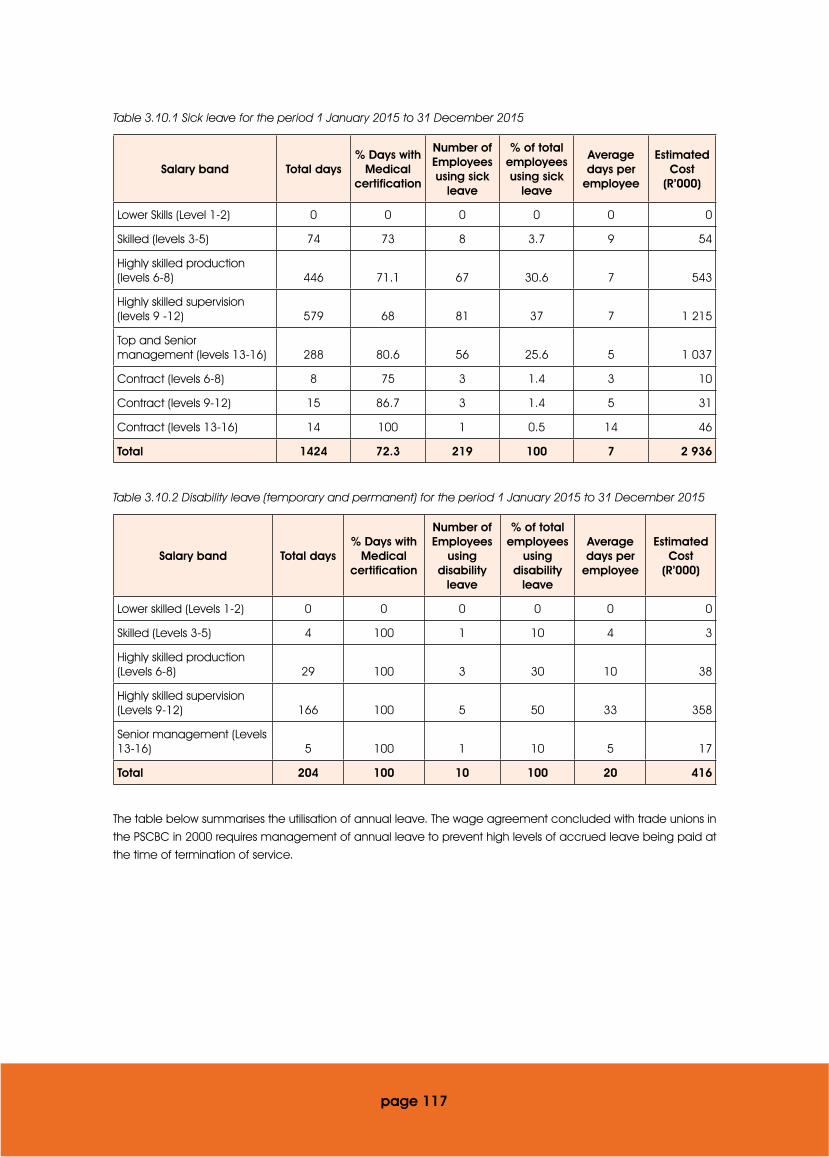
Table 3.10.1 Sick leave for the period 1 January 2015 to 31 December 2015
Salary band Total days% Days with
Medical certification
Number of Employees using sick
leave
% of total employees using sick
leave
Average days per
employee
Estimated Cost
(R’000)
Lower Skills (Level 1-2) 0 0 0 0 0 0
Skilled (levels 3-5) 74 73 8 3.7 9 54
Highly skilled production (levels 6-8) 446 71.1 67 30.6 7 543
Highly skilled supervision (levels 9 -12) 579 68 81 37 7 1 215
Top and Senior management (levels 13-16) 288 80.6 56 25.6 5 1 037
Contract (levels 6-8) 8 75 3 1.4 3 10
Contract (levels 9-12) 15 86.7 3 1.4 5 31
Contract (levels 13-16) 14 100 1 0.5 14 46
Total 1424 72.3 219 100 7 2 936
Table 3.10.2 Disability leave (temporary and permanent) for the period 1 January 2015 to 31 December 2015
Salary band Total days% Days with
Medical certification
Number of Employees
using disability
leave
% of total employees
using disability
leave
Average days per
employee
Estimated Cost
(R’000)
Lower skilled (Levels 1-2) 0 0 0 0 0 0
Skilled (Levels 3-5) 4 100 1 10 4 3
Highly skilled production (Levels 6-8) 29 100 3 30 10 38
Highly skilled supervision (Levels 9-12) 166 100 5 50 33 358
Senior management (Levels 13-16) 5 100 1 10 5 17
Total 204 100 10 100 20 416
The table below summarises the utilisation of annual leave. The wage agreement concluded with trade unions in
the PSCBC in 2000 requires management of annual leave to prevent high levels of accrued leave being paid at
the time of termination of service.
page 117
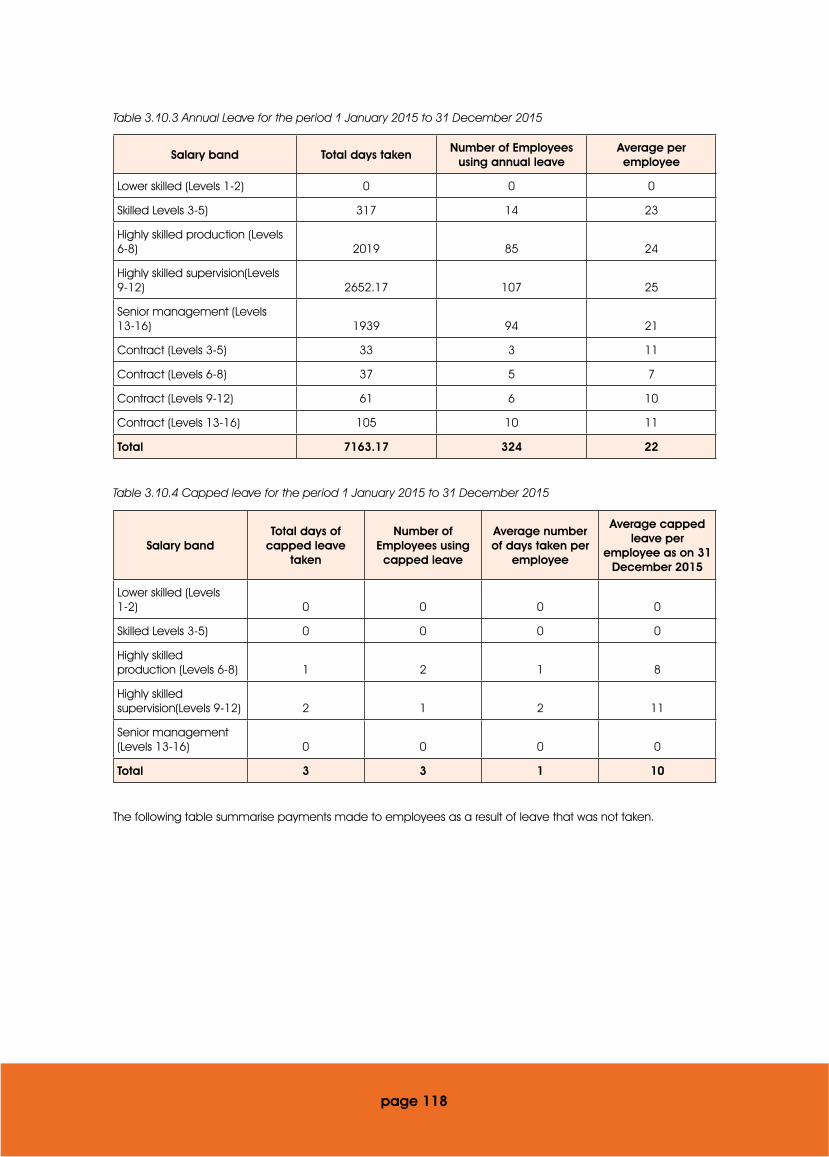
Table 3.10.3 Annual Leave for the period 1 January 2015 to 31 December 2015
Salary band Total days takenNumber of Employees
using annual leaveAverage per employee
Lower skilled (Levels 1-2) 0 0 0
Skilled Levels 3-5) 317 14 23
Highly skilled production (Levels 6-8) 2019 85 24
Highly skilled supervision(Levels 9-12) 2652.17 107 25
Senior management (Levels 13-16) 1939 94 21
Contract (Levels 3-5) 33 3 11
Contract (Levels 6-8) 37 5 7
Contract (Levels 9-12) 61 6 10
Contract (Levels 13-16) 105 10 11
Total 7163.17 324 22
Table 3.10.4 Capped leave for the period 1 January 2015 to 31 December 2015
Salary bandTotal days of
capped leave taken
Number of Employees using capped leave
Average number of days taken per
employee
Average capped leave per
employee as on 31 December 2015
Lower skilled (Levels 1-2) 0 0 0 0
Skilled Levels 3-5) 0 0 0 0
Highly skilled production (Levels 6-8) 1 2 1 8
Highly skilled supervision(Levels 9-12) 2 1 2 11
Senior management (Levels 13-16) 0 0 0 0
Total 3 3 1 10
The following table summarise payments made to employees as a result of leave that was not taken.
page 118
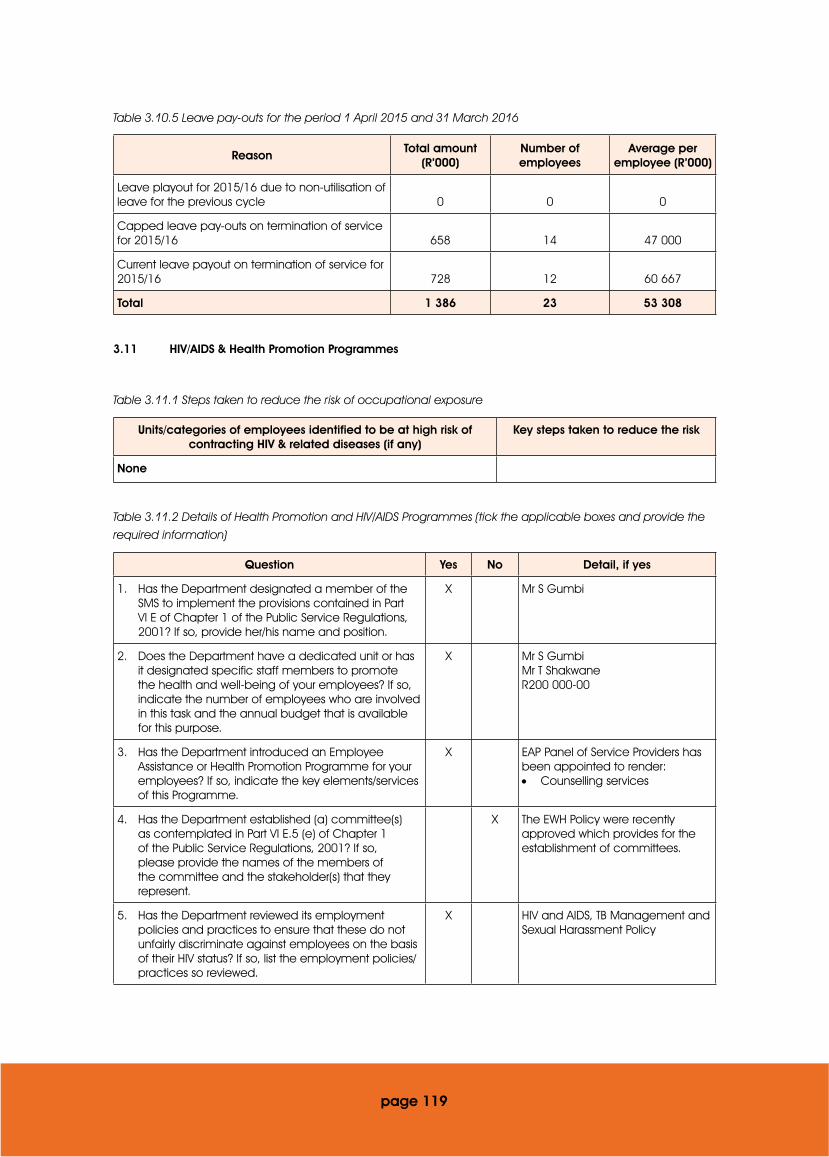
Table 3.10.5 Leave pay-outs for the period 1 April 2015 and 31 March 2016
ReasonTotal amount
(R’000)Number of employees
Average per employee (R’000)
Leave playout for 2015/16 due to non-utilisation of leave for the previous cycle 0 0 0
Capped leave pay-outs on termination of service for 2015/16 658 14 47 000
Current leave payout on termination of service for 2015/16 728 12 60 667
Total 1 386 23 53 308
3.11 HIV/AIDS & Health Promotion Programmes
Table 3.11.1 Steps taken to reduce the risk of occupational exposure
Units/categories of employees identified to be at high risk of contracting HIV & related diseases (if any)
Key steps taken to reduce the risk
None
Table 3.11.2 Details of Health Promotion and HIV/AIDS Programmes (tick the applicable boxes and provide the required information)
Question Yes No Detail, if yes
1. Has the Department designated a member of the SMS to implement the provisions contained in Part VI E of Chapter 1 of the Public Service Regulations, 2001? If so, provide her/his name and position.
X Mr S Gumbi
2. Does the Department have a dedicated unit or has it designated specific staff members to promote the health and well-being of your employees? If so, indicate the number of employees who are involved in this task and the annual budget that is available for this purpose.
X Mr S GumbiMr T ShakwaneR200 000-00
3. Has the Department introduced an Employee Assistance or Health Promotion Programme for your employees? If so, indicate the key elements/services of this Programme.
X EAP Panel of Service Providers has been appointed to render:• Counselling services
4. Has the Department established (a) committee(s) as contemplated in Part VI E.5 (e) of Chapter 1 of the Public Service Regulations, 2001? If so, please provide the names of the members of the committee and the stakeholder(s) that they represent.
X The EWH Policy were recently approved which provides for the establishment of committees.
5. Has the Department reviewed its employment policies and practices to ensure that these do not unfairly discriminate against employees on the basis of their HIV status? If so, list the employment policies/practices so reviewed.
X HIV and AIDS, TB Management and Sexual Harassment Policy
page 119

Question Yes No Detail, if yes
6. Has the Department introduced measures to protect HIV-positive employees or those perceived to be HIV-positive from discrimination? If so, list the key elements of these measures.
X Protection of disclosure is incorporated in the HIV and AIDS and TB Management Policy. Confidentiality is promoted in the provision of EAP.
7. Does the Department encourage its employees to undergo Voluntary Counselling and Testing? If so, list the results that you have achieved.
X 11 Employees participated in HCT and all of them tested negative.
8. Has the Department developed measures/indicators to monitor & evaluate the impact of its health promotion programme? If so, list these measures/indicators.
X Monitoring and evaluation are provided in the EWH policies and reporting.
3.12 Labour Relations
Table 3.12.1 Collective agreements for the period 1 April 2015 and 31 March 2016
Subject matter Date
Total number of Collective Agreements None
The following table summarises the outcome of disciplinary hearings conducted within the Department for the year under
review.
Table 3.12.2 Misconduct and disciplinary hearings finalised for the period 1 April 2015 and 31 March 2016
Outcomes of disciplinary hearings Number % of total
Correctional counselling 0 0
Verbal warning 0 0
Written warning 0 0
Final written warning 0 0
Suspended without pay 0 0
Fine 0 0
Demotion 0 0
Dismissal 0 0
Not guilty 1 100
Case withdrawn 0 0
Total 1 100
page 120
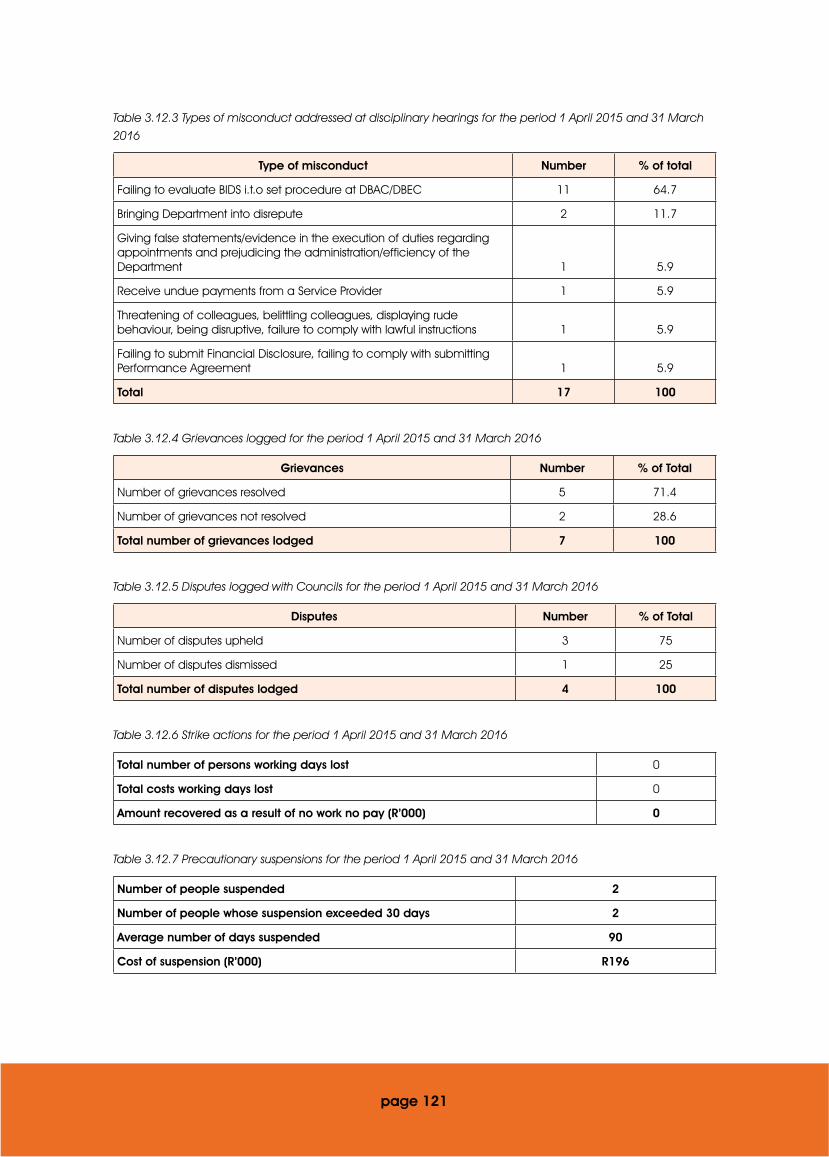
Table 3.12.3 Types of misconduct addressed at disciplinary hearings for the period 1 April 2015 and 31 March 2016
Type of misconduct Number % of total
Failing to evaluate BIDS i.t.o set procedure at DBAC/DBEC 11 64.7
Bringing Department into disrepute 2 11.7
Giving false statements/evidence in the execution of duties regarding appointments and prejudicing the administration/efficiency of the Department 1 5.9
Receive undue payments from a Service Provider 1 5.9
Threatening of colleagues, belittling colleagues, displaying rude behaviour, being disruptive, failure to comply with lawful instructions 1 5.9
Failing to submit Financial Disclosure, failing to comply with submitting Performance Agreement 1 5.9
Total 17 100
Table 3.12.4 Grievances logged for the period 1 April 2015 and 31 March 2016
Grievances Number % of Total
Number of grievances resolved 5 71.4
Number of grievances not resolved 2 28.6
Total number of grievances lodged 7 100
Table 3.12.5 Disputes logged with Councils for the period 1 April 2015 and 31 March 2016
Disputes Number % of Total
Number of disputes upheld 3 75
Number of disputes dismissed 1 25
Total number of disputes lodged 4 100
Table 3.12.6 Strike actions for the period 1 April 2015 and 31 March 2016
Total number of persons working days lost 0
Total costs working days lost 0
Amount recovered as a result of no work no pay (R’000) 0
Table 3.12.7 Precautionary suspensions for the period 1 April 2015 and 31 March 2016
Number of people suspended 2
Number of people whose suspension exceeded 30 days 2
Average number of days suspended 90
Cost of suspension (R’000) R196
page 121

3.13 Skills development
This section highlights the efforts of the Department with regard to skills development.
Table 3.13.1 Training needs identified for the period 1 April 2015 and 31 March 2016
Occupational category Gender
Number of employees as at 1 April
2015
Training needs identified at start of the reporting period
Learnerships
Skills Programmes & other short
courses
Other forms of training
Total
Legislators, senior officials and managers
Female 32 0 57 13 70
Male 52 0 84 19 103
Professionals Female 33 0 47 13 60
Male 14 0 35 17 52
Technicians and associate professionals
Female 40 0 15 6 21
Male39 0 3 0 3
Clerks Female 66 0 44 17 61
Male 22 0 22 5 27
Elementary occupations Female 0 0 0 0 0
Male 3 0 0 0 0
Sub Total Female 171 0 163 49 212
Male 130 0 144 41 185
Total 301 0 307 90 397
Table 3.13.2 Training provided for the period 1 April 2015 and 31 March 2016
Occupational category
Gender
Number of employees as at 1 April
2015
Training provided within the reporting period
Learnerships
Skills Programmes & other short
courses
Other forms of training
Total
Legislators, senior officials and managers
Female 32 0 26 20 46
Male 52 0 13 23 36
Professionals Female 33 0 11 12 23
Male 14 0 8 6 14
Technicians and associate professionals
Female 40 0 3 6 9
Male 39 0 1 0 1
Clerks Female 66 0 16 3 19
Male 22 0 3 3 6
Elementary occupations
Female 0 0 0 0 0
Male 3 0 0 0 0
page 122

Occupational category
Gender
Number of employees as at 1 April
2015
Training provided within the reporting period
Learnerships
Skills Programmes & other short
courses
Other forms of training
Total
Sub Total Female 171 0 56 41 97
Male 130 0 25 32 57
Total 301 0 81 73 154
3.14 Injury on duty
The following tables provide basic information on injury on duty.
Table 3.14.1 Injury on duty for the period 1 April 2015 and 31 March 2016
Nature of injury on duty Number % of total
Required basic medical attention only 0 0
Temporary Total Disablement 0 0
Permanent Disablement 0 0
Fatal 0 0
Total 0 0
3.15 Utilisation of Consultants
The following tables relates information on the utilisation of consultants in the Department. In terms of the Public
Service Regulations “consultant’ means a natural or juristic person or a partnership who or which provides in
terms of a specific contract on an ad hoc basis any of the following professional services to a Department
against remuneration received from any source:
a. The rendering of expert advice;
b. The drafting of proposals for the execution of specific tasks; and
c. The execution of a specific task which is of a technical or intellectual nature, but excludes an
employee of a Department.
Table 3.15.1 Report on consultant appointments using appropriated funds for the period 1 April 2015 and 31 March 2016
Project title
Total number of consultants that worked on
project
Duration(work days)
Contract value in Rand
Conduct a Study on National Roaming 1 90 days R1 938 000
ICT Security vulnerability management and penetration test 1 30 days R399 000
Cyber Security 4 365 days R15 156 157
ICT Policy Review (CSIR) 1 30 days R89 791
page 123

Project title
Total number of consultants that worked on
project
Duration(work days)
Contract value in Rand
Information Ethics (UP) 1 60 days R2 000 000
e-Skills Project 1 30 days R6 558 000
Metro Wi-Fi Projects 243 30 days R40 000 000
Rapid Redeployment 1 30 days R4 296 372
Total number of projectsTotal individual
consultantsTotal duration Work days
Total contract value in Rand
4 1 665 R70 437 320
Table 3.15.2 Analysis of consultant appointments using appropriated funds, in terms of Historically Disadvantaged Individuals (HDIs) for the period 1 April 2015 and 31 March 2016
Project titlePercentage ownership by
HDI groups
Percentage management by HDI
groups
Number of consultants from HDI groups that work on the project
ICT Security vulnerability management and penetration test 100% 100% 1
Table 3.15.3 Report on consultant appointments using Donor funds for the period 1 April 2015 and 31 March 2016
Project titleTotal Number of
consultants that worked on project
Duration (Work days)Donor and contract
value in Rand
None
Total number of projectsTotal individual
consultantsTotal duration
Work daysTotal contract value in
Rand
None
Table 3.15.4 Analysis of consultant appointments using Donor funds, in terms of Historically Disadvantaged Individuals (HDIs) for the period 1 April 2015 and 31 March 2016
Project titlePercentage ownership by
HDI groups
Percentage management by HDI
groups
Number of consultants from HDI groups that work on the project
None
page 124

page 125
3.16 Severance Packages
Table 3.16.1 Granting of employee initiated severance packages for the period 1 April 2015 and 31 March 2016
Salary bandNumber of
applications received
Number of applications
referred to the MPSA
Number of applications supported by
MPSA
Number of packages
approved by Department
Lower skilled (Levels 1-2) 0 0 0 0
Skilled (Levels 3-5) 0 0 0 0
Highly skilled production (Levels 6-8) 0 0 0 0
Highly skilled supervision(Levels 9-12) 0 0 0 0
Senior management (Levels 13-16) 0 0 0 0
Total 0 0 0 0

page 126
PART E FINANCIAL
INFORMATION

page 127
Report of the Auditor-General to Parliament on
Vote No. 32: Department of Telecommunications and Postal Services
Introduction
1. I have audited the financial statements of the Department of Telecommunications and Postal Services set out on pages 130 to 213, which comprise the appropriation statement, the statement of financial position as at 31 March 2016, the statement of financial performance, statement of changes in net assets, and cash flow statement for the year then ended, as well as the notes, comprising a summary of significant accounting policies and other explanatory information.
Accounting Officer’s responsibility for the financial statements
2. The accounting officer is responsible for the preparation and fair presentation of these financial statements in accordance with the Modified Cash Standard and the requirements of the Public Finance Management Act (PFMA) (1 of 1999), and for such internal control as the accounting officer determines is necessary to enable the preparation of financial statements that are free from material misstatement, whether due to fraud or error.
Auditor-general’s responsibility
3. My responsibility is to express an opinion on these financial statements based on my audit. I conducted my audit in accordance with International Standards on Auditing. Those standards require that I comply with ethical requirements, and plan and perform the audit to obtain reasonable assurance about whether the financial statements are free from material misstatement.
4. An audit involves performing procedures to obtain audit evidence about the amounts and disclosures in the financial statements. The procedures selected depend on the auditor’s judgement, including the assessment of the risks of material misstatement of the financial statements, whether due to fraud or error. In making those risk assessments, the auditor considers internal control relevant to the entity’s preparation and fair presentation of the financial statements in order to design audit procedures that are appropriate in the circumstances, but not for the purpose of expressing an opinion on the effectiveness of the entity’s internal control. An audit also includes evaluating the appropriateness of accounting policies used and the reasonableness of accounting estimates made by management, as well as evaluating the overall presentation of the financial statements.
5. I believe that the audit evidence I have obtained is sufficient and appropriate to provide a basis for my audit opinion.
Opinion
6. In my opinion, the financial statements present fairly, in all material respects, the financial position of the Department of Telecommunications and Postal Services as at 31 March 2016 and its financial performance and cash flows for the year then ended, in accordance with the Modified Cash Standard and the requirements of the PFMA.
Additional matter
7. I draw attention to the matter below. My opinion is not modified in respect of this matter
Unaudited supplementary schedules
8. The supplementary information set out on pages 214 to 229 does not form part of the financial statements and is presented as additional information. I have not audited these schedules and, accordingly, I do not express an opinion thereon

page 128
Report on other legal and regulatory requirements
9. In accordance with the Public Audit Act of South Africa, 2004 (Act No. 25 of 2004)(PAA) and the general notice issued in terms thereof, I have a responsibility to report findings on the reported performance information against predetermined objectives of selected programmes presented in the annual performance report, compliance with legislation and internal control. The objective of my tests was to identify reportable findings as described under each subheading but not to gather evidence to express assurance on these matters. Accordingly, I do not express an opinion or conclusion on these matters.
Predetermined objectives
10. I performed procedures to obtain evidence about the usefulness and reliability of the reported performance information of the following selected programmes presented in the annual performance report of the Department for the year ended 31 March 2016:
• Programme 2: International Affairs on pages 33 to 38
• Programme 3: ICT Policy, Research and Capacity Building on pages 38 to 60
• Programme 4: ICT Enterprise Development and SOC Oversight on pages 61 to 68
• Programme 5: ICT Infrastructure Support on pages 69 to 75
11. I evaluated the usefulness of the reported performance information to determine whether it was presented in accordance with the National Treasury’s annual reporting principles and whether the reported performance was consistent with the planned programmes. I further performed tests to determine whether indicators and targets were well defined, verifiable, specific, measurable, time bound and relevant, as required by the National Treasury’s Framework for managing programme performance information (FMPPI).
12. I assessed the reliability of the reported performance information to determine whether it was valid, accurate and complete.
13. I did not identify any material findings on the usefulness and reliability of the reported performance information for the programmes selected as per paragraph 10 above.
Additional matters
14. Although I identified no material findings on the usefulness and reliability of the reported performance information for the selected programmes, I draw attention to the following matters:
Achievement of planned targets
15. Refer to the annual performance report on pages 25 to 80 for information on the achievement of the planned targets for the year.
Unaudited supplementary information
16. The supplementary information set out on pages 214 to 229 does not form part of the annual performance report and is presented as additional information. I have not audited this schedule and, accordingly, I do not report on them.
Compliance with legislation
17. I performed procedures to obtain evidence that the Department had complied with applicable legislation regarding financial matters, financial management and other related matters. My material findings on compliance with specific matters in key legislation, as set out in the general notice issued in terms of the PAA, are as follows:
page 129
Expenditure Management
18. Effective steps were not taken to prevent irregular expenditure, amounting to R27 065 000 as discussed in note 27 of the AFS, as required by section 38(1) (c) (ii) of the Public Finance Management Act and Treasury Regulation 9.1.1.
Procurement and contract management
19. Goods and services of a transaction value above R500 000 were in certain instances procured without inviting competitive bids, as required by Treasury Regulations 16A6.1. Deviations were approved by the accounting officer even though it was not impractical to invite competitive bids, in contravention of Treasury regulation 16A6.4.
Internal control
20. I considered internal control relevant to my audit of the financial statements, annual performance report and compliance with legislation. The matters reported below are limited to the significant internal control deficiencies that resulted in the findings on non-compliance with legislation included in this report.
Leadership
21. Inadequate leadership capacity prevented consistency oversight on compliance with laws and regulations.
Financial and performance management
22. Inadequate processes in place for regular review and monitoring of compliance with legislation.
Other reports
23. My opinion is not modified in respect of these engagements that are either in progress or have been completed.
Investigations
24. Investigations initiated in terms of presidential proclamation and conducted by the Special Investigative Unit (SIU) were still in progress at the end of the financial year. These proclamations referred to tender irregularities, hosting of the ICT Indaba, improper or unlawful conduct by an official of the department which resulted in the department purportedly breaching a contract and improper conduct by employees relating to the recruitment, selection and appointment of official. Some of the matters as included in the proclamation had already been finalised internally, and the involved employees were charged with misconduct and subsequently dismissed.
Pretoria
31 July 2016
page 130
Vote No. 32: Department of Telecommunications and Postal Services
Accounting Policies
Summary of significant accounting policies
The financial statements have been prepared in accordance with the following policies, which have been applied consistently in all material aspects, unless otherwise indicated. Management has concluded that the financial statements present fairly the Department’s primary and secondary information.
The historical cost convention has been used, except where otherwise indicated. Management has used assessments and estimates in preparing the annual financial statements. These are based on the best information available at the time of preparation.
Where appropriate and meaningful, additional information has been disclosed to enhance the usefulness of the financial statements and to comply with the statutory requirements of the Public Finance Management Act (PFMA), Act 1 of 1999 (as amended by Act 29 of 1999), and the Treasury Regulations issued in terms of the PFMA and the annual Division of Revenue Act.
1. Basis of preparation
The financial statements have been prepared in accordance with the Modified Cash Standard.
2. Going concern
The financial statements have been prepared on a going concern basis.
3. Presentation currency
Amounts have been presented in the currency of the South African Rand (R) which is also the functional currency of the Department.
4. Rounding
Unless otherwise stated financial figures have been rounded to the nearest one thousand Rand (R’000).
5. Foreign currency translation
Cash flows arising from foreign currency transactions are translated into South African Rands using the exchange rates prevailing at the date of payment/receipt.
6. Comparative information
6.1 Prior period comparative information
Prior period comparative information has been presented in the current year’s financial statements. Where necessary figures included in the prior period financial statements have been reclassified to ensure that the format in which the information is presented is consistent with the format of the current year’s financial statements.
6.2 Current year comparison with budget
A comparison between the approved, final budget and actual amounts for each programme and economic classification is included in the appropriation statement.

page 131
7. Revenue
7.1 Appropriated funds
Appropriated funds comprises of Departmental allocations as well as direct charges against revenue fund (i.e. statutory appropriation).
Appropriated funds are recognised in the statement of financial performance on the date the appropriation becomes effective. Adjustments made in terms of the adjustments budget process are recognised in the statement of financial performance on the date the adjustments become effective.
The net amount of any appropriated funds due to/from the relevant revenue fund at the reporting date is recognised as a payable/receivable in the statement of financial position.
7.2 Departmental revenue
Departmental revenue is recognised in the statement of financial performance when received and is subsequently paid into the relevant revenue fund, unless stated otherwise.
Any amount owing to the relevant revenue fund at the reporting date is recognised as a payable in the statement of financial position.
7.3 Accrued Departmental revenue
Accruals in respect of Departmental revenue (excluding tax revenue) are recorded in the notes to the financial statements when:
• it is probable that the economic benefits or service potential associated with the transaction will flow to the Department; and
• the amount of revenue can be measured reliably.
The accrued revenue is measured at the fair value of the consideration receivable.
Accrued tax revenue (and related interest and / penalties) is measured at amounts receivable from collecting agents.
8. Expenditure
8.1 Compensation of employees
8.1.1 Salaries and wages
Salaries and wages are recognised in the statement of financial performance on the date of payment.
8.1.2 Social contributions
Social contributions made by the Department in respect of current employees are recognised in the statement of financial performance on the date of payment.
Social contributions made by the Department in respect of ex-employees are classified as transfers to households in the statement of financial performance on the date of payment.
8.2 Other expenditure
Other expenditure (such as goods and services, transfers and subsidies and payments for capital assets) is recognised in the statement of financial performance on the date of payment. The expense is classified as a capital expense if the total consideration paid is more than the capitalisation threshold.
8.3 Accrued expenditure payable
Accrued expenditure payable is recorded in the notes to the financial statements when the goods are received or, in the case of services, when they are rendered to the Department or in the case of transfers and subsidies when they are due and payable.
Accrued expenditure payable is measured at cost.
page 132
8.4 Leases
8.4.1 Operating leases
Operating lease payments made during the reporting period are recognised as current expenditure in the statement of financial performance on the date of payment.
The operating lease commitments are recorded in the notes to the financial statements.
8.4.2 Finance leases
Finance lease payments made during the reporting period are recognised as capital expenditure in the statement of financial performance on the date of payment.
The finance lease commitments are recorded in the notes to the financial statements and are not apportioned between the capital and interest portions.
Finance lease assets acquired at the end of the lease term are recorded and measured at the lower of:
• cost, being the fair value of the asset; or
• the sum of the minimum lease payments made, including any payments made to acquire ownership at the end of the lease term, excluding interest.
9. Aid Assistance
9.1 Aid assistance received
Aid assistance received in cash is recognised in the statement of financial performance when received. In-kind aid assistance is recorded in the notes to the financial statements on the date of receipt and is measured at fair value.
Aid assistance not spent for the intended purpose and any unutilised funds from aid assistance that are required to be refunded to the donor are recognised as a payable in the statement of financial position.
9.2 Aid assistance paid
Aid assistance paid is recognised in the statement of financial performance on the date of payment. Aid assistance payments made prior to the receipt of funds are recognised as a receivable in the statement of financial position.
10. Cash and cash equivalents
Cash and cash equivalents are stated at cost in the statement of financial position.
Bank overdrafts are shown separately on the face of the statement of financial position as a current liability.
For the purposes of the cash flow statement, cash and cash equivalents comprise cash on hand, deposits held, other short-term highly liquid investments and bank overdrafts.
11. Prepayments and advances
Prepayments and advances are recognised in the statement of financial position when the Department receives or disburses the cash.
Prepayments and advances are initially and subsequently measured at cost.
Prepayments and advances are expensed when invoices/claims are received for goods/services delivered/rendered.
12. Loans and receivables
Loans and receivables are recognised in the statement of financial position at cost plus accrued interest, where interest is charged, less amounts already settled or written-off. Write-offs are made according to the Department’s write-off policy.
page 133
13. Investments
Investments are recognised in the statement of financial position at cost.
14. Financial assets
14.1 Financial assets (not covered elsewhere)
A financial asset is recognised initially at its cost plus transaction costs that are directly attributable to the acquisition or issue of the financial asset.
At the reporting date, a Department shall measure its financial assets at cost, less amount already settled or written-off, except for recognised loans and receivables, which are measured at cost plus accrued interest, where interest is charged, less amounts already settled or written-off.
14.2 Impairment of financial assets
Where there is an indication of impairment of a financial asset, an estimation of the reduction in the recorded carrying value, to reflect the best estimate of the amount of the future economic benefits expected to be received from that asset, is recorded in the notes to the financial statements.
15. Payables
Loans and payables are recognised in the statement of financial position at cost.
16. Capital assets
16.1 Immovable capital assets
Immovable capital assets are initially recorded in the notes to the financial statements at cost. Immovable capital assets acquired through a non-exchange transaction is measured at fair value as at the date of acquisition.
Where the cost of immovable capital assets cannot be determined reliably, the immovable capital assets are measured at R1 unless the fair value of the asset has been reliably estimated, in which case the fair value is used.
All assets acquired prior to 1 April 2002 (or a later date as approved by the OAG) are recorded at R1.
Immovable capital assets are subsequently carried at cost and are not subject to depreciation or impairment.
Subsequent expenditure that is of a capital nature is added to the cost of the asset at the end of the capital project unless the immovable asset is recorded by another Department in which case the completed project costs are transferred to that Department.
16.2 Movable capital assets
Movable capital assets are initially recorded in the notes to the financial statements at cost. Movable capital assets acquired through a non-exchange transaction is measured at fair value as at the date of acquisition.
Where the cost of movable capital assets cannot be determined reliaby, the movable capital assets are measured at fair value and where fair value cannot be determined; the movable assets are measured at R1.
All assets acquired prior to 1 April 2002 (or a later date as approved by the OAG) are recorded at R1.
Movable capital assets are subsequently carried at cost and are not subject to depreciation or impairment.
Subsequent expenditure that is of a capital nature is added to the cost of the asset at the end of the capital project unless the movable asset is recorded by another Department/entity in which case the completed project costs are transferred to that Department.
page 134
16.3 Intangible assets
Intangible assets are initially recorded in the notes to the financial statements at cost. Intangible assets acquired through a non-exchange transaction are measured at fair value as at the date of acquisition.
Internally generated intangible assets are recorded in the notes to the financial statements when the Department commences the development phase of the project.
Where the cost of intangible assets cannot be determined reliably, the intangible capital assets are measured at fair value and where fair value cannot be determined; the intangible assets are measured at R1.
All assets acquired prior to 1 April 2002 (or a later date as approved by the OAG) are recorded at R1.
Intangible assets are subsequently carried at cost and are not subject to depreciation or impairment.
Subsequent expenditure that is of a capital nature is added to the cost of the asset at the end of the capital project unless the intangible asset is recorded by another Department/entity in which case the completed project costs are transferred to that Department.
17. Provisions and Contingents
17.1 Provisions
Provisions are recorded in the notes to the financial statements when there is a present legal or constructive obligation to forfeit economic benefits as a result of events in the past and it is probable that an outflow of resources embodying economic benefits or service potential will be required to settle the obligation and a reliable estimate of the obligation can be made. The provision is measured as the best estimate of the funds required to settle the present obligation at the reporting date.
17.2 Contingent liabilities
Contingent liabilities are recorded in the notes to the financial statements when there is a possible obligation that arises from past events, and whose existence will be confirmed only by the occurrence or non-occurrence of one or more uncertain future events not within the control of the Department or when there is a present obligation that is not recognised because it is not probable that an outflow of resources will be required to settle the obligation or the amount of the obligation cannot be measured reliably.
17.3 Contingent assets
Contingent assets are recorded in the notes to the financial statements when a possible asset arises from past events, and whose existence will be confirmed by the occurrence or non-occurrence of one or more uncertain future events not within the control of the Department.
17.4 Commitments
Commitments are recorded at cost in the notes to the financial statements when there is a contractual arrangement or an approval by management in a manner that raises a valid expectation that the Department will discharge its responsibilities thereby incurring future expenditure that will result in the outflow of cash.
18. Unauthorised expenditure
Unauthorised expenditure is recognised in the statement of financial position until such time as the expenditure is either:
• approved by Parliament or the Provincial Legislature with funding and the related funds are received; or
• approved by Parliament or the Provincial Legislature without funding and is written off against the appropriation in the statement of financial performance; or
• transferred to receivables for recovery.
Unauthorised expenditure is measured at the amount of the confirmed unauthorised expenditure.
page 135
19. Fruitless and wasteful expenditure
Fruitless and wasteful expenditure is recorded in the notes to the financial statements when confirmed. The amount recorded is equal to the total value of the fruitless and or wasteful expenditure incurred.
Fruitless and wasteful expenditure is removed from the notes to the financial statements when it is resolved or transferred to receivables for recovery.
Fruitless and wasteful expenditure receivables are measured at the amount that is expected to be recoverable and are de-recognised when settled or subsequently written-off as irrecoverable.
20. Irregular expenditure
Irregular expenditure is recorded in the notes to the financial statements when confirmed. The amount recorded is equal to the total value of the irregularity unless it is impracticable to determine, in which case reasons therefore are provided in the note.
Irregular expenditure is removed from the note when it is either condoned by the relevant authority or transferred to receivables for recovery.
Irregular expenditure receivables are measured at the amount that is expected to be recoverable and are de-recognised when settled or subsequently written-off as irrecoverable.
21. Changes in accounting policies, accounting estimates and errors
Changes in accounting policies that are effected by management have been applied retrospectively in accordance with MCS requirements, except to the extent that it is impracticable to determine the period-specific effects or the cumulative effect of the change in policy. In such instances the Department shall restate the opening balances of assets, liabilities and net assets for the earliest period for which retrospective restatement is practicable.
Changes in accounting estimates are applied prospectively in accordance with MCS requirements.
Correction of errors is applied retrospectively in the period in which the error has occurred in accordance with MCS requirements, except to the extent that it is impracticable to determine the period-specific effects or the cumulative effect of the error. In such cases the Department shall restate the opening balances of assets, liabilities and net assets for the earliest period for which retrospective restatement is practicable.
22. Events after the reporting date
Events after the reporting date that are classified as adjusting events have been accounted for in the financial statements. The events after the reporting date that are classified as non-adjusting events after the reporting date have been disclosed in the notes to the financial statements.
23. Capitalisation reserve
The capitalisation reserve comprises of financial assets and/or liabilities originating in a prior reporting period but which are recognised in the statement of financial position for the first time in the current reporting period. Amounts are recognised in the capitalisation reserves when identified in the current period and are transferred to the National/Provincial Revenue Fund when the underlying asset is disposed and the related funds are received.
24. Recoverable revenue
Amounts are recognised as recoverable revenue when a payment made in a previous financial year becomes recoverable from a debtor in the current financial year. Amounts are either transferred to the National/Provincial Revenue Fund when recovered or are transferred to the statement of financial performance when written-off.
25. Related party transactions
A related party transaction is a transfer of resources, services or obligations between the reporting entity and a related party. Related party transactions within the Minister’s portfolio are recorded in the notes to the financial statements when the transaction is not at arm’s length.
page 136
Key management personnel are those persons having the authority and responsibility for planning, directing and controlling the activities of the Department. The number of individuals and their full compensation is recorded in the notes to the financial statements.
26. Public-Private Partnerships
Public Private Partnerships are accounted for based on the nature and or the substance of the partnership. The transaction is accounted for in accordance with the relevant accounting policies.
A summary of the significant terms of the PPP agreement, the parties to the agreement, and the date of commencement thereof together with the description and nature of the concession fees received, the unitary fees paid, rights and obligations of the Department are recorded in the notes to the financial statements.
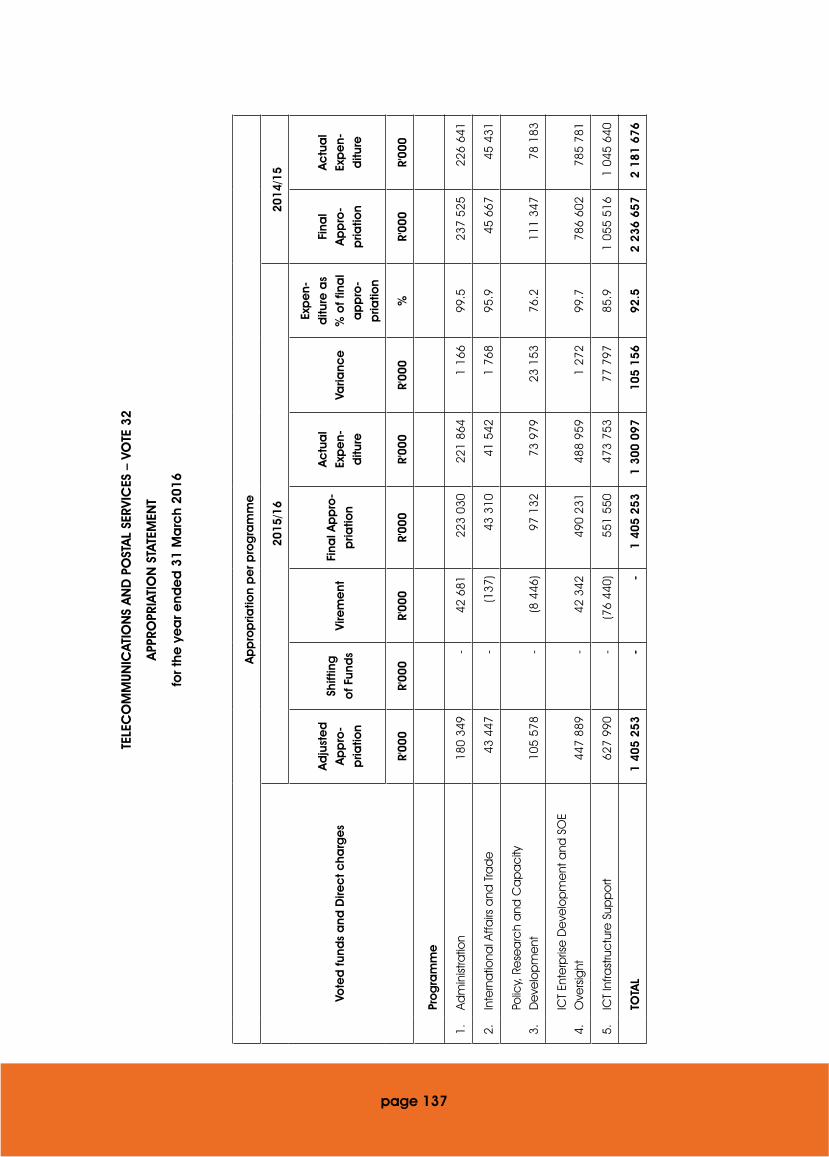
page 137
TELE
CO
MM
UNIC
ATIO
NS
AN
D P
OST
AL
SERV
ICES
– V
OTE
32
APP
ROPR
IATI
ON
STA
TEM
ENT
for t
he y
ea
r end
ed
31
Ma
rch
2016
Ap
pro
pria
tion
pe
r pro
gra
mm
e
Vote
d fu
nds
and
Dire
ct
cha
rge
s
2015
/16
2014
/15
Ad
just
ed
A
pp
ro-
pria
tion
Shift
ing
o
f Fun
ds
Vire
me
ntFi
nal A
pp
ro-
pria
tion
Ac
tua
l Ex
pe
n-d
iture
Varia
nce
Exp
en-
ditu
re a
s %
of f
ina
l a
pp
ro-
pria
tion
Fina
l A
pp
ro-
pria
tion
Ac
tua
l Ex
pe
n-d
iture
R'00
0R'
000
R'00
0R'
000
R'00
0R'
000
%R'
000
R'00
0
Pr
og
ram
me
1.Ad
min
istra
tion
180
349
-42
681
223
030
221
864
1 16
699
.523
7 52
522
6 64
1
2.In
tern
atio
nal A
ffairs
and
Tra
de
43 4
47-
(137
)43
310
41 5
421
768
95.9
45 6
6745
431
3.Po
licy,
Re
sea
rch
and
Ca
pa
city
D
eve
lop
me
nt10
5 57
8-
(8 4
46)
97 1
3273
979
23 1
5376
.211
1 34
778
183
4.IC
T En
terp
rise
De
velo
pm
ent
and
SO
E O
vers
ight
447
889
-42
342
490
231
488
959
1 27
299
.778
6 60
278
5 78
1
5.IC
T In
frast
ruc
ture
Sup
po
rt62
7 99
0-
(76
440)
551
550
473
753
77 7
9785
.91
055
516
1 04
5 64
0
TO
TAL
1 40
5 25
3-
-1
405
253
1 30
0 09
710
5 15
692
.52
236
657
2 18
1 67
6

page 138
Ap
pro
pria
tion
pe
r pro
gra
mm
e
Vote
d fu
nds
and
Dire
ct
cha
rge
s
2015
/16
2014
/15
Ad
just
ed
A
pp
ro-
pria
tion
Shift
ing
o
f Fun
ds
Vire
me
ntFi
nal A
pp
ro-
pria
tion
Ac
tua
l Ex
pe
n-d
iture
Varia
nce
Exp
en-
ditu
re a
s %
of f
ina
l a
pp
ro-
pria
tion
Fina
l A
pp
ro-
pria
tion
Ac
tua
l Ex
pe
n-d
iture
R'00
0R'
000
R'00
0R'
000
R'00
0R'
000
%R'
000
R'00
0
Rec
onc
ilia
tion
with
Sta
tem
ent
of F
ina
ncia
l Pe
rfo
rma
nce
Ad
d:
D
ep
artm
ent
al r
ec
eip
ts
26 8
04 4
351
672
004
N
RF R
ec
eip
ts
--
A
id a
ssist
anc
e
--
Ac
tua
l am
oun
ts p
er S
tate
me
nt o
f Fin
anc
ial P
erf
orm
anc
e (T
ota
l Re
venu
e)
28 2
09 6
883
908
661
Ad
d:
Aid
ass
ista
nce
-
-
P
rior y
ea
r una
utho
rise
d e
xpe
nditu
re a
pp
rove
d w
itho
ut fu
ndin
g
--
Ac
tua
l am
oun
ts p
er S
tate
me
nt o
f Fin
anc
ial P
erf
orm
anc
e E
xpe
nditu
re
1 30
0 09
72
181
676
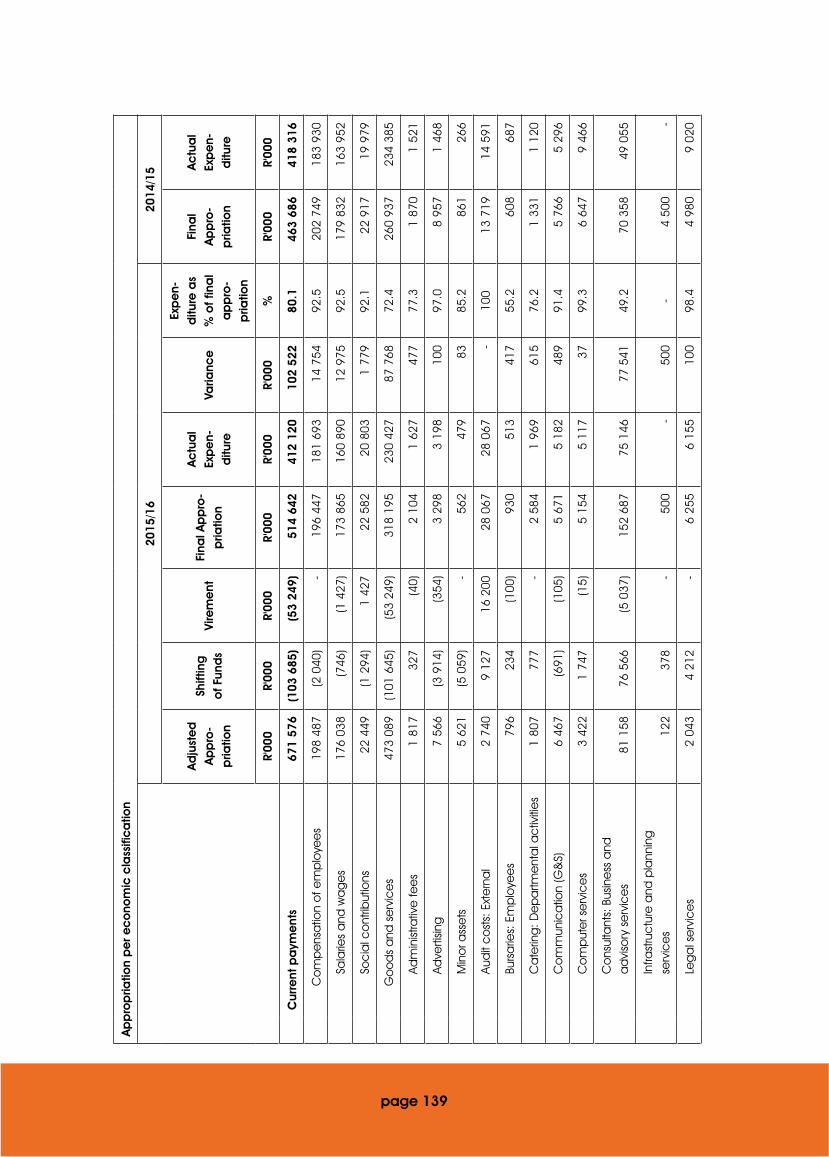
page 139
Ap
pro
pria
tion
pe
r ec
ono
mic
cla
ssifi
ca
tion
2015
/16
2014
/15
Ad
just
ed
A
pp
ro-
pria
tion
Shift
ing
o
f Fun
ds
Vire
me
ntFi
nal A
pp
ro-
pria
tion
Ac
tua
l Ex
pe
n-d
iture
Varia
nce
Exp
en-
ditu
re a
s %
of f
ina
l a
pp
ro-
pria
tion
Fina
l A
pp
ro-
pria
tion
Ac
tua
l Ex
pe
n-d
iture
R'00
0R'
000
R'00
0R'
000
R'00
0R'
000
%R'
000
R'00
0
C
urre
nt p
aym
ent
s67
1 57
6(1
03 6
85)
(53
249)
514
642
412
120
102
522
80.1
463
686
418
316
C
om
pe
nsa
tion
of e
mp
loye
es
198
487
(2 0
40)
-19
6 44
718
1 69
314
754
92.5
202
749
183
930
Sa
larie
s a
nd w
ag
es
176
038
(746
)(1
427
)17
3 86
516
0 89
012
975
92.5
179
832
163
952
So
cia
l co
ntrib
utio
ns22
449
(1 2
94)
1 42
722
582
20 8
031
779
92.1
22 9
1719
979
G
oo
ds
and
se
rvic
es
473
089
(101
645
)(5
3 24
9)31
8 19
523
0 42
787
768
72.4
260
937
234
385
Ad
min
istra
tive
fee
s1
817
327
(40)
2 10
41
627
477
77.3
1 87
01
521
Ad
verti
sing
7 56
6(3
914
)(3
54)
3 29
83
198
100
97.0
8 95
71
468
M
ino
r ass
ets
5 62
1(5
059
)-
562
479
8385
.286
126
6
Au
dit
co
sts:
Ext
ern
al
2 74
09
127
16 2
0028
067
28 0
67-
100
13 7
1914
591
Bu
rsa
ries:
Em
plo
yee
s79
623
4(1
00)
930
513
417
55.2
608
687
C
ate
ring
: De
pa
rtme
nta
l ac
tiviti
es
1 80
777
7-
2 58
41
969
615
76.2
1 33
11
120
C
om
mun
ica
tion
(G&
S)6
467
(691
)(1
05)
5 67
15
182
489
91.4
5 76
65
296
C
om
put
er s
erv
ice
s3
422
1 74
7(1
5)5
154
5 11
737
99.3
6 64
79
466
C
ons
ulta
nts:
Bus
ine
ss a
nd
ad
viso
ry s
erv
ice
s81
158
76 5
66(5
037
)15
2 68
775
146
77 5
4149
.270
358
49 0
55
In
frast
ruc
ture
and
pla
nnin
g
serv
ice
s12
237
8-
500
-50
0-
4 50
0-
Le
ga
l se
rvic
es
2 04
34
212
-6
255
6 15
510
098
.44
980
9 02
0
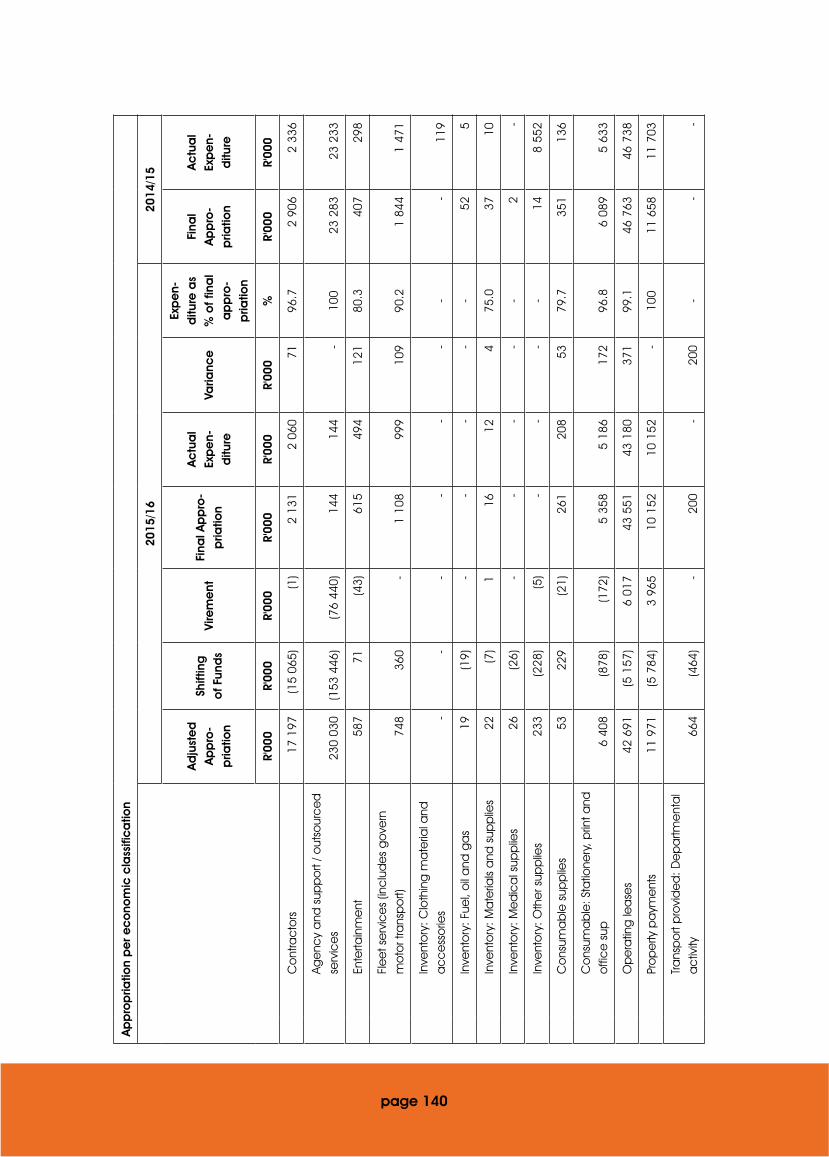
page 140
Ap
pro
pria
tion
pe
r ec
ono
mic
cla
ssifi
ca
tion
2015
/16
2014
/15
Ad
just
ed
A
pp
ro-
pria
tion
Shift
ing
o
f Fun
ds
Vire
me
ntFi
nal A
pp
ro-
pria
tion
Ac
tua
l Ex
pe
n-d
iture
Varia
nce
Exp
en-
ditu
re a
s %
of f
ina
l a
pp
ro-
pria
tion
Fina
l A
pp
ro-
pria
tion
Ac
tua
l Ex
pe
n-d
iture
R'00
0R'
000
R'00
0R'
000
R'00
0R'
000
%R'
000
R'00
0
C
ont
rac
tors
17 1
97(1
5 06
5)(1
)2
131
2 06
071
96.7
2 90
62
336
Ag
enc
y a
nd s
upp
ort
/ out
sour
ce
d
serv
ice
s23
0 03
0(1
53 4
46)
(76
440)
144
144
-10
023
283
23 2
33
En
terta
inm
ent
587
71(4
3)61
549
412
180
.340
729
8
Fl
ee
t se
rvic
es
(inc
lud
es
go
vern
m
oto
r tra
nsp
ort)
748
360
-1
108
999
109
90.2
1 84
41
471
In
vent
ory
: Clo
thin
g m
ate
rial a
nd
ac
ce
sso
ries
--
--
--
--
119
In
vent
ory
: Fue
l, o
il a
nd g
as
19(1
9)-
--
--
525
In
vent
ory
: Ma
teria
ls a
nd s
upp
lies
22(7
)1
1612
475
.037
10
In
vent
ory
: Me
dic
al s
upp
lies
26(2
6)-
--
--
2-
In
vent
ory
: Oth
er s
upp
lies
233
(228
)(5
)-
--
-14
8 55
2
C
ons
uma
ble
sup
plie
s53
229
(21)
261
208
5379
.735
113
6
C
ons
uma
ble
: Sta
tione
ry, p
rint a
nd
offi
ce
sup
6 40
8(8
78)
(172
)5
358
5 18
617
296
.86
089
5 63
3
O
pe
ratin
g le
ase
s42
691
(5 1
57)
6 01
743
551
43 1
8037
199
.146
763
46 7
38
Pr
op
erty
pa
yme
nts
11 9
71(5
784
)3
965
10 1
5210
152
-10
011
658
11 7
03
Tra
nsp
ort
pro
vid
ed
: De
pa
rtme
nta
l a
ctiv
ity66
4(4
64)
-20
0-
200
--
-
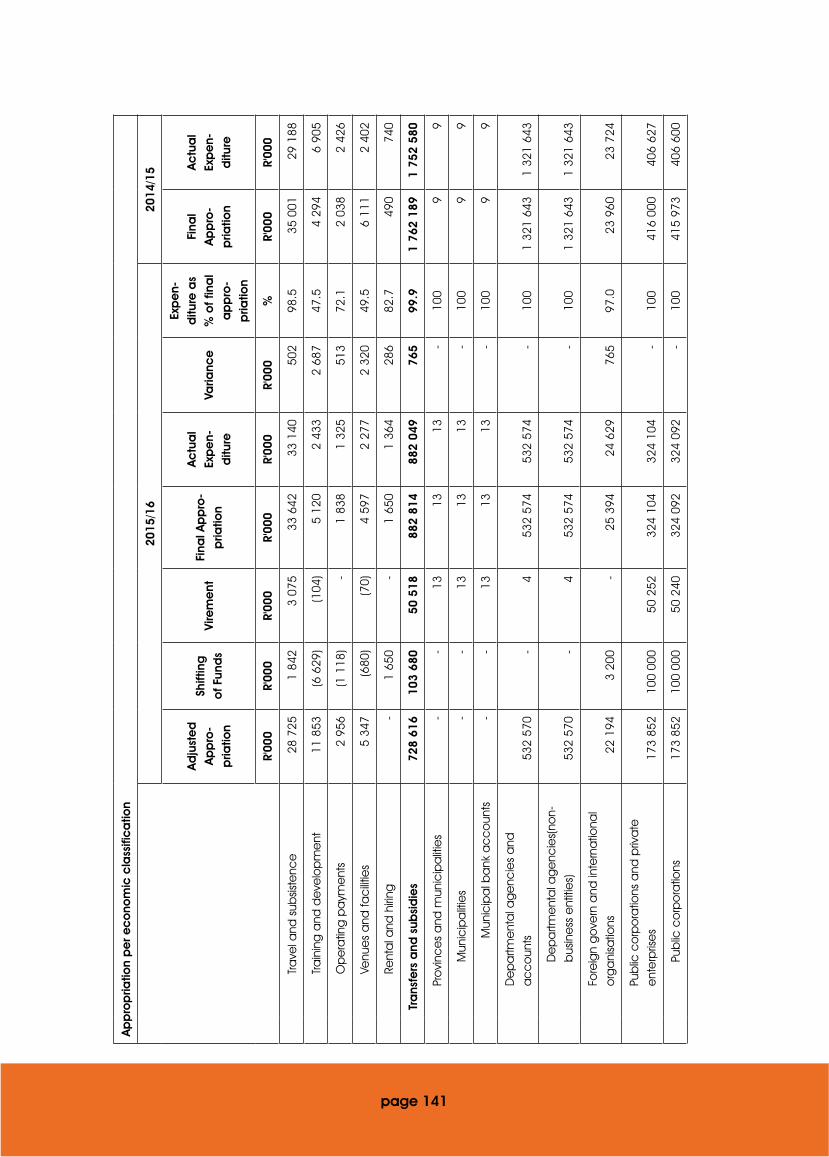
page 141
Ap
pro
pria
tion
pe
r ec
ono
mic
cla
ssifi
ca
tion
2015
/16
2014
/15
Ad
just
ed
A
pp
ro-
pria
tion
Shift
ing
o
f Fun
ds
Vire
me
ntFi
nal A
pp
ro-
pria
tion
Ac
tua
l Ex
pe
n-d
iture
Varia
nce
Exp
en-
ditu
re a
s %
of f
ina
l a
pp
ro-
pria
tion
Fina
l A
pp
ro-
pria
tion
Ac
tua
l Ex
pe
n-d
iture
R'00
0R'
000
R'00
0R'
000
R'00
0R'
000
%R'
000
R'00
0
Tra
vel a
nd s
ubsis
tenc
e28
725
1 84
23
075
33 6
4233
140
502
98.5
35 0
0129
188
Tra
inin
g a
nd d
eve
lop
me
nt11
853
(6 6
29)
(104
)5
120
2 43
32
687
47.5
4 29
46
905
O
pe
ratin
g p
aym
ent
s2
956
(1 1
18)
-1
838
1 32
551
372
.12
038
2 42
6
Ve
nue
s a
nd fa
cilit
ies
5 34
7(6
80)
(70)
4 59
72
277
2 32
049
.56
111
2 40
2
Re
nta
l and
hiri
ng-
1 65
0-
1 65
01
364
286
82.7
490
740
Tr
ans
fers
and
sub
sid
ies
728
616
103
680
50 5
1888
2 81
488
2 04
976
599
.91
762
189
1 75
2 58
0
Pr
ovi
nce
s a
nd m
unic
ipa
litie
s-
-13
1313
-10
09
9
M
unic
ipa
litie
s-
-13
1313
-10
09
9
M
unic
ipa
l ba
nk a
cc
oun
ts-
-13
1313
-10
09
9
D
ep
artm
ent
al a
ge
ncie
s a
nd
ac
co
unts
532
570
-4
532
574
532
574
-10
01
321
643
1 32
1 64
3
D
ep
artm
ent
al a
ge
ncie
s(no
n-b
usin
ess
ent
itie
s)53
2 57
0-
453
2 57
453
2 57
4-
100
1 32
1 64
31
321
643
Fo
reig
n g
ove
rn a
nd in
tern
atio
nal
org
ani
satio
ns22
194
3 20
0-
25 3
9424
629
765
97.0
23 9
6023
724
Pu
blic
co
rpo
ratio
ns a
nd p
riva
te
ent
erp
rise
s17
3 85
210
0 00
050
252
324
104
324
104
-10
041
6 00
040
6 62
7
Pu
blic
co
rpo
ratio
ns17
3 85
210
0 00
050
240
324
092
324
092
-10
041
5 97
340
6 60
0

page 142
Ap
pro
pria
tion
pe
r ec
ono
mic
cla
ssifi
ca
tion
2015
/16
2014
/15
Ad
just
ed
A
pp
ro-
pria
tion
Shift
ing
o
f Fun
ds
Vire
me
ntFi
nal A
pp
ro-
pria
tion
Ac
tua
l Ex
pe
n-d
iture
Varia
nce
Exp
en-
ditu
re a
s %
of f
ina
l a
pp
ro-
pria
tion
Fina
l A
pp
ro-
pria
tion
Ac
tua
l Ex
pe
n-d
iture
R'00
0R'
000
R'00
0R'
000
R'00
0R'
000
%R'
000
R'00
0
O
the
r tra
nsfe
rs to
pub
lic
co
rpo
ratio
ns17
3 85
210
0 00
050
240
324
092
324
092
-10
041
5 97
340
6 60
0
Pr
iva
te e
nte
rpris
es
--
1212
12-
100
2727
O
the
r tra
nsfe
rs to
priv
ate
e
nte
rpris
es
--
1212
12-
100
2727
N
on-
pro
fit in
stitu
tions
--
--
--
-11
011
0
H
ous
eho
lds
-48
024
972
972
9-
-46
746
7
So
cia
l be
nefit
s-
462
209
671
671
--
401
401
O
the
r tra
nsfe
rs to
ho
use
hold
s-
1840
5858
--
6666
Pa
yme
nts
for c
ap
ital a
sse
ts5
061
-2
289
7 35
05
481
1 86
974
.610
419
10 4
18
M
ac
hine
ry a
nd e
qui
pm
ent
5 06
1-
(933
)4
128
3 42
570
383
.010
215
10 2
13
Tra
nsp
ort
eq
uip
me
nt-
--
--
--
2 38
42
384
O
the
r ma
chi
nery
and
e
qui
pm
ent
5 06
1-
(933
)4
128
3 42
570
383
.07
831
7 82
9
So
ftwa
re a
nd o
the
r int
ang
ible
ass
ets
--
3 22
23
222
2 05
61
166
63.8
204
205
Pa
yme
nt fo
r fin
anc
ial a
sse
ts-
544
244
744
7-
100
363
363
1 40
5 25
3-
-1
405
253
1 30
0 09
710
5 15
692
.52
236
657
2 18
1 67
6
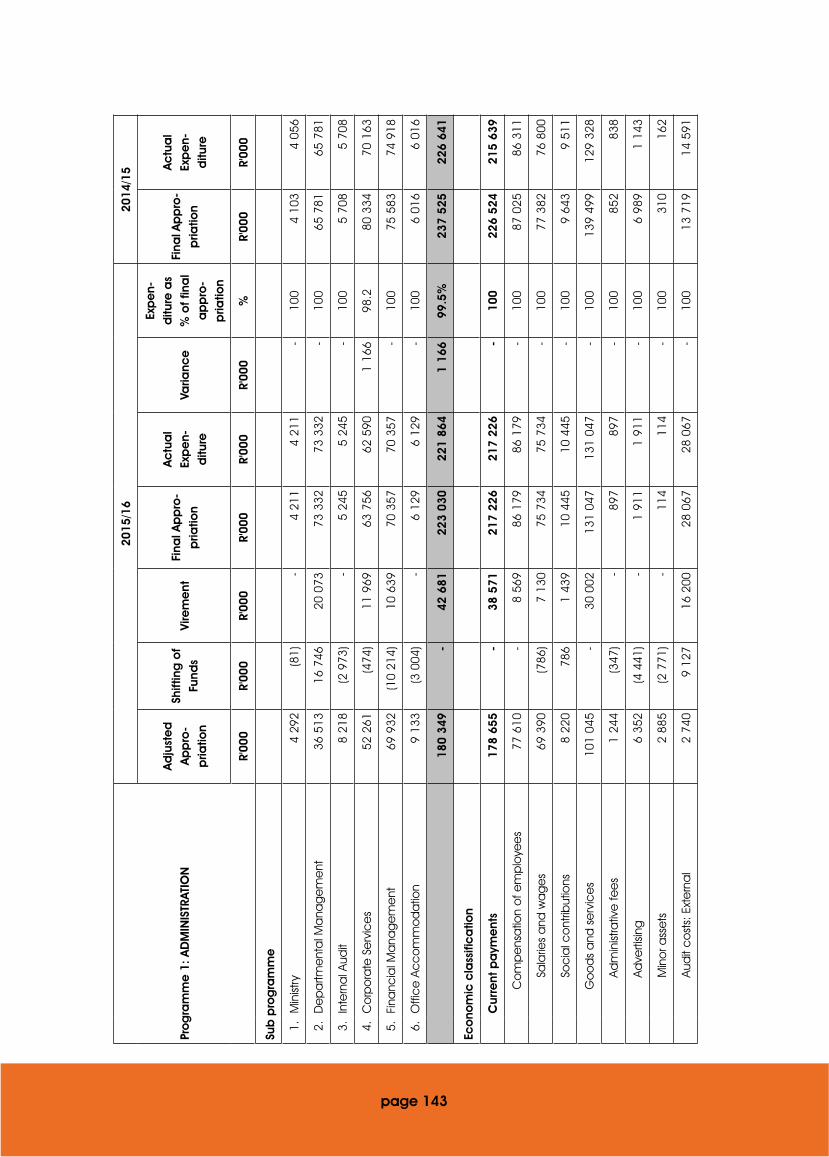
page 143
Pro
gra
mm
e 1
: A
DM
INIS
TRAT
ION
2015
/16
2014
/15
Ad
just
ed
A
pp
ro-
pria
tion
Shift
ing
of
Fund
sVi
rem
ent
Fina
l Ap
pro
-p
riatio
n
Ac
tua
l Ex
pe
n-d
iture
Varia
nce
Exp
en-
ditu
re a
s %
of f
ina
l a
pp
ro-
pria
tion
Fina
l Ap
pro
-p
riatio
n
Ac
tua
l Ex
pe
n-d
iture
R'00
0R'
000
R'00
0R'
000
R'00
0R'
000
%R'
000
R'00
0
Sub
pro
gra
mm
e
1.M
inist
ry4
292
(81)
-4
211
4 21
1-
100
4 10
34
056
2.D
ep
artm
ent
al M
ana
ge
me
nt36
513
16 7
4620
073
73 3
3273
332
-10
065
781
65 7
81
3.In
tern
al A
udit
8 21
8(2
973
)-
5 24
55
245
-10
05
708
5 70
8
4.C
orp
ora
te S
erv
ice
s52
261
(474
)11
969
63 7
5662
590
1 16
698
.280
334
70 1
63
5.Fi
nanc
ial M
ana
ge
me
nt69
932
(10
214)
10 6
3970
357
70 3
57-
100
75 5
8374
918
6.O
ffic
e A
cc
om
mo
da
tion
9 13
3(3
004
)-
6 12
96
129
-10
06
016
6 01
6
180
349
-42
681
223
030
221
864
1 16
699
.5%
237
525
226
641
Eco
nom
ic c
lass
ific
atio
n
C
urre
nt p
aym
ent
s17
8 65
5-
38 5
7121
7 22
621
7 22
6-
100
226
524
215
639
C
om
pe
nsa
tion
of e
mp
loye
es
77 6
10-
8 56
986
179
86 1
79-
100
87 0
2586
311
Sa
larie
s a
nd w
ag
es
69 3
90(7
86)
7 13
075
734
75 7
34-
100
77 3
8276
800
So
cia
l co
ntrib
utio
ns8
220
786
1 43
910
445
10 4
45-
100
9 64
39
511
G
oo
ds
and
se
rvic
es
101
045
-30
002
131
047
131
047
-10
013
9 49
912
9 32
8
Ad
min
istra
tive
fee
s1
244
(347
)-
897
897
-10
085
283
8
Ad
verti
sing
6 35
2(4
441
)-
1 91
11
911
-10
06
989
1 14
3
M
ino
r ass
ets
2 88
5(2
771
)-
114
114
-10
031
016
2
Au
dit
co
sts:
Ext
ern
al
2 74
09
127
16 2
0028
067
28 0
67-
100
13 7
1914
591
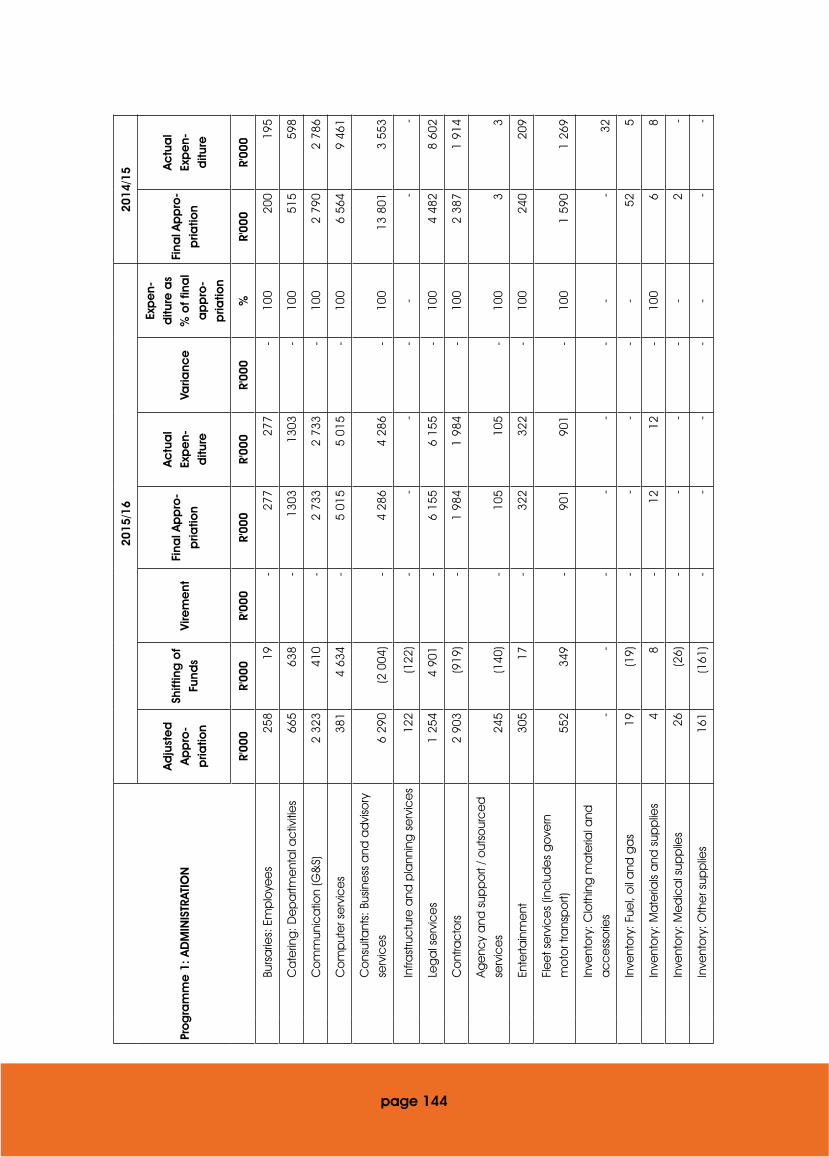
page 144
Pro
gra
mm
e 1
: A
DM
INIS
TRAT
ION
2015
/16
2014
/15
Ad
just
ed
A
pp
ro-
pria
tion
Shift
ing
of
Fund
sVi
rem
ent
Fina
l Ap
pro
-p
riatio
n
Ac
tua
l Ex
pe
n-d
iture
Varia
nce
Exp
en-
ditu
re a
s %
of f
ina
l a
pp
ro-
pria
tion
Fina
l Ap
pro
-p
riatio
n
Ac
tua
l Ex
pe
n-d
iture
R'00
0R'
000
R'00
0R'
000
R'00
0R'
000
%R'
000
R'00
0
Bu
rsa
ries:
Em
plo
yee
s25
819
-27
727
7-
100
200
195
C
ate
ring
: De
pa
rtme
nta
l ac
tiviti
es
665
638
-13
0313
03-
100
515
598
C
om
mun
ica
tion
(G&
S)2
323
410
-2
733
2 73
3-
100
2 79
02
786
C
om
put
er s
erv
ice
s38
14
634
-5
015
5 01
5-
100
6 56
49
461
C
ons
ulta
nts:
Bus
ine
ss a
nd a
dvi
sory
se
rvic
es
6 29
0(2
004
)-
4 28
64
286
-10
013
801
3 55
3
Infra
stru
ctu
re a
nd p
lann
ing
se
rvic
es
122
(122
)-
--
--
--
Le
ga
l se
rvic
es
1 25
44
901
-6
155
6 15
5-
100
4 48
28
602
C
ont
rac
tors
2 90
3(9
19)
-1
984
1 98
4-
100
2 38
71
914
Ag
enc
y a
nd s
upp
ort
/ out
sour
ce
d
serv
ice
s24
5(1
40)
-10
510
5-
100
33
En
terta
inm
ent
305
17-
322
322
-10
024
020
9
Fl
ee
t se
rvic
es
(inc
lud
es
go
vern
m
oto
r tra
nsp
ort)
552
349
-90
190
1-
100
1 59
01
269
In
vent
ory
: Clo
thin
g m
ate
rial a
nd
ac
ce
sso
ries
--
--
--
--
32
In
vent
ory
: Fue
l, o
il a
nd g
as
19(1
9)-
--
--
525
In
vent
ory
: Ma
teria
ls a
nd s
upp
lies
48
-12
12-
100
68
In
vent
ory
: Me
dic
al s
upp
lies
26(2
6)-
--
--
2-
In
vent
ory
: Oth
er s
upp
lies
161
(161
)-
--
--
--

page 145
Pro
gra
mm
e 1
: A
DM
INIS
TRAT
ION
2015
/16
2014
/15
Ad
just
ed
A
pp
ro-
pria
tion
Shift
ing
of
Fund
sVi
rem
ent
Fina
l Ap
pro
-p
riatio
n
Ac
tua
l Ex
pe
n-d
iture
Varia
nce
Exp
en-
ditu
re a
s %
of f
ina
l a
pp
ro-
pria
tion
Fina
l Ap
pro
-p
riatio
n
Ac
tua
l Ex
pe
n-d
iture
R'00
0R'
000
R'00
0R'
000
R'00
0R'
000
%R'
000
R'00
0
C
ons
uma
ble
sup
plie
s50
128
-17
817
8-
100
251
109
C
ons
uma
ble
: Sta
tione
ry, p
rintin
g
and
offi
ce
sup
3 15
71
004
-4
161
4 16
1-
100
3 86
83
760
O
pe
ratin
g le
ase
s39
994
(3 6
39)
6 03
542
390
42 3
90-
100
45 6
2445
717
Pr
op
erty
pa
yme
nts
11 9
71(5
794
)3
965
10 1
4210
142
-10
011
658
11 6
92
Trans
po
rt p
rovi
de
d: D
ep
artm
ent
al
ac
tivity
664
(664
)-
--
--
--
Tra
vel a
nd s
ubsis
tenc
e10
871
2 18
03
802
16 8
5316
853
-10
017
232
16 8
85
Tra
inin
g a
nd d
eve
lop
me
nt2
923
(1 9
13)
-1
010
1 01
0-
100
2 62
82
976
O
pe
ratin
g p
aym
ent
s77
227
8-
1 05
01
050
-10
01
023
1 38
0
Ve
nue
s a
nd fa
cilit
ies
1 91
4(1
374
)-
540
540
-10
02
478
1 24
2
Re
nta
l and
hiri
ng-
641
-64
164
1-
100
235
198
Tr
ans
fers
and
sub
sid
ies
--
278
278
278
-10
01
677
1 67
8
Pr
ovi
nce
s a
nd m
unic
ipa
litie
s-
-13
1313
-10
09
9
M
unic
ipa
litie
s-
-13
1313
-10
09
9
M
unic
ipa
l ba
nk a
cc
oun
ts-
-13
1313
-10
09
9
D
ep
artm
ent
al a
ge
ncie
s a
nd
ac
co
unts
--
44
4-
100
1 19
91
199
D
ep
artm
ent
al a
ge
ncie
s(no
n-b
usin
ess
ent
itie
s)-
-4
44
-10
01
199
1 19
9
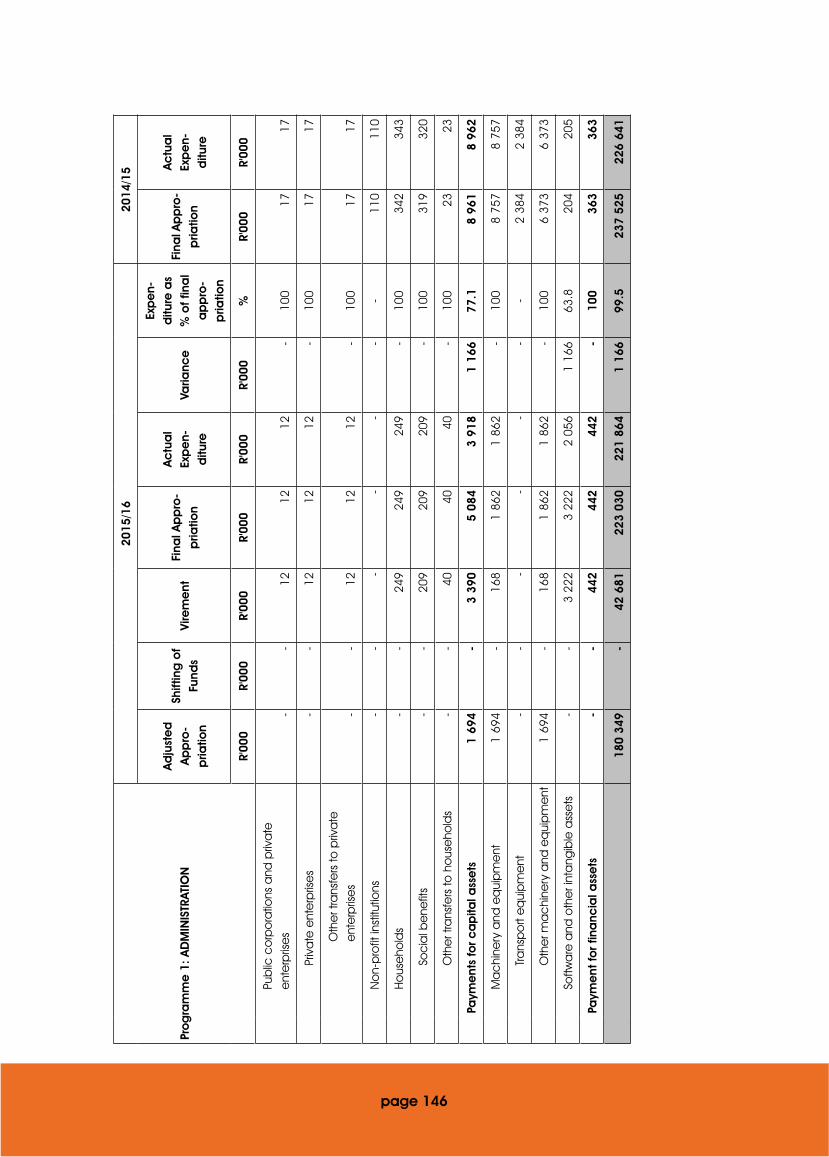
page 146
Pro
gra
mm
e 1
: A
DM
INIS
TRAT
ION
2015
/16
2014
/15
Ad
just
ed
A
pp
ro-
pria
tion
Shift
ing
of
Fund
sVi
rem
ent
Fina
l Ap
pro
-p
riatio
n
Ac
tua
l Ex
pe
n-d
iture
Varia
nce
Exp
en-
ditu
re a
s %
of f
ina
l a
pp
ro-
pria
tion
Fina
l Ap
pro
-p
riatio
n
Ac
tua
l Ex
pe
n-d
iture
R'00
0R'
000
R'00
0R'
000
R'00
0R'
000
%R'
000
R'00
0
Pu
blic
co
rpo
ratio
ns a
nd p
riva
te
ent
erp
rise
s-
-12
1212
-10
017
17
Pr
iva
te e
nte
rpris
es
--
1212
12-
100
1717
O
the
r tra
nsfe
rs to
priv
ate
e
nte
rpris
es
--
1212
12-
100
1717
N
on-
pro
fit in
stitu
tions
--
--
--
-11
011
0
H
ous
eho
lds
--
249
249
249
-10
034
234
3
So
cia
l be
nefit
s-
-20
920
920
9-
100
319
320
O
the
r tra
nsfe
rs to
ho
use
hold
s-
-40
4040
-10
023
23
Pa
yme
nts
for c
ap
ital a
sse
ts1
694
-3
390
5 08
43
918
1 16
677
.18
961
8 96
2
M
ac
hine
ry a
nd e
qui
pm
ent
1 69
4-
168
1 86
21
862
-10
08
757
8 75
7
Tra
nsp
ort
eq
uip
me
nt-
--
--
--
2 38
42
384
O
the
r ma
chi
nery
and
eq
uip
me
nt1
694
-16
81
862
1 86
2-
100
6 37
36
373
So
ftwa
re a
nd o
the
r int
ang
ible
ass
ets
--
3 22
23
222
2 05
61
166
63.8
204
205
Pa
yme
nt fo
r fin
anc
ial a
sse
ts-
-44
244
244
2-
100
363
363
180
349
-42
681
223
030
221
864
1 16
699
.523
7 52
522
6 64
1
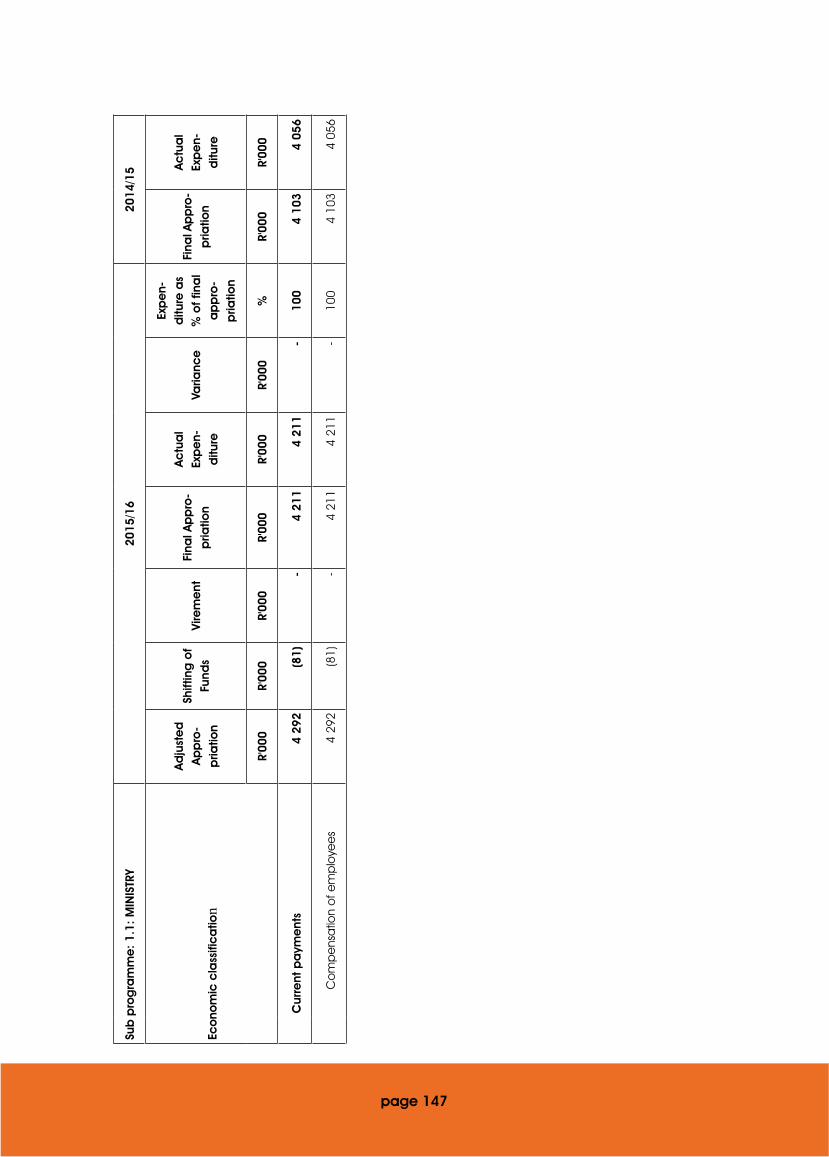
page 147
Sub
pro
gra
mm
e:
1.1:
MIN
ISTR
Y20
15/1
620
14/1
5
Eco
nom
ic c
lass
ific
atio
n
Ad
just
ed
A
pp
ro-
pria
tion
Shift
ing
of
Fund
sVi
rem
ent
Fina
l Ap
pro
-p
riatio
n
Ac
tua
l Ex
pe
n-d
iture
Varia
nce
Exp
en-
ditu
re a
s %
of f
ina
l a
pp
ro-
pria
tion
Fina
l Ap
pro
-p
riatio
n
Ac
tua
l Ex
pe
n-d
iture
R'00
0R'
000
R'00
0R'
000
R'00
0R'
000
%R'
000
R'00
0
Cur
rent
pa
yme
nts
4 29
2(8
1)-
4 21
14
211
-10
04
103
4 05
6
Co
mp
ens
atio
n o
f em
plo
yee
s4
292
(81)
-4
211
4 21
1-
100
4 10
34
056
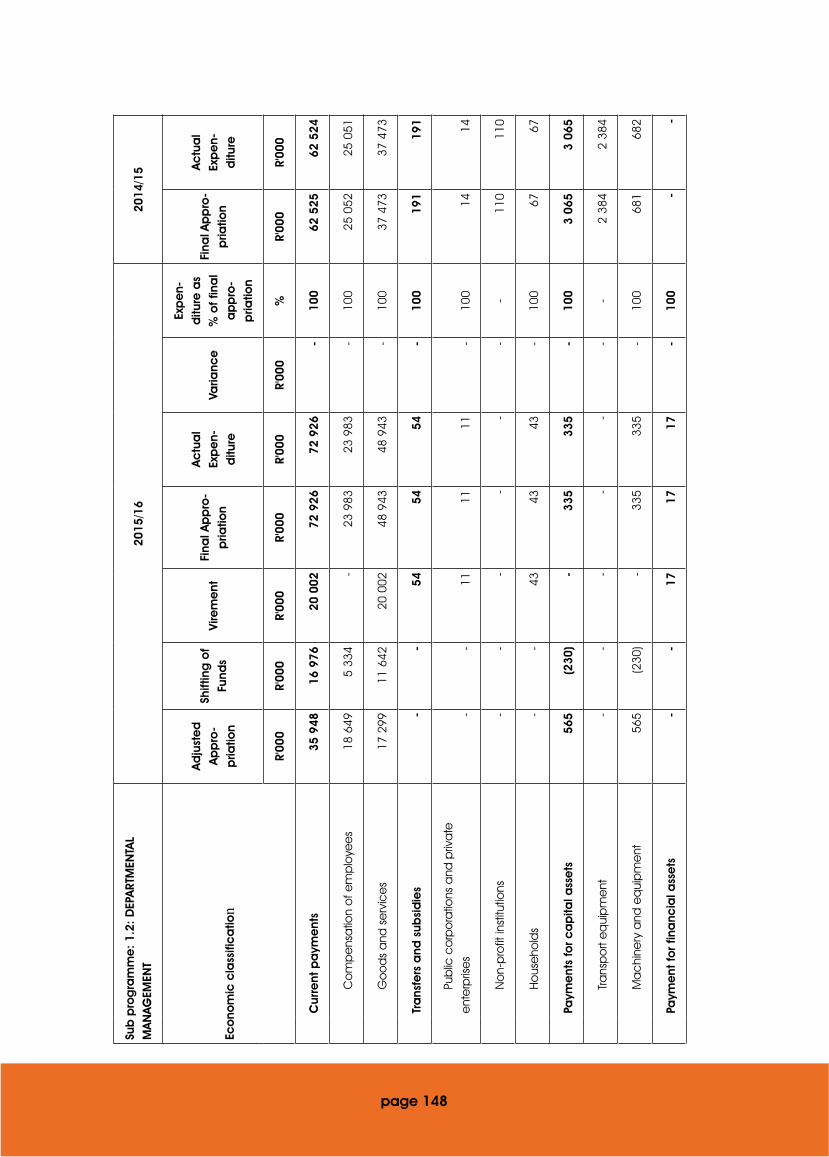
page 148
Sub
pro
gra
mm
e:
1.2:
DEP
ART
MEN
TAL
MA
NAG
EMEN
T20
15/1
620
14/1
5
Eco
nom
ic c
lass
ific
atio
n
Ad
just
ed
A
pp
ro-
pria
tion
Shift
ing
of
Fund
sVi
rem
ent
Fina
l Ap
pro
-p
riatio
n
Ac
tua
l Ex
pe
n-d
iture
Varia
nce
Exp
en-
ditu
re a
s %
of f
ina
l a
pp
ro-
pria
tion
Fina
l Ap
pro
-p
riatio
n
Ac
tua
l Ex
pe
n-d
iture
R'00
0R'
000
R'00
0R'
000
R'00
0R'
000
%R'
000
R'00
0
Cur
rent
pa
yme
nts
35 9
4816
976
20 0
0272
926
72 9
26-
100
62 5
2562
524
Co
mp
ens
atio
n o
f em
plo
yee
s18
649
5 33
4-
23 9
8323
983
-10
025
052
25 0
51
Go
od
s a
nd s
erv
ice
s17
299
11 6
4220
002
48 9
4348
943
-10
037
473
37 4
73
Tra
nsfe
rs a
nd s
ubsi
die
s-
-54
5454
-10
019
119
1
Pub
lic c
orp
ora
tions
and
priv
ate
e
nte
rpris
es
--
1111
11-
100
1414
No
n-p
rofit
inst
itutio
ns-
--
--
--
110
110
Ho
use
hold
s-
-43
4343
-10
067
67
Paym
ent
s fo
r ca
pita
l ass
ets
565
(230
)-
335
335
-10
03
065
3 06
5
Trans
po
rt e
qui
pm
ent
--
--
--
-2
384
2 38
4
Ma
chi
nery
and
eq
uip
me
nt56
5(2
30)
-33
533
5-
100
681
682
Paym
ent
for f
ina
ncia
l ass
ets
--
1717
17-
100
--
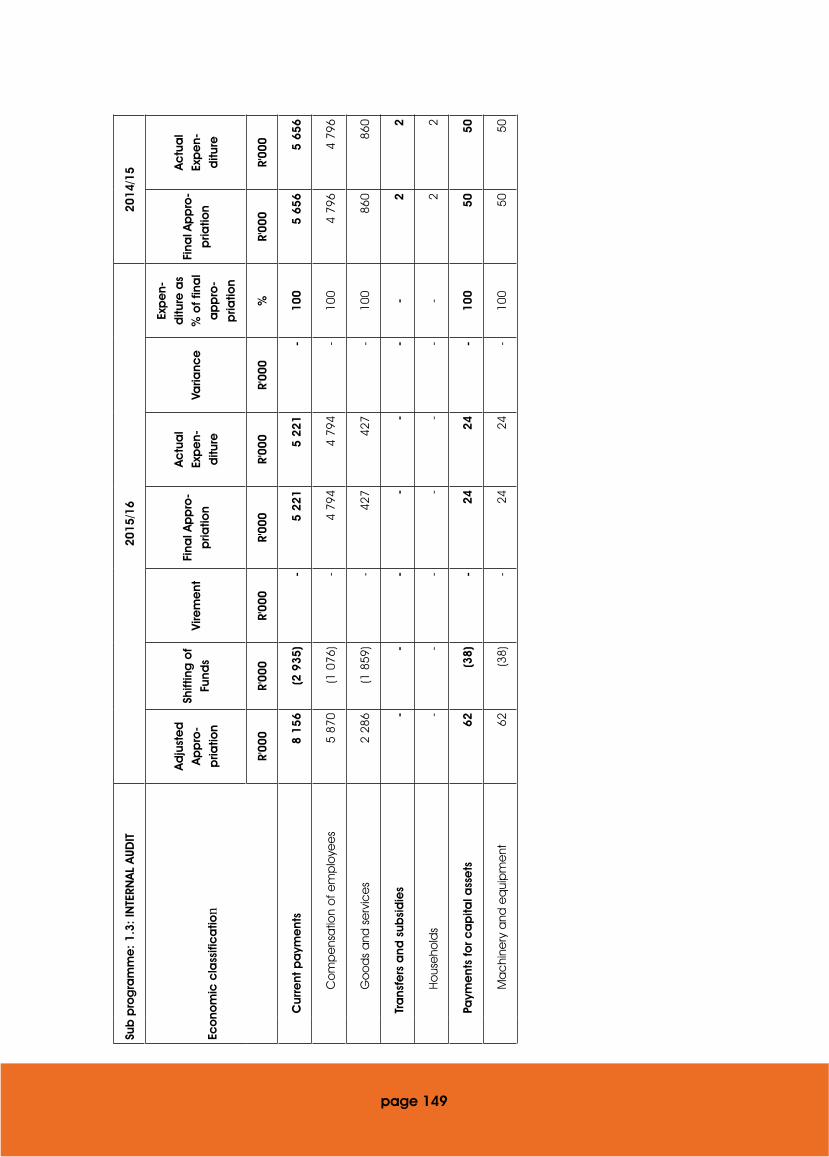
page 149
Sub
pro
gra
mm
e:
1.3:
INTE
RNA
L A
UDIT
2015
/16
2014
/15
Eco
nom
ic c
lass
ific
atio
n
Ad
just
ed
A
pp
ro-
pria
tion
Shift
ing
of
Fund
sVi
rem
ent
Fina
l Ap
pro
-p
riatio
n
Ac
tua
l Ex
pe
n-d
iture
Varia
nce
Exp
en-
ditu
re a
s %
of f
ina
l a
pp
ro-
pria
tion
Fina
l Ap
pro
-p
riatio
n
Ac
tua
l Ex
pe
n-d
iture
R'00
0R'
000
R'00
0R'
000
R'00
0R'
000
%R'
000
R'00
0
Cur
rent
pa
yme
nts
8 15
6(2
935
)-
5 22
15
221
-10
05
656
5 65
6
Co
mp
ens
atio
n o
f em
plo
yee
s5
870
(1 0
76)
-4
794
4 79
4-
100
4 79
64
796
Go
od
s a
nd s
erv
ice
s2
286
(1 8
59)
-42
742
7-
100
860
860
Tra
nsfe
rs a
nd s
ubsi
die
s-
--
--
--
22
Ho
use
hold
s-
--
--
--
22
Paym
ent
s fo
r ca
pita
l ass
ets
62(3
8)-
2424
-10
050
50
Ma
chi
nery
and
eq
uip
me
nt62
(38)
-24
24-
100
5050
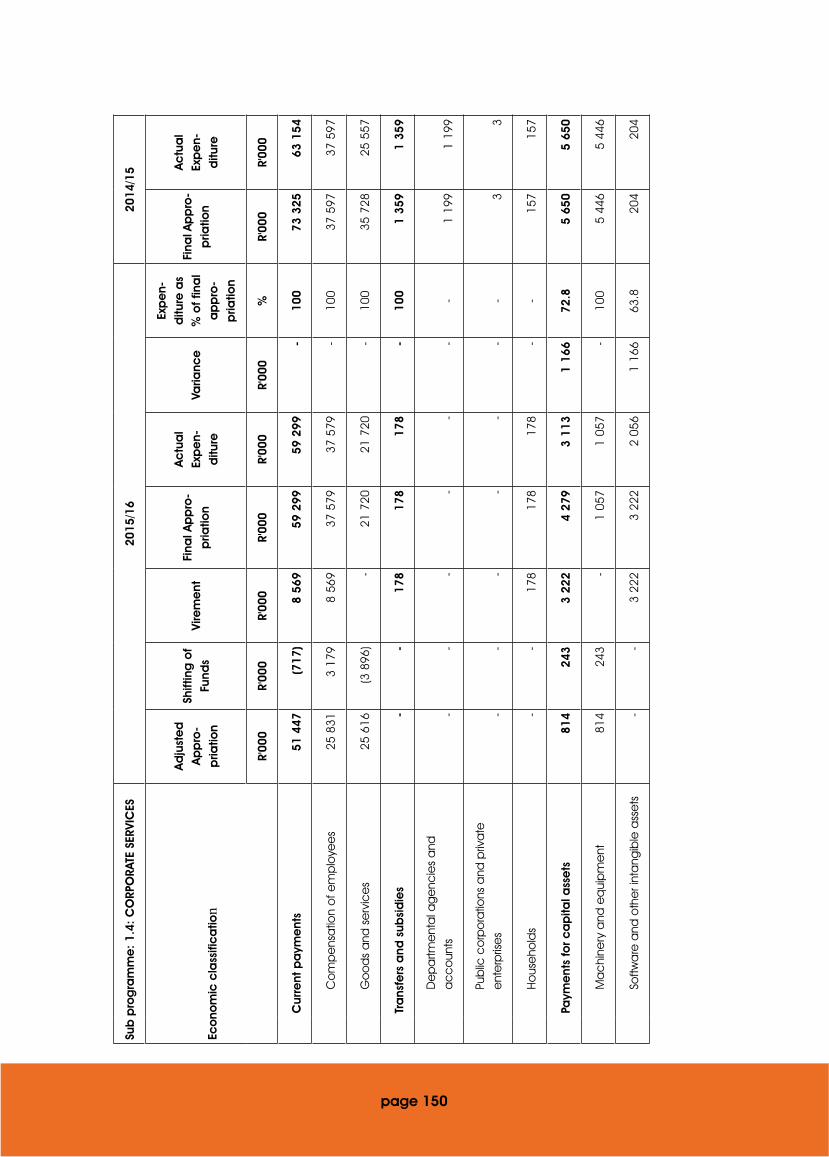
page 150
Sub
pro
gra
mm
e:
1.4:
CO
RPO
RATE
SER
VIC
ES20
15/1
620
14/1
5
Eco
nom
ic c
lass
ific
atio
n
Ad
just
ed
A
pp
ro-
pria
tion
Shift
ing
of
Fund
sVi
rem
ent
Fina
l Ap
pro
-p
riatio
n
Ac
tua
l Ex
pe
n-d
iture
Varia
nce
Exp
en-
ditu
re a
s %
of f
ina
l a
pp
ro-
pria
tion
Fina
l Ap
pro
-p
riatio
n
Ac
tua
l Ex
pe
n-d
iture
R'00
0R'
000
R'00
0R'
000
R'00
0R'
000
%R'
000
R'00
0
Cur
rent
pa
yme
nts
51 4
47(7
17)
8 56
959
299
59 2
99-
100
73 3
2563
154
Co
mp
ens
atio
n o
f em
plo
yee
s25
831
3 17
98
569
37 5
7937
579
-10
037
597
37 5
97
Go
od
s a
nd s
erv
ice
s25
616
(3 8
96)
-21
720
21 7
20-
100
35 7
2825
557
Tra
nsfe
rs a
nd s
ubsi
die
s-
-17
817
817
8-
100
1 35
91
359
De
pa
rtme
nta
l ag
enc
ies
and
a
cc
oun
ts-
--
--
--
1 19
91
199
Pub
lic c
orp
ora
tions
and
priv
ate
e
nte
rpris
es
--
--
--
-3
3
Ho
use
hold
s-
-17
817
817
8-
-15
715
7
Paym
ent
s fo
r ca
pita
l ass
ets
814
243
3 22
24
279
3 11
31
166
72.8
5 65
05
650
Ma
chi
nery
and
eq
uip
me
nt81
424
3-
1 05
71
057
-10
05
446
5 44
6
Softw
are
and
oth
er i
nta
ngib
le a
sse
ts-
-3
222
3 22
22
056
1 16
663
.820
420
4

page 151
Sub
pro
gra
mm
e:
1.5:
FIN
AN
CIA
L M
AN
AGEM
ENT
2015
/16
2014
/15
Eco
nom
ic c
lass
ific
atio
n
Ad
just
ed
A
pp
ro-
pria
tion
Shift
ing
of
Fund
sVi
rem
ent
Fina
l Ap
pro
-p
riatio
n
Ac
tua
l Ex
pe
n-d
iture
Varia
nce
Exp
en-
ditu
re a
s %
of f
ina
l a
pp
ro-
pria
tion
Fina
l Ap
pro
-p
riatio
n
Ac
tua
l Ex
pe
n-d
iture
R'00
0R'
000
R'00
0R'
000
R'00
0R'
000
%R'
000
R'00
0
Cur
rent
pa
yme
nts
69 6
79(1
0 23
9)10
000
69 4
4069
440
-10
074
899
74 2
34
Co
mp
ens
atio
n o
f em
plo
yee
s22
968
(7 3
56)
-15
612
15 6
12-
100
15 4
7714
811
Go
od
s a
nd s
erv
ice
s46
711
(2 8
83)
10 0
0053
828
53 8
28-
100
59 4
2259
423
Tra
nsfe
rs a
nd s
ubsi
die
s-
-46
4646
-10
012
512
5
Pro
vinc
es
and
mun
icip
alit
ies
--
1313
13-
100
99
De
pa
rtme
nta
l ag
enc
ies
and
a
cc
oun
ts-
-4
44
-10
0-
-
Pub
lic c
orp
ora
tions
and
priv
ate
e
nte
rpris
es
--
11
1-
100
--
Ho
use
hold
s-
-28
2828
-10
011
611
6
Paym
ent
s fo
r ca
pita
l ass
ets
253
2516
844
644
6-
100
196
196
Ma
chi
nery
and
eq
uip
me
nt25
325
168
446
446
-10
019
619
6
Paym
ent
for f
ina
ncia
l ass
ets
--
425
425
425
-10
036
336
3

page 152
Sub
pro
gra
mm
e:
1.6:
OFF
ICE
ACC
OM
MO
DAT
ION
2015
/16
2014
/15
Eco
nom
ic c
lass
ific
atio
n
Ad
just
ed
A
pp
ro-
pria
tion
Shift
ing
of
Fund
sVi
rem
ent
Fina
l Ap
pro
-p
riatio
n
Ac
tua
l Ex
pe
n-d
iture
Varia
nce
Exp
en-
ditu
re a
s %
of f
ina
l a
pp
ro-
pria
tion
Fina
l Ap
pro
-p
riatio
n
Ac
tua
l Ex
pe
n-d
iture
R'00
0R'
000
R'00
0R'
000
R'00
0R'
000
%R'
000
R'00
0
Cur
rent
pa
yme
nts
9 13
3(3
004
)-
6 12
96
129
-10
06
016
6 01
6
Go
od
s a
nd s
erv
ice
s9
133
(3 0
04)
-6
129
6 12
9-
100
6 01
66
016
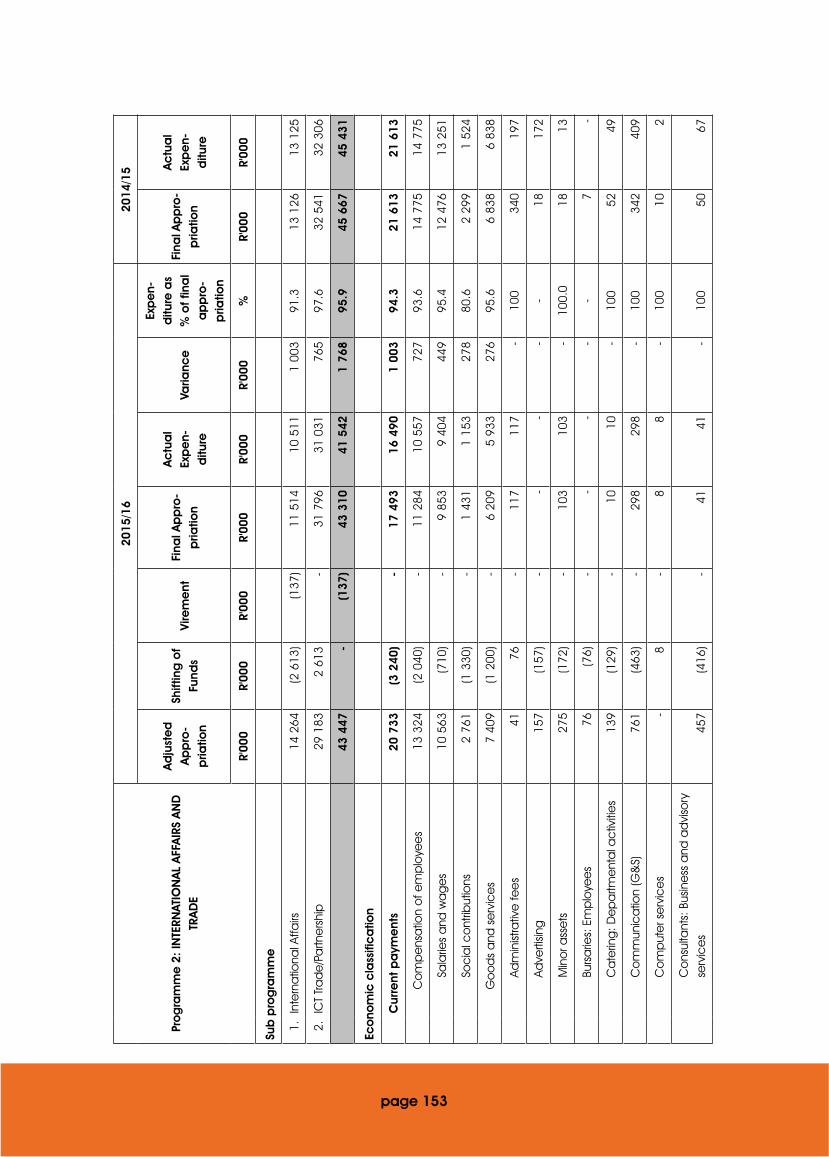
page 153
Pro
gra
mm
e 2
: IN
TERN
ATIO
NA
L A
FFA
IRS
AN
D
TRA
DE
2015
/16
2014
/15
Ad
just
ed
A
pp
ro-
pria
tion
Shift
ing
of
Fund
sVi
rem
ent
Fina
l Ap
pro
-p
riatio
n
Ac
tua
l Ex
pe
n-d
iture
Varia
nce
Exp
en-
ditu
re a
s %
of f
ina
l a
pp
ro-
pria
tion
Fina
l Ap
pro
-p
riatio
n
Ac
tua
l Ex
pe
n-d
iture
R'00
0R'
000
R'00
0R'
000
R'00
0R'
000
%R'
000
R'00
0
Sub
pro
gra
mm
e
1.In
tern
atio
nal A
ffairs
14 2
64(2
613
)(1
37)
11 5
1410
511
1 00
391
.313
126
13 1
25
2.IC
T Tra
de
/Pa
rtne
rshi
p29
183
2 61
3-
31 7
9631
031
765
97.6
32 5
4132
306
43 4
47-
(137
)43
310
41 5
421
768
95.9
45 6
6745
431
Eco
nom
ic c
lass
ific
atio
n
C
urre
nt p
aym
ent
s20
733
(3 2
40)
-17
493
16 4
901
003
94.3
21 6
1321
613
C
om
pe
nsa
tion
of e
mp
loye
es
13 3
24(2
040
)-
11 2
8410
557
727
93.6
14 7
7514
775
Sa
larie
s a
nd w
ag
es
10 5
63(7
10)
-9
853
9 40
444
995
.412
476
13 2
51
So
cia
l co
ntrib
utio
ns2
761
(1 3
30)
-1
431
1 15
327
880
.62
299
1 52
4
G
oo
ds
and
se
rvic
es
7 40
9(1
200
)-
6 20
95
933
276
95.6
6 83
86
838
Ad
min
istra
tive
fee
s41
76-
117
117
-10
034
019
7
Ad
verti
sing
157
(157
)-
--
--
1817
2
M
ino
r ass
ets
275
(172
)-
103
103
-10
0.0
1813
Bu
rsa
ries:
Em
plo
yee
s76
(76)
--
--
-7
-
C
ate
ring
: De
pa
rtme
nta
l ac
tiviti
es
139
(129
)-
1010
-10
052
49
C
om
mun
ica
tion
(G&
S)76
1(4
63)
-29
829
8-
100
342
409
C
om
put
er s
erv
ice
s-
8-
88
-10
010
2
C
ons
ulta
nts:
Bus
ine
ss a
nd a
dvi
sory
se
rvic
es
457
(416
)-
4141
-10
050
67

page 154
Pro
gra
mm
e 2
: IN
TERN
ATIO
NA
L A
FFA
IRS
AN
D
TRA
DE
2015
/16
2014
/15
Ad
just
ed
A
pp
ro-
pria
tion
Shift
ing
of
Fund
sVi
rem
ent
Fina
l Ap
pro
-p
riatio
n
Ac
tua
l Ex
pe
n-d
iture
Varia
nce
Exp
en-
ditu
re a
s %
of f
ina
l a
pp
ro-
pria
tion
Fina
l Ap
pro
-p
riatio
n
Ac
tua
l Ex
pe
n-d
iture
R'00
0R'
000
R'00
0R'
000
R'00
0R'
000
%R'
000
R'00
0
C
ont
rac
tors
448
(448
)-
--
--
200
22
En
terta
inm
ent
54(3
8)-
1616
-10
017
10
Fl
ee
t se
rvic
es
(inc
lud
es
go
vern
m
oto
r tra
nsp
ort)
-1
-1
1-
100
-80
Inve
nto
ry: M
ate
rials
and
sup
plie
s1
(1)
--
--
--
-
In
vent
ory
: Oth
er s
upp
lies
2(2
)-
--
--
--
C
ons
uma
ble
sup
plie
s-
5-
55
-10
0-
2
C
ons
uma
ble
: Sta
tione
ry, p
rint a
nd
offi
ce
sup
110
(62)
-48
48-
100
6533
8
O
pe
ratin
g le
ase
s30
8(2
24)
-84
84-
100
114
113
Pr
op
erty
pa
yme
nts
--
--
--
--
1
Tra
vel a
nd s
ubsis
tenc
e2
405
2 83
8-
5 24
34
967
276
94.7
4 64
34
524
Tra
inin
g a
nd d
eve
lop
me
nt96
(90)
-6
6-
100
7515
7
O
pe
ratin
g p
aym
ent
s1
540
(1 5
40)
--
--
-20
013
8
Ve
nue
s a
nd fa
cilit
ies
539
(345
)-
194
194
-10
046
220
9
Re
nta
l and
hiri
ng-
35-
3535
-10
022
533
4

page 155
Pro
gra
mm
e 2
: IN
TERN
ATIO
NA
L A
FFA
IRS
AN
D
TRA
DE
2015
/16
2014
/15
Ad
just
ed
A
pp
ro-
pria
tion
Shift
ing
of
Fund
sVi
rem
ent
Fina
l Ap
pro
-p
riatio
n
Ac
tua
l Ex
pe
n-d
iture
Varia
nce
Exp
en-
ditu
re a
s %
of f
ina
l a
pp
ro-
pria
tion
Fina
l Ap
pro
-p
riatio
n
Ac
tua
l Ex
pe
n-d
iture
R'00
0R'
000
R'00
0R'
000
R'00
0R'
000
%R'
000
R'00
0
Tr
ans
fers
and
sub
sid
ies
22 1
943
240
-25
434
24 6
6976
597
.024
000
23 7
64
Fo
reig
n g
ove
rn a
nd in
tern
atio
nal
org
ani
satio
ns22
194
3 20
0-
25 3
9424
629
765
97.0
23 9
6023
724
H
ous
eho
lds
-40
-40
40-
100
4040
So
cia
l be
nefit
s-
38-
3838
-10
021
21
O
the
r tra
nsfe
rs to
ho
use
hold
s-
2-
22
-10
019
19
Pa
yme
nts
for c
ap
ital a
sse
ts52
0-
(137
)38
338
3-
100
5454
M
ac
hine
ry a
nd e
qui
pm
ent
520
-(1
37)
383
383
-10
054
54
O
the
r ma
chi
nery
and
eq
uip
me
nt52
0-
(137
)38
338
3-
100
5454
43 4
47-
(137
)43
310
41 5
421
768
95.9
45 6
6745
431

page 156
Sub
pro
gra
mm
e:
2.1:
INTE
RNAT
ION
AL
AFF
AIR
S20
15/1
620
14/1
5
Eco
nom
ic c
lass
ific
atio
n
Ad
just
ed
A
pp
ro-
pria
tion
Shift
ing
of
Fund
sVi
rem
ent
Fina
l Ap
pro
-p
riatio
n
Ac
tua
l Ex
pe
n-d
iture
Varia
nce
Exp
en-
ditu
re a
s %
of f
ina
l a
pp
ro-
pria
tion
Fina
l Ap
pro
-p
riatio
n
Ac
tua
l Ex
pe
n-d
iture
R'00
0R'
000
R'00
0R'
000
R'00
0R'
000
%R'
000
R'00
0
Cur
rent
pa
yme
nts
13 9
25(2
578
)-
11 3
4710
344
1 00
391
.213
073
13 0
72
Co
mp
ens
atio
n o
f em
plo
yee
s9
979
(2 4
49)
-7
530
6 80
372
790
.38
993
8 99
3
Go
od
s a
nd s
erv
ice
s3
946
(129
)-
3 81
73
541
276
92.8
4 08
04
079
Tra
nsfe
rs a
nd s
ubsi
die
s-
40-
4040
-10
023
23
Ho
use
hold
s-
40-
4040
-10
023
23
Paym
ent
s fo
r ca
pita
l ass
ets
339
(75)
(137
)12
712
7-
100
3030
Ma
chi
nery
and
eq
uip
me
nt33
9(7
5)(1
37)
127
127
-10
030
30
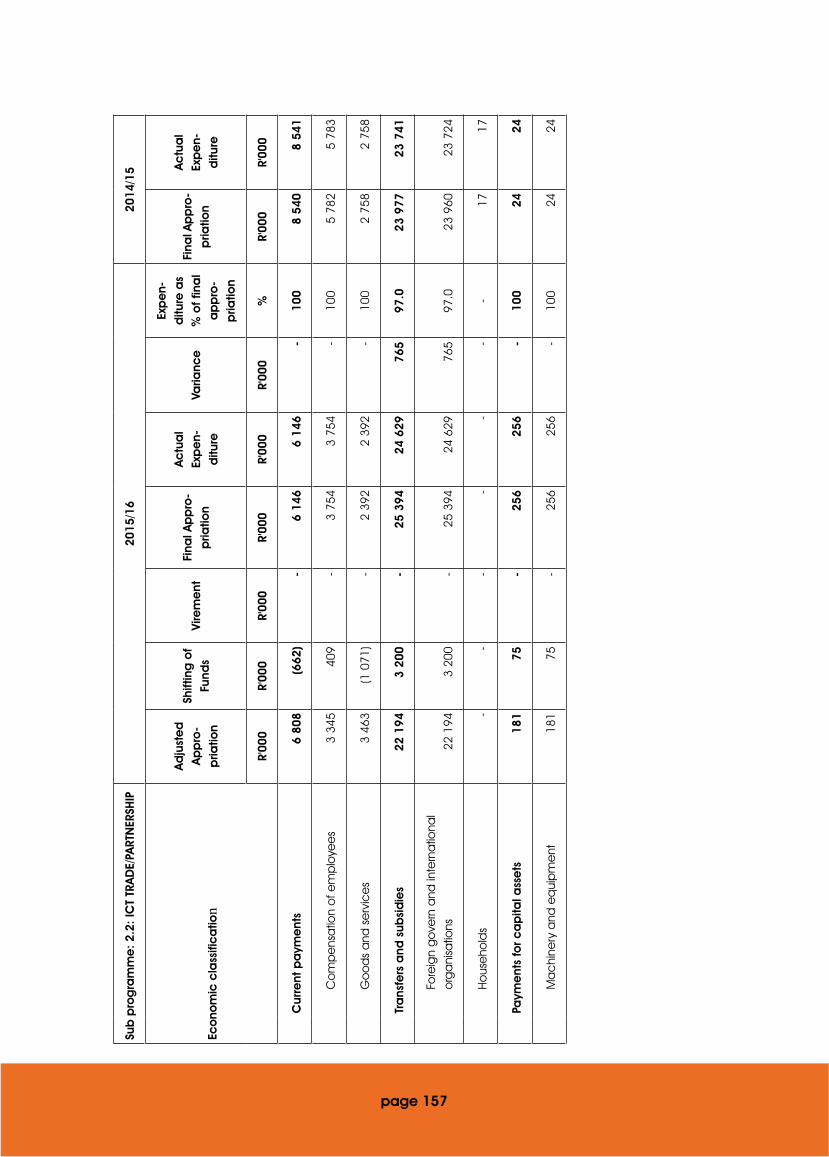
page 157
Sub
pro
gra
mm
e:
2.2:
ICT
TRA
DE/
PART
NER
SHIP
2015
/16
2014
/15
Eco
nom
ic c
lass
ific
atio
n
Ad
just
ed
A
pp
ro-
pria
tion
Shift
ing
of
Fund
sVi
rem
ent
Fina
l Ap
pro
-p
riatio
n
Ac
tua
l Ex
pe
n-d
iture
Varia
nce
Exp
en-
ditu
re a
s %
of f
ina
l a
pp
ro-
pria
tion
Fina
l Ap
pro
-p
riatio
n
Ac
tua
l Ex
pe
n-d
iture
R'00
0R'
000
R'00
0R'
000
R'00
0R'
000
%R'
000
R'00
0
Cur
rent
pa
yme
nts
6 80
8(6
62)
-6
146
6 14
6-
100
8 54
08
541
Co
mp
ens
atio
n o
f em
plo
yee
s3
345
409
-3
754
3 75
4-
100
5 78
25
783
Go
od
s a
nd s
erv
ice
s3
463
(1 0
71)
-2
392
2 39
2-
100
2 75
82
758
Tra
nsfe
rs a
nd s
ubsi
die
s22
194
3 20
0-
25 3
9424
629
765
97.0
23 9
7723
741
Fore
ign
go
vern
and
inte
rna
tiona
l o
rga
nisa
tions
22 1
943
200
-25
394
24 6
2976
597
.023
960
23 7
24
Ho
use
hold
s-
--
--
--
1717
Paym
ent
s fo
r ca
pita
l ass
ets
181
75-
256
256
-10
024
24
Ma
chi
nery
and
eq
uip
me
nt18
175
-25
625
6-
100
2424
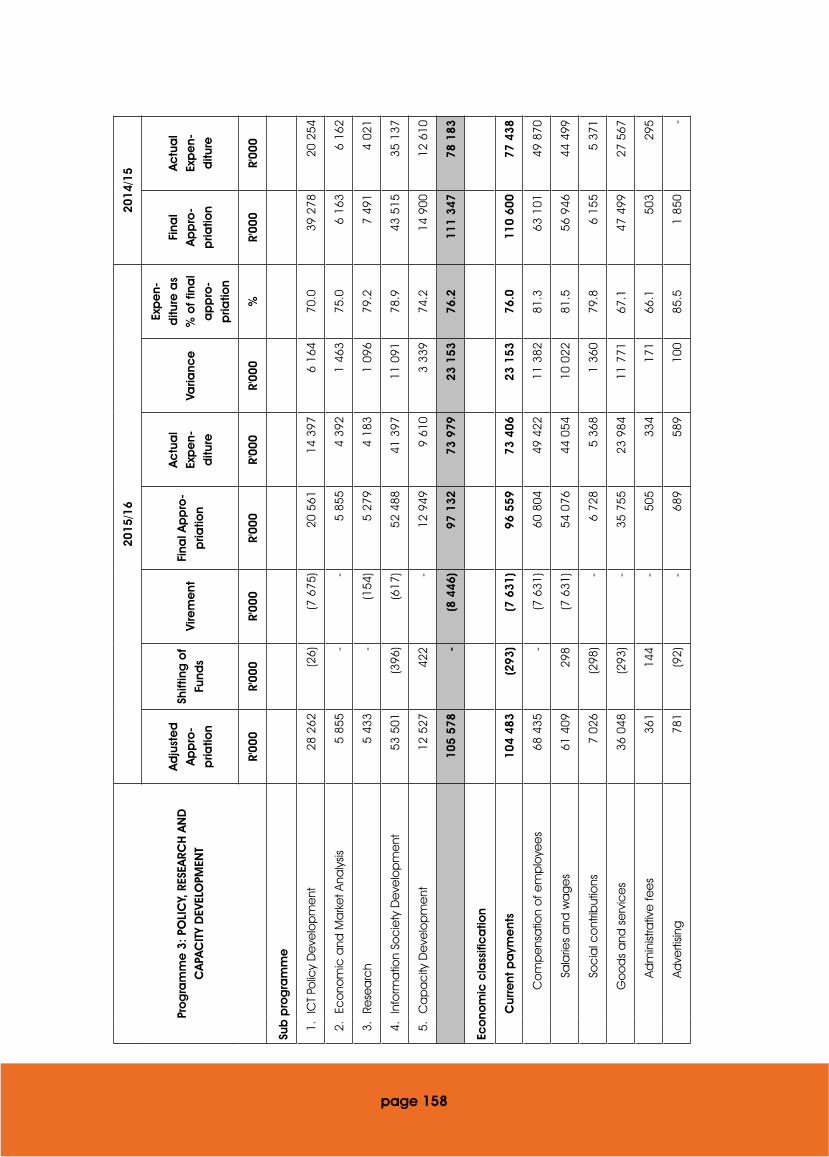
page 158
Pro
gra
mm
e 3
: PO
LIC
Y, R
ESEA
RCH
AN
D
CA
PAC
ITY
DEV
ELO
PMEN
T
2015
/16
2014
/15
Ad
just
ed
A
pp
ro-
pria
tion
Shift
ing
of
Fund
sVi
rem
ent
Fina
l Ap
pro
-p
riatio
n
Ac
tua
l Ex
pe
n-d
iture
Varia
nce
Exp
en-
ditu
re a
s %
of f
ina
l a
pp
ro-
pria
tion
Fina
l A
pp
ro-
pria
tion
Ac
tua
l Ex
pe
n-d
iture
R'00
0R'
000
R'00
0R'
000
R'00
0R'
000
%R'
000
R'00
0
Sub
pro
gra
mm
e
1.IC
T Po
licy
De
velo
pm
ent
28 2
62(2
6)(7
675
)20
561
14 3
976
164
70.0
39 2
7820
254
2.Ec
ono
mic
and
Ma
rke
t Ana
lysis
5 85
5-
-5
855
4 39
21
463
75.0
6 16
36
162
3.Re
sea
rch
5 43
3-
(154
)5
279
4 18
31
096
79.2
7 49
14
021
4.In
form
atio
n So
cie
ty D
eve
lop
me
nt53
501
(396
)(6
17)
52 4
8841
397
11 0
9178
.943
515
35 1
37
5.C
ap
ac
ity D
eve
lop
me
nt12
527
422
-12
949
9 61
03
339
74.2
14 9
0012
610
105
578
-(8
446
)97
132
73 9
7923
153
76.2
111
347
78 1
83
Eco
nom
ic c
lass
ific
atio
n
C
urre
nt p
aym
ent
s10
4 48
3(2
93)
(7 6
31)
96 5
5973
406
23 1
5376
.011
0 60
077
438
C
om
pe
nsa
tion
of e
mp
loye
es
68 4
35-
(7 6
31)
60 8
0449
422
11 3
8281
.363
101
49 8
70
Sa
larie
s a
nd w
ag
es
61 4
0929
8(7
631
)54
076
44 0
5410
022
81.5
56 9
4644
499
So
cia
l co
ntrib
utio
ns7
026
(298
)-
6 72
85
368
1 36
079
.86
155
5 37
1
G
oo
ds
and
se
rvic
es
36 0
48(2
93)
-35
755
23 9
8411
771
67.1
47 4
9927
567
Ad
min
istra
tive
fee
s36
114
4-
505
334
171
66.1
503
295
Ad
verti
sing
781
(92)
-68
958
910
085
.51
850
-

page 159
Pro
gra
mm
e 3
: PO
LIC
Y, R
ESEA
RCH
AN
D
CA
PAC
ITY
DEV
ELO
PMEN
T
2015
/16
2014
/15
Ad
just
ed
A
pp
ro-
pria
tion
Shift
ing
of
Fund
sVi
rem
ent
Fina
l Ap
pro
-p
riatio
n
Ac
tua
l Ex
pe
n-d
iture
Varia
nce
Exp
en-
ditu
re a
s %
of f
ina
l a
pp
ro-
pria
tion
Fina
l A
pp
ro-
pria
tion
Ac
tua
l Ex
pe
n-d
iture
R'00
0R'
000
R'00
0R'
000
R'00
0R'
000
%R'
000
R'00
0
M
ino
r ass
ets
412
(294
)-
118
3583
29.7
432
79
Bu
rsa
ries:
Em
plo
yee
s16
733
-20
010
595
52.5
331
464
C
ate
ring
: De
pa
rtme
nta
l ac
tiviti
es
587
122
-70
954
816
177
.345
042
3
C
om
mun
ica
tion
(G&
S)1
874
(280
)-
1 59
41
335
259
83.8
1 88
01
346
C
om
put
er s
erv
ice
s28
0(2
43)
-37
-37
-72
2
C
ons
ulta
nts:
Bus
ine
ss a
nd a
dvi
sory
se
rvic
es
9 45
06
316
-15
766
10 1
225
644
64.2
25 0
2513
223
Le
ga
l se
rvic
es
-10
0-
100
-10
0-
--
C
ont
rac
tors
526
(385
)-
141
7071
49.6
294
306
Ag
enc
y a
nd s
upp
ort
/ out
sour
ce
d
serv
ice
s11
8(7
9)-
3939
-10
050
-
En
terta
inm
ent
141
33-
174
5611
832
.293
25
Fl
ee
t se
rvic
es
(inc
lud
es
go
vern
m
oto
r tra
nsp
ort)
196
(96)
-10
087
1387
.023
988
In
vent
ory
: Clo
thin
g m
ate
rial a
nd
ac
ce
sso
ries
--
--
--
--
87
In
vent
ory
: Ma
teria
ls a
nd s
upp
lies
14(1
2)-
2-
2-
12

Pro
gra
mm
e 3
: PO
LIC
Y, R
ESEA
RCH
AN
D
CA
PAC
ITY
DEV
ELO
PMEN
T
2015
/16
2014
/15
Ad
just
ed
A
pp
ro-
pria
tion
Shift
ing
of
Fund
sVi
rem
ent
Fina
l Ap
pro
-p
riatio
n
Ac
tua
l Ex
pe
n-d
iture
Varia
nce
Exp
en-
ditu
re a
s %
of f
ina
l a
pp
ro-
pria
tion
Fina
l A
pp
ro-
pria
tion
Ac
tua
l Ex
pe
n-d
iture
R'00
0R'
000
R'00
0R'
000
R'00
0R'
000
%R'
000
R'00
0
Inve
nto
ry: O
the
r sup
plie
s17
(17)
--
--
--
-
C
ons
uma
ble
sup
plie
s3
40-
4314
2932
.642
18
C
ons
uma
ble
: Sta
tione
ry, p
rint a
nd
offi
ce
sup
1 47
2(6
87)
-78
561
317
278
.11
637
1 06
3
O
pe
ratin
g le
ase
s1
374
(801
)-
573
511
6289
.279
265
5
Pr
op
erty
pa
yme
nts
-10
-10
10-
100.
0-
-
Tra
nsp
ort
pro
vid
ed
: De
pa
rtme
nta
l a
ctiv
ity-
200
-20
0-
200
--
-
Tra
vel a
nd s
ubsis
tenc
e8
609
(2 4
32)
-6
177
6 17
25
99.9
8 95
14
035
Tra
inin
g a
nd d
eve
lop
me
nt8
022
(4 3
84)
-3
638
1 27
42
364
35.0
1 43
93
662
O
pe
ratin
g p
aym
ent
s11
265
1-
763
250
513
32.8
620
868
Ve
nue
s a
nd fa
cilit
ies
1 53
289
2-
2 42
41
138
1 28
646
.92
768
748
Re
nta
l and
hiri
ng-
968
-96
868
228
670
.530
179
page 160
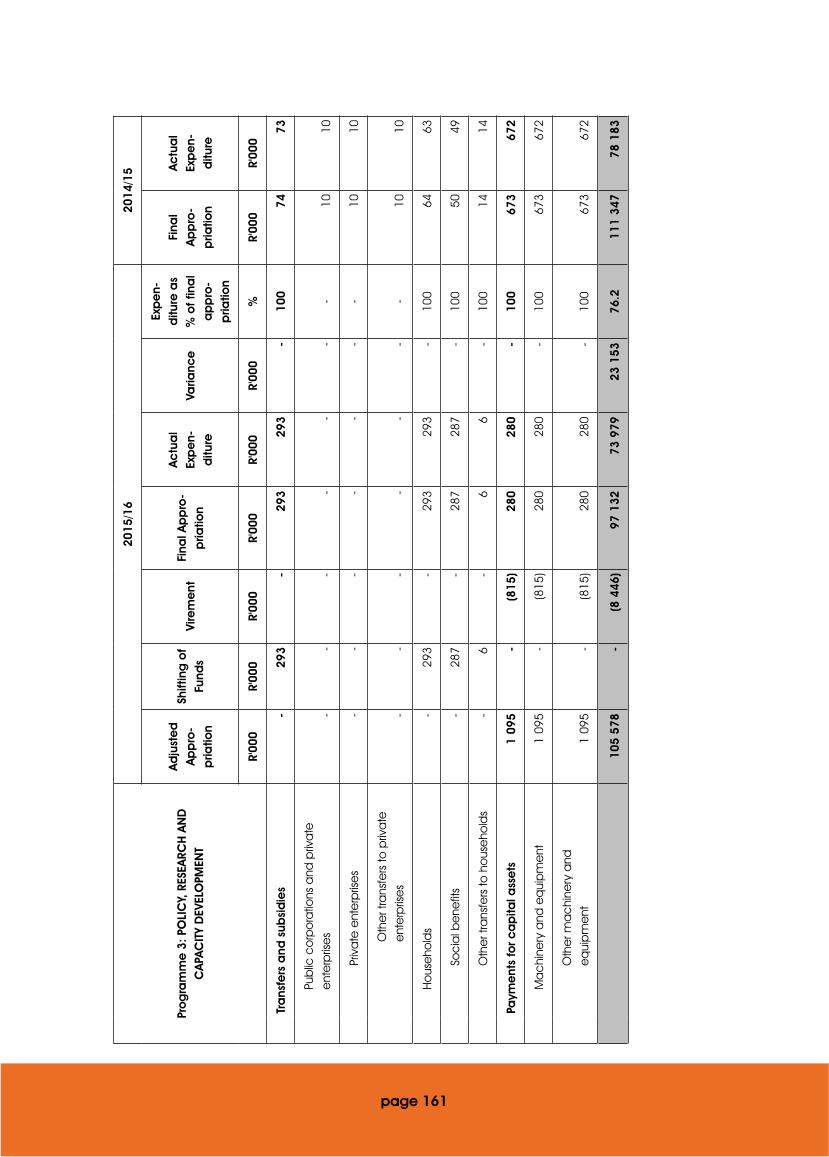
page 161
Pro
gra
mm
e 3
: PO
LIC
Y, R
ESEA
RCH
AN
D
CA
PAC
ITY
DEV
ELO
PMEN
T
2015
/16
2014
/15
Ad
just
ed
A
pp
ro-
pria
tion
Shift
ing
of
Fund
sVi
rem
ent
Fina
l Ap
pro
-p
riatio
n
Ac
tua
l Ex
pe
n-d
iture
Varia
nce
Exp
en-
ditu
re a
s %
of f
ina
l a
pp
ro-
pria
tion
Fina
l A
pp
ro-
pria
tion
Ac
tua
l Ex
pe
n-d
iture
R'00
0R'
000
R'00
0R'
000
R'00
0R'
000
%R'
000
R'00
0
Tr
ans
fers
and
sub
sid
ies
-29
3-
293
293
-10
074
73
Pu
blic
co
rpo
ratio
ns a
nd p
riva
te
ent
erp
rise
s-
--
--
--
1010
Pr
iva
te e
nte
rpris
es
--
--
--
-10
10
O
the
r tra
nsfe
rs to
priv
ate
e
nte
rpris
es
--
--
--
-10
10
H
ous
eho
lds
-29
3-
293
293
-10
064
63
So
cia
l be
nefit
s-
287
-28
728
7-
100
5049
O
the
r tra
nsfe
rs to
ho
use
hold
s-
6-
66
-10
014
14
Pa
yme
nts
for c
ap
ital a
sse
ts1
095
-(8
15)
280
280
-10
067
367
2
M
ac
hine
ry a
nd e
qui
pm
ent
1 09
5-
(815
)28
028
0-
100
673
672
O
the
r ma
chi
nery
and
e
qui
pm
ent
1 09
5-
(815
)28
028
0-
100
673
672
105
578
-(8
446
)97
132
73 9
7923
153
76.2
111
347
78 1
83
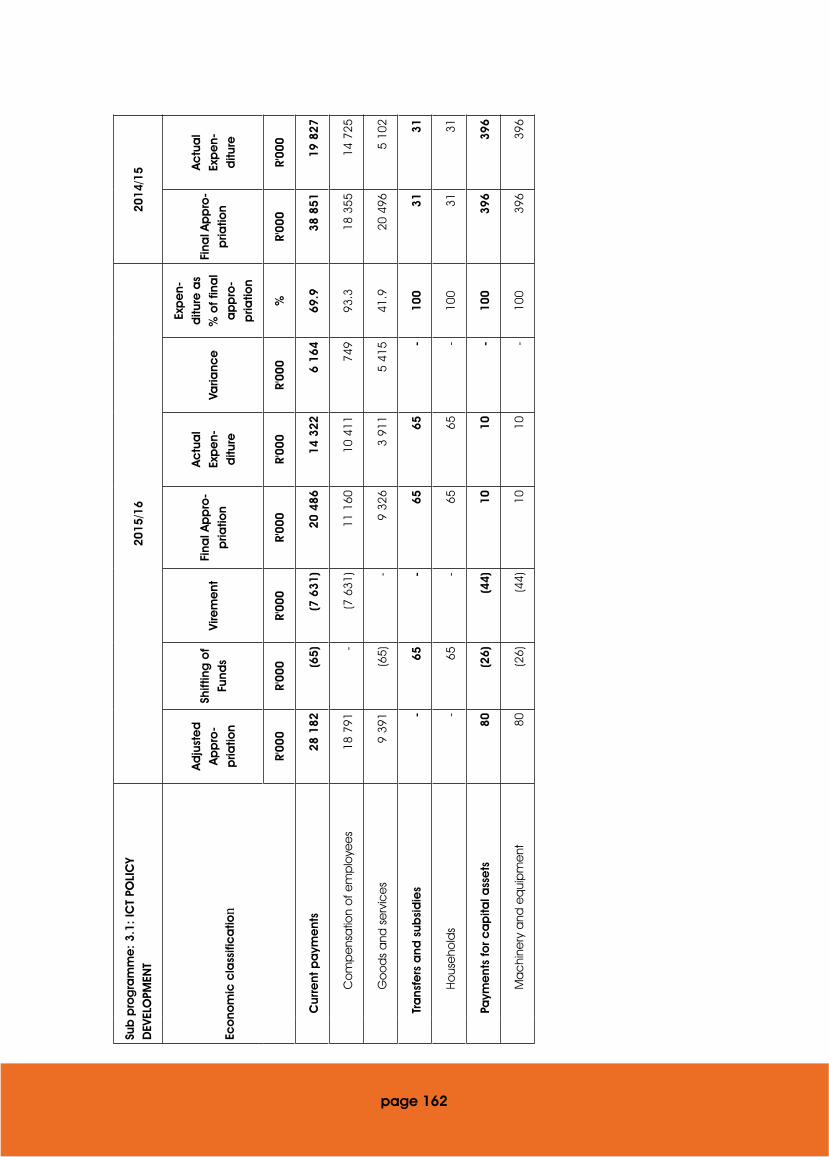
page 162
Sub
pro
gra
mm
e:
3.1:
ICT
POLI
CY
DEV
ELO
PMEN
T20
15/1
620
14/1
5
Eco
nom
ic c
lass
ific
atio
n
Ad
just
ed
A
pp
ro-
pria
tion
Shift
ing
of
Fund
sVi
rem
ent
Fina
l Ap
pro
-p
riatio
n
Ac
tua
l Ex
pe
n-d
iture
Varia
nce
Exp
en-
ditu
re a
s %
of f
ina
l a
pp
ro-
pria
tion
Fina
l Ap
pro
-p
riatio
n
Ac
tua
l Ex
pe
n-d
iture
R'00
0R'
000
R'00
0R'
000
R'00
0R'
000
%R'
000
R'00
0
Cur
rent
pa
yme
nts
28 1
82(6
5)(7
631
)20
486
14 3
226
164
69.9
38 8
5119
827
Co
mp
ens
atio
n o
f em
plo
yee
s18
791
-(7
631
)11
160
10 4
1174
993
.318
355
14 7
25
Go
od
s a
nd s
erv
ice
s9
391
(65)
-9
326
3 91
15
415
41.9
20 4
965
102
Tra
nsfe
rs a
nd s
ubsi
die
s-
65-
6565
-10
031
31
Ho
use
hold
s-
65-
6565
-10
031
31
Paym
ent
s fo
r ca
pita
l ass
ets
80(2
6)(4
4)10
10-
100
396
396
Ma
chi
nery
and
eq
uip
me
nt80
(26)
(44)
1010
-10
039
639
6
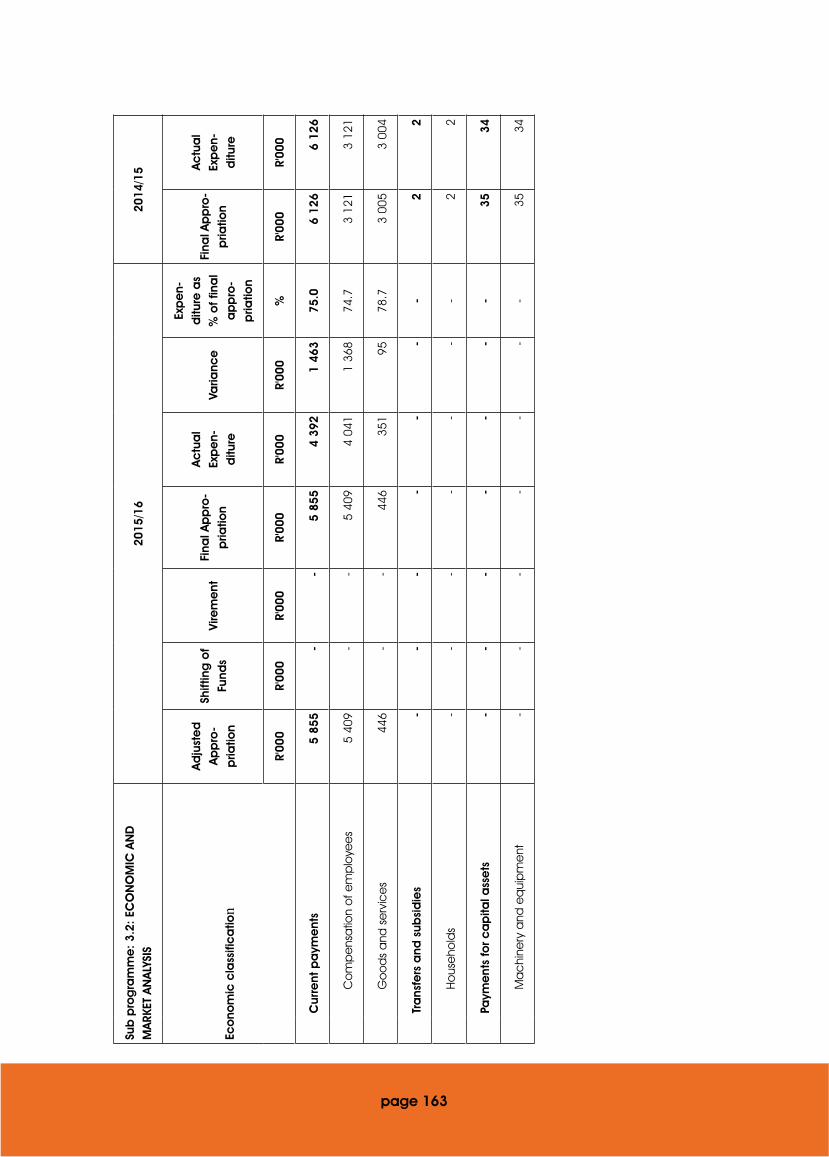
page 163
Sub
pro
gra
mm
e:
3.2:
EC
ON
OM
IC A
ND
M
ARK
ET A
NA
LYSI
S20
15/1
620
14/1
5
Eco
nom
ic c
lass
ific
atio
n
Ad
just
ed
A
pp
ro-
pria
tion
Shift
ing
of
Fund
sVi
rem
ent
Fina
l Ap
pro
-p
riatio
n
Ac
tua
l Ex
pe
n-d
iture
Varia
nce
Exp
en-
ditu
re a
s %
of f
ina
l a
pp
ro-
pria
tion
Fina
l Ap
pro
-p
riatio
n
Ac
tua
l Ex
pe
n-d
iture
R'00
0R'
000
R'00
0R'
000
R'00
0R'
000
%R'
000
R'00
0
Cur
rent
pa
yme
nts
5 85
5-
-5
855
4 39
21
463
75.0
6 12
66
126
Co
mp
ens
atio
n o
f em
plo
yee
s5
409
--
5 40
94
041
1 36
874
.73
121
3 12
1
Go
od
s a
nd s
erv
ice
s44
6-
-44
635
195
78.7
3 00
53
004
Tra
nsfe
rs a
nd s
ubsi
die
s-
--
--
--
22
Ho
use
hold
s-
--
--
--
22
Paym
ent
s fo
r ca
pita
l ass
ets
--
--
--
-35
34
Ma
chi
nery
and
eq
uip
me
nt-
--
--
--
3534
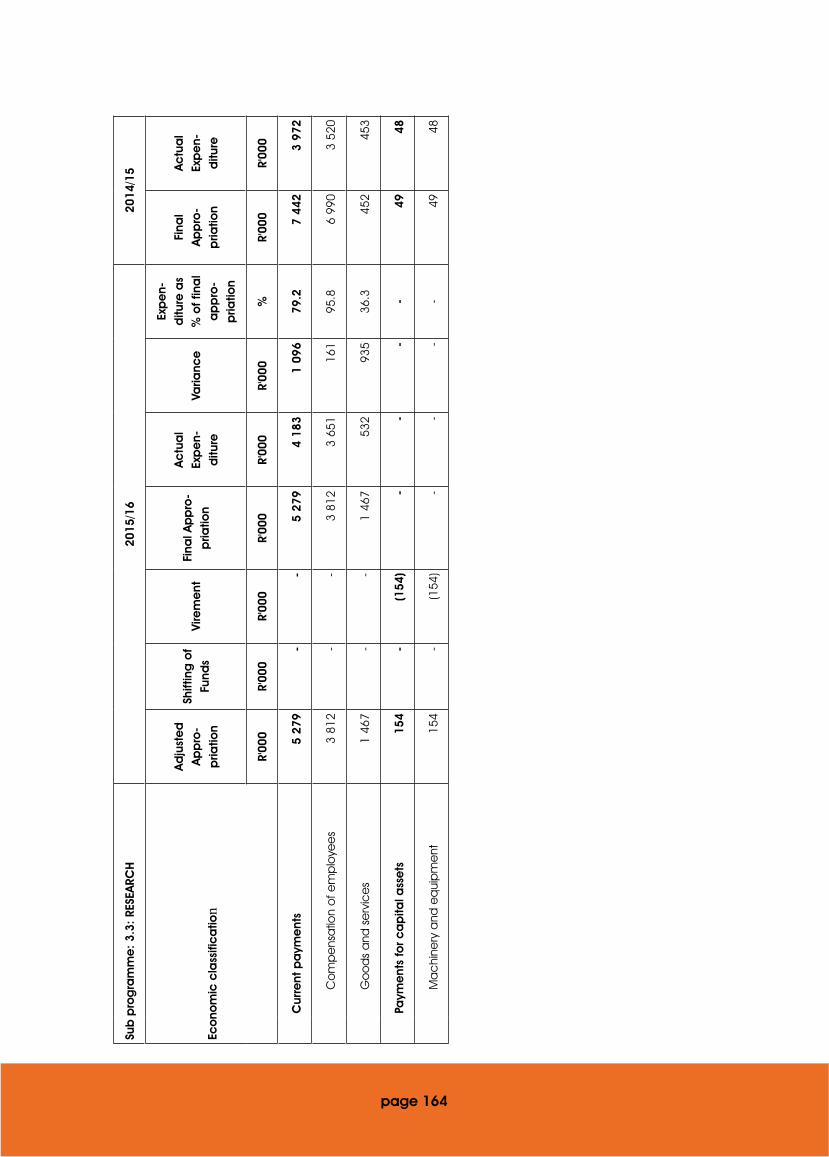
page 164
Sub
pro
gra
mm
e:
3.3:
RES
EARC
H20
15/1
620
14/1
5
Eco
nom
ic c
lass
ific
atio
n
Ad
just
ed
A
pp
ro-
pria
tion
Shift
ing
of
Fund
sVi
rem
ent
Fina
l Ap
pro
-p
riatio
n
Ac
tua
l Ex
pe
n-d
iture
Varia
nce
Exp
en-
ditu
re a
s %
of f
ina
l a
pp
ro-
pria
tion
Fina
l A
pp
ro-
pria
tion
Ac
tua
l Ex
pe
n-d
iture
R'00
0R'
000
R'00
0R'
000
R'00
0R'
000
%R'
000
R'00
0
Cur
rent
pa
yme
nts
5 27
9-
-5
279
4 18
31
096
79.2
7 44
23
972
Co
mp
ens
atio
n o
f em
plo
yee
s3
812
--
3 81
23
651
161
95.8
6 99
03
520
Go
od
s a
nd s
erv
ice
s1
467
--
1 46
753
293
536
.345
245
3
Paym
ent
s fo
r ca
pita
l ass
ets
154
-(1
54)
--
--
4948
Ma
chi
nery
and
eq
uip
me
nt15
4-
(154
)-
--
-49
48
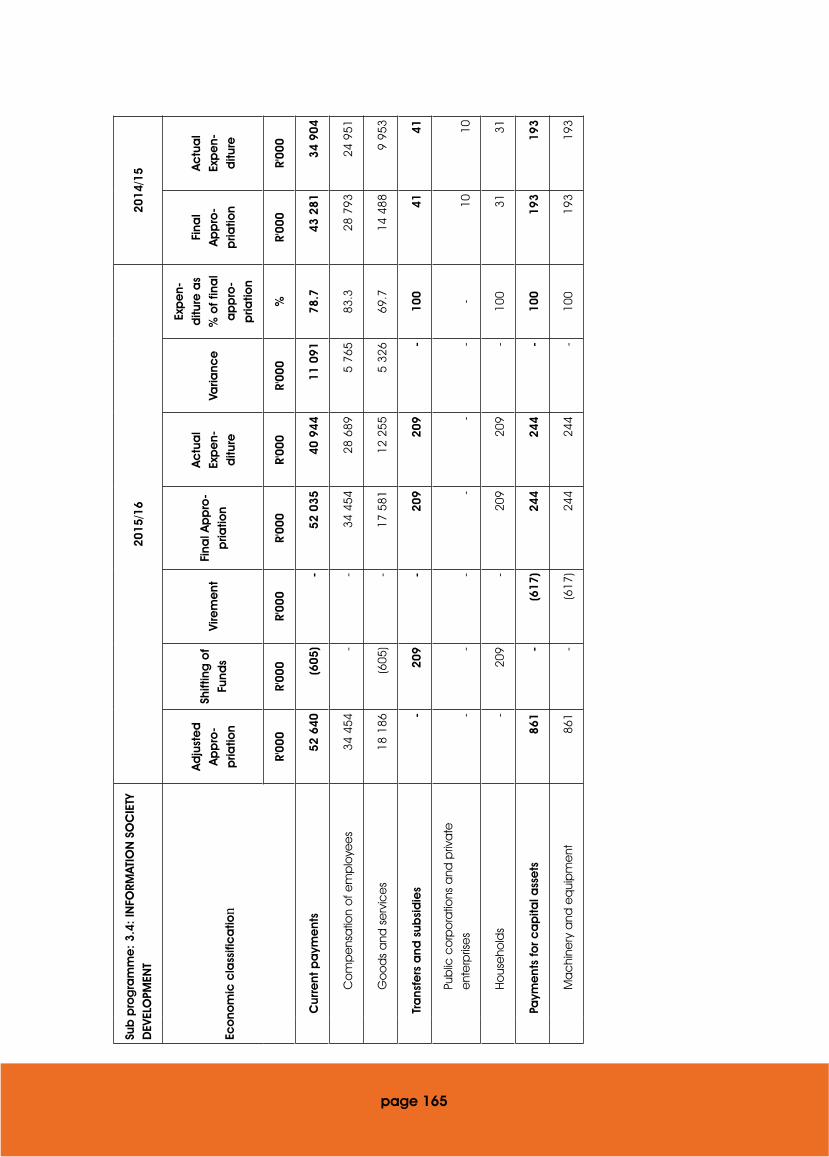
page 165
Sub
pro
gra
mm
e:
3.4:
INFO
RMAT
ION
SO
CIE
TY
DEV
ELO
PMEN
T20
15/1
620
14/1
5
Eco
nom
ic c
lass
ific
atio
n
Ad
just
ed
A
pp
ro-
pria
tion
Shift
ing
of
Fund
sVi
rem
ent
Fina
l Ap
pro
-p
riatio
n
Ac
tua
l Ex
pe
n-d
iture
Varia
nce
Exp
en-
ditu
re a
s %
of f
ina
l a
pp
ro-
pria
tion
Fina
l A
pp
ro-
pria
tion
Ac
tua
l Ex
pe
n-d
iture
R'00
0R'
000
R'00
0R'
000
R'00
0R'
000
%R'
000
R'00
0
Cur
rent
pa
yme
nts
52 6
40(6
05)
-52
035
40 9
4411
091
78.7
43 2
8134
904
Co
mp
ens
atio
n o
f em
plo
yee
s34
454
--
34 4
5428
689
5 76
583
.328
793
24 9
51
Go
od
s a
nd s
erv
ice
s18
186
(605
)-
17 5
8112
255
5 32
669
.714
488
9 95
3
Tra
nsfe
rs a
nd s
ubsi
die
s-
209
-20
920
9-
100
4141
Pub
lic c
orp
ora
tions
and
priv
ate
e
nte
rpris
es
--
--
--
-10
10
Ho
use
hold
s-
209
-20
920
9-
100
3131
Paym
ent
s fo
r ca
pita
l ass
ets
861
-(6
17)
244
244
-10
019
319
3
Ma
chi
nery
and
eq
uip
me
nt86
1-
(617
)24
424
4-
100
193
193
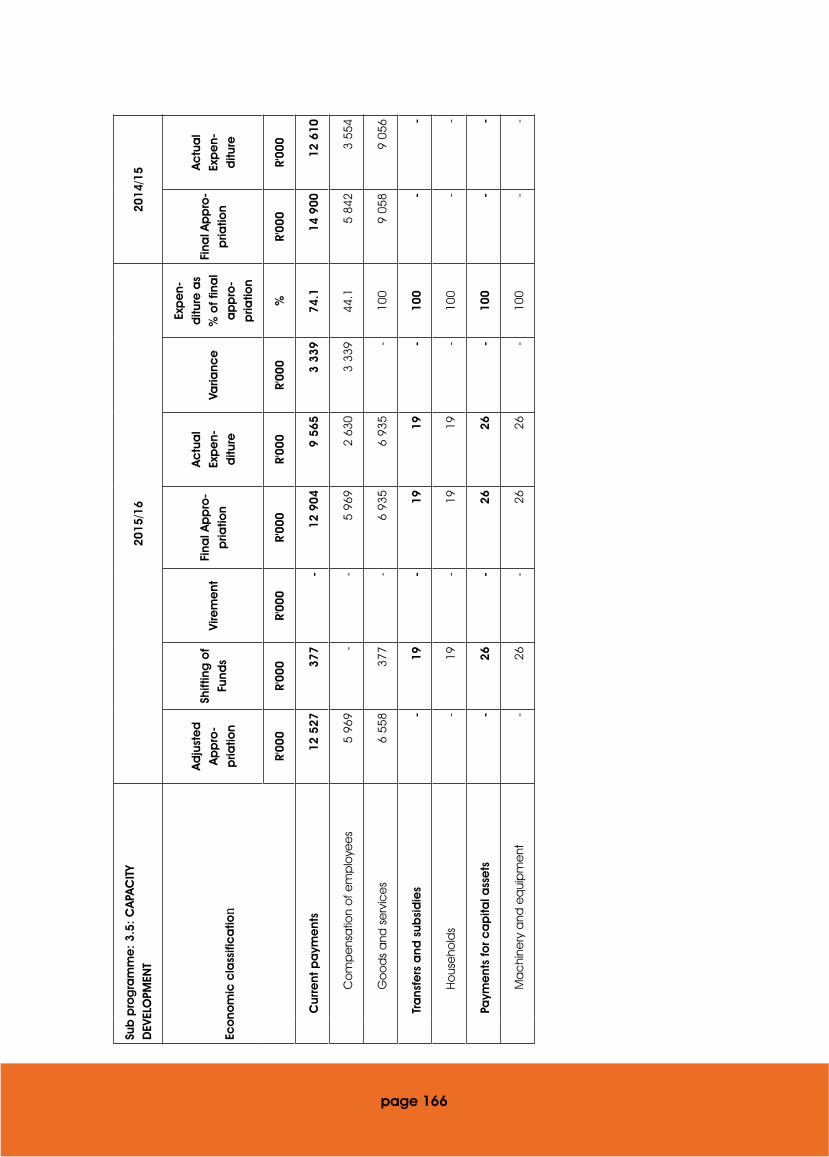
page 166
Sub
pro
gra
mm
e:
3.5:
CA
PAC
ITY
DEV
ELO
PMEN
T20
15/1
620
14/1
5
Eco
nom
ic c
lass
ific
atio
n
Ad
just
ed
A
pp
ro-
pria
tion
Shift
ing
of
Fund
sVi
rem
ent
Fina
l Ap
pro
-p
riatio
n
Ac
tua
l Ex
pe
n-d
iture
Varia
nce
Exp
en-
ditu
re a
s %
of f
ina
l a
pp
ro-
pria
tion
Fina
l Ap
pro
-p
riatio
n
Ac
tua
l Ex
pe
n-d
iture
R'00
0R'
000
R'00
0R'
000
R'00
0R'
000
%R'
000
R'00
0
Cur
rent
pa
yme
nts
12 5
2737
7-
12 9
049
565
3 33
974
.114
900
12 6
10
Co
mp
ens
atio
n o
f em
plo
yee
s5
969
--
5 96
92
630
3 33
944
.15
842
3 55
4
Go
od
s a
nd s
erv
ice
s6
558
377
-6
935
6 93
5-
100
9 05
89
056
Tra
nsfe
rs a
nd s
ubsi
die
s-
19-
1919
-10
0-
-
Ho
use
hold
s-
19-
1919
-10
0-
-
Paym
ent
s fo
r ca
pita
l ass
ets
-26
-26
26-
100
--
Ma
chi
nery
and
eq
uip
me
nt-
26-
2626
-10
0-
-
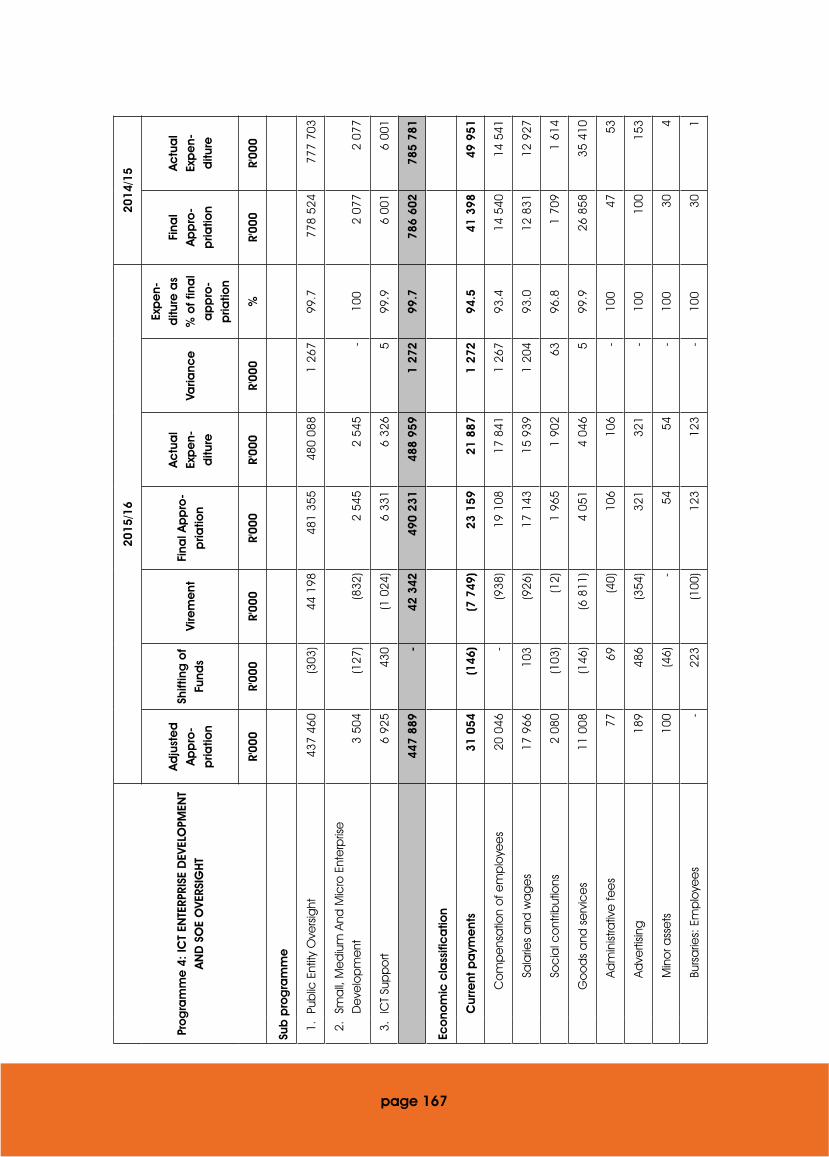
Pro
gra
mm
e 4
: IC
T EN
TERP
RISE
DEV
ELO
PMEN
T A
ND
SO
E O
VERS
IGH
T
2015
/16
2014
/15
Ad
just
ed
A
pp
ro-
pria
tion
Shift
ing
of
Fund
sVi
rem
ent
Fina
l Ap
pro
-p
riatio
n
Ac
tua
l Ex
pe
n-d
iture
Varia
nce
Exp
en-
ditu
re a
s %
of f
ina
l a
pp
ro-
pria
tion
Fina
l A
pp
ro-
pria
tion
Ac
tua
l Ex
pe
n-d
iture
R'00
0R'
000
R'00
0R'
000
R'00
0R'
000
%R'
000
R'00
0
Sub
pro
gra
mm
e
1.Pu
blic
Ent
ity O
vers
ight
437
460
(303
)44
198
481
355
480
088
1 26
799
.777
8 52
477
7 70
3
2.Sm
all,
Me
diu
m A
nd M
icro
Ent
erp
rise
D
eve
lop
me
nt3
504
(127
)(8
32)
2 54
52
545
-10
02
077
2 07
7
3.IC
T Su
pp
ort
6 92
543
0(1
024
)6
331
6 32
65
99.9
6 00
16
001
447
889
-42
342
490
231
488
959
1 27
299
.778
6 60
278
5 78
1
Eco
nom
ic c
lass
ific
atio
n
C
urre
nt p
aym
ent
s31
054
(146
)(7
749
)23
159
21 8
871
272
94.5
41 3
9849
951
C
om
pe
nsa
tion
of e
mp
loye
es
20 0
46-
(938
)19
108
17 8
411
267
93.4
14 5
4014
541
Sa
larie
s a
nd w
ag
es
17 9
6610
3(9
26)
17 1
4315
939
1 20
493
.012
831
12 9
27
So
cia
l co
ntrib
utio
ns2
080
(103
)(1
2)1
965
1 90
263
96.8
1 70
91
614
G
oo
ds
and
se
rvic
es
11 0
08(1
46)
(6 8
11)
4 05
14
046
599
.926
858
35 4
10
Ad
min
istra
tive
fee
s77
69(4
0)10
610
6-
100
4753
Ad
verti
sing
189
486
(354
)32
132
1-
100
100
153
M
ino
r ass
ets
100
(46)
-54
54-
100
304
Bu
rsa
ries:
Em
plo
yee
s-
223
(100
)12
312
3-
100
301
page 167
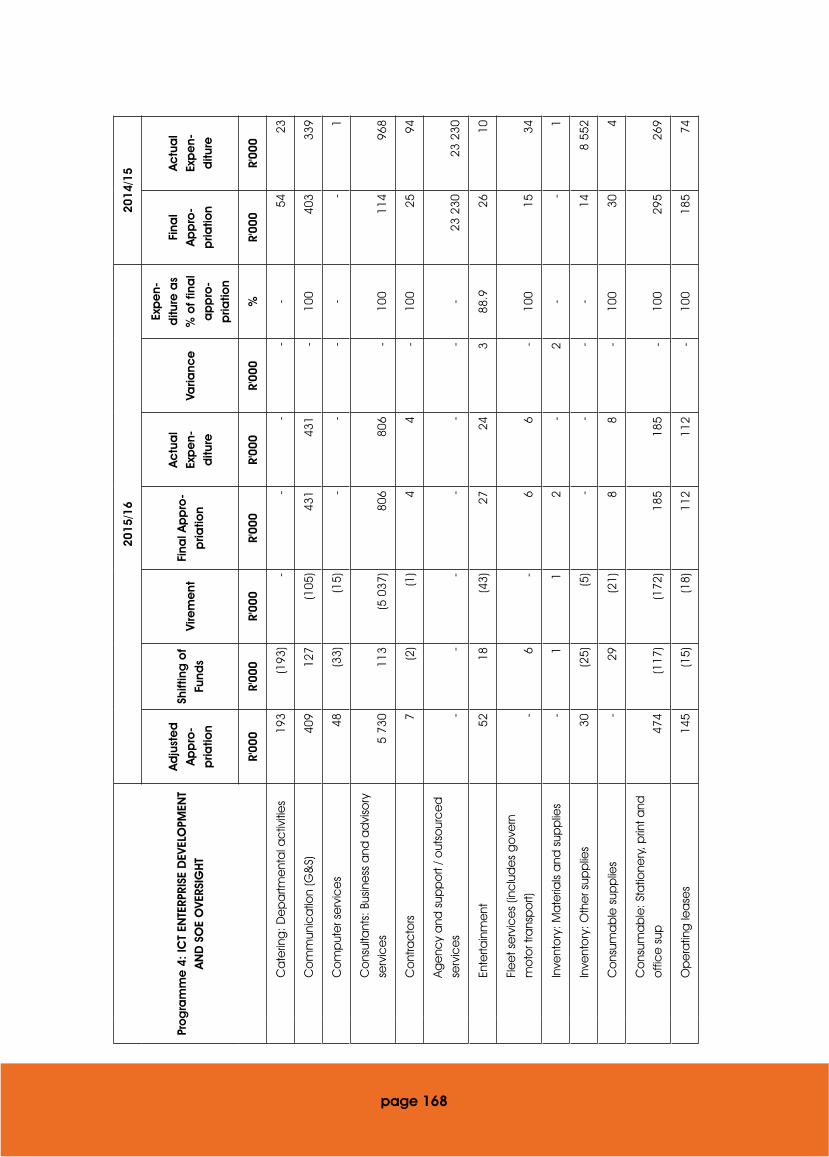
Pro
gra
mm
e 4
: IC
T EN
TERP
RISE
DEV
ELO
PMEN
T A
ND
SO
E O
VERS
IGH
T
2015
/16
2014
/15
Ad
just
ed
A
pp
ro-
pria
tion
Shift
ing
of
Fund
sVi
rem
ent
Fina
l Ap
pro
-p
riatio
n
Ac
tua
l Ex
pe
n-d
iture
Varia
nce
Exp
en-
ditu
re a
s %
of f
ina
l a
pp
ro-
pria
tion
Fina
l A
pp
ro-
pria
tion
Ac
tua
l Ex
pe
n-d
iture
R'00
0R'
000
R'00
0R'
000
R'00
0R'
000
%R'
000
R'00
0
C
ate
ring
: De
pa
rtme
nta
l ac
tiviti
es
193
(193
)-
--
--
5423
C
om
mun
ica
tion
(G&
S)40
912
7(1
05)
431
431
-10
040
333
9
C
om
put
er s
erv
ice
s48
(33)
(15)
--
--
-1
C
ons
ulta
nts:
Bus
ine
ss a
nd a
dvi
sory
se
rvic
es
5 73
011
3(5
037
)80
680
6-
100
114
968
C
ont
rac
tors
7(2
)(1
)4
4-
100
2594
Ag
enc
y a
nd s
upp
ort
/ out
sour
ce
d
serv
ice
s-
--
--
--
23 2
3023
230
En
terta
inm
ent
5218
(43)
2724
388
.926
10
Fl
ee
t se
rvic
es
(inc
lud
es
go
vern
m
oto
r tra
nsp
ort)
-6
-6
6-
100
1534
In
vent
ory
: Ma
teria
ls a
nd s
upp
lies
-1
12
-2
--
1
In
vent
ory
: Oth
er s
upp
lies
30(2
5)(5
)-
--
-14
8 55
2
C
ons
uma
ble
sup
plie
s-
29(2
1)8
8-
100
304
C
ons
uma
ble
: Sta
tione
ry, p
rint a
nd
offi
ce
sup
474
(117
)(1
72)
185
185
-10
029
526
9
O
pe
ratin
g le
ase
s14
5(1
5)(1
8)11
211
2-
100
185
74
page 168
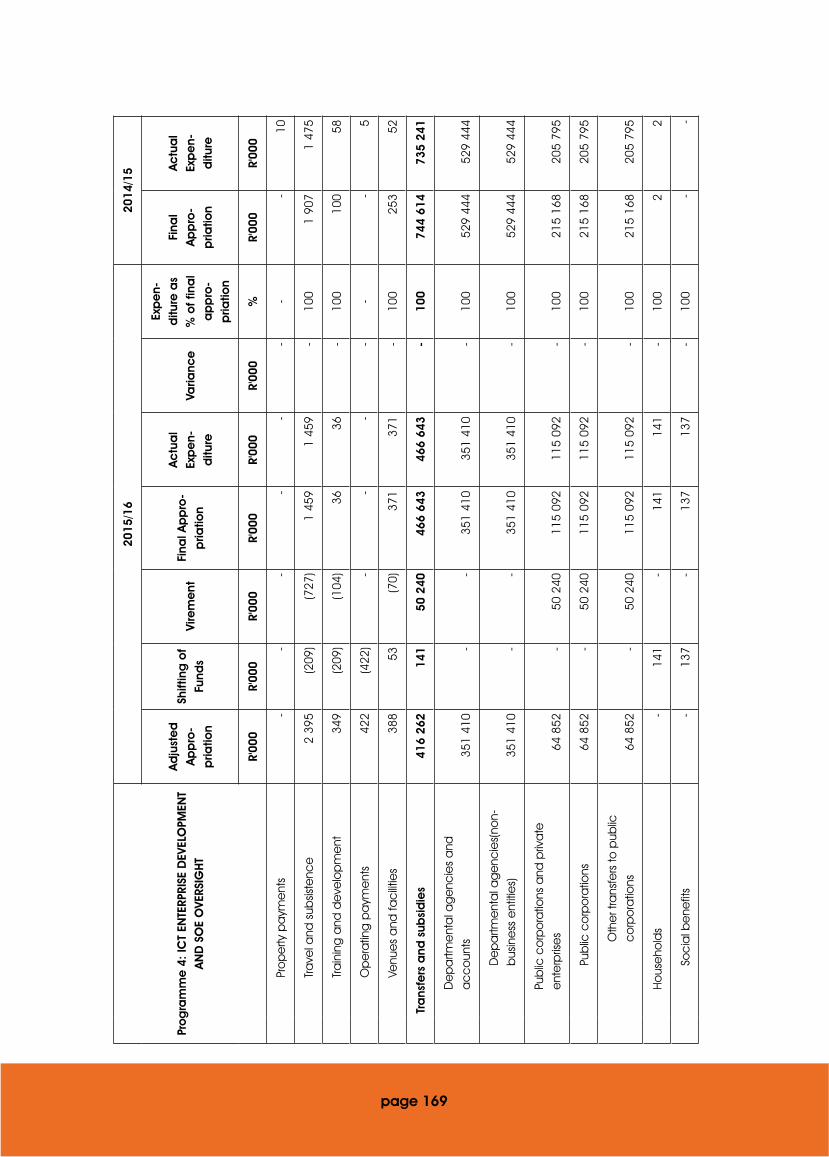
page 169
Pro
gra
mm
e 4
: IC
T EN
TERP
RISE
DEV
ELO
PMEN
T A
ND
SO
E O
VERS
IGH
T
2015
/16
2014
/15
Ad
just
ed
A
pp
ro-
pria
tion
Shift
ing
of
Fund
sVi
rem
ent
Fina
l Ap
pro
-p
riatio
n
Ac
tua
l Ex
pe
n-d
iture
Varia
nce
Exp
en-
ditu
re a
s %
of f
ina
l a
pp
ro-
pria
tion
Fina
l A
pp
ro-
pria
tion
Ac
tua
l Ex
pe
n-d
iture
R'00
0R'
000
R'00
0R'
000
R'00
0R'
000
%R'
000
R'00
0
Pr
op
erty
pa
yme
nts
--
--
--
--
10
Tra
vel a
nd s
ubsis
tenc
e2
395
(209
)(7
27)
1 45
91
459
-10
01
907
1 47
5
Tra
inin
g a
nd d
eve
lop
me
nt34
9(2
09)
(104
)36
36-
100
100
58
O
pe
ratin
g p
aym
ent
s42
2(4
22)
--
--
--
5
Ve
nue
s a
nd fa
cilit
ies
388
53(7
0)37
137
1-
100
253
52
Tr
ans
fers
and
sub
sid
ies
416
262
141
50 2
4046
6 64
346
6 64
3-
100
744
614
735
241
D
ep
artm
ent
al a
ge
ncie
s a
nd
ac
co
unts
351
410
--
351
410
351
410
-10
052
9 44
452
9 44
4
D
ep
artm
ent
al a
ge
ncie
s(no
n-b
usin
ess
ent
itie
s)35
1 41
0-
-35
1 41
035
1 41
0-
100
529
444
529
444
Pu
blic
co
rpo
ratio
ns a
nd p
riva
te
ent
erp
rise
s64
852
-50
240
115
092
115
092
-10
021
5 16
820
5 79
5
Pu
blic
co
rpo
ratio
ns64
852
-50
240
115
092
115
092
-10
021
5 16
820
5 79
5
O
the
r tra
nsfe
rs to
pub
lic
co
rpo
ratio
ns64
852
-50
240
115
092
115
092
-10
021
5 16
820
5 79
5
H
ous
eho
lds
-14
1-
141
141
-10
02
2
So
cia
l be
nefit
s-
137
-13
713
7-
100
--
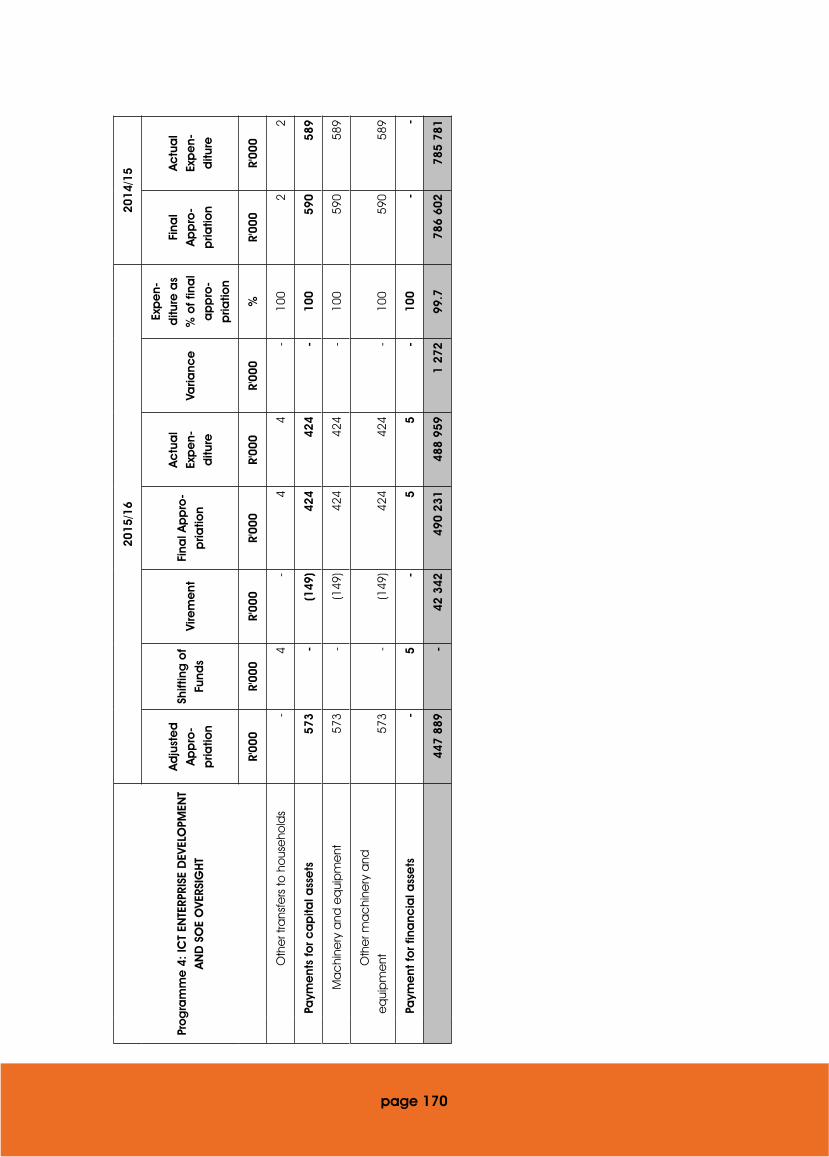
page 170
Pro
gra
mm
e 4
: IC
T EN
TERP
RISE
DEV
ELO
PMEN
T A
ND
SO
E O
VERS
IGH
T
2015
/16
2014
/15
Ad
just
ed
A
pp
ro-
pria
tion
Shift
ing
of
Fund
sVi
rem
ent
Fina
l Ap
pro
-p
riatio
n
Ac
tua
l Ex
pe
n-d
iture
Varia
nce
Exp
en-
ditu
re a
s %
of f
ina
l a
pp
ro-
pria
tion
Fina
l A
pp
ro-
pria
tion
Ac
tua
l Ex
pe
n-d
iture
R'00
0R'
000
R'00
0R'
000
R'00
0R'
000
%R'
000
R'00
0
O
the
r tra
nsfe
rs to
ho
use
hold
s-
4-
44
-10
02
2
Pa
yme
nts
for c
ap
ital a
sse
ts57
3-
(149
)42
442
4-
100
590
589
M
ac
hine
ry a
nd e
qui
pm
ent
573
-(1
49)
424
424
-10
059
058
9
O
the
r ma
chi
nery
and
e
qui
pm
ent
573
-(1
49)
424
424
-10
059
058
9
Pa
yme
nt fo
r fin
anc
ial a
sse
ts-
5-
55
-10
0-
-
447
889
-42
342
490
231
488
959
1 27
299
.778
6 60
278
5 78
1

Sub
pro
gra
mm
e:
4.1:
PUB
LIC
EN
TITY
O
VERS
IGH
T20
15/1
620
14/1
5
Eco
nom
ic c
lass
ific
atio
n
Ad
just
ed
A
pp
ro-
pria
tion
Shift
ing
of
Fund
sVi
rem
ent
Fina
l Ap
pro
-p
riatio
n
Ac
tua
l Ex
pe
n-d
iture
Varia
nce
Exp
en-
ditu
re a
s %
of f
ina
l a
pp
ro-
pria
tion
Fina
l A
pp
ro-
pria
tion
Ac
tua
l Ex
pe
n-d
iture
R'00
0R'
000
R'00
0R'
000
R'00
0R'
000
%R'
000
R'00
0
Cur
rent
pa
yme
nts
21 0
01(6
24)
(6 0
42)
14 3
3513
068
1 26
791
.233
362
41 9
15
Co
mp
ens
atio
n o
f em
plo
yee
s13
692
(485
)(9
38)
12 2
6911
002
1 26
789
.78
311
8 31
1
Go
od
s a
nd s
erv
ice
s7
309
(139
)(5
104
)2
066
2 06
6-
100
25 0
5133
603
Tra
nsfe
rs a
nd s
ubsi
die
s41
6 26
213
950
240
466
641
466
641
-10
074
4 61
473
5 24
1
De
pa
rtme
nta
l ag
enc
ies
and
a
cc
oun
ts35
1 41
0-
-35
1 41
035
1 41
0-
100
529
444
529
444
Pub
lic c
orp
ora
tions
and
priv
ate
e
nte
rpris
es
64 8
52-
50 2
4011
5 09
211
5 09
2-
100
215
168
205
795
Ho
use
hold
s-
139
-13
913
9-
100
22
Paym
ent
s fo
r ca
pita
l ass
ets
197
182
-37
937
9-
100
548
548
Ma
chi
nery
and
eq
uip
me
nt19
718
2-
379
379
-10
054
854
8
page 171
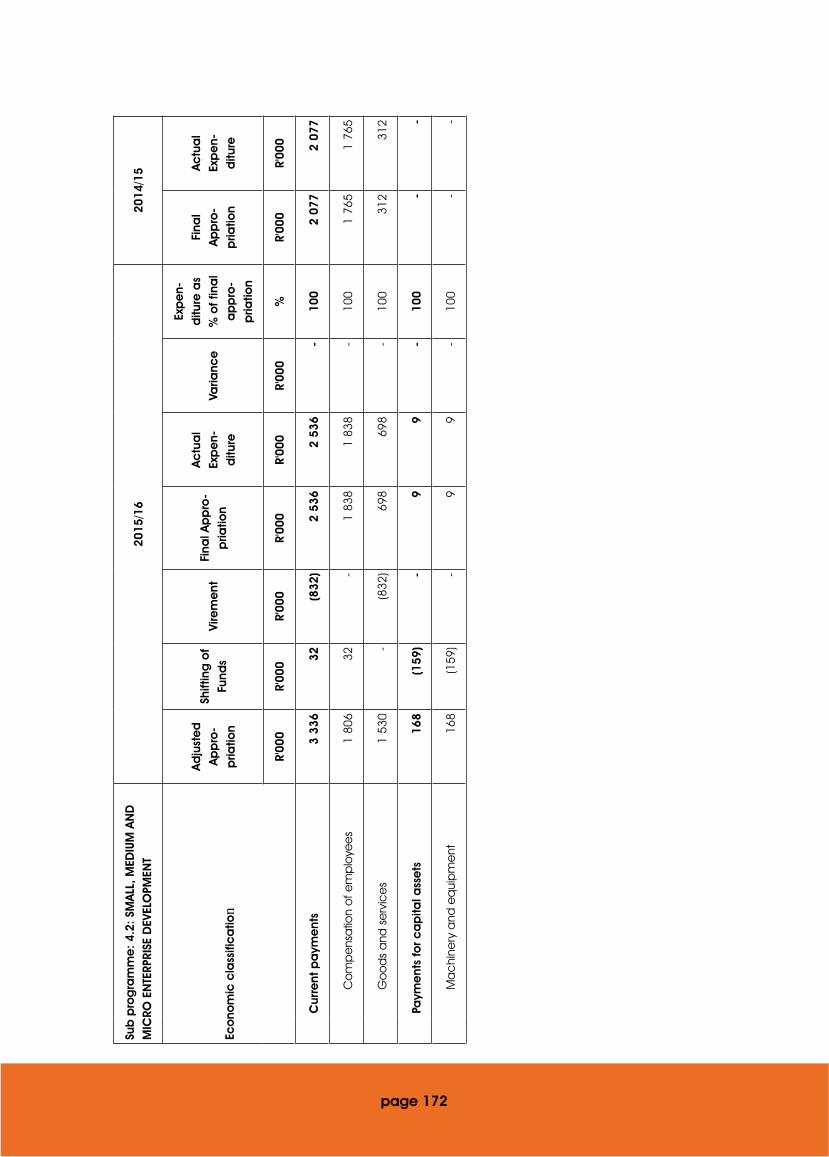
Sub
pro
gra
mm
e:
4.2:
SM
ALL
, MED
IUM
AN
D
MIC
RO E
NTE
RPRI
SE D
EVEL
OPM
ENT
2015
/16
2014
/15
Eco
nom
ic c
lass
ific
atio
n
Ad
just
ed
A
pp
ro-
pria
tion
Shift
ing
of
Fund
sVi
rem
ent
Fina
l Ap
pro
-p
riatio
n
Ac
tua
l Ex
pe
n-d
iture
Varia
nce
Exp
en-
ditu
re a
s %
of f
ina
l a
pp
ro-
pria
tion
Fina
l A
pp
ro-
pria
tion
Ac
tua
l Ex
pe
n-d
iture
R'00
0R'
000
R'00
0R'
000
R'00
0R'
000
%R'
000
R'00
0
Cur
rent
pa
yme
nts
3 33
632
(832
)2
536
2 53
6-
100
2 07
72
077
Co
mp
ens
atio
n o
f em
plo
yee
s1
806
32-
1 83
81
838
-10
01
765
1 76
5
Go
od
s a
nd s
erv
ice
s1
530
-(8
32)
698
698
-10
031
231
2
Paym
ent
s fo
r ca
pita
l ass
ets
168
(159
)-
99
-10
0-
-
Ma
chi
nery
and
eq
uip
me
nt16
8(1
59)
-9
9-
100
--
page 172
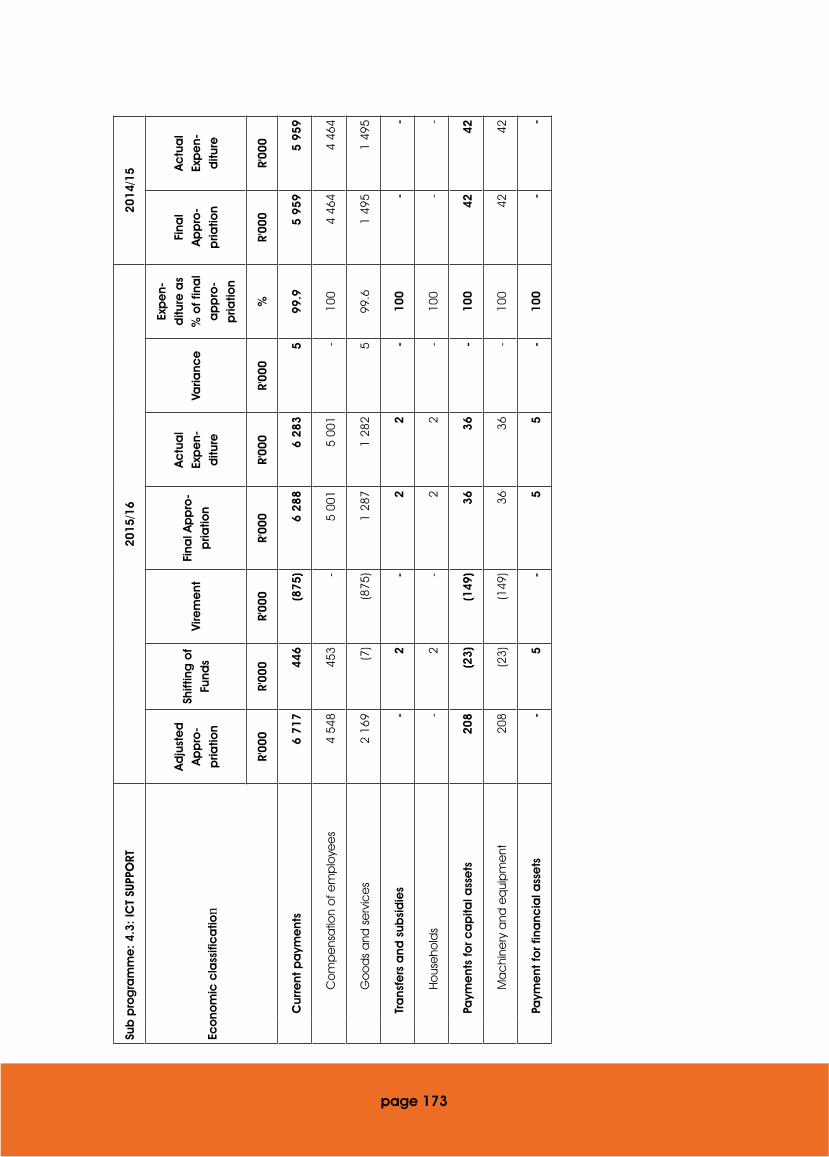
Sub
pro
gra
mm
e:
4.3:
ICT
SUPP
ORT
2015
/16
2014
/15
Eco
nom
ic c
lass
ific
atio
n
Ad
just
ed
A
pp
ro-
pria
tion
Shift
ing
of
Fund
sVi
rem
ent
Fina
l Ap
pro
-p
riatio
n
Ac
tua
l Ex
pe
n-d
iture
Varia
nce
Exp
en-
ditu
re a
s %
of f
ina
l a
pp
ro-
pria
tion
Fina
l A
pp
ro-
pria
tion
Ac
tua
l Ex
pe
n-d
iture
R'00
0R'
000
R'00
0R'
000
R'00
0R'
000
%R'
000
R'00
0
Cur
rent
pa
yme
nts
6 71
744
6(8
75)
6 28
86
283
599
.95
959
5 95
9
Co
mp
ens
atio
n o
f em
plo
yee
s4
548
453
-5
001
5 00
1-
100
4 46
44
464
Go
od
s a
nd s
erv
ice
s2
169
(7)
(875
)1
287
1 28
25
99.6
1 49
51
495
Tra
nsfe
rs a
nd s
ubsi
die
s-
2-
22
-10
0-
-
Ho
use
hold
s-
2-
22
-10
0-
-
Paym
ent
s fo
r ca
pita
l ass
ets
208
(23)
(149
)36
36-
100
4242
Ma
chi
nery
and
eq
uip
me
nt20
8(2
3)(1
49)
3636
-10
042
42
Paym
ent
for f
ina
ncia
l ass
ets
-5
-5
5-
100
--
page 173
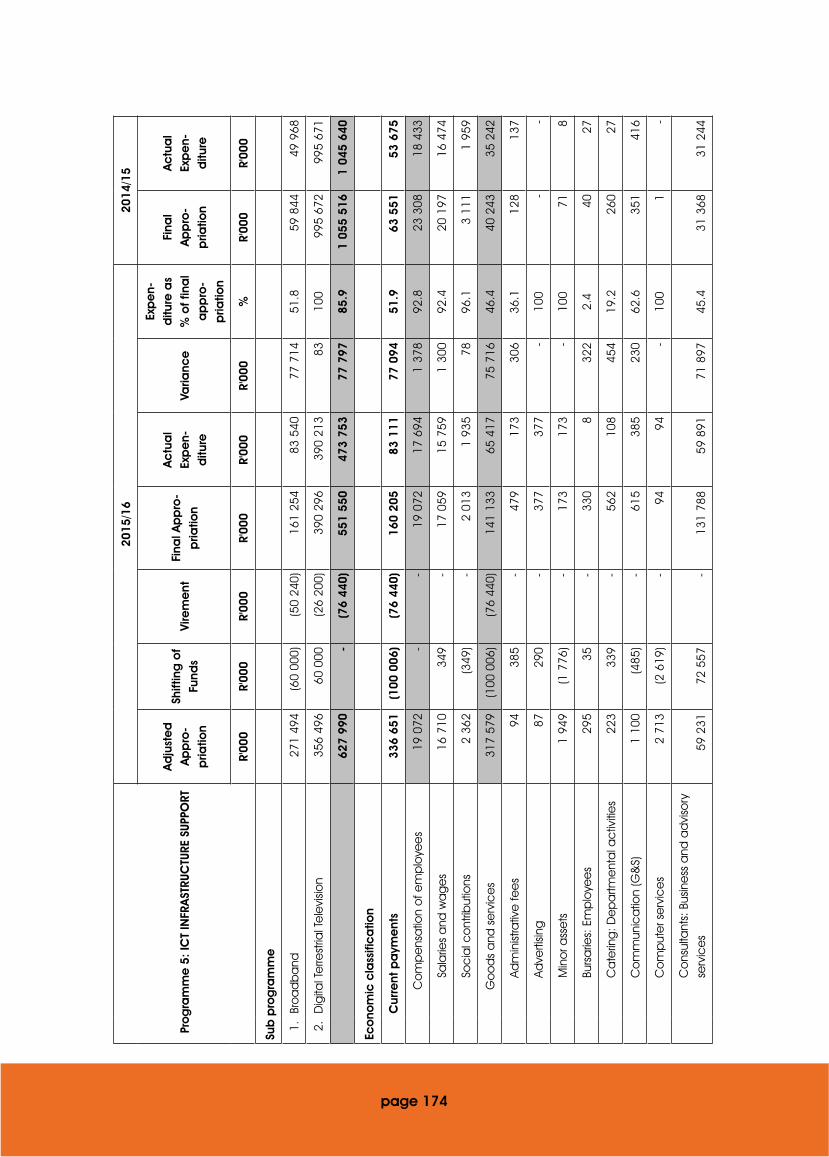
Pro
gra
mm
e 5
: IC
T IN
FRA
STRU
CTU
RE S
UPPO
RT
2015
/16
2014
/15
Ad
just
ed
A
pp
ro-
pria
tion
Shift
ing
of
Fund
sVi
rem
ent
Fina
l Ap
pro
-p
riatio
n
Ac
tua
l Ex
pe
n-d
iture
Varia
nce
Exp
en-
ditu
re a
s %
of f
ina
l a
pp
ro-
pria
tion
Fina
l A
pp
ro-
pria
tion
Ac
tua
l Ex
pe
n-d
iture
R'00
0R'
000
R'00
0R'
000
R'00
0R'
000
%R'
000
R'00
0
Sub
pro
gra
mm
e
1.Br
oa
db
and
271
494
(60
000)
(50
240)
161
254
83 5
4077
714
51.8
59 8
4449
968
2.D
igita
l Te
rrest
rial T
ele
visio
n35
6 49
660
000
(26
200)
390
296
390
213
8310
099
5 67
299
5 67
1
627
990
-(7
6 44
0)55
1 55
047
3 75
377
797
85.9
1 05
5 51
61
045
640
Eco
nom
ic c
lass
ific
atio
n
C
urre
nt p
aym
ent
s33
6 65
1(1
00 0
06)
(76
440)
160
205
83 1
1177
094
51.9
63 5
5153
675
C
om
pe
nsa
tion
of e
mp
loye
es
19 0
72-
-19
072
17 6
941
378
92.8
23 3
0818
433
Sa
larie
s a
nd w
ag
es
16 7
1034
9-
17 0
5915
759
1 30
092
.420
197
16 4
74
So
cia
l co
ntrib
utio
ns2
362
(349
)-
2 01
31
935
7896
.13
111
1 95
9
G
oo
ds
and
se
rvic
es
317
579
(100
006
)(7
6 44
0)14
1 13
365
417
75 7
1646
.440
243
35 2
42
Ad
min
istra
tive
fee
s94
385
-47
917
330
636
.112
813
7
Ad
verti
sing
8729
0-
377
377
-10
0-
-
M
ino
r ass
ets
1 94
9(1
776
)-
173
173
-10
071
8
Bu
rsa
ries:
Em
plo
yee
s29
535
-33
08
322
2.4
4027
C
ate
ring
: De
pa
rtme
nta
l ac
tiviti
es
223
339
-56
210
845
419
.226
027
C
om
mun
ica
tion
(G&
S)1
100
(485
)-
615
385
230
62.6
351
416
C
om
put
er s
erv
ice
s2
713
(2 6
19)
-94
94-
100
1-
C
ons
ulta
nts:
Bus
ine
ss a
nd a
dvi
sory
se
rvic
es
59 2
3172
557
-13
1 78
859
891
71 8
9745
.431
368
31 2
44
page 174
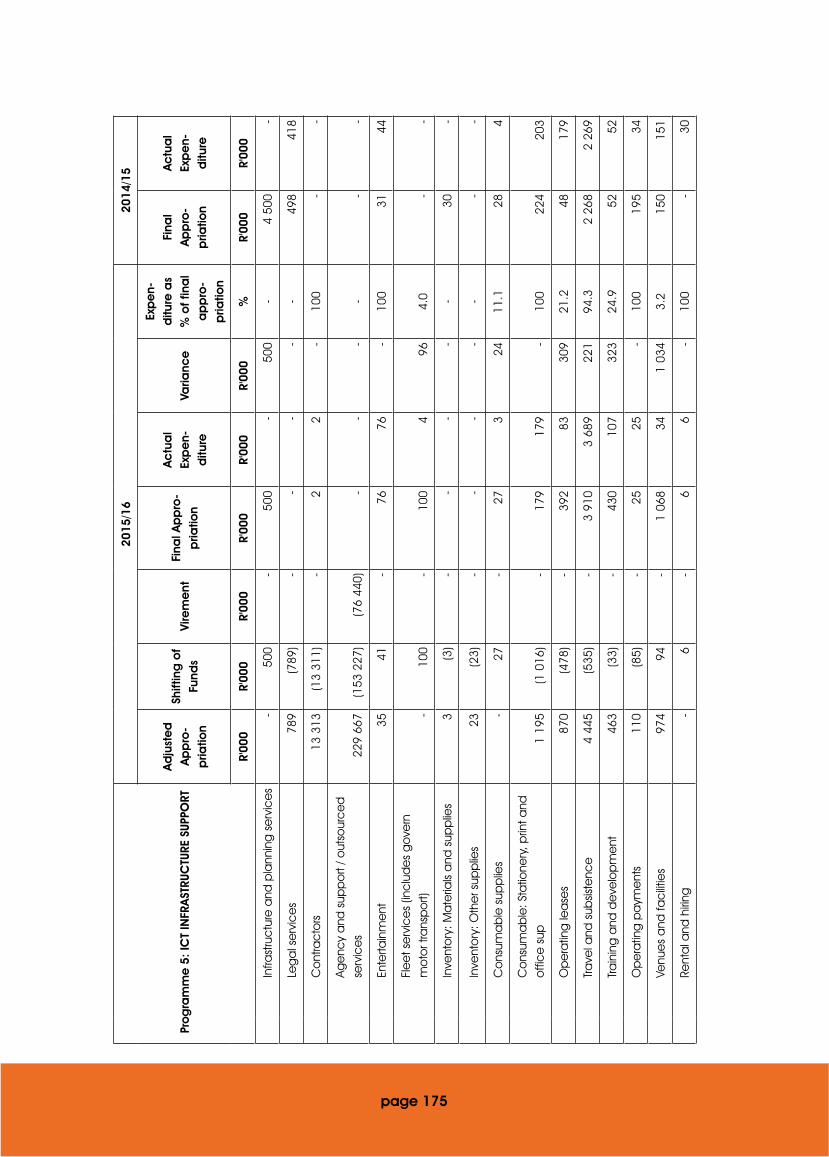
Pro
gra
mm
e 5
: IC
T IN
FRA
STRU
CTU
RE S
UPPO
RT
2015
/16
2014
/15
Ad
just
ed
A
pp
ro-
pria
tion
Shift
ing
of
Fund
sVi
rem
ent
Fina
l Ap
pro
-p
riatio
n
Ac
tua
l Ex
pe
n-d
iture
Varia
nce
Exp
en-
ditu
re a
s %
of f
ina
l a
pp
ro-
pria
tion
Fina
l A
pp
ro-
pria
tion
Ac
tua
l Ex
pe
n-d
iture
R'00
0R'
000
R'00
0R'
000
R'00
0R'
000
%R'
000
R'00
0
In
frast
ruc
ture
and
pla
nnin
g s
erv
ice
s-
500
-50
0-
500
-4
500
-
Le
ga
l se
rvic
es
789
(789
)-
--
--
498
418
C
ont
rac
tors
13 3
13(1
3 31
1)-
22
-10
0-
-
Age
ncy
and
sup
po
rt / o
utso
urc
ed
se
rvic
es
229
667
(153
227
)(7
6 44
0)-
--
--
-
En
terta
inm
ent
3541
-76
76-
100
3144
Fl
ee
t se
rvic
es
(inc
lud
es
go
vern
m
oto
r tra
nsp
ort)
-10
0-
100
496
4.0
--
In
vent
ory
: Ma
teria
ls a
nd s
upp
lies
3(3
)-
--
--
30-
Inve
nto
ry: O
the
r sup
plie
s23
(23)
--
--
--
-
C
ons
uma
ble
sup
plie
s-
27-
273
2411
.128
4
C
ons
uma
ble
: Sta
tione
ry, p
rint a
nd
offi
ce
sup
1 19
5(1
016
)-
179
179
-10
022
420
3
O
pe
ratin
g le
ase
s87
0(4
78)
-39
283
309
21.2
4817
9
Tra
vel a
nd s
ubsis
tenc
e4
445
(535
)-
3 91
03
689
221
94.3
2 26
82
269
Tra
inin
g a
nd d
eve
lop
me
nt46
3(3
3)-
430
107
323
24.9
5252
O
pe
ratin
g p
aym
ent
s11
0(8
5)-
2525
-10
019
534
Ve
nue
s a
nd fa
cilit
ies
974
94-
1 06
834
1 03
43.
215
015
1
Re
nta
l and
hiri
ng-
6-
66
-10
0-
30
page 175
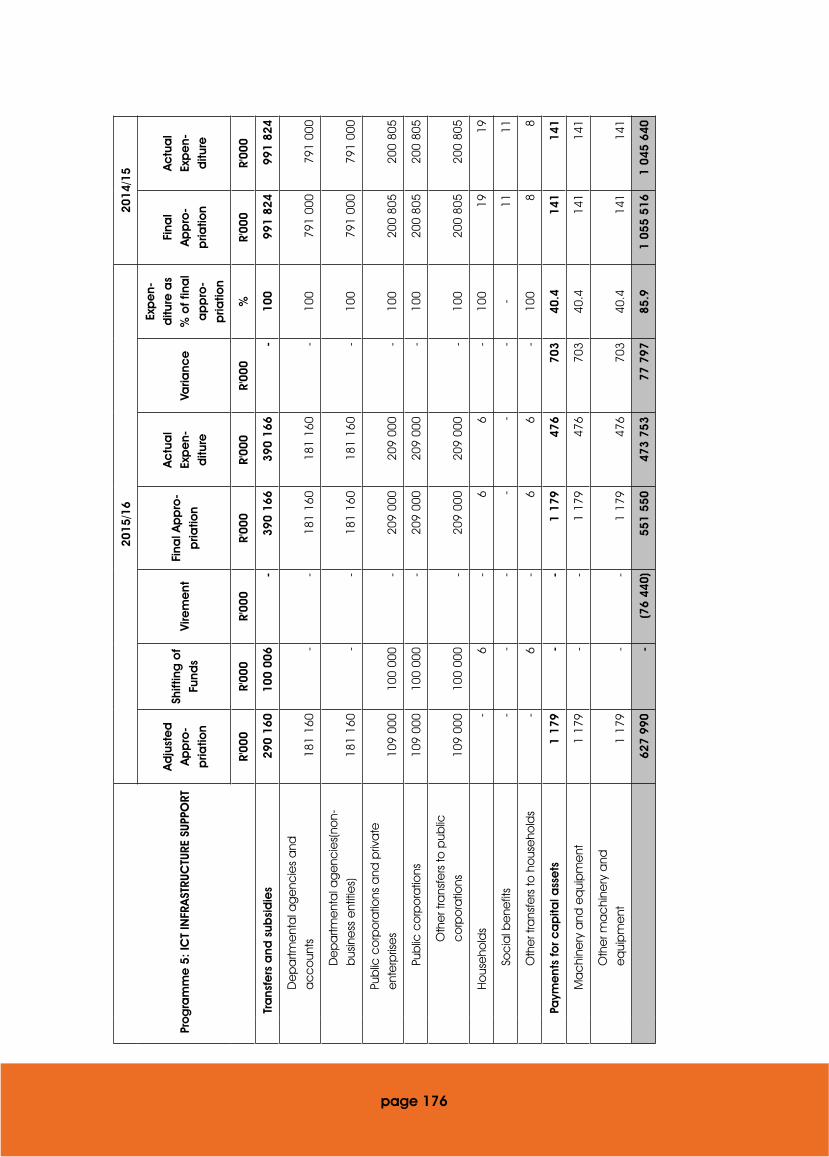
page 176
Pro
gra
mm
e 5
: IC
T IN
FRA
STRU
CTU
RE S
UPPO
RT
2015
/16
2014
/15
Ad
just
ed
A
pp
ro-
pria
tion
Shift
ing
of
Fund
sVi
rem
ent
Fina
l Ap
pro
-p
riatio
n
Ac
tua
l Ex
pe
n-d
iture
Varia
nce
Exp
en-
ditu
re a
s %
of f
ina
l a
pp
ro-
pria
tion
Fina
l A
pp
ro-
pria
tion
Ac
tua
l Ex
pe
n-d
iture
R'00
0R'
000
R'00
0R'
000
R'00
0R'
000
%R'
000
R'00
0
Tr
ans
fers
and
sub
sid
ies
290
160
100
006
-39
0 16
639
0 16
6-
100
991
824
991
824
D
ep
artm
ent
al a
ge
ncie
s a
nd
ac
co
unts
181
160
--
181
160
181
160
-10
079
1 00
079
1 00
0
D
ep
artm
ent
al a
ge
ncie
s(no
n-b
usin
ess
ent
itie
s)18
1 16
0-
-18
1 16
018
1 16
0-
100
791
000
791
000
Pu
blic
co
rpo
ratio
ns a
nd p
riva
te
ent
erp
rise
s10
9 00
010
0 00
0-
209
000
209
000
-10
020
0 80
520
0 80
5
Pu
blic
co
rpo
ratio
ns10
9 00
010
0 00
0-
209
000
209
000
-10
020
0 80
520
0 80
5
O
the
r tra
nsfe
rs to
pub
lic
co
rpo
ratio
ns10
9 00
010
0 00
0-
209
000
209
000
-10
020
0 80
520
0 80
5
H
ous
eho
lds
-6
-6
6-
100
1919
So
cia
l be
nefit
s-
--
--
--
1111
O
the
r tra
nsfe
rs to
ho
use
hold
s-
6-
66
-10
08
8
Pa
yme
nts
for c
ap
ital a
sse
ts1
179
--
1 17
947
670
340
.414
114
1
M
ac
hine
ry a
nd e
qui
pm
ent
1 17
9-
-1
179
476
703
40.4
141
141
O
the
r ma
chi
nery
and
e
qui
pm
ent
1 17
9-
-1
179
476
703
40.4
141
141
627
990
-(7
6 44
0)55
1 55
047
3 75
377
797
85.9
1 05
5 51
61
045
640

Sub
pro
gra
mm
e:
5.1:
BRO
AD
BAN
D20
15/1
620
14/1
5
Ec
ono
mic
cla
ssifi
ca
tion
Ad
just
ed
A
pp
ro-
pria
tion
Shift
ing
of
Fund
sVi
rem
ent
Fina
l Ap
pro
-p
riatio
n
Ac
tua
l Ex
pe
n-d
iture
Varia
nce
Exp
en-
ditu
re a
s %
of f
ina
l a
pp
ro-
pria
tion
Fina
l A
pp
ro-
pria
tion
Ac
tua
l Ex
pe
n-d
iture
R'00
0R'
000
R'00
0R'
000
R'00
0R'
000
%R'
000
R'00
0
Cur
rent
pa
yme
nts
270
315
(60
006)
(50
240)
160
069
83 0
5877
011
51.9
59 7
0849
832
Co
mp
ens
atio
n o
f em
plo
yee
s19
072
--
19 0
7217
694
1 37
892
.820
255
15 3
81
Go
od
s a
nd s
erv
ice
s25
1 24
3(6
0 00
6)(5
0 24
0)14
0 99
765
364
75 6
3346
.439
453
34 4
51
Tra
nsfe
rs a
nd s
ubsi
die
s-
6-
66
-10
04
4
Ho
use
hold
s-
6-
66
-10
04
4
Paym
ent
s fo
r ca
pita
l ass
ets
1 17
9-
-1
179
476
703
40.4
132
132
Ma
chi
nery
and
eq
uip
me
nt1
179
--
1 17
947
670
340
.413
213
2
page 177
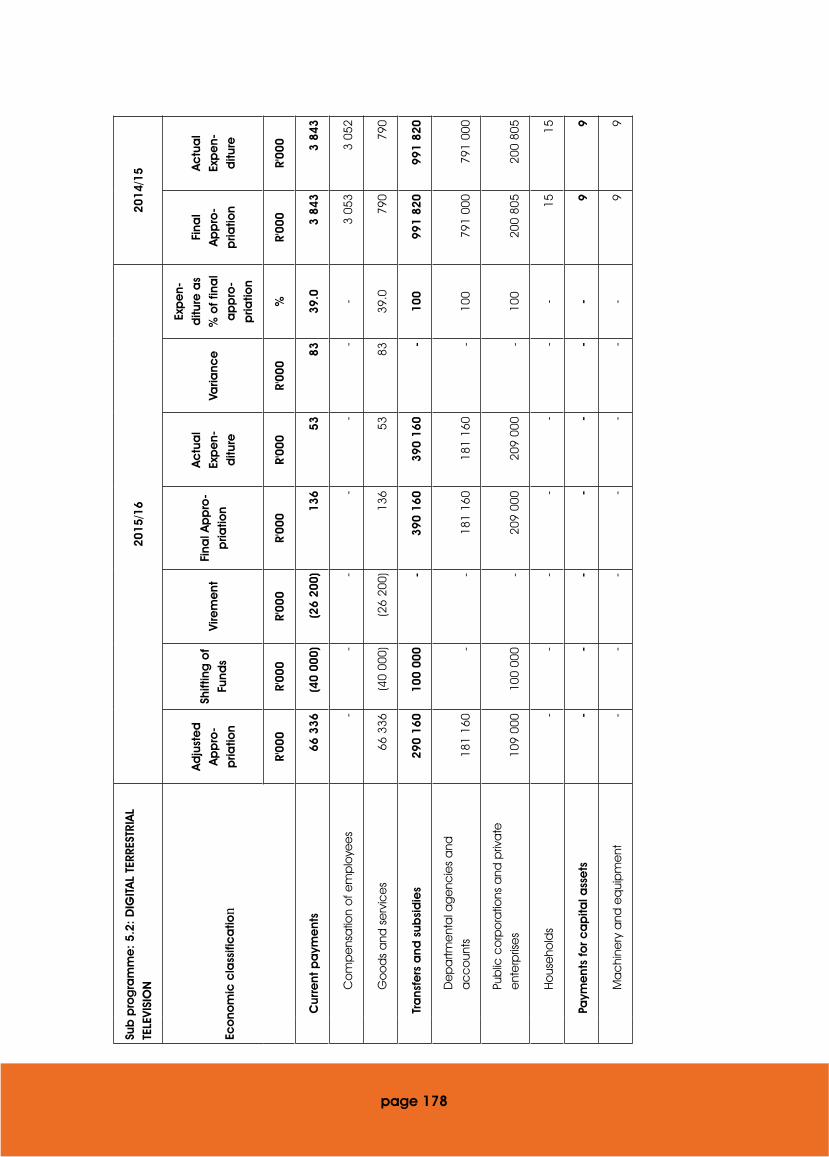
Sub
pro
gra
mm
e:
5.2:
DIG
ITA
L TE
RRES
TRIA
L TE
LEVI
SIO
N20
15/1
620
14/1
5
Eco
nom
ic c
lass
ific
atio
n
Ad
just
ed
A
pp
ro-
pria
tion
Shift
ing
of
Fund
sVi
rem
ent
Fina
l Ap
pro
-p
riatio
n
Ac
tua
l Ex
pe
n-d
iture
Varia
nce
Exp
en-
ditu
re a
s %
of f
ina
l a
pp
ro-
pria
tion
Fina
l A
pp
ro-
pria
tion
Ac
tua
l Ex
pe
n-d
iture
R'00
0R'
000
R'00
0R'
000
R'00
0R'
000
%R'
000
R'00
0
Cur
rent
pa
yme
nts
66 3
36(4
0 00
0)(2
6 20
0)13
653
8339
.03
843
3 84
3
Co
mp
ens
atio
n o
f em
plo
yee
s-
--
--
--
3 05
33
052
Go
od
s a
nd s
erv
ice
s66
336
(40
000)
(26
200)
136
5383
39.0
790
790
Tra
nsfe
rs a
nd s
ubsi
die
s29
0 16
010
0 00
0-
390
160
390
160
-10
099
1 82
099
1 82
0
De
pa
rtme
nta
l ag
enc
ies
and
a
cc
oun
ts18
1 16
0-
-18
1 16
018
1 16
0-
100
791
000
791
000
Pub
lic c
orp
ora
tions
and
priv
ate
e
nte
rpris
es
109
000
100
000
-20
9 00
020
9 00
0-
100
200
805
200
805
Ho
use
hold
s-
--
--
--
1515
Paym
ent
s fo
r ca
pita
l ass
ets
--
--
--
-9
9
Ma
chi
nery
and
eq
uip
me
nt-
--
--
--
99
page 178
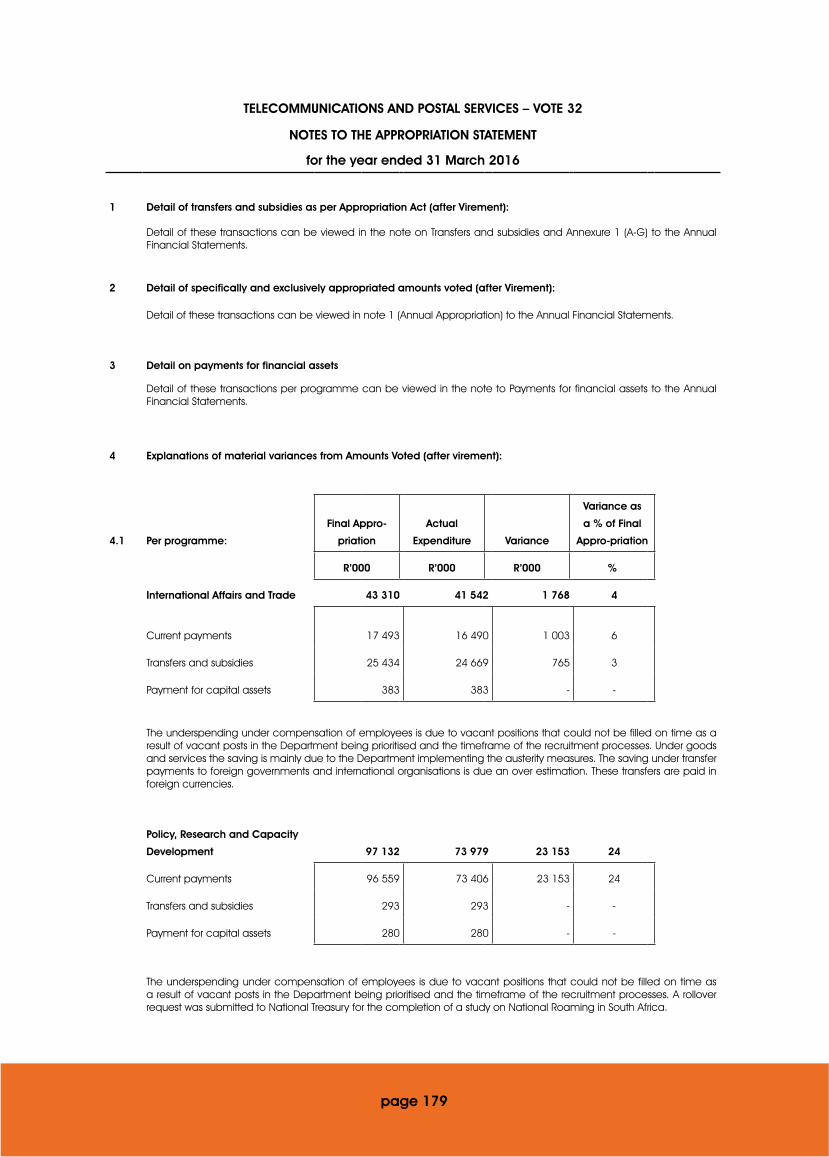
TELECOMMUNICATIONS AND POSTAL SERVICES – VOTE 32
NOTES TO THE APPROPRIATION STATEMENT
for the year ended 31 March 2016
1 Detail of transfers and subsidies as per Appropriation Act (after Virement):
Detail of these transactions can be viewed in the note on Transfers and subsidies and Annexure 1 (A-G) to the Annual Financial Statements.
2 Detail of specifically and exclusively appropriated amounts voted (after Virement):
Detail of these transactions can be viewed in note 1 (Annual Appropriation) to the Annual Financial Statements.
3 Detail on payments for financial assets
Detail of these transactions per programme can be viewed in the note to Payments for financial assets to the Annual Financial Statements.
4 Explanations of material variances from Amounts Voted (after virement):
4.1 Per programme:
Final Appro-
priation
Actual
Expenditure Variance
Variance as
a % of Final
Appro-priation
R’000 R’000 R’000 %
International Affairs and Trade 43 310 41 542 1 768 4
Current payments 17 493 16 490 1 003 6
Transfers and subsidies 25 434 24 669 765 3
Payment for capital assets 383 383 - -
The underspending under compensation of employees is due to vacant positions that could not be filled on time as a result of vacant posts in the Department being prioritised and the timeframe of the recruitment processes. Under goods and services the saving is mainly due to the Department implementing the austerity measures. The saving under transfer payments to foreign governments and international organisations is due an over estimation. These transfers are paid in foreign currencies.
Policy, Research and Capacity
Development 97 132 73 979 23 153 24
Current payments 96 559 73 406 23 153 24
Transfers and subsidies 293 293 - -
Payment for capital assets 280 280 - -
The underspending under compensation of employees is due to vacant positions that could not be filled on time as a result of vacant posts in the Department being prioritised and the timeframe of the recruitment processes. A rollover request was submitted to National Treasury for the completion of a study on National Roaming in South Africa.
page 179
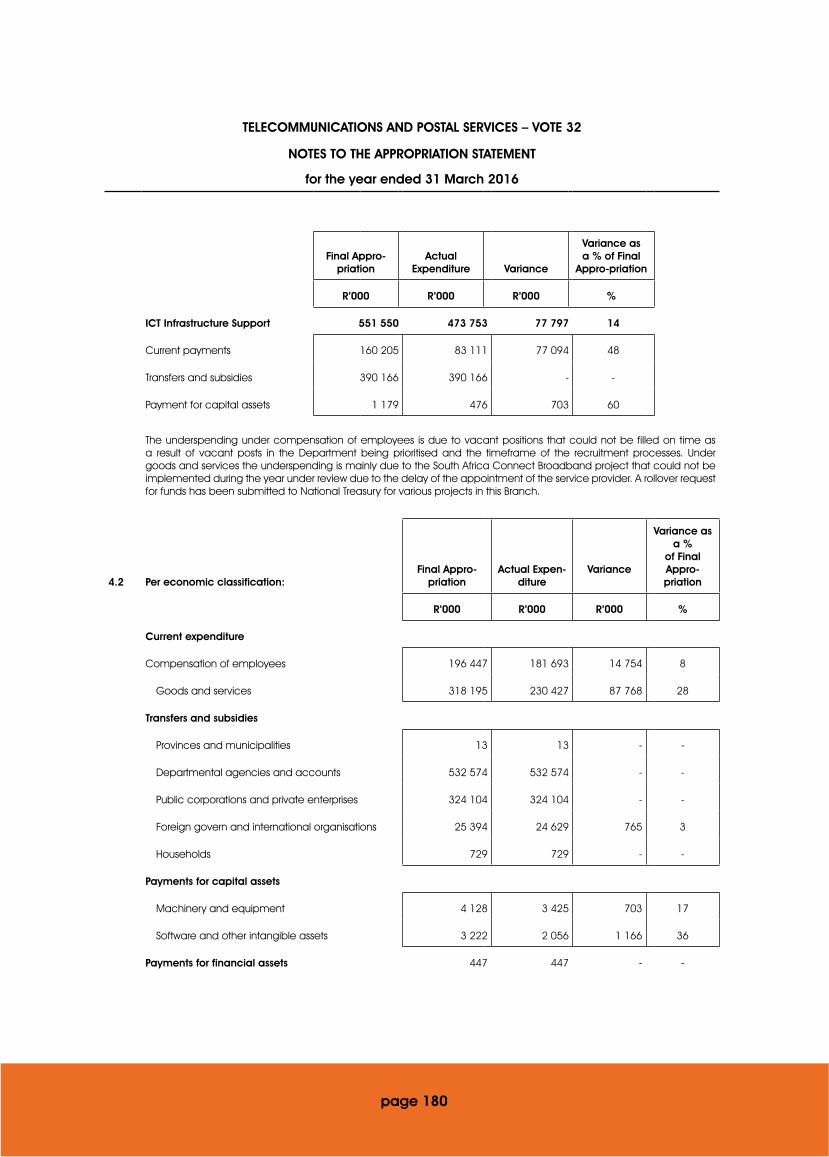
TELECOMMUNICATIONS AND POSTAL SERVICES – VOTE 32
NOTES TO THE APPROPRIATION STATEMENT
for the year ended 31 March 2016
Final Appro-priation
Actual Expenditure Variance
Variance as a % of Final
Appro-priation
R’000 R’000 R’000 %
ICT Infrastructure Support 551 550 473 753 77 797 14
Current payments 160 205 83 111 77 094 48
Transfers and subsidies 390 166 390 166 - -
Payment for capital assets 1 179 476 703 60
The underspending under compensation of employees is due to vacant positions that could not be filled on time as a result of vacant posts in the Department being prioritised and the timeframe of the recruitment processes. Under goods and services the underspending is mainly due to the South Africa Connect Broadband project that could not be implemented during the year under review due to the delay of the appointment of the service provider. A rollover request for funds has been submitted to National Treasury for various projects in this Branch.
4.2 Per economic classification:Final Appro-
priationActual Expen-
ditureVariance
Variance as a %
of Final Appro-priation
R’000 R’000 R’000 %
Current expenditure
Compensation of employees 196 447 181 693 14 754 8
Goods and services 318 195 230 427 87 768 28
Transfers and subsidies
Provinces and municipalities 13 13 - -
Departmental agencies and accounts 532 574 532 574 - -
Public corporations and private enterprises 324 104 324 104 - -
Foreign govern and international organisations 25 394 24 629 765 3
Households 729 729 - -
Payments for capital assets
Machinery and equipment 4 128 3 425 703 17
Software and other intangible assets 3 222 2 056 1 166 36
Payments for financial assets 447 447 - -
page 180
TELECOMMUNICATIONS AND POSTAL SERVICES – VOTE 32
NOTES TO THE APPROPRIATION STATEMENT
for the year ended 31 March 2016
The underspending under compensation of employees is due to vacant positions that could not be filled on time as a result of vacant posts in the Department being prioritised and the timeframe of the recruitment processes. Under goods and services the underspending is mainly due to the South Africa Connect Broadband project that could not be implemented during the year under review due to the delay of the appointment of the service provider. A rollover request for funds has been submitted to National Treasury for various projects in this Branch. The saving under transfer payments to foreign governments and international organisations is due an over estimation. These transfers are paid in foreign currencies. The Underspending on capital assets is mainly due to orders placed before 31 March 2016 but the assets has not been delivered and in some instances delivered after 31 March 2016.
page 181

TELECOMMUNICATIONS AND POSTAL SERVICES – VOTE 32
STATEMENT OF FINANCIAL PERFORMANCE
for the year ended 31 March 2016
2015/16 2014/15
Note R'000 R'000
REVENUE
Annual appropriation 1 1 405 253 2 236 657
Departmental revenue 2 26 804 435 1 672 004
TOTAL REVENUE 28 209 688 3 908 661
EXPENDITURE
Current expenditure
Compensation of employees 4 181 693 183 930
Goods and services 5 230 427 234 385
Interest and rent on land 6 - -
Total current expenditure 412 120 418 315
Transfers and subsidies
Transfers and subsidies 8 882 049 1 752 580
Total transfers and subsidies 882 049 1 752 580
Expenditure for capital assets
Tangible assets 9 3 425 10 213
Intangible assets 9 2 056 205
Total expenditure for capital assets 5 481 10 418
Payments for financial assets 7 447 363
TOTAL EXPENDITURE 1 300 097 2 181 676
SURPLUS/(DEFICIT) FOR THE YEAR 26 909 591 1 726 985
Reconciliation of Net Surplus/(Deficit) for the year
Voted Funds 105 156 54 981
Annual appropriation 17 105 156 54 981
Departmental revenue and NRF Receipts 18 26 804 435 1 672 004
SURPLUS/(DEFICIT) FOR THE YEAR 26 909 591 1 726 985
page 182

TELECOMMUNICATIONS AND POSTAL SERVICES – VOTE 32
STATEMENT OF FINANCIAL POSITION
for the year ended 31 March 2016
2015/16 2014/15
Note R'000 R'000
ASSETS
Current Assets 101 139 55 817
Unauthorised expenditure 10 4 741 4 741
Cash an cash equivalents 11 92 358 48 780
Prepayments and advances 13 3 725 1 719
Receivables 14 315 577
Non-Current Assets 2 774 059 14 479 289
Investments 15 2 767 241 14 445 160
Receivables 14 6 718 6 499
Loans 16 - 27 391
Other financial assets 12 100 239
TOTAL ASSETS 2 875 198 14 535 106
LIABILITIES
Current Liabilities 105 390 60 365
Voted funds to be surrendered to the Revenue Fund 17 105 156 54 981
Departmental revenue and NRF Receipts to be surrendered to the
Revenue Fund 18 50 136
Payables 19 184 5 248
TOTAL LIABILITIES 105 390 60 365
NET ASSETS 2 769 808 14 474 741
Represented by:
Capitalisation reserve 2 767 241 14 472 551
Recoverable revenue 2 567 2 190
TOTAL 2 769 808 14 474 741
page 183

TELECOMMUNICATIONS AND POSTAL SERVICES – VOTE 32
STATEMENT OF CHANGES IN NET ASSETS
for the year ended 31 March 2016
2015/16 2014/15
Note R'000 R'000
NET ASSETS
Capitalisation Reserves
Opening balance 14 472 551 14 472 551
Transfers:
Movement in Equity (11 677 919) -
Other movements (27 391) -
Closing balance 2 767 241 14 472 551
Recoverable revenue
Opening balance 2 190 2 139
Transfers 377 51
Irrecoverable amounts written off 7.2 (42) (94)
Debts recovered (included in departmental receipts) (496) (402)
Debts raised 915 547
Closing balance 2 567 2 190
TOTAL 2 769 808 14 474 741
page 184
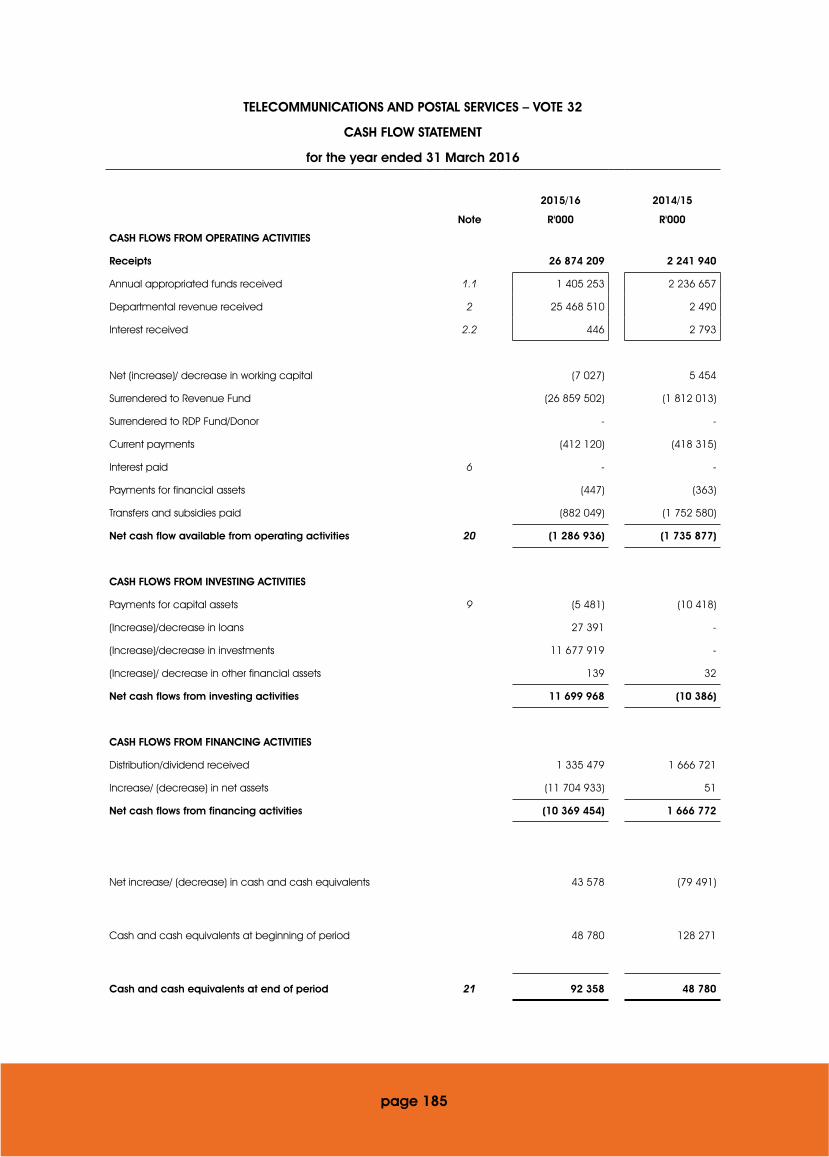
TELECOMMUNICATIONS AND POSTAL SERVICES – VOTE 32
CASH FLOW STATEMENT
for the year ended 31 March 2016
2015/16 2014/15
Note R'000 R'000
CASH FLOWS FROM OPERATING ACTIVITIES
Receipts 26 874 209 2 241 940
Annual appropriated funds received 1.1 1 405 253 2 236 657
Departmental revenue received 2 25 468 510 2 490
Interest received 2.2 446 2 793
Net (increase)/ decrease in working capital (7 027) 5 454
Surrendered to Revenue Fund (26 859 502) (1 812 013)
Surrendered to RDP Fund/Donor - -
Current payments (412 120) (418 315)
Interest paid 6 - -
Payments for financial assets (447) (363)
Transfers and subsidies paid (882 049) (1 752 580)
Net cash flow available from operating activities 20 (1 286 936) (1 735 877)
CASH FLOWS FROM INVESTING ACTIVITIES
Payments for capital assets 9 (5 481) (10 418)
(Increase)/decrease in loans 27 391 -
(Increase)/decrease in investments 11 677 919 -
(Increase)/ decrease in other financial assets 139 32
Net cash flows from investing activities 11 699 968 (10 386)
CASH FLOWS FROM FINANCING ACTIVITIES
Distribution/dividend received 1 335 479 1 666 721
Increase/ (decrease) in net assets (11 704 933) 51
Net cash flows from financing activities (10 369 454) 1 666 772
Net increase/ (decrease) in cash and cash equivalents 43 578 (79 491)
Cash and cash equivalents at beginning of period 48 780 128 271
Cash and cash equivalents at end of period 21 92 358 48 780
page 185
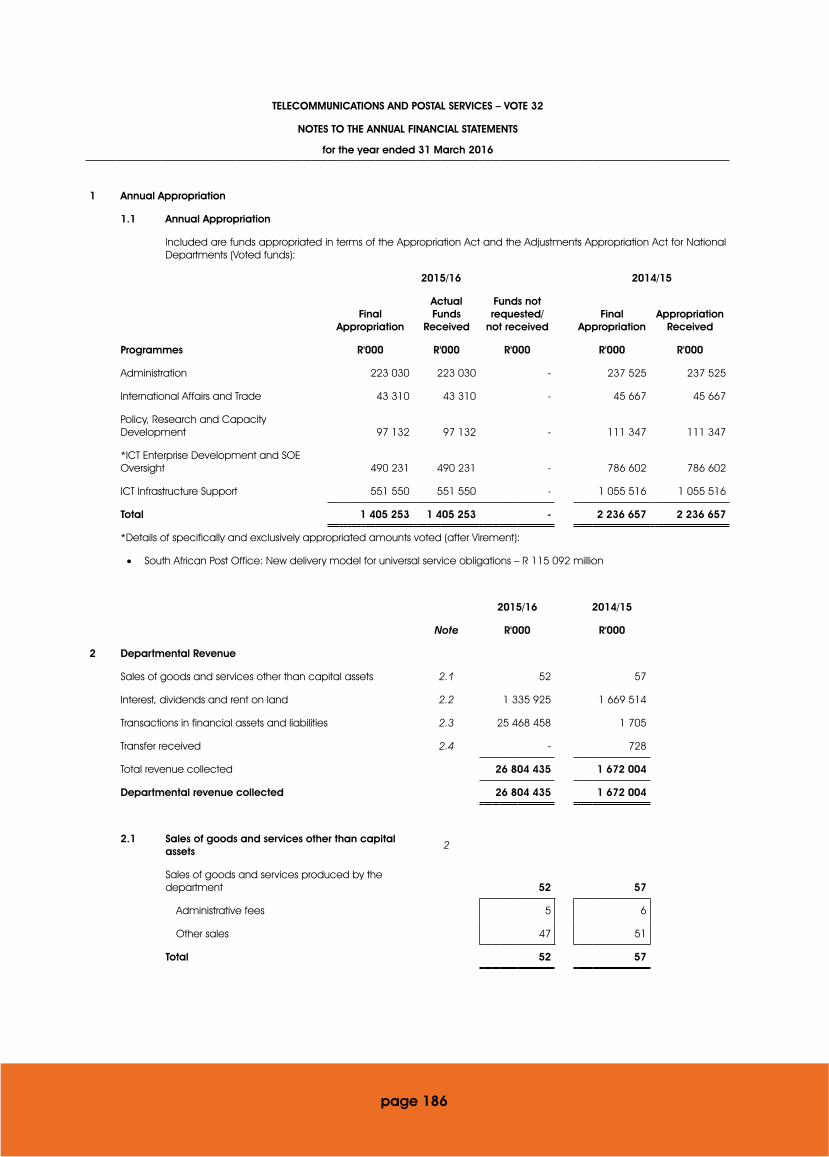
TELECOMMUNICATIONS AND POSTAL SERVICES – VOTE 32
NOTES TO THE ANNUAL FINANCIAL STATEMENTS
for the year ended 31 March 2016
1 Annual Appropriation
1.1 Annual Appropriation
Included are funds appropriated in terms of the Appropriation Act and the Adjustments Appropriation Act for National Departments (Voted funds):
2015/16 2014/15
Final Appropriation
Actual Funds
Received
Funds not requested/
not receivedFinal
Appropriation Appropriation
Received
Programmes R'000 R'000 R'000 R'000 R'000
Administration 223 030 223 030 - 237 525 237 525
International Affairs and Trade 43 310 43 310 - 45 667 45 667
Policy, Research and Capacity Development 97 132 97 132 - 111 347 111 347
*ICT Enterprise Development and SOE Oversight 490 231 490 231 - 786 602 786 602
ICT Infrastructure Support 551 550 551 550 - 1 055 516 1 055 516
Total 1 405 253 1 405 253 - 2 236 657 2 236 657
*Details of specifically and exclusively appropriated amounts voted (after Virement):
• South African Post Office: New delivery model for universal service obligations – R 115 092 million
2015/16 2014/15
Note R'000 R'000
2 Departmental Revenue
Sales of goods and services other than capital assets 2.1 52 57
Interest, dividends and rent on land 2.2 1 335 925 1 669 514
Transactions in financial assets and liabilities 2.3 25 468 458 1 705
Transfer received 2.4 - 728
Total revenue collected 26 804 435 1 672 004
Departmental revenue collected 26 804 435 1 672 004
2.1 Sales of goods and services other than capital assets
2
Sales of goods and services produced by the department 52 57
Administrative fees 5 6
Other sales 47 51
Total 52 57
page 186

TELECOMMUNICATIONS AND POSTAL SERVICES – VOTE 32
NOTES TO THE ANNUAL FINANCIAL STATEMENTS
for the year ended 31 March 2016
2015/16 2014/15
Note R'000 R'000
2.2 Interest, dividends and rent on land 2
Interest 446 2 793
Dividends 1 335 479 1 666 721
Total 1 335 925 1 669 514
The decrease is mainly due to a decrease in Vodacom dividends received and the sale of shares.
2.3 Transactions in financial assets and liabilities 2
Receivables 405 293
Forex gain - 10
*Sale of Equity 25 467 557 -
Other Receipts including Recoverable Revenue 496 1 402
Total 25 468 458 1 705
*The increase is in respect of the sale of Vodacom shares.
2.4 Transfers received 2
Public corporations and private enterprises - 728
Total - 728
Public corporations and private enterprises: The decrease is due to an insurance claim payment of R728 thousand on vehicle written off in the 2014/15 financial year.
3 Cash received not recognised (not included in note 2) 2015/16
Opening balance
R’000
Amount paid to Revenue
FundR’000
BalanceR’000
Name of Entity
ICASA 4 959 4 959 -
Total 4 959 4 959 -
Cash received not recognised (not included in note 2) 2014/15
Name of Entity
Amount received
R’000
Amount paid to Revenue
FundR’000
BalanceR’000
ICASA 986 208 981 249 4 959
Total 986 208 981 249 4 959
ICASA revenue received in the 2014/15 financial year not recognised as departmental revenue and paid to the National Revenue Fund in the 2015/16 financial year (Not included is an amount of R176 648 million received in the 2014/15 financial year from ICASA and paid to SARS as per National Treasury directive of which R39 thousand was paid to SARS in the 2015/16 financial year.
page 187

TELECOMMUNICATIONS AND POSTAL SERVICES – VOTE 32
NOTES TO THE ANNUAL FINANCIAL STATEMENTS
for the year ended 31 March 2016
2015/16 2014/15
Note R'000 R'000
4 Compensation of Employees
4.1 Salaries and wages
Basic salary 118 216 119 962
Performance award 2 594 1 961
Service Based 115 107
Compensative/circumstantial 3 490 2 522
Periodic payments - 360
Other non-pensionable allowances 36 473 39 039
Total 160 888 163 951
4.2 Social Contributions
Employer contributions
Pension 15 881 15 334
Medical 4 903 4 626
Bargaining council 21 19
Total 20 805 19 979
Total compensation of employees 181 693 183 930
Average number of employees 278 310
The decrease in compensation of employees is due to vacant positions that could not be filled on time as a result of vacant posts in the Department being prioritised and the timeframe of the recruitment processes.
5 Goods and services
Administrative fees 1 627 1 521
Advertising 3 198 1 468
Minor assets 5.1 479 265
Bursaries (employees) 513 687
Catering 1 969 1 120
Communication 5 182 5 297
Computer services 5.2 5 117 9 466
Consultants: Business and advisory services 75 146 49 056
Legal services 6 155 9 020
Contractors 2 060 2 336
Agency and support / outsourced services 144 23 233
Entertainment 494 298
page 188
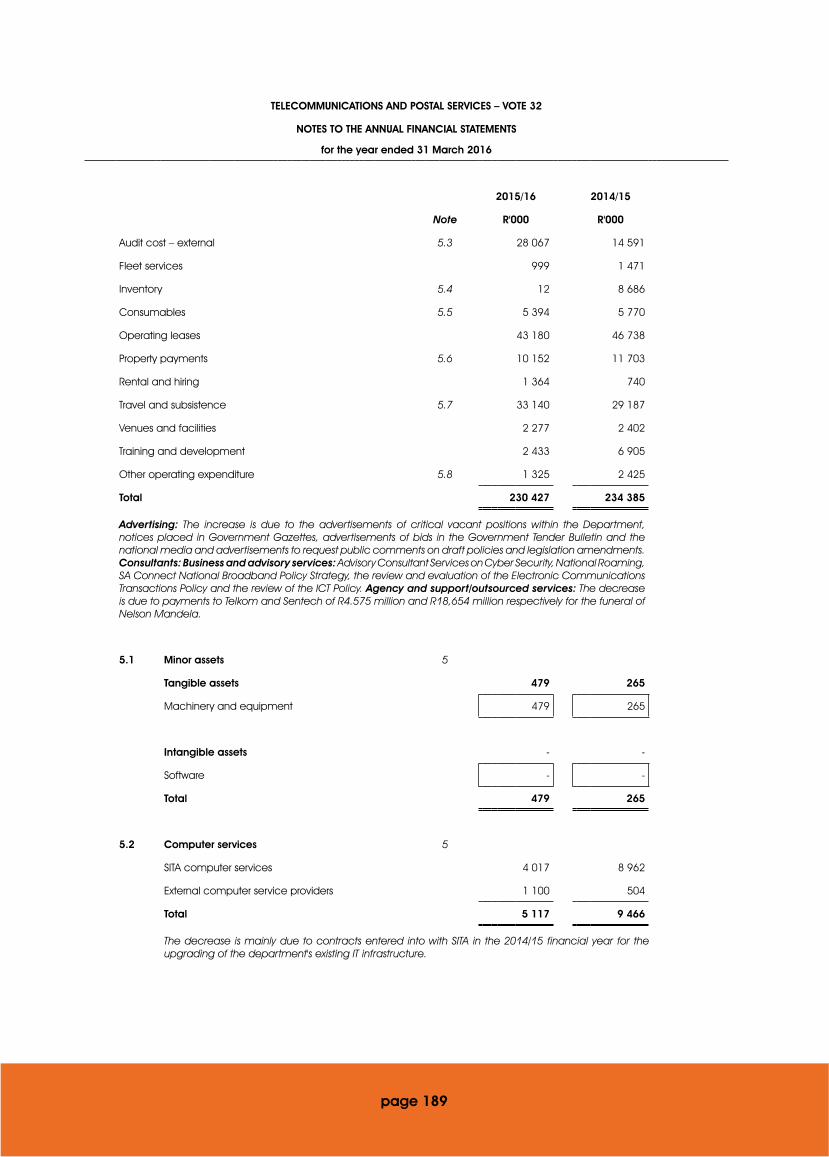
TELECOMMUNICATIONS AND POSTAL SERVICES – VOTE 32
NOTES TO THE ANNUAL FINANCIAL STATEMENTS
for the year ended 31 March 2016
2015/16 2014/15
Note R'000 R'000
Audit cost – external 5.3 28 067 14 591
Fleet services 999 1 471
Inventory 5.4 12 8 686
Consumables 5.5 5 394 5 770
Operating leases 43 180 46 738
Property payments 5.6 10 152 11 703
Rental and hiring 1 364 740
Travel and subsistence 5.7 33 140 29 187
Venues and facilities 2 277 2 402
Training and development 2 433 6 905
Other operating expenditure 5.8 1 325 2 425
Total 230 427 234 385
Advertising: The increase is due to the advertisements of critical vacant positions within the Department, notices placed in Government Gazettes, advertisements of bids in the Government Tender Bulletin and the national media and advertisements to request public comments on draft policies and legislation amendments. Consultants: Business and advisory services: Advisory Consultant Services on Cyber Security, National Roaming, SA Connect National Broadband Policy Strategy, the review and evaluation of the Electronic Communications Transactions Policy and the review of the ICT Policy. Agency and support/outsourced services: The decrease is due to payments to Telkom and Sentech of R4.575 million and R18,654 million respectively for the funeral of Nelson Mandela.
5.1 Minor assets 5
Tangible assets 479 265
Machinery and equipment 479 265
Intangible assets - -
Software - -
Total 479 265
5.2 Computer services 5
SITA computer services 4 017 8 962
External computer service providers 1 100 504
Total 5 117 9 466
The decrease is mainly due to contracts entered into with SITA in the 2014/15 financial year for the upgrading of the department's existing IT infrastructure.
page 189

TELECOMMUNICATIONS AND POSTAL SERVICES – VOTE 32
NOTES TO THE ANNUAL FINANCIAL STATEMENTS
for the year ended 31 March 2016
2015/16 2014/15
Note R'000 R'000
5.3 Audit cost – external 5
Regularity audits 4 523 5 131
Investigations 23 544 9 460
Total 28 067 14 591
Investigations: R23, 544 million is for forensic audits conducted at the department by SIU.
5.4 Inventory 5
Clothing material and accessories - 119
Fuel, oil and gas - 5
Materials and supplies 12 10
Other supplies - 8 552
Total 12 8 686
5.4.1 Other supplies
Assets for distribution - 8 552
Machinery and equipment - 8 552
The decrease is due to a tender completed for community radio stations broadcasting equipment used by radio stations. The function was also transferred to the new Department of Communications.
5.5 Consumables 5
Consumable supplies 209 137
Uniform and clothing 17 -
Household supplies 67 24
IT consumables 91 96
Other consumables 34 17
Stationery, printing and office supplies 5 185 5 633
Total 5 394 5 770
5.6 Property payments 5
Municipal services 3 012 2 852
Property management fees 15 14
Other 7 125 8 837
Total 10 152 11 703
The cleaning and security services for property are included under other.
page 190
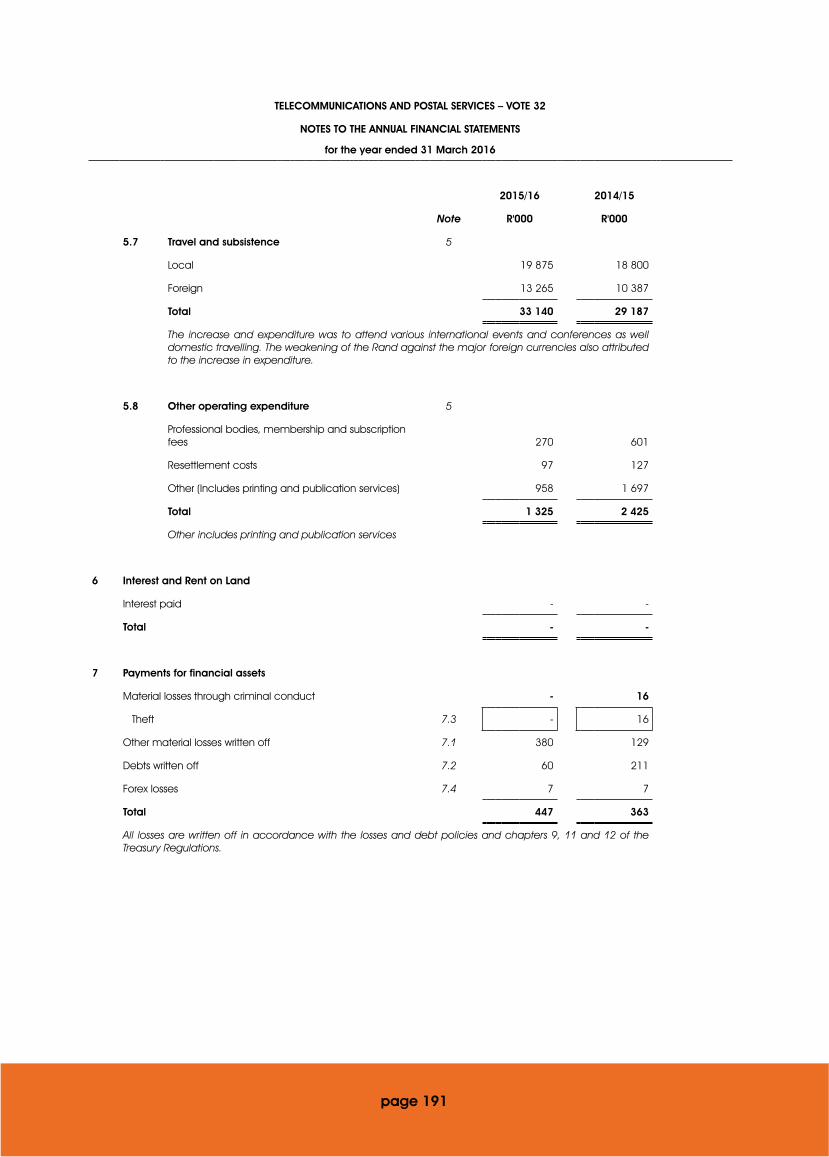
TELECOMMUNICATIONS AND POSTAL SERVICES – VOTE 32
NOTES TO THE ANNUAL FINANCIAL STATEMENTS
for the year ended 31 March 2016
2015/16 2014/15
Note R'000 R'000
5.7 Travel and subsistence 5
Local 19 875 18 800
Foreign 13 265 10 387
Total 33 140 29 187
The increase and expenditure was to attend various international events and conferences as well domestic travelling. The weakening of the Rand against the major foreign currencies also attributed to the increase in expenditure.
5.8 Other operating expenditure 5
Professional bodies, membership and subscription fees 270 601
Resettlement costs 97 127
Other (Includes printing and publication services) 958 1 697
Total 1 325 2 425
Other includes printing and publication services
6 Interest and Rent on Land
Interest paid - -
Total - -
7 Payments for financial assets
Material losses through criminal conduct - 16
Theft 7.3 - 16
Other material losses written off 7.1 380 129
Debts written off 7.2 60 211
Forex losses 7.4 7 7
Total 447 363
All losses are written off in accordance with the losses and debt policies and chapters 9, 11 and 12 of the Treasury Regulations.
page 191

TELECOMMUNICATIONS AND POSTAL SERVICES – VOTE 32
NOTES TO THE ANNUAL FINANCIAL STATEMENTS
for the year ended 31 March 2016
2015/16 2014/15
Note R'000 R'000
7.1 Other material losses written off 7
Nature of losses
Income tax - 27
No shows 3 8
Standing advance - 2
Interest 319 10
Duplicated service - 21
Penalties car licences - 1
Damaged rented vehicles 58 60
Total 380 129
Interest: The increase is due to interest of R316 263.11 charged by Amex due to late payments as a result of late certification and returning of invoices for payment. A process is in place to recover the losses were negligence is proved.
7.2 Debts written off 7
Nature of debts written off
Recoverable revenue written off
Supplier overpayments 37 -
Ex-employee debts 5 42
Leave without pay - 36
Laptops - 16
42 94
Other debts written off
Advances outstanding 7 -
Ex-employee debts 11 109
Leave without pay - 7
Impound of state vehicle - 1
Total 18 117
Total debt written off 60 211
Supplier overpayments: Supplier charged vat but is not a VAT vendor.
7.3 Details of theft 7
Nature of theft
Laptops - 16
Total - 16
page 192
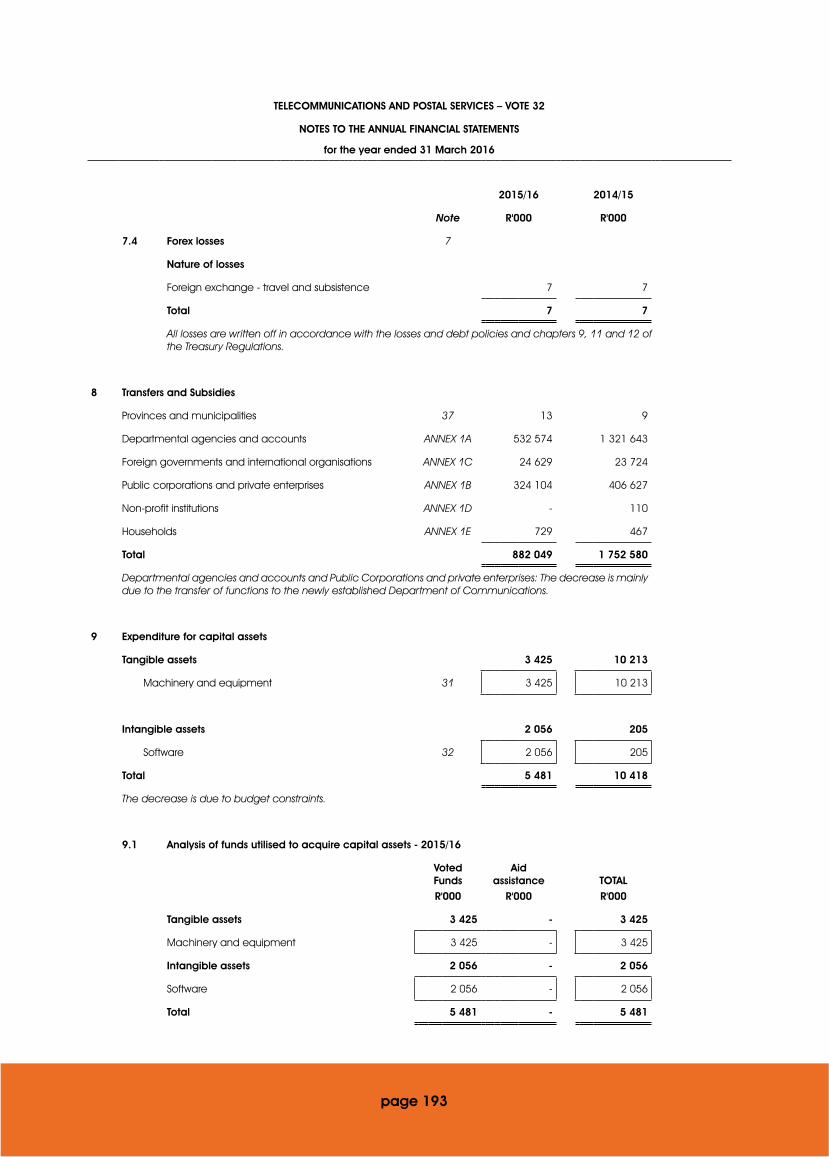
TELECOMMUNICATIONS AND POSTAL SERVICES – VOTE 32
NOTES TO THE ANNUAL FINANCIAL STATEMENTS
for the year ended 31 March 2016
2015/16 2014/15
Note R'000 R'000
7.4 Forex losses 7
Nature of losses
Foreign exchange - travel and subsistence 7 7
Total 7 7
All losses are written off in accordance with the losses and debt policies and chapters 9, 11 and 12 of the Treasury Regulations.
8 Transfers and Subsidies
Provinces and municipalities 37 13 9
Departmental agencies and accounts ANNEX 1A 532 574 1 321 643
Foreign governments and international organisations ANNEX 1C 24 629 23 724
Public corporations and private enterprises ANNEX 1B 324 104 406 627
Non-profit institutions ANNEX 1D - 110
Households ANNEX 1E 729 467
Total 882 049 1 752 580
Departmental agencies and accounts and Public Corporations and private enterprises: The decrease is mainly due to the transfer of functions to the newly established Department of Communications.
9 Expenditure for capital assets
Tangible assets 3 425 10 213
Machinery and equipment 31 3 425 10 213
Intangible assets 2 056 205
Software 32 2 056 205
Total 5 481 10 418
The decrease is due to budget constraints.
9.1 Analysis of funds utilised to acquire capital assets - 2015/16
Voted Funds
Aid assistance TOTAL
R'000 R'000 R'000
Tangible assets 3 425 - 3 425
Machinery and equipment 3 425 - 3 425
Intangible assets 2 056 - 2 056
Software 2 056 - 2 056
Total 5 481 - 5 481
page 193
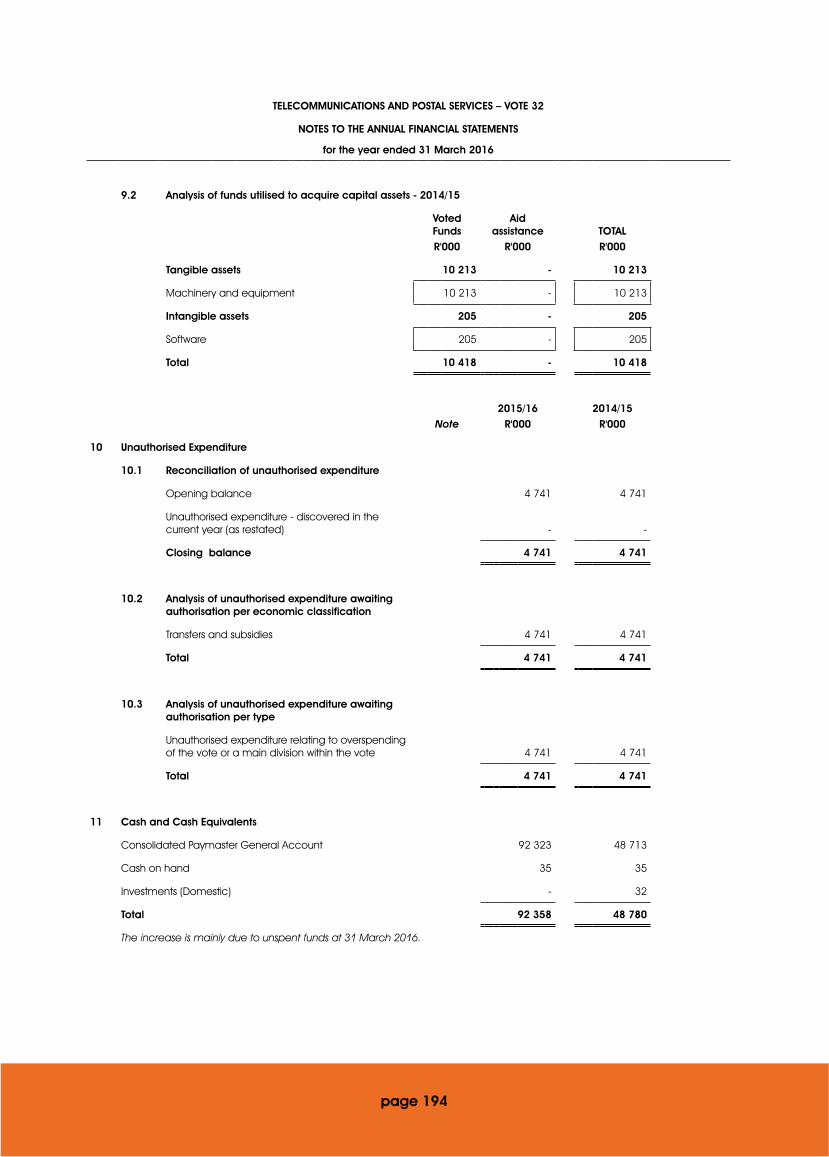
TELECOMMUNICATIONS AND POSTAL SERVICES – VOTE 32
NOTES TO THE ANNUAL FINANCIAL STATEMENTS
for the year ended 31 March 2016
9.2 Analysis of funds utilised to acquire capital assets - 2014/15
Voted Funds
Aid assistance TOTAL
R'000 R'000 R'000
Tangible assets 10 213 - 10 213
Machinery and equipment 10 213 - 10 213
Intangible assets 205 - 205
Software 205 - 205
Total 10 418 - 10 418
2015/16 2014/15Note R'000 R'000
10 Unauthorised Expenditure
10.1 Reconciliation of unauthorised expenditure
Opening balance 4 741 4 741
Unauthorised expenditure - discovered in the current year (as restated) - -
Closing balance 4 741 4 741
10.2 Analysis of unauthorised expenditure awaiting authorisation per economic classification
Transfers and subsidies 4 741 4 741
Total 4 741 4 741
10.3 Analysis of unauthorised expenditure awaiting authorisation per type
Unauthorised expenditure relating to overspending of the vote or a main division within the vote 4 741 4 741
Total 4 741 4 741
11 Cash and Cash Equivalents
Consolidated Paymaster General Account 92 323 48 713
Cash on hand 35 35
Investments (Domestic) - 32
Total 92 358 48 780
The increase is mainly due to unspent funds at 31 March 2016.
page 194

TELECOMMUNICATIONS AND POSTAL SERVICES – VOTE 32
NOTES TO THE ANNUAL FINANCIAL STATEMENTS
for the year ended 31 March 2016
2015/16 2014/15Note R'000 R'000
12 Other Financial Assets
Non-Current
Local
Deposit Municipality 100 199
Total 100 199
Security deposit Gaborone - 40
Total - 40
Total Non-Current other financial assets 100 239
Foreign: Security deposit - Gaborone R19 496.50 transferred to the newly established Department of Communications in terms of section 42 of PFMA - See also note 45 transfer of functions.
2015/16 2014/15
Note R'000 R'000
13 Prepayments and Advances
Travel and subsistence - 135
Advances paid 13.1 3 725 1 584
Total 3 725 1 719
13.1 Advances paid
National departments Annex 6 3 725 1 584
Total 3 725 1 584
Advances paid National departments: Outstanding invoices/claims from Department of International Relations and Cooperation as well as invoices that could not be processed before 31 March 2016.
2015/16 2014/15
CurrentNon-
current Total Current Non-current Total
Note R’000 R’000 R’000 R’000 R’000 R’000
14 Receivables
Claims recoverable14.1 - Annex
4 58 - 58 154 - 154
Recoverable expenditure 14.2 - 1 649 1 649 - 1 649 1 649
Staff debt 14.3 192 87 279 174 142 316
Other debtors 14.4 65 4 982 5 047 249 4 708 4 957
Total 315 6 718 7 033 577 6 499 7 076
page 195

TELECOMMUNICATIONS AND POSTAL SERVICES – VOTE 32
NOTES TO THE ANNUAL FINANCIAL STATEMENTS
for the year ended 31 March 2016
2015/16 2014/15
Note R'000 R'000
14.1 Claims recoverable 14
National departments 58 154
Total 58 154
Claims for Department of Health. See also annexure 4.
14.2 Recoverable expenditure (disallowance accounts)
14
Disallowance payments - fraud 1 649 1 649
Total 1 649 1 649
Fraudulent orders and invoices to the amount of R1 649 120
14.3 Staff debt 14
Debt accounts 279 316
Total 279 316
Various employee debts.
14.4 Other debtors 14
Ex-employees 392 348
Suppliers 4 637 4 593
Clearing accounts 4 4
Non-employees 14 12
Total 5 047 4 957
Suppliers: Legal case in process.
14.5 Fruitless and wasteful expenditure 14
Opening balance - -
Less amounts recovered 2 11
Less amounts written off 355 96
Transfers from note 28 Fruitless and Wasteful expenditure (357) (107)
Total - -
All losses are written off in accordance with the losses and debt policies and chapters 9, 11 and 12 of the Treasury Regulations.
page 196

TELECOMMUNICATIONS AND POSTAL SERVICES – VOTE 32
NOTES TO THE ANNUAL FINANCIAL STATEMENTS
for the year ended 31 March 2016
2015/16 2014/15
Note R'000 R'000
14.6 Impairment of receivables
Estimate of impairment of receivables 6 524 6 085
Total 6 524 6 085
15 Investments
Non-Current
Shares and other equity
Telkom SA Limited 2 070 381 2 070 380
South African Post Office Limited 693 116 200 940
Sentech (Pty) (Ltd) 1 1
Vodacom Group Limited 3 743 12 173 839
Total 2 767 241 14 445 160
Total non-current 2 767 241 14 445 160
Analysis of non-current investments
Opening balance 14 445 160 14 445 160
Disposals for cash (12 170 095) -
Non-cash movements 492 176 -
Closing balance 2 767 241 14 445 160
Disposals for cash: Sold Vodacom shares. Non cash movements: South African Post Office Ltd issued 287 176 058 shares for the TBVC loan converted to equity and 205 000 000 shares for 2013/14 MTEF allocation as approved by the Minister of Finance on 7 April 2014.
16 Loans
Public corporations - 27 391
Total - 27 391
Analysis of Balance
Opening balance 27 391 27 391
Transferred (27 391) -
Closing balance - 27 391
Transferred to the newly established Department of Communications in terms of section 42 of PFMA - See also note 36 transfer of functions.
page 197

TELECOMMUNICATIONS AND POSTAL SERVICES – VOTE 32
NOTES TO THE ANNUAL FINANCIAL STATEMENTS
for the year ended 31 March 2016
2015/16 2014/15
Note R'000 R'000
17 Voted Funds to be Surrendered to the Revenue Fund
Opening balance 54 981 14 072
Transfer from statement of financial performance 105 156 54 981
Add: Unauthorised expenditure for current year - -
Paid during the year (54 981) (14 072)
Closing balance 105 156 54 981
The increase is mainly due to underspending of voted funds in the 2015/2016 financial year.
18 Departmental revenue and NRF Receipts to be surrendered to the Revenue Fund
Opening balance 136 126 073
Transfer from Statement of Financial Performance 26 804 435 1 672 004
Paid during the year (26 804 521) (1 797 941)
Closing balance 50 136
The decrease is mainly due to fewer funds paid into the department's account on 31 March 2016 that could not be transferred to the NRF and the transfer of functions to the newly established Department of Communications.
19 Payables - current
Clearing accounts 19.1 165 231
Other payables 19.2 19 5 017
Total 184 5 248
19.1 Clearing accounts 19
Salary deductions 129 182
Leave days to be utilised for departmental debt - 21
Travel and subsistence 8 -
State guarantee 28 28
Total 165 231
19.2 Other payables 19
SARS - USF license fees - 4 998
Supplier invoices - legal dispute 19 19
Total 19 5 017
The decrease is mainly due to fewer funds paid into the department's account on 31 March 2016 that could not be transferred to the NRF and the transfer of functions to the newly established Department of Communications.
page 198

TELECOMMUNICATIONS AND POSTAL SERVICES – VOTE 32
NOTES TO THE ANNUAL FINANCIAL STATEMENTS
for the year ended 31 March 2016
2015/16 2014/15
Note R'000 R'000
20 Net cash flow available from operating activities
Net surplus/(deficit) as per Statement of Financial Performance 26 909 591 1 726 985
Add back non cash/cash movements not deemed operating activities (28 196 527) (3 462 862)
(Increase)/decrease in receivables – current 43 341
(Increase)/decrease in prepayments and advances (2 006) (23)
Increase/(decrease) in payables – current (5 064) 5 136
Proceeds from sale of investments (1 335 479) (1 666 721)
Expenditure on capital assets 5 481 10 418
Surrenders to Revenue Fund (26 859 502) (1 812 013)
Surrenders to RDP Fund/Donor - -
Net cash flow generated by operating activities (1 286 936) (1 735 877)
21 Reconciliation of cash and cash equivalents for cash flow purposes
Consolidated Paymaster General account 92 323 48 713
Cash on hand 35 35
Cash with commercial banks (Local) - 32
Total 92 358 48 780
The increase is mainly due to unspent funds at 31 March 2016.
22 Contingent liabilities and contingent assets
22.1 Contingent liabilities
Liable to Nature
Housing loan guarantees Employees Annex 3A 142 142
Other guarantees Annex 3A 1 397 647 369 751
Claims against the department Annex 3B 79 753 813 086
Total 1 477 542 1 182 979
Contingent liabilities: The decrease is due to R 755,756 million transferred to the new Department of Communications in the 2015/16 financial year. See also note 46 transfer of functions.
page 199

TELECOMMUNICATIONS AND POSTAL SERVICES – VOTE 32
NOTES TO THE ANNUAL FINANCIAL STATEMENTS
for the year ended 31 March 2016
2015/16 2014/15
Note R'000 R'000
22.2 Contingent assets
Nature of contingent asset
Counter claim submitted 5 299 4 853
Payment of legal costs 1 000 266
SAPO TBVC States loan conversion - 287 176
Total 6 299 292 295
SAPO has a loan stemming from the Former TBVC States Posts and Telecommunications Reorganisation Act. SAPO applied to convert this loan into share capital. It was approved in 2014 by Minister of Finance and shares were issued on 15 March 2016.
23 Commitments
Current expenditure 19 015 18 365
Approved and contracted 17 931 16 427
Approved but not yet contracted 1 084 1 983
Capital Expenditure 457 4 903
Approved and contracted 457 4 903
Total Commitments 19 472 23 268
African Communication Research - was to expire in 2014 and to work is yet to be completed. The commitments for cleaning and security services are for more than a year.
30 days 30+ days
2015/16R'000Total
2014/15R'000Total
24 Accruals and payables not recognised
24.1 Accruals
Listed by economic classification
Goods and services 65 130 195 -
Capital assets - - - -
Total 65 130 195 -
Listed by programme level
Administration 107 -
ICT International Affairs and Trade 43 -
Policy, Research and Capacity Development 27 -
ICT Enterprise Development and SOE Oversight - -
ICT Infrastructure Support 18 -
Total 195 -
page 200

TELECOMMUNICATIONS AND POSTAL SERVICES – VOTE 32
NOTES TO THE ANNUAL FINANCIAL STATEMENTS
for the year ended 31 March 2016
30 days 30+ days
2015/16R'000Total
2014/15R'000Total
24.2 Payables not recognised
Listed by economic classification
Goods and services 8 662 1 114 9 776 17 552
Capital assets 1 635 - 1 635 620
Total 10 297 1 114 11 411 18 172
Listed by programme level
Administration 6 688 16 645
ICT International Affairs and Trade 413 290
Policy, Research and Capacity Development 911 404
ICT Enterprise Development and SOE Oversight 413 259
ICT Infrastructure Support 2 986 574
Total 11 411 18 172
Both the Accruals and Payables not recognised were previously combined and have been split into sub note for the current year and beyond.
The decrease in Accruals and Payables not recognised is due to less invoices being submitted to the Department after 31 March 2016
25 Employee benefits
Leave entitlement 7 885 7 588
Service bonus (Thirteenth cheque) 3 845 4 126
Performance awards 2 594 1 961
Capped leave commitments 2 604 3 088
Long service awards 121 98
Total 17 049 16 861
Leave entitlement: The leave cycle is from January to December whilst the financial reporting period is from April to March. Officials are entitled to leave as and when required and not as accrued. Debit leave days (exceeding accruals allowed) included above is 92.78 days with a monetary value of R149 658.33. Officials are entitled to leave as and when required and not as accrued. Debit leave days (exceeding accruals allowed) included above is 76.61 days with a monetary value of R126 820.84. Other is Long service awards provisions.
page 201
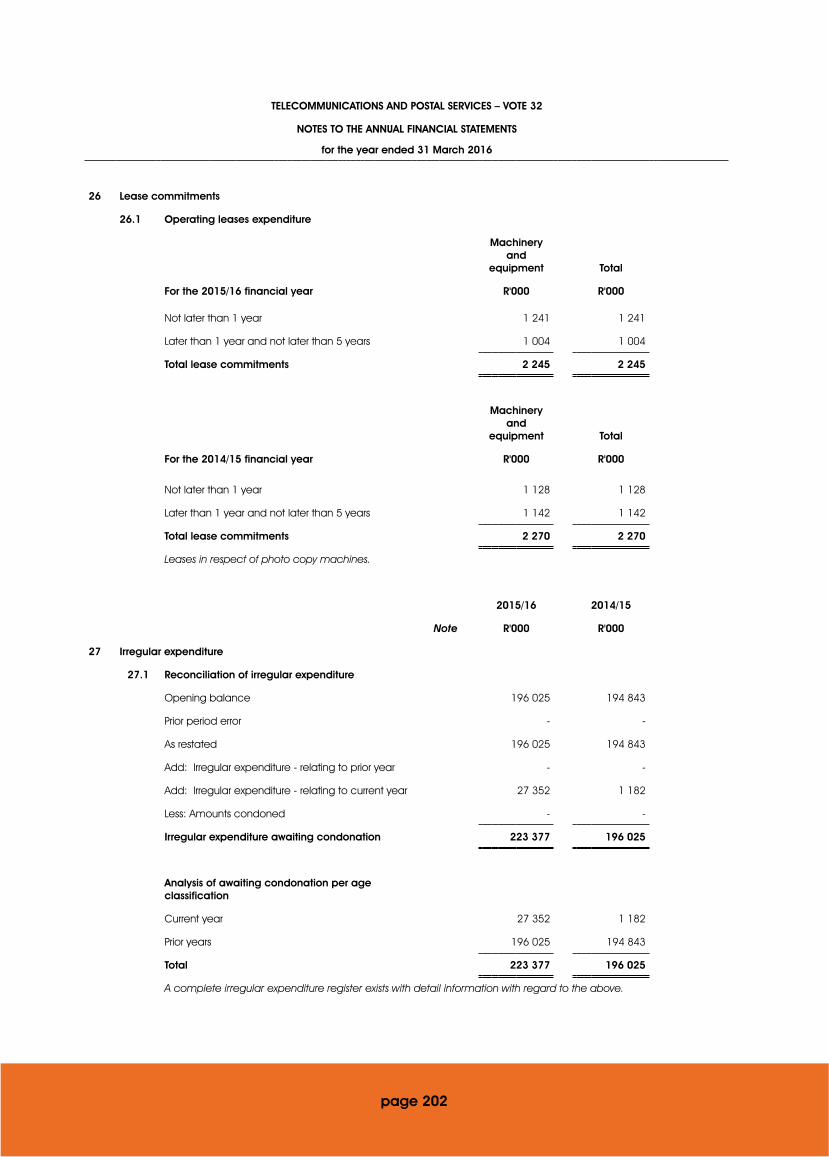
TELECOMMUNICATIONS AND POSTAL SERVICES – VOTE 32
NOTES TO THE ANNUAL FINANCIAL STATEMENTS
for the year ended 31 March 2016
26 Lease commitments
26.1 Operating leases expenditure
Machinery and
equipment Total
For the 2015/16 financial year R'000 R'000
Not later than 1 year 1 241 1 241
Later than 1 year and not later than 5 years 1 004 1 004
Total lease commitments 2 245 2 245
Machinery and
equipment Total
For the 2014/15 financial year R'000 R'000
Not later than 1 year 1 128 1 128
Later than 1 year and not later than 5 years 1 142 1 142
Total lease commitments 2 270 2 270
Leases in respect of photo copy machines.
2015/16 2014/15
Note R'000 R'000
27 Irregular expenditure
27.1 Reconciliation of irregular expenditure
Opening balance 196 025 194 843
Prior period error - -
As restated 196 025 194 843
Add: Irregular expenditure - relating to prior year - -
Add: Irregular expenditure - relating to current year 27 352 1 182
Less: Amounts condoned - -
Irregular expenditure awaiting condonation 223 377 196 025
Analysis of awaiting condonation per age classification
Current year 27 352 1 182
Prior years 196 025 194 843
Total 223 377 196 025
A complete irregular expenditure register exists with detail information with regard to the above.
page 202

TELECOMMUNICATIONS AND POSTAL SERVICES – VOTE 32
NOTES TO THE ANNUAL FINANCIAL STATEMENTS
for the year ended 31 March 2016
2015/16
R'000
27.2 Details of irregular expenditure - current year
IncidentDisciplinary steps taken/criminal
proceedings
Procurement procedures not followed In process 5
Procurement procedures not followed In process 20
Procurement procedures not followed In process 75
Procurement procedures not followed In process 60
Procurement procedures not followed In process 29
Procurement procedures not followed In process 32
Procurement procedures not followed In process 57
Procurement procedures not followed In process 12
Procurement procedures not followed In process 9
Veriment of a saving under Programme 5 exceeded 8% as required by Section 43 of the PFMA In process 26 200
Preferential points not calculated correctly In process 49
Reasons and motivation for deviations from normal SCM process not reasonable as required by practice note In process 804
Total 27 352
page 203

TELECOMMUNICATIONS AND POSTAL SERVICES – VOTE 32
NOTES TO THE ANNUAL FINANCIAL STATEMENTS
for the year ended 31 March 2016
2015/16 2014/15
Note R'000 R'000
28 Fruitless and wasteful expenditure
28.1 Reconciliation of fruitless and wasteful expenditure
Opening balance 12 294 12 380
Prior period error - -
As restated 12 294 12 380
Fruitless and wasteful expenditure – relating to current year 46 21
Less: Amounts transferred to receivables for recovery 14.5 (357) (107)
Closing balance 11 983 12 294
28.2 Analysis of awaiting resolution per economic classification
Current 11 983 12 294
Total 11 983 12 294
2015/16R’000
28.3 Analysis of Current Year's Fruitless and wasteful expenditure
Incident Disciplinary steps taken/criminal proceedings
Traffic fines In process – R1 371.64 recovered from officials 1
No Shows In process – R679. 99 recovered from official 45
Total 46
A complete fruitless and wasteful expenditure register exists with detail information with regard to the above.
No. of 2015/16 2014/15Individuals R'000 R'000
29 Key management personnel
Political office bearers 2 4 385 3 952
Officials:
Level 15 to 16 15 12 793 12 947
Level 14 7 5 568 5 077
Total 22 746 21 976
page 204
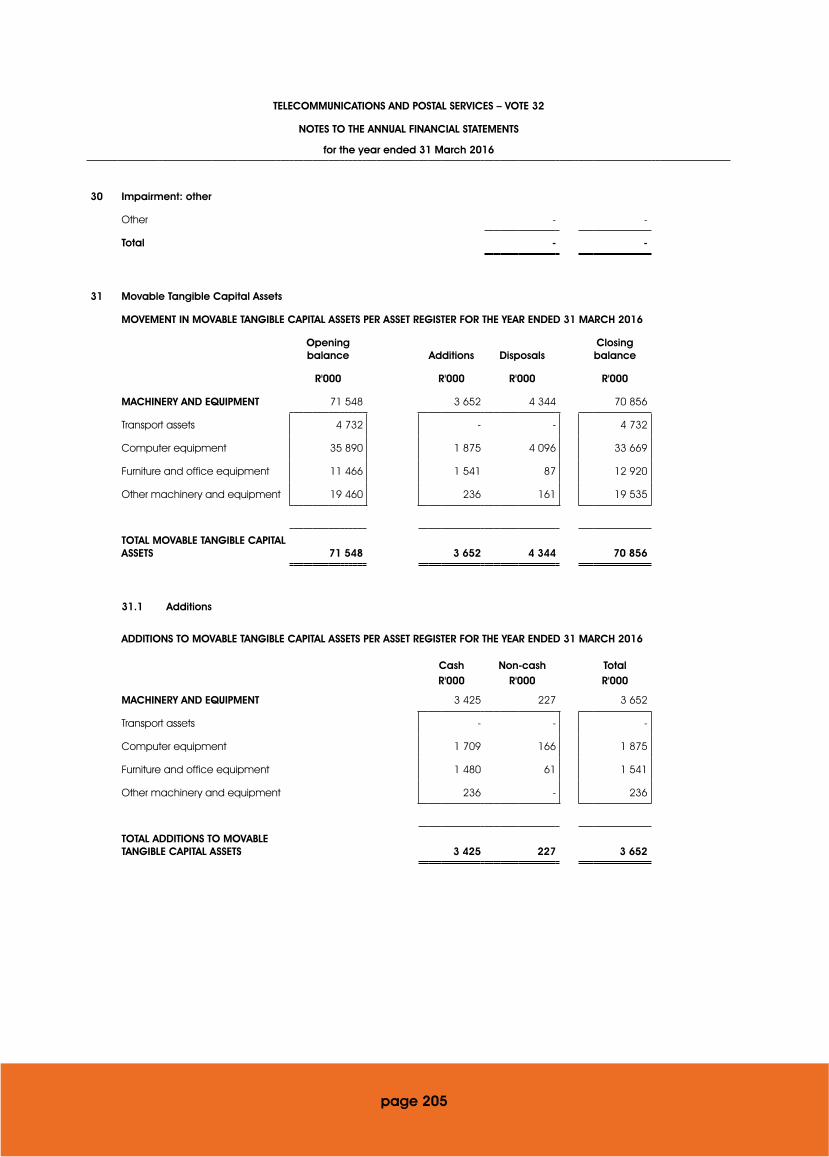
TELECOMMUNICATIONS AND POSTAL SERVICES – VOTE 32
NOTES TO THE ANNUAL FINANCIAL STATEMENTS
for the year ended 31 March 2016
30 Impairment: other
Other - -
Total - -
31 Movable Tangible Capital Assets
MOVEMENT IN MOVABLE TANGIBLE CAPITAL ASSETS PER ASSET REGISTER FOR THE YEAR ENDED 31 MARCH 2016
Opening balance Additions Disposals
Closing balance
R'000 R'000 R'000 R'000
MACHINERY AND EQUIPMENT 71 548 3 652 4 344 70 856
Transport assets 4 732 - - 4 732
Computer equipment 35 890 1 875 4 096 33 669
Furniture and office equipment 11 466 1 541 87 12 920
Other machinery and equipment 19 460 236 161 19 535
TOTAL MOVABLE TANGIBLE CAPITAL ASSETS 71 548 3 652 4 344 70 856
31.1 Additions
ADDITIONS TO MOVABLE TANGIBLE CAPITAL ASSETS PER ASSET REGISTER FOR THE YEAR ENDED 31 MARCH 2016
Cash Non-cash TotalR'000 R'000 R'000
MACHINERY AND EQUIPMENT 3 425 227 3 652
Transport assets - - -
Computer equipment 1 709 166 1 875
Furniture and office equipment 1 480 61 1 541
Other machinery and equipment 236 - 236
TOTAL ADDITIONS TO MOVABLE TANGIBLE CAPITAL ASSETS 3 425 227 3 652
page 205

TELECOMMUNICATIONS AND POSTAL SERVICES – VOTE 32
NOTES TO THE ANNUAL FINANCIAL STATEMENTS
for the year ended 31 March 2016
31.2 Disposals
DISPOSALS OF MOVABLE TANGIBLE CAPITAL ASSETS PER ASSET REGISTER FOR THE YEAR ENDED 31 MARCH 2016
Non-cash disposals
Total disposals
Cash received Actual
R'000 R'000 R'000
MACHINERY AND EQUIPMENT 4 344 4 344 -
Transport assets - - -
Computer equipment 4 096 4 096 -
Furniture and office equipment 87 87 -
Other machinery and equipment 161 161 -
TOTAL DISPOSAL OF MOVABLE TANGIBLE CAPITAL ASSETS 4 344 4 344 -
31.3 Movement for 2014/15
MOVEMENT IN MOVABLE TANGIBLE CAPITAL ASSETS PER ASSET REGISTER FOR THE YEAR ENDED 31 MARCH 2015
Opening balance
Prior period error Additions Disposals
Closing balance
R'000 R'000 R'000 R'000 R'000
MACHINERY AND EQUIPMENT 62 719 - 10 213 1 384 71 548
Transport assets 3 279 - 2 384 931 4 732
Computer equipment 30 095 - 6 226 431 35 890
Furniture and office equipment 10 576 - 890 - 11 466
Other machinery and equipment 18 769 - 713 22 19 460
TOTAL MOVABLE TANGIBLE CAPITAL ASSETS 62 719 - 10 213 1 384 71 548
page 206
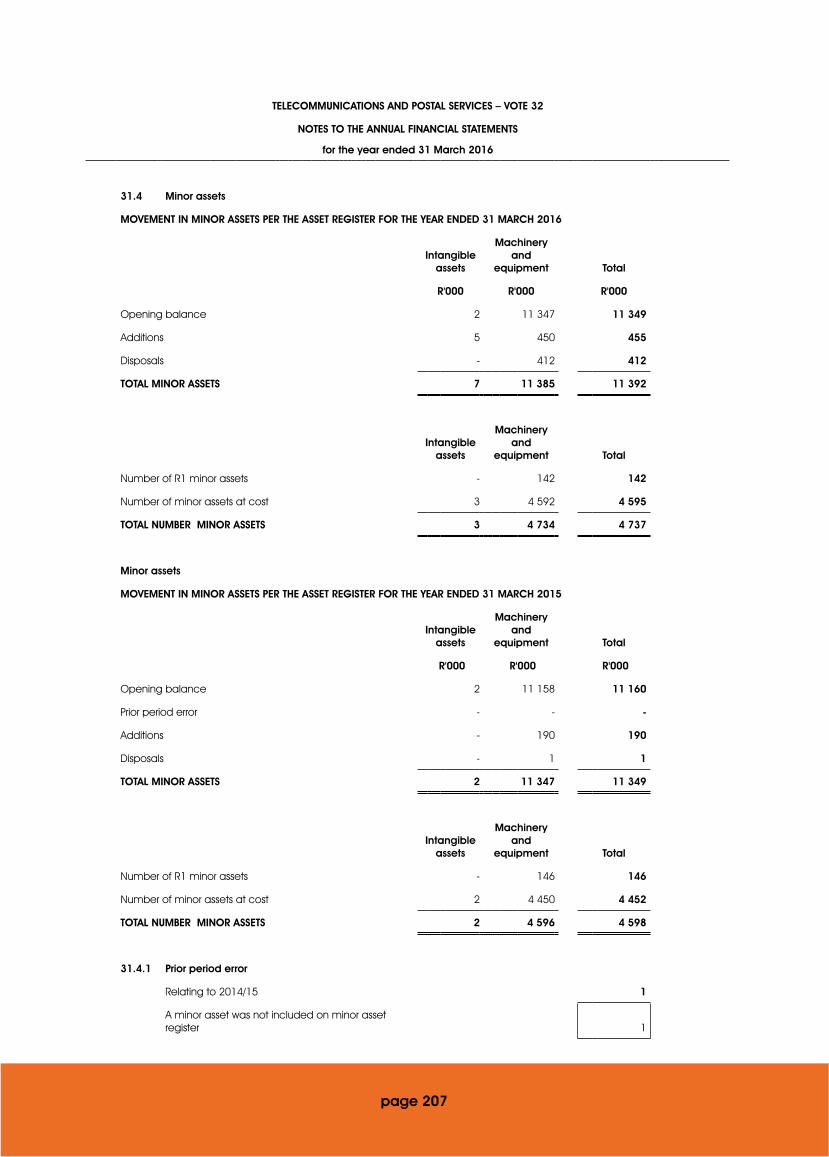
TELECOMMUNICATIONS AND POSTAL SERVICES – VOTE 32
NOTES TO THE ANNUAL FINANCIAL STATEMENTS
for the year ended 31 March 2016
31.4 Minor assets
MOVEMENT IN MINOR ASSETS PER THE ASSET REGISTER FOR THE YEAR ENDED 31 MARCH 2016
Intangible assets
Machinery and
equipment Total
R'000 R'000 R'000
Opening balance 2 11 347 11 349
Additions 5 450 455
Disposals - 412 412
TOTAL MINOR ASSETS 7 11 385 11 392
Intangible assets
Machinery and
equipment Total
Number of R1 minor assets - 142 142
Number of minor assets at cost 3 4 592 4 595
TOTAL NUMBER MINOR ASSETS 3 4 734 4 737
Minor assets
MOVEMENT IN MINOR ASSETS PER THE ASSET REGISTER FOR THE YEAR ENDED 31 MARCH 2015
Intangible assets
Machinery and
equipment Total
R'000 R'000 R'000
Opening balance 2 11 158 11 160
Prior period error - - -
Additions - 190 190
Disposals - 1 1
TOTAL MINOR ASSETS 2 11 347 11 349
Intangible assets
Machinery and
equipment Total
Number of R1 minor assets - 146 146
Number of minor assets at cost 2 4 450 4 452
TOTAL NUMBER MINOR ASSETS 2 4 596 4 598
31.4.1 Prior period error
Relating to 2014/15 1
A minor asset was not included on minor asset register 1
page 207

TELECOMMUNICATIONS AND POSTAL SERVICES – VOTE 32
NOTES TO THE ANNUAL FINANCIAL STATEMENTS
for the year ended 31 March 2016
31.5 Movable assets written off
MOVABLE ASSETS WRITTEN OFF FOR THE YEAR ENDED 31 MARCH 2016
Intangible assets
Machinery and
equipment Total
R'000 R'000 R'000
Assets written off - 82 82
TOTAL MOVABLE ASSETS WRITTEN OFF - 82 82
MOVABLE ASSETS WRITTEN OFF FOR THE YEAR ENDED 31 MARCH 2015
Intangible assets
Machinery and
equipment Total
R'000 R'000 R'000
Assets written off - 77 77
TOTAL MOVABLE ASSETS WRITTEN OFF - 77 77
32 Intangible Capital Assets
MOVEMENT IN INTANGIBLE CAPITAL ASSETS PER ASSET REGISTER FOR THE YEAR ENDED 31 MARCH 2016
Opening balance Additions Disposals
Closing balance
R'000 R'000 R'000 R'000
Software 1 050 2 056 299 2 807
Patent, Licences, Copyright, Brand names, Trademarks 369 - - 369
TOTAL INTANGIBLE CAPITAL ASSETS 1 419 2 056 299 3 176
32.1 ADDITIONS TO INTANGIBLE CAPITAL ASSETS PER ASSET REGISTER FOR THE YEAR ENDED 31 MARCH 2016
Cash Non-cash Total
R'000 R'000 R'000
Software 2 056 - 2 056
TOTAL ADDITIONS TO INTANGIBLE CAPITAL ASSETS 2 056 - 2 056
32.2 Disposals
DISPOSALS OF INTANGIBLE CAPITAL ASSETS PER ASSET REGISTER FOR THE YEAR ENDED 31 MARCH 2016
Non-cash disposal
Total disposals
Cash received Actual
R'000 R'000 R'000
Software 299 299 -
TOTAL DISPOSAL OF INTANGIBLE CAPITAL ASSETS 299 299 -
page 208

TELECOMMUNICATIONS AND POSTAL SERVICES – VOTE 32
NOTES TO THE ANNUAL FINANCIAL STATEMENTS
for the year ended 31 March 2016
32.3 Movement for 2014/15
MOVEMENT IN INTANGIBLE CAPITAL ASSETS PER ASSET REGISTER FOR THE YEAR ENDED 31 MARCH 2015
Opening balance Additions Disposals
Closing balance
R'000 R'000 R'000 R'000
Software 8 402 205 7 557 1 050
Patents, licences, copyright, brand names, trademarks 369 - - 369
TOTAL INTANGIBLE CAPITAL ASSETS 8 771 205 7 557 1 419
33 Immovable Tangible Capital Assets
MOVEMENT IN IMMOVABLE TANGIBLE CAPITAL ASSETS PER ASSET REGISTER FOR THE YEAR ENDED 31 MARCH 2016
Opening balance Additions Disposals
Closing balance
R'000 R'000 R'000 R'000
BUILDINGS AND OTHER FIXED STRUCTURES 18 - - 18
Non-residential buildings 18 - - 18
TOTAL IMMOVABLE TANGIBLE CAPITAL ASSETS 18 - - 18
33.1 Movement for 2014/15
MOVEMENT IN IMMOVABLE TANGIBLE CAPITAL ASSETS PER ASSET REGISTER FOR THE YEAR ENDED 31 MARCH 2015
Opening balance
Prior period error Additions Disposals
Closing balance
R'000 R'000 R'000 R'000 R'000
BUILDINGS AND OTHER FIXED STRUCTURES 18 - - - 18
Non-residential buildings 18 - - - 18
TOTAL IMMOVABLE TANGIBLE CAPITAL ASSETS 18 - - - 18
34 Related party relationships
34.1 Investment entities: Telkom SA Limited; South African Post Office Limited; Vodacom Group Limited; Broadband Infraco; SITA and SENTECH.
34.2 Other: Universal Service and Access Agency of South Africa; Universal Service and Access Fund; National Electronic Media Institute of South Africa; .ZA Domain Name Authority and DPW.
page 209
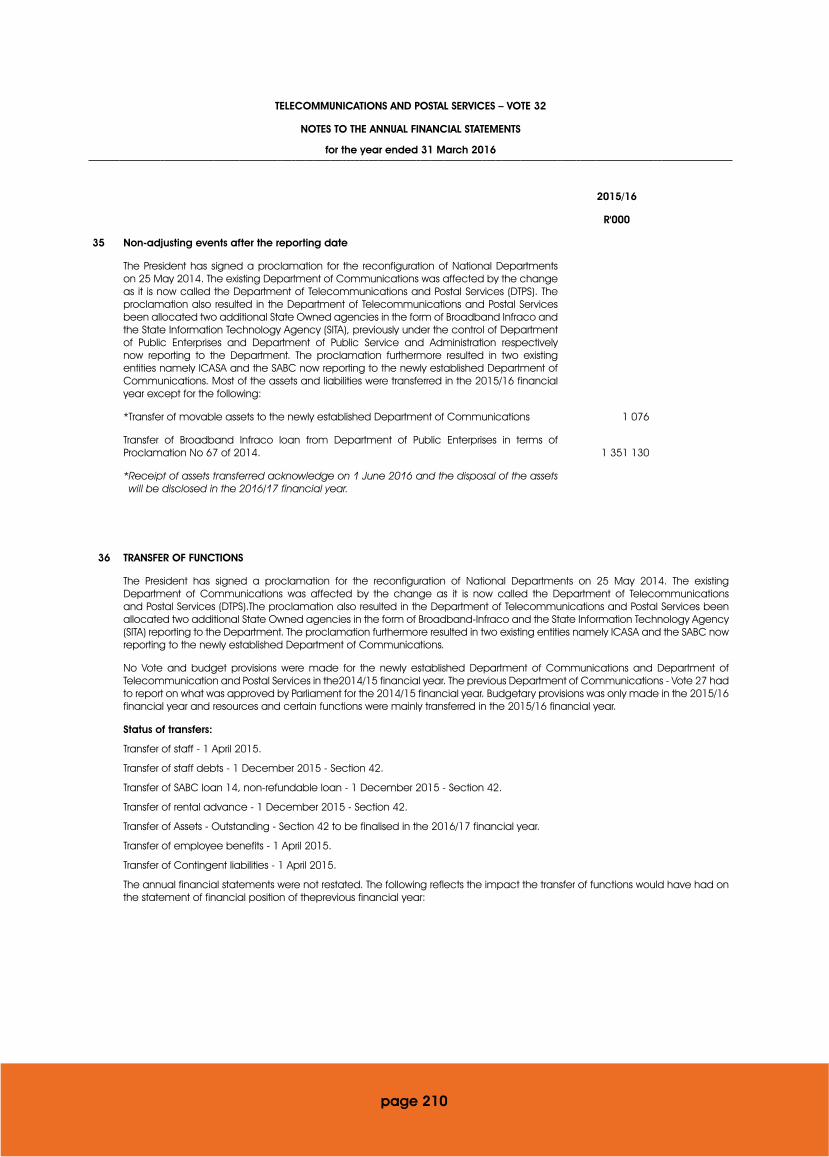
TELECOMMUNICATIONS AND POSTAL SERVICES – VOTE 32
NOTES TO THE ANNUAL FINANCIAL STATEMENTS
for the year ended 31 March 2016
2015/16
R'000
35 Non-adjusting events after the reporting date
The President has signed a proclamation for the reconfiguration of National Departments on 25 May 2014. The existing Department of Communications was affected by the change as it is now called the Department of Telecommunications and Postal Services (DTPS). The proclamation also resulted in the Department of Telecommunications and Postal Services been allocated two additional State Owned agencies in the form of Broadband Infraco and the State Information Technology Agency (SITA), previously under the control of Department of Public Enterprises and Department of Public Service and Administration respectively now reporting to the Department. The proclamation furthermore resulted in two existing entities namely ICASA and the SABC now reporting to the newly established Department of Communications. Most of the assets and liabilities were transferred in the 2015/16 financial year except for the following:
*Transfer of movable assets to the newly established Department of Communications 1 076
Transfer of Broadband Infraco loan from Department of Public Enterprises in terms of Proclamation No 67 of 2014. 1 351 130
* Receipt of assets transferred acknowledge on 1 June 2016 and the disposal of the assets will be disclosed in the 2016/17 financial year.
36 TRANSFER OF FUNCTIONS
The President has signed a proclamation for the reconfiguration of National Departments on 25 May 2014. The existing Department of Communications was affected by the change as it is now called the Department of Telecommunications and Postal Services (DTPS).The proclamation also resulted in the Department of Telecommunications and Postal Services been allocated two additional State Owned agencies in the form of Broadband-Infraco and the State Information Technology Agency (SITA) reporting to the Department. The proclamation furthermore resulted in two existing entities namely ICASA and the SABC now reporting to the newly established Department of Communications.
No Vote and budget provisions were made for the newly established Department of Communications and Department of Telecommunication and Postal Services in the2014/15 financial year. The previous Department of Communications - Vote 27 had to report on what was approved by Parliament for the 2014/15 financial year. Budgetary provisions was only made in the 2015/16 financial year and resources and certain functions were mainly transferred in the 2015/16 financial year.
Status of transfers:
Transfer of staff - 1 April 2015.
Transfer of staff debts - 1 December 2015 - Section 42.
Transfer of SABC loan 14, non-refundable loan - 1 December 2015 - Section 42.
Transfer of rental advance - 1 December 2015 - Section 42.
Transfer of Assets - Outstanding - Section 42 to be finalised in the 2016/17 financial year.
Transfer of employee benefits - 1 April 2015.
Transfer of Contingent liabilities - 1 April 2015.
The annual financial statements were not restated. The following reflects the impact the transfer of functions would have had on the statement of financial position of theprevious financial year:
page 210
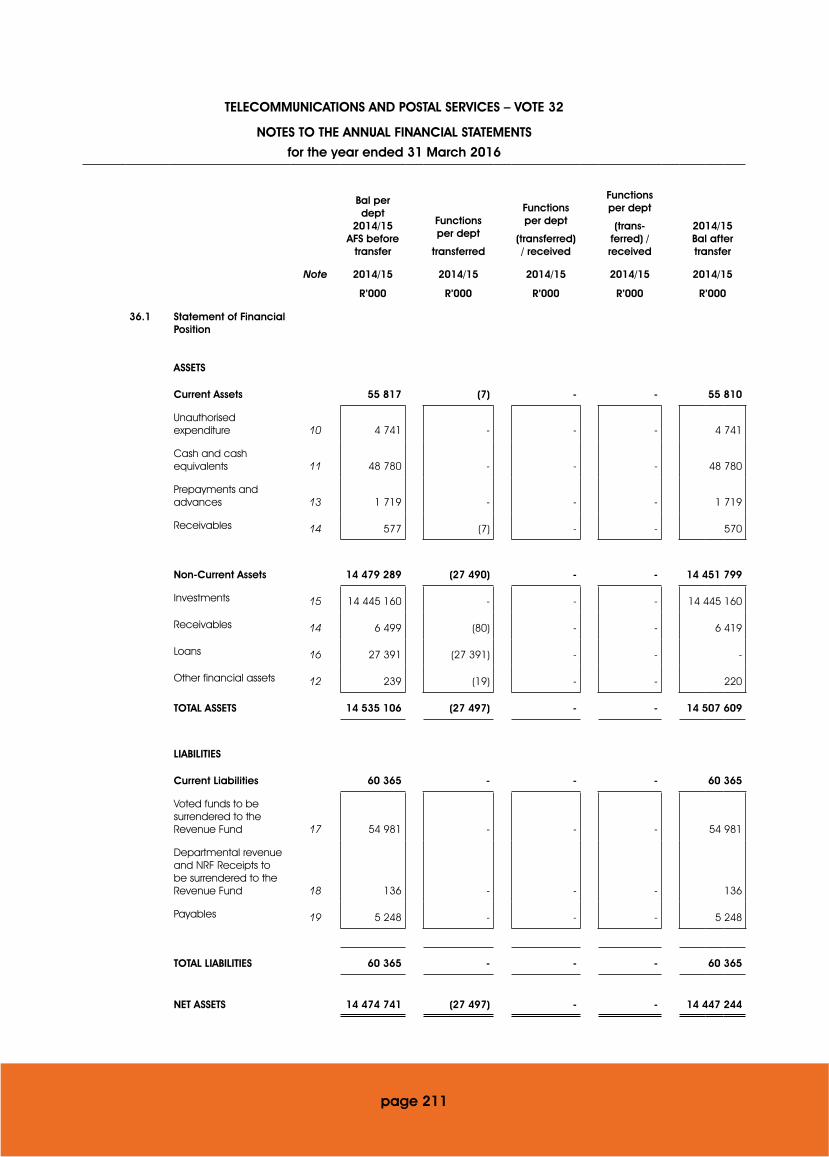
TELECOMMUNICATIONS AND POSTAL SERVICES – VOTE 32
NOTES TO THE ANNUAL FINANCIAL STATEMENTS
for the year ended 31 March 2016
Bal per dept
2014/15 AFS before
transfer
Functions per dept
transferred
Functions per dept
(transferred) / received
Functions per dept
(trans-ferred) / received
2014/15 Bal after transfer
Note 2014/15 2014/15 2014/15 2014/15 2014/15
R’000 R’000 R’000 R’000 R’000
36.1 Statement of Financial Position
ASSETS
Current Assets 55 817 (7) - - 55 810
Unauthorised expenditure 10 4 741 - - - 4 741
Cash and cash equivalents 11 48 780 - - - 48 780
Prepayments and advances 13 1 719 - - - 1 719
Receivables 14 577 (7) - - 570
Non-Current Assets 14 479 289 (27 490) - - 14 451 799
Investments 15 14 445 160 - - - 14 445 160
Receivables 14 6 499 (80) - - 6 419
Loans 16 27 391 (27 391) - - -
Other financial assets 12 239 (19) - - 220
TOTAL ASSETS 14 535 106 (27 497) - - 14 507 609
LIABILITIES
Current Liabilities 60 365 - - - 60 365
Voted funds to be surrendered to the Revenue Fund 17 54 981 - - - 54 981
Departmental revenue and NRF Receipts to be surrendered to the Revenue Fund 18 136 - - - 136
Payables 19 5 248 - - - 5 248
TOTAL LIABILITIES 60 365 - - - 60 365
NET ASSETS 14 474 741 (27 497) - - 14 447 244
page 211

page 212
TELECOMMUNICATIONS AND POSTAL SERVICES – VOTE 32
NOTES TO THE ANNUAL FINANCIAL STATEMENTS
for the year ended 31 March 2016
Bal per dept
2014/15 AFS before
transfer
Functions per dept
transferred
Functions per dept
(transferred) / received
Functions per dept
(trans-ferred) / received
2014/15 Bal after transfer
2014/15 2014/15 2014/15 2014/15 2014/15
36.2 Disclosure Notes Note R'000 R'000 R'000 R'000 R'000
Contingent liabilities 22.1 1 182 979 (755 576) - - 427 403
Contingent assets 22.2 5 119 - - - 5 119
Commitments 23 23 268 - - - 23 268
Accruals 24 - - - - -
Payables not recognised 24 18 172 18 172
Employee benefits 25 16 861 (1 202) - - 15 659
Lease commitments - operating lease 26 2 270 - - - 2 270
Irregular expenditure 27 195 996 - - - 195 996
Fruitless and wasteful expenditure 28 12 294 - - - 12 294
Impairment 14.6 6 085 - - - 6 085
Movable tangible capital assets 31 71 548 - - - 71 548
Immovable tangible capital assets 33 18 - - - 18
Intangible capital assets 32 1 419 - - - 1 419
Provide a reference to the proclamation or declaration giving effect to the transfer or receipt of functions
During the 2014/15 financial year the Department underwent one of the most significant changes in its history through the NMOS – National Macro Organisation of the Stateprocess that was set into motion following the May 2014 National Elections. Subsequent to the National Elections, the President pronounced the establishment of theNational Department of Telecommunications and Postal Services. Accordingly, the following Presidential Proclamations in Government Gazette No. 37839 dated15 July 2014 and Government Gazette No. 38280 dated 02 December 2014, confirmed the transfer of administration, powers and functions entrusted by specific legislationto the Ministry of Telecommunications and Postal Services and the newly formed Ministry of Communications.
The transfer of administration, powers and functions required constructive engagements with the newly established Department of Communications that resulted in a transferof relevant projects and associated resources during the 2014/15 financial year. Such projects and resources featured largely around the Broadcasting space. Theproclamation also resulted in the Department of Telecommunications and Postal Services inheriting two additional State Owned Companies in the form of Broadband Infracoand the State Information Technology Agency (SITA). The Department did well to manage this transformation while still ensuring implementation of its Strategic Plan andAnnual Performance Plan in alignment with its revised mandate.
Indicate whether there was an agreement drawn up, and provide a description of the roles, responsibilities and accountability arrangements
A memorandum of Understanding was entered into between the DOC and the DTPS and between the DPE to provide co-operation between the parties in order to archive a smooth and seamless (i) transfer of staff, functions and shifting of funds from the DPE to the DTPS and from the DTPS to the DOC; (ii) to established a protocol and governance arrangement for the management of funds other matters and (iii) to provide for interim working arrangements for staff to be transferred and (iv) define the working relationship the Director Generals.

TELE
CO
MM
UNIC
ATIO
NS
AN
D P
OST
AL
SERV
ICES
– V
OTE
32
NO
TES
TO T
HE
AN
NUA
L FI
NA
NC
IAL
STAT
EMEN
TS
for t
he y
ea
r end
ed
31
Ma
rch
2016
37. S
TATE
MEN
T O
F C
ON
DIT
ION
AL
GRA
NTS
AN
D O
THER
TRA
NSF
ERS
TO M
UNIC
IPA
LITI
ES
NA
ME
OF
MUN
ICIP
ALI
TY
GRA
NT
ALL
OC
ATIO
NTR
AN
SFER
Div
isio
n o
f
Reve
nue
Ac
tRo
ll O
vers
Ad
just
me
nts
Tota
l
Ava
ilab
leA
ctu
al T
rans
fer
Fund
s W
ithhe
ld
Re-a
lloc
atio
ns b
y
Na
tiona
l Tre
asu
ry o
r
Na
tiona
l De
pa
rtm
ent
R'00
0R'
000
R'00
0R'
000
R'00
0R'
000
R'00
0
City
of T
shw
ane
--
--
11-
-
Ca
pe
To
wn
--
--
2-
-
Tota
l-
--
-13
--
Vehi
cle
lic
enc
e fe
es
page 213

TELE
CO
MM
UNIC
ATIO
NS
AN
D P
OST
AL
SERV
ICES
– V
OTE
32
AN
NEX
URES
TO
TH
E A
NN
UAL
FIN
AN
CIA
L ST
ATEM
ENTS
for t
he y
ea
r end
ed
31
Ma
rch
2016
AN
NEX
URE
1A
STAT
EMEN
T O
F TR
AN
SFER
S TO
DEP
ART
MEN
TAL
AGEN
CIE
S A
ND
AC
CO
UNTS
DEP
ART
MEN
T/AG
ENC
Y/AC
CO
UNT
TRA
NSF
ER A
LLO
CAT
ION
TRA
NSF
ER20
14/1
5
Ad
just
ed
ap
pro
pria
tion
Roll
Ove
rsA
dju
stm
ent
s
Tota
l
Ava
ilab
le
Ac
tua
l
Tra
nsfe
r
% o
f
Ava
ilab
le
fund
s
tra
nsfe
rre
d
Ap
pro
pria
tion
Ac
t
R'00
0R'
000
R'00
0R'
000
R'00
0%
R'00
0
Univ
ers
al S
erv
ice
and
Ac
ce
ss A
ge
ncy
of S
out
h Af
rica
: Op
era
tions
66
429
--
66 4
2966
429
100
65 3
76
Univ
ers
al S
erv
ice
and
Ac
ce
ss F
und
: Op
era
tions
52
380
--
52 3
8052
380
100
49 9
88
Univ
ers
al S
erv
ice
and
Ac
ce
ss A
ge
ncy
of S
out
h Af
rica
: Bro
ad
ca
stin
g d
igita
l
mig
ratio
n -
Set T
op
Bo
x Su
bsid
ies,
ant
enn
ae
and
inst
alla
tion
co
sts
196
000
196
000
196
000
100
-
Univ
ers
al S
erv
ice
and
Ac
ce
ss F
und
: Bro
ad
ca
stin
g d
igita
l mig
ratio
n -
Set T
op
Box
Sub
sidie
s, a
nte
nna
e a
nd in
sta
llatio
n c
ost
s 18
1 16
0-
-18
1 16
018
1 16
010
079
1 00
0
Ind
ep
end
ent
Co
mm
unic
atio
ns A
utho
rity
of S
out
h Af
rica
: Op
era
tions
-
--
--
-37
6 22
1
Na
tiona
l Ele
ctro
nic
Me
dia
Inst
itute
of S
A: O
pe
ratio
ns
36 6
01-
-36
601
36 6
0110
037
859
ISET
T SE
TA (S
kills
de
velo
pm
ent
levy
) -
--
--
-1
199
SABC
- T
V Lic
ens
es
--
--
4-
-
Tota
l53
2 57
0-
-53
2 57
053
2 57
41
321
643
page 214
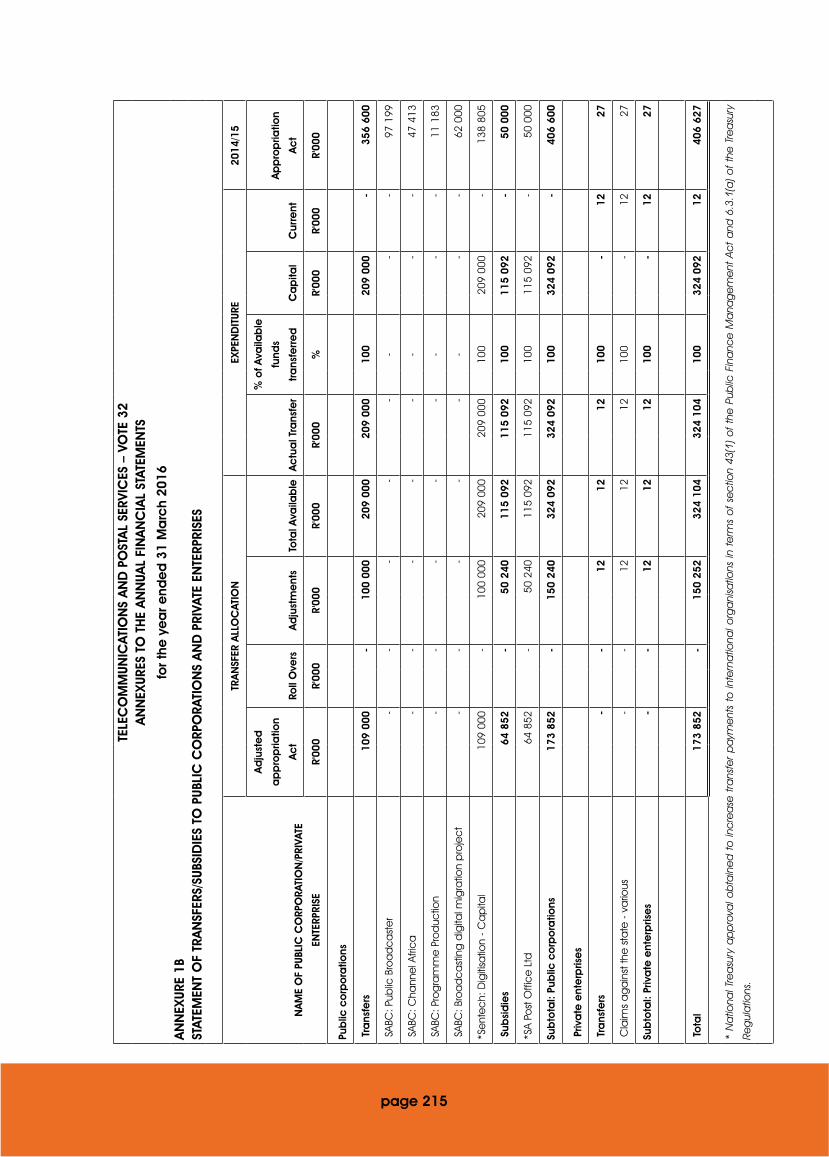
TELE
CO
MM
UNIC
ATIO
NS
AN
D P
OST
AL
SERV
ICES
– V
OTE
32
AN
NEX
URES
TO
TH
E A
NN
UAL
FIN
AN
CIA
L ST
ATEM
ENTS
for t
he y
ea
r end
ed
31
Ma
rch
2016
AN
NEX
URE
1BST
ATEM
ENT
OF
TRA
NSF
ERS/
SUBS
IDIE
S TO
PUB
LIC
CO
RPO
RATI
ON
S A
ND
PRI
VATE
EN
TERP
RISE
S
NA
ME
OF
PUBL
IC C
ORP
ORA
TIO
N/P
RIVA
TE
ENTE
RPRI
SE
TRA
NSF
ER A
LLO
CAT
ION
EXPE
ND
ITUR
E20
14/1
5
Ad
just
ed
ap
pro
pria
tion
Ac
tRo
ll O
vers
Ad
just
me
nts
Tota
l Ava
ilab
leA
ctu
al T
rans
fer
% o
f Ava
ilab
le
fund
s
tra
nsfe
rre
dC
ap
ital
Cur
rent
Ap
pro
pria
tion
Ac
t
R'00
0R'
000
R'00
0R'
000
R'00
0%
R'00
0R'
000
R'00
0
Pub
lic c
orp
ora
tions
Tra
nsfe
rs
109
000
-10
0 00
020
9 00
020
9 00
010
020
9 00
0-
356
600
SAB
C: P
ublic
Bro
ad
ca
ste
r -
--
--
--
-97
199
SAB
C: C
hann
el A
fric
a
--
--
--
--
47 4
13
SAB
C: P
rog
ram
me
Pro
duc
tion
--
--
--
--
11 1
83
SAB
C: B
roa
dc
ast
ing
dig
ital m
igra
tion
pro
jec
t -
--
--
--
-62
000
*Se
nte
ch:
Dig
itisa
tion
- C
ap
ital
109
000
-10
0 00
020
9 00
020
9 00
010
020
9 00
0-
138
805
Sub
sid
ies
64 8
52-
50 2
4011
5 09
211
5 09
210
011
5 09
2-
50 0
00
*SA
Post
Offi
ce
Ltd
64
852
-50
240
115
092
115
092
100
115
092
-50
000
Sub
tota
l: Pu
blic
co
rpo
ratio
ns
173
852
-15
0 24
032
4 09
232
4 09
210
032
4 09
2-
406
600
Priv
ate
ent
erp
rise
s
Tra
nsfe
rs
--
1212
1210
0-
1227
Cla
ims
ag
ain
st th
e s
tate
- v
ario
us
--
1212
1210
0-
1227
Sub
tota
l: Pr
iva
te e
nte
rpris
es
--
1212
1210
0-
1227
To
tal
173
852
-15
0 25
232
4 10
432
4 10
410
032
4 09
212
406
627
* N
atio
nal T
rea
sury
ap
pro
val o
bta
ine
d t
o in
cre
ase
tra
nsfe
r p
aym
ent
s to
inte
rna
tiona
l org
ani
satio
ns in
te
rms
of
sec
tion
43(1
) o
f th
e P
ublic
Fin
anc
e M
ana
ge
me
nt A
ct
and
6.3
.1(a
) o
f th
e T
rea
sury
Reg
ula
tions
.
page 215

TELE
CO
MM
UNIC
ATIO
NS
AN
D P
OST
AL
SERV
ICES
– V
OTE
32
AN
NEX
URES
TO
TH
E A
NN
UAL
FIN
AN
CIA
L ST
ATEM
ENTS
for t
he y
ea
r end
ed
31
Ma
rch
2016
AN
NEX
URE
1C
STAT
EMEN
T O
F TR
AN
SFER
S TO
FO
REIG
N G
OVE
RNM
ENT
AN
D IN
TERN
ATIO
NA
L O
RGA
NIS
ATIO
NS
FORE
IGN
GO
VERN
MEN
T/IN
TERN
ATIO
NA
L O
RGA
NIS
ATIO
N
TRA
NSF
ER A
LLO
CAT
ION
EXPE
ND
ITUR
E20
14/1
5
Ad
just
ed
ap
pro
pria
tion
Ac
tRo
ll O
vers
Ad
just
me
nts
Tota
l Ava
ilab
leA
ctu
al T
rans
fer
% o
f Ava
ilab
le
fund
s
tra
nsfe
rre
d
Ap
pro
pria
tion
Ac
t
R'00
0R'
000
R'00
0R'
000
R'00
0%
R'00
0
Tra
nsfe
rs
Afri
ca
n Te
lec
om
mun
ica
tion
Unio
n (A
TU)
986
--
986
940
9592
7
*Uni
vers
al P
ost
al U
nio
n (U
PU)
4 72
3-
723
5 44
65
445
100
5 31
4
*Pa
n Af
rica
n Po
sta
l Uni
on
(PAP
U)
908
-16
310
711
071
100
861
*Int
ern
atio
nal T
ele
co
mm
unic
atio
ns U
nio
n (IT
U)
14 7
64-
2 24
717
011
16 5
4597
16 2
04
*Co
mm
onw
ea
lth T
ele
co
mm
unic
atio
n O
rga
niza
tion
(CTO
) 37
6-
6744
344
210
041
8
Org
ani
satio
n fo
r Ec
ono
mic
and
Cul
tura
l De
velo
pm
ent
43
7-
-43
718
643
-
Tota
l22
194
-3
200
25 3
9424
629
23 7
24
* N
atio
nal T
rea
sury
ap
pro
val o
bta
ine
d t
o in
cre
ase
tra
nsfe
r p
aym
ent
s to
inte
rna
tiona
l org
ani
satio
ns in
te
rms
of
sec
tion
43(1
) o
f th
e P
ublic
Fin
anc
e M
ana
ge
me
nt A
ct
and
6.3
.1(a
) o
f th
e T
rea
sury
Reg
ula
tions
.
page 216

TELE
CO
MM
UNIC
ATIO
NS
AN
D P
OST
AL
SERV
ICES
– V
OTE
32
AN
NEX
URES
TO
TH
E A
NN
UAL
FIN
AN
CIA
L ST
ATEM
ENTS
for t
he y
ea
r end
ed
31
Ma
rch
2016
AN
NEX
URE
1D
STAT
EMEN
T O
F TR
AN
SFER
S TO
NO
N-P
ROFI
T IN
STIT
UTIO
NS
NO
N-P
ROFI
T IN
STIT
UTIO
NS
TRA
NSF
ER A
LLO
CAT
ION
EXPE
ND
ITUR
E20
14/1
5
Ad
just
ed
ap
pro
pria
tion
Ac
tRo
ll O
vers
Ad
just
me
nts
Tota
l Ava
ilab
leA
ctu
al T
rans
fer
% o
f Ava
ilab
le
fund
s
tra
nsfe
rre
dA
pp
rop
riatio
n A
ct
R'00
0R'
000
R'00
0R'
000
R'00
0%
R'00
0
Tra
nsfe
rs
Do
natio
n o
f co
mp
ute
rs b
y M
inist
er a
t Ha
rare
lib
rary
--
--
-99
Co
rpo
rate
gift
s fo
r min
istry
at t
he G
SMA
Barc
elo
na
co
nfe
renc
e-
--
--
11
Tota
l-
--
--
110
page 217
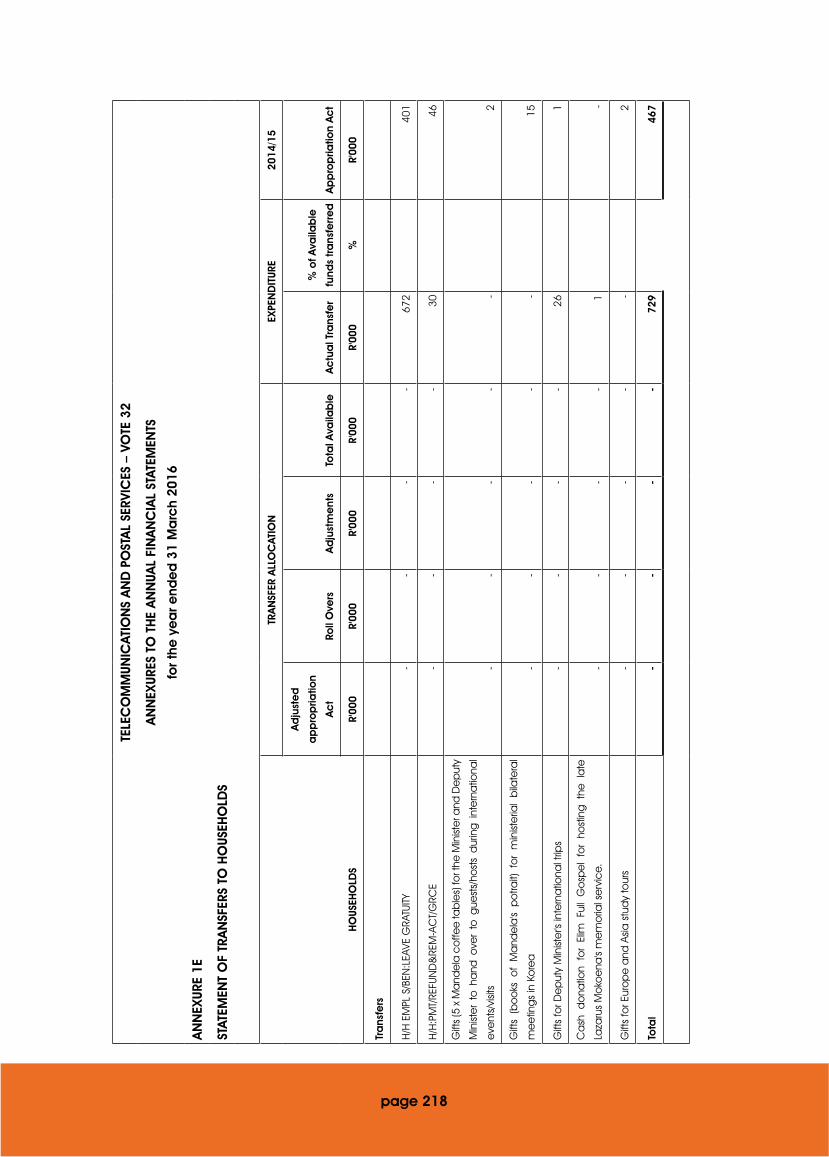
TELE
CO
MM
UNIC
ATIO
NS
AN
D P
OST
AL
SERV
ICES
– V
OTE
32
AN
NEX
URES
TO
TH
E A
NN
UAL
FIN
AN
CIA
L ST
ATEM
ENTS
for t
he y
ea
r end
ed
31
Ma
rch
2016
AN
NEX
URE
1E
STAT
EMEN
T O
F TR
AN
SFER
S TO
HO
USEH
OLD
S
HO
USEH
OLD
S
TRA
NSF
ER A
LLO
CAT
ION
EXPE
ND
ITUR
E20
14/1
5
Ad
just
ed
ap
pro
pria
tion
Ac
tRo
ll O
vers
Ad
just
me
nts
Tota
l Ava
ilab
leA
ctu
al T
rans
fer
% o
f Ava
ilab
le
fund
s tr
ans
ferr
ed
Ap
pro
pria
tion
Ac
t
R'00
0R'
000
R'00
0R'
000
R'00
0%
R'00
0
Tra
nsfe
rs
H/H
EM
PL S
/BEN
:LEA
VE G
RATU
ITY
--
--
672
401
H/H
:PM
T/RE
FUN
D&
REM
-AC
T/G
RCE
--
--
3046
Gift
s (5
x M
and
ela
co
ffee
tab
les)
for t
he M
inist
er a
nd D
ep
uty
Min
iste
r to
ha
nd o
ver
to g
uest
s/ho
sts
dur
ing
int
ern
atio
nal
eve
nts/
visit
s-
--
--
2
Gift
s (b
oo
ks o
f M
and
ela
's p
otra
it) f
or
min
iste
rial
bila
tera
l
me
etin
gs
in K
ore
a-
--
--
15
Gift
s fo
r De
put
y M
inist
er's
inte
rna
tiona
l trip
s-
--
-26
1
Ca
sh d
ona
tion
for
Elim
Ful
l G
osp
el
for
host
ing
the
la
te
Laza
rus
Mo
koe
na's
me
mo
rial s
erv
ice.
--
--
1-
Gift
s fo
r Eur
op
e a
nd A
sia s
tud
y to
urs
--
--
-2
Tota
l-
--
-72
946
7
page 218

TELE
CO
MM
UNIC
ATIO
NS
AN
D P
OST
AL
SERV
ICES
– V
OTE
32
AN
NEX
URES
TO
TH
E A
NN
UAL
FIN
AN
CIA
L ST
ATEM
ENTS
for t
he y
ea
r end
ed
31
Ma
rch
2016
AN
NEX
URE
1F
STAT
EMEN
T O
F G
IFTS
, DO
NAT
ION
S A
ND
SPO
NSO
RSH
IPS
REC
EIVE
D
NA
ME
OF
ORG
AN
ISAT
ION
NAT
URE
OF
GIF
T, D
ON
ATIO
N O
R SP
ON
SORS
HIP
2015
/16
2014
/15
R'00
0R'
000
Rec
eiv
ed
in c
ash
No
ne
--
Sub
tota
l-
-
Rec
eiv
ed
in k
ind
2014
/15
Fina
ncia
l ye
ar
Spa
ce
co
mSp
ons
ors
hip
in
the
fo
rm o
f ho
stin
g t
he S
ADC
- I
TSO
Sa
telit
e T
rain
ing
Wo
rksh
op
clo
sing
din
ner
on
21 F
eb
201
5.
-17
GSM
ASp
ons
ors
hip
in th
e fo
rm o
f ho
stin
g th
e o
pe
ning
din
ner o
f the
SAD
C W
RC-1
5 Pr
ep
ara
tory
Me
etin
g o
n
23 F
eb
201
5. T
he s
po
nor s
ettl
ed
and
pa
id th
e G
ard
en
Co
urt h
ote
l dire
ctly
. Am
oun
t no
t kno
wn.
--
Inm
ars
at
Spo
nso
rshi
p i
n th
e f
orm
of
host
ing
the
Co
ckt
ail
of
the
SAD
C W
RC-1
5 Pr
ep
ara
tory
Me
etin
g o
n
24 F
eb
201
5-
8
MTN
Spo
nso
rshi
p in
the
form
of h
ost
ing
the
clo
sing
din
ner o
f the
SAD
C W
RC -
15
Pre
pa
rato
ry m
ee
ting
on
26 F
eb
201
5 . T
he S
po
nor s
ettl
ed
and
pa
id th
e re
sta
ura
nt d
irec
tly. A
mo
unt n
ot k
now
n.-
-
Telko
m S
A SO
C L
tdSp
ons
ors
hip
in th
e fo
rm o
f me
mo
ry s
ticks
and
no
teb
oo
ks fo
r the
SAD
C W
RC-1
5 Pr
ep
ara
tory
me
etin
g
held
23-
26 F
eb
201
5. A
mo
unt n
ot k
now
n.
--
page 219

page 220
TELE
CO
MM
UNIC
ATIO
NS
AN
D P
OST
AL
SERV
ICES
– V
OTE
32
AN
NEX
URES
TO
TH
E A
NN
UAL
FIN
AN
CIA
L ST
ATEM
ENTS
for t
he y
ea
r end
ed
31
Ma
rch
2016
AN
NEX
URE
1F
STAT
EMEN
T O
F G
IFTS
, DO
NAT
ION
S A
ND
SPO
NSO
RSH
IPS
REC
EIVE
D
NA
ME
OF
ORG
AN
ISAT
ION
NAT
URE
OF
GIF
T, D
ON
ATIO
N O
R SP
ON
SORS
HIP
2015
/16
2014
/15
R'00
0R'
000
2015
/16
Fina
ncia
l ye
ar
Bro
ad
ba
nd In
frac
oH
ost
ing
of t
he 1
6th
ord
ina
ry s
ess
ion
of t
he A
TU a
dm
inist
rativ
e c
oun
cil
me
etin
g -
sp
ons
or 1
20 b
ag
s.-
-
MTN
Ho
stin
g o
f the
16t
h o
rdin
ary
se
ssio
n o
f the
ATU
ad
min
istra
tive
co
unc
il m
ee
ting
- sp
ons
or t
he w
elc
om
e
netw
ork
ing
din
ner o
n 17
Jun
e 2
015.
80-
Sent
ec
hH
ost
ing
of t
he 1
6th
ord
ina
ry s
ess
ion
of t
he A
TU a
dm
inist
rativ
e c
oun
cil
me
etin
g -
sp
ons
or 1
20 c
ups.
--
SITA
Ho
stin
g o
f the
16t
h o
rdin
ary
se
ssio
n o
f the
ATU
ad
min
istra
tive
co
unc
il m
ee
ting
- sp
ons
or
a h
ea
vy d
uty
co
pie
r lo
ane
d fr
om
SITA
, Dur
ba
n fo
r the
dur
atio
n o
f the
me
etin
g.
--
Telko
m S
A SO
C L
tdH
ost
ing
of t
he 1
6th
ord
ina
ry s
ess
ion
of t
he A
TU a
dm
inist
rativ
e c
oun
cil
me
etin
g -
spo
nso
r 100
me
mo
ry
stic
ks.
--
USAA
SAH
ost
ing
of
the
16t
h o
rdin
ary
se
ssio
n o
f th
e A
TU a
dm
inist
rativ
e c
oun
cil
me
etin
g -
sp
ons
or
Wi-F
i
inst
alla
tion
at t
he c
onf
ere
nce
ve
nue.
25-
ICA
SAUP
U C
oun
cil
Me
etin
g, 0
8 -
26 F
eb
rua
ry 2
016,
Be
rn, S
witz
erla
nd -
SA
Rec
ep
tion.
30
4-
Org
ani
zers
of t
he 3
rd A
fric
a S
cho
ol o
n In
tern
et G
ove
rna
nce
held
in E
thio
pia
, 02
- 05
Se
pte
mb
er 2
015
Mr.
Lese
tja M
otla
la w
as
spo
nso
red
for E
co
nom
y Fl
ight
Tic
ket (
R26
000)
& D
aily
Allo
wa
nce
(R1
919)
at
this
Me
etin
g.
28-
Org
ani
zers
of t
he C
our
se o
n C
ybe
r Sa
fety
and
Info
rma
tion
Sec
urity
in M
ala
ysia
, 27
- 30
Oc
tob
er 2
015
Ms.
No
ma
-efe
se M
ntus
ant
o w
as
spo
nso
red
for T
rain
ing
Pa
cka
ge
and
Mo
dul
e F
ee
& A
cc
om
mo
da
tion
& T
rans
po
rtatio
n (A
irpo
rt-H
ote
l-Airp
ort)
to
the
am
oun
t o
f 23
00 M
ala
ysia
n Ri
ngit
(R7
213.
90)
for
this
Me
etin
g.
7-
Sub
tota
l44
425
Tota
l44
425
(Co
ntin
ued
)

TELE
CO
MM
UNIC
ATIO
NS
AN
D P
OST
AL
SERV
ICES
– V
OTE
32
AN
NEX
URES
TO
TH
E A
NN
UAL
FIN
AN
CIA
L ST
ATEM
ENTS
for t
he y
ea
r end
ed
31
Ma
rch
2016
AN
NEX
URE
1G
STAT
EMEN
T O
F G
IFTS
, DO
NAT
ION
S A
ND
SPO
NSO
RSH
IPS
MA
DE
NAT
URE
OF
GIF
T, D
ON
ATIO
N O
R SP
ON
SORS
HIP
2015
/16
2014
/15
R'00
0R'
000
Ma
de
in k
ind
Dur
ing
the
201
4/15
fina
ncia
l ye
ar:
No
ne-
-
Dur
ing
the
201
5/16
fina
ncia
l ye
ar:
No
ne-
-
page 221

TELE
CO
MM
UNIC
ATIO
NS
AN
D P
OST
AL
SERV
ICES
– V
OTE
32
AN
NEX
URES
TO
TH
E A
NN
UAL
FIN
AN
CIA
L ST
ATEM
ENTS
for t
he y
ea
r end
ed
31
Ma
rch
2016
AN
NEX
URE
2A
STAT
EMEN
T O
F IN
VEST
MEN
TS IN
AN
D A
MO
UNTS
OW
ING
BY/
TO N
ATIO
NA
L/PR
OVI
NC
IAL
PUBL
IC E
NTI
TES
NA
ME
OF
PUBL
IC E
NTI
TY
Sta
te E
ntity
’s
PFM
A
Sche
dul
e
typ
e (s
tate
yea
rend
if no
t 31
Ma
rch)
% of
Sha
re H
old
Num
be
r of s
hare
s he
ld
Co
st o
f inv
est
me
nt
R‘00
0
Ne
t A
sse
t Va
lue
of i
nve
stm
ent
R'00
0
Pro
fit/(L
oss
) fo
r the
ye
ar
R'00
0
Loss
es
gua
ran-
tee
d
2015
/16
2014
/15
2015
/16
2014
/15
2015
/16
2014
/15
2015
/16
2014
/15
2015
/16
2014
/15
Yes/
No
Na
tiona
l/Pro
vinc
ial P
ublic
Ent
ity
Univ
ers
al S
erv
ice
and
Ac
ce
ss A
ge
ncy
of S
out
h Af
rica
3A10
0%10
0%-
--
--
-19
0 75
01
090
No
Univ
ers
al S
erv
ice
and
Ac
ce
ss F
und
3A10
0%10
0%-
--
--
-27
3 62
881
8 97
9N
o
¹Te
lkom
SA
Limite
d2
39.8
0%39
.80%
207
038
058
207
038
058
2 07
0 38
02
070
380
No
t
ava
ilab
le10
207
514
No
t
ava
ilab
le3
256
000
No
²So
uth
Afric
an
Post
Offi
ce
Ltd
210
0%10
0%69
3 11
5 87
920
0 93
9 82
169
3 11
620
0 94
069
3 11
620
0 94
0(1
165
000
)(1
520
253
)N
o
Na
tiona
l Ele
ctro
nic
Me
dia
Inst
itute
of
Sout
h Af
rica
3A10
0%10
0%-
--
--
-46
83
023
No
³Se
nte
ch
(Pty
) Ltd
3B10
0%10
0%99
899
81
11
115
4 10
417
4 56
4N
o
⁴Vo
da
co
m G
roup
Lim
ited
20.
03%
13.9
0%63
658
207
038
059
3 74
312
173
839
--
No
t
ava
ilab
le12
510
000
No
TOTA
L90
0 21
8 59
361
5 01
6 93
62
767
240
14 4
45 1
6069
3 11
710
408
455
(546
050
)15
243
403
page 222
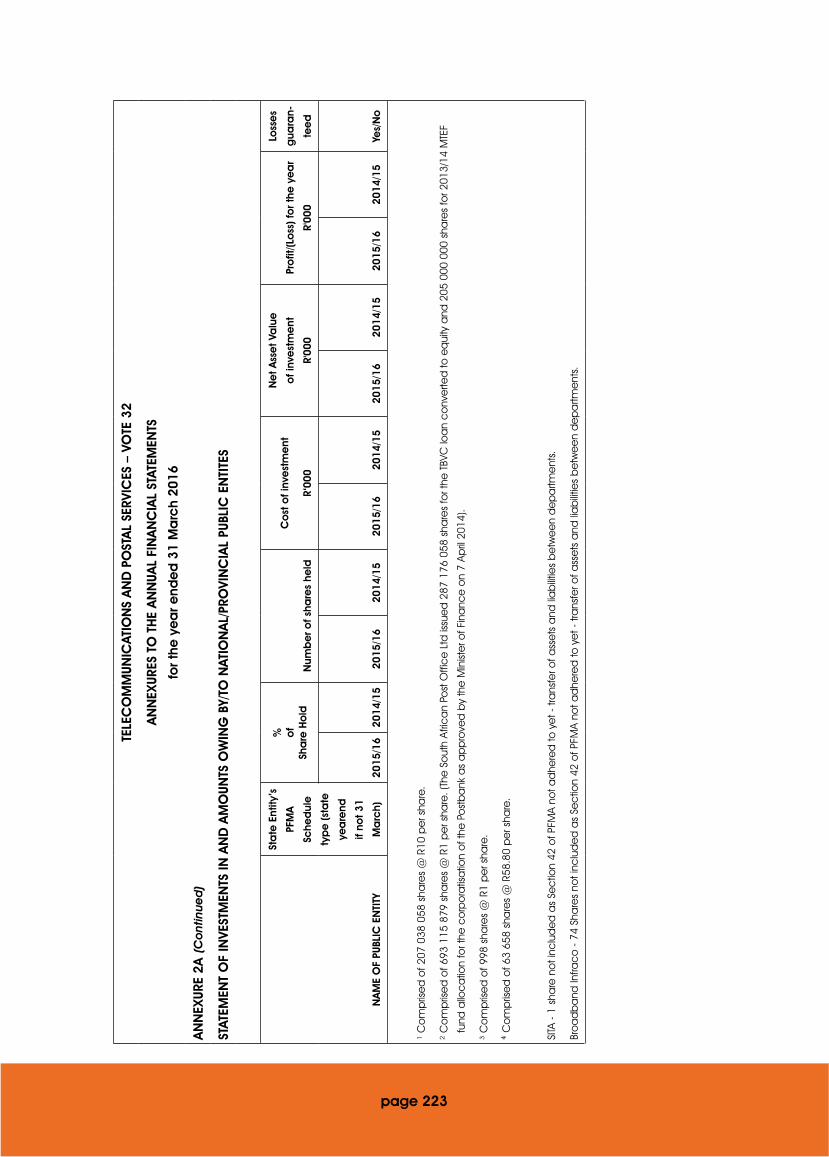
TELE
CO
MM
UNIC
ATIO
NS
AN
D P
OST
AL
SERV
ICES
– V
OTE
32
AN
NEX
URES
TO
TH
E A
NN
UAL
FIN
AN
CIA
L ST
ATEM
ENTS
for t
he y
ea
r end
ed
31
Ma
rch
2016
AN
NEX
URE
2A
STAT
EMEN
T O
F IN
VEST
MEN
TS IN
AN
D A
MO
UNTS
OW
ING
BY/
TO N
ATIO
NA
L/PR
OVI
NC
IAL
PUBL
IC E
NTI
TES
NA
ME
OF
PUBL
IC E
NTI
TY
Sta
te E
ntity
’s
PFM
A
Sche
dul
e
typ
e (s
tate
yea
rend
if no
t 31
Ma
rch)
% of
Sha
re H
old
Num
be
r of s
hare
s he
ld
Co
st o
f inv
est
me
nt
R‘00
0
Ne
t A
sse
t Va
lue
of i
nve
stm
ent
R'00
0
Pro
fit/(L
oss
) fo
r the
ye
ar
R'00
0
Loss
es
gua
ran-
tee
d
2015
/16
2014
/15
2015
/16
2014
/15
2015
/16
2014
/15
2015
/16
2014
/15
2015
/16
2014
/15
Yes/
No
¹ C
om
pris
ed
of 2
07 0
38 0
58 s
hare
s @
R10
pe
r sha
re.
² C
om
pris
ed
of 6
93 1
15 8
79 s
hare
s @
R1
pe
r sha
re. (
The
So
uth
Afric
an
Post
Offi
ce
Ltd
issu
ed
287
176
058
sha
res
for t
he T
BVC
loa
n c
onv
erte
d to
eq
uity
and
205
000
000
sha
res
for 2
013/
14 M
TEF
fund
allo
ca
tion
for t
he c
orp
ora
tisa
tion
of t
he P
ost
ba
nk a
s a
pp
rove
d b
y th
e M
inist
er o
f Fin
anc
e o
n 7
April
201
4).
³ C
om
pris
ed
of 9
98 s
hare
s @
R1
pe
r sha
re.
⁴ C
om
pris
ed
of 6
3 65
8 sh
are
s @
R58
.80
pe
r sha
re.
SITA
- 1
sha
re n
ot i
nclu
de
d a
s Se
ctio
n 42
of P
FMA
not a
dhe
red
to y
et -
tra
nsfe
r of a
sse
ts a
nd li
ab
ilitie
s b
etw
ee
n d
ep
artm
ent
s.
Bro
ad
ba
nd In
frac
o -
74
Sha
res
not i
nclu
de
d a
s Se
ctio
n 42
of P
FMA
not a
dhe
red
to y
et -
tra
nsfe
r of a
sse
ts a
nd li
ab
ilitie
s b
etw
ee
n d
ep
artm
ent
s.
page 223
(Co
ntin
ued
)
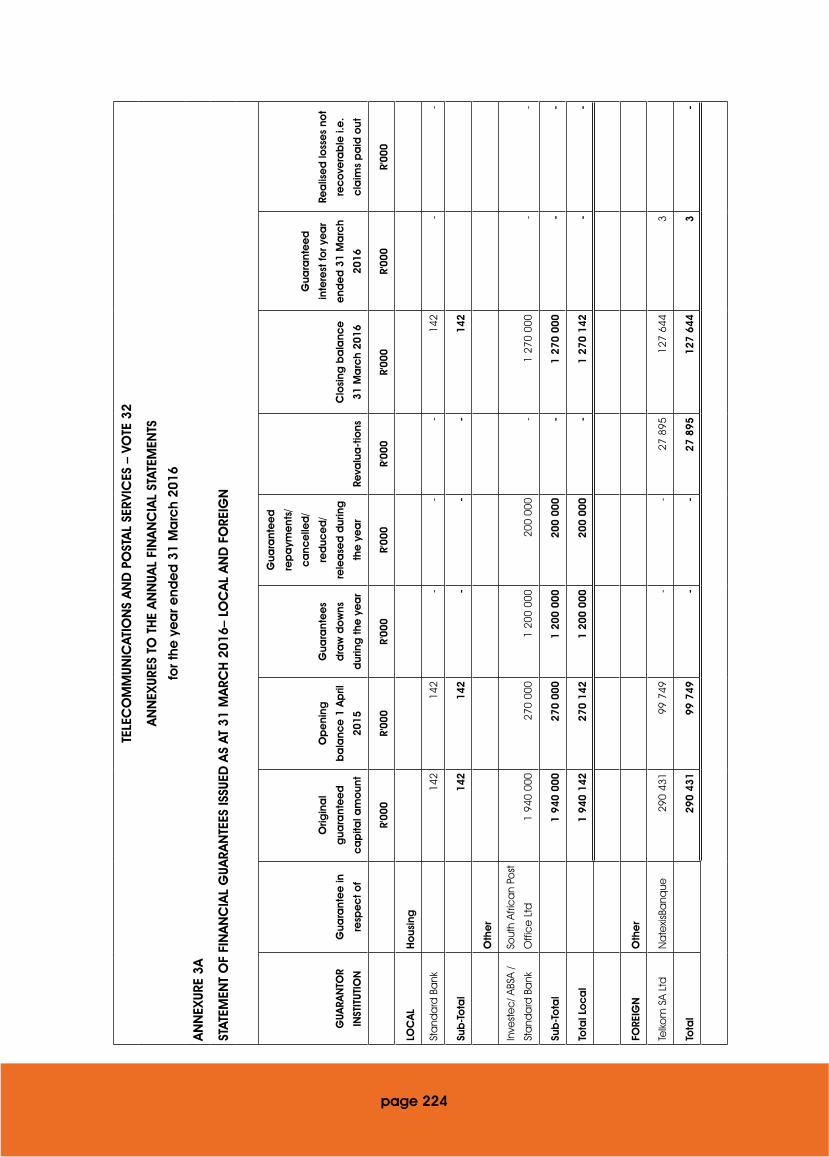
TELE
CO
MM
UNIC
ATIO
NS
AN
D P
OST
AL
SERV
ICES
– V
OTE
32
AN
NEX
URES
TO
TH
E A
NN
UAL
FIN
AN
CIA
L ST
ATEM
ENTS
for t
he y
ea
r end
ed
31
Ma
rch
2016
AN
NEX
URE
3A
STAT
EMEN
T O
F FI
NA
NC
IAL
GUA
RAN
TEES
ISSU
ED A
S AT
31
MA
RCH
201
6– L
OC
AL
AN
D F
ORE
IGN
GUA
RAN
TOR
INST
ITUT
ION
Gua
rant
ee
in
resp
ec
t o
f
Orig
ina
l
gua
rant
ee
d
ca
pita
l am
oun
t
Op
eni
ng
ba
lanc
e 1
Ap
ril
2015
Gua
rant
ee
s
dra
w d
ow
ns
dur
ing
the
ye
ar
Gua
rant
ee
d
rep
aym
ent
s/
ca
nce
lled
/
red
uce
d/
rele
ase
d d
urin
g
the
ye
ar
Reva
lua
-tio
ns
Clo
sing
ba
lanc
e
31 M
arc
h 20
16
Gua
rant
ee
d
inte
rest
for y
ea
r
end
ed
31
Ma
rch
2016
Rea
lise
d lo
sse
s no
t
rec
ove
rab
le i.
e.
cla
ims
pa
id o
ut
R'00
0R'
000
R'00
0R'
000
R'00
0R'
000
R'00
0R'
000
LOC
AL
Ho
usin
g
Sta
nda
rd B
ank
14
214
2-
--
142
--
Sub
-To
tal
142
142
--
-14
2
Oth
er
Inve
ste
c/ A
BSA
/
Sta
nda
rd B
ank
Sout
h Af
rica
n Po
st
Offi
ce
Ltd
1 94
0 00
027
0 00
01
200
000
200
000
-1
270
000
--
Sub
-To
tal
1 94
0 00
027
0 00
01
200
000
200
000
-1
270
000
--
Tota
l Lo
ca
l1
940
142
270
142
1 20
0 00
020
0 00
0-
1 27
0 14
2-
-
FORE
IGN
Oth
er
Telko
m S
A Lt
dN
ate
xisBa
nque
290
431
99 7
49-
-27
895
127
644
3
Tota
l29
0 43
199
749
--
27 8
9512
7 64
43
-
page 224

TELE
CO
MM
UNIC
ATIO
NS
AN
D P
OST
AL
SERV
ICES
– V
OTE
32
AN
NEX
URES
TO
TH
E A
NN
UAL
FIN
AN
CIA
L ST
ATEM
ENTS
for t
he y
ea
r end
ed
31
Ma
rch
2016
AN
NEX
URE
3B
STAT
EMEN
T O
F C
ON
TIN
GEN
T LI
ABI
LITI
ES A
S AT
31
MA
RCH
201
6
Na
ture
of l
iab
ility
Op
eni
ng b
ala
nce
1 A
pril
201
5
Lia
bili
ties
inc
urre
d
dur
ing
the
ye
ar
Lia
bili
ties
pa
id/
ca
nce
lled
/ re
duc
ed
dur
ing
the
ye
ar
Lia
bili
ties
rec
ove
rab
le (P
rovi
de
de
tails
he
reun
de
r)
Clo
sing
ba
lanc
e
31 M
arc
h 20
16
R'00
0R'
000
R'00
0R'
000
Cla
ims
ag
ain
st t
he d
ep
art
me
nt
Poss
ible
leg
al c
laim
26-
--
26
Poss
ible
leg
al c
laim
600
--
-60
0
Poss
ible
leg
al c
laim
31 4
212
817
--
34 2
38
Poss
ible
leg
al c
laim
877
44-
50
Poss
ible
leg
al c
laim
4 43
242
8-
-4
860
Poss
ible
leg
al c
laim
280
--
-28
0
Poss
ible
leg
al c
laim
8 28
31
006
--
9 28
9
Poss
ible
leg
al c
laim
2 60
8-
2 60
8-
-
Poss
ible
leg
al c
laim
24-
24-
-
Poss
ible
leg
al c
laim
20-
--
20
Poss
ible
leg
al c
laim
20-
--
20
Poss
ible
leg
al c
laim
9 63
920
361
--
30 0
00
Poss
ible
leg
al c
laim
20-
--
20
page 225
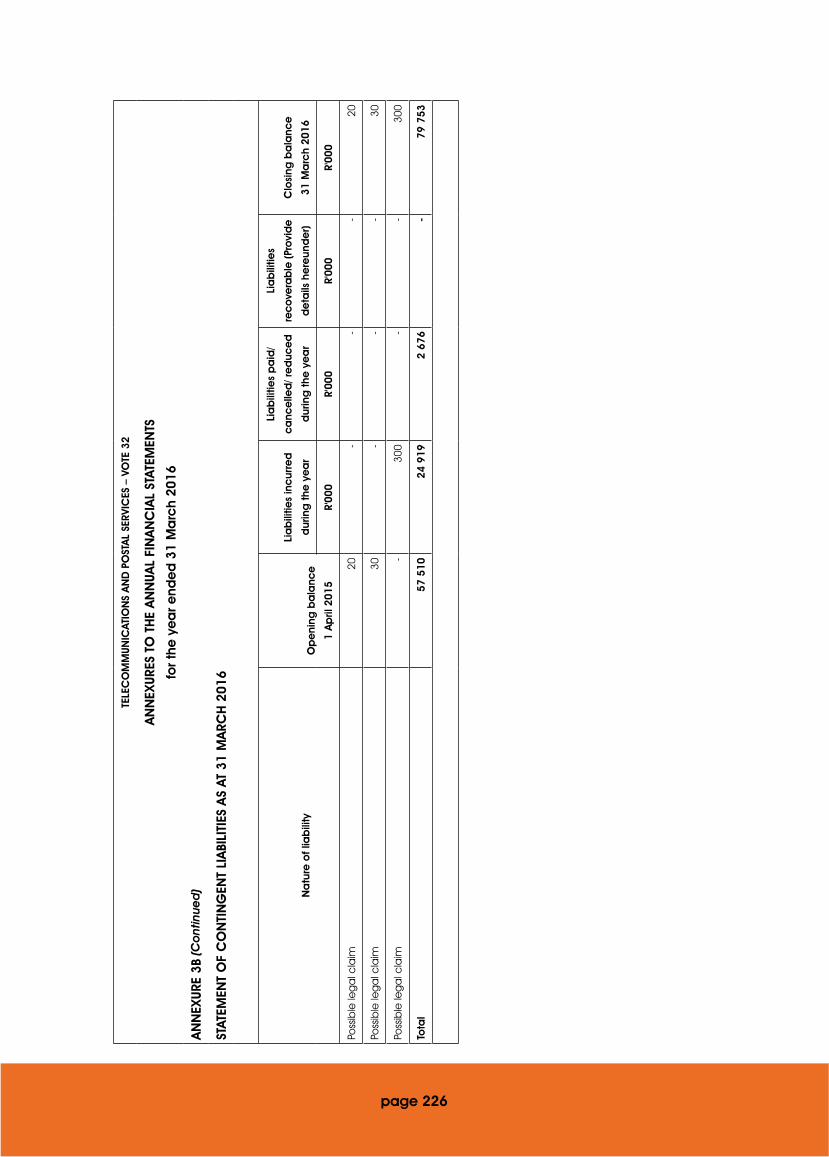
TELE
CO
MM
UNIC
ATIO
NS
AN
D P
OST
AL
SERV
ICES
– V
OTE
32
AN
NEX
URES
TO
TH
E A
NN
UAL
FIN
AN
CIA
L ST
ATEM
ENTS
for t
he y
ea
r end
ed
31
Ma
rch
2016
AN
NEX
URE
3B
STAT
EMEN
T O
F C
ON
TIN
GEN
T LI
ABI
LITI
ES A
S AT
31
MA
RCH
201
6
Na
ture
of l
iab
ility
Op
eni
ng b
ala
nce
1 A
pril
201
5
Lia
bili
ties
inc
urre
d
dur
ing
the
ye
ar
Lia
bili
ties
pa
id/
ca
nce
lled
/ re
duc
ed
dur
ing
the
ye
ar
Lia
bili
ties
rec
ove
rab
le (P
rovi
de
de
tails
he
reun
de
r)
Clo
sing
ba
lanc
e
31 M
arc
h 20
16
R'00
0R'
000
R'00
0R'
000
Poss
ible
leg
al c
laim
20-
--
20
Poss
ible
leg
al c
laim
30-
--
30
Poss
ible
leg
al c
laim
-30
0-
-30
0
Tota
l57
510
24 9
192
676
-79
753
page 226
(Co
ntin
ued
)

TELE
CO
MM
UNIC
ATIO
NS
AN
D P
OST
AL
SERV
ICES
– V
OTE
32
AN
NEX
URES
TO
TH
E A
NN
UAL
FIN
AN
CIA
L ST
ATEM
ENTS
for t
he y
ea
r end
ed
31
Ma
rch
2016
AN
NEX
URE
4
CLA
IMS
REC
OVE
RABL
E
C
onf
irme
d b
ala
nce
out
sta
ndin
gUn
co
nfirm
ed
ba
lanc
e o
utst
and
ing
Tota
lC
ash
in t
rans
it a
t ye
ar e
nd
2015
/16*
GO
VERN
MEN
T EN
TITY
31
/03/
2016
31/0
3/20
1531
/03/
2016
31/0
3/20
1531
/03/
2016
31/0
3/20
15
Rec
eip
t d
ate
up
to
six
(6)
wo
rkin
g d
ays
a
fte
r ye
ar e
ndA
mo
unt
R'
000
R'00
0R'
000
R'00
0R'
000
R'00
0R'
000
DEP
ART
MEN
TS
Pub
lic S
erv
ice
and
Ad
min
istra
tion
--
-2
-2
--
Co
op
era
tive
Go
vern
anc
e a
nd T
rad
itio
nal A
ffairs
--
-13
8-
138
--
Eco
nom
ic D
eve
lop
me
nt-
--
14-
14-
-
He
alth
--
58-
58-
--
Tota
l-
-58
154
5815
4-
page 227

TELE
CO
MM
UNIC
ATIO
NS
AN
D P
OST
AL
SERV
ICES
– V
OTE
32
AN
NEX
URES
TO
TH
E A
NN
UAL
FIN
AN
CIA
L ST
ATEM
ENTS
for t
he y
ea
r end
ed
31
Ma
rch
2016
AN
NEX
URE
5
INVE
NTO
RY
2015
/16
2014
/15
No
teQ
uant
ityR'
000
Qua
ntity
R'00
0
Inve
nto
ry
Op
eni
ng b
ala
nce
12 2
331
177
5 57
263
1
Add
/(Le
ss):
Ad
just
me
nts
to p
rior y
ea
r ba
lanc
es
--
--
Add
: Ad
diti
ons
/Pur
cha
ses
- C
ash
4 80
042
134
913
4 26
5
Add
: Ad
diti
ons
- N
on-
ca
sh-
--
-
(Le
ss):
Disp
osa
ls-
-(6
13)
(238
)
(Le
ss):
Issue
s(2
437
)(5
71)
(27
639)
(3 4
81)
Add
/(Le
ss):
Adju
stm
ent
s(1
4 35
8)(1
013
)-
-
Clo
sing
ba
lanc
e23
814
12 2
331
177
page 228

TELE
CO
MM
UNIC
ATIO
NS
AN
D P
OST
AL
SERV
ICES
– V
OTE
32
AN
NEX
URES
TO
TH
E A
NN
UAL
FIN
AN
CIA
L ST
ATEM
ENTS
for t
he y
ea
r end
ed
31
Ma
rch
2016
AN
NEX
URE
6
INTE
R-EN
TITY
AD
VAN
CES
PA
ID (n
ote
13.
1)
Co
nfirm
ed
ba
lanc
e o
utst
and
ing
Unc
onf
irme
d b
ala
nce
out
sta
ndin
gTo
tal
31/0
3/20
1631
/03/
2015
31/0
3/20
1631
/03/
2015
31/0
3/20
1631
/03/
2015
R'00
0R'
000
R'00
0R'
000
R'00
0R'
000
NAT
ION
AL
DEP
ART
MEN
TS
Inte
rna
tiona
l Re
latio
ns a
nd C
o-o
pe
ratio
ns-
-3
725
1 25
3 72
51
254
Co
mm
unic
atio
ns -
Pre
vio
us G
CIS
--
-33
0-
330
Tota
l-
-3
725
1 58
43
725
1 58
4
page 229
page 230
NOTES

iParioli Office Park1166 Park StreetHatfield, Pretoria
South Africa
Private Bag X860Pretoria, 0001South Africa
Telephone: +27 12 427 8000
RP197/2016
ISBN: 978-0-621-44677-7