i APPLICATION OF GEOGRAPHIC INFORMATION SYSTEM...
31
i APPLICATION OF GEOGRAPHIC INFORMATION SYSTEM (GIS) IN WATER QUALITY STUDY ON A ROAD CONSTRUCTION PROJECT NOORAZLINDA BINTI ABDUL RAZAK UNIVERSITI TEKOLOGI MALAYSIA
Transcript of i APPLICATION OF GEOGRAPHIC INFORMATION SYSTEM...
i
APPLICATION OF GEOGRAPHIC INFORMATION SYSTEM (GIS) IN WATER
QUALITY STUDY ON A ROAD CONSTRUCTION PROJECT
NOORAZLINDA BINTI ABDUL RAZAK
UNIVERSITI TEKOLOGI MALAYSIA
iii
APPLICATION OF GEOGRAPHIC INFORMATION SYSTEM IN WATER
QUALITY STUDY ON A ROAD CONSTRUCTION PROJECT
NOORAZLINDA BINTI ABDUL RAZAK
A project report submitted in fulfillment of the requirements for the award of the degree of
the Master of Engineering (Civil-Environmental Management)
Faculty of Civil Engineering
Universiti Teknologi Malaysia
NOVEMBER, 2009

v
To my beloveds

vi
ACKNOWLEDGEMENT
Alhamdullilah, a very special thanks and heaps of appreciation to my supervisor,
Dr Mohd Badruddin Mohd Yusof for being the most understanding, helpful and
patient in guiding me throughout the project. His encouragement and moral support
really helps me in completing my project successfully. I would also like to express
my heartiest gratitude to Mr. Mohd Samsudin Bin Ahmad, senior lecturer in FKSG for
his valuable time, guidance and encouragement throughout the course of this research.
Not forgetting my lovely family that is always by my side to support me all
the way. I also wish to extend my heartfelt thanks to all environmental laboratories
technicians for their continuous support during my projects.
Last but not least, I also owes special thanks to my mates, who always
been there for me and extended every possible support.
I am grateful indeed
vii
ABSTACT
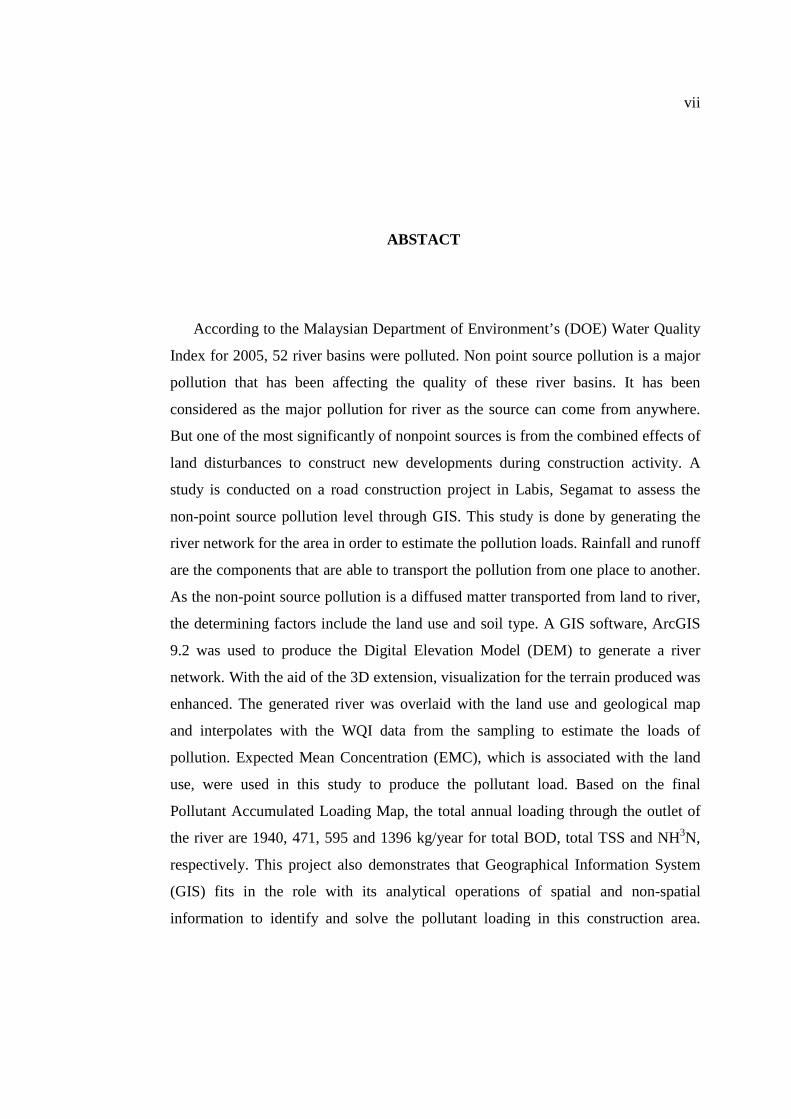
According to the Malaysian Department of Environment’s (DOE) Water Quality
Index for 2005, 52 river basins were polluted. Non point source pollution is a major
pollution that has been affecting the quality of these river basins. It has been
considered as the major pollution for river as the source can come from anywhere.
But one of the most significantly of nonpoint sources is from the combined effects of
land disturbances to construct new developments during construction activity. A
study is conducted on a road construction project in Labis, Segamat to assess the
non-point source pollution level through GIS. This study is done by generating the
river network for the area in order to estimate the pollution loads. Rainfall and runoff
are the components that are able to transport the pollution from one place to another.
As the non-point source pollution is a diffused matter transported from land to river,
the determining factors include the land use and soil type. A GIS software, ArcGIS
9.2 was used to produce the Digital Elevation Model (DEM) to generate a river
network. With the aid of the 3D extension, visualization for the terrain produced was
enhanced. The generated river was overlaid with the land use and geological map
and interpolates with the WQI data from the sampling to estimate the loads of
pollution. Expected Mean Concentration (EMC), which is associated with the land
use, were used in this study to produce the pollutant load. Based on the final
Pollutant Accumulated Loading Map, the total annual loading through the outlet of
the river are 1940, 471, 595 and 1396 kg/year for total BOD, total TSS and NH3N,
respectively. This project also demonstrates that Geographical Information System
(GIS) fits in the role with its analytical operations of spatial and non-spatial
information to identify and solve the pollutant loading in this construction area.
viii
ABSTRAK
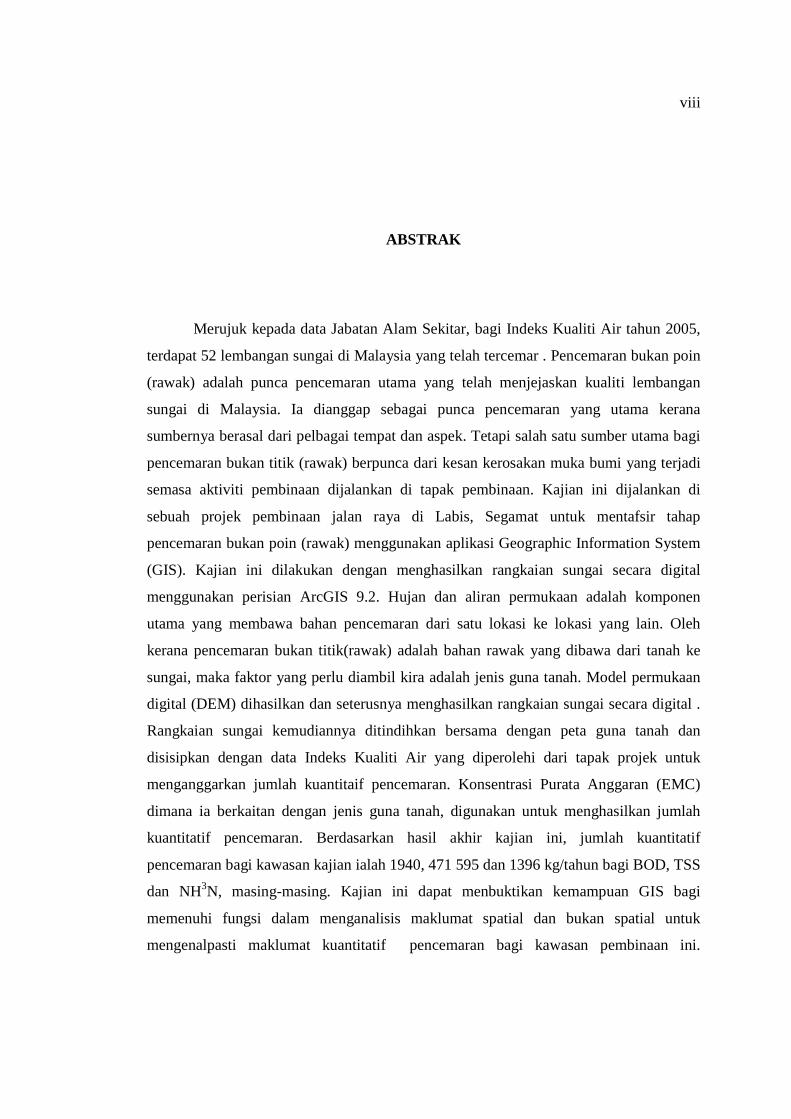
Merujuk kepada data Jabatan Alam Sekitar, bagi Indeks Kualiti Air tahun 2005,
terdapat 52 lembangan sungai di Malaysia yang telah tercemar . Pencemaran bukan poin
(rawak) adalah punca pencemaran utama yang telah menjejaskan kualiti lembangan
sungai di Malaysia. Ia dianggap sebagai punca pencemaran yang utama kerana
sumbernya berasal dari pelbagai tempat dan aspek. Tetapi salah satu sumber utama bagi
pencemaran bukan titik (rawak) berpunca dari kesan kerosakan muka bumi yang terjadi
semasa aktiviti pembinaan dijalankan di tapak pembinaan. Kajian ini dijalankan di
sebuah projek pembinaan jalan raya di Labis, Segamat untuk mentafsir tahap
pencemaran bukan poin (rawak) menggunakan aplikasi Geographic Information System
(GIS). Kajian ini dilakukan dengan menghasilkan rangkaian sungai secara digital
menggunakan perisian ArcGIS 9.2. Hujan dan aliran permukaan adalah komponen
utama yang membawa bahan pencemaran dari satu lokasi ke lokasi yang lain. Oleh
kerana pencemaran bukan titik(rawak) adalah bahan rawak yang dibawa dari tanah ke
sungai, maka faktor yang perlu diambil kira adalah jenis guna tanah. Model permukaan
digital (DEM) dihasilkan dan seterusnya menghasilkan rangkaian sungai secara digital .
Rangkaian sungai kemudiannya ditindihkan bersama dengan peta guna tanah dan
disisipkan dengan data Indeks Kualiti Air yang diperolehi dari tapak projek untuk
menganggarkan jumlah kuantitaif pencemaran. Konsentrasi Purata Anggaran (EMC)
dimana ia berkaitan dengan jenis guna tanah, digunakan untuk menghasilkan jumlah
kuantitatif pencemaran. Berdasarkan hasil akhir kajian ini, jumlah kuantitatif
pencemaran bagi kawasan kajian ialah 1940, 471 595 dan 1396 kg/tahun bagi BOD, TSS
dan NH3N, masing-masing. Kajian ini dapat menbuktikan kemampuan GIS bagi
memenuhi fungsi dalam menganalisis maklumat spatial dan bukan spatial untuk
mengenalpasti maklumat kuantitatif pencemaran bagi kawasan pembinaan ini.

ix
TABLE OF CONTENTS CHAPTER TITLE PAGE
DECLARATION ii
DEDICATION v
ACKNOWLEDGEMENT vi
ABSTRAK v
ABSTRACT vii
CONTENT viii
LIST OF TABLE xiv
LIST OF FIGURE xvi
LIST OF ABBREVIATIONS xix
I INTRODUCTION
1.0 Introduction 1
1.1 Definition of Nonpoint Source Pollution 2
1.2 Definition of Geographic Information System (GIS) 3
1.3 Background of Study 5
1.4 Statement of Problem 5
1.5 Objective of Study 7
1.6 Significance of Study 7
1.7 Scope of Study 8
x
1.7.1 Site Description 9
1.7.2 Catchment Area 11
1.7.3 Frequency and Parameter of Sampling 12
II LITERATURE REVIEW
2.0 Introduction 13
2.1 Project Description 14
2.2 River 15
2.3 Water Quality 16
2.3.1 Physical Parameter 18
2.3.1.1 Suspended Solid 19
2.3.1.2 Turbidity 19
2.3.1.3Temperature 20
2.3.1.4 Odor 21
2.3.2 Chemical Parameter 22
2.3.2.1 Biological Oxygen Demand 22
2.3.2.2 Chemical Oxygen Demand 21
2.3.2.3Dissolved Oxygen 23
2.3.2.4 Ammoniac Nitrogen 24
2.3.2.5 pH 24
2.4 Water Quality Assessment: Water Quality Index (WQI) 27
2.5 Water Pollution and Sources 29
2.5.1 Sources of Water Pollution 29
2.5.1.1 Point Source 29
2.5.1.2 Non-point Source 30
2.6 Assessment for Water Quality 31
2.7 Water Quality Monitoring 32
2.8 Geographic Information System (GIS) 34

xi
2.8.1 ArcGIS 9.1 36
2.8.1.1 ArcMap 36
2.8.1.2 ArcGIS 3D Analyst 37
2.9 Nonpoint Source Pollution Models 39
2.9.1 Agriculture Nonpoint Source (AGNPS) 40
2.9.2 Areal Nonpoint Source Watershed Environment
Response Simulation (ANSWERS) 41
2.9.3 Storm Water Management Model (SWMM) 41
2.9.4 Universal Soil Loss Equation (USLE) 42
2.10 GIS-Based Nonpoint sources Pollution Model 43
2.10.1 Expected Mean Concentration 44
2.10.2 Rainfall-Runoff Analysis 46
2.11 Related Works 47
2.12 Previous Study 49
2.13 Summary 50
III METHODOLOGY
3.1 Introduction 52
3.2 Identification of Study Area 53
3.3 Data Acquisition 54
3.3.1 Primary data 54
3.3.2 Secondary Data 55
3.4 Laboratory Work 55
3.4.1 Biochemical Oxygen Demand (BOD) 55
3.4.2 Chemical oxygen demand (COD) 58
3.4.3 Total Suspended Solid Test 59
3.4.4 Ammonical nitrogen 61
3.4.5 Oil and grease (O&G) 62
3.5 GIS Integration 64
xii
3.5.1 Nonpoint Source Pollution Modeling Description 66
3.5.2 Establishing a River Basin GIS Database 67
3.5.3 Generation of DTM 71
3.5.4 Rainfall-runoff analysis 73
3.5.5 Expected Mean Concentration Values 74
3.5.6 Pollutant Loading Assessment 77
3.5.7 Accumulative Pollutant Loading Assessment 78
3.5.7.1 Flow Direction 78
3.5.7.2 Flow Accumulation 78
3.5 Summary 79
IV RESULT AND ANALYSIS
4.1 Introduction 81
4.2 Water Quality Index (WQI) 81
4.3 GIS Modeling result and analysis 85
4.3.1 Digital Elevation Model 85
4.3.2 Rainfall-Runoff Analysis 86
4.3.3 Expected Mean Concentration value (EMC) 88
4.3.4 Accumulative Pollutant Loading Assessment 88
4.3.4.1 Flow Direction 89
4.3.4.2 Flow Accumulation 90
4.4 Assessment Approach 90
4.5 Results Assessment 94
4.5.1 Biochemical Oxygen Demand (BOD) 94
4.5.2 Total Suspended Solid (TSS) 97
4.5.3 Ammonical Nitrogen (NH3-N) 98
4.6 Corrective Measure 100
4.7 Summary 102

xiii
V CONCLUSION AND RECOMMENDATION
5.1 Introduction 103
5.2 Major Finding 103
5.3 Future Research 105
REFERENCES 106
Appendices A-D 111
xiv
LIST OF TABLE
TABLE NO. TITLE PAGE
1.1 Land Use Area of the Project Site 9
1.2 The Area of Coverage for the Water Catchment 11
2.0 Physical and Chemical Parameters 19
2.1 Water Quality Index (WQI) Criteria 27
2.2 DOE Water Quality Index Classes 29
2.3 The Possible Land-Water Transform Coefficients 44
3.0 Measurable BOD using Various Dilutions of Samples. 56
3.1 Monthly Average of Generated Discharge for 2009 73
3.2 Land Use Description and Codes 76
3.3 EMC Values of Pollutants Based on Land Use. 75
4.2 (a) Water Quality Index for First Sampling, 13 February 2009 81
4.2 (b) Water Quality Index for Second Sampling 21 April 2009 82
4.2 (c) Water Quality Index for Third Sampling 1 September l 2009 83

xv
4.3 Annual Runoff 87
4.4 Expected Mean Concentration Table for Study Area. 88
4.5 Pollutant Load Calculation 92
4.6 The Annual Accumulative Pollutant Load (kg/year) 94
xvi
LIST OF FIGURE
FIGURE NO. TITLE PAGE
1.0 Oil Palm Plantation and Reserved Forest the Proposed Road 10
1.1 Sampling Points 10
1.2 The Catchment of the Study Area 12
2.1 Status of River Basin Water Quality 2005 18
2.2 Network for Water Quality Monitoring 34
2.3 Perform Modeling and Analysis Using ArcGIS 38
2.4 The 3D Extension for ArcGIS Server 39
2.5 Hydrograph, Pollutograph and Loadgraph 46
2.6 Comparison of Pollutographs and EMC for Storm Events 46
3.1 Methodology Flow Chart 53
3.2 Apparatus Used to Measure Dissolved Oxygen in BOD Test. 58
3.3 Apparatus Used to Measure COD 59
3.4 Apparatus Used to Measure TSS 61

xvii
3.5 Apparatus for Oil and Grease Test 64
3.6 The GIS Integration Overview 65
3.7 The Nonpoint Source Pollutant Modeling 67
3.8 The Digitized River Network 69
3.9 Construction of the Runoff Grid, Expected Mean
Concentration (EMC) Grid and Assessment of Pollutant Loading 70
3.10 Contour Line Digitizing Using ArcGIS 72
3.11 Chart for Discharge Value for Each Station 74
3.12 Joining of Table land use and EMC 76
4.0 Elevation Surface of Study Area 85
4.1 Stream network overlaid with elevation surface 86
4.2 The Yearly Runoff Grid 87
4.3 The Flow Analysis using GIS 89
4.4 Flow Direction Grid of the study area 89
4.5 Flow Accumulation Grid of the study area 90
4.6 Pollutant Accumulated Loading Map 91
4.7 (a) Annual Accumulative Pollutant Load for BOD and NH3N 93
4.7 (b) Annual Accumulative Pollutant Load for TSS 93
4.8 Differences in BOD Loading 95

xviii
4.9 Daily Rainfall for the Study Area 95
4.10 BOD Pollutant Laoding for W4 96
4.11 Differences in TSS Loading 97
4.12 BOD Pollutant Laoding During Construction Stage 98
4.13 NH3N Loading for Each Sampling Station 99
xix
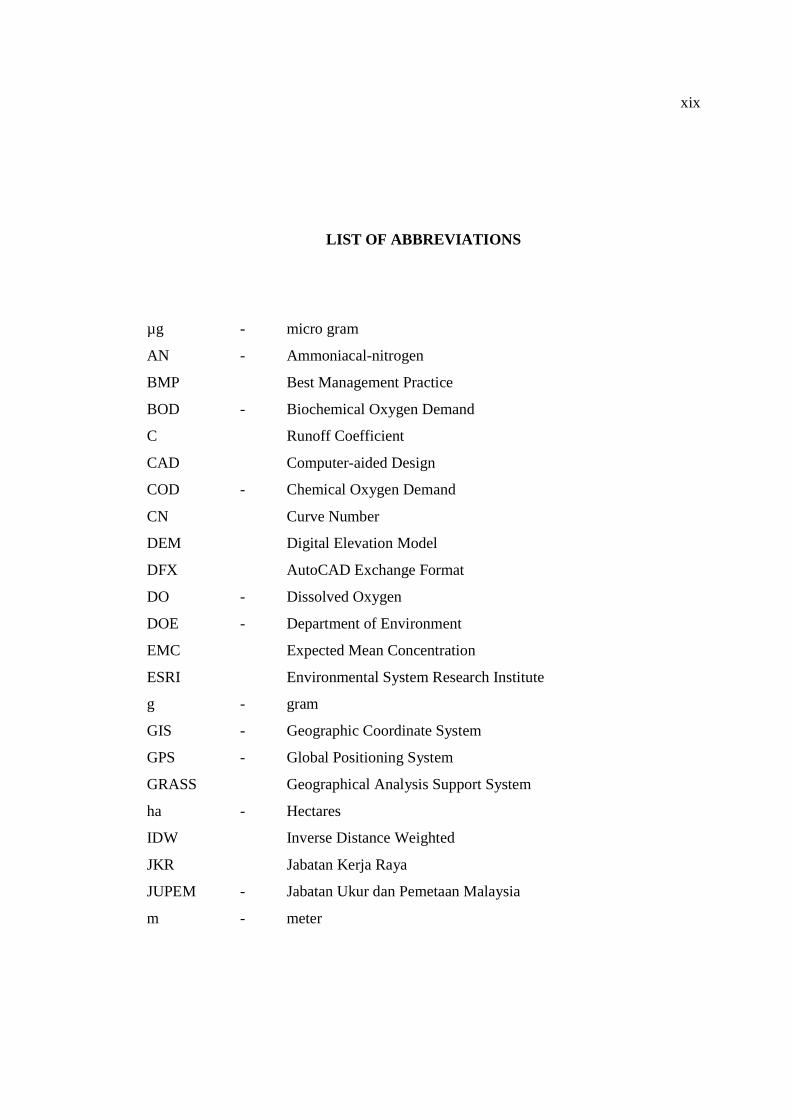
LIST OF ABBREVIATIONS
µg - micro gram
AN - Ammoniacal-nitrogen
BMP Best Management Practice
BOD - Biochemical Oxygen Demand
C Runoff Coefficient
CAD Computer-aided Design
COD - Chemical Oxygen Demand
CN Curve Number
DEM Digital Elevation Model
DFX AutoCAD Exchange Format
DO - Dissolved Oxygen
DOE - Department of Environment
EMC Expected Mean Concentration
ESRI Environmental System Research Institute
g - gram
GIS - Geographic Coordinate System
GPS - Global Positioning System
GRASS Geographical Analysis Support System
ha - Hectares
IDW Inverse Distance Weighted
JKR Jabatan Kerja Raya
JUPEM - Jabatan Ukur dan Pemetaan Malaysia
m - meter
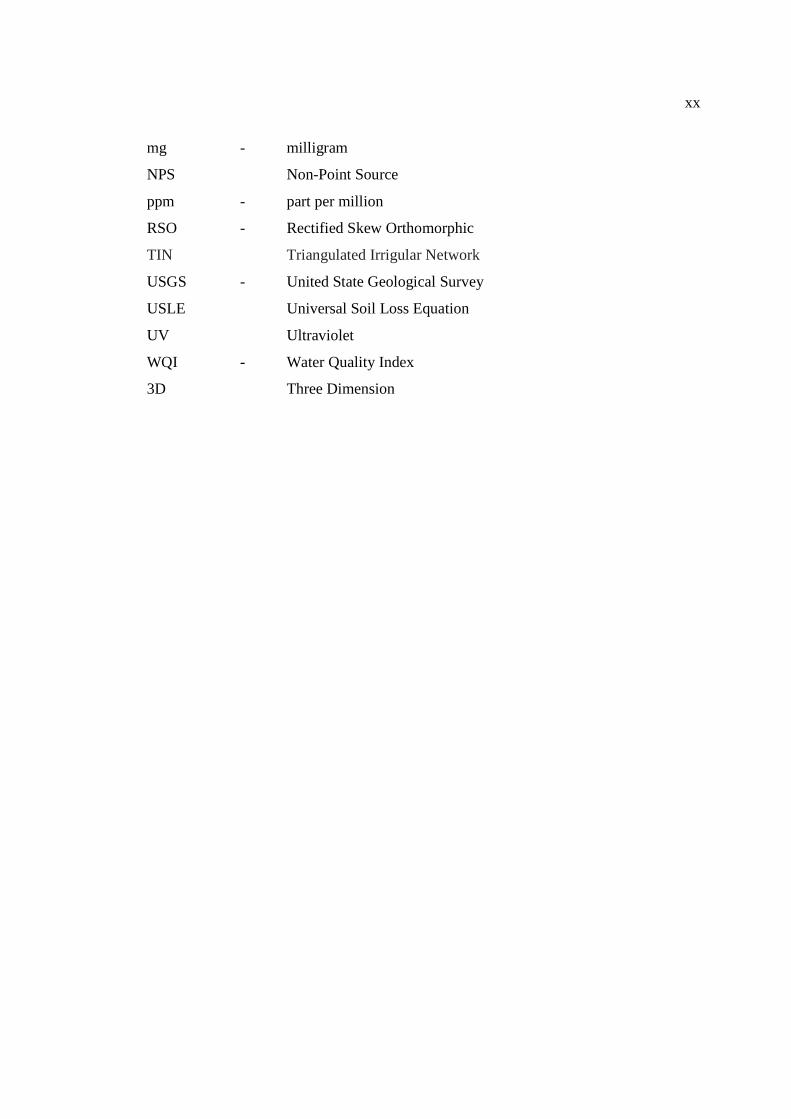
xx
mg - milligram
NPS Non-Point Source
ppm - part per million
RSO - Rectified Skew Orthomorphic
TIN Triangulated Irrigular Network
USGS - United State Geological Survey
USLE Universal Soil Loss Equation
UV Ultraviolet
WQI - Water Quality Index
3D Three Dimension
xxi
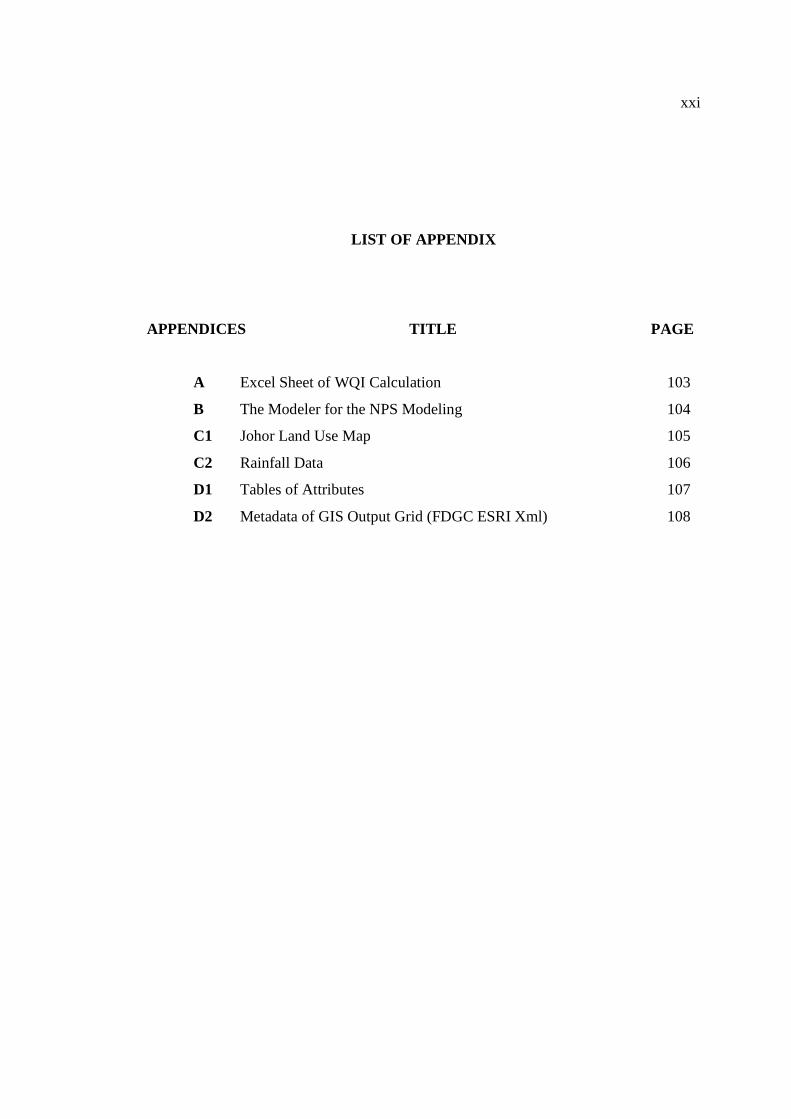
LIST OF APPENDIX
APPENDICES TITLE PAGE
A Excel Sheet of WQI Calculation 103
B The Modeler for the NPS Modeling 104
C1 Johor Land Use Map 105
C2 Rainfall Data 106
D1 Tables of Attributes 107 D2 Metadata of GIS Output Grid (FDGC ESRI Xml) 108

1
CHAPTER 1
INTRODUCTION 1.0 Introduction
River play an important role as the natural drainage arteries of a country, meeting
the needs of an expanding population and supporting agricultural, industrial and socio-
economic development besides being the most important freshwater resource for man.
Social, economic and political development has, in the past, been largely related to the
availability and distribution of fresh waters contained in reverie system.
As development intensifies, the natural river systems are subjected to increasing
stresses resulting in a host of problems, among which include natural runoff, dissolved
chemicals in water that percolates through the soil and human sources, such as
agriculture, mining, construction, industry, homes and businesses (Prabhakar, V.K.
2000). The introduction of pollutants from human activity has seriously degraded water
quality even to the extent of turning pristine trout streams into foul open sewers with few
life forms and less beneficial use (Hill, K.M. 2004). Actually there are many sources
where pollutants can enter the water body. In general the sources of pollutions divided
into two categories know as point sources and non point sources.
River basin is an intricate natural resource which demands varied practices,
complex management decisions and manifold research efforts in order to ensure its

2
efficient utilization. In Malaysia, there are about 150 river basins, which are made up of
more than 1800 rivers (DOE, 2005). Hence, one of the greatest challenges in river basin
management is achieving an appropriate balance between the developments of natural
resources and maintaining an optimal natural environment. For example, since nonpoint
source pollution control cannot begin until the location and severity are identified.
Geographical Information System (GIS) and nonpoint source pollution models are
becoming an integral part of national and state efforts to control the degradation of water
bodies. The emergence of GIS will provide database management, tools, visualization,
simulation and assessment models that supply open and unclouded information that
generate dependence and a common purpose between all parties involved in river basin
management.
1.1 Definition of Nonpoint Source Pollution
Nonpoint source pollution (NPS) is the introduction of impurities into a surface-
water body, usually through a non-direct route and from sources that are diffuse in
nature. Discharge from nonpoint sources are usually intermittent, associated with a
rainfall runoff event and occur less frequently and for shorter periods of time than do
point source discharges. Nonpoint source of pollution are often difficult to identify,
isolate and control. In many cases, nonpoint source pollution such as runoff from
agriculture land, runoff from construction site, urban storm water and strip mining are
becoming major water quality problem (Alexander 1976). According to United States
Environmental Protection Agency (EPA), nonpoint source pollution is the nation’s
largest water quality problem. NPS pollution is caused by rainfall moving over and
through the ground. As the runoff moves, it picks up and carries away natural and
human made pollutants, finally depositing them into lakes, rivers, wetlands, coastal
waters and even or groundwater resources (United States Environmental Protection
Agency 1997). These pollutants include:
3
• Excess fertilizer, herbicides and insecticides from agricultural lands and
residential areas;
• Sediment from improperly managed construction sites, crop and forest lands and
eroding stream banks;
• Oil, grease and toxic chemicals from urban runoff and energy production;
• Salt from irrigation practices and acid drainage from abandoned mines;
• Bacteria and nutrients from livestock, pet wastes and faulty septic systems.
1.2 Definition of Geographic Information System (GIS)
According to Taher (1989), GIS is a computer-based system that supports
functions for managing, analyzing and displaying geographical data. Another definition
states that GIS allows users to effectively organize, update and query mapped data
(Berry 1993). Although many definitions of GIS have been discussed, they all have a
common feature, namely GIS systems deal with geographic information (Maguire
1991). This technology has developed so rapidly over the past two decades that it is now
accepted as essential tools for the effective use of geographic information.
GIS is sometime considered a subset of other information systems like computer-
aided design (CAD), computer carthography, database management and remote sensing.
Many feel that GIS is simply a catch-all for almost any type of automated geographic
data processing. These systems all predate GIS which, because they have evolved from
them, have many features in common. GIS, however, has a number of other features not
available in other system. The major characteristic of GIS is the emphasis placed on
analytical operation, thus distinguishes GIS from systems whose primary objective is
map production.
4
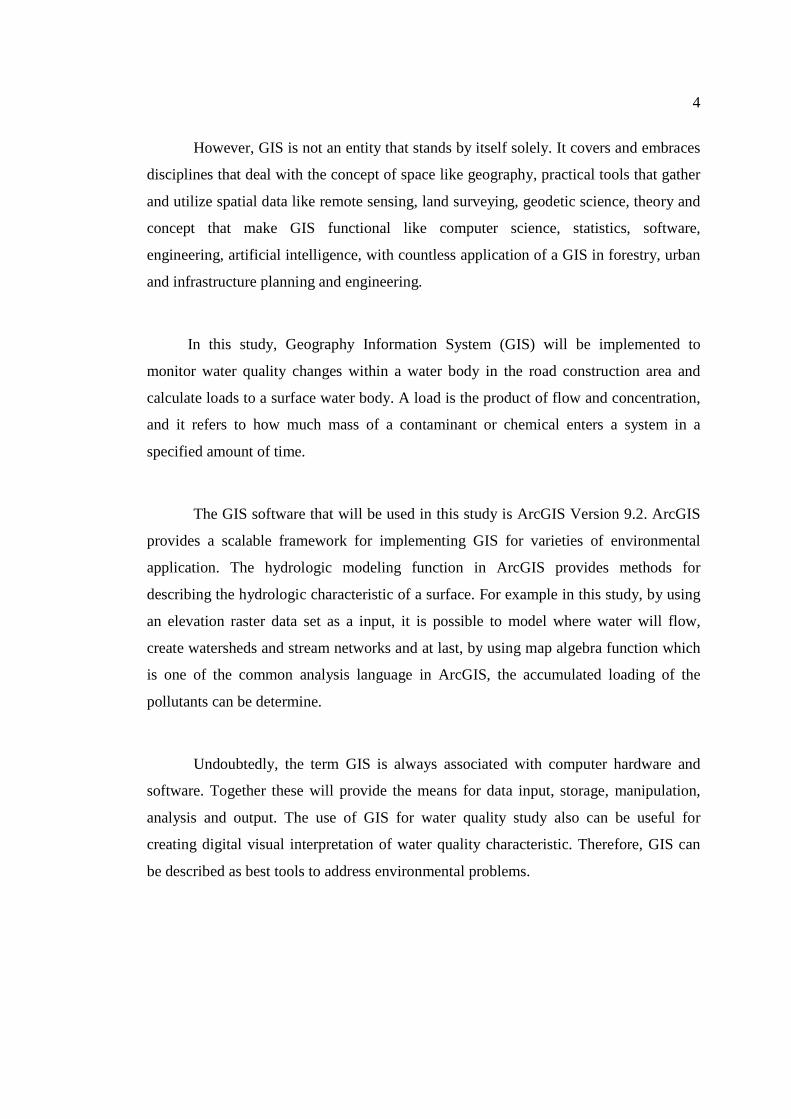
However, GIS is not an entity that stands by itself solely. It covers and embraces
disciplines that deal with the concept of space like geography, practical tools that gather
and utilize spatial data like remote sensing, land surveying, geodetic science, theory and
concept that make GIS functional like computer science, statistics, software,
engineering, artificial intelligence, with countless application of a GIS in forestry, urban
and infrastructure planning and engineering.
In this study, Geography Information System (GIS) will be implemented to
monitor water quality changes within a water body in the road construction area and
calculate loads to a surface water body. A load is the product of flow and concentration,
and it refers to how much mass of a contaminant or chemical enters a system in a
specified amount of time.
The GIS software that will be used in this study is ArcGIS Version 9.2. ArcGIS
provides a scalable framework for implementing GIS for varieties of environmental
application. The hydrologic modeling function in ArcGIS provides methods for
describing the hydrologic characteristic of a surface. For example in this study, by using
an elevation raster data set as a input, it is possible to model where water will flow,
create watersheds and stream networks and at last, by using map algebra function which
is one of the common analysis language in ArcGIS, the accumulated loading of the
pollutants can be determine.
Undoubtedly, the term GIS is always associated with computer hardware and
software. Together these will provide the means for data input, storage, manipulation,
analysis and output. The use of GIS for water quality study also can be useful for
creating digital visual interpretation of water quality characteristic. Therefore, GIS can
be described as best tools to address environmental problems.
5
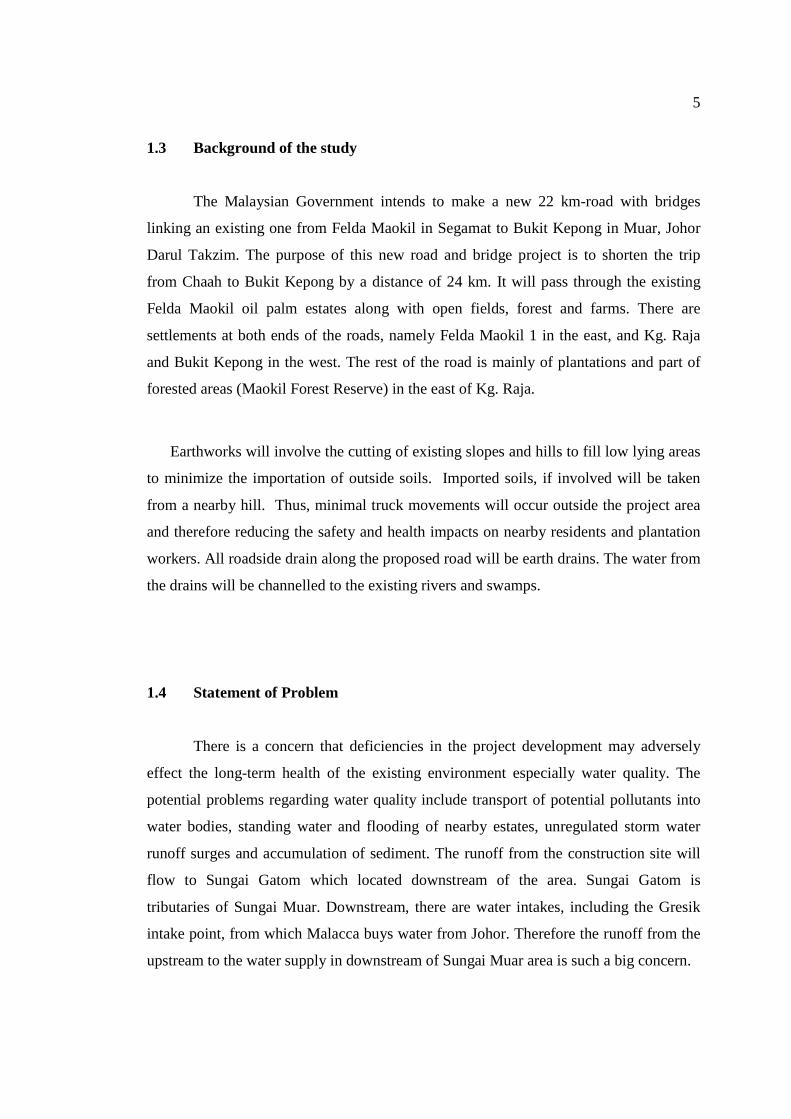
1.3 Background of the study
The Malaysian Government intends to make a new 22 km-road with bridges
linking an existing one from Felda Maokil in Segamat to Bukit Kepong in Muar, Johor
Darul Takzim. The purpose of this new road and bridge project is to shorten the trip
from Chaah to Bukit Kepong by a distance of 24 km. It will pass through the existing
Felda Maokil oil palm estates along with open fields, forest and farms. There are
settlements at both ends of the roads, namely Felda Maokil 1 in the east, and Kg. Raja
and Bukit Kepong in the west. The rest of the road is mainly of plantations and part of
forested areas (Maokil Forest Reserve) in the east of Kg. Raja.
Earthworks will involve the cutting of existing slopes and hills to fill low lying areas
to minimize the importation of outside soils. Imported soils, if involved will be taken
from a nearby hill. Thus, minimal truck movements will occur outside the project area
and therefore reducing the safety and health impacts on nearby residents and plantation
workers. All roadside drain along the proposed road will be earth drains. The water from
the drains will be channelled to the existing rivers and swamps.
1.4 Statement of Problem
There is a concern that deficiencies in the project development may adversely
effect the long-term health of the existing environment especially water quality. The
potential problems regarding water quality include transport of potential pollutants into
water bodies, standing water and flooding of nearby estates, unregulated storm water
runoff surges and accumulation of sediment. The runoff from the construction site will
flow to Sungai Gatom which located downstream of the area. Sungai Gatom is
tributaries of Sungai Muar. Downstream, there are water intakes, including the Gresik
intake point, from which Malacca buys water from Johor. Therefore the runoff from the
upstream to the water supply in downstream of Sungai Muar area is such a big concern.
6
The road construction sites can result in the release of significant amounts of
pollutants into the storm drain system, Sungai Gatom without proper management.
Construction work involves the removal of vegetation and the excavation of soils
causing erosion and the subsequent discharge of sediment. Activities conducted at the
construction sites can also result in the release of other pollutants to Sungai Gatom.
Therefore, GIS is applied in this study as it has been used in the area of environmental
modeling, by providing ease and accuracy in surface terrain representation, watershed
delineation, precipitation, data compilation, non-point source pollutant loading
calculation and other concepts related to environmental processes.
The national government is fully aware of the need to protect and enhance the
environment. And, the Government is committed to take the appropriate action to
ensure that the development is sustainable and balanced. Towards this end, environment
and conservations considerations will increasingly be integrated with development
planning. In line with the Government's interest in protecting and enhancing the
environment, focus on the potentially significant adverse impacts that its projects could
have on the environment should be emphasized especially on water quality monitoring.
Mostly all research and studies that been conducted on the Malaysian context
had been on point source pollution as this pollution is giving acute impacts on the
ecosystem. Controlling of point source pollution is also much easier. As for non point
source pollution, this area is still new in term of number of study that been conducted
and due to much difficulty in acquiring information regarding the pollution as this kind
of impacts is long term. With its characteristic such as diffuse, arise over an extensive
area of land and are in transit over land before entering the navigable waters, technology
such as Geographic Information System (GIS) can be applicable in this area.
Furthermore, managing data by using conventional method is laborious task. In
the conventional methods, technicians are confronted with restrictions and limitation
when there are too much water quality data. There is no systematic system that helps to
reduce their work loads as well as updating the data. Therefore, applying GIS in water

7
quality management may improve the traditional method in the preparation of
geographical information.
1.5 Objective of Study
A set of objectives has been drawn up to archieve the purpose of this study:
i. To analyze the effect of the Segamat road project to the water quality;
ii. To integrate GIS (ArcGIS) in the analysis of water quality and estimation of
loading for the site;
iii. To illustrate the proficiency of GIS technology as an application tool on data
management, analysis and visualization of nonpoint source pollution models
1.6 Significant of Study
Generally, Water Quality Index (WQI) and INWQS are used to determine the
classification and pollutant status of particular water bodies. Since the road construction
will cause several adverse effects to the environment, therefore the water quality of the
water body within the project area should be study to level of construction impact
towards the environment with focus to quality of the water bodies. Therefore this study
is conducted to determine the existing quality of the water bodies within the project area.
The importance of monitoring the water quality from the road construction site is to
ensure the quality and sanitation of the water supply sources as the runoff from the site
will flow to Sungai Gatom which is the of Sungai Muar. More over, downstream of
Sungai Muar are water intakes, including the Gresik intake point, from which Malacca
buys water from Johor.
It is also important to ensure that water quality management during the
construction phase be closely related to management of soil erosion and sedimentation,

8
as excessive erosion and siltation will contribute to water quality deterioration. Other
related aspects of water quality management include management of waste disposal
from site clearing works, solid waste and sewage as well as potential pollution of oil and
grease from waste oils, fuels and lubricants from machinery.
The integration of Geographical Information System to monitor the water quality
of the construction area will give the better information access regarding to the quality
of the water bodies. GIS helps identify and map critical areas of land use and reveal
trends that affect water quality during the construction period. ArcGIS 3D Analyst can
map multiple contamination layers at multiple depths.
1.7 Scope of the study
The scope of this study cover the modeling of nonpoint source pollution for the
selected study area by determining and utilizes appropriate spatial analysis data
classification
technique in ArcGIS and its extention, ArcGIS Spatial Analyst and 3D Analyst.
1.7.1 Site Description
The study area is situated in Daerah Labis, about 4 km from Chaah in the east.
The proposed road will connect the existing State Road J32 from Bukit Kepong to Felda
Maokil and continue to the State Road. It will pass through the existing Felda Maokil oil
palm estates along with open fields, forest and farms. Figure 1.0 show the land use of the
sampling point location. Some of the land uses surrounding the project site include:

9
Table 1.1: Landuse Area of the Project Site
Land use Area Covered
Residential Areas Bukit Kepong, Kg. Raja, Kg Jawa, Kg. Sg. Muda Luar,
Kg. Lenga, Felda Maokil, Kg. Jawa Baru, Kg.Batu Tanum,
Kg.Baharu, Tmn. Chaah Baru, Kg. Kuala Sabar, Kg.Btg.
Merbau
Commercial Areas Pekan Bukit Keopng, Chaah
Institutions Primary School (S.K. Bukit Kepong), Sk. Felda Maokil
2, Labis, Segamat 85300 Labis
Plantations/Orchards Felda Maokil Satu, Felda Maokil Dua, Ladang Song near
Kg. Raja, Ladang Lim Sim Eng
The boundary of this study is from the upstream of the construction area (20 17’
06.6”) until the downstream of the water bodies at (20 18’ 15”). Figure 1.0 and 1.1
shows the sampling point location. Detailed description of the location will be discussed
in Chapter III.
Figure 1.0 (a) (b)
Figure 1.0(a): Oil Palm Plantation North-west (b) Reserved forest at West of the
Proposed Road
10
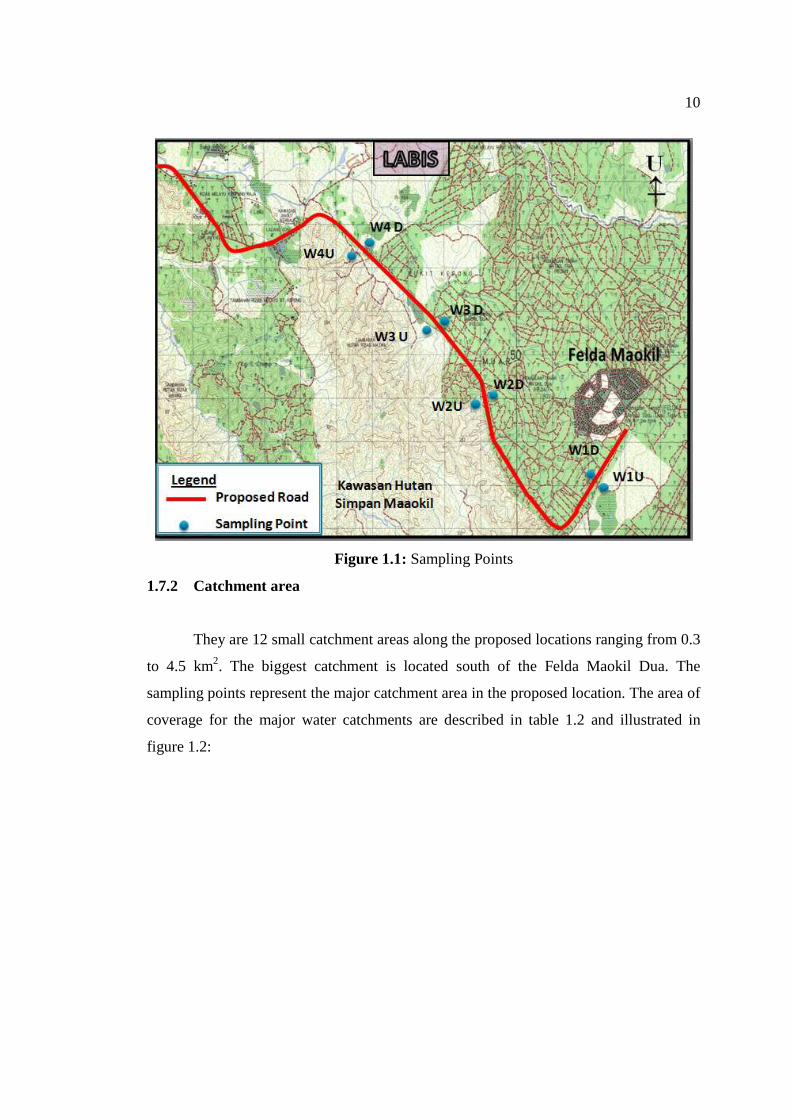
Figure 1.1: Sampling Points
1.7.2 Catchment area
They are 12 small catchment areas along the proposed locations ranging from 0.3
to 4.5 km2. The biggest catchment is located south of the Felda Maokil Dua. The
sampling points represent the major catchment area in the proposed location. The area of
coverage for the major water catchments are described in table 1.2 and illustrated in
figure 1.2:

11
Table 1.2: The Area of Coverage for the Water Catchment
Water Catchment Area of coverage
Water Catchment NO 4 3.15 km2
Water Catchment NO 6 2.4 km2
Water Catchment NO 10 3.1 km2
Water Catchment NO 12 4.5 km2
Source : Pengiraan Hydrologi dan kapasiti hidraulik, Ogos 2007 with reference to
Urban Stormwater Management Manual For Malaysia (MASMA)-Volume 4: Design
Foundamentals
Figure 1.2: The Catchment of the Study Area
1.7.3 Frequency and Parameters of Sampling The sampling frequency of water quality is taken at eight stations with three
times of frequency for during both dry and rainy days. Two samples will be taken for
each major catchment area. There are two types of parameters considered in order to
determine the water quality which are physical parameters and chemical parameters.

12
Water quality is determined by assessing three classes of attributes: physical, chemical,
and biological. The detail of the parameter will be discussed in Chapter 2.