Final Feasibility Report National Waterway-41, Region VI ...
EXHIBIT A
I & J WATERWAY SITE
REMEDIAL INVESTIGATION/FEASIBILITY STUDY
WORK PLAN
Sediments RI/FS Work Plan I & J Waterway Bellingham, Washington Prepared by: The RETEC Group, Inc. 1011 SW Klickitat Way, Suite 207 Seattle, WA 98134-1162 RETEC Project Number: PORTB-18449-100 Prepared for: Port of Bellingham 1801 Roeder Avenue Bellingham, Washington 98225 July 27, 2005

U:\DBerlin\Bellingham\I&J\RIFS\Work Plan\WP for the I&J Waterway_08-08-05.doc
Sediments RI/FS Work Plan I & J Waterway Bellingham, Washington Prepared by: The RETEC Group, Inc. 1011 SW Klickitat Way, Suite 207 Seattle, WA 98134-1162 RETEC Project Number: PORTB-18449-100 Prepared for: Port of Bellingham 1801 Roeder Avenue Bellingham, Washington 98225 Prepared by: _____________________________________________________ Dan Berlin, Environmental Scientist Reviewed by: _____________________________________________________ Mark Larsen, Senior Project Manager
July 27, 2005

Table of Contents
PORTB-18449-100 i
1 Introduction.................................................................................................... 1-1 1.1 Site Description and Ownership ........................................................ 1-1 1.2 Objectives of the RI/FS...................................................................... 1-2
2 Basis and Rationale for RI/FS Scope............................................................. 2-1 2.1 Incorporation of Previous Findings ................................................... 2-1 2.2 Evaluation of Cleanup Requirements under SMS and MTCA.......... 2-3 2.3 Rationale for RI/FS Scope of Work................................................... 2-5
3 Remedial Investigation Tasks ........................................................................ 3-1 3.1 Primary Investigation Tasks .............................................................. 3-1 3.2 Additional Investigation Tasks .......................................................... 3-2 3.3 Data Management, Reporting and QA/QC........................................ 3-3
4 Feasibility Study Tasks .................................................................................. 4-1 4.1 Remedial Technology Screening ....................................................... 4-1 4.2 Development of Remedial Alternatives............................................. 4-3 4.3 Analysis of Habitat, Land Use and Mitigation Issues........................ 4-3 4.4 Selection of a Preferred Alternative................................................... 4-4 4.5 Preparation of the RI/FS Report ........................................................ 4-4
5 Project Schedule............................................................................................. 5-1
6 References Cited ............................................................................................ 6-1
List of Tables
PORTB-18449-100 ii
Table 2-1 Contaminants of Concern for the I&J Waterway Sediments................... 2-2
Table 5-1 Project Schedule....................................................................................... 5-1
List of Figures
Figure 1-1 Site Location Map
Figure 1-2 Summary of Previous Surface Sediments Exceedances
List of Appendices
Appendix A Sediment Sampling and Analysis Plan and Quality Assurance/Quality Control Plan
Appendix B I&J Waterway PSDDA Sediment Characterization Sampling and Analysis Plan
PORTB-18449-100 1-1
1 Introduction This document summarizes the work to be performed during a sediments Remedial Investigation and Feasibility Study (RI/FS) at the I & J Waterway Site (Site) in Bellingham, Washington. This work will be performed by The RETEC Group, Inc. (RETEC) under a Professional Services Agreement with the Port of Bellingham (Port).
The RI/FS will be conducted to determine appropriate remedial measures to address contaminated sediments within the Site and to select a final remedy for sediment cleanup in compliance with the requirements of the Model Toxics Control Act (MTCA) and the Sediment Management Standards (SMS).
1.1 Site Description and Ownership The Site is located between Hilton Avenue and Bellwether Way on the Bellingham waterfront and was formerly called the “Olivine-Hilton sediment Site” (Figure 1-1). The Site includes areas of contaminated marine sediments in both the I & J Waterway and nearby berthing areas. The Waterway is located primarily on a state-owned aquatic land. The Port owns the berthing areas on the south side of the waterway and the surrounding uplands. The Waterway includes a federally authorized navigation channel with a current authorized channel depth of 18 feet below Mean Lower Low Water (MLLW). The U.S. Coast Guard owns the property north of the Site and berths vessels within the waterway and northern berth areas.
The upland areas near the Site include the former Olivine Corporation lease area and a property to its southwest that is currently leased to Bornstein Seafoods.
The ownership and history for the Site and adjacent upland properties were defined in the Phase 2 Sediment Sampling Report (ThermoRetec, 2001). The Whatcom Falls Mill Company owned and operated a lumber mill in the vicinity of the Site between the early 1900’s and 1940. In 1944, these properties were acquired by the Port and leased to tenants, including Bayshore Lumber, who operated a lumber company (1947-1962) and H&H Products, who managed the same lumber mill (1963-1972) at the head of the waterway. The Olivine Corporation operated a rock crushing plant for the mineral olivine between 1963 and 1992. During that period, dust and wastewater were periodically released to the waterway. North Pacific Frozen Products managed a food processing plant between 1946 and 1959 in the location of the current Bornstein lease. Bornstein Seafoods has operated a seafood processing plant from 1959 to present in that location. Bornstein Seafoods provided diesel fuel to boats at its dock between 1960 and the early 1980s. A fire destroyed the main Bornstein Seafoods building in July of 1985. Fire
Sediments RI/FS Work Plan - I & J Waterway, Bellingham, Washington
PORTB-18449-100 1-2
suppression efforts lasted for two days, during which time fire control water was discharged directly to the Site.
Environmental impacts to the Site as documented by previous studies include contaminated surface sediments containing elevated concentrations of bis(2-ethylhexyl)phthalate. The elevated phthalate concentrations are located around the Bornstein Seafoods lease area in the vicinity of the 1985 fire.
Additional sources of phthalate contamination were previously investigated in leachate from the Roeder Avenue landfill and compressor oil from a compressor on the Bornstein dock. Concentrations of bis(2-ethylhexyl)phthalate in leachate from the Roeder Avenue landfill were determined to be below MTCA criteria under a direct discharge scenario (ThermoRetec, 2001b). In addition, as part of the Port’s Environmental Compliance Assessment Program (ECAP) following the Phase 2 investigation, phthalates were measured in trace amounts in compressor oil from a compressor located on Bornstein’s dock. It was determined that thousands of gallons of compressor oil would have needed to have been spilled to create the existing condition in the sediments.
Surface sediments are also contaminated with nickel in the southeastern portion of the waterway adjacent to the former Olivine Corporation lease area. Nickel is a constituent within olivine ore. Additional contaminants present in subsurface sediments include mercury, phenols, and polynuclear aromatic hydrocarbon (PAH) compounds (ThermoRetec, 2001).
1.2 Objectives of the RI/FS As owner of the berthing areas and properties adjacent to the waterway, the Port is performing this RI/FS to evaluate Site cleanup requirements under applicable regulations. The RI/FS will comply with cleanup requirements administered by the Department of Ecology (Ecology) under MTCA and SMS regulations. The RI/FS will be used to define the remedial measures required to clean up the I & J Waterway sediments under these regulations.
Sediments in the I & J Waterway will be investigated in two phases. The first phase consists of determining the surficial extent of contamination. Appendix A provides sampling and analysis methods for the initial phase of field activities, which includes surface sediment sampling. The second phase consists of subsurface sampling. As described in Appendix B, data will be collected to quantify depths and volumes of impacted sediment.
Each phase together is intended to collect sufficient data to fully characterize the extent of surface and subsurface contamination and to comply with MTCA and SMS requirements for RI/FS evaluations. However, the second phase is also intended to characterize the sediments for suitability of open-water disposal under the Puget Sound Dredged Disposal Analysis Program
Sediments RI/FS Work Plan - I & J Waterway, Bellingham, Washington
PORTB-18449-100 1-3
(PSDDA). This assessment will be used to evaluate remedial alternatives as part of the Feasibility Study for the Site.
The I&J Waterway Site is one of several cleanup sites being addressed as part of the Bellingham Bay Demonstration Pilot; a bay-wide, multi-agency initiative integrating sediment cleanup, control of pollution sources, habitat restoration, and aquatic/shoreline land use.
The RI/FS is being performed under an Agreed Order with Ecology (No. DE 1090). At the completion of the RI/FS, the Port and Ecology will evaluate the administrative options for implementing any necessary remedial actions. It is anticipated that the final cleanup action will be conducted under a MTCA Consent Decree.
This document provides an overview of the investigation and engineering tasks to be performed during the RI/FS. Investigation tasks are described in Section 2 and 3 of this report. Engineering tasks are described in Section 4. Appendices A and B describe sampling plans for surface and subsurface investigations, respectively.
PORTB-18449-100 2-1
2 Basis and Rationale for RI/FS Scope This section provides an overview of previous investigation findings in and around the Site and presents the rationale on which the scope of work for the Site RI/FS is based. Sections 3 and 4 of this Work Plan provide a description of the sampling, analysis, and engineering tasks to be completed, consistent with the rationale presented in this section.
2.1 Incorporation of Previous Findings This document incorporates and builds upon sediment sampling data collected in previous investigations. The most recent sampling effort consisted of Phase 2 sediment sampling at the Site during summer of 2000 (ThermoRetec, 2001a). That study provided extensive baseline information about the history of the Site and the types and distribution of sediment contamination. That information has been integrated, along with other existing information to focus the efforts of this RI/FS. A brief description of these existing data and conclusions is provided below.
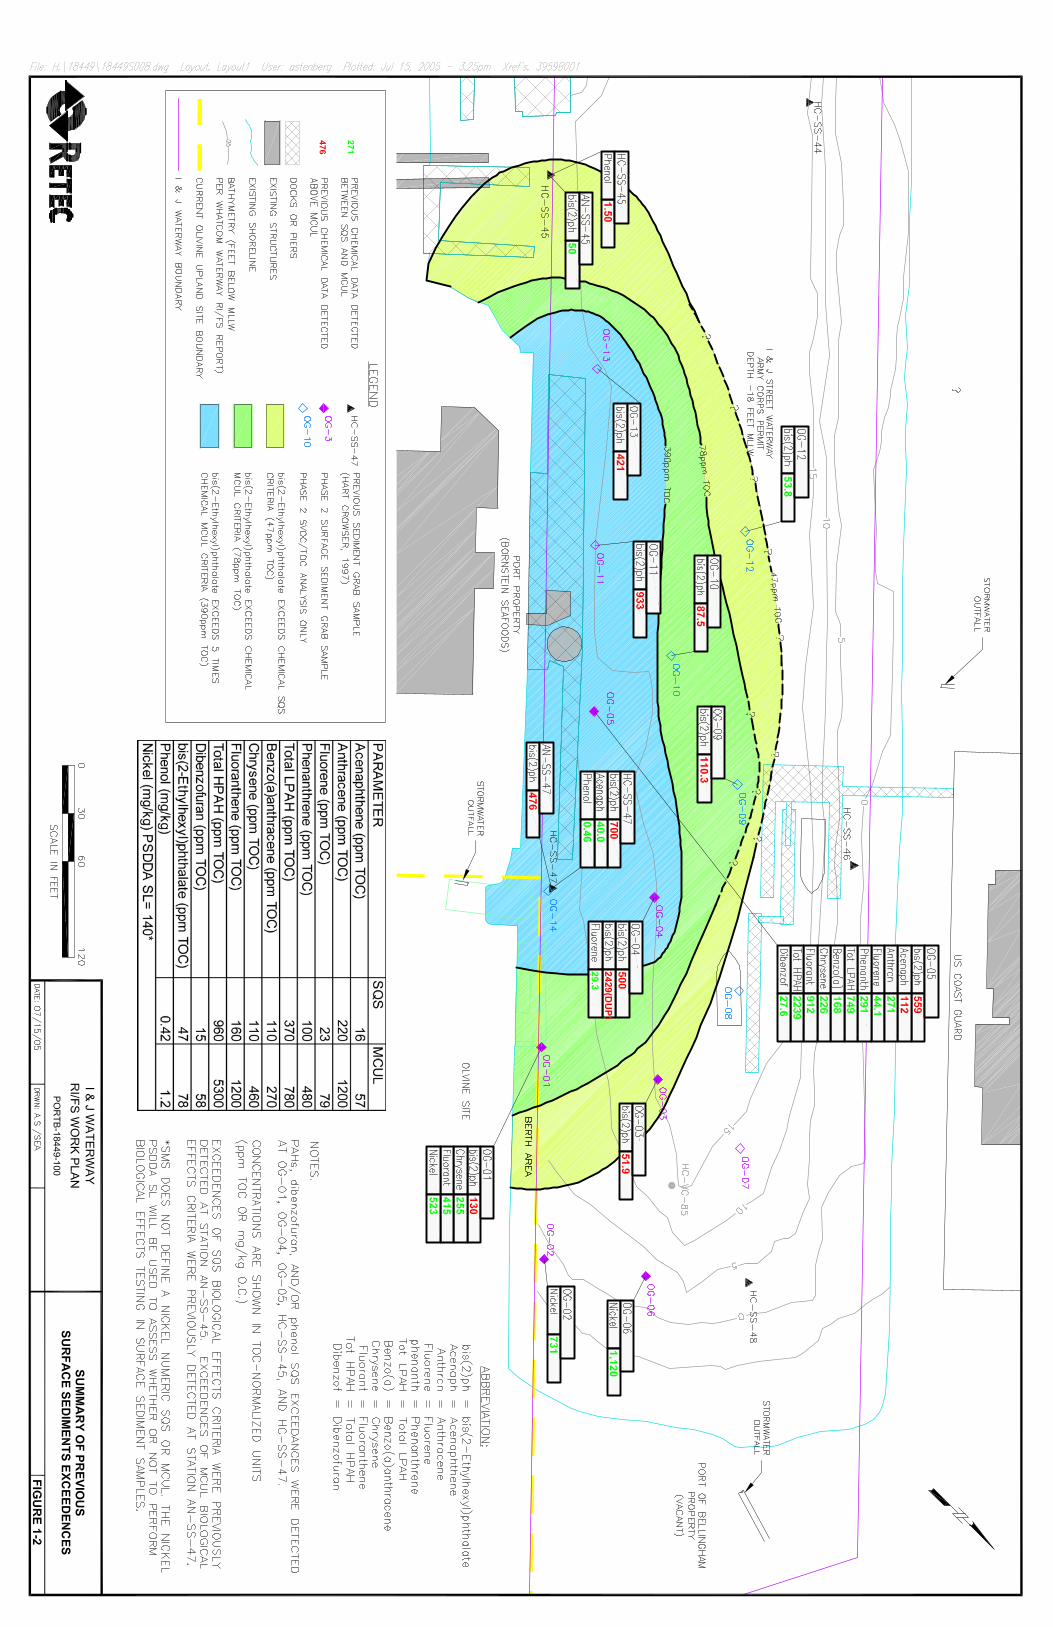
RI/FS Focus Area The focus of this investigation is a contiguous area within the Site where elevated concentrations of sediment contaminants have been detected (Figure 1-1). Phase 2 sampling involved a preliminary characterization of the lateral extent of contamination within the bioactive zone (top 0 to 12 cm) in the Site sediments. Figure 1-2 shows the locations and extent of contamination quantified during the Phase 2 sampling event, including delineations for values exceeding numeric Sediment Quality Standards (SQS) and Minimum Clean-Up Levels (MCUL), as defined in SMS regulations (ThermoRetec, 2001a).
The investigation area of the RI/FS (Figure 1-1) includes all contiguous areas within the Site where exceedances of the SQS or MCUL chemical criteria have been detected. The RI/FS activities will also include sampling of adjacent areas to confirm the lateral extent of surface contamination.
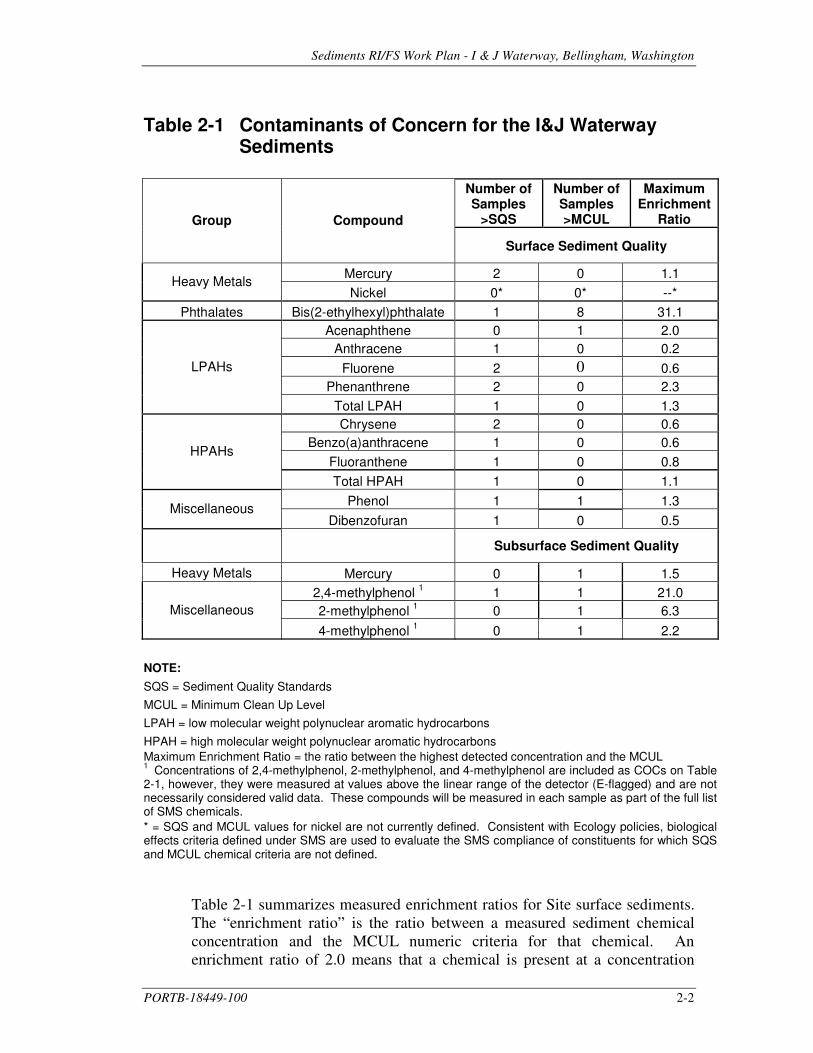
Contaminants of Concern Table 2-1 summarizes the list of contaminants for which exceedances of the current SQS or MCUL values have been noted from the Phase 2 Investigation (ThermoRetec, 2001a) and from previous Hart Crowser (1997) and Anchor Environmental (1999) investigations. These contaminants will be carried forward as the contaminants of concern for the RI/FS investigations. The testing program described in Section 3 incorporates testing for all compounds and related compounds shown in Table 2-1.
Sediments RI/FS Work Plan - I & J Waterway, Bellingham, Washington
PORTB-18449-100 2-2
Table 2-1 Contaminants of Concern for the I&J Waterway Sediments
Number of Samples
>SQS
Number of Samples >MCUL
Maximum Enrichment
Ratio Group Compound
Surface Sediment Quality
Mercury 2 0 1.1 Heavy Metals Nickel 0* 0* --*
Phthalates Bis(2-ethylhexyl)phthalate 1 8 31.1 Acenaphthene 0 1 2.0
Anthracene 1 0 0.2 Fluorene 2 0 0.6
Phenanthrene 2 0 2.3 LPAHs
Total LPAH 1 0 1.3 Chrysene 2 0 0.6
Benzo(a)anthracene 1 0 0.6 Fluoranthene 1 0 0.8
HPAHs
Total HPAH 1 0 1.1 Phenol 1 1 1.3 Miscellaneous
Dibenzofuran 1 0 0.5
Subsurface Sediment Quality
Heavy Metals Mercury 0 1 1.5 2,4-methylphenol 1 1 1 21.0 2-methylphenol 1 0 1 6.3 Miscellaneous
4-methylphenol 1 0 1 2.2 NOTE: SQS = Sediment Quality Standards MCUL = Minimum Clean Up Level LPAH = low molecular weight polynuclear aromatic hydrocarbons HPAH = high molecular weight polynuclear aromatic hydrocarbons Maximum Enrichment Ratio = the ratio between the highest detected concentration and the MCUL 1 Concentrations of 2,4-methylphenol, 2-methylphenol, and 4-methylphenol are included as COCs on Table 2-1, however, they were measured at values above the linear range of the detector (E-flagged) and are not necessarily considered valid data. These compounds will be measured in each sample as part of the full list of SMS chemicals. * = SQS and MCUL values for nickel are not currently defined. Consistent with Ecology policies, biological effects criteria defined under SMS are used to evaluate the SMS compliance of constituents for which SQS and MCUL chemical criteria are not defined.
Table 2-1 summarizes measured enrichment ratios for Site surface sediments. The “enrichment ratio” is the ratio between a measured sediment chemical concentration and the MCUL numeric criteria for that chemical. An enrichment ratio of 2.0 means that a chemical is present at a concentration
Sediments RI/FS Work Plan - I & J Waterway, Bellingham, Washington
PORTB-18449-100 2-3
twice the MCUL value. Enrichment ratios are simplified ways to express the relative concentrations of different chemicals in Site sediments.
At the Site, bis(2-ethylhexyl)phthalate is the compound with the highest measured enrichment ratios. It is also the compound present in excess of MCUL values in the greatest number of samples. Areas of elevated phthalate concentrations were localized around the Bornstein Seafoods dock area as shown in Figure 1-2. Two surface sediment samples collected from phthalate-impacted areas were tested for biological effects using SMS bioassays in 1998. These samples were collected from stations AN-SS-45 and from station AN-SS-47, confirming the presence of biological effects in Site sediments and defining a preliminary correlation between the level of biological effects and the sediment phthalate concentrations.
Other contaminants include LPAHs with enrichment values ranging from 0.2 to 2.3, and HPAHs with enrichment values ranging from 0.6 to 1.1. Nickel was detected in surface sediment samples in the southeastern portion of the waterway above PSDDA screening levels (SL), however, there are no SMS criteria for nickel. Mercury was below SQS criteria in surface sediments in 2000, but contained slightly elevated concentrations in 1996 and 1998. This is consistent with other reports that suggest mercury contamination is absent in the surface but present in subsurface sediments. Mercury contamination in the I&J Waterway Site is associated with elevated mercury concentrations located in sediment in the Whatcom Waterway. Several methylphenol compounds (2,4-methylphenol, 2-methylphenol, and 4-methylphenol) were also elevated above MCUL criteria in subsurface sediments, although the concentrations were above the linear range of the detector (ThermoRetec, 2001). Based on these previous findings, mercury and methylphenols will be carried forward as contaminants of concern for the Site in subsurface sediments.
2.2 Evaluation of Cleanup Requirements under SMS and MTCA The Sediment Management Standards (SMS) provide a uniform set of rules and procedures to evaluate the clean up of contaminated sediment sites (WAC 173-204). The SMS regulations are enforced under the Model Toxics Control Act (MTCA; Chapter 70.105D RCW). All activities performed under this RI/FS will be consistent with those regulations.
Under the SMS, two sets of cleanup criteria are established. The first of these, the Sediment Quality Standard (SQS), is a criterion below which no adverse effects occur, “including no acute or chronic adverse effects on biological resources and no significant health risk to humans” (Ecology, 1995). The SQS are a regulatory and management goal for the quality of sediments throughout the state. The second criterion, the Minimum Cleanup Level (MCUL), is a minor adverse effects level, which is the minimum level to be achieved in all cleanup actions under the SMS. SQS and MCUL standards
Sediments RI/FS Work Plan - I & J Waterway, Bellingham, Washington
PORTB-18449-100 2-4
apply to surface sediments, and to subsurface sediments which could be exposed by natural or anthropogenic processes.
Compliance with SMS criteria can be assessed using chemical and/or biological sampling data. Protocols for both chemical and biological testing are defined under the Puget Sound Protocols (Puget Sound Estuary Program, 1986) and in amendments to those protocols as established by Ecology. As described in Section 3, chemical testing methods developed under the PSDDA program will also be incorporated where appropriate for evaluation of dredged material management options.
Sediment surface sampling will be used during the RI/FS to better define the spatial extent of contaminated surface sediments. Surface samples, or “grabs” will be located throughout the Site, including on the eastern, northern, and western boundaries of the Site. Chemical testing will be used to evaluate compliance of surface sediment samples with SMS numeric criteria. Any surface sediment samples with chemical concentrations in excess of SQS chemical criteria or as determined by Ecology will be tested for biological effects. Biological testing will be performed using appropriate bioassays as specified in WAC 173-204-310(2)a and WAC 173-204-315 and recent Ecology revisions to those testing protocols. Sediment samples that exceed the SMS chemical criteria but which pass the confirmatory bioassays will be designated as passing the SQS or MCUL, consistent with SMS regulations. For nickel, the PSDDA screening level (SL) will be used as a conservative screening level analogous to the SQS. Samples exceeding the nickel PSDDA SL will be tested for biological effects.
The definition of the nature and extent of subsurface sediments is necessary in order to evaluate potential sediment management options and remedial alternatives. Sediment remedial alternatives can include the use of natural recovery, capping or removal with treatment or disposal. The thickness and characteristics of subsurface sediments in impacted Site areas will be defined as part of the RI/FS. Specifically the Site has been divided into a series of potential dredged material management units (DMMU) for evaluation of suitability of sediment for open-water disposal under the PSDDA program. Within each DMMU containing impacted sediments, subsurface testing will be performed. Although core locations are designed to comply with the PSDDA program, the subsurface data collected will aid in determining vertical extent of contamination for the RI/FS. Testing results will be compared to SMS criteria and to the criteria applicable to potential treatment or disposal alternatives. Results of surface and subsurface testing will then be used to assess the need for Site remediation, screen potential remedial technologies, and evaluate remedial alternatives consistent with the MTCA and SMS regulations.
Sediments RI/FS Work Plan - I & J Waterway, Bellingham, Washington
PORTB-18449-100 2-5
2.3 Rationale for RI/FS Scope of Work The scope of investigation and engineering activities to be performed during the RI/FS is consistent with MTCA and SMS requirements. Principal investigation tasks to be performed include the following:
� Collect surface sediment data in areas where existing data are inadequate to determine compliance with SMS chemical criteria, such that the lateral extent of surface sediment contamination can be characterized.
� Perform confirmatory biological testing in those areas that exceed the SMS chemical criteria and in those areas that may cause deleterious benthic impacts, as determined by Ecology.
� Use core sampling to characterize the vertical extent of contamination in subsurface sediments and to evaluate sediment management alternatives, including the suitability of unconfined, open-water disposal under PSDDA.
� Collect bathymetric information at each sampling location in support of the engineering analysis for remedial alternatives.
� Collect additional site information as required to support the analysis of remedial alternatives.
The feasibility study will evaluate remedial alternatives in compliance with SMS, and MTCA remedy selection requirements. This analysis will address the effectiveness, implementability and cost of different cleanup technologies, ranging from aggressive removal technologies to containment and natural recovery technologies. Where appropriate, the feasibility study will evaluate different remedial technologies for specific areas of the site or for different contamination levels. Specific analyses to be performed during the feasibility study include the following:
� Analysis of prop wash effects and bathymetric limitations relevant to the use of capping or natural recovery technologies.
� Evaluation of logistical constraints (e.g., presence of docks and pilings) relevant to dredging activities, as well as the evaluation of methods, which could be used to overcome those constraints.
� Evaluation of current and future land uses for each remedial alternative.
� Evaluation of remedial costs for different cleanup levels (i.e., costs associated with remediation to the SQS versus those associated with cleanup to the MCUL and human health criteria).
� Evaluation of total remedial costs for a range of alternatives.
Sediments RI/FS Work Plan - I & J Waterway, Bellingham, Washington
PORTB-18449-100 2-6
Collection of surface sediment and subsurface sediment samples are described in more detail in Section 3 and in the Sampling & Analysis Plans included as Appendices A and B, respectively.
PORTB-18449-100 3-1
3 Remedial Investigation Tasks This section contains an overview of the field investigation tasks to be performed as part of the RI/FS. These activities will be performed within the RI/FS investigation area identified in Figure 1-1.
The RI/FS investigations will be used to define any Site areas requiring remediation. The sampling activities will include the collection of surface grab samples for chemical analysis and bioassay testing. Surface samples will define the lateral extent of chemical contamination and biological effects. The extent of subsurface coring will be contingent upon surface grab results. Subsurface samples will define the vertical extent of chemical contamination and will provide data necessary for evaluation of potential remedial alternatives.
3.1 Primary Investigation Tasks The RI/FS sediment investigations will be conducted in two phased field efforts. The first phase will consist of surface sampling, chemical analysis, and bioassay testing. The second phase will consist of subsurface sampling and chemical analysis to determine the composition and thickness of contaminated sediments. The subsurface data will be used to first evaluate the nature and extent of contamination and (secondarily) to evaluate sediment management alternatives as part of the FS. The program of surface sampling is defined in detail in Appendix A. The subsurface coring program is defined in detail in Appendix B.
All investigation activities will be conducted consistent with a Site Health and Safety Plan (HASP). The Site HASP will be prepared consistent with state regulatory requirements. The project HASP will be submitted to Ecology at least 30-days prior to mobilization for field investigation activities.
Surface Grab Sampling Surface sediment samples will be collected within the RI/FS investigation area to help define the extent of surface contamination. Samples will be collected within the area of SMS exceedances and beyond these boundaries. Grab samples will be analyzed for chemical parameters, and those that fail SQS chemical criteria will be tested with bioassays.
Chemical Analysis of Grab Samples Thirteen locations within the Site will be sampled for surface sediments by van Veen grabs, as described in Appendix A. These samples will be analyzed for SMS chemical parameters, including volatile and semivolatile organics, pesticides and PCBs, metals, total organic carbon (TOC), ammonia, total sulfides, grain size, and total solids. Metals analysis will include nickel.
Sediments RI/FS Work Plan - I & J Waterway, Bellingham, Washington
PORTB-18449-100 3-2
Bioassay Sampling At each of the grab sampling locations, additional volume will be collected and archived to be used for bioassay testing. If any of the surface sediments should fail SQS chemical criteria, those stations will be subjected to bioassay testing along with those requested by Ecology. Bioassays will be performed as described in Appendix A. As described in section 2.2, samples with nickel at concentrations in excess of the PSDDA screening level will be tested using bioassays, along with those samples requested by Ecology.
Under SMS regulations, the interpretation of bioassay data requires the collection and analysis of clean reference sediment, similar in physical characteristics to the test sediments. One of more reference samples will be collected for use in the RI/FS confirmational bioassays, based a priori on the grain size and organic carbon content of test sediments. These samples will be analyzed for bioassays as well as for the same chemical parameters as grab samples at the Site.
Subsurface Core Sampling The composition and thickness of the contaminated sediments will be determined in the area defined by surface sediment sampling. Coring will be conducted with a vibracore, as described in Appendix B, and will be tested for the full suite of SMS chemicals. All chemicals tested will be compared to SMS and PSDDA criteria. Biological testing of subsurface sediments will be performed on samples from dredged material management units if PSDDA screening levels are exceeded.
3.2 Additional Investigation Tasks As part of the field investigation program, additional data will be collected to support the engineering analyses to be performed as part of the RI/FS.
Analysis of Current and Future Land Uses Land use information and anticipated navigation requirements of the I&J Waterway and berth areas will be collected for the current primary users of the waterway. The users include Bornstein Seafoods, the US Coast Guard, and users of the marina entrance at the opening of the waterway. Additional analysis of impacts of each remedial alternative on existing and future habitat, land use, and mitigation issues will be carried out as part of the feasibility study, as discussed in Section 4.3.
Bathymetric Data A complete bathymetric survey will be conducted as part of the RI/FS investigation. Water depths will be measured from a boat using a transducer suspended from the boat while travelling first parallel and then perpendicular to track lines. Positions will be recorded using a DGPS unit at time of data collection. Water depths will be measured from a boat using lead line or
Sediments RI/FS Work Plan - I & J Waterway, Bellingham, Washington
PORTB-18449-100 3-3
transducer equipment, depending on site conditions. Discrete measurements will be collected every 10 feet along transect survey lines spaced approximately 100 feet apart oriented perpendicular to shore. Positions will be recorded using a DGPS unit at time of collection. At least one longitudinal track line will be run parallel to shore to cross-reference the track lines.
Documentation of General Site Features During the RI/FS investigations, additional data will be collected regarding the site features that may impact remediation activities. Specific observations include the following:
� Dock piling locations and types
� Over-water utilities or structures
� Shoreline armoring, bulkheads or other features relevant to Site remedial alternatives
� Bottom characteristics and sediment grain size
An updated base map will be prepared as part of the RI/FS for use during remedial alternatives evaluation.
3.3 Data Management, Reporting and QA/QC Data collected during the field investigation program will be summarized in the RI/FS document. That document will include tabular and graphical summaries of all collected data. All laboratory reports and QA/QC summaries will be attached to the document as appendices. All chemical and biological testing data will be reported to Ecology electronically in SEDQUAL database format prior to final RI/FS approval.
PORTB-18449-100 4-1
4 Feasibility Study Tasks 4.1 Remedial Technology Screening
Once the areas and volumes of contaminated sediments have been determined, cleanup technologies will be screened for their ability to remediate these sediments. The screening will evaluate the implementability, effectiveness, and cost of each technology. Based on data collected to date, likely sediment remedial technologies which will be carried forward for further consideration at the Site include:
� Natural recovery
� Capping of contaminated sediments
� Dredging and disposal in an upland Subtitle D landfill
� Dredging with upland treatment
� Dredging with beneficial reuse or PSDDA disposal
� Mixtures of the above-listed technologies
Capping Technologies As part of the technology screening for sediment capping, particular attention will be paid to the long-term effectiveness of this technology, as well as land use considerations.
Given the size of the vessels entering and exiting the I & J Waterway, prop wash is likely to be the dominant mechanism affecting the long-term effectiveness of sediment capping. An analysis of prop wash will be conducted using the methodology presented by the U.S. Army Corps of Engineers (ACOE). This analysis will specify minimum capping requirements at the Site.
Results of the bathymetry information collected during investigation activities will be used to evaluate the areas where capping is an option, given the need for a minimum depth of water at the Site. Where capping is determined to be impracticable, the technology will be excluded from further consideration in that area. The required cap thicknesses and any associated armoring will be assessed for each area for which capping is determined to be feasible.
Natural Recovery Due to the presence of an active federal navigation channel and navigation berth areas within the site, natural recovery is not likely to be the primary remedial approach for the Site. However, it may impact the area and volume of sediments for which active remediation technologies are used. As part of the FS, the potential impact of natural recovery to the areas and the volumes requiring active remediation will be evaluated. The results of the prop wash
Sediments RI/FS Work Plan - I & J Waterway, Bellingham, Washington
PORTB-18449-100 4-2
analyses performed as part of the capping analysis will be incorporated in the screening of natural recovery, along with natural recovery evaluations that were performed in the immediate vicinity of the Site as part of the Whatcom Waterway RI/FS (Anchor, 2000). The influence of natural recovery on contaminant concentrations will be assessed for each of the site areas.
Sediment Dredging Analysis Dredging of contaminated sediments will be evaluated as part of the technology screening. The analysis will be used to define the procedures, practicability, and costs associated with removal of impacted sediments.
Knowledge of site bathymetry and sediment thicknesses collected during sampling and the location of fixed features at the Site (e.g., pilings) will be used to determine which areas are amenable to the use of dredging technologies. Structural stability of existing pilings and structures will be considered in evaluating remedial alternatives. Specific types of dredges that can be used (e.g., hydraulic or mechanical), rates of dredging, and issues involving water quality management will be assessed in this analysis.
The dredging analysis will be performed in parallel with the analysis of sediment treatment and disposal options. Where the costs and engineering alternatives associated with dredging are affected by the type of treatment/disposal alternative selected, these differences will be identified. The format of the cost estimates will permit direct comparison between technologies. The sampling plan in Appendix B evaluates the potential for beneficial reuse and for unconfined, open-water disposal under the PSDDA program. Appendix B includes maps defining preliminary dredged material management units based on existing site data and historical dredge records and bathymetric maps.
Beneficial Reuse and/or PSDDA Sediment Disposal The disposal of the sediments at an established PSDDA disposal site will be evaluated as part of the RI/FS. Sediment must meet PSDDA requirements in order to qualify for unconfined, open-water disposal. These requirements are also used to evaluate beneficial reuse options.
Upland Treatment, Reuse and Disposal Technologies Upland treatment, reuse and/or disposal technologies will be screened for application to the Site sediments. Specific treatment, reuse and/or disposal options to be evaluated include the following:
� Beneficial reuse as industrial soil consistent with applicable federal and state regulations
� Treatment and reuse as construction aggregate or cement admixture
� Treatment in a thermal desorption unit
Sediments RI/FS Work Plan - I & J Waterway, Bellingham, Washington
PORTB-18449-100 4-3
� Disposal in a Subtitle D landfill
� Other commercially-available treatment/disposal alternatives as appropriate
4.2 Development of Remedial Alternatives Following screening of remedial technologies, the technologies will be combined to create remedial alternatives for further evaluation in the feasibility study. The range of alternatives is expected to span technologies from natural recovery to complete removal. The range of alternatives will include consideration of special subareas of the Site (e.g., under-pier contaminated areas), which may require special technologies or for which remedial costs may be substantially different from other similarly contaminated site areas with different physical characteristics.
Detailed cost estimates and drawings will be prepared for each alternative evaluated. The format of the cost estimates will allow for direct comparison of costs between each alternative. Each alternative will be evaluated consistent with MTCA remedy selection requirements as defined in WAC 173-340-360.
Cost estimates will include both short-term and long-term costs, including the costs of mitigation for land use or habitat impacts as described below. The analysis of effectiveness will address the issue of long-term risks. Options to reduce these long term risks will be discussed where appropriate.
4.3 Analysis of Habitat, Land Use and Mitigation Issues As part of the remedial alternatives analysis, habitat, land use and mitigation issues will be evaluated. The habitat analysis will address potential habitat impacts of each alternative, and will address any required mitigation measures under existing regulations. This analysis will address potential concerns associated with the Endangered Species Act.
Land use issues will be evaluated for each of the alternatives. Potential impacts on each of the following will be addressed:
� Existing uses and anticipated navigation for the I&J Waterway and berth areas
� Existing and anticipated uses of the adjacent upland properties
� Potential future uses of the site and neighboring properties, with a weighting toward those uses that are consistent with the City of Bellingham Shoreline Master Plan and the Washington State regulations for the management of state-owned aquatic lands (WAC
Sediments RI/FS Work Plan - I & J Waterway, Bellingham, Washington
PORTB-18449-100 4-4
332), including the results of ongoing land use planning efforts and SMP revision.
� Consistency with the State Environmental Policy Act (SEPA) and with the Environmental Impact Statement (EIS) prepared by Ecology and cooperating agencies under the Bellingham Bay Demonstration Pilot (Ecology, 2000).
Where impacts to habitat or land uses would require mitigation, and where reasonable mitigation alternatives for mitigation are available, the costs and other requirements of these actions will be defined, discussed, and included as part of the alternatives evaluation process.
4.4 Selection of a Preferred Alternative Selection of a preferred alternative will be performed after coordination with Ecology. The preferred alternative will be selected consistent with MTCA and SMS regulatory requirements.
4.5 Preparation of the RI/FS Report The RI/FS report will be prepared as a draft for review and comment by Ecology. The draft RI/FS report will be submitted to Ecology for review. RETEC expects that Ecology will provide written comments on the RI/FS report. Written responses to these comments will be provided.
After the comments from Ecology have been addressed, a revised RI/FS report will be prepared by RETEC. The revised report will reflect the comments and responses from the draft RI/FS. This version of the RI/FS will be made available for public and stakeholder review during a 30-day public comment period as described in the Public Participation Plan (Ecology, 2004). The RI/FS will be finalized after completion of a public comment period.
PORTB-18449-100 5-1
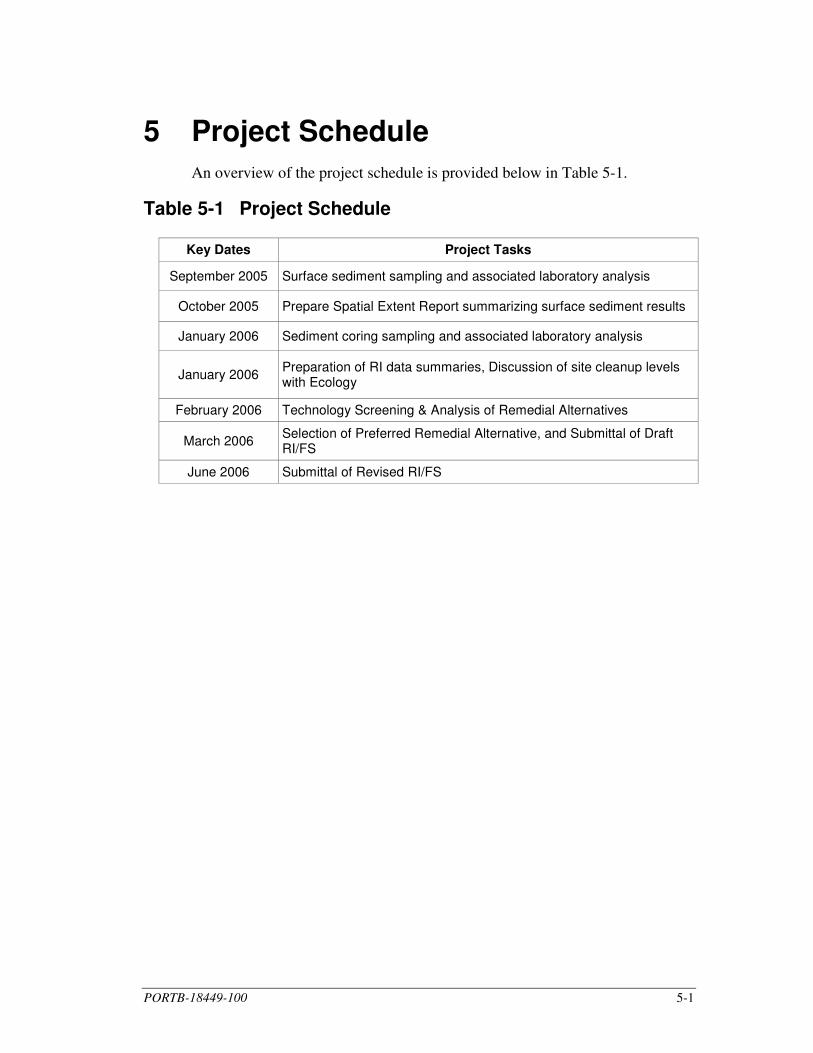
5 Project Schedule An overview of the project schedule is provided below in Table 5-1.
Table 5-1 Project Schedule
Key Dates Project Tasks
September 2005 Surface sediment sampling and associated laboratory analysis
October 2005 Prepare Spatial Extent Report summarizing surface sediment results
January 2006 Sediment coring sampling and associated laboratory analysis
January 2006 Preparation of RI data summaries, Discussion of site cleanup levels with Ecology
February 2006 Technology Screening & Analysis of Remedial Alternatives
March 2006 Selection of Preferred Remedial Alternative, and Submittal of Draft RI/FS
June 2006 Submittal of Revised RI/FS
PORTB-18449-100 6-1
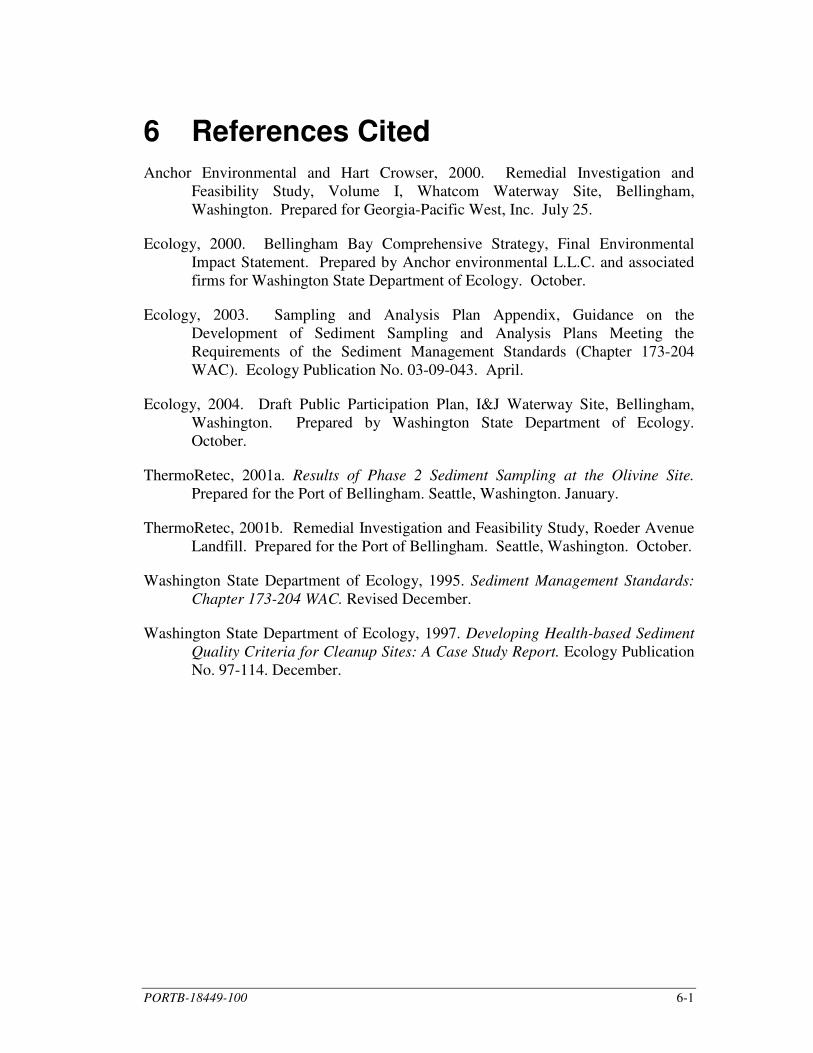
6 References Cited Anchor Environmental and Hart Crowser, 2000. Remedial Investigation and
Feasibility Study, Volume I, Whatcom Waterway Site, Bellingham, Washington. Prepared for Georgia-Pacific West, Inc. July 25.
Ecology, 2000. Bellingham Bay Comprehensive Strategy, Final Environmental Impact Statement. Prepared by Anchor environmental L.L.C. and associated firms for Washington State Department of Ecology. October.
Ecology, 2003. Sampling and Analysis Plan Appendix, Guidance on the Development of Sediment Sampling and Analysis Plans Meeting the Requirements of the Sediment Management Standards (Chapter 173-204 WAC). Ecology Publication No. 03-09-043. April.
Ecology, 2004. Draft Public Participation Plan, I&J Waterway Site, Bellingham, Washington. Prepared by Washington State Department of Ecology. October.
ThermoRetec, 2001a. Results of Phase 2 Sediment Sampling at the Olivine Site. Prepared for the Port of Bellingham. Seattle, Washington. January.
ThermoRetec, 2001b. Remedial Investigation and Feasibility Study, Roeder Avenue Landfill. Prepared for the Port of Bellingham. Seattle, Washington. October.
Washington State Department of Ecology, 1995. Sediment Management Standards: Chapter 173-204 WAC. Revised December.
Washington State Department of Ecology, 1997. Developing Health-based Sediment Quality Criteria for Cleanup Sites: A Case Study Report. Ecology Publication No. 97-114. December.

Appendix A Sediment Sampling and Analysis Plan and Quality Assurance/ Quality Control Plan I & J Waterway Sediments RI/FS Bellingham, Washington Prepared by: The RETEC Group, Inc. 1011 SW Klickitat Way, Suite 207 Seattle, WA 98134-1162 RETEC Project Number: PORTB-18449-100 Prepared for: Port of Bellingham 1801 Roeder Avenue Bellingham, Washington 98225 July 27, 2005
F:\PROJECTS\DOCS\8448\DOCS\Work Plan\App A\I&J SAP-7-27-05.doc
Sediment Sampling and Analysis Plan and Quality Assurance/ Quality Control Plan I & J Waterway Sediments RI/FS Bellingham, Washington Prepared by: The RETEC Group, Inc. 1011 SW Klickitat Way, Suite 207 Seattle, WA 98134-1162 RETEC Project Number: PORTB-18449-100 Prepared for: Port of Bellingham 1801 Roeder Avenue Bellingham, Washington 98225 Prepared by: _____________________________________________________ Daniel J. Berlin, Environmental Scientist Reviewed by: _____________________________________________________ Mark Larsen, Senior Project Manager
July 27, 2005

Table of Contents
PORTB-18449-100 iii
1 Introduction.................................................................................................... 1-1 1.1 Purpose............................................................................................... 1-1 1.2 Investigation Areas and Tasks ........................................................... 1-1
2 Sediment Sample Collection.......................................................................... 2-1 2.1 Navigation, Positioning, and Location Control ................................. 2-1 2.2 Surface Sediment Sampling............................................................... 2-2
2.2.1 Sample Nomenclature............................................................ 2-2 2.2.2 Surface Sample Collection..................................................... 2-3 2.2.3 Sample Processing ................................................................. 2-4 2.2.4 Grain Size Rapid Wet Sieving ............................................... 2-5
2.3 Reference Sample Collection............................................................. 2-6 2.4 Chemistry Analysis Methods............................................................. 2-7 2.5 Bioassay Testing Methods ................................................................. 2-7
2.5.1 Species Selection ................................................................... 2-8 2.5.2 Procedures.............................................................................. 2-8 2.5.3 Negative Controls .................................................................. 2-9 2.5.4 Reference Sediment ............................................................... 2-9 2.5.5 Replication ........................................................................... 2-10 2.5.6 Positive Controls.................................................................. 2-10 2.5.7 Water Quality Monitoring.................................................... 2-10
3 Decontamination Procedures ......................................................................... 3-1 3.1 Sampling Equipment.......................................................................... 3-1 3.2 Personnel............................................................................................ 3-2 3.3 Sediment Sampling Equipment.......................................................... 3-2
4 Project Organization and Responsibilities ..................................................... 4-1 4.1 Project Team ...................................................................................... 4-1 4.2 Special Training Requirements/Certification .................................... 4-3
5 Quality Assurance/Quality Control Plan ....................................................... 5-1 5.1 Field QA/QC Protocol and Record Keeping ..................................... 5-1
5.1.1 Documentation....................................................................... 5-1 5.1.2 Sample Chain of Custody ...................................................... 5-1 5.1.3 Location Control .................................................................... 5-1
5.2 Laboratory QA/QC Requirements ..................................................... 5-2 5.3 Chemical Data Validation.................................................................. 5-2 5.4 Bioassay Data Quality Review .......................................................... 5-3
6 Field Data Management and Reporting ......................................................... 6-1 6.1 Field Data Management..................................................................... 6-1 6.2 Field Data Evaluation ........................................................................ 6-1 6.3 Corrective Actions ............................................................................. 6-2 6.4 Field Sampling Quality Control Report and Schedule ...................... 6-2
7 References...................................................................................................... 7-1
List of Tables
PORTB-18449-100 iv
Table 2-1 Proposed Sampling Locations Table 2-2 Analyte Categories, Analysis Methods, Holding Times, and Container
Requirements Daily Field Report Table 2-3 Sediment Chemical Analysis Methods, Target Detection Limits, and
Criteria for Analytic Sampling Table 2-4 Key for Physical Description of Sediment Samples Table 5-1 Method QA/QC Sample Frequencies for Analytical Sampling
List of Figures
PORTB-18449-100 v
Figure 1-1 Site Location Map Figure 1-2 Proposed I&J Waterway RI/FS Surface Sediment Sample Locations
List of Attachments
PORTB-18449-100 vi
Attachment A Standard Operating Procedures SOP 110 – Packing and Shipping Samples SOP 120 – Decontamination SOP 260 – Lake and Stream Sediment Sampling SOP 410 – Quality Assurance/Quality Control Data Validation Attachment B Field Forms
List of Acronyms
PORTB-18449-100 vii
CLP Contract Laboratory Program COC Chain of Custody CVAA Cold Vapor Atomic Absorption DGPS Differential Global Positioning System Ecology Washington State Department of Ecology EPA United States Environmental Protection Agency HSP Health and Safety Plan ICP Inductively-Coupled Plasma Emission Spectroscopy MDL Method Detection Limit MLLW Mean Lower Low Water MS/MSD Matrix spike/matrix spike duplicate MSS Marine Sampling Systems MTCA Model Toxics Control Act NAD North American Datum PSAMP Puget Sound Ambient Monitoring Program PSDDA Puget Sound Dredge Disposal Analysis PSEP Puget Sound Estuary Program QA/QC Quality Assurance/Quality Control QAPP Quality Assurance Project Plan RI/FS Remedial Investigation/Feasibility Study SAP Sampling and Analysis Plan SMARM Sediment Management Annual Review Meetings SMS Sediment Management Standards SQS Sediment Quality Standards TAD Total Acid Digestion TOC Total Organic Carbon VOCs Volatile Organic Compounds

PORTB-18449-100 1-1
1 Introduction 1.1 Purpose
This Sampling and Analysis Plan (SAP) summarizes the methods for field investigations to be performed during a remedial investigation and feasibility study (RI/FS) for sediments at the I & J Waterway Site (Site) in Bellingham, Washington. Figure 1-1 shows the Site location map. These methods will be used to implement the scope of work defined in the attached RI/FS Work Plan.
Expanding upon previous studies, the RI/FS investigations described in this document will define the areas and volumes of impacted sediments and will collect additional information needed to support the analysis of remedial alternatives for the Site. The RI/FS is being performed in compliance with the requirements of the Model Toxics Control Act (MTCA) and the Sediment Management Standards (SMS).
The field activities will be conducted by The RETEC Group, Inc. (RETEC), on behalf of the Port of Bellingham (Port). Field sampling activities are currently scheduled to begin in August 2005.
This document includes the elements of a sediment SAP and a quality assurance and quality control plan (QAPP) consistent with Sediment Management Standards (SMS) requirements contained in Washington Administrative Code (WAC) Chapter 173-204 (Ecology, 1995).
1.2 Investigation Areas and Tasks The RI/FS sediment investigations will be conducted in two phased events. The first phase will consist of surface grabs and bioassay testing as described in this document. The second phase will consist of subsurface coring and required biological testing as designated under PSDDA guidelines. The second phase of sampling is attached in a separate SAP in Appendix B. If the spatial extent of contamination has not been determined in the first phase of grabs, additional investigation may be necessary. Phasing of discrete tasks and laboratory analyses are described below. Locations of surface sediment sampling locations are depicted in Figure 1-2.
Surface Grab Sampling The spatial extent of contaminated sediments will be determined by collecting 13 surface grab samples (0-12 cm) located throughout the Site, including the inner waterway, outer waterway, and northwestern (opposite shore) boundaries. Surface grab samples will be analyzed for the chemical parameters listed below.
Chemical Analysis of Surface Grab Samples
Sediment Sampling and Analysis Plan and Quality Assurance/ Quality Control Plan – I & J Waterway Sediments RI/FS, Bellingham, Washington
PORTB-18449-100 1-2
Thirteen locations will be sampled by hydraulic van Veen. Sampling methods are described in Section 2 of this document.
The surface grabs will be analyzed for SMS chemical parameters, including semivolatile organics, metals (including nickel), total organic carbon (TOC), total sulfides, grain size, and total solids. If any surface samples should exceed SQS chemical criteria, those stations will be subjected to bioassay testing as will those determined by Ecology. Samples with nickel exceeding the PSDDA screening levels will also be tested for potential biological effects.
Bioassay Sampling At each of the grab sampling locations shown in Figure 1-2, additional volume will be collected and archived. These archived samples will be used to perform bioassays if exceedances of the chemical SQS criteria are detected or as determined by Ecology. These bioassays will be performed as described in Section 4 of this document.
Under SMS regulations, the interpretation of bioassay data requires the collection and analysis of clean reference sediment, similar in physical characteristics to the test sediments. One or more reference samples will be collected from Samish Bay a priori based on similar grain size and organic carbon content of site sediment. These samples will be analyzed for chemical parameters during the first phase of sample analysis, with bioassay testing to be conducted in parallel with the test samples as described above.
Subsurface Core Sampling A second phase of fieldwork will occur following establishment of the spatial extent of surface sediment contamination. The sediment sampling and analysis plan for subsurface cores is contained in Appendix B. The outlines of the preliminary dredged material management units developed for the RI/FS and used as the basis for the subsurface sampling effort are shown in Figure 1-2 for reference.
PORTB-18449-100 2-1
2 Sediment Sample Collection This section outlines the activities, procedures, and objectives for surface sediment sampling at the Site. Field activities will be conducted in accordance with the SAP. Surface sediment will be collected from each of the proposed locations provided on Figure 1-2. Table 2-1 lists the proposed station coordinates (in both state plane coordinates and latitude/longitude). Table 2-2 lists samples to be collected at each station and the associated chemical, biological, and physical analyses. These activities are discussed below.
Specific sampling equipment and methodology may change based on sediment characteristics and Site conditions. Modifications and/or deviations from the approved SAP will be documented in the summary report and revised RI/FS. Sampling and analysis will follow PSEP (PSEP, 1986, 1995, 1996a, 1996b, 1996c, 1996d).
2.1 Navigation, Positioning, and Location Control Positioning and navigation for sediment sample locations will be accomplished using a Real Time Kinematic (RTK) Differential Global Positioning System (DGPS) that allows sub-meter horizontal and vertical accuracy. For this project, a Trimble 4000 global positioning system (GPS) or similar device will be employed. The objectives for the sample station positioning require an accuracy of plus or minus 3 meters. To meet these requirements, the instrument calibration and quality control procedures described below will be followed.
The positioning system will be calibrated over a known location prior to the initiation of any field activities. Datum for all survey data will be reported under North American Datum 1983 (NAD83), Washington State Plane Coordinates (SPC), North 4601. National Geodetic Vertical Datum of 1929 (NGVD29) will be used as the vertical datum for survey data. Data deliverables will include latitude/longitude, northing/easting, and elevation, where applicable. Ecology’s SEDQUAL database is maintained in SPC in feet NAD83 North Zone and Geographic Information System (GIS) maps use latitude/longitude decimal degrees projected into NAD83 North Zone. Locations will likely be displayed in these formats. A previously established, land-surveyed DGPS benchmark located near the sampling area will be used prior to initiating field sampling and daily to check the system accuracy.
All samples will be collected within 20 feet of the proposed sample coordinates. If an adequate sample cannot be collected within this radius, the Field Team Leader (FTL) may choose to move 50 feet from the proposed sample coordinates without notifying the Project Manager (PM). The new
Sediment Sampling and Analysis Plan and Quality Assurance/ Quality Control Plan – I & J Waterway Sediments RI/FS, Bellingham, Washington
PORTB-18449-100 2-2
location must be moved laterally and remain equidistant from the current cleanup boundary. No sample will be collected outside of a 50-foot radius from the proposed sample coordinates without prior consent from the PM.
Vertical elevation will be determined for all sample locations and will be reported as depth to sediment ([DTS] mudline). When applicable, the DTS will be measured before and after each sampling event. Measurements will be taken by weighted tape and echo sounder. The incremented tape will be pulled taut from the bottom and measured to the nearest tenth of foot. These measurements will then be confirmed with an electronic echo sounder onboard the vessel. The echo sounder method determines depth by bouncing sound waves off the mud layer and back to a receiver. These readings will be correlated to mudline elevations in mean lower low water (MLLW) datum to the nearest 0.1 foot using tide measurements obtained for Bellingham Bay for each of the sampling dates and times.
2.2 Surface Sediment Sampling Surface sediment samples will be collected using a 0.1 square-meter stainless steel hydraulic van Veen sampler, operated by Marine Sampling Services (MSS). Surface sediment samples will be collected according to the procedures outlined in RETEC SOP 260 (Attachment A).
The surface sediment samples (0 to 12 centimeters [cm]) will be collected for the chemical, physical, and biological testing listed in Table 2-2. This table contains a list of analyte groups, along with analysis methods, holding times, preservatives, and container requirements. Table 2-3 provides a complete list of analytes measured as part of chemical analysis. Specific details on the sediment sampling procedures are described below. Visual classification of sediment samples will be according to the American Society for Testing and Materials (ASTM) standards listed in Table 2-4.
2.2.1 Sample Nomenclature Each sediment sample location will be assigned a unique 6-digit alpha-numeric label. This 6-digit system will facilitate the identification and tracking of each unique sample. The code will be divided into the following sets of character designations as follows:
� The first characters identify the study location: � IJW - I & J Waterway;
� The next characters identify the type of sample taken and will be separated from the study location symbol with a dash (-):
� SS – Surface Grab sample
Sediment Sampling and Analysis Plan and Quality Assurance/ Quality Control Plan – I & J Waterway Sediments RI/FS, Bellingham, Washington
PORTB-18449-100 2-3
� The final two characters identify a unique sample number according to location and will be separated from the previous characters by a dash (-):
� 01-13 - Sites in the I & J Waterway
� R1-R2 - Bioassay Reference Station samples
� Blind field duplicates will be identified as a unique sample location and/or sub-sample number (e.g., IJW-SS05-100)
An example ID for a surface grab at station 8 is “IJW-SS-08”.
2.2.2 Surface Sample Collection The R/V Nancy Anne, owned and operated by MSS, equipped with a modified hydraulic van Veen sampling device, will be used to collect surface sediment samples. Sampling locations will be approached at slow boat speeds with minimal wake to minimize disturbance of bottom sediments prior to sampling. Sediment samples will be handled carefully to minimize disturbance during collection and transportation to the laboratory.
The grab sampler will be lowered over the side of the boat from a cable wire at an approximate speed of 0.3 feet per second. When the sampler reaches the mudline, the cable will be drawn taut and DGPS measurements recorded. Each surface grab sample will be retrieved aboard the vessel and evaluated for the following acceptance criteria:
• Overlying water is present and has low turbidity; • Adequate penetration depth is achieved; • Sampler is not overfilled; • Sediment surface is undisturbed; and • No signs of winnowing or leaking from sampling device.
Grab samples not meeting these criteria will be rejected near the location of sample collection and steps repeated until criteria have been met. Deployments will be repeated within a 20-foot radius of the proposed sample location. If adequate penetration is not achieved after multiple attempts, less volume will be accepted and noted in the field notebook. Once accepted, overlying water will be siphoned off and a decontaminated stainless steel trowel, spoon, or equivalent, will be used to collect only the upper 12 cm of sediment from inside of the sampler without touching the sidewalls. The sampler will be decontaminated between stations and rinsed with Site water between grabs.

Sediment Sampling and Analysis Plan and Quality Assurance/ Quality Control Plan – I & J Waterway Sediments RI/FS, Bellingham, Washington
PORTB-18449-100 2-4
After sample collection, the following information will be recorded on the Field Log Sheet, Sediment Sampling Form, and/or the field notebook (Appendix B).
• Date, time, and name of person logging sample;
• Weather conditions;
• Sample location number and coordinates;
• Project designation;
• Depth of water at the location and surface elevation;
• Sediment penetration and depth;
• Sediment sample interval;
• Sample recovery; and
• Physical observations such as apparent grain size, color, odor, density, layering, anoxic contact, and presence of sheen, shells and/or debris.
2.2.3 Sample Processing Sulfide samples will be collected from discrete grabs prior to compositing to minimize potential loss of volatiles. Each sulfide sample jar must be completely filled with sediments followed by 2 milliliters (ml) of ZnAc added on top. In addition, the sample jar must be sealed with a Teflon-lined cap to ensure proper preservation of the sample.
Homogenized sediment will be spooned immediately into appropriate pre-cleaned, pre-labeled sample containers, placed in coolers filled with ice or equivalent, and maintained at 4 degrees centigrade (°C). Materials over 0.5-inch-diameter and debris will be omitted from the sample containers. Any material removed from the sediment will be noted on the field forms. Surface sediment samples will be submitted for chemical analysis and bioassay testing.
In addition to the location information collected in the field, sample logging of bulk samples will involve physical characterization in general accordance with the visual-manual description procedure (Method ASTM D-2488 modified), details of which are provided in Table 2-4. Physical characterization includes the following:
Sediment Sampling and Analysis Plan and Quality Assurance/ Quality Control Plan – I & J Waterway Sediments RI/FS, Bellingham, Washington
PORTB-18449-100 2-5
• Grain size distribution;
• Density/consistency;
• Plasticity;
• Color and moisture content;
• Biological structures (e.g., shells, tubes, macrophytes, bioturbation);
• Presence of debris (e.g., woodchips or fibers, paint chips, concrete, sand blast grit, metal debris);
• Presence of oily sheen; and
• Odor (e.g., hydrogen sulfide).
This information will be recorded on the Sediment Sampling Forms (Attachment B).
Surface sediment samples collected for chemical and physical analysis will be packed and shipped to Analytical Resources, Inc. (ARI) in Tukwila, Washington, in accordance with RETEC SOP 110 (Attachment A). The surface sediment samples for bioassay analysis will be shipped under the same protocol to the bioassay laboratory, as appropriate.
2.2.4 Grain Size Rapid Wet Sieving This process separates the sediment sample into size fractions greater than 62.5 micrometers (µm) (i.e., sand and gravel) and less than 62.5 µm (i.e., silt and clay) for rapid classification of sand and silt/clay fractions. This process helps determine appropriate reference stations with similar grain size fractions (by volume) during field operations. This procedure requires a 62.5-µm sieve, a funnel with diameter slightly greater than that of the sieve frame, a 100-ml graduated cylinder, a squirt bottle, a supply of distilled water, and a bowl for collecting rinse water.
• Place a 62.5-µm (4-phi or 0.0025-inch mesh or #230 mesh size) sieve in a funnel, with a bowl underneath. Moisten the sieve using a light spray of distilled water.
• Place exactly 50 ml of sample in the 100-ml graduated cylinder, add 20 to 30 ml of distilled water, and stir to fluidize the sample.
Sediment Sampling and Analysis Plan and Quality Assurance/ Quality Control Plan – I & J Waterway Sediments RI/FS, Bellingham, Washington
PORTB-18449-100 2-6
• Pour the sample into the sieve and thoroughly rinse any residue from the 100-ml graduated cylinder and stir into the sieve.
• Wash the sediment on to the sieve with distilled water using a water pique or squirt bottle having low water pressure. Aggregates can be gently broken using a rubber policeman.
• Continue wet sieving until only clear water passes through the sieve. Take care to ensure that the rinsate does not exceed approximately 950 ml. This is accomplished by sieving an appropriate sample quantity (i.e., a sample volume that is not too large) and by efficient use of rinse water. Both of these techniques may require experimentation before routine wet sieving is started.
• Upon completion of sieving, carefully return the contents (i.e., sand and gravel fraction) of the sieve to the 100-ml graduated cylinder.
• Tap the graduated cylinder gently to settle the solid material.
• Read the volume of solid material from the scale on the side of the graduated cylinder and record the value. The fraction of sample with grain size greater than 62.5 µm is the ratio of the volume of material retained in the sieve to the original volume (50 ml).
2.3 Reference Sample Collection Toxicity testing requires that appropriate reference sediment be collected and tested with Site sediments. Concurrent test on reference sediment are conducted to control for possible sediment grain size effects on bioassay organisms. Bioassays will be run with reference sediment that is well matched to the test sediments for grain size and total organic carbon (TOC). One or more reference samples will be collected for bioassay analysis based on grain size and TOC content of Site samples.
Reference stations for bioassay testing are collected to analyze the response of the tests to sediments that are known to be unimpacted from chemical contamination. In addition, it is favorable to collect reference samples that have similar grain size distribution and TOC content as the sediment samples taken from the study area to assure that the reference stations are representative of the sediments in the study area. One reference station sample will be collected from Samish Bay, just south of Bellingham, in order to determine the response of bioassay test organisms to sediments of physical characteristics similar to those of the test sediments. Chemical testing will also be evaluated in the reference sediment to confirm test organism response is not due to chemical contamination.
Sediment Sampling and Analysis Plan and Quality Assurance/ Quality Control Plan – I & J Waterway Sediments RI/FS, Bellingham, Washington
PORTB-18449-100 2-7
2.4 Chemistry Analysis Methods Sediment samples will be analyzed according to PSEP as outlined in the following methods, listed in Table 2-2:
• VOCs: VOCs by US EPA Method 8260;
• SVOCs: SVOCs by United States Environmental Protection Agency (EPA) Method 8270;
• PCBs: EPA Method 8081;
• Metals: Various metals by EPA Methods 6010/7471;
• Conventional Parameters: Total solids, total volatile solids, TOC, total sulfides, and ammonia by PSEP methods;
• Bioassays: Infaunal Neanthes arenaceodentata 20-day infaunal growth test, Eohaustorius estuarius 10-day acute mortality test, and sediment larval test with Dendraster excentricus or Mytilus (edulis) galloprovincialis; and
• Grain Size: By PSEP methods.
2.5 Bioassay Testing Methods Marine bioassay testing species selection depends on grain size, salinity, and season in which testing will be performed. Based on the currently proposed project schedule, the following bioassay tests will likely be performed:
• Neanthes arenaceodentata (Los Angeles karyotype);
• Eohaustorius estuarius, Rhepoxynius abronius, or Ameplisca abdita; and
• Dendraster excentricus or Mytilus (edulis) galloprovincialis.
Bioassay testing will be performed according to PSEP guidelines (PSEP, 1995) by Vizon Scitec bioassay laboratory in Vancouver, British Columbia. Vizon Scitec is accredited by Ecology to perform each of the above testing procedures according to PSEP guidelines. If species substitutions are required due to the acceptability, availability, or other factors, such substitutions will be confirmed with Ecology prior to test initiation.
Sediment Sampling and Analysis Plan and Quality Assurance/ Quality Control Plan – I & J Waterway Sediments RI/FS, Bellingham, Washington
PORTB-18449-100 2-8
2.5.1 Species Selection
Amphipod Test The amphipod Rhepoxynius abronius has demonstrated sensitivity to high percent fines in sediments, particularly high clay content sediments, and has exhibited mortalities greater than 20 percent in clean, reference area sediments (DeWitt et al., 1988; Fox, 1993). Eohaustorius estuaries has also exhibited sensitivity to high clay content (>30%) despite being relatively insensitive to salinity changes and other effects of grain size. E. estuarius will be the preferred amphipod species unless clays are greater than 30 percent clay. A. abdita is relatively insensitive to grain size up to concentrations of fines greater than 60 percent (USACE, 2000). If clay is greater than 30% and fines are greater than 60 percent, A. abdita will be the preferred amphipod test species. If clay is more than 30% and fines are less than 60%, R. abronius will be used for testing.
Larval Test For the sediment larval test, adults must be collected in spawning condition or must be induced to spawn in the laboratory. Therefore, seasonality plays a role in selecting a test organism. The preferred species for larval testing is the sand dollar Dendraster excentricus. According to the Users Manual for the PSDDA program, D. excentricus spawns naturally in Puget Sound from April through December. Larvae of D. excentricus do not show an adverse response to increasing silt and clay fractions, and under conditions of expected high silts and clay, the sand dollar test is preferable (EPA, 1993). The bioassay laboratory has had success inducing spawning in D. excentricus, however, if spawning is unable to be induced, another species deemed acceptable for test sediments containing at least 60% fines is Mytilus (edulis) galloprovincialis. Although they spawn naturally in Puget Sound between March and July, (USACE, 2000), AMEC bioassay laboratory has had success inducing spawning in M. galloprovincialis.
Prior to initiating bioassay testing, sediment grain size and interstitial salinity will be determined to confirm selection of the appropriate test species. If there is headspace in the jars, nitrogen will be added prior to storage (PSEP, 1995).
2.5.2 Procedures
Amphipod Bioassay This test involves exposing the amphipod Rhepoxynius abronius to test sediment for ten (10) days and counting the surviving animals at the end of the exposure period. Daily emergence data and the number of amphipods failing to rebury at the end of the test will be recorded as well.
Sediment Sampling and Analysis Plan and Quality Assurance/ Quality Control Plan – I & J Waterway Sediments RI/FS, Bellingham, Washington
PORTB-18449-100 2-9
Sediment Larval Bioassay This test monitors larval development of a suitable echinoderm or bivalve species in the presence of test sediment. The test is run until the appropriate stage of development is achieved in a sacrificial seawater control (PSDDA MPR-Phase II, pp. 5-20). At the end of the test, larvae from each test sediment exposure are examined to quantify abnormality and mortality.
Initial counts will be made for a minimum of five 10-ml aliquots. Final counts for seawater control, reference sediment and test sediment will be made on 10-ml aliquots. The sediment larval bioassay has a variable endpoint (not necessarily 48 hours) that is determined by the developmental stage of organisms in a sacrificial seawater control (PSDDA MPR Phase II, page 5-20).
Ammonia and sulfides toxicity may interfere with test results for this bioassay. Aeration will be conducted throughout the test to minimize these effects.
Neanthes Growth Test This test utilizes the polychaete Neanthes arenaceodentata, in a 20-day growth test. The growth rate of organisms exposed to test sediments is compared to the growth rate of organisms exposed to a reference sediment.
2.5.3 Negative Controls Negative control sediments are used in the amphipod and Neanthes bioassays to check laboratory performance. Negative control sediments are clean sediments in which the test organism normally lives and which are expected to produce low mortality. The sediment larval test utilizes a negative seawater control rather than a control sediment. The negative control to be used for the sediment toxicity test will be a clean control (i.e., inert material with Site seawater) or native sediment where the organisms reside.
2.5.4 Reference Sediment Reference sediments will also be included with each bioassay. Reference sediments provide toxicity data that can be used to separate toxicant effects from unrelated effects, such as those of sediment grain size and total organic carbon. Bioassay testing requires that test sediments be matched and tested simultaneously with an appropriate Ecology-approved reference sediment to factor out sediment grain size effects on bioassay organisms.
One or more reference samples will be collected from Samish Bay or a similar reference site in Washington if substantially different grain sizes and organic carbon contents are encountered in the Site sediment samples. Reference sediments will be collected using a 0.1-square-meter stainless van Veen grab
Sediment Sampling and Analysis Plan and Quality Assurance/ Quality Control Plan – I & J Waterway Sediments RI/FS, Bellingham, Washington
PORTB-18449-100 2-10
sampler deployed by boat. Upon reaching the designated reference sediment location, a test grab sample will be collected and a subsample will be wet-sieved to determine grain size. If the grain size is not appropriate, the vessel position will be adjusted and another test grab will be collected. This procedure will be conducted until sediments with the proper grain size have been located. Multiple grab samples will then be taken until enough reference sediment is collected. A subsample of the final composite will be wet-sieved to verify the appropriate grain size.
Locations of reference station coordinates will be reported, with an accuracy of ± 3 meters. Reference sediment samples will also be tested for total solids, total volatile solids, total organic carbon, grain size, ammonia, and sulfides.
2.5.5 Replication Five laboratory replicates of test sediments, reference sediments, and negative controls will be run for each bioassay.
2.5.6 Positive Controls A positive control will be run for each bioassay. The positive control to be used for the sediment toxicity test will be a toxic control in which a reference toxicant is used to establish the relative sensitivity of the test organism. Cadmium chloride will be the positive control reference toxicant used for the amphipod and juvenile polychaete bioassays. Copper sulfate will be the positive control reference toxicant used for the bivalve larvae bioassay.
2.5.7 Water Quality Monitoring Bioassays require that proper water quality conditions be maintained to ensure survival of the organisms, and to ensure that undue stress is not exerted on the organisms unrelated to test sediments. Daily water quality measurements include salinity, temperature, pH, and dissolved oxygen for the amphipod and sediment larval tests. These measurements will be made every three days for the Neanthes bioassay. Ammonia and total sulfide concentrations in both porewater and overlying water will be measured at test initiation and termination for all three tests. Monitoring will be conducted for all test and reference sediments and negative controls (including seawater controls).
Parameter measurements must be within the limits specified for each bioassay. Interstitial salinity will be documented at test initiation for the amphipod bioassay. Measurements for each treatment will be made on a separate chemistry beaker set up to be identical to the other replicates within the treatment group, including the addition of test organisms.
PORTB-18449-100 3-1
3 Decontamination Procedures Decontamination is performed as a quality assurance measure and a safety precaution. It prevents cross contamination between samples and helps to maintain a clean working environment. The purpose of decontamination is to remove contaminated materials clinging to gloves, boots, equipment, and sample containers prior to their removal from the work area. Decontamination also includes the removal and disposal of contaminated clothing and gloves.
Decontamination is achieved mainly by rinsing with soap or detergent solutions, tap water, deionized water, methanol, dilute acids, or acetone. Equipment will be allowed to air dry after being cleaned. Decontamination will be accomplished between each sample collection station and/or depth.
The following is a list of supplies needed provide decontamination of equipment and personnel:
• Clean gloves – inner and outer;
• Cleaning liquids and dispensers: soap and/or a powdered detergent solution such as Alconox™, tap water, deionized water, and technical grade hexane;
• Waste storage containers: drums, boxes, and plastic bags;
• Plastic ground cover;
• Chemical-free paper towels;
• Cleaning containers: plastic or galvanized steel pans and buckets; and
• Cleaning brushes.
3.1 Sampling Equipment At a minimum, sampling equipment will be decontaminated prior to initial use and between sampling stations. Sampling equipment (i.e., spoons, bowls) decontaminated prior to field use will be wrapped in aluminum foil and stored in a sealed plastic bag to prevent contamination. Monitoring equipment (i.e., pH probe, tape measures) will be rinsed with distilled water and wiped dry with paper towels. Decontamination methods are detailed in RETEC SOP 120. Decontamination procedures include washing and scrubbing with an Alconox™ soap solution, rinsing with tap water, rinsing with distilled water, and air drying. If heavy, oily substances are found on sampling equipment, Simple Green™ or isopropanol will be used to clean the equipment. Cross
Sediment Sampling and Analysis Plan and Quality Assurance/ Quality Control Plan – I & J Waterway Sediments RI/FS, Bellingham, Washington
PORTB-18449-100 3-2
contamination will be minimized by sequencing sampling events from areas of suspected lower concentrations to areas suspected of relatively high concentrations, or from downstream to upstream locations as appropriate.
3.2 Personnel RETEC has performed prior to sampling at the Site. The current investigations will be conducted under Level D protection (disposable Tyvek™ coveralls, steel-toe boots, hardhat, and protective gloves). The following steps will be used for personnel decontamination when using Level D equipment:
1) Wash boots and outer gloves with brush and detergent water, then rinse twice with tap water.
2) Remove disposable Tyvek™ coveralls, then remove outer gloves and place both coveralls and gloves in a disposal container.
3) Wash and remove inner gloves.
4) Wash and rinse face and hands with potable water or waterless cleaner.
5) Shower and shampoo as soon as possible at end of each workday.
All field participants must follow procedures and guidelines contained in the Site-Specific Health and Safety Plan. They must recognize the Site health and safety hazards and the protocols required to minimize exposure to such hazards by signing the Acknowledgement Form before beginning work.
3.3 Sediment Sampling Equipment Equipment used to sample sediment that comes into contact with sediment will be decontaminated before collection of samples. The van Veen sampler will be decontaminated on site following methods outlined in RETEC SOP 120. The deck of the sampling vessel will be hosed down with site water in between sampling stations to minimize cross contamination and tracking of sediment to support zone areas.
PORTB-18449-100 4-1
4 Project Organization and Responsibilities The specific roles, activities, and responsibilities of project participants are summarized below. The Port of Bellingham has the primary responsibility for managing the work completed at the Site. The primary contact for the Port is Mike Stoner. RETEC is the primary consultant for the Port and is responsible for the activities associated with implementing the supplemental sampling. The daily management of the project will be completed by RETEC staff members including Mark Larsen (PM) and Dan Berlin.
4.1 Project Team The following additional personnel have been identified for the field investigation.
Field Team Leader The FTL, Nick Bacher, will support the PM. The FTL is responsible for implementing and coordinating the day-to-day activities of the field team, including health and safety in the field. The FTL will report directly to the PM and will:
• Implement field-related work plans and schedules;
• Coordinate and manage field staff;
• Implement QA/QC for technical data provided by the field staff including field-measurement data;
• Conduct peer reviews of the field performance and reporting products of field crews;
• Write and approve text and graphics required for field-team effort;
• Coordinate and oversee technical efforts of subcontractors assisting the field team;
• Identify problems at the field-team level, resolve issues in consultation with the PM, implement and document corrective action procedures, and communicate with team members and upper management; and
• Participate in preparation of the project deliverables.
The field technical staff will be utilized to mobilize equipment, obtain samples, and gather field data. All designated technical team members will be experienced professionals who possess the degree of specialization and

Sediment Sampling and Analysis Plan and Quality Assurance/ Quality Control Plan – I & J Waterway Sediments RI/FS, Bellingham, Washington
PORTB-18449-100 4-2
technical competence required to effectively and efficiently perform the required work.
Project Manager The PM, Dan Berlin, is responsible for ensuring completion of project objectives and Quality Assurance (QA) standards. The PM communicates with the Port and DNR and manages schedule, budget, and resources.
Quality Control Manager The Quality Control Manager (QCM), Jennifer Fetting, for this project will review and document project performance as it relates to the Work Plan. He will be supported by Anne Fitzpatrick, RETEC’s Technical Advisor for the project. As appropriate, the QCM will:
• Assist with laboratory coordination for scheduled analyses;
• Assure that the specified field, analytical, and data management procedures are followed and documented;
• Assess the precision, accuracy, and completeness of the data derived from the investigations;
• Schedule and oversee data validation; issue laboratory audit reports; retain laboratory audit records; and follow up on corrective actions; and
• Finalize electronic data deliverables (EDDs) and import data into the project database.
Health and Safety Officer The Office Health and Safety Officer will be responsible for the health and safety aspects of this project.
Subcontractors Local subcontractors will be used as appropriate and when available, without compromising quality, schedule, and cost.
Samples will be collected by RETEC. Chemical analyses of all media and physical analysis will be conducted by ARI, of Tukwila, Washington. Vizon Scitec of Vancouver, British Columbia, will be responsible for biological analysis. Individual laboratory QAPPs and SOPs for each laboratory are on file at RETEC.
MSS of Burley, Washington, under the direction of Bill Jaworski, will be responsible for the sediment collection for the investigation.
Sediment Sampling and Analysis Plan and Quality Assurance/ Quality Control Plan – I & J Waterway Sediments RI/FS, Bellingham, Washington
PORTB-18449-100 4-3
4.2 Special Training Requirements/Certification Specific training requirements for performing fieldwork at the Site are as follows:
• All field personnel assigned to the Site must have successfully completed 40 hours of training for hazardous site work in accordance with Occupational Safety and Health Administration (OSHA) 29 Code of Federal Regulations (CFR) 1910.120(e)(3) and be current with their 8-hour refresher training in accordance with OSHA 29 CFR 1910.120(e)(8). Documentation of OSHA training is required prior to personnel being permitted to work on Site.
• Personnel managing or supervising work on site will also have successfully completed 8 hours of manager/supervisor training meeting the requirements of OSHA 29 CFR 1910.120(e)(4).
• Personnel assigned to the site must be enrolled in a medical surveillance program meeting the requirements of OSHA 29 CFR 1910.120(f). Personnel must have successfully passed an occupational physical during the past 12 months and be medically cleared to work on a hazardous waste site and capable of wearing appropriate personal protective equipment (PPE) and respiratory protection as may be required.
• Personnel assigned to the site who must wear a respirator must be familiar with the OSHA respiratory standard (29 CFR 1910.134). Personnel who are required to wear respirator protection must have successfully passed a respirator fit test within the last 12 months.
It is the responsibility of the employing organization to provide their employees with the required training, medical monitoring, and fit testing prior to assigning them to work at this site. Each employing organization will be responsible for providing documentation of training, monitoring, and fit testing (with make/model of respirator) to the RETEC Project Manager and Field Team Leader prior to sending their employees to the site to work.
All field participants must follow procedures and guidelines contained in the Site-Specific Health and Safety Plan (HASP). The HASP will be completed and submitted to Ecology 30-days prior to initiation of field sampling. All participants in the sampling effort must recognize the site health and safety hazards and the protocols required to minimize exposure to such hazards by signing the Acknowledgement Form before beginning work.
PORTB-18449-100 5-1
5 Quality Assurance/Quality Control Plan To verify that the data produced during the sediment investigation are of sufficient quality, specific QA/QC requirements will be addressed by field personnel and the analytical laboratory. All laboratory data will be validated, as described below, prior to their use in project reporting.
5.1 Field QA/QC Protocol and Record Keeping Proper sample collection, identification, preservation, storage and handling procedures, and chain of custody records are necessary for sampling data to be valid and usable. Procedures for these steps are discussed in the previous sections of this sampling plan. The field sampling crew is also responsible for ensuring that the required QA/QC analyses are requested, as indicated in Table 5-1.
5.1.1 Documentation In addition to sample labels and chain of custody forms, a field logbook will be maintained by the field supervisor to provide a daily record of significant events. All entries will be signed and dated, made in nonerasable ink, and errors will be crossed out and initialed with a single line. The logbook will be kept as a permanent record. All field measurements will be recorded on the appropriate sampling log forms.
5.1.2 Sample Chain of Custody Samples are considered to be in one’s custody if they are: (1) in the custodian’s possession or view; (2) in a secured location (under lock) with restricted access; or (3) in a container that is secured with an official seal(s) such that the sample cannot be reached without breaking the seal(s). The principal documents used to identify samples and to document possession are chain of custody (COC) records, field logbooks, and field tracking forms. COC procedures will be used for all samples at all stages in the analytical or transfer process and for all data and data documentation, whether in hard copy or electronic format.
5.1.3 Location Control DGPS locations and sampling times will be recorded electronically and on the project sampling logs. The DGPS system will be checked using the control point established for the project at least once daily. Any variability of measurements will be recorded in the field logbook. Measurements of water depth will be repeated, with the depth measured to the nearest 0.1 foot. After tidal corrections, mudline elevations will be reported to the nearest 1.0 foot.
Sediment Sampling and Analysis Plan and Quality Assurance/ Quality Control Plan – I & J Waterway Sediments RI/FS, Bellingham, Washington
PORTB-18449-100 5-2
5.2 Laboratory QA/QC Requirements Sediment samples will be stored and analyzed in accordance with the holding time requirements of PSEP (Table 2-2). QA/QC samples will be performed in accordance with PSEP (1996d) and Table 5-1.
At a minimum, the laboratory will comply with the QA/QC requirements shown in Table 4-1. In addition, the analytical laboratory also has separate, instituted internal QA/QC plans. Analyses will be required to conform to accepted standard methods and rigorous internal QA/QC checks prior to final approval and reporting by the laboratory.
The analytical laboratory will provide data reports that will include a cover letter describing any problems or deviations from standard protocols, analytical results, and associated QA/QC materials. The laboratory will retain electronic data necessary to report chromatograms for each sample, mass spectra of detected target compounds, calibration summaries, appropriate sample information (weights, final volumes, and dilutions), and the results of the QC samples.
The final report will include QA2 deliverables, surrogate recoveries where appropriate, and sample chain of custody information (as required by Ecology for SEDQUAL database). Any QA problems (i.e., calibrations, internal standards) must be noted in the laboratory report narrative. Chemical data will be qualified in accordance with PSEP guidelines. The “J” qualifier will be applied to all concentrations that fall between the reporting detection limit (RDL), or practical quantitation limit (PQL) and the laboratory’s method detection limit (MDL). Dilution volumes, sample sizes, percent moisture, and surrogate recoveries will be presented on each summary sheet with the analytical results in the data packages. Similar information will also be assembled for each QC sample (method blanks, matrix spikes, etc.).
5.3 Chemical Data Validation RETEC will review all raw data to verify that the laboratory has supplied the required QA/QC deliverables. The data will then be validated against QA2 level review for acceptable inclusion into the regional SEDQUAL database. All data will be submitted to Ecology’s Sediment Management Unit in electronic SEDQUAL format prior to final approval of the report. The review will be performed using EPA CLP guidelines, RETEC SOP 410 (Appendix A), and methods specified in this SAP. QA review of conventional data will be performed using the Data Validation Guidance Manual by PSEP.
The review will evaluate the data for completeness, format, holding conditions, and laboratory QA sample results (e.g., blanks, matrix spikes).
Sediment Sampling and Analysis Plan and Quality Assurance/ Quality Control Plan – I & J Waterway Sediments RI/FS, Bellingham, Washington
PORTB-18449-100 5-3
The data validation will also include a review of surrogate recovery values for each of the organic samples. Data validation checklists will be prepared.
Where data fail criteria provided in the QA2 manual, the laboratory will be contacted, and the data will be: (1) reanalyzed, (2) qualified, or (3) discarded. Data quality issues will be summarized in a data validation report.
5.4 Bioassay Data Quality Review A review of the bioassay tests that will be conducted on surface sediment samples collected from Bellingham Bay is necessary to confirm that appropriate and thorough laboratory testing procedures and documentation procedures were followed. Bioassay test data should be compiled and reviewed for validity using the appropriate guidelines and directives set forth in this SAP, and data should be reported according to the established QA/QC procedures. The bioassay laboratory should document and provide an explanation of any exceptions to the established procedures. Overall data usability must be determined if any of the bioassay results are to be used in the decision-making process.
The data quality review will compare bioassay testing holding conditions, test setup, test implementation, and test termination to pertinent bioassay protocols. The review of test setup procedures includes reference sediment collection, organism procurement, number of organisms, number of replicates, volume of sediment, and general test initiation conditions. The review of test implementation includes an evaluation of standard parameters like the length of photoperiod, type of aeration, water replacement, and other daily monitoring variables, including the validity of test termination procedures. It also includes summaries of information pertinent to negative and positive control samples and reference sediment relative to requirements for test success.
The bioassay test validation is based on a RETEC Level II verification protocol. RETEC Level II data verification protocol is followed for preliminary site investigations or ongoing site monitoring events that do not require full documentation and data validation. With Level II data validation, the laboratory is entrusted to follow all internal quality control procedures (i.e., calibrations, performance checks) as directed in the analytical methods reported. A definitive assessment of analytical precision, accuracy, and completeness can be made.
Composited surface samples will be collected for both sediment chemistry analyses and bioassay tests. Samples for bioassay testing will be sent to Vizon Scitec for the following bulk sediment toxicity tests:
• Eohaustorius estuarius 10-day mortality;
Sediment Sampling and Analysis Plan and Quality Assurance/ Quality Control Plan – I & J Waterway Sediments RI/FS, Bellingham, Washington
PORTB-18449-100 5-4
• Neanthes arenaceodentata 20-day growth; and • Dendraster excentricus sediment larval test.
Checklists will be used during bioassay test validation to assess the acceptability of the following major test elements:
• Custody, preservation, and holding times; • Test setup; • Implementation, including test, control, and reference samples;
and • Reporting.
PORTB-18449-100 6-1
6 Field Data Management and Reporting
6.1 Field Data Management Field measurements and observations recorded in field notebooks, on field data forms, or on similar permanent records by field technicians are to become part of the permanent file. Field data is to be recorded directly and legibly in the notebooks or forms with all entries signed and dated.
Managerial documentation consists of:
• Data processing and storage records; • Sample identification and chain-of-custody records; • Field changes and variances; • Document control, inventory, and filing records; • QA/QC records; • Health and safety records; and • Financial and project tracking records.
6.2 Field Data Evaluation Initial responsibility for verification of accurate entries will lay with the field data logger. At the end of the sampling day, the data logger must sign and date the notebook. Data will then be verified by the FTL or PM, who will review all collected data to ensure that all pertinent information has been entered, and that correct codes and units have been used. The FTL will direct the field data logger to make any necessary corrections to the record and initial them.
After data are reduced into tables or arrays, the task managers will review data sets for anomalous values. Any inconsistencies will be resolved by seeking clarification from the field personnel responsible for data collection.
Managerial and technical data will be verified by the PM for reasonableness and completeness. Random checks of sampling and field conditions will be made by the task managers. The designated QA officer will review selected field data and procedures during random site visits to ensure adherence to the SAP and RETEC SOPs. Whenever possible, peer review will also be incorporated into the data evaluation process in order to maximize consistency among field personnel. All data evaluation will be verified by a dated signature.
The QA officer will monitor and audit performance of the QA procedures to assure that the project is performed in accordance with approved quality assurance procedures. The QA officer or authorized representative will
Sediment Sampling and Analysis Plan and Quality Assurance/ Quality Control Plan – I & J Waterway Sediments RI/FS, Bellingham, Washington
PORTB-18449-100 6-2
conduct audits to evaluate the execution of sample identification, field notebooks, and sampling procedures. The field audit program will have preventative maintenance procedures to ensure vital equipment is functioning properly. These procedures include cleaning/decontamination of equipment, daily visual inspection, and routine maintenance of parts depending on the type of equipment used.
6.3 Corrective Actions The purpose of the evaluation process is to qualify or eliminate field information or samples that were not collected or documented in accordance with specified protocols outlined in the SAP/SOP. The Field Team Leader will review the procedures being implemented in the field for consistency with the established protocols. Sample collection, preservation, labeling, etc., will be checked for completeness. Where procedures are not in compliance with the specified protocols, the deviations will be field documented and reported to the Task Manager. Corrective actions will be defined by the Field Team Leader and Task Manager and documented and implemented as appropriate.
6.4 Field Sampling Quality Control Report and Schedule At the end of the field investigations, a report will be prepared and submitted to the task manager. This report will include copies of the field notebook, Chain-of-Custody Forms, or any other pertinent field records. Any deviations from the SAP or SOPs that will result in a compromise of the project goals will be flagged and discussed in the report.

PORTB-18449-100 7-1
7 References ASTM D 2487, 1993. Standard Classification of Soils for Engineering Purposes
(Unified Soil Classification System). Prepared by ASTM Committee D-18.
ASTM D 2488, 1993. Standard Practice for Description and Identification of Soils (Visual-Manual Procedure). Prepared by ASTM Committee D-18.
DeWitt, T.H., G.R. Ditsworth, and R.C. Schwartz, 1988. Effects of Natural Sediment Features on Survival of the Phoxocepalid Amphipod, Rhepoxynius Abronius. Mar. Env. Res. 25:99-124.
Ecology, 1995. Washington State Sediment Management Standards, Chapter 173-204
Washington Administrative Code (WAC). Prepared by the Washington State Department of Ecology, Olympia, Washington. April.
Ecology, 1996. Washington State Model Toxics Control Act Cleanup Regulation, Chapter 173-340 Washington Administrative Code (WAC). Prepared by the Washington State Department of Ecology, Olympia, Washington. January.
PSDDA, 1996. Sediment Management Program Biennial Report: Dredging Years 1994/1995. Puget Sound Dredge Disposal Analysis Program and Sediment Management Program. March.
PSDDA, 2000. User’s Manual. Puget Sound Dredge Disposal Analysis Program. Revised February.
PSEP, 1986. Puget Sound Estuary Program: Recommended Protocols for Measuring Conventional Sediment Variables in Puget Sound. Prepared for U.S. Environmental Protection Agency, Region 10, and the Puget Sound Water Quality Authority. Puget Sound Water Quality Authority, Olympia, Washington.
PSEP, 1995. Puget Sound Estuary Program: Recommended Protocols for Conducting Laboratory Bioassays on Puget Sound Sediments. Prepared for U.S. Environmental Protection Agency, Region 10, and the Puget Sound Water Quality Authority. Puget Sound Water Quality Authority, Olympia, Washington.
PSEP, 1996a. Puget Sound Estuary Program: Recommended Guidelines for Sampling Marine Sediment, Water Column, and Tissue in Puget Sound. Prepared for U.S. Environmental Protection Agency, Region 10, and the Puget Sound Water Quality Authority. Puget Sound Water Quality Authority, Olympia, Washington.
PSEP, 1996b. Puget Sound Estuary Program: Recommended Guidelines for Measuring Organic Compounds in Puget Sound Sediment and Tissue
Sediment Sampling and Analysis Plan and Quality Assurance/ Quality Control Plan – I & J Waterway Sediments RI/FS, Bellingham, Washington
PORTB-18449-100 7-2
Samples. Prepared for U.S. Environmental Protection Agency, Region 10, and the Puget Sound Water Quality Authority. Puget Sound Water Quality Authority, Olympia, Washington.
PSEP, 1996c. Puget Sound Estuary Program: Recommended Protocols for Measuring Metals in Puget Sound Sediment and Tissue Samples. Prepared for U.S. Environmental Protection Agency, Region 10, and the Puget Sound Water Quality Authority. Puget Sound Water Quality Authority, Olympia, Washington.
PTI Environmental Services, 1989 . Data Validation Guidance Manual for Selected Sediment Variables. Draft. Prepared for the Washington Department of Ecology. June.

Tables
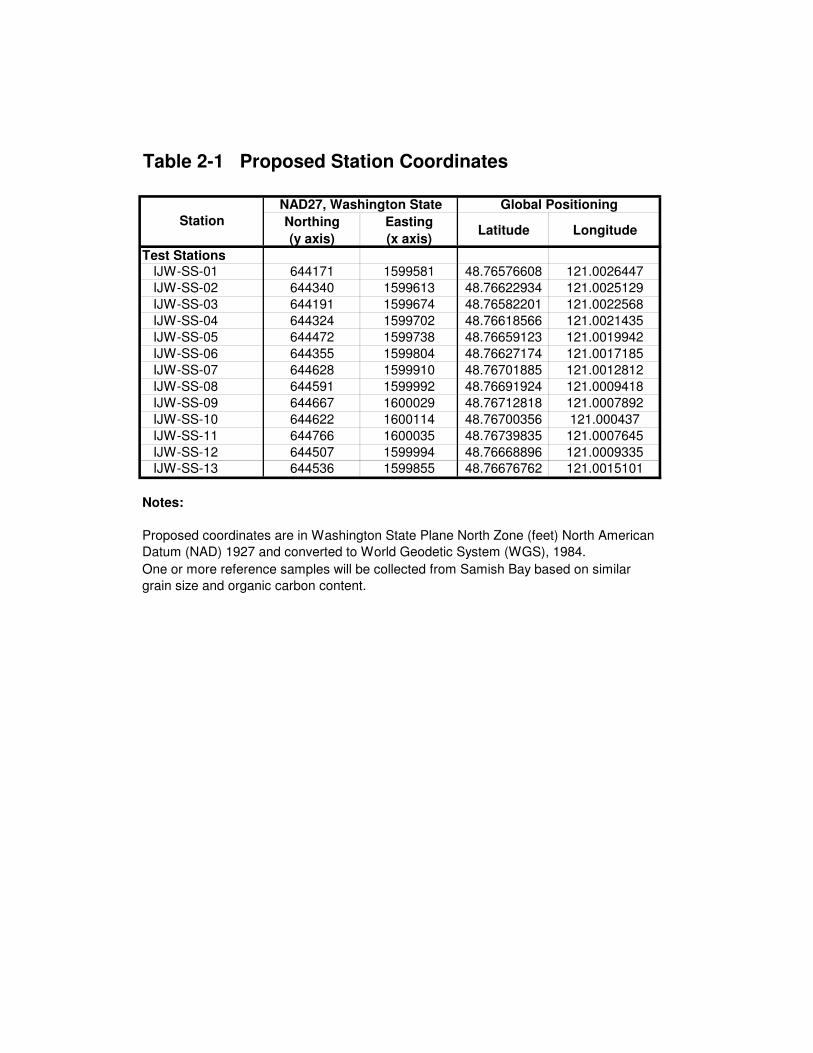
Northing (y axis)
Easting (x axis)
Latitude Longitude
Test StationsIJW-SS-01 644171 1599581 48.76576608 121.0026447IJW-SS-02 644340 1599613 48.76622934 121.0025129IJW-SS-03 644191 1599674 48.76582201 121.0022568IJW-SS-04 644324 1599702 48.76618566 121.0021435IJW-SS-05 644472 1599738 48.76659123 121.0019942IJW-SS-06 644355 1599804 48.76627174 121.0017185IJW-SS-07 644628 1599910 48.76701885 121.0012812IJW-SS-08 644591 1599992 48.76691924 121.0009418IJW-SS-09 644667 1600029 48.76712818 121.0007892IJW-SS-10 644622 1600114 48.76700356 121.000437IJW-SS-11 644766 1600035 48.76739835 121.0007645IJW-SS-12 644507 1599994 48.76668896 121.0009335IJW-SS-13 644536 1599855 48.76676762 121.0015101
Notes:
One or more reference samples will be collected from Samish Bay based on similar grain size and organic carbon content.
Proposed coordinates are in Washington State Plane North Zone (feet) North American Datum (NAD) 1927 and converted to World Geodetic System (WGS), 1984.
Table 2-1 Proposed Station Coordinates
StationNAD27, Washington State Global Positioning
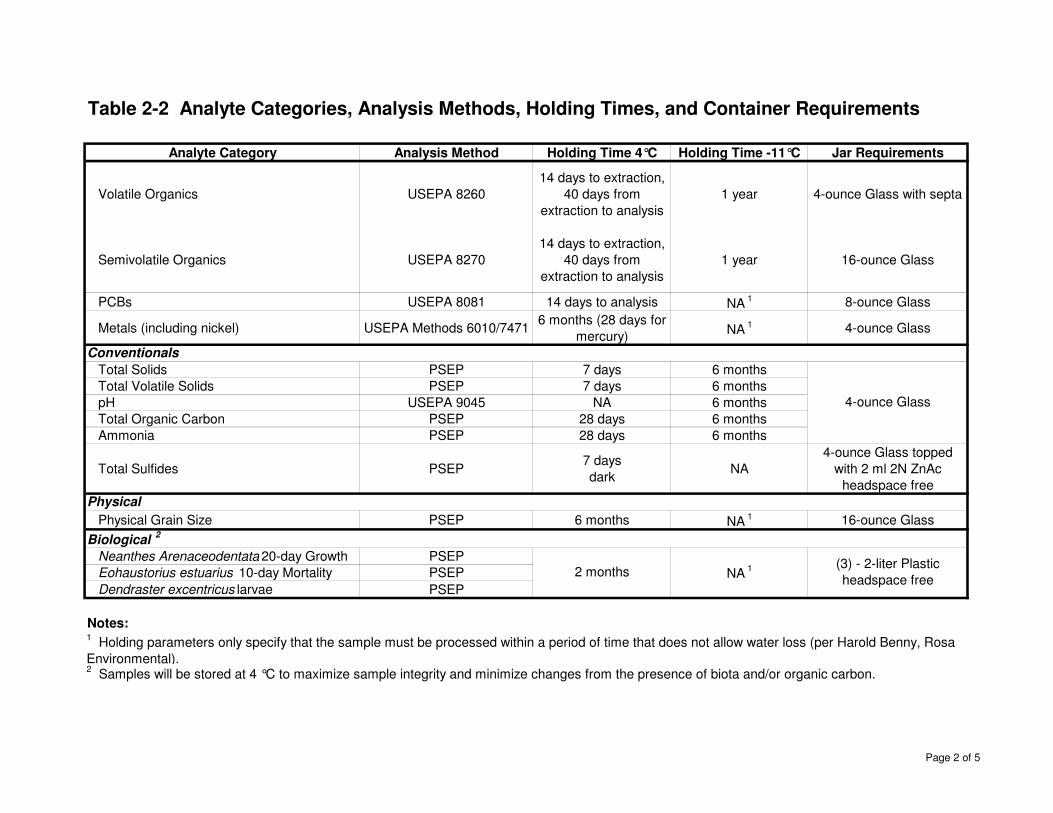
Table 2-2 Analyte Categories, Analysis Methods, Holding Times, and Container Requirements
Analyte Category Analysis Method Holding Time 4°C Holding Time -11°C Jar Requirements
Volatile Organics USEPA 826014 days to extraction,
40 days from extraction to analysis
1 year 4-ounce Glass with septa
Semivolatile Organics USEPA 827014 days to extraction,
40 days from extraction to analysis
1 year 16-ounce Glass
PCBs USEPA 8081 14 days to analysis NA 1 8-ounce Glass
Metals (including nickel) USEPA Methods 6010/7471 6 months (28 days for mercury) NA 1 4-ounce Glass
Total Solids PSEP 7 days 6 monthsTotal Volatile Solids PSEP 7 days 6 monthspH USEPA 9045 NA 6 monthsTotal Organic Carbon PSEP 28 days 6 monthsAmmonia PSEP 28 days 6 months
Total Sulfides PSEP7 daysdark NA
4-ounce Glass topped with 2 ml 2N ZnAc
headspace free
Physical Grain Size PSEP 6 months NA 1 16-ounce Glass
Neanthes Arenaceodentata 20-day Growth PSEPEohaustorius estuarius 10-day Mortality PSEPDendraster excentricus larvae PSEP
Notes:
4-ounce Glass
Conventionals
Physical
2 Samples will be stored at 4 °C to maximize sample integrity and minimize changes from the presence of biota and/or organic carbon.
1 Holding parameters only specify that the sample must be processed within a period of time that does not allow water loss (per Harold Benny, Rosa Environmental).
Biological 2
2 months NA 1 (3) - 2-liter Plastic headspace free
Page 2 of 5
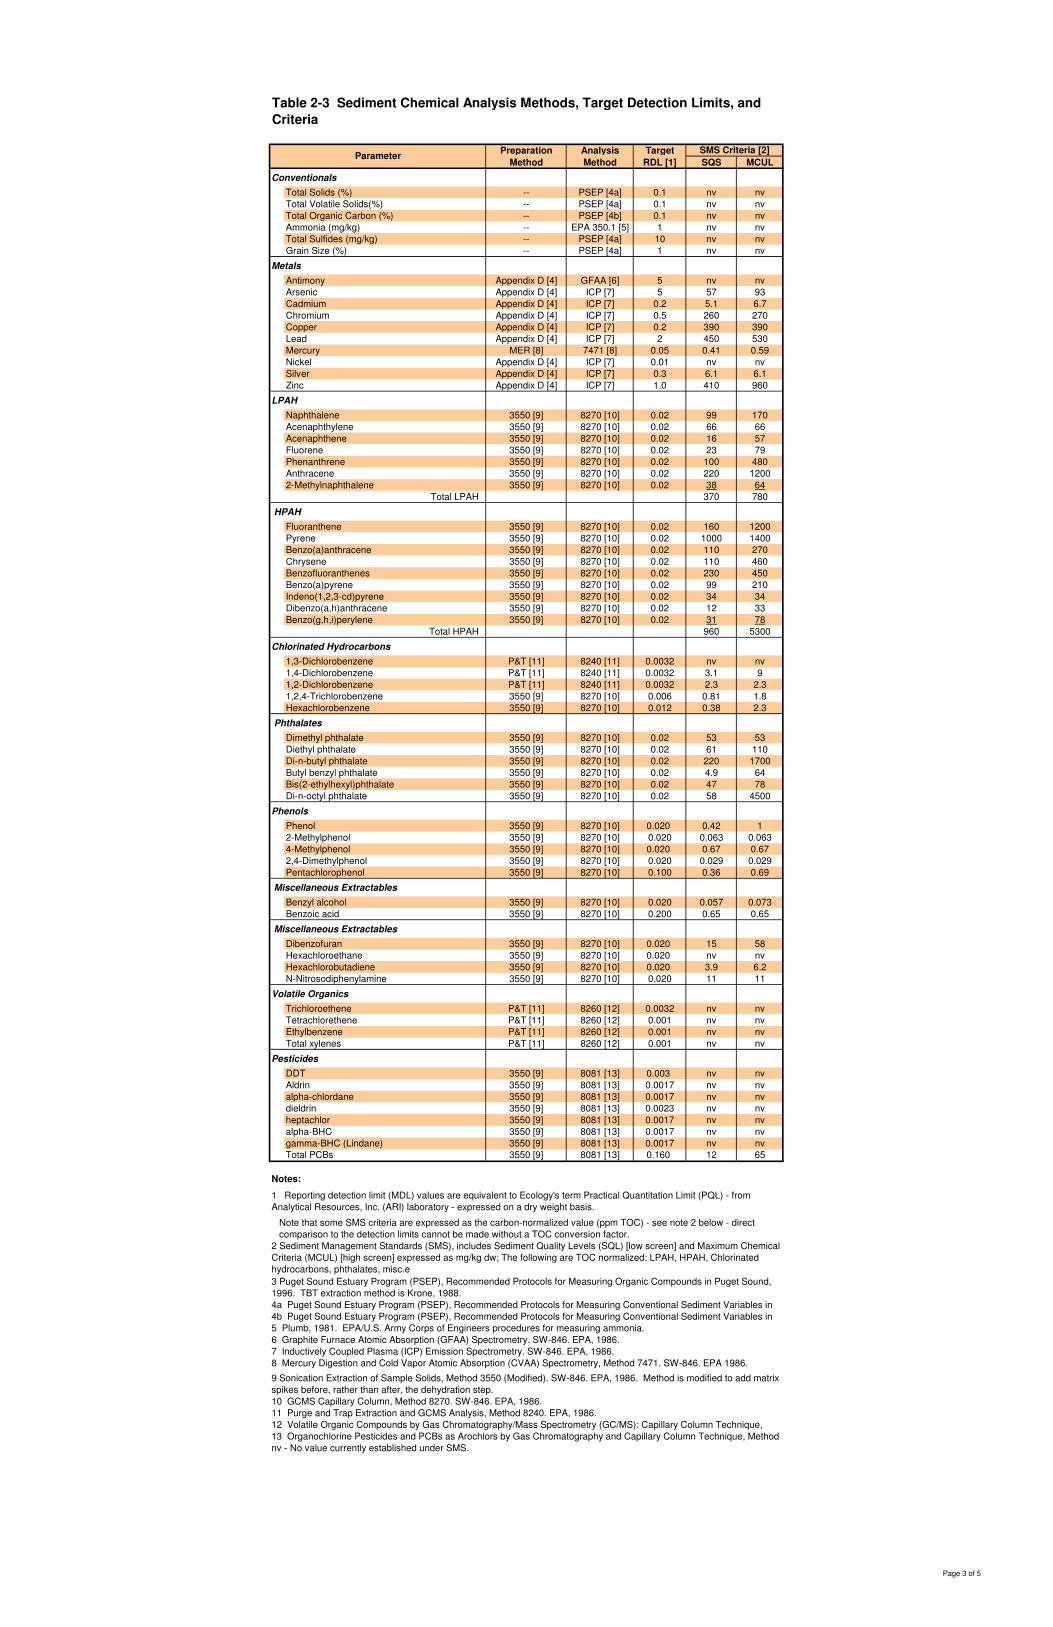
Preparation Analysis TargetMethod Method RDL [1] SQS MCUL
ConventionalsTotal Solids (%) -- PSEP [4a] 0.1 nv nvTotal Volatile Solids(%) -- PSEP [4a] 0.1 nv nvTotal Organic Carbon (%) -- PSEP [4b] 0.1 nv nvAmmonia (mg/kg) -- EPA 350.1 [5] 1 nv nvTotal Sulfides (mg/kg) -- PSEP [4a] 10 nv nvGrain Size (%) -- PSEP [4a] 1 nv nv
MetalsAntimony Appendix D [4] GFAA [6] 5 nv nvArsenic Appendix D [4] ICP [7] 5 57 93Cadmium Appendix D [4] ICP [7] 0.2 5.1 6.7Chromium Appendix D [4] ICP [7] 0.5 260 270Copper Appendix D [4] ICP [7] 0.2 390 390Lead Appendix D [4] ICP [7] 2 450 530Mercury MER [8] 7471 [8] 0.05 0.41 0.59Nickel Appendix D [4] ICP [7] 0.01 nv nvSilver Appendix D [4] ICP [7] 0.3 6.1 6.1Zinc Appendix D [4] ICP [7] 1.0 410 960
LPAH Naphthalene 3550 [9] 8270 [10] 0.02 99 170Acenaphthylene 3550 [9] 8270 [10] 0.02 66 66Acenaphthene 3550 [9] 8270 [10] 0.02 16 57Fluorene 3550 [9] 8270 [10] 0.02 23 79Phenanthrene 3550 [9] 8270 [10] 0.02 100 480Anthracene 3550 [9] 8270 [10] 0.02 220 12002-Methylnaphthalene 3550 [9] 8270 [10] 0.02 38 64
Total LPAH 370 780
HPAH Fluoranthene 3550 [9] 8270 [10] 0.02 160 1200Pyrene 3550 [9] 8270 [10] 0.02 1000 1400Benzo(a)anthracene 3550 [9] 8270 [10] 0.02 110 270Chrysene 3550 [9] 8270 [10] 0.02 110 460Benzofluoranthenes 3550 [9] 8270 [10] 0.02 230 450Benzo(a)pyrene 3550 [9] 8270 [10] 0.02 99 210Indeno(1,2,3-cd)pyrene 3550 [9] 8270 [10] 0.02 34 34Dibenzo(a,h)anthracene 3550 [9] 8270 [10] 0.02 12 33Benzo(g,h,i)perylene 3550 [9] 8270 [10] 0.02 31 78
Total HPAH 960 5300
Chlorinated Hydrocarbons 1,3-Dichlorobenzene P&T [11] 8240 [11] 0.0032 nv nv1,4-Dichlorobenzene P&T [11] 8240 [11] 0.0032 3.1 91,2-Dichlorobenzene P&T [11] 8240 [11] 0.0032 2.3 2.31,2,4-Trichlorobenzene 3550 [9] 8270 [10] 0.006 0.81 1.8Hexachlorobenzene 3550 [9] 8270 [10] 0.012 0.38 2.3
Phthalates Dimethyl phthalate 3550 [9] 8270 [10] 0.02 53 53Diethyl phthalate 3550 [9] 8270 [10] 0.02 61 110Di-n-butyl phthalate 3550 [9] 8270 [10] 0.02 220 1700Butyl benzyl phthalate 3550 [9] 8270 [10] 0.02 4.9 64Bis(2-ethylhexyl)phthalate 3550 [9] 8270 [10] 0.02 47 78Di-n-octyl phthalate 3550 [9] 8270 [10] 0.02 58 4500
Phenols Phenol 3550 [9] 8270 [10] 0.020 0.42 12-Methylphenol 3550 [9] 8270 [10] 0.020 0.063 0.0634-Methylphenol 3550 [9] 8270 [10] 0.020 0.67 0.672,4-Dimethylphenol 3550 [9] 8270 [10] 0.020 0.029 0.029Pentachlorophenol 3550 [9] 8270 [10] 0.100 0.36 0.69
Miscellaneous Extractables Benzyl alcohol 3550 [9] 8270 [10] 0.020 0.057 0.073Benzoic acid 3550 [9] 8270 [10] 0.200 0.65 0.65
Miscellaneous Extractables Dibenzofuran 3550 [9] 8270 [10] 0.020 15 58Hexachloroethane 3550 [9] 8270 [10] 0.020 nv nvHexachlorobutadiene 3550 [9] 8270 [10] 0.020 3.9 6.2N-Nitrosodiphenylamine 3550 [9] 8270 [10] 0.020 11 11
Volatile Organics Trichloroethene P&T [11] 8260 [12] 0.0032 nv nvTetrachlorethene P&T [11] 8260 [12] 0.001 nv nvEthylbenzene P&T [11] 8260 [12] 0.001 nv nvTotal xylenes P&T [11] 8260 [12] 0.001 nv nv
PesticidesDDT 3550 [9] 8081 [13] 0.003 nv nvAldrin 3550 [9] 8081 [13] 0.0017 nv nvalpha-chlordane 3550 [9] 8081 [13] 0.0017 nv nvdieldrin 3550 [9] 8081 [13] 0.0023 nv nvheptachlor 3550 [9] 8081 [13] 0.0017 nv nvalpha-BHC 3550 [9] 8081 [13] 0.0017 nv nvgamma-BHC (Lindane) 3550 [9] 8081 [13] 0.0017 nv nvTotal PCBs 3550 [9] 8081 [13] 0.160 12 65
Notes:
5 Plumb, 1981. EPA/U.S. Army Corps of Engineers procedures for measuring ammonia.6 Graphite Furnace Atomic Absorption (GFAA) Spectrometry. SW-846. EPA, 1986.7 Inductively Coupled Plasma (ICP) Emission Spectrometry. SW-846. EPA, 1986.8 Mercury Digestion and Cold Vapor Atomic Absorption (CVAA) Spectrometry, Method 7471. SW-846. EPA 1986.
10 GCMS Capillary Column, Method 8270. SW-846. EPA, 1986.11 Purge and Trap Extraction and GCMS Analysis, Method 8240. EPA, 1986.
nv - No value currently established under SMS.13 Organochlorine Pesticides and PCBs as Arochlors by Gas Chromatography and Capillary Column Technique, Method
4a Puget Sound Estuary Program (PSEP), Recommended Protocols for Measuring Conventional Sediment Variables in 4b Puget Sound Estuary Program (PSEP), Recommended Protocols for Measuring Conventional Sediment Variables in
9 Sonication Extraction of Sample Solids, Method 3550 (Modified). SW-846. EPA, 1986. Method is modified to add matrix spikes before, rather than after, the dehydration step.
12 Volatile Organic Compounds by Gas Chromatography/Mass Spectrometry (GC/MS): Capillary Column Technique,
2 Sediment Management Standards (SMS), includes Sediment Quality Levels (SQL) [low screen] and Maximum Chemical Criteria (MCUL) [high screen] expressed as mg/kg dw; The following are TOC normalized: LPAH, HPAH, Chlorinated hydrocarbons, phthalates, misc.e3 Puget Sound Estuary Program (PSEP), Recommended Protocols for Measuring Organic Compounds in Puget Sound, 1996. TBT extraction method is Krone, 1988.
Table 2-3 Sediment Chemical Analysis Methods, Target Detection Limits, and Criteria
1 Reporting detection limit (MDL) values are equivalent to Ecology's term Practical Quantitation Limit (PQL) - from Analytical Resources, Inc. (ARI) laboratory - expressed on a dry weight basis.
Note that some SMS criteria are expressed as the carbon-normalized value (ppm TOC) - see note 2 below - direct comparison to the detection limits cannot be made without a TOC conversion factor.
SMS Criteria [2]Parameter
Page 3 of 5
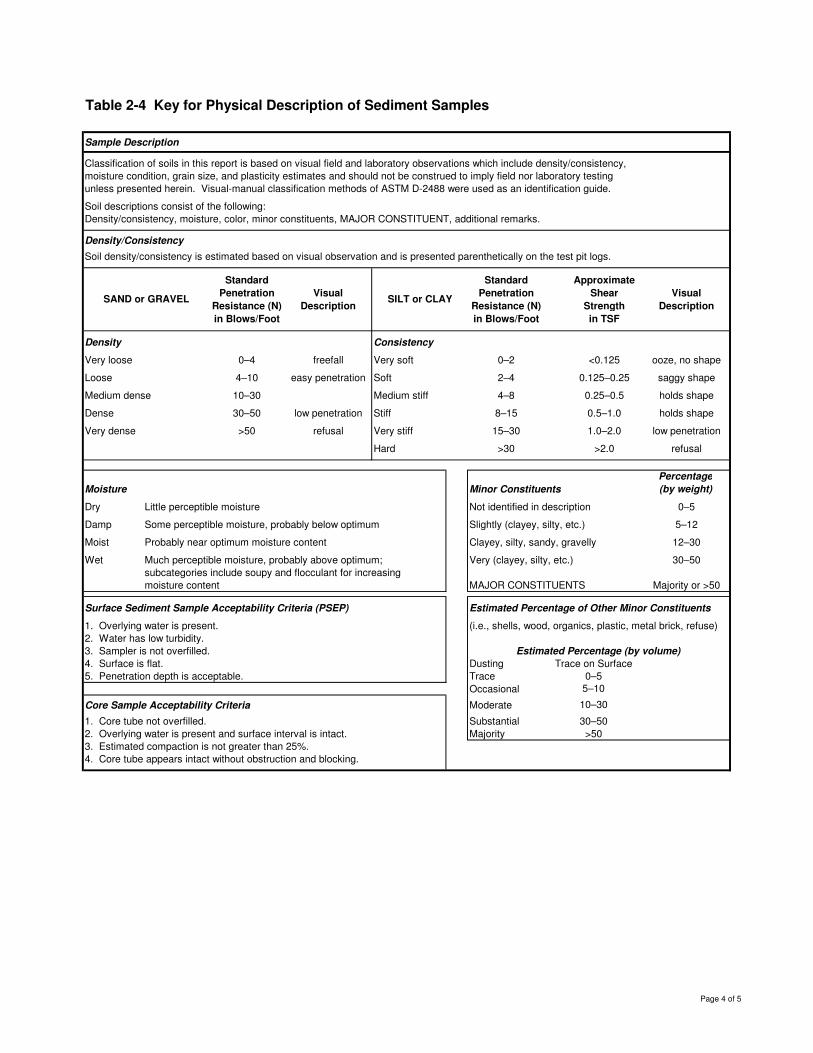
Table 2-4 Key for Physical Description of Sediment Samples
Sample Description
Classification of soils in this report is based on visual field and laboratory observations which include density/consistency,moisture condition, grain size, and plasticity estimates and should not be construed to imply field nor laboratory testingunless presented herein. Visual-manual classification methods of ASTM D-2488 were used as an identification guide.
Soil descriptions consist of the following:Density/consistency, moisture, color, minor constituents, MAJOR CONSTITUENT, additional remarks.
Density/Consistency
Soil density/consistency is estimated based on visual observation and is presented parenthetically on the test pit logs.
Standard Penetration
Resistance (N) in Blows/Foot
Visual Description
Standard Penetration
Resistance (N) in Blows/Foot
Approximate Shear
Strength in TSF
Visual Description
Density Consistency
Very loose 0–4 freefall Very soft 0–2 <0.125 ooze, no shape
Loose 4–10 easy penetration Soft 2–4 0.125–0.25 saggy shape
Medium dense 10–30 Medium stiff 4–8 0.25–0.5 holds shape
Dense 30–50 low penetration Stiff 8–15 0.5–1.0 holds shape
Very dense >50 refusal Very stiff 15–30 1.0–2.0 low penetration
Hard >30 >2.0 refusal
Moisture Minor ConstituentsPercentage(by weight)
Dry Little perceptible moisture Not identified in description 0–5
Damp Some perceptible moisture, probably below optimum Slightly (clayey, silty, etc.) 5–12
Moist Probably near optimum moisture content Clayey, silty, sandy, gravelly 12–30
Wet Much perceptible moisture, probably above optimum; Very (clayey, silty, etc.) 30–50subcategories include soupy and flocculant for increasingmoisture content MAJOR CONSTITUENTS Majority or >50
Surface Sediment Sample Acceptability Criteria (PSEP) Estimated Percentage of Other Minor Constituents
1. Overlying water is present. (i.e., shells, wood, organics, plastic, metal brick, refuse)2. Water has low turbidity.3. Sampler is not overfilled.4. Surface is flat. Dusting5. Penetration depth is acceptable. Trace
Occasional
Core Sample Acceptability Criteria Moderate
1. Core tube not overfilled. Substantial2. Overlying water is present and surface interval is intact. Majority3. Estimated compaction is not greater than 25%.4. Core tube appears intact without obstruction and blocking.
SAND or GRAVEL SILT or CLAY
Estimated Percentage (by volume)Trace on Surface
5–10
30–50>50
0–5
10–30
Page 4 of 5
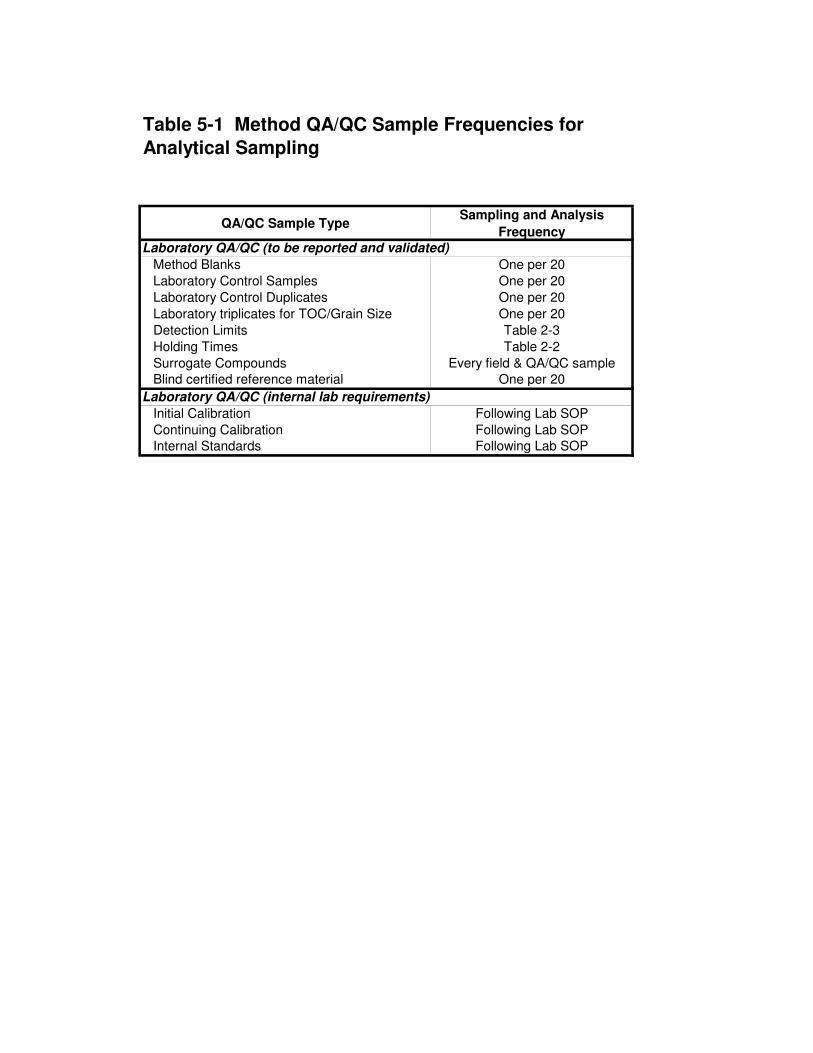
QA/QC Sample TypeSampling and Analysis
Frequency
Method Blanks One per 20Laboratory Control Samples One per 20Laboratory Control Duplicates One per 20Laboratory triplicates for TOC/Grain Size One per 20Detection Limits Table 2-3Holding Times Table 2-2Surrogate Compounds Every field & QA/QC sampleBlind certified reference material One per 20
Initial Calibration Following Lab SOPContinuing Calibration Following Lab SOPInternal Standards Following Lab SOP
Laboratory QA/QC (to be reported and validated)
Laboratory QA/QC (internal lab requirements)
Table 5-1 Method QA/QC Sample Frequencies for Analytical Sampling

Figures

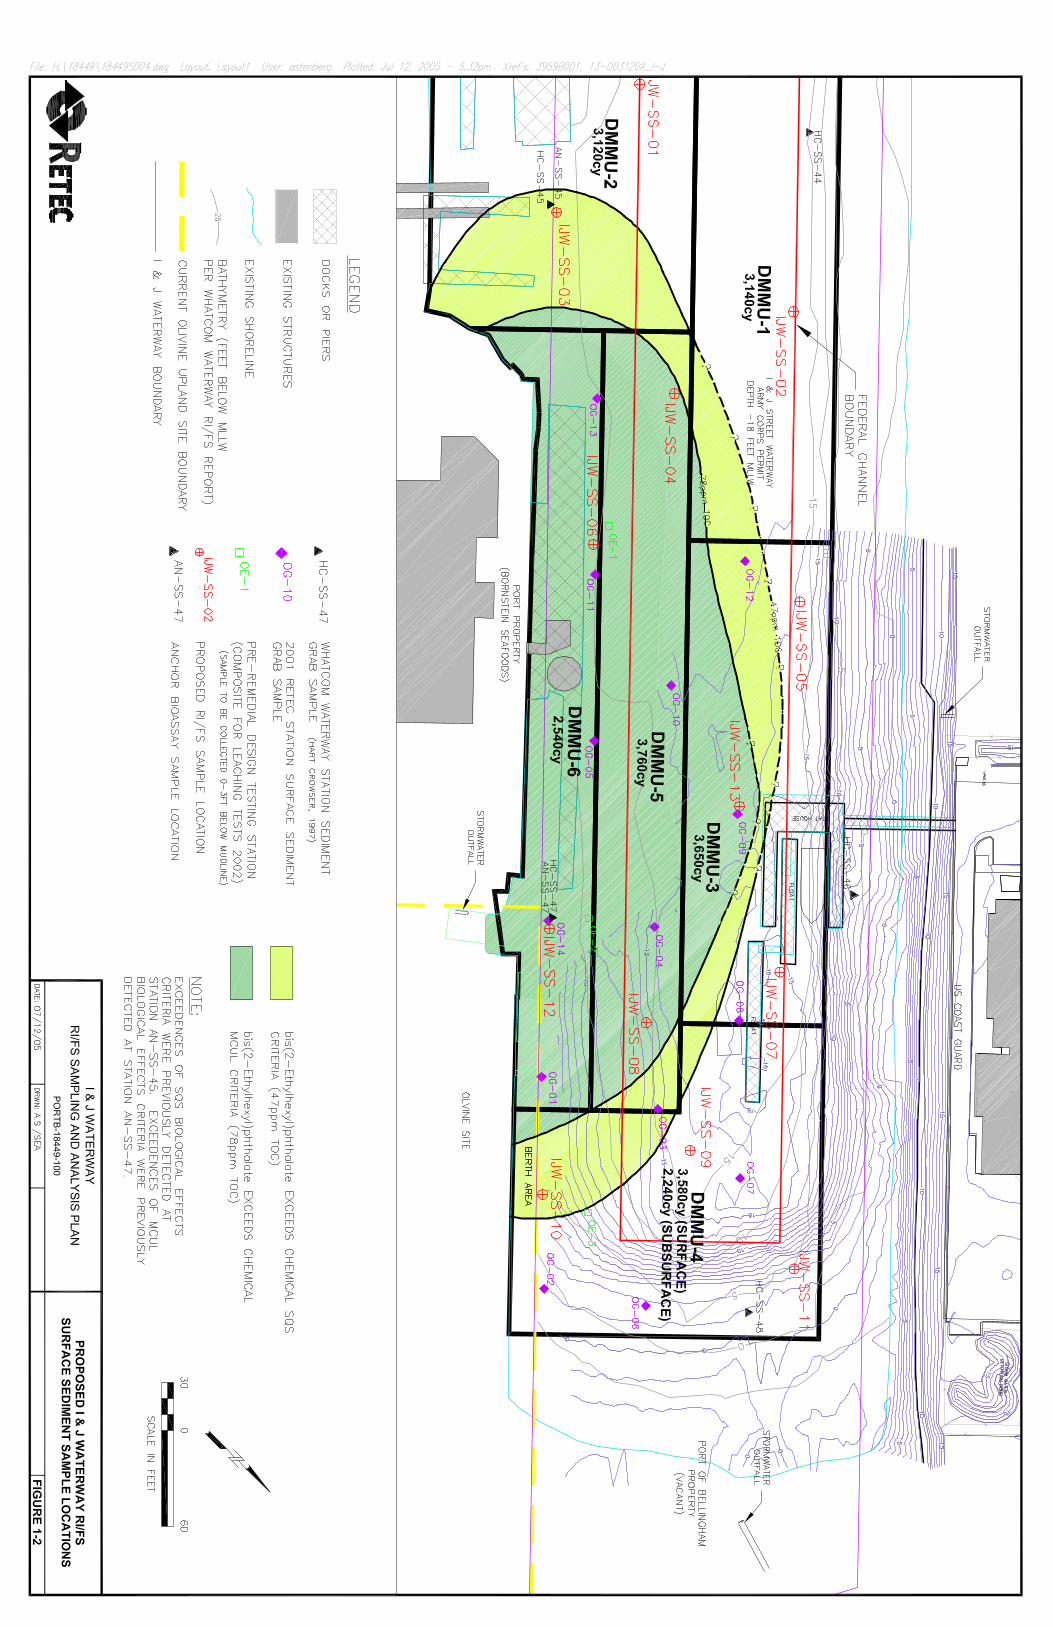
Attachment A
Standard Operating Procedures
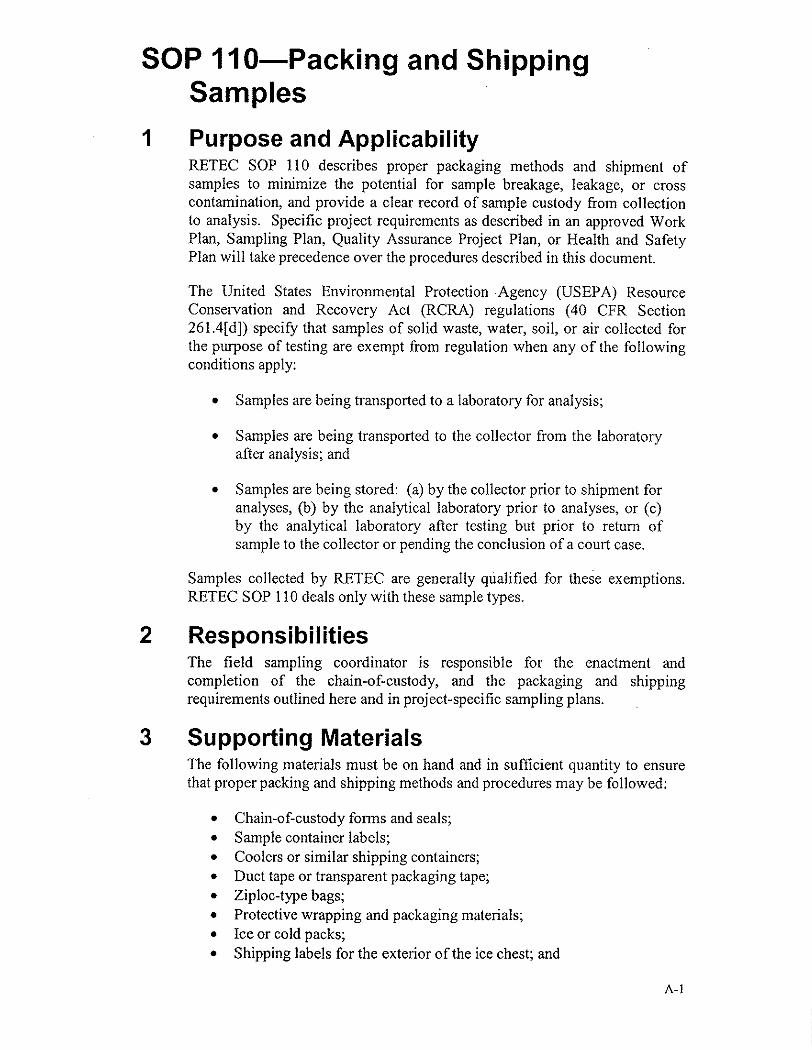
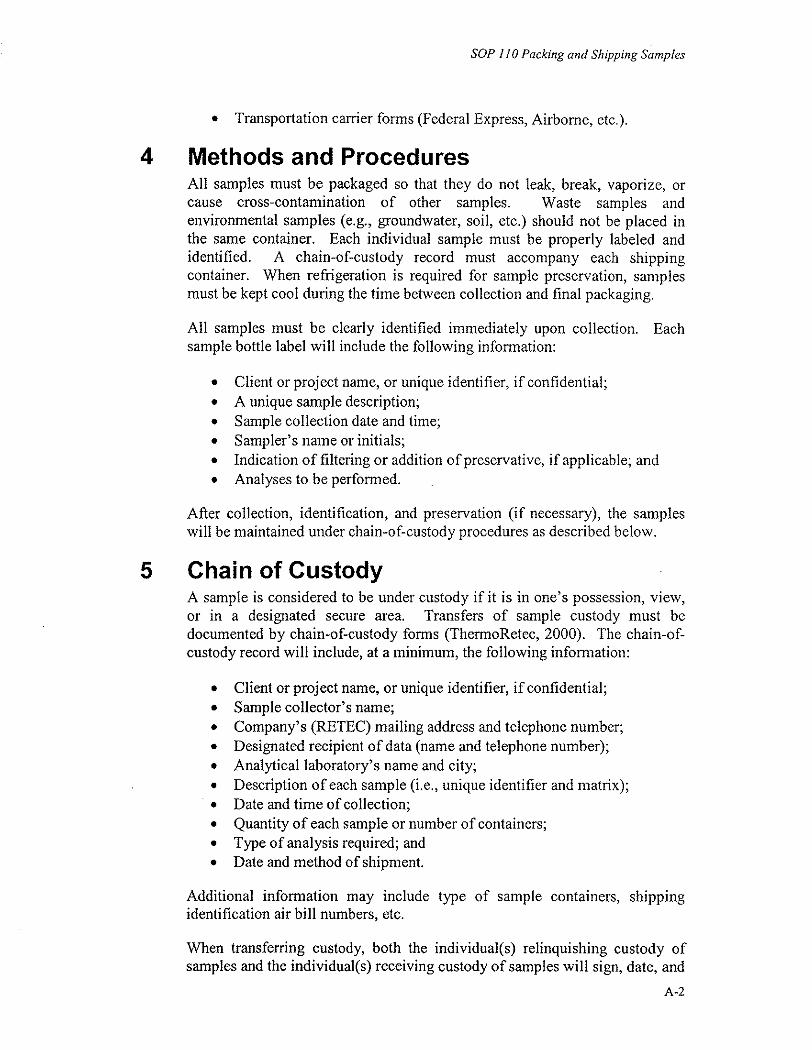
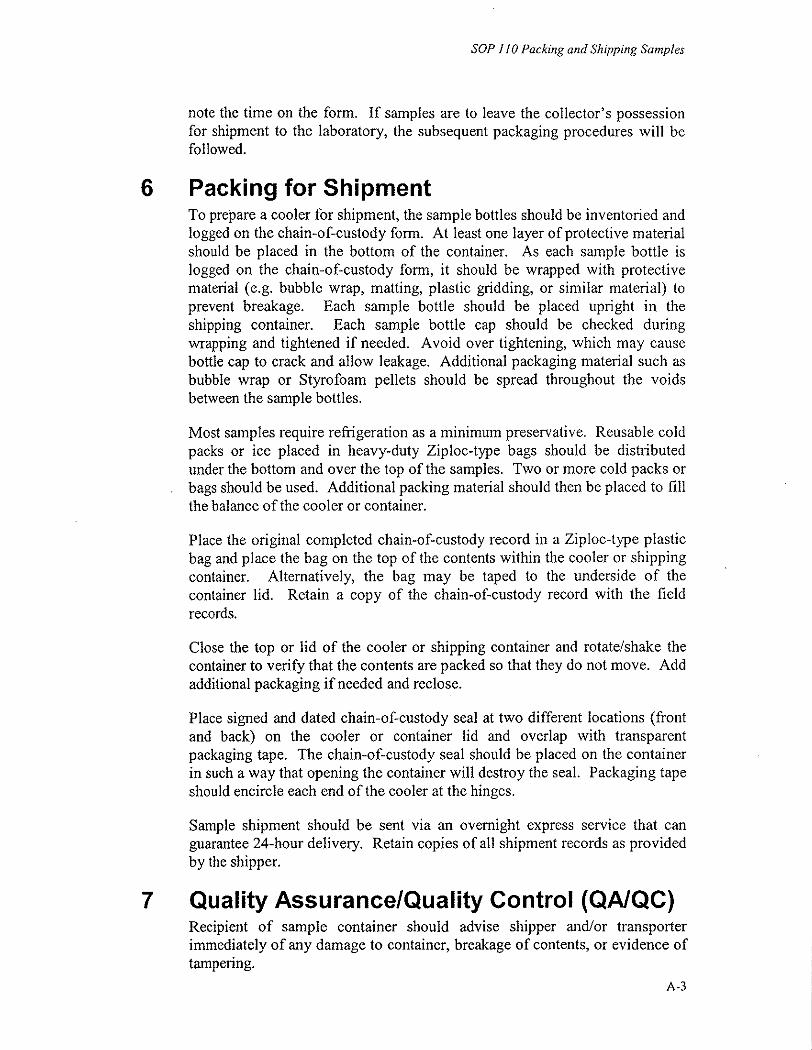
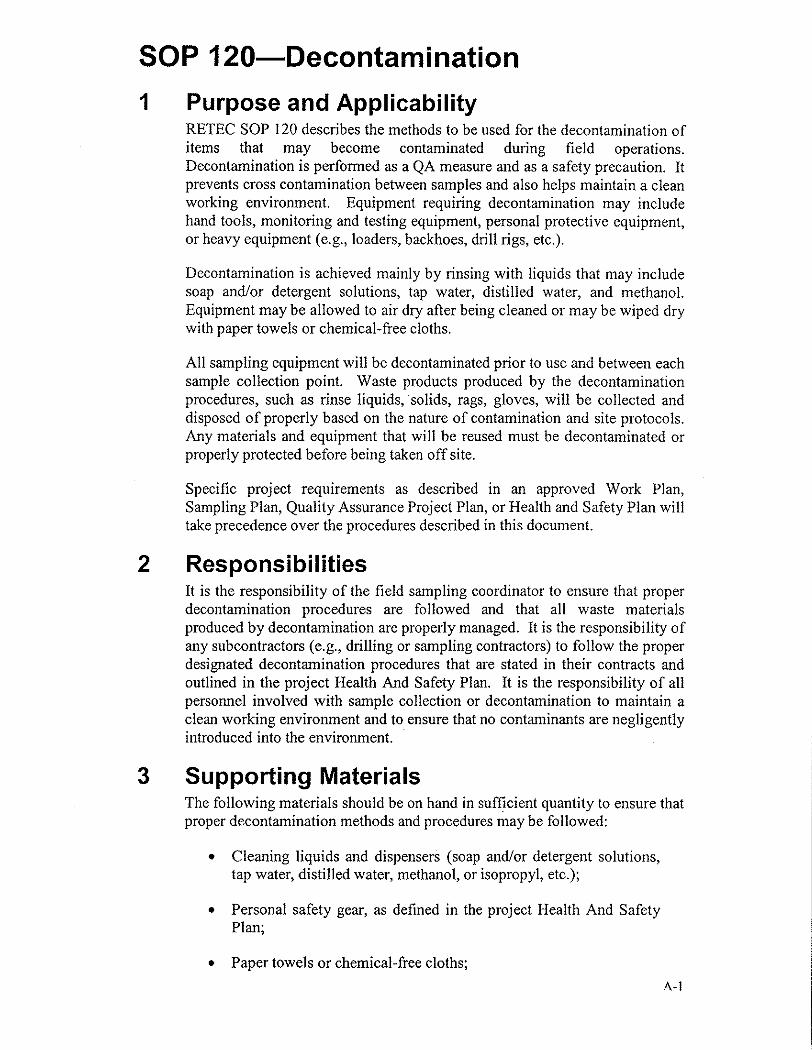
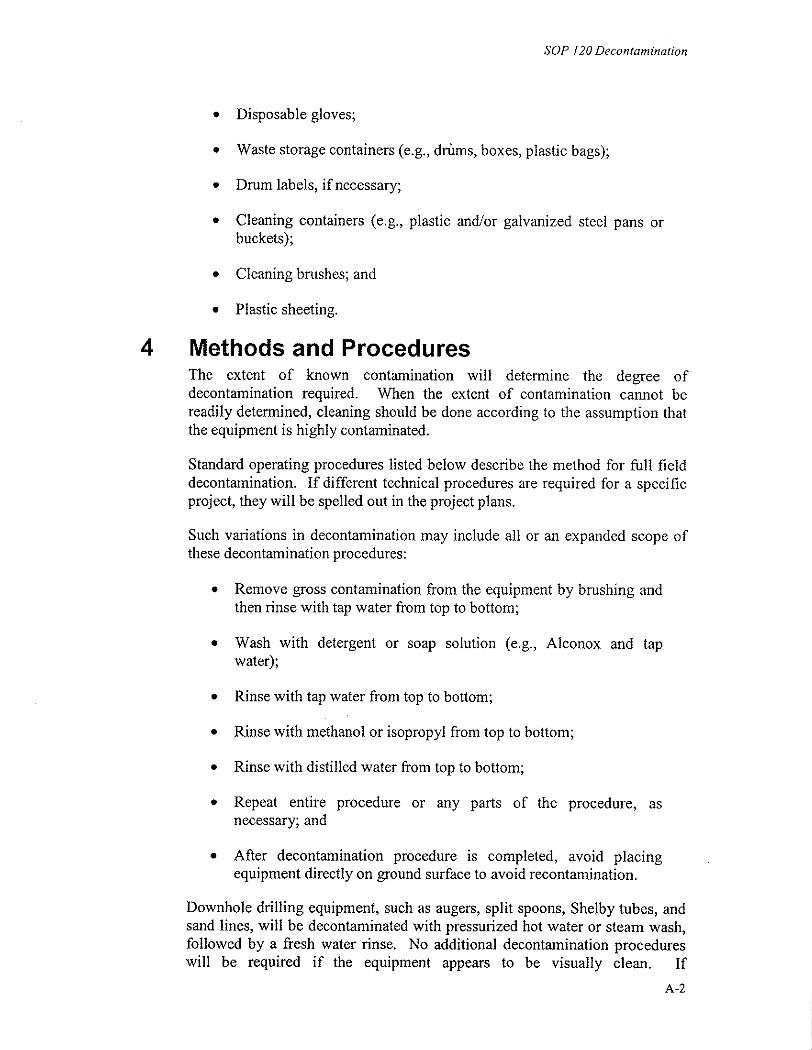
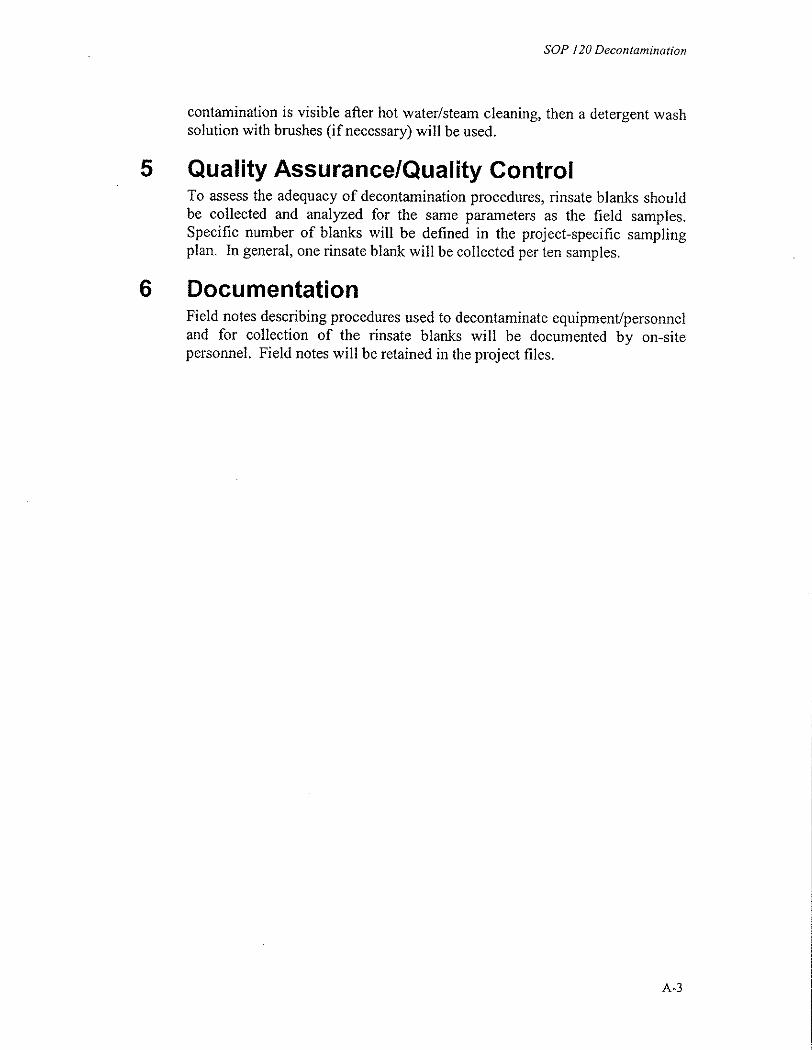
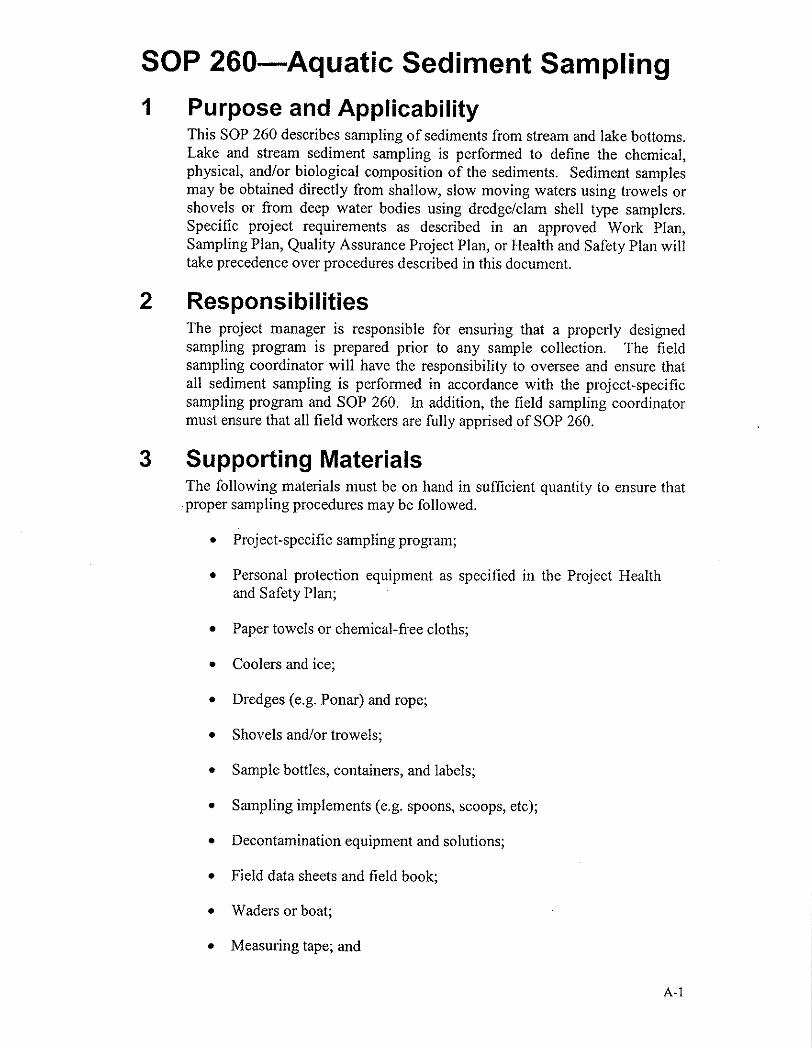
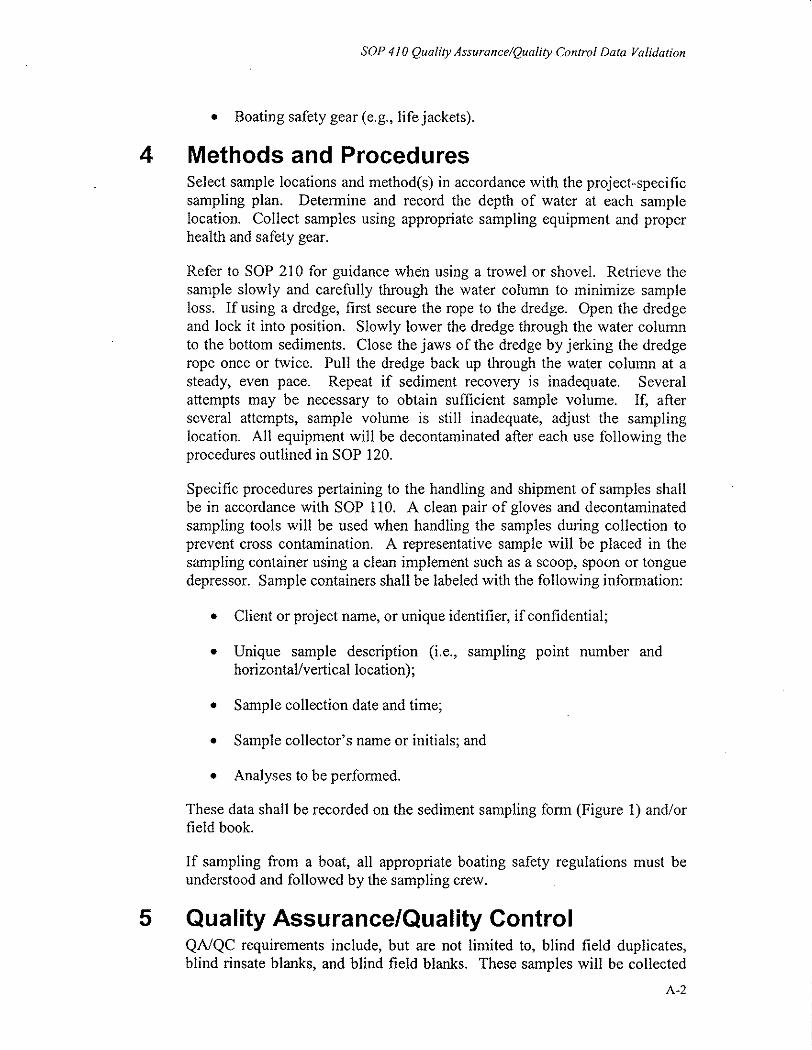


Attachment B
Field Forms
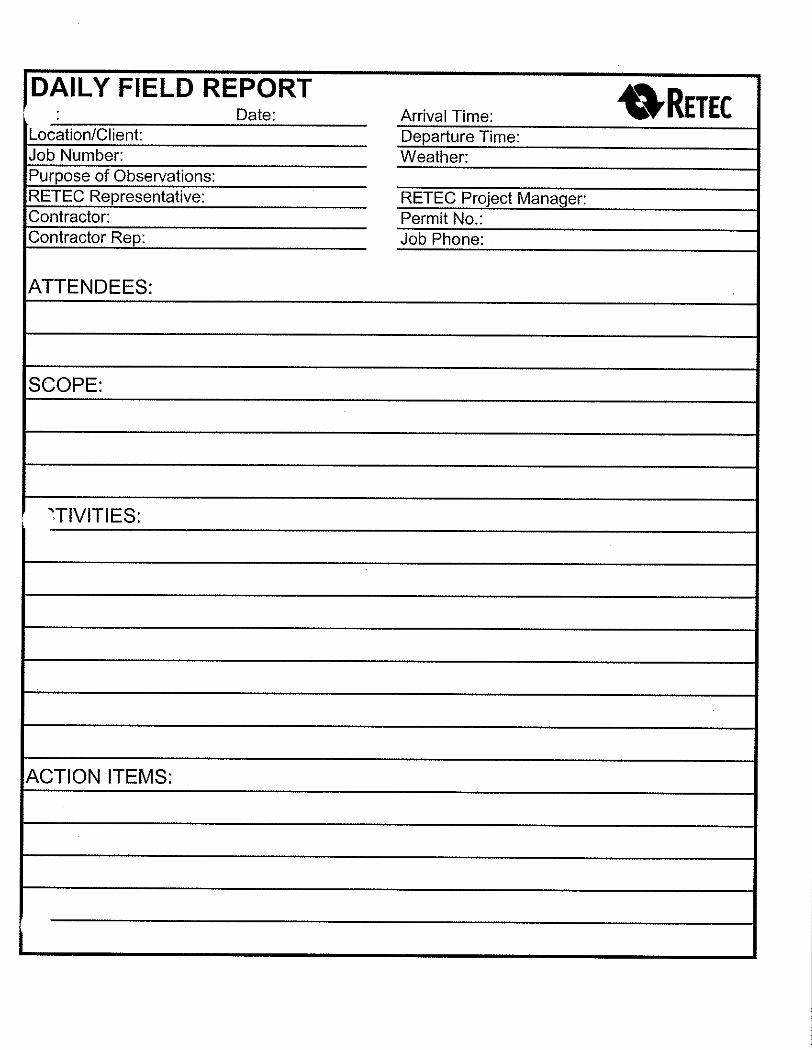
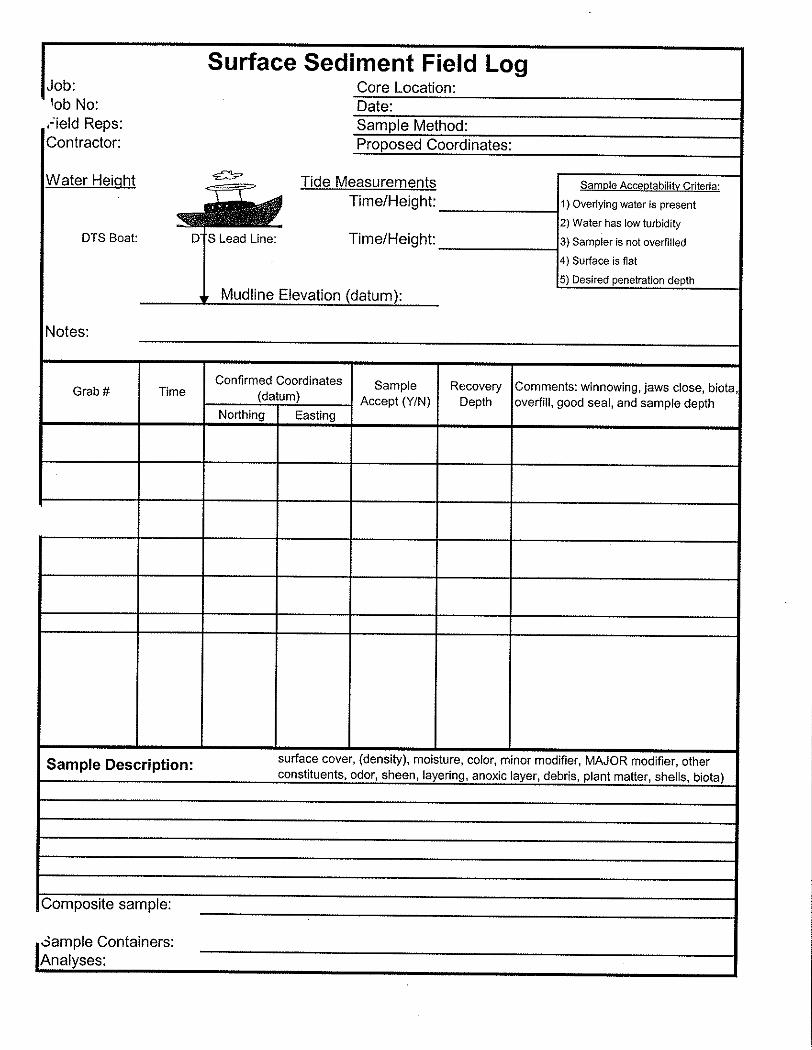
Appendix B I&J Waterway PSDDA Sediment Characterization Sampling and Analysis Plan I&J Waterway Bellingham, Washington Prepared by: The RETEC Group, Inc. 1011 S.W. Klickitat Way, Suite #207 Seattle, Washington 98134 RETEC Project Number: PORTB-18449-100 Prepared for: Port of Bellingham 1801 Roeder Avenue Bellingham, Washington 98225
July 27, 2005
F:\PROJECTS\DOCS\8448\DOCS\Work Plan\App B\PSDDA SAP 7-27-05.doc
Appendix B I&J Waterway PSDDA Sediment Characterization Sampling and Analysis Plan I&J Waterway Bellingham, Washington Prepared by: The RETEC Group, Inc. 1011 S.W. Klickitat Way, Suite #207 Seattle, Washington 98134 RETEC Project Number: PORTB-18449-100 Prepared for: Port of Bellingham 1801 Roeder Avenue Bellingham, Washington 98225 Prepared by: _____________________________________________________ Daniel J. Berlin, Environmental Scientist Reviewed by: _____________________________________________________ Mark Larsen, Senior Project Manager
July 27, 2005
Table of Contents
PORTB-18449-100 i
1 Introduction.................................................................................................... 1-1 1.1 Project Description............................................................................. 1-1 1.2 Sediment Description......................................................................... 1-2 1.3 Site History ........................................................................................ 1-2 1.4 Program Objectives............................................................................ 1-3
2 Project Team and Responsibilities................................................................. 2-1 2.1 Project Planning and Coordination .................................................... 2-1 2.2 Field Sample Collection..................................................................... 2-1 2.3 Laboratory Preparation and Analysis................................................. 2-1 2.4 QA/QC Management ......................................................................... 2-1 2.5 Final Data Report ............................................................................... 2-2
3 Sample Collection and Handling Procedures ................................................ 3-1 3.1 Definitions.......................................................................................... 3-1 3.2 Number of Cores and Samples Required Based on Site Ranking ..... 3-2 3.3 Conceptual Dredging Plan, Sampling and Compositing Scheme...... 3-3
3.3.1 Conceptual Dredging Plan ..................................................... 3-4 3.3.2 Sampling and Compositing Scheme ...................................... 3-5 3.3.3 Sampling Locations ............................................................... 3-5
3.4 Field Sampling Schedule ................................................................... 3-7 3.5 Field Operations and Equipment ....................................................... 3-7
3.5.1 Sediment Sampling Equipment.............................................. 3-8 3.5.2 Positioning and Navigation.................................................... 3-8
3.6 Sample Collection Techniques .......................................................... 3-9 3.7 Sample Compositing and Subsampling ........................................... 3-11
3.7.1 Extrusion.............................................................................. 3-11 3.7.2 Compositing......................................................................... 3-11 3.7.3 Sample Volume.................................................................... 3-12
3.8 Equipment Decontamination Procedures......................................... 3-13 3.9 QA/QC Samples............................................................................... 3-13 3.10 Sample Transport and Chain of Custody Procedures ...................... 3-13 3.11 Health and Safety............................................................................. 3-14
4 Chemical and Physical Testing...................................................................... 4-1 4.1 Chemical Analyses Protocols ............................................................ 4-1
4.1.1 Chain of Custody ................................................................... 4-1 4.1.2 Chemical Analyte List and Methods...................................... 4-1 4.1.3 Physical Analysis ................................................................... 4-1 4.1.4 Limits of Detection ................................................................ 4-1 4.1.5 Quality Assurance/Quality Control........................................ 4-3
4.2 Laboratory Written Report................................................................. 4-3 4.3 Data Validation .................................................................................. 4-4
5 Biological Testing.......................................................................................... 5-1
Table of Contents
PORTB-18449-100 ii
5.1 Bioassay Testing Approach ............................................................... 5-1 5.2 Sample Handling................................................................................ 5-1 5.3 Sediment Toxicity Tests .................................................................... 5-2
5.3.1 Species Selection ................................................................... 5-2 5.3.2 Procedures.............................................................................. 5-3 5.3.3 Negative Controls .................................................................. 5-4 5.3.4 Reference Sediment ............................................................... 5-4 5.3.5 Replication ............................................................................. 5-5 5.3.6 Positive Controls.................................................................... 5-5 5.3.7 Water Quality Monitoring...................................................... 5-5
5.4 Interpretation...................................................................................... 5-6 5.5 Bioaccumulation Testing ................................................................... 5-6 5.6 Laboratory Reporting Requirements.................................................. 5-6
6 Reporting and Deliverables............................................................................ 6-1
7 References...................................................................................................... 7-1
List of Tables
PORTB-18449-100 iii
Table 3-1 I&J Waterway Dredging Coring Plan
Table 3-2 Sample Collection Requirements
Table 3-3 PSDDA Sample Holding Times and Bottle Requirements
Table 4-1 Sediment Chemical Analysis Methods, Target Detection Limits, and Criteria
Table 4-2 Minimum Laboratory QA/QC Requirements
Table 5-1 Proposed Bioassay Test Organisms for PSDDA Testing
Table 5-2 PSDDA Bioassay Evaluation Guidelines
List of Figures
PORTB-18449-100 iv
Figure 1-1 I&J Waterway Site Location Map and Parcel Boundaries
Figure 1-2 Proposed I&J Waterway Dredging Areas
Figure 3-1 Proposed I&J Waterway DMMU Sampling Locations
List of Attachments
PORTB-18449-100 v
Attachment A Summary of Historical Analytical Data
Attachment B Field Forms
Attachment C Reporting Requirements for Chemical Variables and Bioassays
List of Acronyms
PORTB-18449-100 vi
ARI Analytical Resources, Inc. ASTM American Society for Testing and Materials BT bioaccumulation trigger COC chemical of concern DAIS Dredged Analysis Information System DGPS Differential Global Positioning System DMMP Dredged Material Management Program DMMU Dredged Material Management Units DNR Washington State Department of Natural Resources Ecology Washington State Department of Ecology EPA U.S. Environmental Protection Agency MDL method detection limit ML maximum level MLLW mean lower low water MS/MSD matrix spike/matrix spike duplicate Port Port of Bellingham PSDDA Puget Sound Dredged Disposal Analysis PSEP Puget Sound Estuary Protocol QA/QC quality assurance/quality control RI/FS Remedial Investigation and Feasibility Study SAP Sampling and Analysis Plan SL screening level SMARM Sediment Management Annual Review Meeting SMS Sediment Management Standards SQS Sediment Quality Standards SVOC semivolatile organic compound TDL target detection limit TOC total organic carbon USACE U.S. Army Corps of Engineers VCP Voluntary Cleanup Program
PORTB-18449-100 1-1
1 Introduction 1.1 Project Description
This Sampling and Analysis Plan (SAP) provides the scope and methods to evaluate the suitability for open-water disposal of sediments at the I&J Waterway Site (Site) in Bellingham Bay in Bellingham, Washington under the Puget Sound Dredged Disposal Analysis Program (PSDDA) (See site map, Figure 1-1). This testing is being performed in support of the Sediments Remedial Investigation and Feasibility Study (RI/FS) occurring at the Site under the oversight of the Department of Ecology (Ecology). The need for disposal is driven by the cleanup at the site, but the design of the remedial activities will be influenced by navigation needs within the waterway and adjacent areas.
Based on areas identified for remediation in the Phase 2 Sampling (ThermoRetec, 2001), the area of the site within which dredging may occur is shown in Figure 1-2. This area has been divided into six (6) surface dredged material management units (DMMUs) and one (1) subsurface DMMU. Three (3) of the surface DMMUs and one (1) subsurface DMMU are contingent on the results of additional testing being performed as part of the RI/FS. These units may not be included in testing for open-water disposal if surface sediments do not exceed SMS criteria. The final orientation of DMMUs may change based upon results of surface sediment sampling conducted prior to coring. This SAP covers the characterization procedures for all seven DMMUs (6 surface, 1 subsurface).
These DMMUs are currently being investigated under an Agreed Order between Ecology and the Port of Bellingham to delineate sediment contamination at the site during preparation of the final RI/FS. All or some of the DMMUs will be evaluated depending on determinations from the Department of Ecology about the need for remediation in these areas based on the supplemental surface sediment chemical and biological data collected as part of a separate investigation. The SAP describing the surface testing is contained in Appendix A of the RI/FS Work Plan. Only those DMMUs in which the supplemental data from that area suggests remediation is necessary will be evaluated for open-water disposal under the PSDDA program.
An investigation of surface sediment contamination was conducted in 2000 by RETEC (formerly ThermoRetec, 2001). Elevated concentrations of bis(2-ethylhexyl)phthalate, phenol, polynuclear aromatic hydrocarbons (PAHs), and nickel are present in surface sediments. Historical sampling data collected by Hart Crowser in 1996 (1997) and Anchor Environmental (1998) indicate that mercury contamination is present in subsurface sediments. The coring prescribed in this plan will define which sediments may be unsuitable for unconfined, open-water disposal.
I&J Waterway PSDDA Sediment Characterization Sampling and Analysis Plan - I&J Waterway, Bellingham, Washington
PORTB-18449-100 1-2
The total dredged volume of sediment of the three (3) non-contingent surface sediment DMMUs is approximately 9,910 cyds, including overdredge allowances. The total potential dredged material volume of all six (6) surface sediment DMMUs and the single subsurface sediment DMMU is approximately 22,030 cyds, including overdredge allowances.
1.2 Sediment Description PSDDA guidance identifies Bellingham Bay as an area of high concern for sediment contamination. The waterway site has many known chemical sources and high concentrations of chemicals of concern (see Attachment A for historical analytical data results). Therefore, as an area of high concern, PSDDA guidance specifies that the maximum surface sediment volume represented by each surface DMMU is 4,000 cyds. Maximum subsurface sediment volume contained in each DMMU is 12,000 cyds.
Data collected as part of the Phase 2 investigation indicate that sediment in the waterway ranges from clayey silt to sand (ThermoRetec, 2001). Areas identified for remediation have been divided into 6 surface DMMUs and one subsurface DMMU based on similar contaminant levels (see Section 3 and Attachment A). Mudline elevations of sediments in the DMMUs range from approximately 0 to -17.0 feet MLLW.
RETEC proposes to characterize sediment by collecting and analyzing representative core samples in accordance with PSDDA requirements for each of the DMMUs. Dredged materials that pass chemical and biological guidelines may be disposed of at the Rosario Straits dispersive site if determined suitable, or to the Bellingham Bay non-dispersive open-water disposal site as part of the proposed project.
The field activities will be performed by The RETEC Group, Inc. (RETEC) on behalf of the Port of Bellingham (Port). Field sampling activities are currently scheduled for the summer of 2005.
1.3 Site History The Site is located between Hilton Avenue and Bellwether Way on the Bellingham waterfront and was formerly called the “Olivine-Hilton sediment Site” (Figure 1-1). The Site includes areas of contaminated marine sediments in both the I & J Waterway and nearby berthing areas. The Waterway is located primarily on a state-owned aquatic land. The Port owns the berthing areas on the south side of the waterway and the surrounding uplands. The Waterway includes a federally authorized navigation channel with a current authorized channel depth of 18 feet below Mean Lower Low Water (MLLW). The U.S. Coast Guard owns the property north of the Site and berths vessels within the waterway and northern berth areas.
I&J Waterway PSDDA Sediment Characterization Sampling and Analysis Plan - I&J Waterway, Bellingham, Washington
PORTB-18449-100 1-3
The upland areas near the Site include the former Olivine Corporation lease area and a property to its southwest that is currently leased to Bornstein Seafoods.
The ownership and history for the Site and adjacent upland properties were defined in the Phase 2 Sediment Sampling Report (ThermoRetec, 2001). The Whatcom Falls Mill Company owned and operated a lumber mill in the vicinity of the Site between the early 1900’s and 1940. In 1944, these properties were acquired by the Port and leased to tenants, including Bayshore Lumber, who operated a lumber company (1947-1962) and H&H Products, who managed the same lumber mill (1963-1972) at the head of the waterway. The Olivine Corporation operated a rock crushing plant for the mineral olivine between 1963 and 1992. During that period, dust and wastewater were periodically released to the waterway. North Pacific Frozen Products managed a food processing plant between 1946 and 1959 in the location of the current Bornstein lease. Bornstein Seafoods has operated a seafood processing plant from 1959 to present in that location. Bornstein Seafoods provided diesel fuel to boats at its dock between 1960 and the early 1980s. A fire destroyed the main Bornstein Seafoods building in July of 1985. Fire suppression efforts lasted for two days, during which time fire control water was discharged directly to the Site.
Environmental impacts to the Site as documented by previous studies include contaminated surface sediments containing elevated concentrations of bis(2-ethylhexyl)phthalate. The elevated phthalate concentrations are located around the Bornstein Seafoods lease area in the vicinity of the 1985 fire. Surface sediments are also contaminated with nickel in the southeastern portion of the waterway adjacent to the former Olivine Corporation lease area. Nickel is a constituent within olivine ore. Additional contaminants present in subsurface sediments include mercury, phenols, and polynuclear aromatic hydrocarbon (PAH) compounds (ThermoRetec, 2001).
Dredging of approximately 68,000 cubic yards of sediments was conducted during maintenance dredging of the I&J Waterway by the Army Corps of Engineers in 1992 (West Central Environmental and ThermoRetec, 2000). Approximately 25,000 cyds were found to be unsuitable for unconfined, open-water disposal.
1.4 Program Objectives The primary objective of the characterization is to collect the necessary chemical, physical, and biological testing data to evaluate the suitability of open-water disposal for site sediments that may be dredged as part of the proposed project.
I&J Waterway PSDDA Sediment Characterization Sampling and Analysis Plan - I&J Waterway, Bellingham, Washington
PORTB-18449-100 1-4
The sediment characterization program objectives and constraints are summarized below:
• To characterize sediments for dredging in conformance with PSDDA requirements to enable the PSDDA agencies to designate approved disposal option(s);
• To collect, handle, and analyze representative sediment core samples that characterize the full dredging prism in accordance with protocols, timing, and QA/QC requirements outlined in the PSDDA Evaluation Procedures Technical Appendix (June 1988), the updated procedures documented in Chapter 5 and Appendix A of the PSDDA Phase II Management Plan Report (September, 1989), modifications made through the PSDDA and Sediment Management Annual Review Meeting (SMARM) process, and procedures presented in PSEP Recommended Protocols for Measuring Selected Environmental Variables in Puget Sound.
• Sediment cores will be composited and analyzed in a timely manner to meet the remediation schedule and PSDDA requirements for sample holding times, including those related to possible biological analysis, if needed.
• Chemical and biological testing results will be compared to chemical guidelines or biological performance criteria presented in the Evaluation Procedures Technical Appendix – Phase I (PSDDA, 1988), the PSDDA Management Plan Report – Phase II (PSDDA, 1989), as well as any revisions to guidelines or performance criteria that have been incorporated as part of the SMARM process.
PORTB-18449-100 2-1
2 Project Team and Responsibilities The sediment characterization program will include: (1) project planning and agency coordination, (2) field sample collection, (3) laboratory preparation and analysis, (4) QA/QC management, and (5) final data reporting. Staffing and responsibilities are outlined below.
2.1 Project Planning and Coordination Dan Berlin, RETEC, will be the overall Project Manager responsible for developing and completing the sampling program, and the primary contact for technical issues related to this SAP and the sediment characterization report. Following plan approval by the USACE, Mr. Berlin will be responsible for timely and successful completion of the project. Mr. Berlin will provide a copy of the approved SAP to all sampling and testing subcontractors, and coordinate any significant deviations from the approved sampling plan with the appropriate PSDDA agencies.
2.2 Field Sample Collection Nick Bacher, RETEC, will provide overall direction to the field sampling and laboratory analysis programs in terms of logistics, personnel assignments, field observations, and analytical laboratory selection. Mr. Bacher will also supervise field collection of the sediment core samples. Mr. Bacher will be responsible for ensuring accurate sample positioning, recording sample locations, depths, and identification, ensuring conformance to sampling and handling requirements, including field decontamination procedures, photographing, physical evaluation, and logging of the samples, and for chain of custody of the sample cores until they are delivered to the analytical laboratory.
2.3 Laboratory Preparation and Analysis Leslie McKee, RETEC, will be responsible for documenting sample preparation, observations, and chain of custody until the time she delivers the samples to the appropriate laboratory. Ms. McKee will also instruct the analytical laboratory on the need to maintain required handling and analytical protocols including detection limit requirements for dredge material characterization. Ms. McKee will ensure that archived sediments are stored under proper conditions. Analytical Resources, Inc. (ARI) will handle and analyze the submitted samples in accordance with PSDDA analytical testing protocols and QA/QC requirements. ARI will perform sediment grain size analysis. Vizon Scitec (Vancouver, BC) will conduct biological testing.
2.4 QA/QC Management Jennifer Fetting will serve as Quality Assurance Representative for the sediment characterization project. She will perform quality assurance
I&J Waterway PSDDA Sediment Characterization Sampling and Analysis Plan - I&J Waterway, Bellingham, Washington
PORTB-18449-100 2-2
oversight for both the field sampling and laboratory programs. She will remain fully informed of field program procedures and progress during sample collection and laboratory activities during sample preparation. She will record and correct any activities that vary from the written sampling and analysis plans. She will also review the laboratory analytical and QA/QC data to ensure that data are valid and procedures meet the required analytical quality control limits. Upon completion of the sampling and analytical program she will incorporate findings into a QA/QC report.
2.5 Final Data Report Nick Bacher will be responsible for preparation of a PSDDA Data Evaluation Report, including descriptions of sample locations and depths, sampling, handling and analytical methods, QA/QC, and compilation and interpretation of data. Dan Berlin will provide technical oversight and review of the document. The report will include the following elements:
• Type of sampling equipment used;
• Protocols and procedures used during sampling and testing and an explanation of any deviations from the sampling plan protocols;
• Descriptions and core logs of each sample, including penetration and recovery depths, compositing intervals, mudline elevation, grain size, and geologic contacts;
• Methods used to locate the sampling positions within an accuracy of ±2 m;
• Maps and tables identifying locations where the sediment samples were collected, reported in State Plane Coordinates to the nearest foot;
• A plan view of the project site showing the waterway, bathymetry, and actual sampling locations;
• Chain of custody procedures used, and explanation of any deviations from the sampling plan procedures;
• Tabular summary of chemical testing results in DAIS (Dredged Analysis Information System) format, with comparisons to USACE guideline chemistry values; and
• Final QA Report, which will identify any field and laboratory activities that deviated from the approved sampling plan and the referenced protocols. The QA Report will assess the overall validity of the collected data.
PORTB-18449-100 3-1
3 Sample Collection and Handling Procedures This SAP provides details of specific data collection and analysis activities designed to support the objectives of the project. Preparation of the SAP follows the USACE guidance manual titled Requirements for the Preparation of Sampling and Analysis Plans (USACE, 1994), the components and strategy of which are provided in the following subsections.
3.1 Definitions The following definitions apply to this sampling program:
• Dredging Prism: the entire volume of sediments to be dredged, including a 1-foot overdredge allowance.
• Sampling Depth (Penetration Depth): the entire cumulative depth of penetration of the coring device from the sediment/water interface.
• Sediment Core: the entire cumulative length of sediment extracted by the coring device. Typically, the recovered sediment length is less than the total penetration depth due to compaction during coring.
• Core Section: each core section is 4 feet long except where the total sediment depth leaves a core section less than 4 feet at the bottom of the dredging prism. Core sections for each sediment core are designated alphabetically, beginning with “A” for the 4-foot surface layer and proceeding downward from the top in 4-foot increments…A, B, C, etc., to the bottom core section. Core sections are composited within Dredge Material Management Units for laboratory analyses. Slightly longer or shorter core sections may be composited if stratigraphic contacts in the sediment sequence are observed during core processing. One-foot core sections will be collected from below the dredge prism for archiving (z-sample). Core sections are composited within Dredge Material Management Units for laboratory analyses.
• Dredged Material Management Unit (DMMU): the volume of dredged material for which a separate decision on suitability for unconfined open-water disposal can be made. DMMUs are typically represented by chemical and biological testing of a single sample and composited from one or more core sections within the DMMU.
• Surface Sediments: sediments located within a 4-foot-thick surface layer. Surface sediment samples are repsresented by core sections designated by the capital letter “A”
I&J Waterway PSDDA Sediment Characterization Sampling and Analysis Plan - I&J Waterway, Bellingham, Washington
PORTB-18449-100 3-2
• Subsurface Sediments: sediments located beneath the 4 foot layer of surface sediments. Subsurface sediment samples are represented by core sections designated by the capital letters “B”, “C”, etc.
• “Z” Samples: sediments below the dredge prism which will be exposed by dredging and represent the surface that will remain when dredging is completed.
3.2 Number of Cores and Samples Required Based on Site Ranking The dredge materials at the site are ranked by PSDDA classification scheme as an area of high concern for sediment contamination. High concentrations of chemicals of concern are found in site surface sediments, and acute toxicity in sediment bioassays may be present (see Attachment A). In accordance with PSDDA requirements, full sediment characterization requirements for a dredging area ranked high concern are outlined below:
• Surface Sediments (0 to 4 feet): One core section and one laboratory analysis for each 4,000 cubic yards.
• Subsurface Sediments (> 4 feet): One core section for each 4,000 cubic yards, and one laboratory analysis for each 12,000 cubic yards.
Four cores will be collected from each DMMU in order to achieve sufficient volume for full chemical, bioassay, and bioaccumulation analyses. These cores will be composited into one surface sample within each DMMU to characterize more recently deposited sediments and one composite for the subsurface DMMU. A z-sample representing the top one-foot of the new surface following dredging will be collected and archived to verify compliance with Washington State’s antidegradation policy. If the DMMP and/or the SMS programs require their analysis, testing will consist of conventional and chemistry analysis.
As shown in the historical data in Attachment A, much of the surface sediment is impacted with bis(2-ethylhexyl)phthalate, nickel, of PAHs. Mercury contamination and phenols are present in subsurface sediment and are not expected to extend beyond the depth to which the federal channel is maintained (-18 feet MLLW). Table A-1 summarizes surface chemical concentrations from studies in 1997 and 1999 and Table A-2 shows coring data from 1997 to a depth of 7.1 feet below mudline. Table A-3 provides results of the Phase 2 surface sediment sampling. Figure A-1 provides exceedances of SQS or MCUL criteria from Phase 2 and other historic surface sediment investigations.
I&J Waterway PSDDA Sediment Characterization Sampling and Analysis Plan - I&J Waterway, Bellingham, Washington
PORTB-18449-100 3-3
The estimated total dredged volume of sediment in the three non-contingent DMMUs in the remediation area (DMMU-3, 5, and 6) is approximately 9,950 cyds, including overdredge allowances. Dredge cuts are meant to remove sediment to -18 feet MLLW in the federal waterway with a 2 foot overdredge depth. Volumes include slope volume, and assume a 3:1 slope from the federal channel boundary. The total potential dredged volume of sediment of the additional three (3) contingent units is approximately 12,080 cyds, including overdredge allowances. One sample will be collected from each DMMU, which will be composited from four cores in each DMMU.
3.3 Conceptual Dredging Plan, Sampling and Compositing Scheme The SAP is developed with consideration of site-specific project and environmental factors. A key requirement is ensuring that if an individual DMMU (represented by one or more core sections) is found unsuitable for unconfined open-water disposal, then that unit can be feasibly dredged independently from surrounding clean sediments so that the contaminated material can be disposed of at an alternate approved site. The sampling program for the waterway dredging project was developed as follows:
• Prepare Conceptual Dredging Plan. Criteria for a dredging plan were established for this site based on the depth and similar chemical and physical characteristics of the sediments, the dredge layout plan including side slopes, appropriate dredging methods and equipment, and conventional construction practices at similar dredging projects in Puget Sound.
• Prepare Sampling Scheme. Basic criteria for selecting sampling locations and compositing for analysis are contained in PSDDA guidance documents relative to sediment volumes to be characterized. The approach is to delineate sediment sampling grid units as basic building blocks for identifying DMMUs capable of being dredged independently.
• Integrate the Dredging Plan with the Sampling and Compositing Scheme. This step consisted of using professional judgment to relate the operational aspects of dredging to the compositing scheme to ensure that specific sediment volumes, represented by sampling, and analytical results can be feasibly dredged independently from adjacent volumes. A primary consideration was to provide common lateral boundaries between the surface DMMUs as much as practicable to enable full depth dredging with each dredge setup where sampling results allow use of the same disposal site.
I&J Waterway PSDDA Sediment Characterization Sampling and Analysis Plan - I&J Waterway, Bellingham, Washington
PORTB-18449-100 3-4
3.3.1 Conceptual Dredging Plan Criteria for dredging are as follows:
• Dredge by clamshell and bottom-dump barge in open-water areas, or by backhoe with extended arm under docks with diver-guided hydraulic dredging to remove remaining sediments.
• Most practicable dredge cut widths are in the range of 50 to 90 feet.
• Full box-cutting of the dredge slopes will not be allowed along the Bornstein dock (southeastern portion of waterway) and Coast Guard dock (northwestern portion of waterway) in order to protect the piling from potential slope failure due to overcutting, i.e., the pier side slope will be excavated as close to the 1V-on-3H design slope as practicable (estimated dredge volumes assume vertical dredge cuts along the pilings). Adjusting dredge volume estimates to accommodate appropriate side slope requirements will decrease the total dredge volume of each DMMU, and will be performed prior to dredging as part of the engineering design.
• Dredged removal of the dock side slopes will be conducted by advancing the dredge cut longitudinally along the pier length. This will take advantage of increased bucket control by side swing (compared to more difficult control by raising and lowering the boom as would be required by advancing into the side slope perpendicular to the pier). Advancing parallel to the pier will also enhance operator control by creating a pattern of repetitive excavation along the slope cut in reference to the pier face.
• Underpier dredge cuts will be conducted with a backhoe with an extended arm on a barge pulling sediment from underneath the pier along gaps between piles. Due to the presence of braces preventing dredge cuts in the direction perpendicular to the first cuts, a diver-guided hydraulic dredge will remove remaining sediments. Total dredge area of sediments under the two docks is less than 900 yd2, the majority of which will be removed by mechanical dredge.
• Remaining dredge cuts will also be oriented longitudinally along the pier, i.e., parallel to the pier face and the pier side slope cut. However, it is also practicable to orient selected dredge cuts perpendicular to the pier; however, this would require more dredge positioning to initiate the additional cuts and alignments.
I&J Waterway PSDDA Sediment Characterization Sampling and Analysis Plan - I&J Waterway, Bellingham, Washington
PORTB-18449-100 3-5
• Except for the dock side slope cut (which may require successive passes), the full allowable depth of removal, based on testing results, will be accomplished as the dredge advances into the cut.
3.3.2 Sampling and Compositing Scheme The basic approach for establishing the sampling array and compositing scheme include the following criteria:
• Design sediment grid unit borders perpendicular to the federal channel boundary consistent with the maintenance dredging requirements of the waterway such that units are composed of similar sediment quality.
• Arrange grid unit borders beyond the federal channel boundary to allow for appropriate side-slope cuts (3H:1V) along the channel boundary
• Design contingent sediment grid unit borders (DMMUs 1, 2, and 4) along the perimeter of the remediation area.
• Arrange sediment grid units to provide testing of surface sediments in both shallower and deeper water.
Sediment DMMUs have been designed based on historically similar concentrations of contaminants in surface sediments. Attachment A contains a tabular summary of surface sediment data (Tables A-1 and A-3) and subsurface data (Table A-2) and one figure summarizing sample locations and contaminant exceeding SMS criteria.
The waterway sediment surface contains a distinct footprint of bis(2-ethylhexyl)phthalate with areas of PAH and phenol contamination. Nickel is elevated in sediments on the eastern portion of the inner waterway. DMMU units have been designed to minimize the chemical heterogeneity within a single unit based on historic data. DMMUs 5 and 6 contain surface sediment that exceed MCUL concentrations, and DMMU-3 contains surface sediment with SQS or MCUL exceedances.
3.3.3 Sampling Locations Sampling locations have been designed to capture sediment that is representative of chemical and physical makeup of each DMMU. Twenty-four (24) sediment cores will be collected at approximately 60 to 150-foot intervals, depending on the shape of the DMMU. Sampling locations are established as shown on Figure 3-1. Table 3-1 lists sediment core sampling locations, core and sample nomenclature, and estimated sediment volumes of each DMMU. Each of the four sampling locations for remediation area
I&J Waterway PSDDA Sediment Characterization Sampling and Analysis Plan - I&J Waterway, Bellingham, Washington
PORTB-18449-100 3-6
DMMUs is positioned in a manner to maximize the distance between sampling locations without being too close to any borders of the DMMU. Sampling locations are spaced in order to sample both more and less contaminated areas within the DMMU.
Surface Sampling Units The surface interval from each of four sediment cores of each DMMU will be composited together into one analytical sample and designated with an “S1” extension. Table 3-1 identifies length of sediment cores for each DMMU. Surface unit depths vary according to proximity to the waterway. Depths of surface units vary in each DMMU. Maximum depths in DMMUs 1, 2, 3, 5, and 6 do not exceed 4 feet. Maximum depth of the surface interval in DMMU-4 is 3 feet. Additional sediment will be sampled from the subsurface unit below the surface interval in DMMU-4. Cores in the waterway will be sampled to -20 feet MLLW (-18 feet MLLW plus 2 feet of overdredge depth). Cuts away from the waterway are meant to provide a final slope of 3H-on-1V.
Actual sample composite depths may vary depending on observed stratigraphy in each core. Historical maintenance dredging has shown a native clay layer present at approximately -20 feet MLLW throughout much of the waterway. If a well-defined contact between recent sediments and native sediments exist and is slightly deeper or shallower than the targeted dredge cut, then the surface sample will be sampled to the contact composed of recent sediments. Z-samples will be designated with an “S2” extension and collected from composites collected from the 1 foot layer beneath the surface intervals in DMMUs 1, 2, 3, 5, and 6.
Subsurface Sampling Units The subsurface interval from the four cores in DMMU-4 will be composited together into one analytical sample and designated with an “S-2” extension. No other subsurface units will be characterized. Table 3-1 identifies the length of sediment core sections in the subsurface intervals. Subsurface sampling intervals range from one to three feet below the surface interval. Subsurface cuts are meant to remove sediment to the depth of -20 feet MLLW within the federal channel boundary and with a 3H-on-1V slope to the edges of the DMMU.
Actual sample composite depths may vary depending on observed stratigraphy in each core. Historical maintenance dredging has shown a native clay layer present at approximately -20 feet MLLW throughout much of the waterway. If a well-defined contact between recent sediments and native sediments exist and is slightly deeper or shallower than the targeted dredge cut, then the surface sample will be sampled to the contact composed of recent sediments. Z-samples will be designated with an “S2” extension and collected
I&J Waterway PSDDA Sediment Characterization Sampling and Analysis Plan - I&J Waterway, Bellingham, Washington
PORTB-18449-100 3-7
from composites collected from the 1 foot layer beneath the subsurface intervals in DMMU-4B.
Reference Samples Sediment samples collected for sediment bioassay testing will be compared to one or two reference samples collected in the field with similar grain size and total organic carbon (TOC) characteristics. Reference samples are ambient surface samples collected from areas not likely impacted by site activities. They will be collected from Samish Bay or a similar reference site in Washington and rapid field-sieved in the field to best match grain size distributions. Reference sediment samples will be submitted for grain size analysis, as well as total solids, total volatile solids, total organic carbon, grain size, ammonia, and sulfides.
3.4 Field Sampling Schedule The field sampling schedule is constrained by the shortest sample holding time (7 days). To safely meet the holding times for composited samples, the field samples will be composited and delivered for laboratory testing within 3 days of sampling the first core section within each composite. Sampling will generally proceed by completing each core for a DMMU before proceeding to core locations for the next DMMU. Based on a review of the limited available sediment data and expected logistic considerations, it is projected that up to 5 sediment cores can be completed per sampling day. The entire core-sampling program is expected to be completed within 5 working days.
Initiation of core sampling will be preceded by preparation of sample coring and handling equipment, acquisition of appropriate EPA-approved decontaminated sample containers from the analytical laboratories, on-site establishment of positioning references and tide gauge by the surveyor, and mobilization of the coring vessel to the site.
3.5 Field Operations and Equipment The field crew and equipment will be mobilized from RETEC’s Seattle and Bellingham Offices. The field crew will make sure all equipment is in good working order prior to collection of cores. Initiation of sediment sampling will be preceded by preparation and cleaning of sample coring and handling equipment, acquisition of decontaminated sample containers from the analytical laboratory, and establishment of sampling locations in the waterway. All field sampling and sediment handling will conform to the procedures outlined in the project Health and Safety Plan.
I&J Waterway PSDDA Sediment Characterization Sampling and Analysis Plan - I&J Waterway, Bellingham, Washington
PORTB-18449-100 3-8
3.5.1 Sediment Sampling Equipment The sampling vessel and operator to be employed for the coring program will be provided by Marine Sampling Systems of Seattle, Washington. The sampling vessel, R/V Nancy Anne, is an aluminum, flat-deck, 36-foot-long, and 14-foot-wide catamaran vessel with twin 120-horsepower engines. The R/V Nancy Anne is equipped with a 14-foot-high hydraulically-operated A-frame with boom with variable speed, 3,000-pound capacity, hydraulic winch (1 to 3 ft/s), and 270 square feet of deck space. The vessel is equipped with a pilot house, freshwater and seawater pumps; and vessel draft ranges from 18 inches forward to 42 inches aft.
Sediment cores will be collected using a vibracore. A vibracoring system collects a continuous profile of sediments below mudline. The system utilizes a high frequency vibrating coring device, which penetrates into the underlying sediments with minimal distortion. This method is ideal for collecting long, relatively undisturbed cores from a variety of sediment types. The vibratory head assembly and core barrels will be deployed from the A-frame of the R/V Nancy Anne. If debris is encountered, alternative sampling gear will be considered, including the mud-mole or diver operated core sampling prior to moving the location.
The field representative will log each sample on a chain of custody form, noting the location, date, and time of collection. Subsequent chain of custody forms will be used to track the submittal of specific samples to the laboratory, and will be signed by any individual handling the coolers. Coolers, in which samples are kept on ice, will be in possession of project personnel or secured at all times. A complete record of drilling and sampling operations will be maintained on the appropriate sediment sampling forms.
3.5.2 Positioning and Navigation The objective of the positioning procedure is to accurately (±2 m) determine and record the positions of all sampling locations. This determination will be achieved by documenting the following parameters at each sampling location:
• Horizontal location in state plane coordinates and latitude/longitude (NAD 83) recorded electronically when sampler is on the bottom and cable is taut and perpendicular to the water surface;
• Vertical elevation in feet (USACE MLLW) recorded from lead-line water depth measurements and tide height; and
• Time and date.
I&J Waterway PSDDA Sediment Characterization Sampling and Analysis Plan - I&J Waterway, Bellingham, Washington
PORTB-18449-100 3-9
These parameters will be measured using combinations of a Differential Global Positioning System (DGPS), local tide gauges, tide programs, acoustic and lead-line water depth instruments, and back-up methods (i.e., triangulation or taping to survey control points and/or terminal landmarks or structures).
Positioning while sampling will be performed using a DGPS, which will provide positions every second with submeter accuracy for precise positioning of sample locations. The navigation system onboard the vessel will provide the vessel pilot with a navigation display to enable piloting to sample locations and recording the exact location of the sediment core. Each day, the sampling vessel will be positioned at a land-surveyed quality control point to verify the accuracy of the DGPS system, and recorded in the field notes.
As a back up, horizontal triangulation is proposed for recording station positions. If necessary, sampling locations will be identified by measuring the horizontal distance from the actual sampling location to a known survey control point and/or permanent structure to the nearest foot using an incremental tape measure. These horizontal measurements can be translated into state plane coordinates using project base maps.
3.6 Sample Collection Techniques Sediment samples will be collected in the following manner:
• Vessel will maneuver to the proposed sample location;
• A decontaminated core tube the length of the desired penetration depth will be secured to the vibratory assembly and deployed from the vessel;
• The cable umbilical to the vibrator assembly will be drawn taut and perpendicular, as the core rests on the bottom sediment;
• Location of the umbilical hoist will be measured and recorded by the location control personnel, depth to sediment will be measured with a survey tape attached to the head assembly;
• A 4-inch-diameter, thin-walled, aluminum tube will be vibratory-driven into the sediment using two counter-rotating vibrating heads;
• A continuous core sample will be collected to the designated coring depth or until refusal;
• The depth of core penetration will be measured and recorded;
I&J Waterway PSDDA Sediment Characterization Sampling and Analysis Plan - I&J Waterway, Bellingham, Washington
PORTB-18449-100 3-10
• The vibrator will be turned off and the core barrel will be extracted from the sediment using the winch;
• While suspended from the A-frame, the assembly and core barrel will be sprayed off and then placed on the vessel deck; and
• The core sample will be evaluated at the visible ends of the core tube, the length of recovered sediment will be recorded and, if accepted, the core tube will be sectioned into 4-foot lengths.
Sample recovery will be inspected relative to the following RETEC acceptance criteria:
• Overlying water is present and the surface is intact; • The core tube appears intact without obstruction or blocking; and • Recovery is greater than 75 percent of drive length.
If sample acceptance criteria are not achieved, the sample will be rejected. If repeated deployments (2) within a 15.2-meter (50-foot) radius within the DMMU of the proposed location do not meet acceptance criteria, then selection of an alternate sample location will be considered within the DMMU. Prior to selection of an alternative sample location, the Dredged Material Management Office (206-764-3768) should be contacted for discussion/approval.
Once the core samples are deemed acceptable, the cutterhead will be removed and a cap will be placed over the end of the tube and secured firmly in place with duct tape. The core tube will then be removed from the sampler and the other end of the core will be capped and taped. A label identifying the core will be securely attached to the outside of the core and wrapped with transparent table to prevent loss or damage of the label. The core sections will be stored upright in an insulated core storage box filled with blue ice. The cores will be sealed tightly enough to prevent leakage or disturbance during transport.
As samples are collected, logs and field notes of all sediment samples will be maintained on field forms and in a project notebook. Field forms are contained in Attachment B. Included on the forms and in this log will be the following:
• Calculated elevation of each sediment sample; • Date and time of sampling; • Initials of person supervising the sampling operation; • Weather conditions; • Sample location number and core section identification;
I&J Waterway PSDDA Sediment Characterization Sampling and Analysis Plan - I&J Waterway, Bellingham, Washington
PORTB-18449-100 3-11
• Physical description of sediment; and • Chronological occurrence of events during sampling operations.
3.7 Sample Compositing and Subsampling
3.7.1 Extrusion Core sections will have their sealed caps removed for extrusion. The sediment from each sample tube will be extruded onto a stainless steel tray using vibratory/pushing techniques or cutting the core longitudinally using a circular saw if push-extruding the sediment is difficult. The sample will be disturbed as little as possible when extruding. Upon extrusion, the core will be split with decontaminated stainless steel wire core splitters or spatulas.
A color photograph will be taken and the sediment description of each core sample will be recorded on the sediment-sampling log for the following parameters as appropriate and present:
• Sample recovery;
• Physical soil description in accordance with the Unified Soil Classification System (includes soil type, density/consistency of soil, color);
• Odor (e.g., hydrogen sulfide, petroleum);
• Visual stratification, structure, and texture;
• Vegetation;
• Debris (e.g. woodchips or fibers, paint chips, concrete, sand blast grit, metal debris;
• Biological activity (e.g., detritus, shells, tubes, bioturbation, live or dead organisms);
• Presence of oil sheen; and
• Any other distinguishing characteristics or features.
3.7.2 Compositing To reduce cross-contamination due to smear, the smeared sediments found along the sidewalls of the core tube will be removed prior to compositing. Only sediment that is not touching the sidewalls or ends will be collected for chemical analysis. Samples will be composited under the direction of an
I&J Waterway PSDDA Sediment Characterization Sampling and Analysis Plan - I&J Waterway, Bellingham, Washington
PORTB-18449-100 3-12
experienced RETEC geologist per the compositing plan presented in Table 3-1 and in accordance with USACE guidance. For sediment composite samples, equal volumes of sediment will be removed from each core section comprising a composite.
Immediately upon extrusion of cores, a subsample volume will be collected from a selected core section for volatiles and sulfide analysis without mixing by randomly selecting a sample that has not had contact with the core lining from one core representing each composite. Tables 3-1 and 3-2 indicate the stations randomly selected for volatile and sulfide subsampling. For sulfides, 5 ml of 2N zinc acetate will be added to every 30 grams of sediment using a pipette creating a thin film across the top of sediment in the jar. Separate containers will be completely filled with sample sediment for volatiles. No headspace will be allowed to remain in either container.
Sediments representing each composite sample will be placed in a decontaminated stainless steel bowl and mixed using decontaminated stainless steel mixing spoons or paddles. The composited sediment in the stainless steel bowl will be mixed until homogenous in color and texture.
Field sample recovery will be taken into account when vertically compositing the sample material. For example, a core sample with 3 feet of penetration but only 2.5 feet of recovery (retained) will have 83 percent sample recovery. Therefore, a 2.5-foot sample interval will be reduced by 17 percent from 2.5 feet to 2.08 feet to account for compaction during driving.
3.7.3 Sample Volume Approximately 27 liters of homogenized sample will be prepared for each composite. Table 3-3 contains sediment collection requirements for each composite sample or core. Two liters of sample are required to provide adequate volume for physical and chemical laboratory analyses. An additional 25 liters of sample will be collected and archived (refrigerated), pending chemical testing results, which will indicate if subsequent biological (5 liters) testing and/or bioaccumulation (20 liters) testing is deemed necessary to determine suitability for open-water disposal. Portions of each composite sample will be placed in appropriate containers obtained from the analytical chemistry laboratories.
Each sample container will be clearly labeled with the project name, sample/composite identification, type of analysis to be performed, date and time, and initials of person(s) preparing the sample, and referenced by entry into the log book. Samples will be stored at approximately 4 °C until withdrawn for analysis.
I&J Waterway PSDDA Sediment Characterization Sampling and Analysis Plan - I&J Waterway, Bellingham, Washington
PORTB-18449-100 3-13
3.8 Equipment Decontamination Procedures Sampling and sediment compositing equipment will be thoroughly cleaned prior to use and after each sample collection event. Sampling equipment will be decontaminated according to the following procedure:
• Initial rinse with site water to dislodge residual particles;
• Wash with brush and Alconox soap;
• Rinse with tap water;
• Rinse with methanol, nitric acid, or other cleaning solvent, if necessary; and
• Rinse with deionized water.
After cleaning, all sampling equipment not immediately used will be wrapped in foil to limit the risk of contamination. Cleaning solvents, such as hexane and/or nitric acid may be considered if heavy sheens/free product are present in the sample material. In general, core tubes will not be reused for sampling.
Hand processing work (e.g., using stainless steel spoons for extracting the sample from the split cores, mixing the samples and filling sample containers) will be conducted with disposable gloves, which will be rinsed with distilled water before and after handling each individual sample, as appropriate, to prevent sample contamination. Gloves will be disposed of between composites to prevent cross-contamination between the DMMUs.
3.9 QA/QC Samples Additional matrix spike/matrix spike duplicate (MS/MSD) samples will be collected for laboratory QA purposes. Samples will be collected from one station with sufficient sediment volume for analysis of volatiles, SVOCs, PCBs/pesticides, metals, and tributyl tin. Section 4.1.5 contains additional information on laboratory QA procedures.
3.10 Sample Transport and Chain of Custody Procedures Containerized sediment samples will be transported to the laboratories after compositing is completed. Specific sample shipping procedures will be as follows:
• Individual sample containers will be packed to prevent breakage and transported in a sealed ice chest or other suitable container; glass jars
I&J Waterway PSDDA Sediment Characterization Sampling and Analysis Plan - I&J Waterway, Bellingham, Washington
PORTB-18449-100 3-14
will be separated in the shipping container by shock-absorbent material (e.g., bubble wrap) to prevent breakage;
• Coolers will be packed with ice packs or crushed ice (sealed in plastic bags) to keep the samples at 4 °C ± 2 ºC;
• Cooler trip blanks will be included with volatile samples at a frequency of one per cooler;
• Each cooler or container containing the sediment samples for chemical analysis will be delivered to the laboratory within 24 hours of being sealed;
• The shipping containers will be clearly labeled with sufficient information (name of project, time and date container was sealed, person sealing the container, and consultant’s office name and address) to enable positive identification;
• A sealed envelope containing chain of custody forms will be enclosed in a plastic bag and taped to the inside lid of the cooler; and
• Signed and dated custody seals will be placed on all coolers prior to shipping.
Upon transfer to sample possession to the analytical laboratory, the custody form will be signed by the persons transferring custody of the sample container. Upon receipt of samples at the laboratory, the shipping container seal will be broken and the receiver will record the condition of the samples. Custody forms will be used internally in the lab to track sample handling and final disposition.
3.11 Health and Safety Prior to the initiation of any field activities, all parties with review, become familiar with, and sign off in acknowledgement of the Site-Specific Health and Safety Plan, provided under separate cover. Issues related to health and safety, including emergency plans and potentially dangerous situations, will be discussed at the start of each day of sampling, and potential corrective actions will be considered.
PORTB-18449-100 4-1
4 Chemical and Physical Testing This section provides an overview of the chemical and physical testing program. Samples will be analyzed in accordance with PSDDA guidelines by an Ecology-accredited laboratory using accredited methods. Table 4-1 presents the proposed analyte list, methods, and the target detection limits (TDLs).
4.1 Chemical Analyses Protocols Laboratory testing procedures will be conducted in accordance with the procedures specified in the PSDDA Evaluation Procedures Technical Appendix, June 1988; the PSDDA Phase II Management Plan Report, September 1989; and with the PSEP Recommended Protocols. These procedures are discussed below.
4.1.1 Chain of Custody A chain of custody record for each set of samples will be maintained throughout all sampling activities and will accompany samples during shipment to the laboratory. Information tracked by the chain of custody records include sample identification number, date and time of sample receipt, analytical parameters required, location and conditions of storage, signature of person relinquishing and receiving custody, and final disposition of the sample.
4.1.2 Chemical Analyte List and Methods A maximum of eight composited sediment samples will be analyzed for the full suite of PSDDA analytes listed in Table 4-1. Volatiles and sulfide subsamples will be collected from a randomly selected core section immediately upon extrusion of cores to avoid volatilization of potential contaminants and (for sulfides) to add necessary preservative. Samples will be submitted to ARI laboratory for chemical analysis.
4.1.3 Physical Analysis Grain size distribution of sediment samples will be determined using PSDDA-specified protocol (ASTM D-422 modified). Wet sieve analysis will be used to determine the size distribution greater than the U.S. No. 230 mesh sieve (sand and gravel fraction). The silt and clay fraction will be determined by the hydrometer method. One triplicate analysis of one sample will be performed for QA purposes. Sediment samples will be submitted to ARI laboratory for physical analysis.
4.1.4 Limits of Detection The sediment composite samples identified in Table 3-1 will be analyzed for each of the parameters listed in Table 4-1. The analytical test methods and
I&J Waterway PSDDA Sediment Characterization Sampling and Analysis Plan - I&J Waterway, Bellingham, Washington
PORTB-18449-100 4-2
reporting limits to be achieved by the analytical laboratory are also identified in Table 4-1. The testing laboratories are aware of the PSDDA detection limit requirements and will employ all reasonable means, including additional cleanup steps and method modifications, to reach these detection limits. Failure to reach PSDDA detection limits may result in a requirement to reanalyze or perform bioassays. All reasonable means, including additional cleanup steps and method modifications will be used to bring all limits-of-detection below PSDDA screening levels. Additionally, an aliquot (8-oz) of each sediment sample for analysis will be archived and preserved at –18 °C for additional analysis if necessary.
The following scenarios are possible and will be handled appropriately:
1) One or more chemicals-of-concern (COC) have limits of detection exceeding screening levels while all other COCs are quantitated or have limits of detection at or below the screening levels: the requirement to conduct biological testing would be triggered solely by limits of detection. In this case the chemical testing subcontractor will do everything possible to bring limits of detection down to or below the screening levels, including additional cleanup steps, re-extraction, etc. This is the only way to prevent unnecessary biological testing. If problems or questions arise, the chemical testing subcontractor will be directed to contact the Dredged Material Management Office.
2) One of more COCs have limits of detection exceeding screening levels for a lab sample, but below respective bioaccumulation triggers (BT) and maximum levels (ML), and other COCs have quantitated concentrations above screening levels: the need to do bioassays is based on the detected exceedances of SLs and the limits of detection above SL become irrelevant. No further action is necessary.
3) One or more COCs have limits of detection exceeding SL and exceeding BT or ML, and other COCs have quantitated concentrations above screening levels: the need to do bioassays is based on the detected exceedances of SLs but all other limits of detection must be brought below BTs and MLs to avoid the requirement to do bioaccumulation testing or special biological testing. As in case 1), everything possible will be done to lower the limits of detection.
4) One COC is quantitated at a level that exceeds ML by more than 100%, or more than one COC concentration exceeds ML: although there is reason to believe that the test sediment is unsuited for open-water disposal without additional chronic sublethal testing data, the standard suite of bioassay tests must be completed, and no additional testing is required by the program. However, the DMMP agencies
I&J Waterway PSDDA Sediment Characterization Sampling and Analysis Plan - I&J Waterway, Bellingham, Washington
PORTB-18449-100 4-3
retain the authority to require “additional, specialized” testing of any dredged material based on “reason-to-believe” whenever the disposal of that material is subject to 404 authority.
In all cases, to avoid potential problems and leave open the option for retesting, sediments or extracts will be kept under proper storage conditions until the chemistry data is deemed acceptable by the PSDDA agencies.
4.1.5 Quality Assurance/Quality Control The analyst will review results of the quality control samples from each sample group immediately after a sample group has been analyzed. The quality control sample results will then be evaluated to determine if control limits have been exceeded. If control limits are exceeded in the sample group, the Project QA Coordinator will be contacted immediately, and corrective action (e.g., method modifications followed by reprocessing the affected samples) will be initiated prior to processing a subsequent group of samples. A summary of the types of quality control procedures to be performed by the laboratories is presented in Table 4-2.
All samples for physical and chemical testing will be maintained at the testing laboratory in accordance with the sample holding limitations and storage temperature requirements listed in Table 3-3.
4.2 Laboratory Written Report A written report will be prepared by the analytical laboratories documenting the activities associated with sample analyses. Because of the possibility of additional bioassay testing, to the maximum extent practicable, all chemical results will be provided within 28 days of sampling to allow a timely decision for tiered biological testing. At a minimum, the following will be included in the report:
• Results of the laboratory analyses and QA/QC results;
• Protocols used during analyses;
• Chain of custody procedures, including explanation of any deviation from those identified herein;
• Any protocol deviations from the approved sampling plan; and
• Location and availability of data.
The final report will include QA2 deliverables, surrogate recoveries where appropriate, and sample custody information. QA2 deliverables are required for submission of the data into the SEDQUAL database maintained by the

I&J Waterway PSDDA Sediment Characterization Sampling and Analysis Plan - I&J Waterway, Bellingham, Washington
PORTB-18449-100 4-4
Department of Ecology. A list of QA2 deliverables is summarized in Attachment C. All data will be submitted to the Corps in the pre-tested DAIS format. The Corps will convert the DAIS data to SEDQUAL format and transfer to Ecology. Any QA problems (i.e., calibrations, internal standards) must be noted in the laboratory report narrative. Chemical data will be qualified in accordance with PSEP guidelines. The “J” qualifier will be applied to all concentrations that fall between the limit of detection and the laboratory’s method detection limit (MDL). Dilution volumes, sample sizes, percent moisture, and surrogate recoveries will be presented on each summary sheet with the analytical results in the data packages. Similar information will also be assembled for each QC sample (method blanks, matrix spikes, etc.).
4.3 Data Validation Within 14 days of receipt of the analytical results, the contractor will review all raw data to verify the laboratory has supplied the required QA/QC deliverables. The data will then be validated against QA1 and project criteria for inclusion into the sediment characterization reports.
All analytical results will be validated in accordance with PSDDA QA1 review (PTI, 1989). The QA1 review will evaluate the data for completeness, format, holding conditions, and laboratory QA sample results (e.g., blanks, matrix spikes). The data validation will also include a review of surrogate recovery values for each of the organic samples. Data validation checklists will be followed.
Where data fail criteria provided in the QA1 manual, the laboratory will be contacted, and the data will be: (1) reanalyzed, (2) qualified, or (3) discarded. Data quality issues will be summarized in a data validation report.
PORTB-18449-100 5-1
5 Biological Testing Bioassays will be conducted to determine whether chemicals of concern (COCs) outlined by PSDDA are present and bioavailable at concentrations that are toxic to biota. A tiered testing approach will be used. Bioassay procedures used in this program will be conducted in accordance with protocols recommended by PSEP (PSEP, 1995), in addition to standard laboratory procedures. Analyses will be required to conform to accepted standard methods and rigorous internal QA/QC checks prior to final approval. Vizon Scitec, an Ecology-accredited laboratory in Vancouver, B.C., will conduct the biological testing.
5.1 Bioassay Testing Approach Biological testing will be undertaken on any composite sample which has one or more chemicals of concern above the PSDDA screening level (SL) but below the PSDDA maximum level (ML), although a sample with a single ML exceedance which is less than or equal to two times the ML still qualifies for biological testing. If any COC exceeds a bioaccumulation trigger (BT), a decision will be made as to whether or not to pursue biological testing, which would include the standard suite of PSDDA bioassays plus bioaccumulation testing with Macoma and an adult polychaete (Nereis virens, Arenicola marina, or Nepthys caecoides). If bioaccumulation testing is performed, the organisms and exposure durations will be coordinated with the DMMP.
Adequate sample volume will be collected in the field for chemical, physical, and bioassay/bioaccumulation testing. To the extent practicable, chemical results will be provided for bioassay decisions within 28 days of the first sample collection.
5.2 Sample Handling Bioassay samples will be composited, placed in appropriate glass or plastic jars with minimal headspace, labeled, and stored on ice in insulated coolers while in the field; all under proper chain of custody procedures. Samples retained for biological analysis will be split from the same composited sample designated for chemical analysis. Table 3-3 specifies the sample jars and maximum allowable holding times for bioassay samples. Following the completion of each day’s sample collection, chain of custody forms will be completed for each set of samples.
Sediment samples collected for bioassay analyses will be delivered to the biological laboratory at the end of the sampling period. All samples delivered to the laboratory will be properly packed in coolers and maintained at 4 ºC. Original chain of custody forms and analysis request forms will accompany the samples to the laboratory. All bioassay analyses, including retests, will commence within 56 days after collection of the first core section of the
I&J Waterway PSDDA Sediment Characterization Sampling and Analysis Plan - I&J Waterway, Bellingham, Washington
PORTB-18449-100 5-2
sediment composite to be analyzed. No field duplicates will be submitted for biological testing.
5.3 Sediment Toxicity Tests The suite of biological tests is summarized in Table 5-1 and will consist of the following tests:
• Acute 10-day Amphipod Mortality (Eohaustorius estuarius, Rhepoxynius abronius or Ampelisca abdita);
• Acute 48-hour Larval Mortality/Abnormality (Dendraster excentricus, or Mytilus (edulis) galloprovincialis); and
• Chronic 20-day Juvenile Polychaete (Neanthes arenoceodentata).
The final selection of bioassay species will be approved by the PSDDA agencies. Some of the bioassay species show a sensitivity to high percentages of fine grained sediments. Some of the historic sediment samples located near the proposed coring locations contain large proportions of fines. It is possible some samples will contain more than 30% clay. Bioassay tests performed on sediment collected from cores with high clay content must use bioassay organisms that are insensitive to high fines content.
Other historical data collected from stations contained in the site DMMUs tend to be silty sand. If sediment conditions have not changed, bioassay tests performed on sediment collected from cores containing silty sand may use bioassay organisms that are not sensitive to sediments with high percentages of fines.
5.3.1 Species Selection
Amphipod Test The amphipod Rhepoxynius abronius has demonstrated sensitivity to high percent fines in sediments, particularly high clay content sediments, and has exhibited mortalities greater than 20 percent in clean, reference area sediments (DeWitt et al., 1988; Fox, 1993). Eohaustorius estuaries has also exhibited sensitivity to high clay content (>30%) despite being relatively insensitive to salinity changes and other effects of grain size. E. estuarius will be the preferred amphipod species unless clays are greater than 30 percent clay. A. abdita is relatively insensitive to grain size up to concentrations of fines greater than 60 percent (USACE, 2000). If clay is greater than 30% and fines are greater than 60 percent, A. abdita will be the preferred amphipod test species. If clay is more than 30% and fines are less than 60%, R. abronius
I&J Waterway PSDDA Sediment Characterization Sampling and Analysis Plan - I&J Waterway, Bellingham, Washington
PORTB-18449-100 5-3
will be used for testing. Table 5-1 summarizes the preferred bioassay test organisms for each DMMU composite sample.
Larval Test For the sediment larval test, adults must be collected in spawning condition or must be induced to spawn in the laboratory. Therefore, seasonality plays a role in selecting a test organism. The preferred species for larval testing is the sand dollar Dendraster excentricus. According to the Users Manual for the PSDDA program, D. excentricus spawns naturally in Puget Sound from April through December. Larvae of D. excentricus do not show an adverse response to increasing silt and clay fractions, and under conditions of expected high silts and clay, the sand dollar test is preferable (EPA, 1993). The bioassay laboratory has had success inducing spawning in D. excentricus, however, if spawning is unable to be induced, another species deemed acceptable for test sediments containing at least 60% fines is Mytilus (edulis) galloprovincialis. Although they spawn naturally in Puget Sound between March and July, (USACE, 2000), AMEC bioassay laboratory has had success inducing spawning in M. galloprovincialis. Table 5-1 indicates preferred larval bioassay test organism for each DMMU sample.
Prior to initiating bioassay testing, sediment grain size and interstitial salinity will be determined to confirm selection of the appropriate test species. If there is headspace in the jars, nitrogen will be added prior to storage (PSEP, 1995).
5.3.2 Procedures
Amphipod Bioassay This test involves exposing the amphipod Rhepoxynius abronius to test sediment for ten (10) days and counting the surviving animals at the end of the exposure period. Daily emergence data and the number of amphipods failing to rebury at the end of the test will be recorded as well. Amphipod mortality must meet the performance requirements defined in Table 5-2.
Sediment Larval Bioassay This test monitors larval development of a suitable echinoderm or bivalve species in the presence of test sediment. The test is run until the appropriate stage of development is achieved in a sacrificial seawater control (PSDDA MPR-Phase II, pp. 5-20). At the end of the test, larvae from each test sediment exposure are examined to quantify abnormality and mortality.
Performance standards of the larval test are defined in Table 5-2. Initial counts will be made for a minimum of five 10-ml aliquots. Final counts for seawater control, reference sediment and test sediment will be made on 10-ml
I&J Waterway PSDDA Sediment Characterization Sampling and Analysis Plan - I&J Waterway, Bellingham, Washington
PORTB-18449-100 5-4
aliquots. The sediment larval bioassay has a variable endpoint (not necessarily 48 hours) that is determined by the developmental stage of organisms in a sacrificial seawater control (PSDDA MPR Phase II, page 5-20).
Ammonia and sulfides toxicity may interfere with test results for this bioassay. Aeration will be conducted throughout the test to minimize these effects.
Neanthes Growth Test This test utilizes the polychaete Neanthes arenaceodentata, in a 20-day growth test. The growth rate of organisms exposed to test sediments is compared to the growth rate of organisms exposed to a reference sediment. Performance requirements for this test are defined in Table 5-2.
5.3.3 Negative Controls Negative control sediments are used in the amphipod and Neanthes bioassays to check laboratory performance. Negative control sediments are clean sediments in which the test organism normally lives and which are expected to produce low mortality. The sediment larval test utilizes a negative seawater control rather than a control sediment. The negative control to be used for the sediment toxicity test will be a clean control (i.e., inert material with site seawater) or native sediment where the organisms reside. Bioassay performance standards for negative controls are identified on Table 5-2.
5.3.4 Reference Sediment Reference sediments will also be included with each bioassay. Reference sediments provide toxicity data that can be used to separate toxicant effects from unrelated effects, such as those of sediment grain size and total organic carbon. Bioassay testing requires that test sediments be matched and tested simultaneously with an appropriate PSDDA-approved reference sediment to factor out sediment grain size effects on bioassay organisms.
One or two reference samples will be collected from Samish Bay or a similar reference site in Washington if substantially different grain sizes are encountered in the DMMU composite samples. Reference sediments will be collected using a 0.1-square-meter stainless van Veen grab sampler deployed by boat. Upon reaching the designated reference sediment location, a test grab sample will be collected and a subsample will be wet-sieved to determine grain size. If the grain size is not appropriate, the vessel position will be adjusted and another test grab will be collected. This procedure will be conducted until sediments with the proper grain size have been located. Multiple grab samples will then be taken until enough reference sediment is
I&J Waterway PSDDA Sediment Characterization Sampling and Analysis Plan - I&J Waterway, Bellingham, Washington
PORTB-18449-100 5-5
collected. A subsample of the final composite will be wet-sieved to verify the appropriate grain size.
Locations of reference station coordinates will be reported, with an accuracy of ± 3 meters. Reference sediment samples will also be tested for total solids, total volatile solids, total organic carbon, grain size, ammonia, and sulfides. Performance standards for bioassay testing with reference sediment are listed in Table 5-2.
5.3.5 Replication Five laboratory replicates of test sediments, reference sediments, and negative controls will be run for each bioassay.
5.3.6 Positive Controls A positive control will be run for each bioassay. The positive control to be used for the sediment toxicity test will be a toxic control in which a reference toxicant is used to establish the relative sensitivity of the test organism. Cadmium chloride will be the positive control reference toxicant used for the amphipod and juvenile polychaete bioassays. Copper sulfate will be the positive control reference toxicant used for the bivalve larvae bioassay. In addition, a water-only ammonia reference toxicant using measured ammonia concentrations will be used for the bivalve larvae bioassay, and a 10-day ammonia-spiked sediment test will be used as a positive control for the amphipod bioassay.
5.3.7 Water Quality Monitoring Bioassays require that proper water quality conditions be maintained to ensure survival of the organisms, and to ensure that undue stress is not exerted on the organisms unrelated to test sediments. Daily water quality measurements include salinity, temperature, pH, and dissolved oxygen for the amphipod and sediment larval tests. These measurements will be made every three days for the Neanthes bioassay. Ammonia and total sulfide concentrations in both porewater and overlying water will be measured at test initiation and termination for all three tests. Monitoring will be conducted for all test and reference sediments and negative controls (including seawater controls).
For the amphipod test, according to DMMP guidance implemented in the 2002 clarification paper (EPA, 2002), coordination with the DMMO should occur prior to testing regarding the need for purging if interstitial ammonia concentrations approach 30 mg/L total ammonia for A. abdita or R. abronius testing. If a value of one half of the threshold value for purging (15 mg/L total ammonia) for either amphipod species test is exceeded, an ammonia reference toxicant test (LC50) test must be performed to assist with test interpretation. Purging methods will follow that listed in the DMMP
I&J Waterway PSDDA Sediment Characterization Sampling and Analysis Plan - I&J Waterway, Bellingham, Washington
PORTB-18449-100 5-6
clarification paper (EPA, 2002), and ammonia will be reported for initial bulk sediment interstitial ammonia, total and unionized ammonia at test initiation (day 0) and day 10, overlying water ammonia should be reported as part of the regular daily water quality measurements, and LC50 water only experiment data should be reported.
Parameter measurements must be within the limits specified for each bioassay. Interstitial salinity will be documented at test initiation for the amphipod bioassay. Measurements for each treatment will be made on a separate chemistry beaker set up to be identical to the other replicates within the treatment group, including the addition of test organisms.
5.4 Interpretation Test interpretations consist of endpoint comparisons to controls and reference on an absolute percentage basis as well as statistical comparison to reference. Test interpretation will follow the guidelines established in the PSDDA Management Plan Report — Phase II and the minutes of the dredging year 1991 annual review meeting for the Neanthes bioassay, as modified by subsequent annual review proceedings and workshops. Current endpoints are those provided in the PSDDA Users Manual (February, 2000), which are reproduced in Table 5-2 as they pertain to the non-dispersive disposal sites.
5.5 Bioaccumulation Testing Bioaccumulation testing will be performed if any COC exceeds a bioaccumulation trigger (BT). An adult bivalve (Macoma nasuta) and an adult polychaete (Nereis virens, Arenicola marina, or Nephtys caecoides) will be used for bioaccumulation testing. Test organisms and exposure periods will be coordinated with the DMMP prior to testing.
5.6 Laboratory Reporting Requirements A written report will be prepared by the biological laboratory documenting the activities associated with the samples. The laboratory will be responsible for internal checks on data reporting and will correct errors identified during the quality assurance review. Bioassay laboratories must meet the DMMP QA2 deliverable requirements so that data may be incorporated into the SEDQUAL database. A list of QA2 deliverables is summarized in Attachment C. Elements of the report will include:
• A discussion of any deviations from methodology or problems with the process and procedures of analyses;
• Test methods used for bioassay testing and statistical analyses;

I&J Waterway PSDDA Sediment Characterization Sampling and Analysis Plan - I&J Waterway, Bellingham, Washington
PORTB-18449-100 5-7
• Sources and collection locations of all bioassay organisms;
• Results for survival, growth, reburial, abnormalities, water quality parameters, reference toxicant, and statistical analyses;
• Original data sheets for water quality, survival, growth, reburial, abnormalities, reference toxicant, and statistics;
• Original quality control checklists;
• Custody records; and
• Results of the laboratory bioassay analyses and QA/QC results, reported both in hard copy and in the USACE Dredged Analysis Information System (DAIS) data format. Raw data will be legibly written or typed. If data are unintelligible and cannot be interpreted by the DMMP agencies, a retest may be required.
PORTB-18449-100 6-1
6 Reporting and Deliverables RETEC will document all activities associated with collection, compositing, transportation, and analysis of samples. Data summary results will be presented in tabular form using maps and figures as appropriate. Laboratory analytical results/reports will be included as appendices along with the data validation reports. Results will be presented in a final report and discussed relative to the objectives of this sediment sampling effort. The results section will include, at a minimum, a discussion of the following issues:
• Sample Collection and General Observations � Type of sampling equipment used;
� Protocols and procedures used during sampling and testing and an explanation of any deviations from the sampling plan protocols;
� Descriptions and core logs of each sample, including penetration and recovery depths, compositing intervals, mudline elevation, grain size, and geologic contacts;
� Methods used to locate the sampling positions (within an accuracy of ±2 m);
� Maps and tables identifying locations where the sediment samples were collected, reported in latitude and longitude to the nearest tenth of a second, and in State Plane Coordinates; and
� A plan view of the project site showing the shoreline, bathymetry, and actual sampling locations.
• Analytical Testing Results � Chain of custody procedures used, and explanation of any
deviations from the sampling plan procedures.
• Tabular Summary � Tabular summary of chemical (dry weight) and physical data with
comparison to SMS and PSDDA criteria. Any PSDDA chemical exceedances will be highlighted and discussed. Trends in contaminant levels will be discussed, if apparent;
� Biological testing results, with comparisons to PSDDA biological testing criteria. Any failures of PSDDA toxicity and/or bioaccumulation criteria will be highlighted and discussed; and
� Final QA Report, which will identify any field and laboratory activities that deviated from the approved sampling plan and the referenced protocols. The QA Report will assess the overall validity of the collected data.
PORTB-18449-100 7-1
7 References Barton, J., 2002. Ammonia and Amphipod Toxicity Testing. Draft. DMMP
Clarification Paper. Prepared for the DMMP agencies by the United States Environmental Protection Agency, Region 10. Annual SMARM Meeting, Seattle, Washington. April 29.
Crumbling, D. M., 2001. Current Perspectives in Site Remediation and Monitoring: Clarifying DQO Terminology Usage to Support Modernization of Site Cleanup Practice. EPA 542-R-01-014. United States Environmental Protection Agency, Office of Solid Waste and Emergency Response. October.
Cubbage, Jim, 1993. Memorandum to Lucy Pebles of the Washington State Department of Ecology summarizing the results of sediment sampling performed at the Maritime Contractors, Inc. site in 1993.
Ecology, 1995. Sediment Management Standards: Chapter 173-204 WAC. Revised. Washington State Department of Ecology. December.
EPA, 2000. Data Quality Objectives Process for Hazardous Waste Site Investigations. EPA QA/G-4HW Final, EPA/600/R-00/007. United States Environmental Protection Agency, Office of Environmental Information. January.
EPA, 2002. Clarification Paper, Ammonia and Amphipod Testing. Prepared by Justine Barton, US EPA Region 10 for the DMMP agencies. Final paper June 15, 2002. (http://www.nws.usace.army.mil/publicmenu/DOCUMENTS/AmphAmmoniaClar20021.pdf)
GeoEngineers, 1996. Sediment Sampling Report for the Proposed Maritime Contractors, Inc. Pier Extension Project. Prepared for the Port of Bellingham.
Gries, T. H., 2001. Quality of Post-Dredge Sediment Surfaces. Final. DMMP Clarification Paper. Prepared for the DMMP agencies by the Washington State Department of Ecology. October 5.
Hart Crowser, 1997. Remedial Investigation Report: Whatcom Waterway Site, Bellingham, Washington. Draft. May 9.
Hoffman, E., 2002. Proposed Revisions to the Bioaccumulative Contaminants of Concern (BCOC) List. Review Draft. DMMP Issue Paper. Prepared for the DMMP agencies by the United States Environmental Protection Agency, Region 10. Annual SMARM Meeting, Seattle, Washington. May 1.
I&J Waterway PSDDA Sediment Characterization Sampling and Analysis Plan - I&J Waterway, Bellingham, Washington
PORTB-18449-100 7-2
Kendall, D. R. and R. McMillian, 2000. Clarifications to the DMMP Bioaccumulation Protocol. Final. DMMP Clarification Paper, SMS Technical Information Memorandum. Prepared for the DMMP/SMS agencies by the United States Army Corps of Engineers and Washington State Department of Ecology. June 15.
Landau Associates, Inc. 1994. Environmental Site Assessment: Proposed USCG Search and Rescue Station, Bellingham, Washington. July 15.
PSDDA, 1988. Evaluation Procedures: Technical Appendix – Phase I (Central Puget Sound). Puget Sound Dredged Disposal Analysis Reports. June.
PSDDA 1989. Puget Sound Disposal Analysis Management Plan Report – Phase II. Puget Sound Dredged Disposal Analysis Reports. September.
PSEP, 1995. Puget Sound Estuary Program: Recommended Protocols for Conducting Laboratory Bioassays on Puget Sound Sediments. Prepared for the United States Environmental Protection Agency, Region 10, and the Puget Sound Water Quality Authority. Puget Sound Water Quality Authority, Olympia, Washington.
PSEP, 1996a. Puget Sound Estuary Program: Recommended Guidelines for Sampling Marine Sediment, Water Column, and Tissue in Puget Sound. Prepared for the United States Environmental Protection Agency, Region 10, and the Puget Sound Water Quality Authority. Puget Sound Water Quality Authority, Olympia, Washington.
PSEP, 1996b. Puget Sound Estuary Program: Recommended Guidelines for Measuring Organic Compounds in Puget Sound Sediment and Tissue Samples. Prepared for the United States Environmental Protection Agency, Region 10, and the Puget Sound Water Quality Authority. Puget Sound Water Quality Authority, Olympia, Washington.
PSEP, 1996c. Puget Sound Estuary Program: Recommended Protocols for Measuring Metals in Puget Sound Sediment and Tissue Samples. Prepared for the United States Environmental Protection Agency, Region 10, and the Puget Sound Water Quality Authority. Puget Sound Water Quality Authority, Olympia, Washington.
PSEP, 1996d. Puget Sound Estuary Program: Recommended Quality Assurance and Quality Control Guidelines for Collection of Environmental Data on Puget Sound. Prepared for the United States Environmental Protection Agency, Region 10, and the Puget Sound Water Quality Authority. Puget Sound Water Quality Authority, Olympia, Washington.
I&J Waterway PSDDA Sediment Characterization Sampling and Analysis Plan - I&J Waterway, Bellingham, Washington
PORTB-18449-100 7-3
PSEP, 1998. 1998 Update and Evaluation of Puget Sound AET. Prepared by PTI Environmental Services for Puget Sound Estuary Program, United States Environmental Protection Agency, Office of Puget Sound, Seattle, Washington.
PTI, 1989. Puget Sound Dredged Disposal Analysis guidance manual: data quality evaluation for proposed dredged material disposal projects. Prepared for the Washington Department of Ecology, Olympia, WA. PTI Environmental Services, Bellevue, WA.
USACE, 1994. Requirements for the Preparation of Sampling and Analysis Plans. United States Army Corps of Engineers.
USACE/EPA, 1991. Evaluation of Dredged Material Proposed for Ocean Disposal Testing Manual. EPA-503/8-91/001. United States Army Corps of Engineers and United States Environmental Protection Agency. February.
West Central Environmental Consultants and ThermoRetec, 2000. Work Plan for a Remedial Investigation/Feasibility Study at the Olivine Site at Hilton Avenue. Prepared for the Port of Bellingham. June 8.

Tables
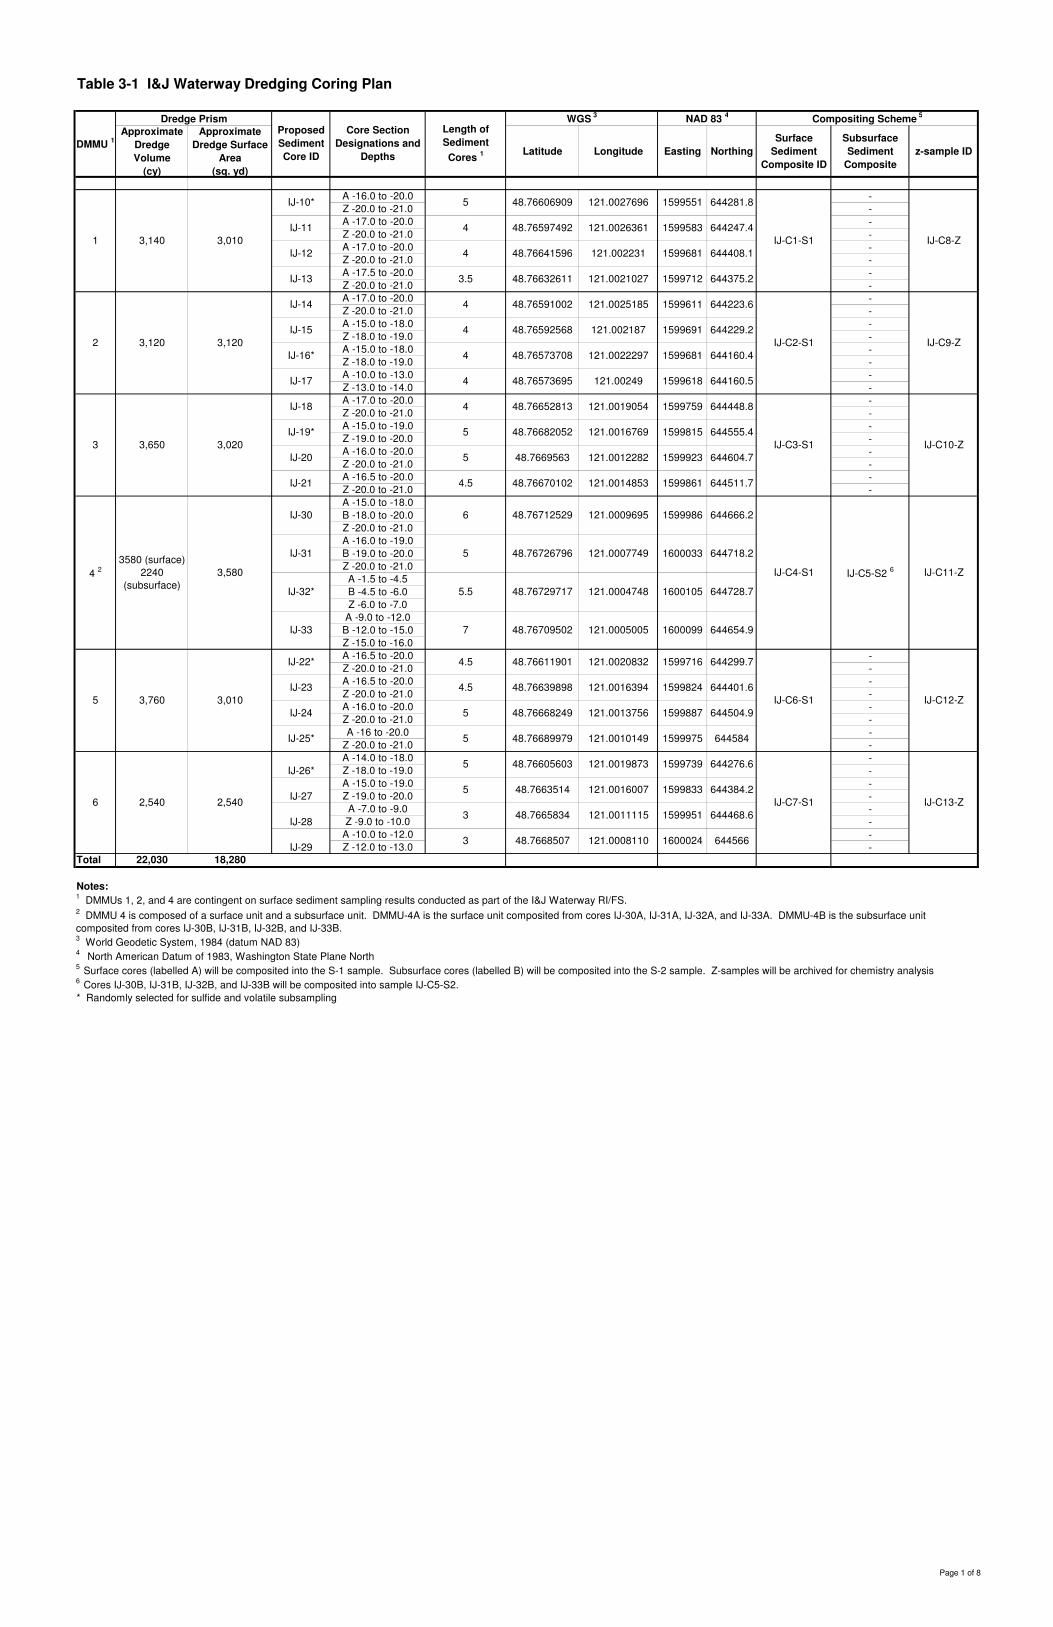
Table 3-1 I&J Waterway Dredging Coring Plan
Approximate Dredge Volume
(cy)
Approximate Dredge Surface
Area (sq. yd)
Latitude Longitude Easting NorthingSurface
Sediment Composite ID
Subsurface Sediment
Compositez-sample ID
A -16.0 to -20.0 -Z -20.0 to -21.0 -A -17.0 to -20.0 -Z -20.0 to -21.0 -A -17.0 to -20.0 -Z -20.0 to -21.0 -A -17.5 to -20.0 -Z -20.0 to -21.0 -A -17.0 to -20.0 -Z -20.0 to -21.0 -A -15.0 to -18.0 -Z -18.0 to -19.0 -A -15.0 to -18.0 -Z -18.0 to -19.0 -A -10.0 to -13.0 -Z -13.0 to -14.0 -A -17.0 to -20.0 -Z -20.0 to -21.0 -A -15.0 to -19.0 -Z -19.0 to -20.0 -A -16.0 to -20.0 -Z -20.0 to -21.0 -A -16.5 to -20.0 -Z -20.0 to -21.0 -A -15.0 to -18.0B -18.0 to -20.0Z -20.0 to -21.0A -16.0 to -19.0B -19.0 to -20.0Z -20.0 to -21.0A -1.5 to -4.5B -4.5 to -6.0Z -6.0 to -7.0
A -9.0 to -12.0B -12.0 to -15.0Z -15.0 to -16.0A -16.5 to -20.0 -Z -20.0 to -21.0 -A -16.5 to -20.0 -Z -20.0 to -21.0 -A -16.0 to -20.0 -Z -20.0 to -21.0 -A -16 to -20.0 -
Z -20.0 to -21.0 -A -14.0 to -18.0 -Z -18.0 to -19.0 -A -15.0 to -19.0 -Z -19.0 to -20.0 -A -7.0 to -9.0 -Z -9.0 to -10.0 -
A -10.0 to -12.0 -Z -12.0 to -13.0 -
Total 22,030 18,280
Notes:1 DMMUs 1, 2, and 4 are contingent on surface sediment sampling results conducted as part of the I&J Waterway RI/FS.
3 World Geodetic System, 1984 (datum NAD 83)4 North American Datum of 1983, Washington State Plane North5 Surface cores (labelled A) will be composited into the S-1 sample. Subsurface cores (labelled B) will be composited into the S-2 sample. Z-samples will be archived for chemistry analysis6 Cores IJ-30B, IJ-31B, IJ-32B, and IJ-33B will be composited into sample IJ-C5-S2.* Randomly selected for sulfide and volatile subsampling
644160.41599681
1599618 644160.5
644223.61599611
1599691 644229.2
644408.11599681
1599712 644375.2
644281.81599551
1599583 644247.4
644728.71600105
1600099 644654.9
644666.21599986
1600033 644718.2
644555.4
644604.71599923
1599861 644511.7
1599759
1599815121.001676948.76682052
121.001905448.76652813
1599716
644401.61599824
121.0005005
121.0020832 644299.7
121.001987348.76605603
121.001014948.76689979
121.001111548.7665834
121.001600748.7663514
6445661600024121.000811048.7668507
1599739
644384.21599833
644468.61599951
644276.6
121.002636148.76597492
121.002769648.76606909
121.002102748.76632611
121.00223148.76641596
121.00218748.76592568
121.002518548.76591002
48.76639898
121.0024948.76573695
121.002229748.76573708
48.76709502
121.0004748
121.001485348.76670102
48.76729717
5
121.001228248.7669563
IJ-C13-Z
IJ-C11-Z
IJ-C10-Z
IJ-C7-S1
121.001375648.76668249
121.0016394
IJ-12
IJ-33
IJ-C9-Z
Dredge PrismProposed Sediment Core ID
IJ-11
IJ-10*
3.5
4
4
6 2,540
4
3
32,540
IJ-24
IJ-29
IJ-21
IJ-25*
Core Section Designations and
Depths
Length of Sediment Cores 1
IJ-18
IJ-17
IJ-16*
IJ-15
IJ-14
IJ-13
4
4
NAD 83 4 Compositing Scheme 5
IJ-C5-S2 6
IJ-C12-Z
IJ-C8-Z
644504.91599887
6445841599975
644448.8
WGS 3
DMMU 1
IJ-C3-S1
IJ-C2-S1
IJ-C1-S1
4.5
5
5
4
4
3 3,650 3,020
IJ-30
4 23580 (surface)
2240 (subsurface)
IJ-20
IJ-19*
1 3,140 3,010
2 3,120 3,120
IJ-C4-S1
6
4.5
4.5
7
121.000969548.76712529
121.000774948.76726796
5.5
2 DMMU 4 is composed of a surface unit and a subsurface unit. DMMU-4A is the surface unit composited from cores IJ-30A, IJ-31A, IJ-32A, and IJ-33A. DMMU-4B is the subsurface unit composited from cores IJ-30B, IJ-31B, IJ-32B, and IJ-33B.
5
5
5
IJ-C6-S1
48.76611901
IJ-26*
IJ-27
IJ-28
55
3,760 3,010
3,580
IJ-32*
IJ-31
IJ-23
IJ-22*
5
Page 1 of 8
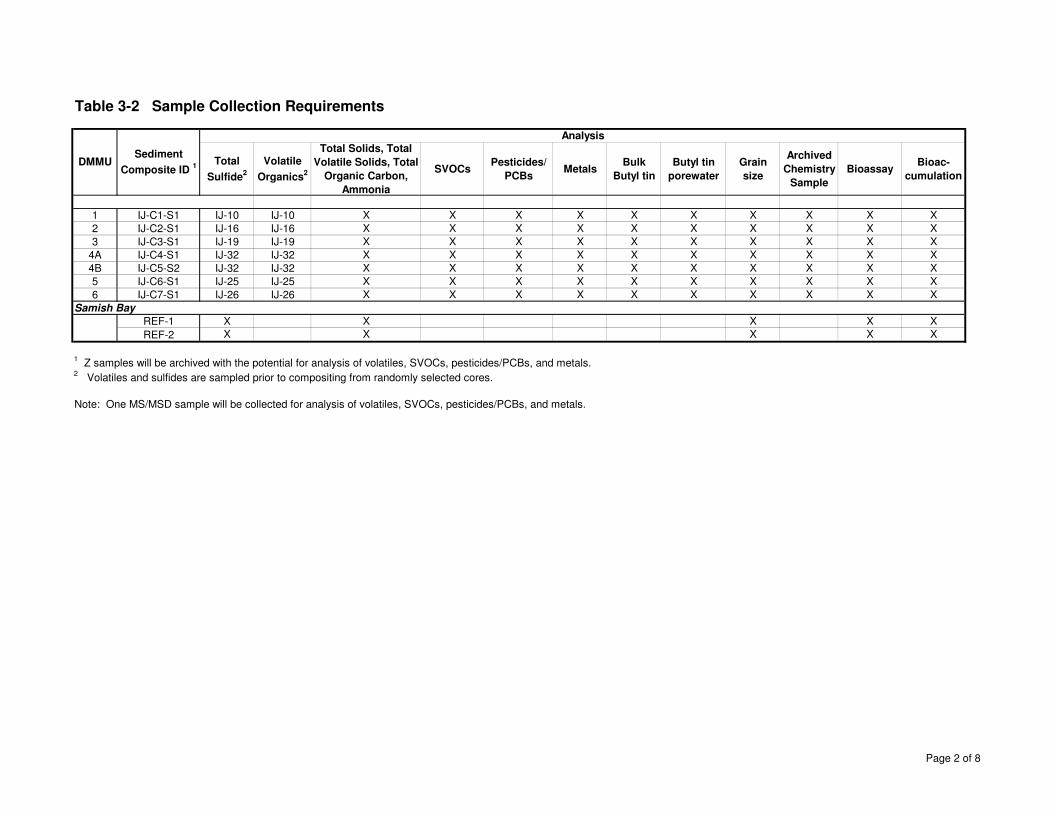
Table 3-2 Sample Collection Requirements
Total Sulfide2
Volatile Organics2
Total Solids, Total Volatile Solids, Total
Organic Carbon, Ammonia
SVOCsPesticides/
PCBsMetals
Bulk Butyl tin
Butyl tin porewater
Grain size
Archived Chemistry
SampleBioassay
Bioac-cumulation
1 IJ-C1-S1 IJ-10 IJ-10 X X X X X X X X X X2 IJ-C2-S1 IJ-16 IJ-16 X X X X X X X X X X3 IJ-C3-S1 IJ-19 IJ-19 X X X X X X X X X X
4A IJ-C4-S1 IJ-32 IJ-32 X X X X X X X X X X4B IJ-C5-S2 IJ-32 IJ-32 X X X X X X X X X X5 IJ-C6-S1 IJ-25 IJ-25 X X X X X X X X X X6 IJ-C7-S1 IJ-26 IJ-26 X X X X X X X X X X
Samish BayREF-1 X X X X XREF-2 X X X X X
1 Z samples will be archived with the potential for analysis of volatiles, SVOCs, pesticides/PCBs, and metals.2 Volatiles and sulfides are sampled prior to compositing from randomly selected cores.
Note: One MS/MSD sample will be collected for analysis of volatiles, SVOCs, pesticides/PCBs, and metals.
DMMUSediment
Composite ID 1
Analysis
Page 2 of 8
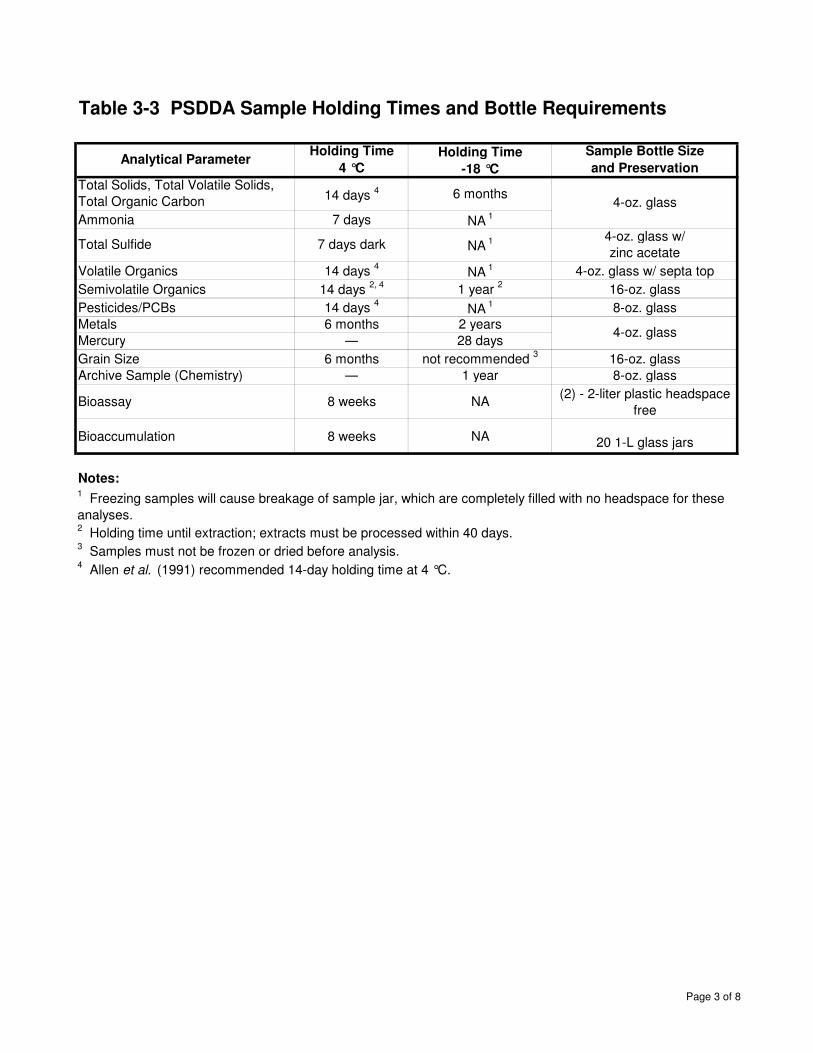
Table 3-3 PSDDA Sample Holding Times and Bottle Requirements
Holding Time -18 °C
Total Solids, Total Volatile Solids, Total Organic Carbon 14 days 4 6 months
Ammonia 7 days NA 1
4-oz. glass w/zinc acetate
Volatile Organics 14 days 4 NA 1 4-oz. glass w/ septa topSemivolatile Organics 14 days 2, 4 1 year 2 16-oz. glassPesticides/PCBs 14 days 4 NA 1 8-oz. glassMetals 6 months 2 yearsMercury — 28 daysGrain Size 6 months not recommended 3 16-oz. glassArchive Sample (Chemistry) — 1 year 8-oz. glass
Bioassay 8 weeks NA (2) - 2-liter plastic headspace free
Bioaccumulation 8 weeks NA 20 1-L glass jars
Notes:
2 Holding time until extraction; extracts must be processed within 40 days.3 Samples must not be frozen or dried before analysis.4 Allen et al. (1991) recommended 14-day holding time at 4 °C.
1 Freezing samples will cause breakage of sample jar, which are completely filled with no headspace for these analyses.
Analytical ParameterHolding Time
4 °CSample Bottle Size and Preservation
Total Sulfide 7 days dark NA 1
4-oz. glass
4-oz. glass
Page 3 of 8
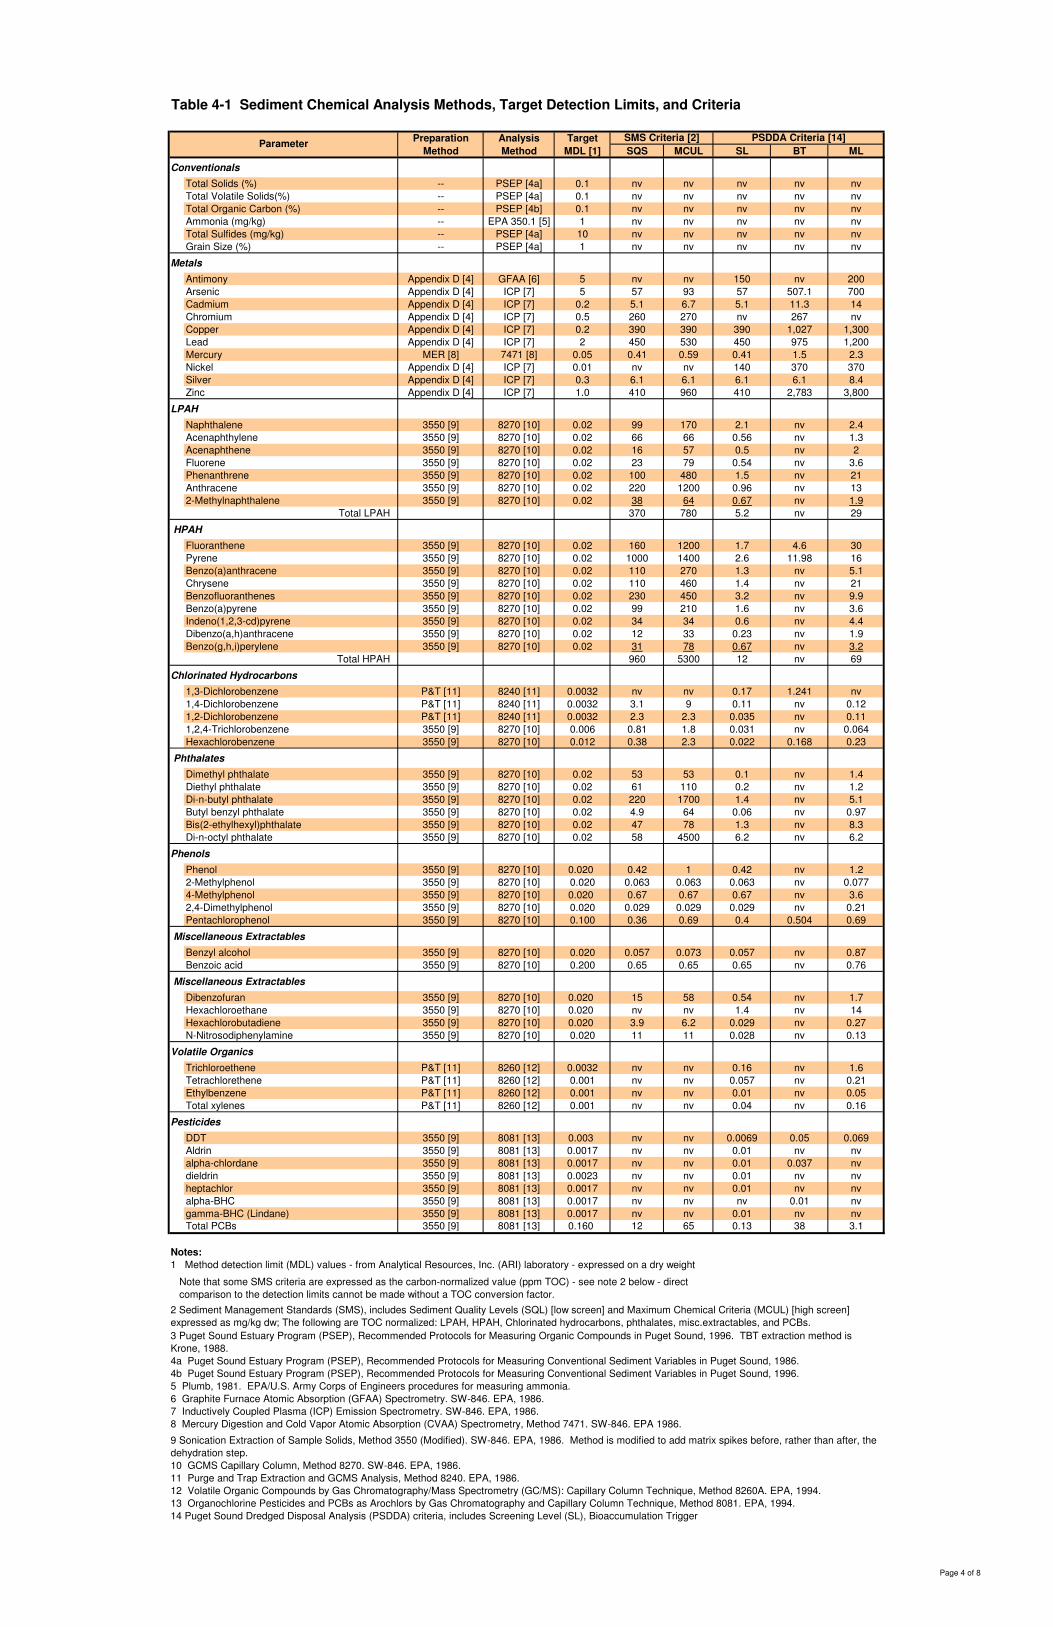
Table 4-1 Sediment Chemical Analysis Methods, Target Detection Limits, and Criteria
Preparation Analysis TargetMethod Method MDL [1] SQS MCUL SL BT ML
Conventionals
Total Solids (%) -- PSEP [4a] 0.1 nv nv nv nv nvTotal Volatile Solids(%) -- PSEP [4a] 0.1 nv nv nv nv nvTotal Organic Carbon (%) -- PSEP [4b] 0.1 nv nv nv nv nvAmmonia (mg/kg) -- EPA 350.1 [5] 1 nv nv nv nv nvTotal Sulfides (mg/kg) -- PSEP [4a] 10 nv nv nv nv nvGrain Size (%) -- PSEP [4a] 1 nv nv nv nv nv
Metals
Antimony Appendix D [4] GFAA [6] 5 nv nv 150 nv 200Arsenic Appendix D [4] ICP [7] 5 57 93 57 507.1 700Cadmium Appendix D [4] ICP [7] 0.2 5.1 6.7 5.1 11.3 14Chromium Appendix D [4] ICP [7] 0.5 260 270 nv 267 nvCopper Appendix D [4] ICP [7] 0.2 390 390 390 1,027 1,300Lead Appendix D [4] ICP [7] 2 450 530 450 975 1,200Mercury MER [8] 7471 [8] 0.05 0.41 0.59 0.41 1.5 2.3Nickel Appendix D [4] ICP [7] 0.01 nv nv 140 370 370Silver Appendix D [4] ICP [7] 0.3 6.1 6.1 6.1 6.1 8.4Zinc Appendix D [4] ICP [7] 1.0 410 960 410 2,783 3,800
LPAH
Naphthalene 3550 [9] 8270 [10] 0.02 99 170 2.1 nv 2.4Acenaphthylene 3550 [9] 8270 [10] 0.02 66 66 0.56 nv 1.3Acenaphthene 3550 [9] 8270 [10] 0.02 16 57 0.5 nv 2Fluorene 3550 [9] 8270 [10] 0.02 23 79 0.54 nv 3.6Phenanthrene 3550 [9] 8270 [10] 0.02 100 480 1.5 nv 21Anthracene 3550 [9] 8270 [10] 0.02 220 1200 0.96 nv 132-Methylnaphthalene 3550 [9] 8270 [10] 0.02 38 64 0.67 nv 1.9
Total LPAH 370 780 5.2 nv 29
HPAH
Fluoranthene 3550 [9] 8270 [10] 0.02 160 1200 1.7 4.6 30Pyrene 3550 [9] 8270 [10] 0.02 1000 1400 2.6 11.98 16Benzo(a)anthracene 3550 [9] 8270 [10] 0.02 110 270 1.3 nv 5.1Chrysene 3550 [9] 8270 [10] 0.02 110 460 1.4 nv 21Benzofluoranthenes 3550 [9] 8270 [10] 0.02 230 450 3.2 nv 9.9Benzo(a)pyrene 3550 [9] 8270 [10] 0.02 99 210 1.6 nv 3.6Indeno(1,2,3-cd)pyrene 3550 [9] 8270 [10] 0.02 34 34 0.6 nv 4.4Dibenzo(a,h)anthracene 3550 [9] 8270 [10] 0.02 12 33 0.23 nv 1.9Benzo(g,h,i)perylene 3550 [9] 8270 [10] 0.02 31 78 0.67 nv 3.2
Total HPAH 960 5300 12 nv 69
Chlorinated Hydrocarbons
1,3-Dichlorobenzene P&T [11] 8240 [11] 0.0032 nv nv 0.17 1.241 nv1,4-Dichlorobenzene P&T [11] 8240 [11] 0.0032 3.1 9 0.11 nv 0.121,2-Dichlorobenzene P&T [11] 8240 [11] 0.0032 2.3 2.3 0.035 nv 0.111,2,4-Trichlorobenzene 3550 [9] 8270 [10] 0.006 0.81 1.8 0.031 nv 0.064Hexachlorobenzene 3550 [9] 8270 [10] 0.012 0.38 2.3 0.022 0.168 0.23
Phthalates
Dimethyl phthalate 3550 [9] 8270 [10] 0.02 53 53 0.1 nv 1.4Diethyl phthalate 3550 [9] 8270 [10] 0.02 61 110 0.2 nv 1.2Di-n-butyl phthalate 3550 [9] 8270 [10] 0.02 220 1700 1.4 nv 5.1Butyl benzyl phthalate 3550 [9] 8270 [10] 0.02 4.9 64 0.06 nv 0.97Bis(2-ethylhexyl)phthalate 3550 [9] 8270 [10] 0.02 47 78 1.3 nv 8.3Di-n-octyl phthalate 3550 [9] 8270 [10] 0.02 58 4500 6.2 nv 6.2
Phenols
Phenol 3550 [9] 8270 [10] 0.020 0.42 1 0.42 nv 1.22-Methylphenol 3550 [9] 8270 [10] 0.020 0.063 0.063 0.063 nv 0.0774-Methylphenol 3550 [9] 8270 [10] 0.020 0.67 0.67 0.67 nv 3.62,4-Dimethylphenol 3550 [9] 8270 [10] 0.020 0.029 0.029 0.029 nv 0.21Pentachlorophenol 3550 [9] 8270 [10] 0.100 0.36 0.69 0.4 0.504 0.69
Miscellaneous Extractables
Benzyl alcohol 3550 [9] 8270 [10] 0.020 0.057 0.073 0.057 nv 0.87Benzoic acid 3550 [9] 8270 [10] 0.200 0.65 0.65 0.65 nv 0.76
Miscellaneous Extractables
Dibenzofuran 3550 [9] 8270 [10] 0.020 15 58 0.54 nv 1.7Hexachloroethane 3550 [9] 8270 [10] 0.020 nv nv 1.4 nv 14Hexachlorobutadiene 3550 [9] 8270 [10] 0.020 3.9 6.2 0.029 nv 0.27N-Nitrosodiphenylamine 3550 [9] 8270 [10] 0.020 11 11 0.028 nv 0.13
Volatile Organics
Trichloroethene P&T [11] 8260 [12] 0.0032 nv nv 0.16 nv 1.6Tetrachlorethene P&T [11] 8260 [12] 0.001 nv nv 0.057 nv 0.21Ethylbenzene P&T [11] 8260 [12] 0.001 nv nv 0.01 nv 0.05Total xylenes P&T [11] 8260 [12] 0.001 nv nv 0.04 nv 0.16
Pesticides
DDT 3550 [9] 8081 [13] 0.003 nv nv 0.0069 0.05 0.069Aldrin 3550 [9] 8081 [13] 0.0017 nv nv 0.01 nv nvalpha-chlordane 3550 [9] 8081 [13] 0.0017 nv nv 0.01 0.037 nvdieldrin 3550 [9] 8081 [13] 0.0023 nv nv 0.01 nv nvheptachlor 3550 [9] 8081 [13] 0.0017 nv nv 0.01 nv nvalpha-BHC 3550 [9] 8081 [13] 0.0017 nv nv nv 0.01 nvgamma-BHC (Lindane) 3550 [9] 8081 [13] 0.0017 nv nv 0.01 nv nvTotal PCBs 3550 [9] 8081 [13] 0.160 12 65 0.13 38 3.1
Notes:
5 Plumb, 1981. EPA/U.S. Army Corps of Engineers procedures for measuring ammonia.6 Graphite Furnace Atomic Absorption (GFAA) Spectrometry. SW-846. EPA, 1986.7 Inductively Coupled Plasma (ICP) Emission Spectrometry. SW-846. EPA, 1986.8 Mercury Digestion and Cold Vapor Atomic Absorption (CVAA) Spectrometry, Method 7471. SW-846. EPA 1986.
10 GCMS Capillary Column, Method 8270. SW-846. EPA, 1986.11 Purge and Trap Extraction and GCMS Analysis, Method 8240. EPA, 1986.
2 Sediment Management Standards (SMS), includes Sediment Quality Levels (SQL) [low screen] and Maximum Chemical Criteria (MCUL) [high screen] expressed as mg/kg dw; The following are TOC normalized: LPAH, HPAH, Chlorinated hydrocarbons, phthalates, misc.extractables, and PCBs.
14 Puget Sound Dredged Disposal Analysis (PSDDA) criteria, includes Screening Level (SL), Bioaccumulation Trigger
3 Puget Sound Estuary Program (PSEP), Recommended Protocols for Measuring Organic Compounds in Puget Sound, 1996. TBT extraction method is Krone, 1988.4a Puget Sound Estuary Program (PSEP), Recommended Protocols for Measuring Conventional Sediment Variables in Puget Sound, 1986.4b Puget Sound Estuary Program (PSEP), Recommended Protocols for Measuring Conventional Sediment Variables in Puget Sound, 1996.
9 Sonication Extraction of Sample Solids, Method 3550 (Modified). SW-846. EPA, 1986. Method is modified to add matrix spikes before, rather than after, the dehydration step.
12 Volatile Organic Compounds by Gas Chromatography/Mass Spectrometry (GC/MS): Capillary Column Technique, Method 8260A. EPA, 1994.13 Organochlorine Pesticides and PCBs as Arochlors by Gas Chromatography and Capillary Column Technique, Method 8081. EPA, 1994.
1 Method detection limit (MDL) values - from Analytical Resources, Inc. (ARI) laboratory - expressed on a dry weight
Note that some SMS criteria are expressed as the carbon-normalized value (ppm TOC) - see note 2 below - direct comparison to the detection limits cannot be made without a TOC conversion factor.
SMS Criteria [2] PSDDA Criteria [14]Parameter
Page 4 of 8
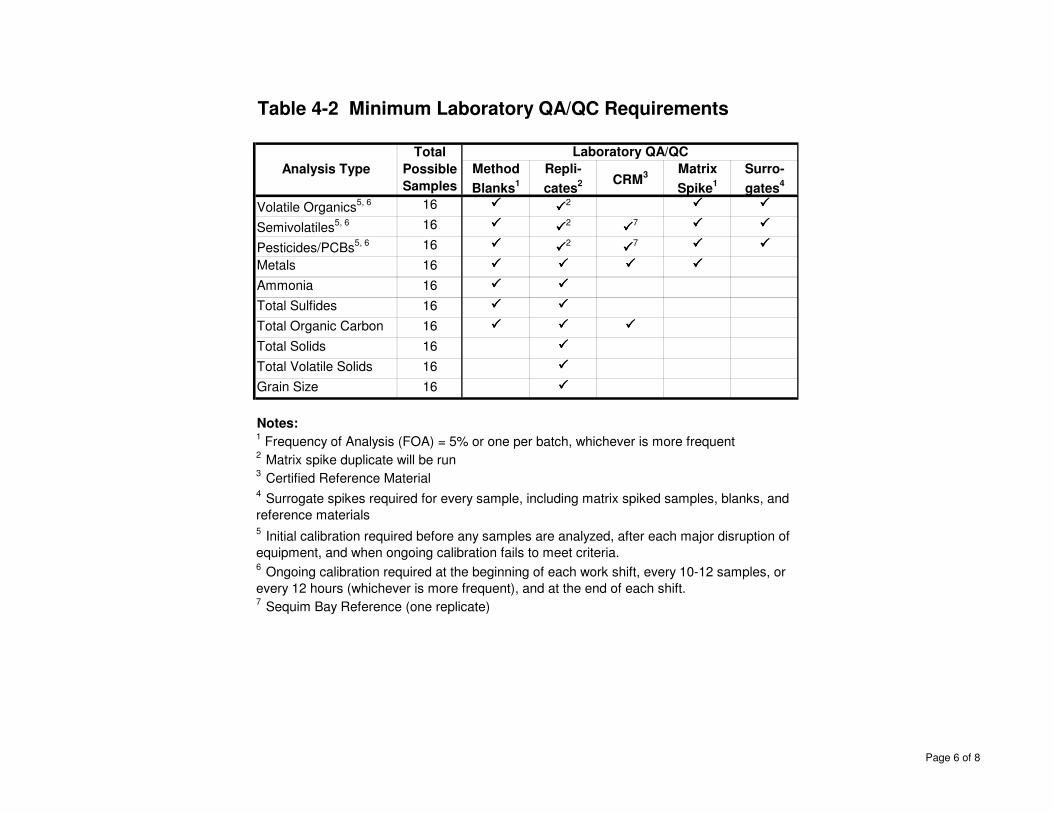
Table 4-2 Minimum Laboratory QA/QC Requirements
Method Blanks1
Repli-cates2 CRM3 Matrix
Spike1Surro-gates4
Volatile Organics5, 6 16 ���� ����2 ���� ����
Semivolatiles5, 6 16 ���� ����2
����7 ���� ����
Pesticides/PCBs5, 6 16 ���� ����2
����7 ���� ����
Metals 16 ���� ���� ���� ����
Ammonia 16 ���� ����
Total Sulfides 16 ���� ����
Total Organic Carbon 16 ���� ���� ����
Total Solids 16 ����
Total Volatile Solids 16 ����
Grain Size 16 ����
Notes:
3 Certified Reference Material
Analysis TypeTotal
Possible Samples
7 Sequim Bay Reference (one replicate)
Laboratory QA/QC
4 Surrogate spikes required for every sample, including matrix spiked samples, blanks, and reference materials5 Initial calibration required before any samples are analyzed, after each major disruption of equipment, and when ongoing calibration fails to meet criteria.6 Ongoing calibration required at the beginning of each work shift, every 10-12 samples, or every 12 hours (whichever is more frequent), and at the end of each shift.
1 Frequency of Analysis (FOA) = 5% or one per batch, whichever is more frequent2 Matrix spike duplicate will be run
Page 6 of 8
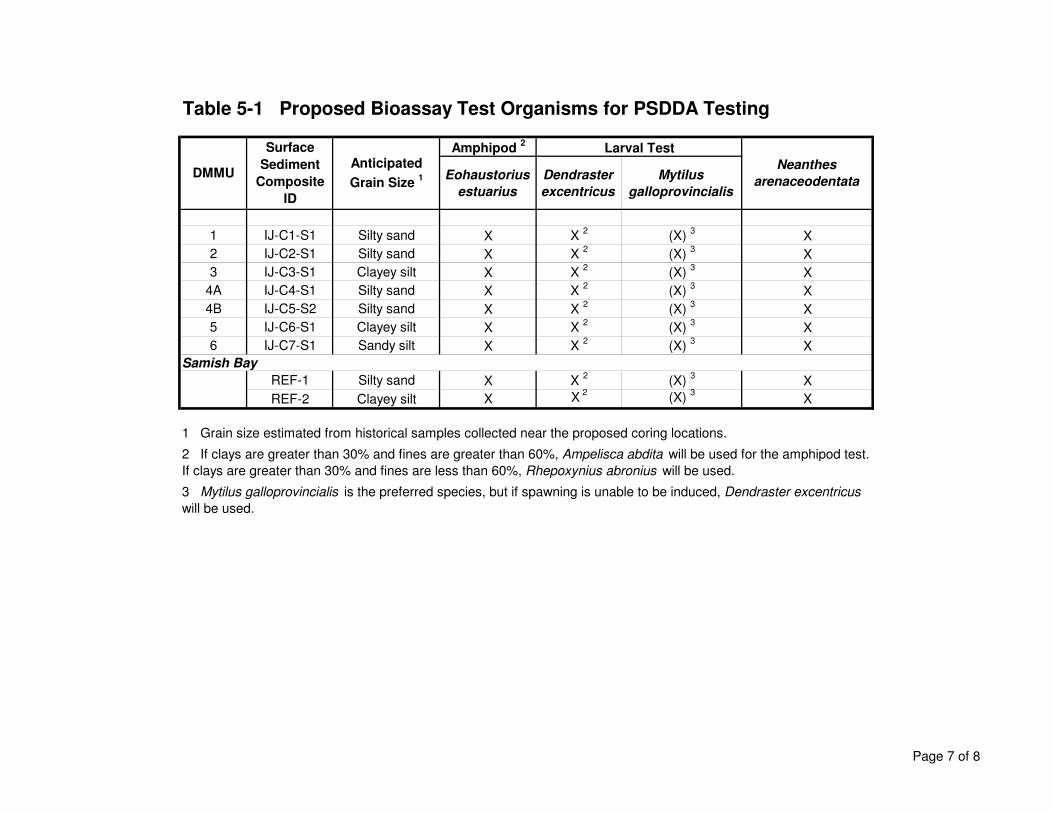
Table 5-1 Proposed Bioassay Test Organisms for PSDDA Testing
Amphipod 2
Eohaustorius estuarius
Dendraster excentricus
Mytilus galloprovincialis
1 IJ-C1-S1 Silty sand X X 2 (X) 3 X2 IJ-C2-S1 Silty sand X X 2 (X) 3 X3 IJ-C3-S1 Clayey silt X X 2 (X) 3 X
4A IJ-C4-S1 Silty sand X X 2 (X) 3 X4B IJ-C5-S2 Silty sand X X 2 (X) 3 X5 IJ-C6-S1 Clayey silt X X 2 (X) 3 X6 IJ-C7-S1 Sandy silt X X 2 (X) 3 X
Samish BayREF-1 Silty sand X X 2 (X) 3 XREF-2 Clayey silt X X 2 (X) 3 X
1 Grain size estimated from historical samples collected near the proposed coring locations.
3 Mytilus galloprovincialis is the preferred species, but if spawning is unable to be induced, Dendraster excentricus will be used.
2 If clays are greater than 30% and fines are greater than 60%, Ampelisca abdita will be used for the amphipod test. If clays are greater than 30% and fines are less than 60%, Rhepoxynius abronius will be used.
Neanthes arenaceodentata
Larval Test
DMMU
Surface Sediment
Composite ID
Anticipated Grain Size 1
Page 7 of 8

Table 5-2 PSDDA Bioassay Evaluation Guidelines
1-hit Rule 2-hit Rule 1-hit Rule 2-hit Rule
MT - MR > 10% NOCN MT - MR > 30% NOCN
NR/NC - NT/NC > 0.15 NOCN NR/NC - NT/NC > 0.30 NOCN
MC � 10% MR � 20%
and and
MIGC � 0.38 'MIGR ÷ MIGC � 0.80
MIGT/MIGR < 0.70 NOCN MIGT/MIGR < 0.50 MIGT/MIGR < 0.70
Notes:I - Initial countM - MortalityMIG - Mean individual growth rateN - NormalsNOCN - No other conditions necessarySD - Statistically differentSubscripts:
C - Negative controlR - Reference sedimentT - Test sediment
MIGT ÷ MIGC < 0.80
and
MIGT vs MIGR SD (p = 0.05)
and
MIGT ÷ MIGC < 0.80
and
MIGT vs MIGR SD (p = 0.05)
and
Neanthes growth
NT/NC vs NR/NC SD (p = 0.10)
and
NT ÷ NC < 0.80
and
NT/NC vs NR/NC SD (p = 0.10)
and
NR ÷ NC � 0.65NC ÷ I � 0.70Larval
MT vs MR SD (p = 0.05)
and
NT ÷ NC < 0.80
and
MT vs MR SD (p = 0.05)
and
Dispersive Disposal Site Interpretation Guidelines
Nondispersive Disposal Site Interpretation Guidelines
MT - MC > 20%
and
MT - MC > 20%
and
Bioassay
Negative Control
Performance Standard
Reference Sediment Performance Standard
Amphipod MC � 10% MR - MC � 20%
Page 8 of 8

Figures
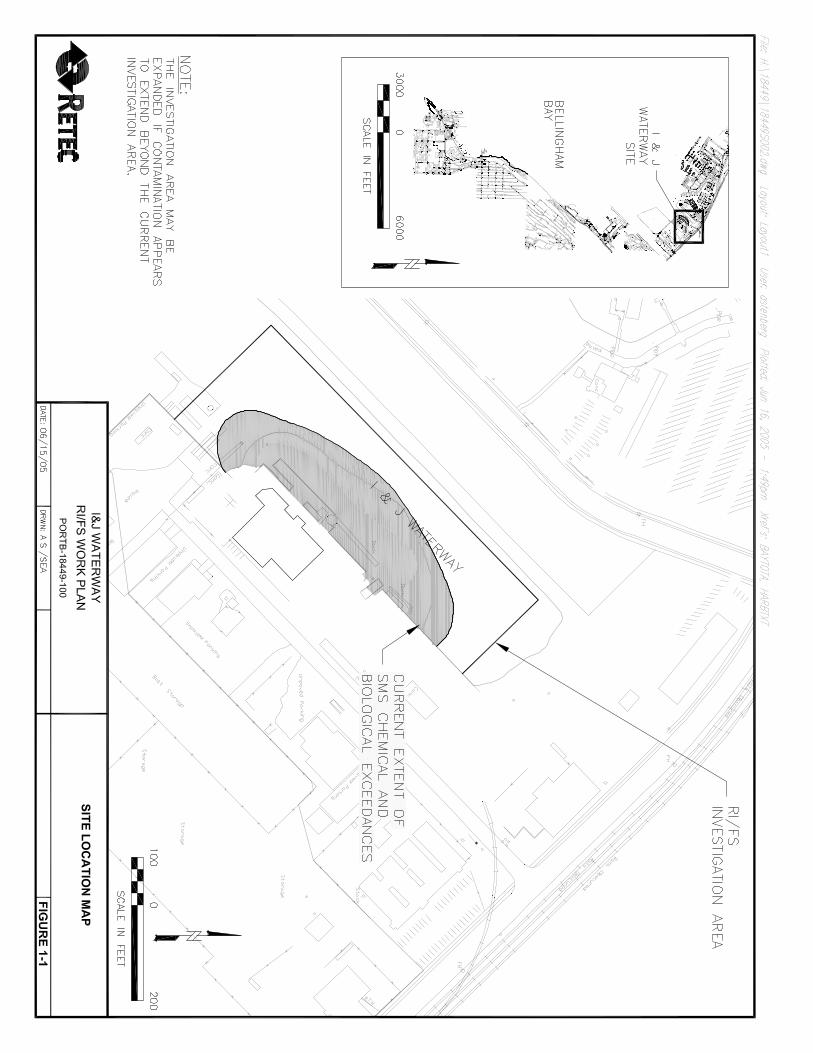
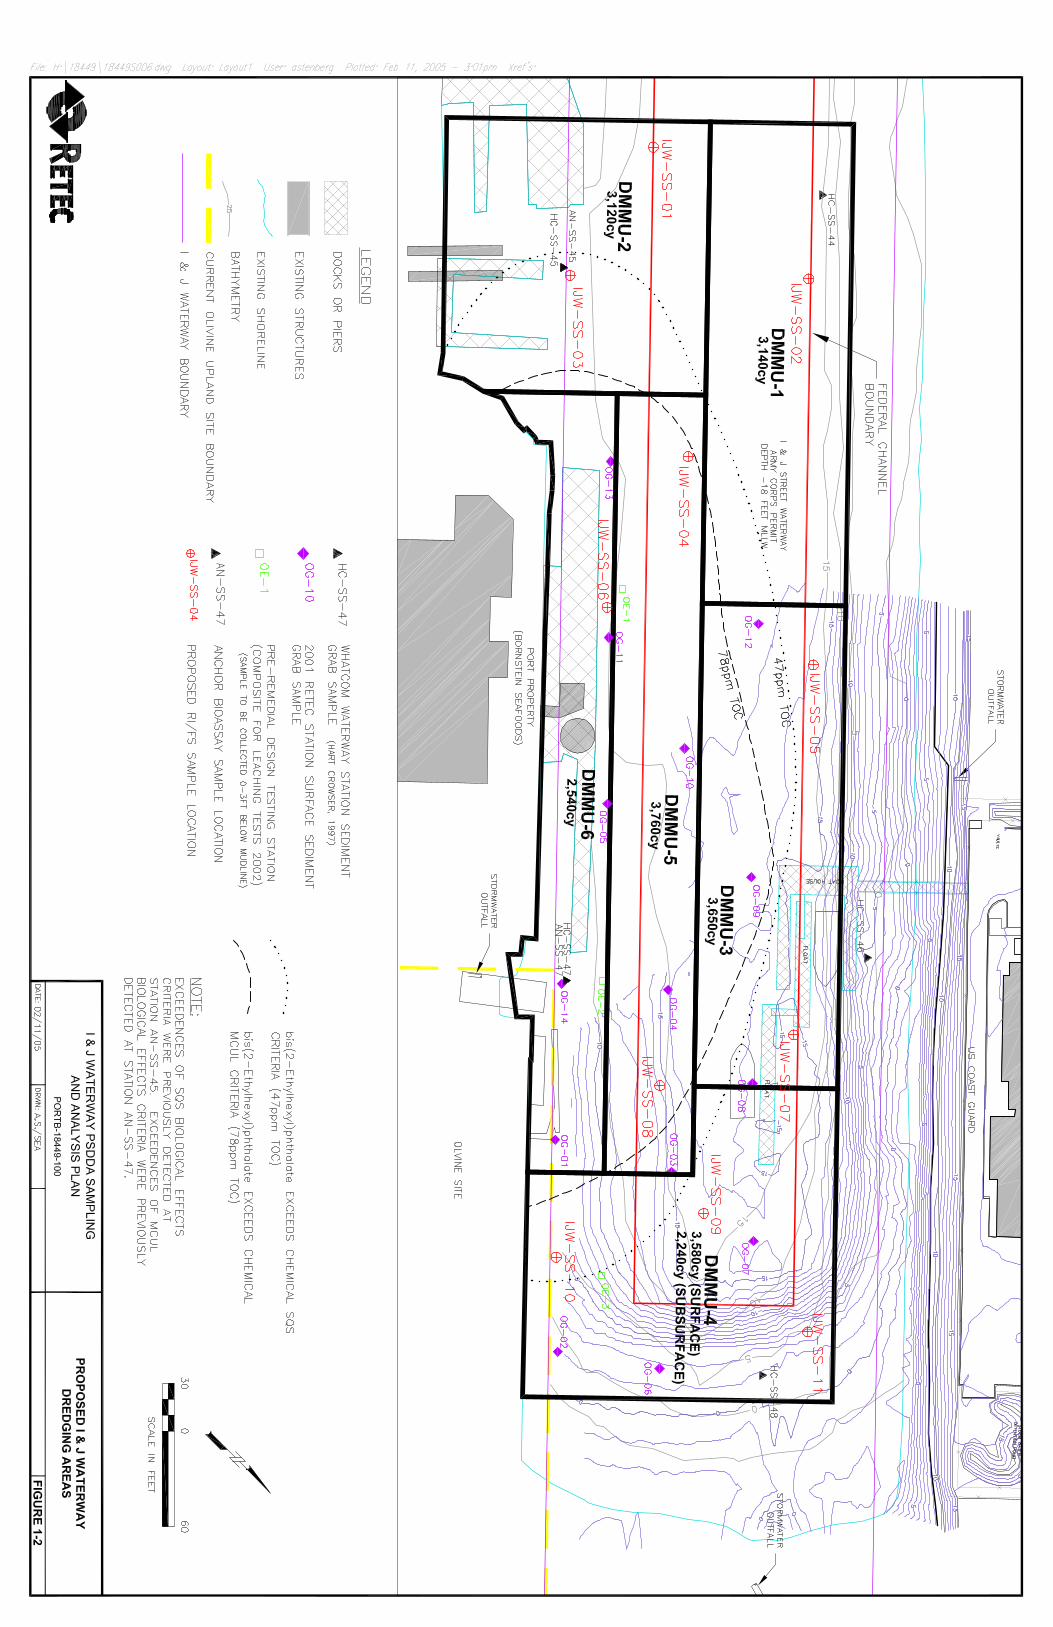
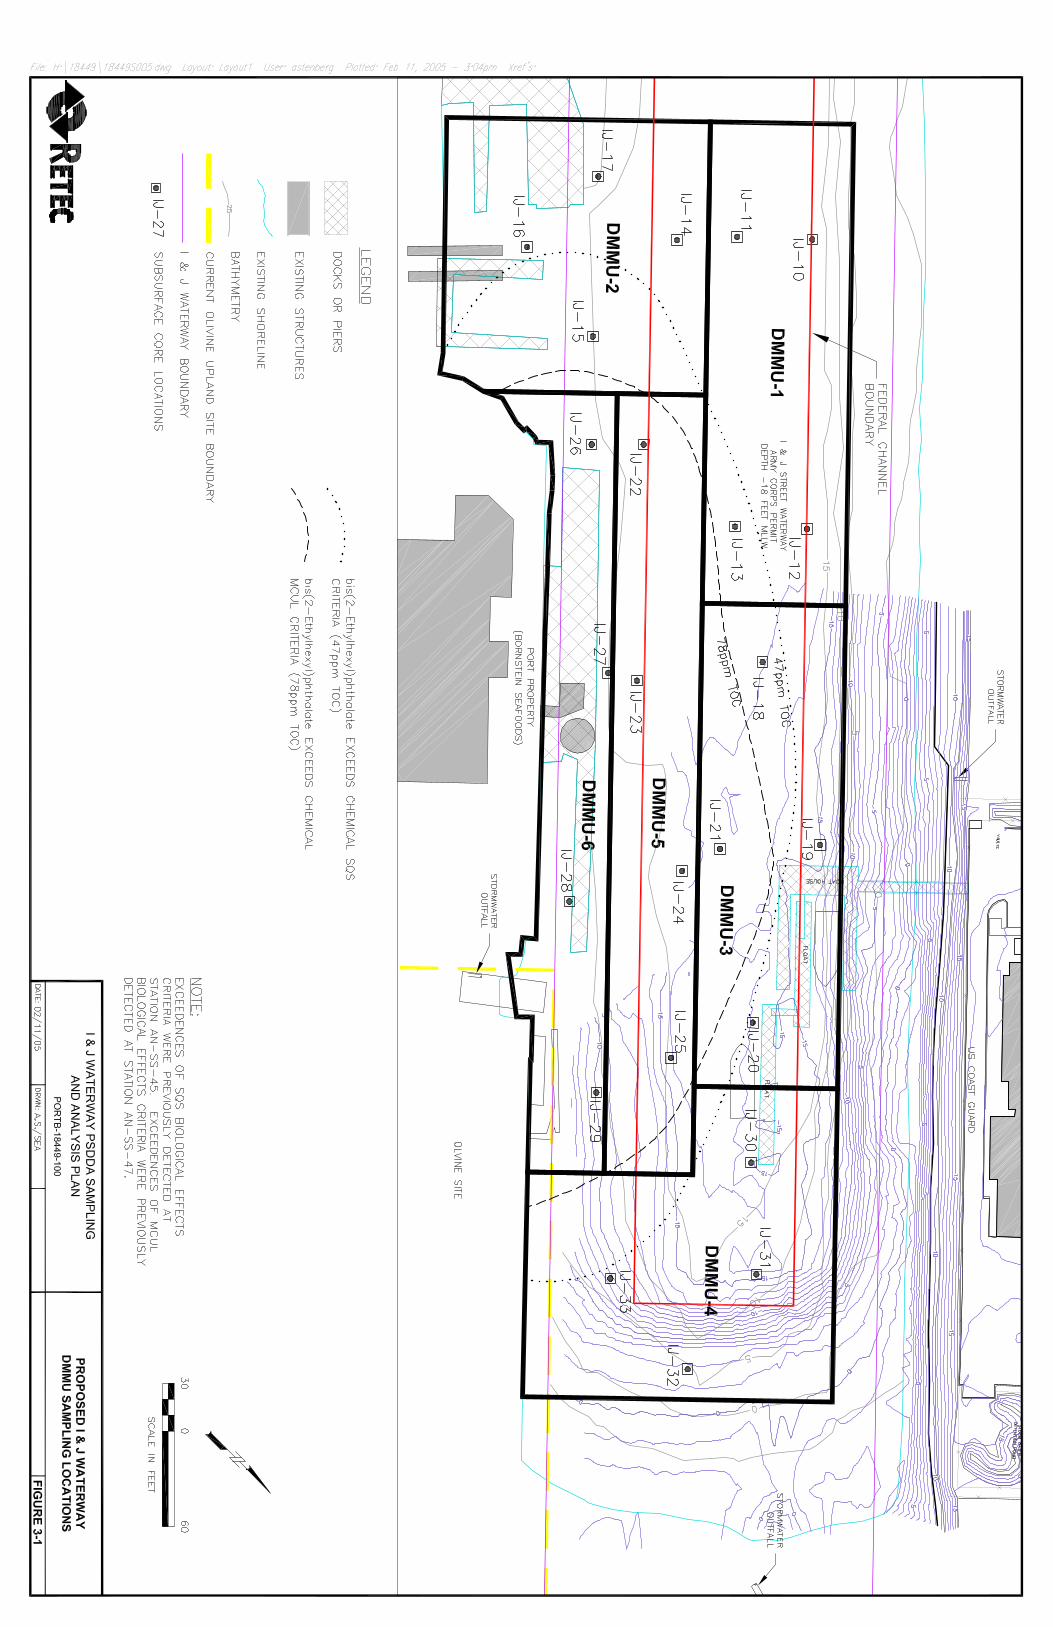
Attachment A
Summary of Historical Analytical Data
Table A-1 Summary of Valid Historical Analytical Data for Surface Sediments
Table A-2 Summary of Valid Historical Core Sampling Data
Table A-3 Summary of Phase 2 Surface Sediment Analytical Data
Figure A-1 Summary of Previous Surface Sediment Exceedances

Table A-1 Summary of Valid Historical Analytical Data for Surface Sediments
Station HC-SS-45 HC-SS-46 HC-SS-47 HC-SS-48 HC-SC-85 AN-SS-84 AN-SS-45 AN-SS-47Sampling Date 9/4/1996 9/5/1996 9/4/1996 9/5/1996 9/9/1996 10/27/1998 10/27/1998 10/27/1998
Datum NAD-83 NAD-83 NAD-83 NAD-83 NAD-83Easting 1239793 1239963 1240107 1240194 1240186
Northing 644131 644572 644449 644711 644711Sample Type Surface Grab Surface Grab Surface Grab Surface Grab Surface Grab Surface Grab Surface Grab Surface Grab
Reported elevation -13.1 ft. -7.0 ft. -7.1 ft. -2.3 ft. -2.3 ft. NT NT NTSampling Interval 0-10 cm 0-10 cm 0-10 cm 0-10 cm 0-10 cm 0-10 cm 0-10 cm 0-10 cm
Consultant Hart Crowser Hart Crowser Hart Crowser Hart Crowser Hart Crowser Anchor Anchor AnchorReference SQS MCUL HC May 1997 HC May 1997 HC May 1997 HC May 1997 HC May 1997 Anchor, 1999 Anchor, 1999 Anchor, 1999
ConventionalsTotal Solids (%) NV NV 40 45 50 50 35 43.3 39.2 62.2Total Organic Carbon (%) NV NV 3.4 2.6 4 0.82 3.1 2.6 2.8 4.2
Metals (mg/kg) (mg/kg) (mg/kg dry) (mg/kg) (mg/kg) (mg/kg) (mg/kg) (mg/kg) (mg/kg) (mg/kg)Antimony NV NV NT NT NT NT NT NT NT NTArsenic 57 93 11 E NT 9.2 E 3.2 E 9.6 E NT NT NTCadmium 5.1 6.7 1.6 NT 1.3 < 0.59 1.3 1 U 1 0.7 JChromium 260 270 71 NT 49 17 66 NT NT NTCopper 390 390 73 NT 51 16 61 NT NT NTLead 450 530 19 NT 24 11 20 NT NT NTMercury 0.41 0.59 0.36 0.36 0.29 < 0.13 0.45 0.45 0.41 0.17 JNickel NV NV NT NT NT NT NT NT NT NTSilver 6.1 6.1 < 1.2 NT < 1.0 < 0.59 < 1.3 NT NT NTZinc 410 960 130 NT 190 51 120 106 138 137
LPAH (ppm TOC) (ppm TOC) (ppm TOC) (ppm TOC) (ppm TOC) (ppm TOC) (ppm TOC) (ppm TOC) (ppm TOC) (ppm TOC)2-Methylnaphthalene 38 64 0.94 E NT 4.00 6.83 0.68 E 1.4 3 3.3 UAcenaphthene 16 57 0.47 E NT 40.00 2.07 E 0.84 E 0.77 U 1.1 3.3 UAcenaphthylene 66 66 < 1.12 NT 2.15 1.16 E < 1.42 0.77 U 0.75 3.3 UAnthracene 220 1,200 1.56 NT 35.00 5.98 1.16 E 1.6 6.1 4.3Fluorene 23 79 0.94 E NT 7.50 4.02 1.26 E 0.96 2.5 3.3 UNaphthalene 99 170 1.53 NT 3.75 7.44 1.13 E 2 3.6 3.3 UPhenanthrene 100 480 4.41 NT 30.00 24.39 7.74 3.8 10 11Total LPAHs 562 780 8.91 NT 118.40 45.06 12.13 11 27 32
HPAH (ppm TOC) (ppm TOC) (ppm TOC) (ppm TOC) (ppm TOC) (ppm TOC) (ppm TOC) (ppm TOC) (ppm TOC) (ppm TOC)Benzo(a)anthracene 110 270 5.29 NT 42.50 18.29 4.52 2.4 13 12Benzo(a)pyrene 99 210 3.24 NT 13.50 20.73 3.13 1.9 8.2 10Benzo(b)fluoranthene 230 450 8.53 C NT 35.0 C 20.73 4.52 2.5 14 17Benzo(g,h,i)perylene 31 78 2.24 E NT 5.75 19.51 2.26 E 1.3 3.1 4Benzo(k)fluoranthene 230 450 8.53 C NT 35.0 C 19.51 3.87 3 12 24Chrysene 110 460 8.82 NT 47.50 29.27 8.06 3.8 19 31Dibenz(a,h)anthracene 12 33 1.32 E NT 3.75 9.27 1.0 E 0.77 U 1.8 3.3 UFluoranthene 160 1,200 10.29 NT 125.00 47.56 12.58 8.5 24 74Indeno(1,2,3-cd)pyrene 34 88 2.24 NT 5.75 18.29 2.16 E 1.1 3.9 5.5Pyrene 1,000 1,400 10.00 NT 117.50 47.56 12.58 9.2 54 100Total HPAHs 2,016 5,300 51.97 NT 396.25 250.73 54.7 35.0 152.0 280.0
Phthalates (ppm TOC) (ppm TOC) (ppm TOC) (ppm TOC) (ppm TOC) (ppm TOC) (ppm TOC) (ppm TOC) (ppm TOC) (ppm TOC)bis(2-Ethylhexyl)phthalate 47 78 13.24 NT 700.00 25.61 7.1 4.6 50 476Butylbenzylphthalate 4.9 64 0.59 E NT < 1.53 1.83 E < 2.81 0.88 1.3 3.3 UDiethylphthalate 61 110 < 2.94 NT < 2.00 < 6.34 < 3.87 0.77 U 0.71 U 3.3 UDimethylphthalate 53 53 < 2.53 NT 0.73 E < 5.37 < 3.16 0.77 U 0.82 3.3 UDi-n-Butylphthalate 220 1,700 < 1.74 NT < 1.18 1.34 E < 2.16 1.3 0.71 U 18Di-n-Octyl phthalate 58 4,500 < 2.12 NT < 1.43 < 4.51 4.19 0.77 U 0.93 E 3.3 U
Phenols (mg/kg) (mg/kg) (mg/kg) (mg/kg) (mg/kg) (mg/kg) (mg/kg) (mg/kg) (mg/kg) (mg/kg)Phenol 0.42 1.2 1.50 NT 0.46 0.07 0.026 E 0.039 U 0.040 U 0.280 UG2,4-Dimethylphenol 0.029 0.029 0.014 E NT .016 E 0.010 E 0.0093 E 0.059 U 0.060 U 0.410 UG2-Methylphenol 0.063 0.063 0.009 E NT 0.011 E 0.0059 E 0.0068 E 0.039 U 0.040 U 0.280 UG4-Methylphenol 0.67 0.67 0.22 NT 0.21 0.04 0.19 0.062 0.22 0.140 UGPentachlorophenol 0.36 0.69 0.015 E NT 0.018 E 0.010 E 0.011 E 0.099 U 0.099 U 0.410 UG
Misc. Extractables (mg/kg) (mg/kg) (mg/kg) (mg/kg) (mg/kg) (mg/kg) (mg/kg) (mg/kg) (mg/kg) (mg/kg)Benzyl Alcohol 0.057 0.073 < 0.0057 E NT < 0.0077 E < 0.034 0.0064 E 0.099 U 0.099 U 0.690 UBenzoic Acid 0.65 0.65 < 0.23 E NT < 0.29 < 0.089 E < 0.19 E 0.2 U 0.20 U 1.4 UG
Misc. Extractables (ppm TOC) (ppm TOC) (ppm TOC) (ppm TOC) (ppm TOC) (ppm TOC) (ppm TOC) (ppm TOC) (ppm TOC) (ppm TOC)1,2,4-Trichlorobenzene 0.81 1.8 < 1.15 NT < 0.78 < 2.44 < 1.42 0.77 U 0.71 U 3.3 U1,2-Dichlorobenzene 2.3 2.3 < 1.35 NT < 0.90 < 2.93 < 1.68 0.77 U 0.71 U 3.3 U1,3-Dichlorobenzene NV NV NA NA NA NA NA NA NA NA1,4-Dichlorobenzene 3.1 9 < 1.21 NT < 0.83 < 2.56 < 1.52 0.77 U 0.71 U 3.3 UDibenzofuran 15 58 0.91 E NT 4.50 4.88 0.94 E 1.4 3.6 3.3 UHexachlorobenzene 0.38 2.3 < 0.12 NT < 0.08 < 0.27 < 0.15 0.77 U 0.71 U 3.3 UHexachlorobutadiene 3.9 6.2 < 0.12 NT < 0.08 < 0.27 < 0.15 1.5 U 1.4 U 6.7 UN-Nitrosodiphenylamine 11 11 < 1.5 NT < 1.03 < 3.29 < 1.90 0.77 U 0.71 U 3.3 U
PCBs (ppm TOC) (ppm TOC) (ppm TOC) (ppm TOC) (ppm TOC) (ppm TOC) (ppm TOC) (ppm TOC) (ppm TOC) (ppm TOC)Aroclor 1016 12 65 < 3.82 NT < 2.5 < 7.93 < 4.52 NT NT NTAroclor 1221 12 65 < 3.82 NT < 2.5 < 7.93 < 4.52 NT NT NTAroclor 1232 12 65 < 3.82 NT < 2.5 < 7.93 < 4.52 NT NT NTAroclor 1242 12 65 < 3.82 NT < 2.5 < 7.93 < 4.52 NT NT NTAroclor 1248 12 65 < 3.82 NT < 2.5 < 7.93 < 4.52 NT NT NTAroclor 1254 12 65 < 3.82 NT < 2.5 < 7.93 < 4.52 NT NT NTAroclor 1260 12 65 < 3.82 NT 3.25 < 7.93 < 4.52 NT NT NTTotal PCBs 12 65 < 3.82 NT 3.25 < 7.93 < 4.52 NT NT NT
NOTES:Single underlined values exceed the SQS value.Double underlined values exceed the MCUL value.NV - No Value.NA - Not Analyzed.D - Indicates value reported in diluted sample.E - Value above linear range of detectorM - indicates estimated value of analyte found and confirmed by analyst but with low spectral match.
SMS Criteria
Corresponds approximately to
HC-SS-45
Corresponds approximately to
HC-SS-47
Corresponds approximately to
HC-SC-84
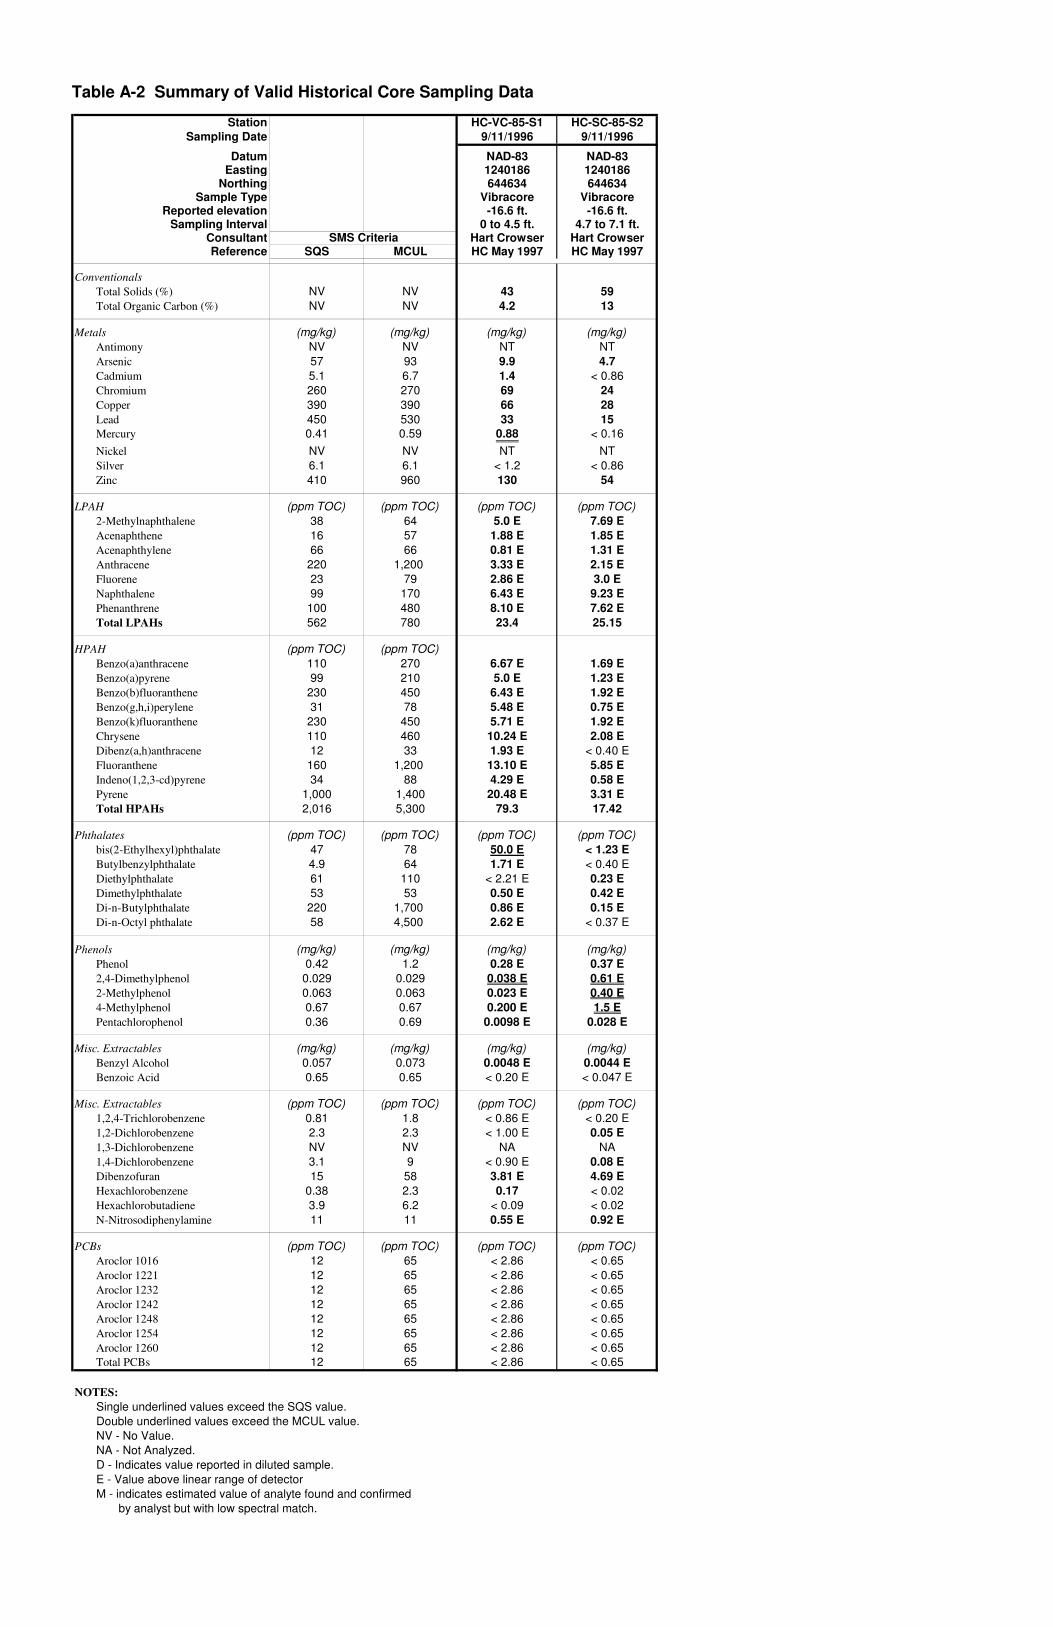
Table A-2 Summary of Valid Historical Core Sampling Data
Station HC-VC-85-S1 HC-SC-85-S2Sampling Date 9/11/1996 9/11/1996
Datum NAD-83 NAD-83Easting 1240186 1240186
Northing 644634 644634Sample Type Vibracore Vibracore
Reported elevation -16.6 ft. -16.6 ft.Sampling Interval 0 to 4.5 ft. 4.7 to 7.1 ft.
Consultant Hart Crowser Hart CrowserReference SQS MCUL HC May 1997 HC May 1997
ConventionalsTotal Solids (%) NV NV 43 59Total Organic Carbon (%) NV NV 4.2 13
Metals (mg/kg) (mg/kg) (mg/kg) (mg/kg)Antimony NV NV NT NTArsenic 57 93 9.9 4.7Cadmium 5.1 6.7 1.4 < 0.86Chromium 260 270 69 24Copper 390 390 66 28Lead 450 530 33 15Mercury 0.41 0.59 0.88 < 0.16Nickel NV NV NT NTSilver 6.1 6.1 < 1.2 < 0.86Zinc 410 960 130 54
LPAH (ppm TOC) (ppm TOC) (ppm TOC) (ppm TOC)2-Methylnaphthalene 38 64 5.0 E 7.69 EAcenaphthene 16 57 1.88 E 1.85 EAcenaphthylene 66 66 0.81 E 1.31 EAnthracene 220 1,200 3.33 E 2.15 EFluorene 23 79 2.86 E 3.0 ENaphthalene 99 170 6.43 E 9.23 EPhenanthrene 100 480 8.10 E 7.62 ETotal LPAHs 562 780 23.4 25.15
HPAH (ppm TOC) (ppm TOC)Benzo(a)anthracene 110 270 6.67 E 1.69 EBenzo(a)pyrene 99 210 5.0 E 1.23 EBenzo(b)fluoranthene 230 450 6.43 E 1.92 EBenzo(g,h,i)perylene 31 78 5.48 E 0.75 EBenzo(k)fluoranthene 230 450 5.71 E 1.92 EChrysene 110 460 10.24 E 2.08 EDibenz(a,h)anthracene 12 33 1.93 E < 0.40 EFluoranthene 160 1,200 13.10 E 5.85 EIndeno(1,2,3-cd)pyrene 34 88 4.29 E 0.58 EPyrene 1,000 1,400 20.48 E 3.31 ETotal HPAHs 2,016 5,300 79.3 17.42
Phthalates (ppm TOC) (ppm TOC) (ppm TOC) (ppm TOC)bis(2-Ethylhexyl)phthalate 47 78 50.0 E < 1.23 EButylbenzylphthalate 4.9 64 1.71 E < 0.40 EDiethylphthalate 61 110 < 2.21 E 0.23 EDimethylphthalate 53 53 0.50 E 0.42 EDi-n-Butylphthalate 220 1,700 0.86 E 0.15 EDi-n-Octyl phthalate 58 4,500 2.62 E < 0.37 E
Phenols (mg/kg) (mg/kg) (mg/kg) (mg/kg)Phenol 0.42 1.2 0.28 E 0.37 E2,4-Dimethylphenol 0.029 0.029 0.038 E 0.61 E2-Methylphenol 0.063 0.063 0.023 E 0.40 E4-Methylphenol 0.67 0.67 0.200 E 1.5 EPentachlorophenol 0.36 0.69 0.0098 E 0.028 E
Misc. Extractables (mg/kg) (mg/kg) (mg/kg) (mg/kg)Benzyl Alcohol 0.057 0.073 0.0048 E 0.0044 EBenzoic Acid 0.65 0.65 < 0.20 E < 0.047 E
Misc. Extractables (ppm TOC) (ppm TOC) (ppm TOC) (ppm TOC)1,2,4-Trichlorobenzene 0.81 1.8 < 0.86 E < 0.20 E1,2-Dichlorobenzene 2.3 2.3 < 1.00 E 0.05 E1,3-Dichlorobenzene NV NV NA NA1,4-Dichlorobenzene 3.1 9 < 0.90 E 0.08 EDibenzofuran 15 58 3.81 E 4.69 EHexachlorobenzene 0.38 2.3 0.17 < 0.02Hexachlorobutadiene 3.9 6.2 < 0.09 < 0.02N-Nitrosodiphenylamine 11 11 0.55 E 0.92 E
PCBs (ppm TOC) (ppm TOC) (ppm TOC) (ppm TOC)Aroclor 1016 12 65 < 2.86 < 0.65Aroclor 1221 12 65 < 2.86 < 0.65Aroclor 1232 12 65 < 2.86 < 0.65Aroclor 1242 12 65 < 2.86 < 0.65Aroclor 1248 12 65 < 2.86 < 0.65Aroclor 1254 12 65 < 2.86 < 0.65Aroclor 1260 12 65 < 2.86 < 0.65Total PCBs 12 65 < 2.86 < 0.65
NOTES:Single underlined values exceed the SQS value.Double underlined values exceed the MCUL value.NV - No Value.NA - Not Analyzed.D - Indicates value reported in diluted sample.E - Value above linear range of detectorM - indicates estimated value of analyte found and confirmed by analyst but with low spectral match.
SMS Criteria
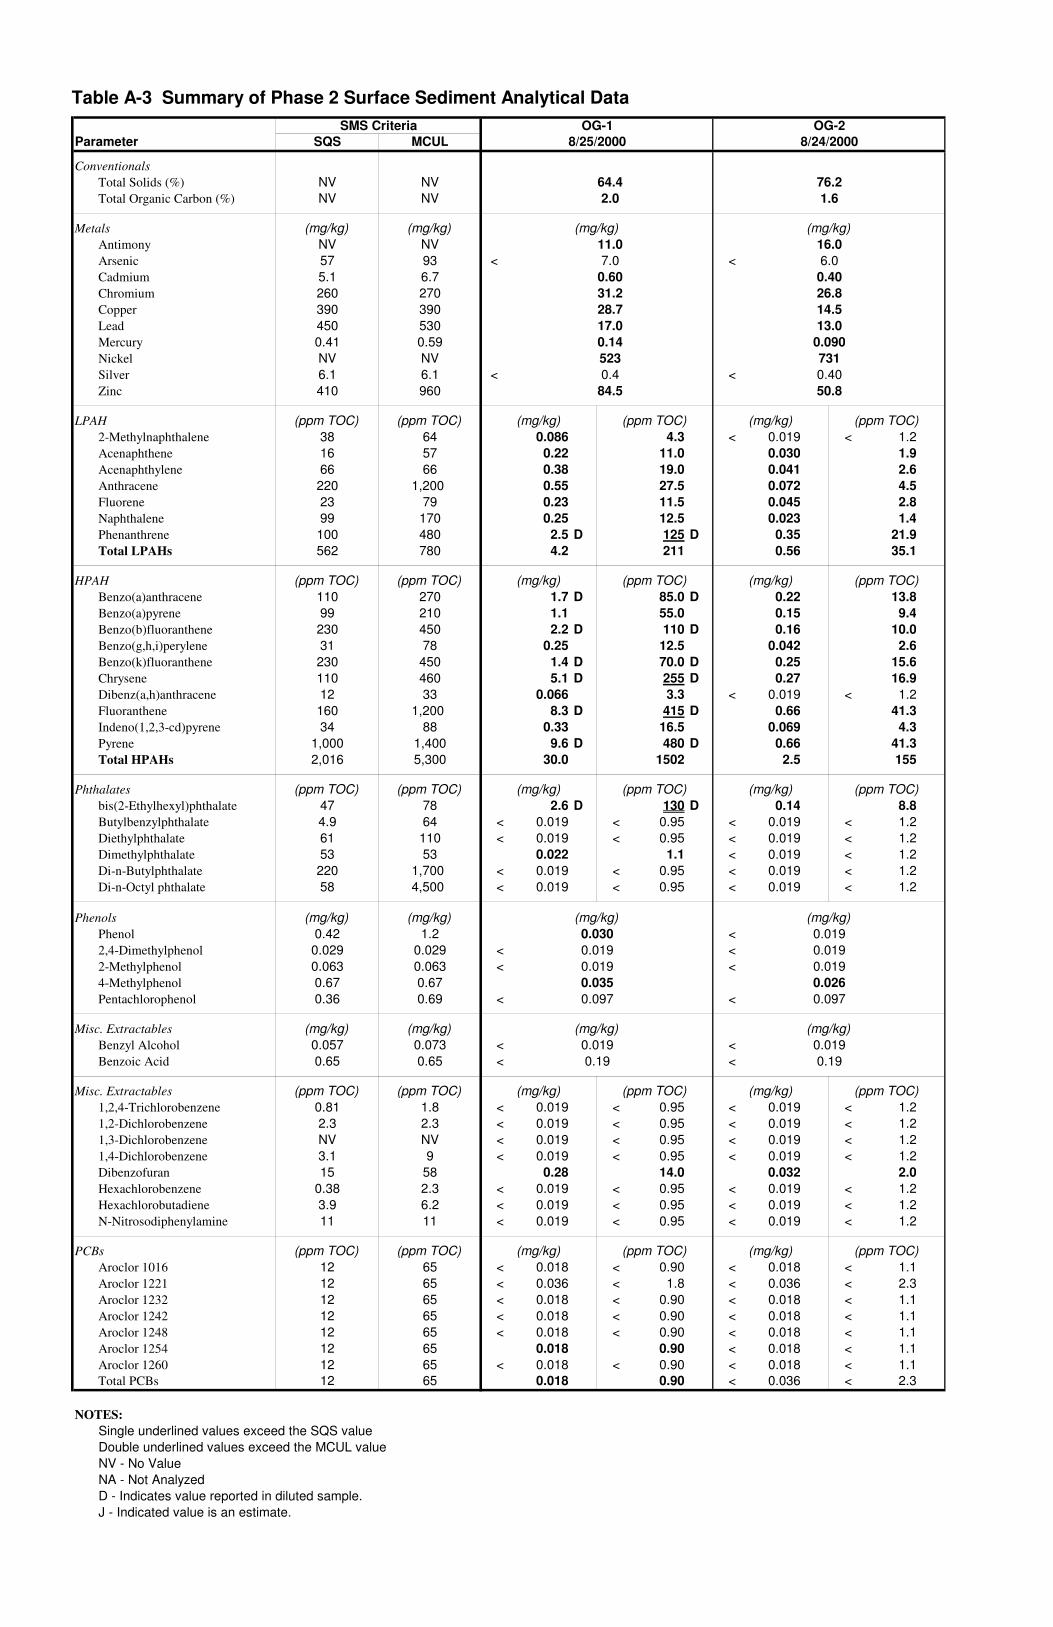
Table A-3 Summary of Phase 2 Surface Sediment Analytical DataOG-1 OG-2
Parameter SQS MCUL 8/25/2000 8/24/2000
ConventionalsTotal Solids (%) NV NV 64.4 76.2Total Organic Carbon (%) NV NV 2.0 1.6
Metals (mg/kg) (mg/kg)Antimony NV NV 11.0 16.0Arsenic 57 93 < 7.0 < 6.0Cadmium 5.1 6.7 0.60 0.40Chromium 260 270 31.2 26.8Copper 390 390 28.7 14.5Lead 450 530 17.0 13.0Mercury 0.41 0.59 0.14 0.090Nickel NV NV 523 731Silver 6.1 6.1 < 0.4 < 0.40Zinc 410 960 84.5 50.8
LPAH (ppm TOC) (ppm TOC) (mg/kg) (ppm TOC) (mg/kg) (ppm TOC)2-Methylnaphthalene 38 64 0.086 4.3 < 0.019 < 1.2Acenaphthene 16 57 0.22 11.0 0.030 1.9Acenaphthylene 66 66 0.38 19.0 0.041 2.6Anthracene 220 1,200 0.55 27.5 0.072 4.5Fluorene 23 79 0.23 11.5 0.045 2.8Naphthalene 99 170 0.25 12.5 0.023 1.4Phenanthrene 100 480 2.5 D 125 D 0.35 21.9Total LPAHs 562 780 4.2 211 0.56 35.1
HPAH (ppm TOC) (ppm TOC) (mg/kg) (ppm TOC) (mg/kg) (ppm TOC)Benzo(a)anthracene 110 270 1.7 D 85.0 D 0.22 13.8Benzo(a)pyrene 99 210 1.1 55.0 0.15 9.4Benzo(b)fluoranthene 230 450 2.2 D 110 D 0.16 10.0Benzo(g,h,i)perylene 31 78 0.25 12.5 0.042 2.6Benzo(k)fluoranthene 230 450 1.4 D 70.0 D 0.25 15.6Chrysene 110 460 5.1 D 255 D 0.27 16.9Dibenz(a,h)anthracene 12 33 0.066 3.3 < 0.019 < 1.2Fluoranthene 160 1,200 8.3 D 415 D 0.66 41.3Indeno(1,2,3-cd)pyrene 34 88 0.33 16.5 0.069 4.3Pyrene 1,000 1,400 9.6 D 480 D 0.66 41.3Total HPAHs 2,016 5,300 30.0 1502 2.5 155
Phthalates (ppm TOC) (ppm TOC) (mg/kg) (ppm TOC) (mg/kg) (ppm TOC)bis(2-Ethylhexyl)phthalate 47 78 2.6 D 130 D 0.14 8.8Butylbenzylphthalate 4.9 64 < 0.019 < 0.95 < 0.019 < 1.2Diethylphthalate 61 110 < 0.019 < 0.95 < 0.019 < 1.2Dimethylphthalate 53 53 0.022 1.1 < 0.019 < 1.2Di-n-Butylphthalate 220 1,700 < 0.019 < 0.95 < 0.019 < 1.2Di-n-Octyl phthalate 58 4,500 < 0.019 < 0.95 < 0.019 < 1.2
Phenols (mg/kg) (mg/kg)Phenol 0.42 1.2 0.030 < 0.0192,4-Dimethylphenol 0.029 0.029 < 0.019 < 0.0192-Methylphenol 0.063 0.063 < 0.019 < 0.0194-Methylphenol 0.67 0.67 0.035 0.026Pentachlorophenol 0.36 0.69 < 0.097 < 0.097
Misc. Extractables (mg/kg) (mg/kg)Benzyl Alcohol 0.057 0.073 < 0.019 < 0.019Benzoic Acid 0.65 0.65 < 0.19 < 0.19
Misc. Extractables (ppm TOC) (ppm TOC) (mg/kg) (ppm TOC) (mg/kg) (ppm TOC)1,2,4-Trichlorobenzene 0.81 1.8 < 0.019 < 0.95 < 0.019 < 1.21,2-Dichlorobenzene 2.3 2.3 < 0.019 < 0.95 < 0.019 < 1.21,3-Dichlorobenzene NV NV < 0.019 < 0.95 < 0.019 < 1.21,4-Dichlorobenzene 3.1 9 < 0.019 < 0.95 < 0.019 < 1.2Dibenzofuran 15 58 0.28 14.0 0.032 2.0Hexachlorobenzene 0.38 2.3 < 0.019 < 0.95 < 0.019 < 1.2Hexachlorobutadiene 3.9 6.2 < 0.019 < 0.95 < 0.019 < 1.2N-Nitrosodiphenylamine 11 11 < 0.019 < 0.95 < 0.019 < 1.2
PCBs (ppm TOC) (ppm TOC) (mg/kg) (ppm TOC) (mg/kg) (ppm TOC)Aroclor 1016 12 65 < 0.018 < 0.90 < 0.018 < 1.1Aroclor 1221 12 65 < 0.036 < 1.8 < 0.036 < 2.3Aroclor 1232 12 65 < 0.018 < 0.90 < 0.018 < 1.1Aroclor 1242 12 65 < 0.018 < 0.90 < 0.018 < 1.1Aroclor 1248 12 65 < 0.018 < 0.90 < 0.018 < 1.1Aroclor 1254 12 65 0.018 0.90 < 0.018 < 1.1Aroclor 1260 12 65 < 0.018 < 0.90 < 0.018 < 1.1Total PCBs 12 65 0.018 0.90 < 0.036 < 2.3
NOTES:Single underlined values exceed the SQS valueDouble underlined values exceed the MCUL valueNV - No ValueNA - Not AnalyzedD - Indicates value reported in diluted sample.J - Indicated value is an estimate.
(mg/kg) (mg/kg)
(mg/kg) (mg/kg)
SMS Criteria
(mg/kg) (mg/kg)
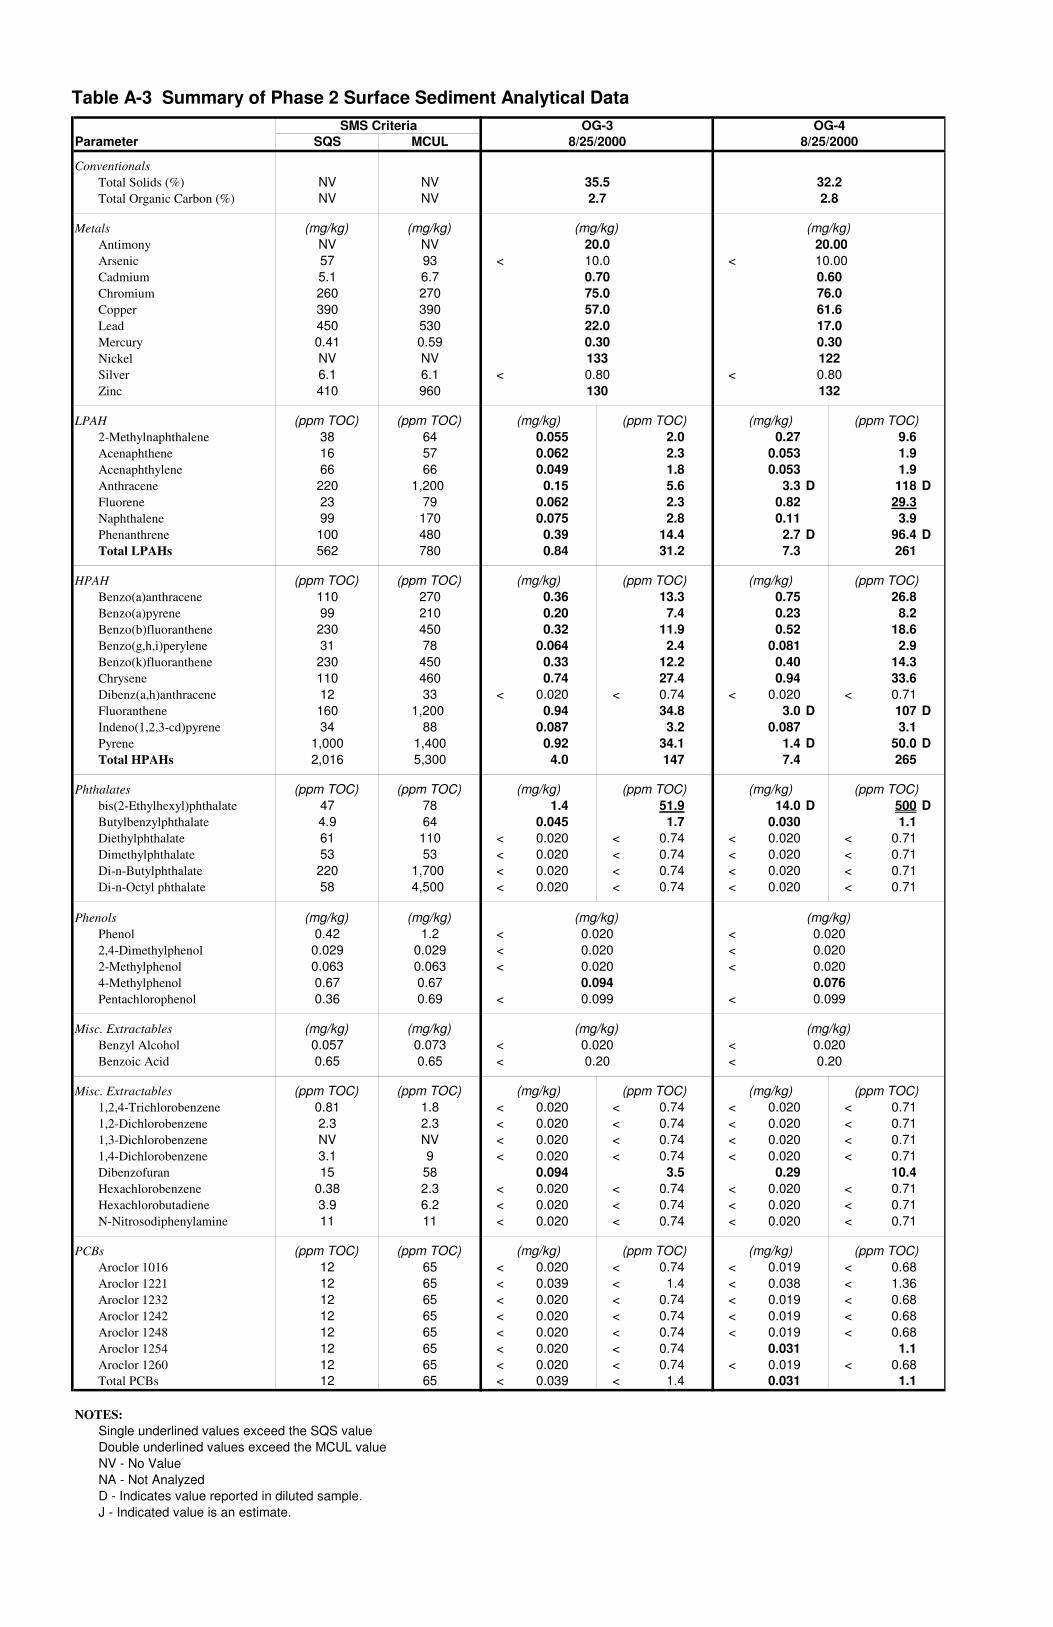
Table A-3 Summary of Phase 2 Surface Sediment Analytical Data
Parameter SQS MCUL
ConventionalsTotal Solids (%) NV NVTotal Organic Carbon (%) NV NV
Metals (mg/kg) (mg/kg)Antimony NV NVArsenic 57 93Cadmium 5.1 6.7Chromium 260 270Copper 390 390Lead 450 530Mercury 0.41 0.59Nickel NV NVSilver 6.1 6.1Zinc 410 960
LPAH (ppm TOC) (ppm TOC)2-Methylnaphthalene 38 64Acenaphthene 16 57Acenaphthylene 66 66Anthracene 220 1,200Fluorene 23 79Naphthalene 99 170Phenanthrene 100 480Total LPAHs 562 780
HPAH (ppm TOC) (ppm TOC)Benzo(a)anthracene 110 270Benzo(a)pyrene 99 210Benzo(b)fluoranthene 230 450Benzo(g,h,i)perylene 31 78Benzo(k)fluoranthene 230 450Chrysene 110 460Dibenz(a,h)anthracene 12 33Fluoranthene 160 1,200Indeno(1,2,3-cd)pyrene 34 88Pyrene 1,000 1,400Total HPAHs 2,016 5,300
Phthalates (ppm TOC) (ppm TOC)bis(2-Ethylhexyl)phthalate 47 78Butylbenzylphthalate 4.9 64Diethylphthalate 61 110Dimethylphthalate 53 53Di-n-Butylphthalate 220 1,700Di-n-Octyl phthalate 58 4,500
Phenols (mg/kg) (mg/kg)Phenol 0.42 1.22,4-Dimethylphenol 0.029 0.0292-Methylphenol 0.063 0.0634-Methylphenol 0.67 0.67Pentachlorophenol 0.36 0.69
Misc. Extractables (mg/kg) (mg/kg)Benzyl Alcohol 0.057 0.073Benzoic Acid 0.65 0.65
Misc. Extractables (ppm TOC) (ppm TOC)1,2,4-Trichlorobenzene 0.81 1.81,2-Dichlorobenzene 2.3 2.31,3-Dichlorobenzene NV NV1,4-Dichlorobenzene 3.1 9Dibenzofuran 15 58Hexachlorobenzene 0.38 2.3Hexachlorobutadiene 3.9 6.2N-Nitrosodiphenylamine 11 11
PCBs (ppm TOC) (ppm TOC)Aroclor 1016 12 65Aroclor 1221 12 65Aroclor 1232 12 65Aroclor 1242 12 65Aroclor 1248 12 65Aroclor 1254 12 65Aroclor 1260 12 65Total PCBs 12 65
NOTES:Single underlined values exceed the SQS valueDouble underlined values exceed the MCUL valueNV - No ValueNA - Not AnalyzedD - Indicates value reported in diluted sample.J - Indicated value is an estimate.
SMS Criteria OG-3 OG-48/25/2000 8/25/2000
35.5 32.22.7 2.8
20.0 20.00 < 10.0 < 10.00
0.70 0.6075.0 76.057.0 61.622.0 17.00.30 0.30133 122
< 0.80 < 0.80130 132
(mg/kg) (ppm TOC) (mg/kg) (ppm TOC)0.055 2.0 0.27 9.60.062 2.3 0.053 1.90.049 1.8 0.053 1.90.15 5.6 3.3 D 118 D
0.062 2.3 0.82 29.30.075 2.8 0.11 3.90.39 14.4 2.7 D 96.4 D0.84 31.2 7.3 261
(mg/kg) (ppm TOC) (mg/kg) (ppm TOC)0.36 13.3 0.75 26.80.20 7.4 0.23 8.20.32 11.9 0.52 18.6
0.064 2.4 0.081 2.90.33 12.2 0.40 14.30.74 27.4 0.94 33.6
< 0.020 < 0.74 < 0.020 < 0.710.94 34.8 3.0 D 107 D
0.087 3.2 0.087 3.10.92 34.1 1.4 D 50.0 D4.0 147 7.4 265
(mg/kg) (ppm TOC) (mg/kg) (ppm TOC)1.4 51.9 14.0 D 500 D
0.045 1.7 0.030 1.1< 0.020 < 0.74 < 0.020 < 0.71< 0.020 < 0.74 < 0.020 < 0.71< 0.020 < 0.74 < 0.020 < 0.71< 0.020 < 0.74 < 0.020 < 0.71
< 0.020 < 0.020< 0.020 < 0.020< 0.020 < 0.020
0.094 0.076< 0.099 < 0.099
< 0.020 < 0.020< 0.20 < 0.20
(mg/kg) (ppm TOC) (mg/kg) (ppm TOC)< 0.020 < 0.74 < 0.020 < 0.71< 0.020 < 0.74 < 0.020 < 0.71< 0.020 < 0.74 < 0.020 < 0.71< 0.020 < 0.74 < 0.020 < 0.71
0.094 3.5 0.29 10.4< 0.020 < 0.74 < 0.020 < 0.71< 0.020 < 0.74 < 0.020 < 0.71< 0.020 < 0.74 < 0.020 < 0.71
(mg/kg) (ppm TOC) (mg/kg) (ppm TOC)< 0.020 < 0.74 < 0.019 < 0.68< 0.039 < 1.4 < 0.038 < 1.36< 0.020 < 0.74 < 0.019 < 0.68< 0.020 < 0.74 < 0.019 < 0.68< 0.020 < 0.74 < 0.019 < 0.68< 0.020 < 0.74 0.031 1.1< 0.020 < 0.74 < 0.019 < 0.68< 0.039 < 1.4 0.031 1.1
(mg/kg) (mg/kg)
(mg/kg) (mg/kg)
(mg/kg)(mg/kg)
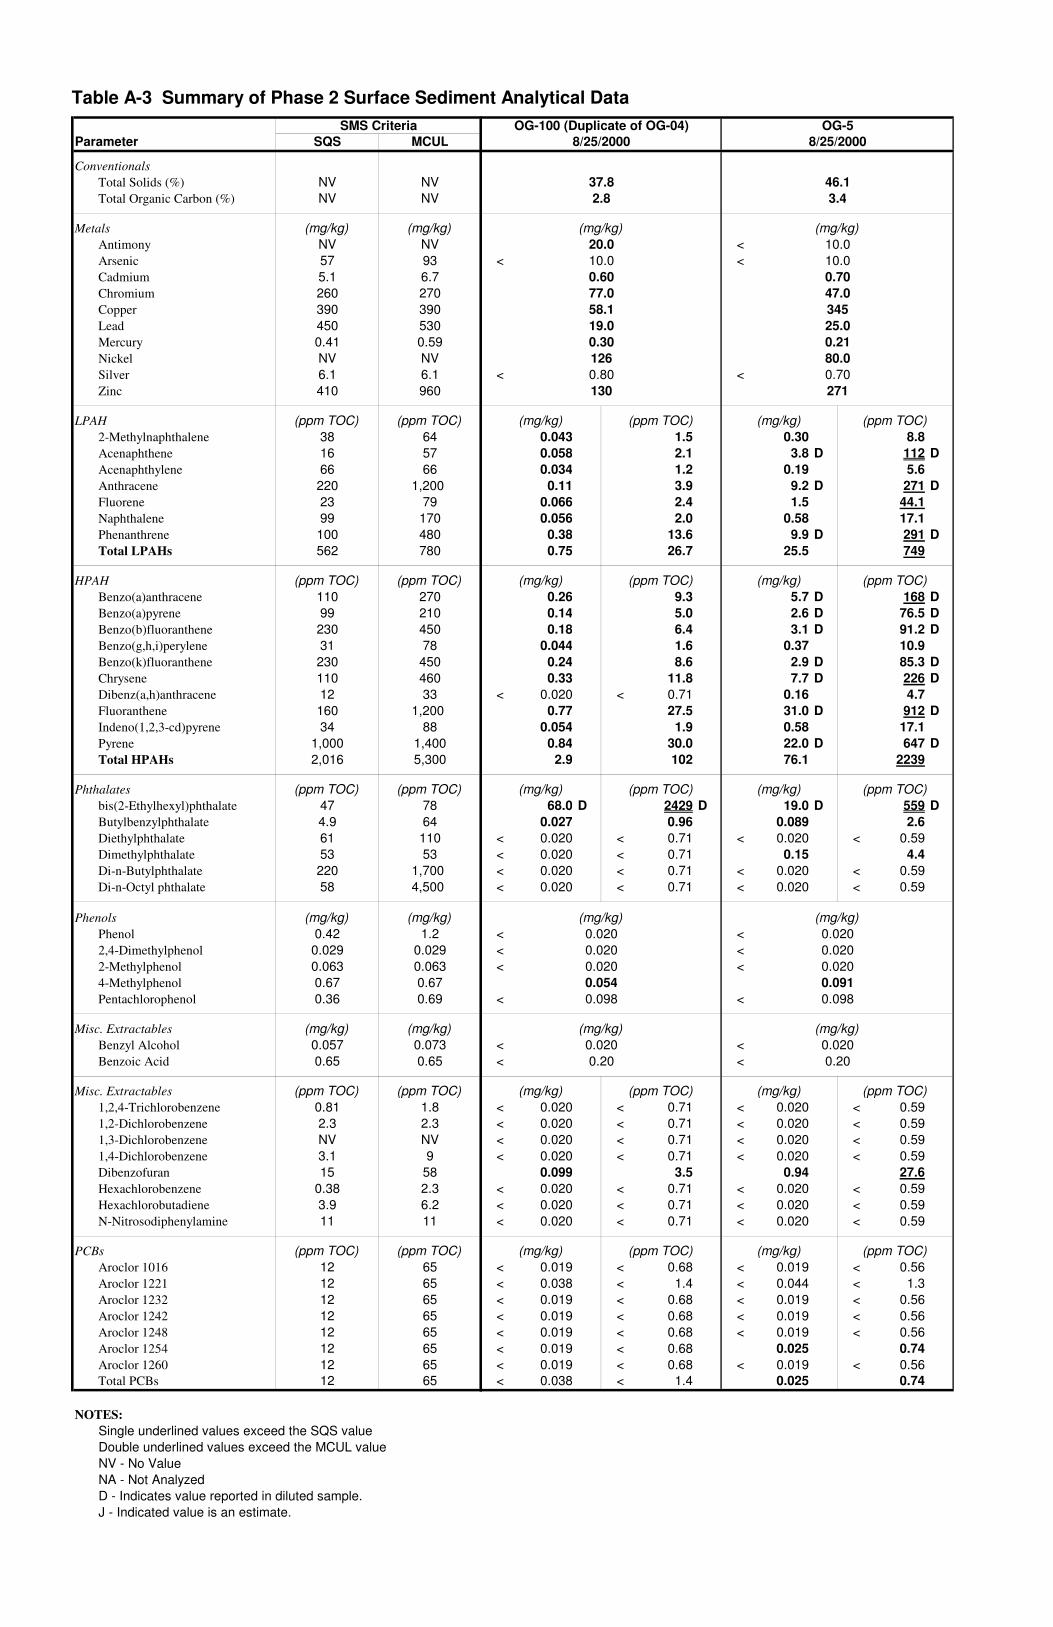
Table A-3 Summary of Phase 2 Surface Sediment Analytical Data
Parameter SQS MCUL
ConventionalsTotal Solids (%) NV NVTotal Organic Carbon (%) NV NV
Metals (mg/kg) (mg/kg)Antimony NV NVArsenic 57 93Cadmium 5.1 6.7Chromium 260 270Copper 390 390Lead 450 530Mercury 0.41 0.59Nickel NV NVSilver 6.1 6.1Zinc 410 960
LPAH (ppm TOC) (ppm TOC)2-Methylnaphthalene 38 64Acenaphthene 16 57Acenaphthylene 66 66Anthracene 220 1,200Fluorene 23 79Naphthalene 99 170Phenanthrene 100 480Total LPAHs 562 780
HPAH (ppm TOC) (ppm TOC)Benzo(a)anthracene 110 270Benzo(a)pyrene 99 210Benzo(b)fluoranthene 230 450Benzo(g,h,i)perylene 31 78Benzo(k)fluoranthene 230 450Chrysene 110 460Dibenz(a,h)anthracene 12 33Fluoranthene 160 1,200Indeno(1,2,3-cd)pyrene 34 88Pyrene 1,000 1,400Total HPAHs 2,016 5,300
Phthalates (ppm TOC) (ppm TOC)bis(2-Ethylhexyl)phthalate 47 78Butylbenzylphthalate 4.9 64Diethylphthalate 61 110Dimethylphthalate 53 53Di-n-Butylphthalate 220 1,700Di-n-Octyl phthalate 58 4,500
Phenols (mg/kg) (mg/kg)Phenol 0.42 1.22,4-Dimethylphenol 0.029 0.0292-Methylphenol 0.063 0.0634-Methylphenol 0.67 0.67Pentachlorophenol 0.36 0.69
Misc. Extractables (mg/kg) (mg/kg)Benzyl Alcohol 0.057 0.073Benzoic Acid 0.65 0.65
Misc. Extractables (ppm TOC) (ppm TOC)1,2,4-Trichlorobenzene 0.81 1.81,2-Dichlorobenzene 2.3 2.31,3-Dichlorobenzene NV NV1,4-Dichlorobenzene 3.1 9Dibenzofuran 15 58Hexachlorobenzene 0.38 2.3Hexachlorobutadiene 3.9 6.2N-Nitrosodiphenylamine 11 11
PCBs (ppm TOC) (ppm TOC)Aroclor 1016 12 65Aroclor 1221 12 65Aroclor 1232 12 65Aroclor 1242 12 65Aroclor 1248 12 65Aroclor 1254 12 65Aroclor 1260 12 65Total PCBs 12 65
NOTES:Single underlined values exceed the SQS valueDouble underlined values exceed the MCUL valueNV - No ValueNA - Not AnalyzedD - Indicates value reported in diluted sample.J - Indicated value is an estimate.
SMS Criteria OG-100 (Duplicate of OG-04) OG-58/25/2000 8/25/2000
37.8 46.12.8 3.4
20.0 < 10.0< 10.0 < 10.0
0.60 0.7077.0 47.058.1 34519.0 25.00.30 0.21126 80.0
< 0.80 < 0.70130 271
(mg/kg) (ppm TOC) (mg/kg) (ppm TOC)0.043 1.5 0.30 8.80.058 2.1 3.8 D 112 D0.034 1.2 0.19 5.60.11 3.9 9.2 D 271 D
0.066 2.4 1.5 44.10.056 2.0 0.58 17.10.38 13.6 9.9 D 291 D0.75 26.7 25.5 749
(mg/kg) (ppm TOC) (mg/kg) (ppm TOC)0.26 9.3 5.7 D 168 D0.14 5.0 2.6 D 76.5 D0.18 6.4 3.1 D 91.2 D
0.044 1.6 0.37 10.90.24 8.6 2.9 D 85.3 D0.33 11.8 7.7 D 226 D
< 0.020 < 0.71 0.16 4.70.77 27.5 31.0 D 912 D
0.054 1.9 0.58 17.10.84 30.0 22.0 D 647 D2.9 102 76.1 2239
(mg/kg) (ppm TOC) (mg/kg) (ppm TOC)68.0 D 2429 D 19.0 D 559 D
0.027 0.96 0.089 2.6< 0.020 < 0.71 < 0.020 < 0.59< 0.020 < 0.71 0.15 4.4< 0.020 < 0.71 < 0.020 < 0.59< 0.020 < 0.71 < 0.020 < 0.59
< 0.020 < 0.020< 0.020 < 0.020< 0.020 < 0.020
0.054 0.091< 0.098 < 0.098
< 0.020 < 0.020< 0.20 < 0.20
(mg/kg) (ppm TOC) (mg/kg) (ppm TOC)< 0.020 < 0.71 < 0.020 < 0.59< 0.020 < 0.71 < 0.020 < 0.59< 0.020 < 0.71 < 0.020 < 0.59< 0.020 < 0.71 < 0.020 < 0.59
0.099 3.5 0.94 27.6< 0.020 < 0.71 < 0.020 < 0.59< 0.020 < 0.71 < 0.020 < 0.59< 0.020 < 0.71 < 0.020 < 0.59
(mg/kg) (ppm TOC) (mg/kg) (ppm TOC)< 0.019 < 0.68 < 0.019 < 0.56< 0.038 < 1.4 < 0.044 < 1.3< 0.019 < 0.68 < 0.019 < 0.56< 0.019 < 0.68 < 0.019 < 0.56< 0.019 < 0.68 < 0.019 < 0.56< 0.019 < 0.68 0.025 0.74< 0.019 < 0.68 < 0.019 < 0.56< 0.038 < 1.4 0.025 0.74
(mg/kg) (mg/kg)
(mg/kg) (mg/kg)
(mg/kg) (mg/kg)

Table A-3 Summary of Phase 2 Surface Sediment Analytical Data
Parameter SQS MCUL
ConventionalsTotal Solids (%) NV NVTotal Organic Carbon (%) NV NV
Metals (mg/kg) (mg/kg)Antimony NV NVArsenic 57 93Cadmium 5.1 6.7Chromium 260 270Copper 390 390Lead 450 530Mercury 0.41 0.59Nickel NV NVSilver 6.1 6.1Zinc 410 960
LPAH (ppm TOC) (ppm TOC)2-Methylnaphthalene 38 64Acenaphthene 16 57Acenaphthylene 66 66Anthracene 220 1,200Fluorene 23 79Naphthalene 99 170Phenanthrene 100 480Total LPAHs 562 780
HPAH (ppm TOC) (ppm TOC)Benzo(a)anthracene 110 270Benzo(a)pyrene 99 210Benzo(b)fluoranthene 230 450Benzo(g,h,i)perylene 31 78Benzo(k)fluoranthene 230 450Chrysene 110 460Dibenz(a,h)anthracene 12 33Fluoranthene 160 1,200Indeno(1,2,3-cd)pyrene 34 88Pyrene 1,000 1,400Total HPAHs 2,016 5,300
Phthalates (ppm TOC) (ppm TOC)bis(2-Ethylhexyl)phthalate 47 78Butylbenzylphthalate 4.9 64Diethylphthalate 61 110Dimethylphthalate 53 53Di-n-Butylphthalate 220 1,700Di-n-Octyl phthalate 58 4,500
Phenols (mg/kg) (mg/kg)Phenol 0.42 1.22,4-Dimethylphenol 0.029 0.0292-Methylphenol 0.063 0.0634-Methylphenol 0.67 0.67Pentachlorophenol 0.36 0.69
Misc. Extractables (mg/kg) (mg/kg)Benzyl Alcohol 0.057 0.073Benzoic Acid 0.65 0.65
Misc. Extractables (ppm TOC) (ppm TOC)1,2,4-Trichlorobenzene 0.81 1.81,2-Dichlorobenzene 2.3 2.31,3-Dichlorobenzene NV NV1,4-Dichlorobenzene 3.1 9Dibenzofuran 15 58Hexachlorobenzene 0.38 2.3Hexachlorobutadiene 3.9 6.2N-Nitrosodiphenylamine 11 11
PCBs (ppm TOC) (ppm TOC)Aroclor 1016 12 65Aroclor 1221 12 65Aroclor 1232 12 65Aroclor 1242 12 65Aroclor 1248 12 65Aroclor 1254 12 65Aroclor 1260 12 65Total PCBs 12 65
NOTES:Single underlined values exceed the SQS valueDouble underlined values exceed the MCUL valueNV - No ValueNA - Not AnalyzedD - Indicates value reported in diluted sample.J - Indicated value is an estimate.
SMS Criteria OG-6 OG-78/24/2000 8/25/2000
72.4 45.51.0 2.6
20.0 < 10< 20.0 < 10< 0.70 0.50
28.0 73.017.9 59.220.0 18.0
0.090 0.40 J1,120 129
< 1.0 < 0.673.0 120
(mg/kg) (ppm TOC) (mg/kg) (ppm TOC)0.029 2.9 0.038 1.50.030 3.0 0.029 1.10.028 2.8 0.029 1.10.074 7.4 0.160 6.20.032 3.2 0.049 1.90.035 3.5 0.048 1.80.30 30.0 0.220 8.50.53 52.8 0.573 22.0
(mg/kg) (ppm TOC) (mg/kg) (ppm TOC)0.25 25.0 0.200 7.70.24 24.0 0.150 5.80.30 30.0 0.210 8.1
0.079 7.9 0.066 2.50.30 30.0 0.210 8.10.46 46.0 0.360 13.8
< 0.020 < 2.0 0.023 M 0.88 M0.73 73.0 0.550 21.2
0.085 8.5 0.850 32.70.94 94.0 0.540 20.83.4 338 3.16 121.5
(mg/kg) (ppm TOC) (mg/kg) (ppm TOC)0.40 40.0 0.67 25.8
< 0.020 < 2.0 0.025 1.0< 0.020 < 2.0 < 0.020 < 0.77< 0.020 < 2.0 < 0.020 < 0.77< 0.020 < 2.0 < 0.020 < 0.77< 0.020 < 2.0 < 0.020 < 0.77
< 0.02 0.046 M< 0.02 < 0.02< 0.02 < 0.02< 0.02 0.051< 0.10 < 0.10
< 0.020 < 0.020< 0.20 < 0.20
(mg/kg) (ppm TOC) (mg/kg) (ppm TOC)< 0.02 < 2 < 0.02 < 0.77< 0.02 < 2 < 0.02 < 0.77< 0.02 < 2 < 0.02 < 0.77< 0.02 < 2 < 0.02 < 0.77
0.037 3.7 0.051 2.0< 0.02 < 2 < 0.02 < 0.77< 0.02 < 2 < 0.02 < 0.77< 0.02 < 2 < 0.02 < 0.77
(mg/kg) (ppm TOC) (mg/kg) (ppm TOC)< 0.018 < 1.8 NA NA< 0.037 < 3.7 NA NA< 0.018 < 1.8 NA NA< 0.018 < 1.8 NA NA< 0.018 < 1.8 NA NA< 0.018 < 1.8 NA NA< 0.018 < 1.8 NA NA< 0.037 < 3.7 NA NA
(mg/kg)(mg/kg)
(mg/kg)(mg/kg)
(mg/kg)(mg/kg)

Table A-3 Summary of Phase 2 Surface Sediment Analytical Data
Parameter SQS MCUL
ConventionalsTotal Solids (%) NV NVTotal Organic Carbon (%) NV NV
Metals (mg/kg) (mg/kg)Antimony NV NVArsenic 57 93Cadmium 5.1 6.7Chromium 260 270Copper 390 390Lead 450 530Mercury 0.41 0.59Nickel NV NVSilver 6.1 6.1Zinc 410 960
LPAH (ppm TOC) (ppm TOC)2-Methylnaphthalene 38 64Acenaphthene 16 57Acenaphthylene 66 66Anthracene 220 1,200Fluorene 23 79Naphthalene 99 170Phenanthrene 100 480Total LPAHs 562 780
HPAH (ppm TOC) (ppm TOC)Benzo(a)anthracene 110 270Benzo(a)pyrene 99 210Benzo(b)fluoranthene 230 450Benzo(g,h,i)perylene 31 78Benzo(k)fluoranthene 230 450Chrysene 110 460Dibenz(a,h)anthracene 12 33Fluoranthene 160 1,200Indeno(1,2,3-cd)pyrene 34 88Pyrene 1,000 1,400Total HPAHs 2,016 5,300
Phthalates (ppm TOC) (ppm TOC)bis(2-Ethylhexyl)phthalate 47 78Butylbenzylphthalate 4.9 64Diethylphthalate 61 110Dimethylphthalate 53 53Di-n-Butylphthalate 220 1,700Di-n-Octyl phthalate 58 4,500
Phenols (mg/kg) (mg/kg)Phenol 0.42 1.22,4-Dimethylphenol 0.029 0.0292-Methylphenol 0.063 0.0634-Methylphenol 0.67 0.67Pentachlorophenol 0.36 0.69
Misc. Extractables (mg/kg) (mg/kg)Benzyl Alcohol 0.057 0.073Benzoic Acid 0.65 0.65
Misc. Extractables (ppm TOC) (ppm TOC)1,2,4-Trichlorobenzene 0.81 1.81,2-Dichlorobenzene 2.3 2.31,3-Dichlorobenzene NV NV1,4-Dichlorobenzene 3.1 9Dibenzofuran 15 58Hexachlorobenzene 0.38 2.3Hexachlorobutadiene 3.9 6.2N-Nitrosodiphenylamine 11 11
PCBs (ppm TOC) (ppm TOC)Aroclor 1016 12 65Aroclor 1221 12 65Aroclor 1232 12 65Aroclor 1242 12 65Aroclor 1248 12 65Aroclor 1254 12 65Aroclor 1260 12 65Total PCBs 12 65
NOTES:Single underlined values exceed the SQS valueDouble underlined values exceed the MCUL valueNV - No ValueNA - Not AnalyzedD - Indicates value reported in diluted sample.J - Indicated value is an estimate.
SMS Criteria OG-8 OG-98/25/2000 8/25/2000
47.3 44.62.8 2.9
NA NANA NANA NANA NANA NANA NANA NANA NANA NANA NA
(mg/kg) (ppm TOC) (mg/kg) (ppm TOC)0.039 1.4 0.049 1.70.029 1.0 0.043 1.50.034 1.2 0.032 1.10.120 4.3 0.13 4.50.050 1.8 0.070 2.40.047 1.7 0.056 1.90.220 7.9 0.27 9.30.539 19.2 0.650 22.4
(mg/kg) (ppm TOC) (mg/kg) (ppm TOC)0.230 8.2 0.24 8.30.170 6.1 0.15 5.20.250 8.9 0.29 10.00.056 2.0 0.014 J 0.480.250 8.9 0.23 7.90.380 13.6 0.38 13.10.021 M 0.7 M < 0.020 < 0.690.560 20.0 0.67 23.10.074 2.6 0.021 0.720.540 19.3 0.61 21.02.53 90.4 2.61 89.8
(mg/kg) (ppm TOC) (mg/kg) (ppm TOC)0.37 13.2 3.2 D 110.3 D
0.026 0.9 0.035 M 1.2< 0.020 < 0.71 < 0.020 < 0.69
0.022 0.8 < 0.020 < 0.69< 0.020 < 0.71 0.042 M 1.4< 0.020 < 0.71 < 0.020 < 0.69
0.086 M 0.05 M< 0.02 0.043< 0.02 < 0.020
0.068 0.062< 0.10 < 0.10
< 0.02 < 0.020< 0.20 < 0.20
(mg/kg) (ppm TOC) (mg/kg) (ppm TOC)< 0.020 < 0.71 < 0.020 < 0.69< 0.020 < 0.71 < 0.020 < 0.69< 0.020 < 0.71 < 0.020 < 0.69< 0.020 < 0.71 < 0.020 < 0.69
0.052 1.9 0.068 2.3< 0.020 < 0.71 < 0.020 < 0.69< 0.020 < 0.71 < 0.020 < 0.69< 0.020 < 0.71 < 0.020 < 0.69
(mg/kg) (ppm TOC) (mg/kg) (ppm TOC)NA NA NA NANA NA NA NANA NA NA NANA NA NA NANA NA NA NANA NA NA NANA NA NA NANA NA NA NA
(mg/kg) (mg/kg)
(mg/kg) (mg/kg)
(mg/kg) (mg/kg)
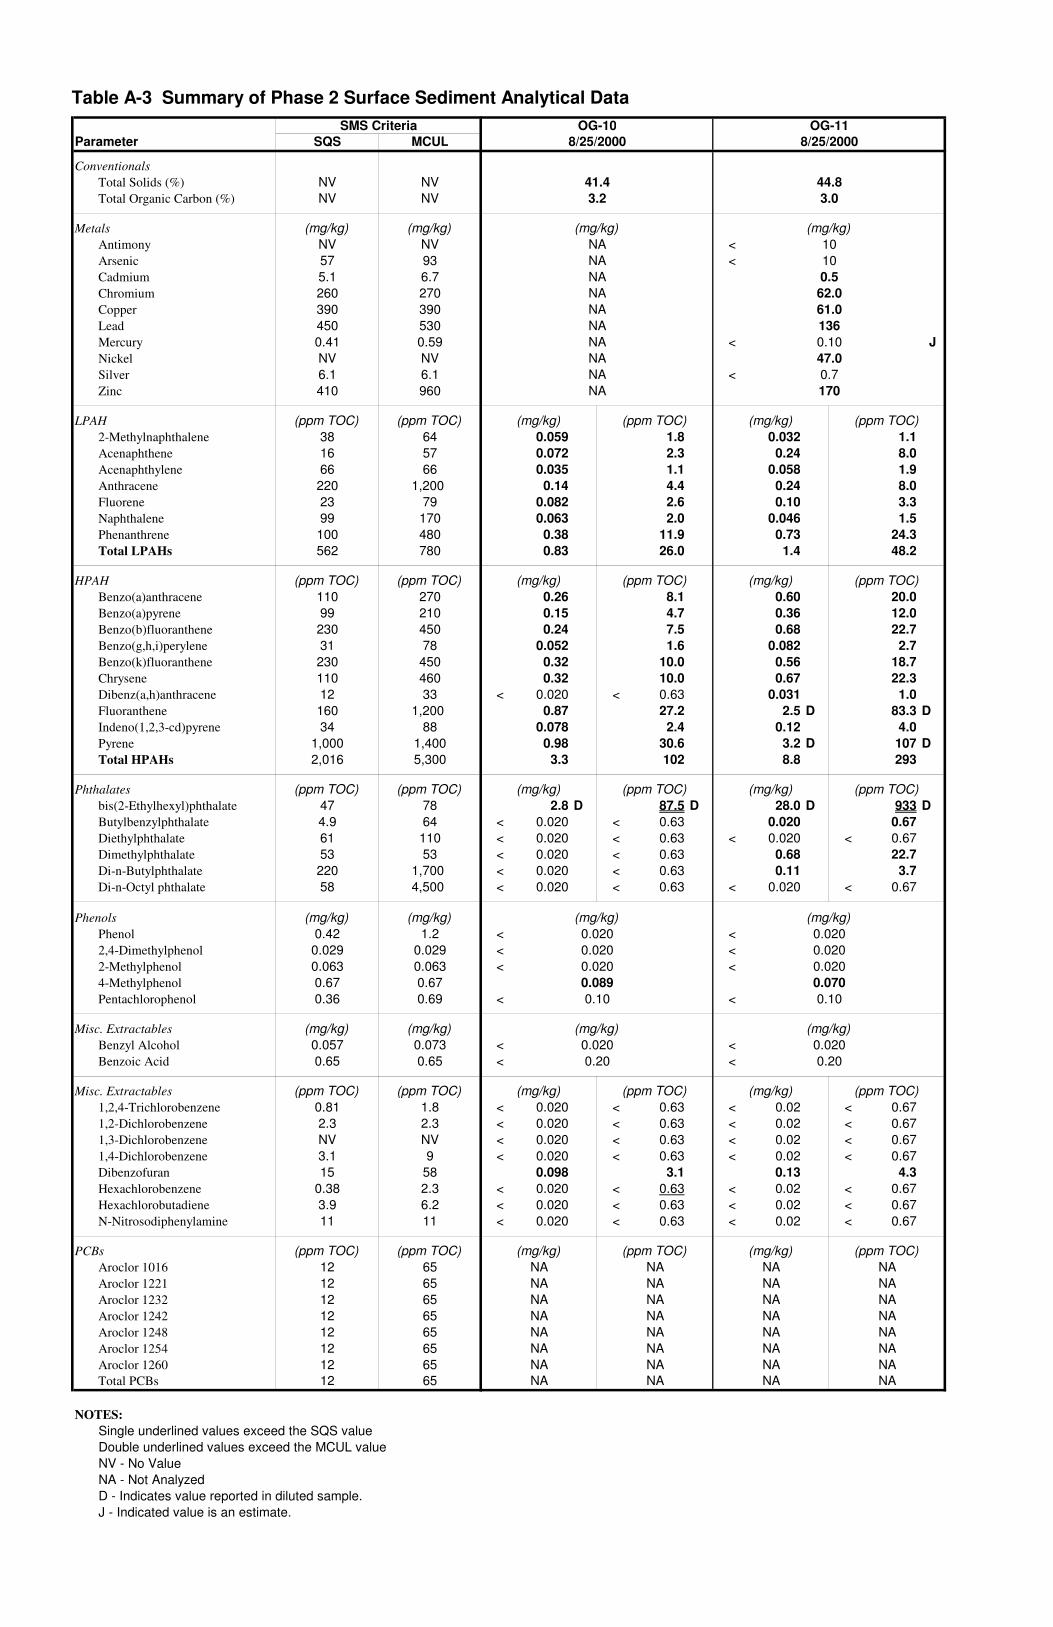
Table A-3 Summary of Phase 2 Surface Sediment Analytical Data
Parameter SQS MCUL
ConventionalsTotal Solids (%) NV NVTotal Organic Carbon (%) NV NV
Metals (mg/kg) (mg/kg)Antimony NV NVArsenic 57 93Cadmium 5.1 6.7Chromium 260 270Copper 390 390Lead 450 530Mercury 0.41 0.59Nickel NV NVSilver 6.1 6.1Zinc 410 960
LPAH (ppm TOC) (ppm TOC)2-Methylnaphthalene 38 64Acenaphthene 16 57Acenaphthylene 66 66Anthracene 220 1,200Fluorene 23 79Naphthalene 99 170Phenanthrene 100 480Total LPAHs 562 780
HPAH (ppm TOC) (ppm TOC)Benzo(a)anthracene 110 270Benzo(a)pyrene 99 210Benzo(b)fluoranthene 230 450Benzo(g,h,i)perylene 31 78Benzo(k)fluoranthene 230 450Chrysene 110 460Dibenz(a,h)anthracene 12 33Fluoranthene 160 1,200Indeno(1,2,3-cd)pyrene 34 88Pyrene 1,000 1,400Total HPAHs 2,016 5,300
Phthalates (ppm TOC) (ppm TOC)bis(2-Ethylhexyl)phthalate 47 78Butylbenzylphthalate 4.9 64Diethylphthalate 61 110Dimethylphthalate 53 53Di-n-Butylphthalate 220 1,700Di-n-Octyl phthalate 58 4,500
Phenols (mg/kg) (mg/kg)Phenol 0.42 1.22,4-Dimethylphenol 0.029 0.0292-Methylphenol 0.063 0.0634-Methylphenol 0.67 0.67Pentachlorophenol 0.36 0.69
Misc. Extractables (mg/kg) (mg/kg)Benzyl Alcohol 0.057 0.073Benzoic Acid 0.65 0.65
Misc. Extractables (ppm TOC) (ppm TOC)1,2,4-Trichlorobenzene 0.81 1.81,2-Dichlorobenzene 2.3 2.31,3-Dichlorobenzene NV NV1,4-Dichlorobenzene 3.1 9Dibenzofuran 15 58Hexachlorobenzene 0.38 2.3Hexachlorobutadiene 3.9 6.2N-Nitrosodiphenylamine 11 11
PCBs (ppm TOC) (ppm TOC)Aroclor 1016 12 65Aroclor 1221 12 65Aroclor 1232 12 65Aroclor 1242 12 65Aroclor 1248 12 65Aroclor 1254 12 65Aroclor 1260 12 65Total PCBs 12 65
NOTES:Single underlined values exceed the SQS valueDouble underlined values exceed the MCUL valueNV - No ValueNA - Not AnalyzedD - Indicates value reported in diluted sample.J - Indicated value is an estimate.
SMS Criteria OG-10 OG-118/25/2000 8/25/2000
41.4 44.83.2 3.0
NA < 10NA < 10NA 0.5NA 62.0NA 61.0NA 136NA < 0.10 JNA 47.0NA < 0.7NA 170
(mg/kg) (ppm TOC) (mg/kg) (ppm TOC)0.059 1.8 0.032 1.10.072 2.3 0.24 8.00.035 1.1 0.058 1.90.14 4.4 0.24 8.0
0.082 2.6 0.10 3.30.063 2.0 0.046 1.50.38 11.9 0.73 24.30.83 26.0 1.4 48.2
(mg/kg) (ppm TOC) (mg/kg) (ppm TOC)0.26 8.1 0.60 20.00.15 4.7 0.36 12.00.24 7.5 0.68 22.7
0.052 1.6 0.082 2.70.32 10.0 0.56 18.70.32 10.0 0.67 22.3
< 0.020 < 0.63 0.031 1.00.87 27.2 2.5 D 83.3 D
0.078 2.4 0.12 4.00.98 30.6 3.2 D 107 D3.3 102 8.8 293
(mg/kg) (ppm TOC) (mg/kg) (ppm TOC)2.8 D 87.5 D 28.0 D 933 D
< 0.020 < 0.63 0.020 0.67< 0.020 < 0.63 < 0.020 < 0.67< 0.020 < 0.63 0.68 22.7< 0.020 < 0.63 0.11 3.7< 0.020 < 0.63 < 0.020 < 0.67
< 0.020 < 0.020< 0.020 < 0.020< 0.020 < 0.020
0.089 0.070< 0.10 < 0.10
< 0.020 < 0.020< 0.20 < 0.20
(mg/kg) (ppm TOC) (mg/kg) (ppm TOC)< 0.020 < 0.63 < 0.02 < 0.67< 0.020 < 0.63 < 0.02 < 0.67< 0.020 < 0.63 < 0.02 < 0.67< 0.020 < 0.63 < 0.02 < 0.67
0.098 3.1 0.13 4.3< 0.020 < 0.63 < 0.02 < 0.67< 0.020 < 0.63 < 0.02 < 0.67< 0.020 < 0.63 < 0.02 < 0.67
(mg/kg) (ppm TOC) (mg/kg) (ppm TOC)NA NA NA NANA NA NA NANA NA NA NANA NA NA NANA NA NA NANA NA NA NANA NA NA NANA NA NA NA
(mg/kg)(mg/kg)
(mg/kg)(mg/kg)
(mg/kg)(mg/kg)

Table A-3 Summary of Phase 2 Surface Sediment Analytical Data
Parameter SQS MCUL
ConventionalsTotal Solids (%) NV NVTotal Organic Carbon (%) NV NV
Metals (mg/kg) (mg/kg)Antimony NV NVArsenic 57 93Cadmium 5.1 6.7Chromium 260 270Copper 390 390Lead 450 530Mercury 0.41 0.59Nickel NV NVSilver 6.1 6.1Zinc 410 960
LPAH (ppm TOC) (ppm TOC)2-Methylnaphthalene 38 64Acenaphthene 16 57Acenaphthylene 66 66Anthracene 220 1,200Fluorene 23 79Naphthalene 99 170Phenanthrene 100 480Total LPAHs 562 780
HPAH (ppm TOC) (ppm TOC)Benzo(a)anthracene 110 270Benzo(a)pyrene 99 210Benzo(b)fluoranthene 230 450Benzo(g,h,i)perylene 31 78Benzo(k)fluoranthene 230 450Chrysene 110 460Dibenz(a,h)anthracene 12 33Fluoranthene 160 1,200Indeno(1,2,3-cd)pyrene 34 88Pyrene 1,000 1,400Total HPAHs 2,016 5,300
Phthalates (ppm TOC) (ppm TOC)bis(2-Ethylhexyl)phthalate 47 78Butylbenzylphthalate 4.9 64Diethylphthalate 61 110Dimethylphthalate 53 53Di-n-Butylphthalate 220 1,700Di-n-Octyl phthalate 58 4,500
Phenols (mg/kg) (mg/kg)Phenol 0.42 1.22,4-Dimethylphenol 0.029 0.0292-Methylphenol 0.063 0.0634-Methylphenol 0.67 0.67Pentachlorophenol 0.36 0.69
Misc. Extractables (mg/kg) (mg/kg)Benzyl Alcohol 0.057 0.073Benzoic Acid 0.65 0.65
Misc. Extractables (ppm TOC) (ppm TOC)1,2,4-Trichlorobenzene 0.81 1.81,2-Dichlorobenzene 2.3 2.31,3-Dichlorobenzene NV NV1,4-Dichlorobenzene 3.1 9Dibenzofuran 15 58Hexachlorobenzene 0.38 2.3Hexachlorobutadiene 3.9 6.2N-Nitrosodiphenylamine 11 11
PCBs (ppm TOC) (ppm TOC)Aroclor 1016 12 65Aroclor 1221 12 65Aroclor 1232 12 65Aroclor 1242 12 65Aroclor 1248 12 65Aroclor 1254 12 65Aroclor 1260 12 65Total PCBs 12 65
NOTES:Single underlined values exceed the SQS valueDouble underlined values exceed the MCUL valueNV - No ValueNA - Not AnalyzedD - Indicates value reported in diluted sample.J - Indicated value is an estimate.
SMS Criteria OG-12 OG-138/25/2000 8/25/2000
43.6 41.92.6 3.8
NA < 10NA < 10NA 0.6NA 49NA 43NA 14NA 0.3 JNA 71NA < 0.7NA 176
(mg/kg) (ppm TOC) (mg/kg) (ppm TOC)0.044 1.7 0.14 3.70.039 1.5 0.30 7.90.025 1.0 0.11 2.90.084 3.2 0.49 12.90.059 2.3 0.34 8.90.048 1.8 0.12 3.20.20 7.7 1.7 D 44.7 D
0.499 19.2 3.2 84.2
(mg/kg) (ppm TOC) (mg/kg) (ppm TOC)0.16 6.2 1.2 31.60.11 4.2 0.56 14.70.22 8.5 0.8 21.1
< 0.019 < 0.73 0.14 3.70.17 6.5 1.2 31.60.26 10.0 1.5 39.5
< 0.019 < 0.73 0.038 1.00.50 19.2 5.6 D 147 D
0.017 J 0.7 0.2 5.30.42 16.2 5.6 D 147 D1.86 71.4 16.8 443
(mg/kg) (ppm TOC) (mg/kg) (ppm TOC)1.4 53.8 16.0 421
0.014 JM 0.5 < 0.020 < 0.53< 0.019 < 0.73 < 0.020 < 0.53< 0.019 < 0.73 0.046 1.2< 0.019 < 0.73 < 0.020 < 0.53< 0.019 < 0.73 < 0.020 < 0.53
0.052 M < 0.0200.019 J < 0.020
< 0.019 < 0.0200.056 0.110.018 J < 0.099
< 0.019 < 0.020< 0.19 < 0.20
(mg/kg) (ppm TOC) (mg/kg) (ppm TOC)< 0.019 < 0.73 < 0.020 < 0.53< 0.019 < 0.73 < 0.020 < 0.53< 0.019 < 0.73 < 0.020 < 0.53< 0.019 < 0.73 < 0.020 < 0.53
0.059 2.3 0.30 7.9< 0.019 < 0.73 < 0.020 < 0.53< 0.019 < 0.73 < 0.020 < 0.53< 0.019 < 0.73 < 0.020 < 0.53
(mg/kg) (ppm TOC) (mg/kg) (ppm TOC)NA NA NA NANA NA NA NANA NA NA NANA NA NA NANA NA NA NANA NA NA NANA NA NA NANA NA NA NA
(mg/kg) (mg/kg)
(mg/kg) (mg/kg)
(mg/kg) (mg/kg)

Attachment B
Field Forms
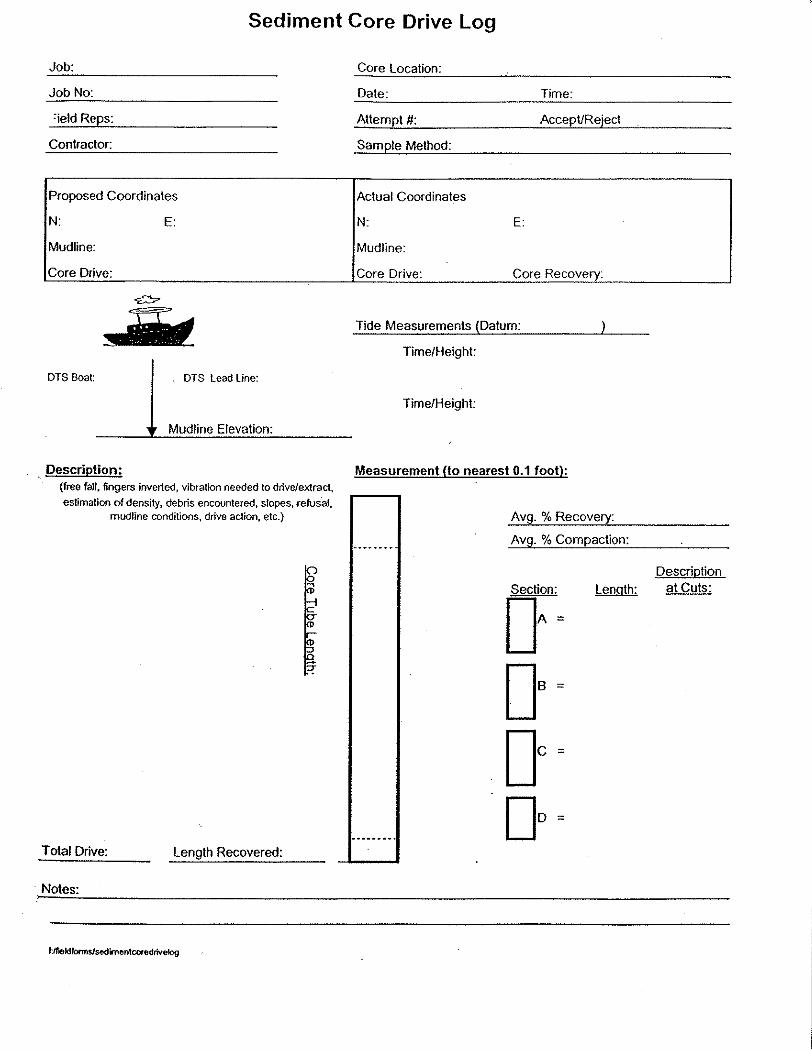
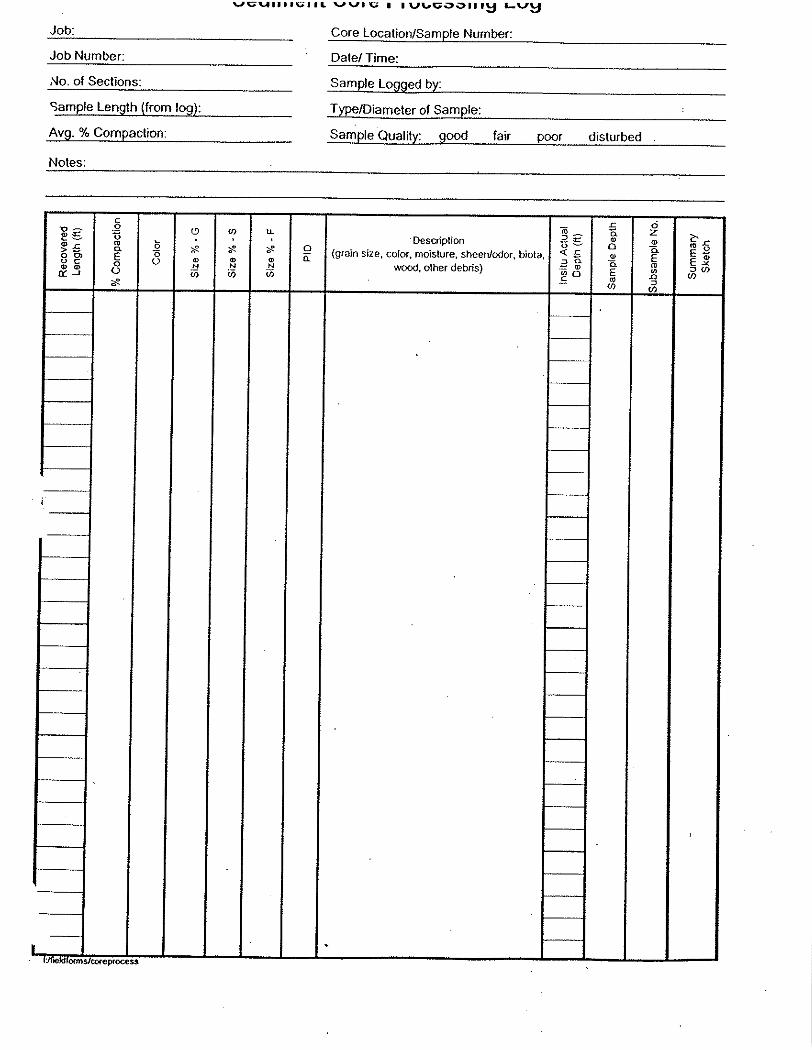
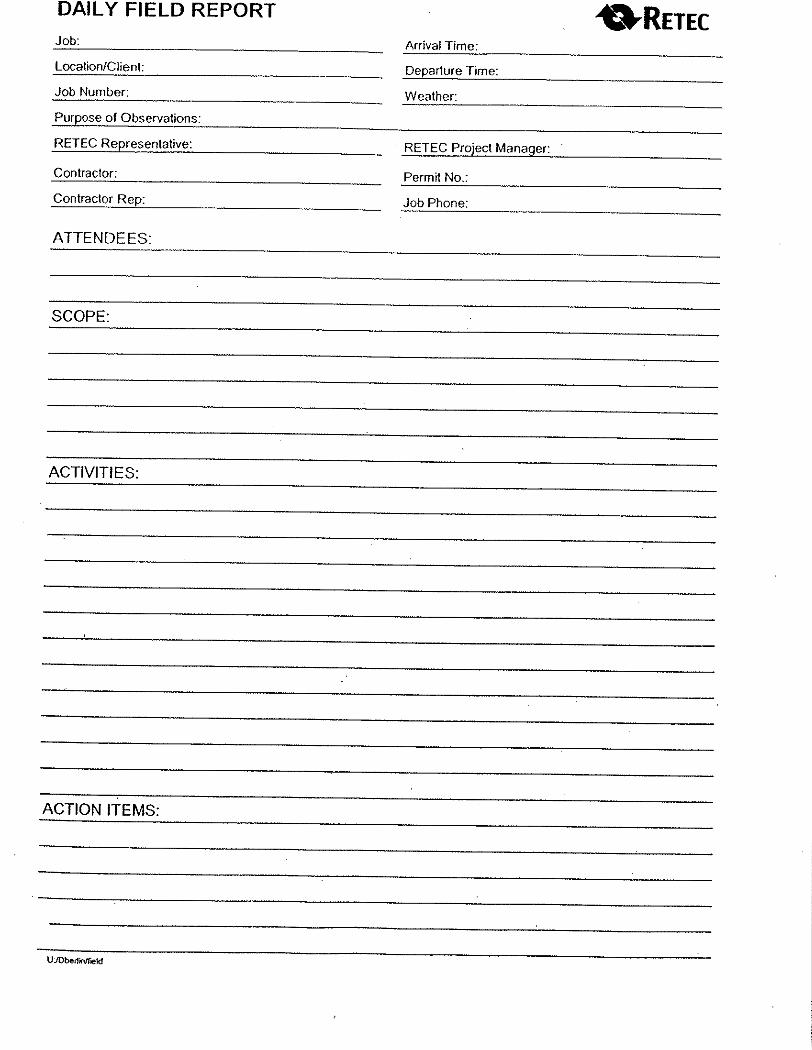
Attachment C
Reporting Requirements for Chemical Variables and Bioassays