I-80 Integrated Corridor Mobility (ICM) Corridor … Integrated Corridor Mobility (ICM) Corridor...
29
I-80 Integrated Corridor Mobility (ICM) Corridor System Management Plan Executive Summary Final Prepared by November 30, 2010
Transcript of I-80 Integrated Corridor Mobility (ICM) Corridor … Integrated Corridor Mobility (ICM) Corridor...
I-80 Integrated CorridorMobility (ICM)
Corridor System ManagementPlan
Executive SummaryFinal
ExecutiveSummaryFinal
Prepared by
November 30, 2010

Interstate 80 Integrated
Corridor Mobility Project Corridor System Management Plan
Executive Summary FINAL
By
DKS Associates 1000 Broadway, Suite 450 Oakland, CA 94607 (510) 763-2061
November 30, 2010


Table of Contents
1. CSMP OVERVIEW............................................................................................................ 1 Purpose and Need Statement.................................................................................................... 1 Consistency With Other Plans.................................................................................................. 2
2
3355
5
89
1213
22
4
2. THE I-80 CSMP CORRIDOR...........................................................................................
3. OPERATING CONDITIONS............................................................................................ Existing Conditions .................................................................................................................. Near Term Conditions (2015) .................................................................................................. Long Term Conditions (2035)..................................................................................................
4. CANDIDATE STRATEGIES AND CONSTRAINTS ....................................................
5. RECOMMENDATIONS.................................................................................................... Near Term Recommendations.................................................................................................. Intermediate Term Recommendations ................................................................................... Long Term Recommendations ...............................................................................................
6. LIMITATIONS OF THE I-80 CSMP STUDY ..............................................................
List of Figures Figure 1 Key Elements of Strategic Growth Plan...........................................................................2 Figure 2 I-80 CSMP Corridor .........................................................................................................3 Figure 3 Existing I-80 Bottleneck Locations .................................................................................. Figure 4 I-80 Intergrated Corridor Mobility Project Concept ........................................................9
List of Tables Table 1 I-80 CSMP Recommended Project Implementation Timeline .........................................15
I-80 Integrated Corridor Mobility Project Final CSMP – Executive Summary
i November 30, 2010

1. CSMP OVERVIEW A Corridor System Management Plan (CSMP) is a transportation planning document that provides for the safe, efficient and effective mobility of people and goods within the most congested transportation corridors in California. Each CSMP presents an analysis of existing and future traffic conditions and proposes traffic management strategies and capital improvements to maintain and enhance mobility within each corridor. The corridor management planning strategy is based on the integration of system planning and system management. The CSMP transportation network is defined to include, but is not limited to, State Highways, major arterials, intercity and regional rail service, regional transit services, and other regional modes pertinent to corridor mobility.
CSMPs are being developed throughout the State for corridors within which funding is being used from the Corridor Mobility Improvement Account (CMIA) and Highway 99 Bond Programs created by the passage of the Highway Safety, Traffic Reduction, Air Quality, and Port Security Bond Act of 2006, approved by the voters as Proposition 1B in November 2006. The intent is to eventually develop CSMPs for all urban freeway corridors.
Purpose and Need Statement Corridor System Management Plans (CSMPs) are legislatively required for all corridors that receive CMIA or Highway 99 bond funding to implement capital improvement projects. In response to the passage of Proposition 1B, the CTC adopted Resolution CMIS-P-0607-02 on March 15, 2007. In Sections 2.12 and 2.13 of this resolution, the CTC resolved that “…the Commission expects Caltrans and regional agencies to preserve the mobility gains of urban corridor capacity improvements over time that will be described in CSMPs, which may include the installations of traffic detection equipment, the use of ramp metering, operational improvements, and other traffic management elements as appropriate…” and “…the nominating agencies including the installations of detection equipment and other supporting elements, to the project delivery council on a semiannual basis…”. The intent of the CSMP is to ensure that the CMIA projects are paired with corridor strategies that maximize the benefit of these investments.
The ultimate purpose of the CSMP is to serve as a tool for efficiently and effectively using all transportation modes and facilities in congested corridors so as to maximize mobility, improve safety and reduce delay costs. The CSMP allows the State, regional agencies, and local jurisdictions to manage and operate the transportation corridor to maintain a high level of sustained productivity and reliability based on the assessment and evaluation of performance measures. The CSMP assesses current performance, identifies causal factors for congestion and proposes the best currently feasible mix of improvements, strategies, and actions to optimize corridor performance.
I-80 Integrated Corridor Mobility Project Final CSMP – Executive Summary
-1- November 30, 2010
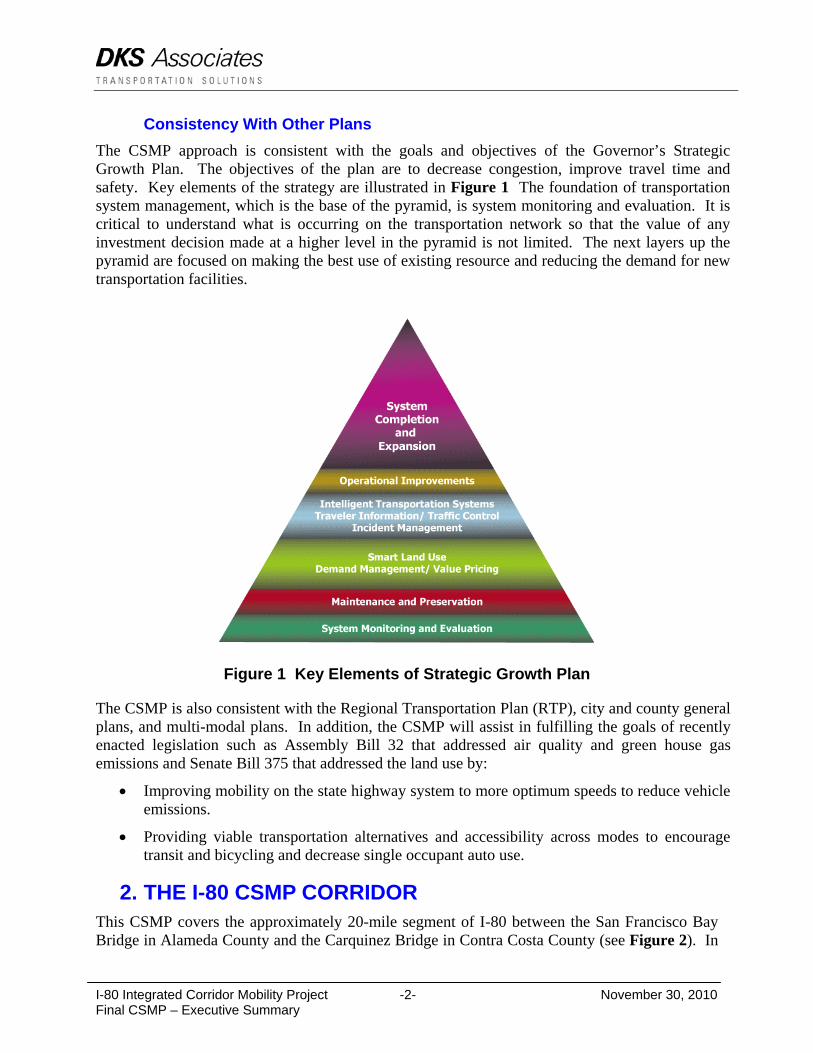
Consistency With Other Plans The CSMP approach is consistent with the goals and objectives of the Governor’s Strategic Growth Plan. The objectives of the plan are to decrease congestion, improve travel time and safety. Key elements of the strategy are illustrated in Figure 1 The foundation of transportation system management, which is the base of the pyramid, is system monitoring and evaluation. It is critical to understand what is occurring on the transportation network so that the value of any investment decision made at a higher level in the pyramid is not limited. The next layers up the pyramid are focused on making the best use of existing resource and reducing the demand for new transportation facilities.
Figure 1 Key Elements of Strategic Growth Plan
The CSMP is also consistent with the Regional Transportation Plan (RTP), city and county general plans, and multi-modal plans. In addition, the CSMP will assist in fulfilling the goals of recently enacted legislation such as Assembly Bill 32 that addressed air quality and green house gas emissions and Senate Bill 375 that addressed the land use by:
• Improving mobility on the state highway system to more optimum speeds to reduce vehicle emissions.
• Providing viable transportation alternatives and accessibility across modes to encourage transit and bicycling and decrease single occupant auto use.
2. THE I-80 CSMP CORRIDOR This CSMP covers the approximately 20-mile segment of I-80 between the San Francisco Bay Bridge in Alameda County and the Carquinez Bridge in Contra Costa County (see Figure 2). In
I-80 Integrated Corridor Mobility Project Final CSMP – Executive Summary
-2- November 30, 2010
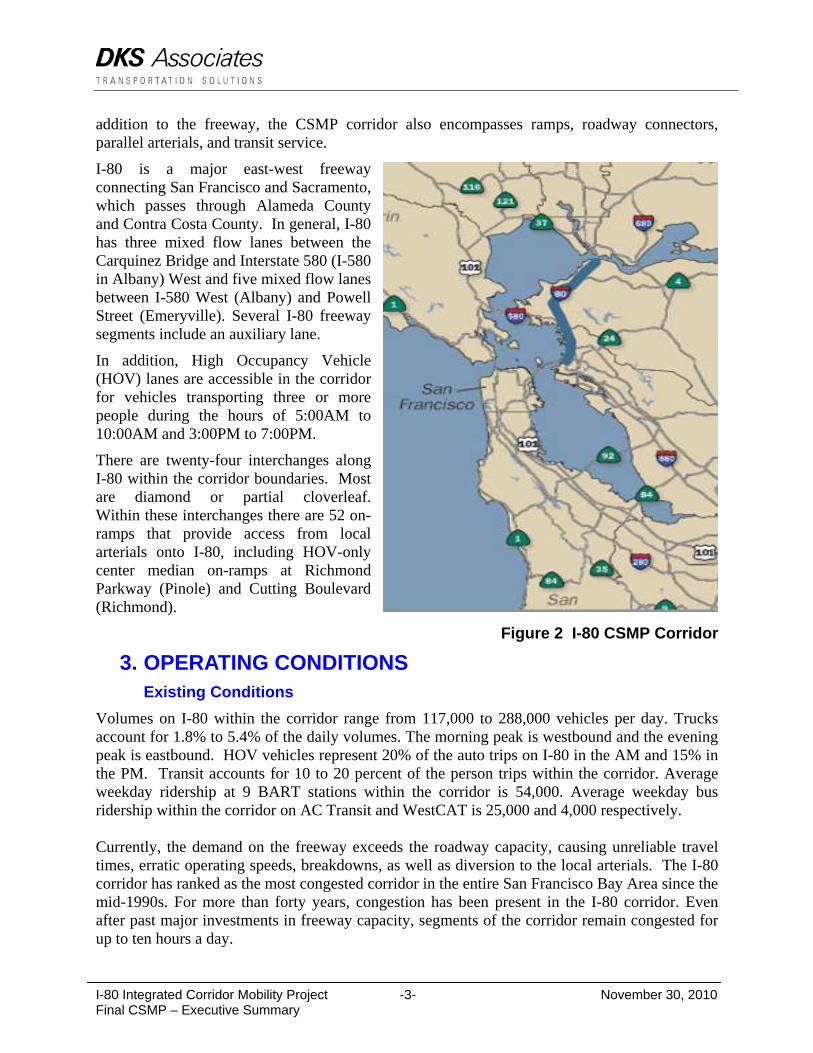
addition to the freeway, the CSMP corridor also encompasses ramps, roadway connectors, parallel arterials, and transit service.
I-80 is a major east-west freeway connecting San Francisco and Sacramento, which passes through Alameda County and Contra Costa County. In general, I-80 has three mixed flow lanes between the Carquinez Bridge and Interstate 580 (I-580 in Albany) West and five mixed flow lanes between I-580 West (Albany) and Powell Street (Emeryville). Several I-80 freeway segments include an auxiliary lane.
In addition, High Occupancy Vehicle (HOV) lanes are accessible in the corridor for vehicles transporting three or more people during the hours of 5:00AM to 10:00AM and 3:00PM to 7:00PM.
There are twenty-four interchanges along I-80 within the corridor boundaries. Most are diamond or partial cloverleaf. Within these interchanges there are 52 on-ramps that provide access from local arterials onto I-80, including HOV-only center median on-ramps at Richmond Parkway (Pinole) and Cutting Boulevard (Richmond).
Figure 2 I-80 CSMP Corridor
3. OPERATING CONDITIONS Existing Conditions
Volumes on I-80 within the corridor range from 117,000 to 288,000 vehicles per day. Trucks account for 1.8% to 5.4% of the daily volumes. The morning peak is westbound and the evening peak is eastbound. HOV vehicles represent 20% of the auto trips on I-80 in the AM and 15% in the PM. Transit accounts for 10 to 20 percent of the person trips within the corridor. Average weekday ridership at 9 BART stations within the corridor is 54,000. Average weekday bus ridership within the corridor on AC Transit and WestCAT is 25,000 and 4,000 respectively. Currently, the demand on the freeway exceeds the roadway capacity, causing unreliable travel times, erratic operating speeds, breakdowns, as well as diversion to the local arterials. The I-80 corridor has ranked as the most congested corridor in the entire San Francisco Bay Area since the mid-1990s. For more than forty years, congestion has been present in the I-80 corridor. Even after past major investments in freeway capacity, segments of the corridor remain congested for up to ten hours a day.
I-80 Integrated Corridor Mobility Project Final CSMP – Executive Summary
-3- November 30, 2010

I-80 Integrated Corridor Mobility Project Final CSMP – Executive Summary
-4- November 30, 2010
The congestion on the roadway network contributes to an increase in incidents, including rear-end accidents on both the freeway and local arterials. The accident rate in the Berkeley/Emeryville segment is nearly double the statewide average for similar freeway segments. The frequency of incidents also contributes to delays for transit services operating along the corridor. The combined effect of the incidents and the congestion hinders efficient response times and creates potential for additional secondary incidents. The weekday commute period bottleneck locations in the corridor are listed below by direction and peak period of occurrence and are illustrated in Figure 3.
1. Westbound I-80 at Appian Way on-ramp (AM peak)
2. Westbound I-80 at San Pablo Dam Road on-ramp (AM peak)
3. Westbound I-80 at Gilman Street on-ramp (AM peak)
4. Westbound I-80 at Powell Street on-ramp (AM peak)
5. Westbound I-80 at I-80/I-580/I-880 diverge (PM peak)
6. Eastbound I-80 at I-580 off-ramp (AM and PM peak)
7. Eastbound I-80 at Carlson Boulevard on-ramp (PM peak)
8. Eastbound I-80 at San Pablo Ave (PM peak)
9. Eastbound I-80 at SR 4 off-ramp (PM peak)
Figure 3 Existing I-80 Bottleneck Locations Congestion, notably in the westbound direction in the Emeryville/Berkeley area, also occurs during the weekend periods, but is not as predictable as it is influenced by events at a variety of Bay Area venues, weather, accidents, etc. While the remainder of this CSMP focuses on weekday commute conditons, many of the improvements and strategies discussed in this document may also provide benefits during the weekend periods. In addition, anlaysis of weekend conditions is recommended as an area of further study.
Near Term Conditions (2015) In the near term (2015), it is forecasted that freeway volumes will increase over existing conditions by approximately 13%, while daily transit ridership in the corridor is projected to increase by 17%. Forecasts also suggest that corridor Vehicle Miles Traveled (VMT) will increase by approximately 12% and Vehicle Hours Traveled (VHT) will increase by approximately 20%. Because of the instability in the system in the future, freeway Vehicle Hours of Delay (VHD) is projected to increase by 50% for westbound I-80 in the AM and 100% for eastbound I-80 in the PM. Existing bottlenecks will still be present but with longer queues and longer times to clear the queues.
Long Term Conditions (2035) Households are expected to increase in Alameda County and Contra Costa County by 28.4% between 2005 and 2035. For the I-80 corridor, households will increase 20.9% from 113,407 in 2005 to 137,154 in 2035. Employment in Alameda and Contra Costa Counties will increase by 49.5% between 2005 and 2035, rising from 1,123,521 to 1,679,458. Within the I-80 corridor, 2005 employment is 126,335 and will increase by 44.8% to 182,942 by 2035. Based on this increase in population and employment, I-80 peak hour demand is forecasted to increase between 21% and 67% for the AM peak hour and between 16% and 35% for the PM peak hour between 2005 and 2035. Total freeway demand within the corridor, defined as the total vehicle demand that uses a section of Interstate 80 within the study corridor, is forecasted to increase by 51.9% during the AM peak hour and 47.4% during the PM peak hour by 2035. This includes vehicle trips with an origin and/or destination within the corridor and through trips where both the origin and destination of the trips exist outside the corridor. As demands are forecasted to increase, travel times will increase, delays will increase significantly, and speeds will decrease significantly under the baseline trend conditions (no further improvements to corridor after 2015). In 2035, the I-80 corridor’s VMT increases by approximately 37% and 32% during the respective AM and PM peak hours while the VHT increases by approximately 109% and 77% during the respective AM and PM peak hours.
4. CANDIDATE STRATEGIES AND CONSTRAINTS The I-80 corridor currently ranks as the most congested corridor in the entire San Francisco Bay Area. In the future years, without congestion mitigation/management strategies and improvements, traffic conditions in the I-80 corridor may be expected to worsen significantly in both peak periods based on the traffic growth projected in the regional travel demand model. The most direct approach for mitigating these impacts, and to improve mobility and reliability within the corridor, is to add or expand freeway capacity by adding lanes. However, while some localized improvements may be possible, the potential for significant capacity expansion is constrained physically (on both sides by water and development), institutionally and politically.
I-80 Integrated Corridor Mobility Project Final CSMP – Executive Summary
-5- November 30, 2010

The majority of stakeholders do not support roadway widening due to the:
1. High cost associated with right of way acquisition, roadway construction and roadway operation and maintenance.
2. Significant environmental impacts associated with the roadway construction and roadway operation and maintenance.
3. Potential for the increased capacity to lead to an increase in vehicles using the corridor.
Given this limitation, and the magnitude of projected growth, it is expected that some of the demand will shift to other times (expand the peak period) and some forecasted trips will not occur. However, it is still expected that the demand will grow beyond what the baseline roadway system, plus minor improvements, can accommodate. Therefore there is a need to focus on strategies that:
1. Maximize the efficiency of the existing roadway system. 2. Encourage increased use of other modes. 3. Reduce the occurrence and impact of incidents. 4. Reduce or manage peak period vehicle travel demand.
The types of strategies that can be applied in the I-80 corridor to address existing and forecasted deficiencies include: Freeway and Arterial Geometric Improvements, Freeway and Arterial Management and Operations Improvements, Transit Improvements, Non-Motorized Mode Improvements, Demand Management Strategies, Traveler Information Improvements, Goods Movement Policies, ITS Improvements. In reality, a combination of these improvements and strategies is likely necessary. An overview of these types of strategies is provided below. Roadway Geometric Improvements While major capacity expansion in the I-80 corridor is unlikely, smaller improvements are possible that may address localized deficiencies. Potential freeway improvements include auxiliary lanes, ramp modifications and ramp intersection modifications. Surface street improvements could include adding new roadways that can help relieve I-80, especially in the eastern end of the corridor where higher growth is projected in future years, as well as the widening of existing roadway and intersections.
System Management Improvements The primary objective of System Management improvements is to get maximum benefit out of the existing system. Examples of System Management improvements or strategies include ramp metering, managed lanes, shoulder use, variable speed limit signs, congestion pricing, traffic signal improvements, freeway/ramp/surface street signal coordination, incident management, and reversible lane control. The proposed I-80 ICM Project is focused on the implementation of several System Management strategies, plus systems that can support the implementation of additional or expanded strategies in the future. The project also includes integration with the East Bay SMART Corridors
I-80 Integrated Corridor Mobility Project Final CSMP – Executive Summary
-6- November 30, 2010
Program (a joint Alameda and Contra Costa County ITS program) and the Caltrans District 4 Transportation Management Center (TMC). Transit Improvements There are currently a number of transit services and facilities in the corridor. Current services include various bus services (local, express, Rapid Bus), BART, Amtrak/Capitol Corridor rail. Transit facilties include BART and Amtrak stations, Hercules Transit Center, and numerous park-and-ride lots. The travel demand forecasts suggest that transit demand will increase by 20% by the year 2015, and more than double by 2035. Even with this growth, auto travel demand is also expected to grow leading to more severe congestion in the corridor. To accommodate the forecasted growth and, ideally, promote even greater transit mode share to help reduce congestion on the roadway network, improvements to the transit system will be necessary. Potential transit-related improvements within the I-80 corridor may include enhancing or expanding the existing services and facilities, implementing new services (i.e. ferry, express bus), and constructing new facilities (i.e. transit center and stations, park-and-ride facilities). Other improvements include supporting strategies such as transit signal priority (TSP), transit/HOV lanes that facilitate the flow of transit vehicles on the roadway network, and improved transit traveler information systems. A critical component of these improvements will be the provision of parking at transit centers, rail stations and park-and-ride facilities.
Non-Motorized Mode Improvements Non-motorized mode of travel is an alternative to both auto and transit modes. While the I-80 freeway corridor exceeds the typical maximum trip length for bicycle and pedestrian travel, non-motorized travel is appropriate for short trips and may reduce surface street traffic within the corridor. Potential non-motorized mode improvements may include constructing new bicycle and pedestrian facilties, improving the condition of existing facilties, improving streetscapes and lighting, adding bike detection at signalized intersections, providing more room for bikes on BART and buses, and increasing the availability of bike lockers and bike parking at BART stations. Demand Management Strategies Federal Highway Administration (FHWA) recognizes that managing demand can no longer stop at encouraging travelers to change their travel mode from driving alone to choosing a carpool, public transit, or other commute alternative. Managing demand today is about providing all travelers, regardless of whether they drive alone, with choices of location, route, and time, not just mode of travel. The contemporary concept of travel demand management encompasses broader set of transportation goals due to need to manage demand in multiple situations and conditions as well as the influence of information and the technologies to deliver it. The I-80 corridor has no right of way to increase capacity to the roadway network. Therefore, it is more critical to pay attention to the strategies to shift the demand to other modes, to non-peak hours and possible means to reduce the demand.
I-80 Integrated Corridor Mobility Project Final CSMP – Executive Summary
-7- November 30, 2010
The possible strategies for the I-80 corridor include worksite flextime, telecommuting, Transit-Oriented and Pedestrian Oriented Design, Live Near Work Incentive Programs, Live Near Transit Mortgage Incentives. For the most part, these TDM options are well recognized by stakeholder agencies in the corridor and are already being pursued to the extent feasible. Traveler Information Currently, traveler information on the I-80 corridor is provided via Changeable Message Signs (CMS), Highway Advisory Radios (HAR), telephone and the internet. CMS and HAR systems are used to provide real time information and directions to the driver, plus they are used to advise about upcoming events. These systems are controlled from Caltrans District 4 Transportation Management Center. The internet is used to provide more detailed information to the public. The primary method of sharing information on the Internet and the telephone is via the Bay Area 511 system. This information helps travelers make more-informed decisions in selecting departure times, destinations, and routes in addition to modes of transportation. The I-80 ICM project will provide more ITS devices to monitor traffic conditons, and disseminate the information to travelers in the near-term. In the longer-term, potential improvements include extending the capability of traveler information to emerging personalized devices and in-vehicle navigation systems. In addition, devices could be installed at bus transit and rail stations to disseminate the traveler and transit information. Goods Movement Policies Trucks and other heavy vehicles use I-80 to move goods within the Bay Area to and from northern and southern California, and points beyond. The Port of Oakland and other important industrial and commercial facilities are located along the corridor or are linked by the I-80 freeway. During the peak periods, heavy truck traffic can consume road capacity which contributes significantly to congestion. Because of the importance of efficient freight movement to the economy, the needs of this group will be factored into the solution; moreover, the solution must be consistent with the Bay Area goods movements’ strategies while still allowing the corridor to meet its congestion and safety goals. Improving the commercial vehicle operators’ safety, efficiency, mobility and travel times are the most important goals for this group of users. Some possible strategies include roadway time-of-day restrictions, lane restrictions (this may include designating lanes for trucks only, or resticting trucks from using some lanes), and constructing a remote transfer site.
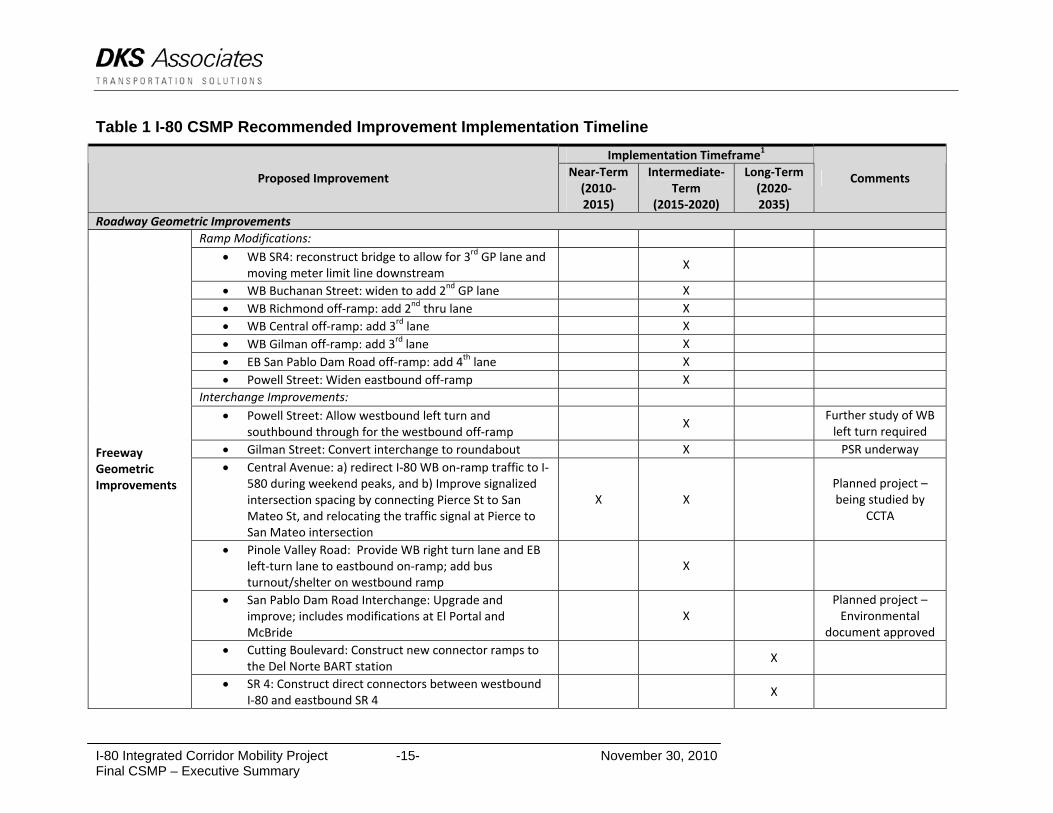
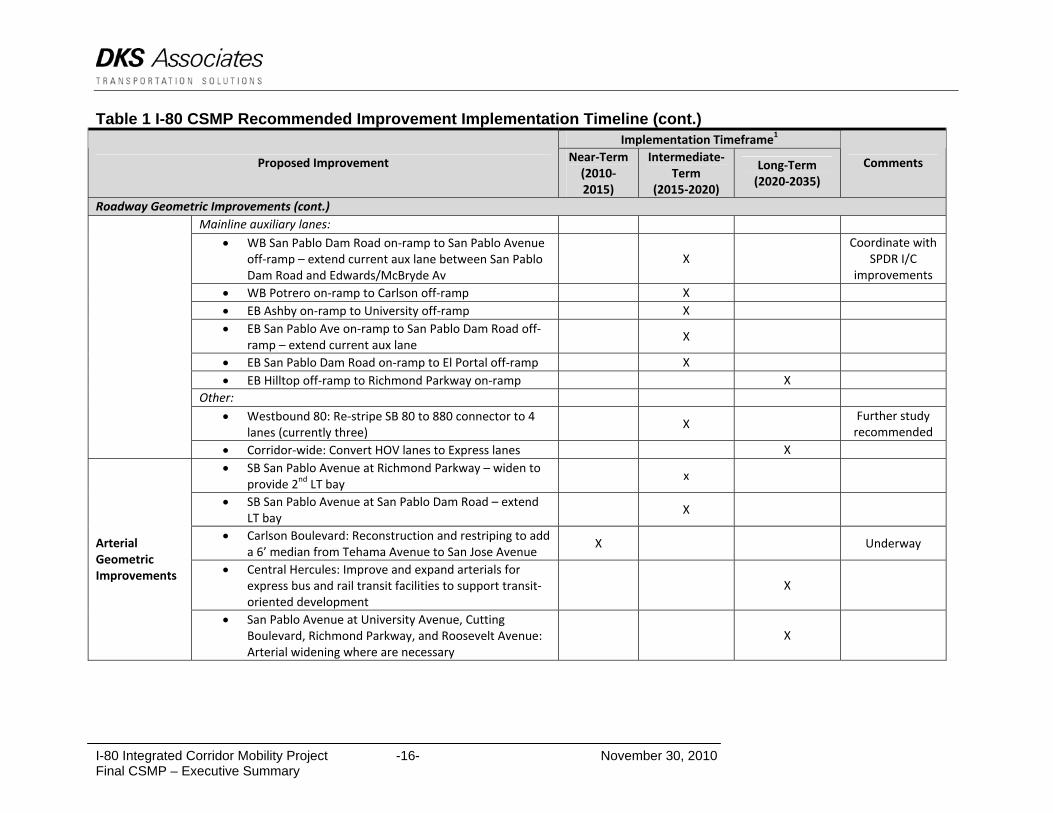
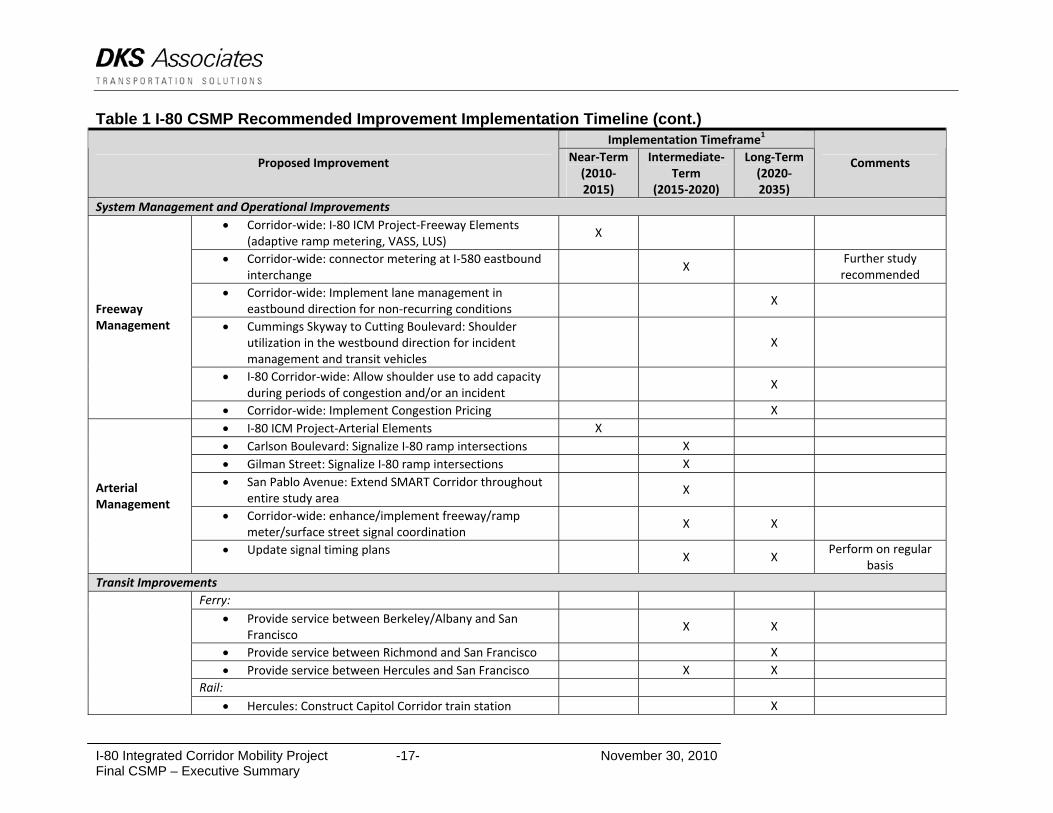
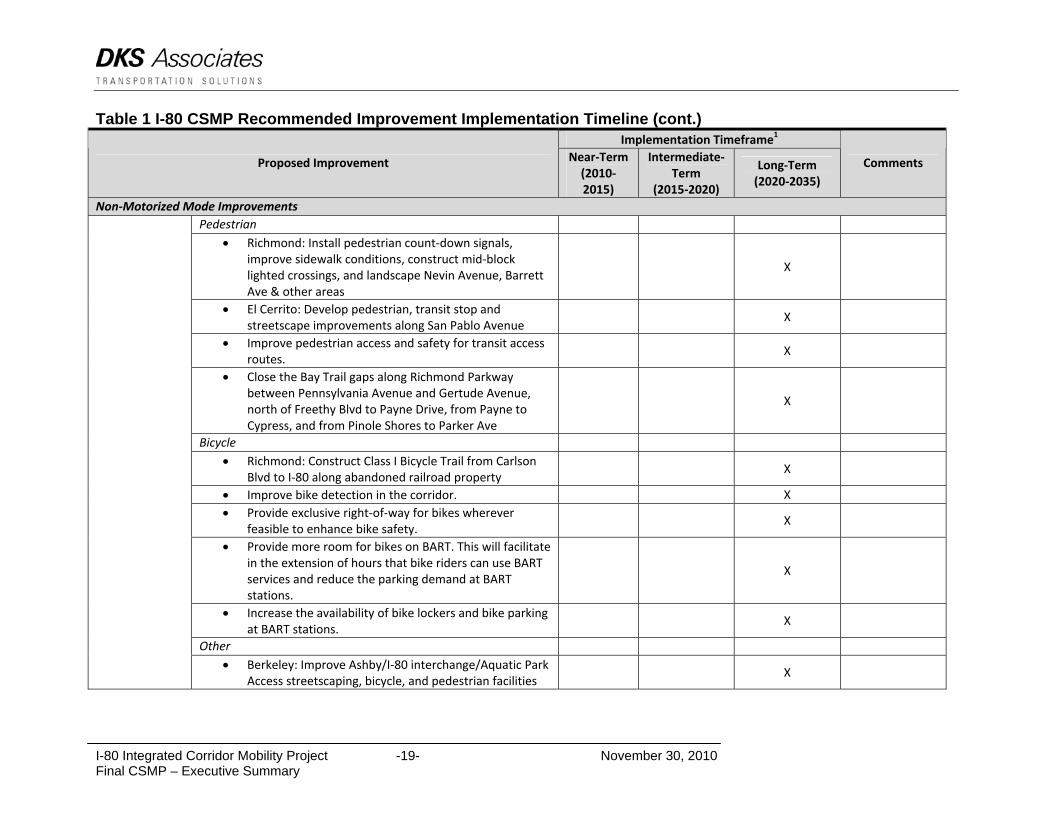
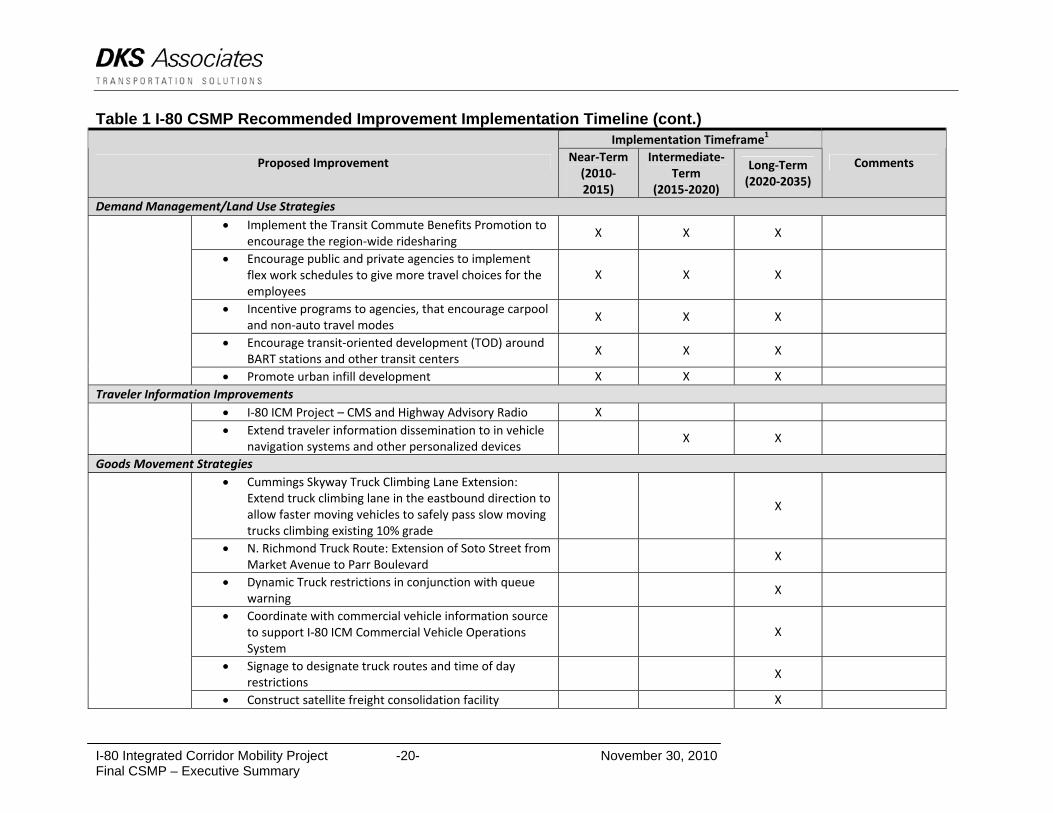
5. RECOMMENDATIONS The recommended near-, intermediate- and long-term improvements for the I-80 corridor are listed in Table 1. For the purposes of this CSMP, near-term is defined as 0 to 5 years (2010 to 2015), intermediate term is defined as 5 to 10 years (2015 to 2020), and long-term is defined as 10 to 25 years (2020 to 2035). However, it is important to recognize that the exact timing of any future improvement is dependent upon several factors including actual future conditons and funding levels. Many of the proposed improvements are concepts that have previously been proposed as part of other efforts. Others were defined based on an assessment of freeway, ramp
I-80 Integrated Corridor Mobility Project Final CSMP – Executive Summary
-8- November 30, 2010
and arterial bottlenecks observed in the 2015 Build – ICM simulation models. The recommended improvements for each timeframe are further discussed below.
Near Term Recommendations Projects and strategies recommended for implementation in the near-term include those that have secured funding, obtained environmental clearance, are under design, or do not require significant physical work or funding. Based on these criteria, the recommended near-term improvements include:
• Complete construction of the eastbound I-80 HOV lane from SR 4 to the Carquinez Bridge;
• Implement the I-80 ICM Project, including the system management and transit improvements.
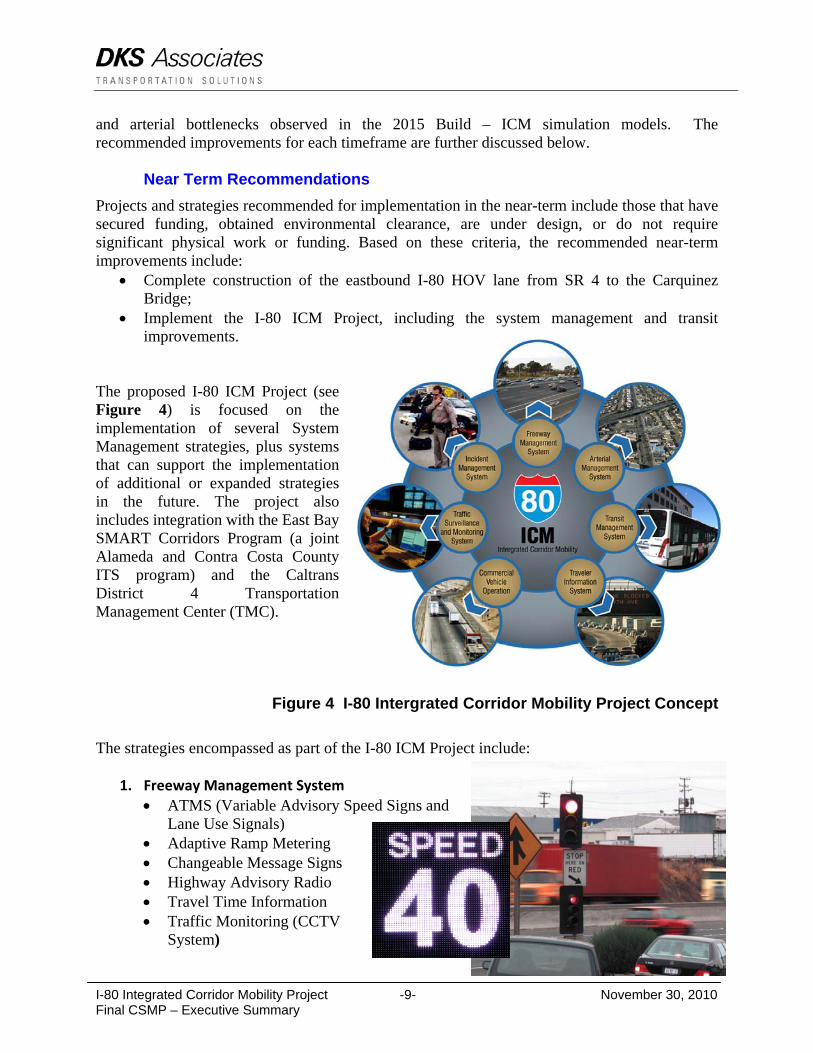
The proposed I-80 ICM Project (see Figure 4) is focused on the implementation of several System Management strategies, plus systems that can support the implementation of additional or expanded strategies in the future. The project also includes integration with the East Bay SMART Corridors Program (a joint Alameda and Contra Costa County ITS program) and the Caltrans District 4 Transportation Management Center (TMC).
Figure 4 I-80 Intergrated Corridor Mobility Project Concept
The strategies encompassed as part of the I-80 ICM Project include:
1. Freeway Management System • ATMS (Variable Advisory Speed Signs and
Lane Use Signals) • Adaptive Ramp Metering • Changeable Message Signs • Highway Advisory Radio • Travel Time Information • Traffic Monitoring (CCTV
System)
I-80 Integrated Corridor Mobility Project Final CSMP – Executive Summary
-9- November 30, 2010

2. Incident Management System
• Incident Response plan • Lane Management • End-of-the-queue warning • Vehicle detection system • Speed Harmonization (SH);
3. Arterial Management System • Traffic Signal Synchronizations • Traffic Signal Interconnect • Emergency Vehicle Preemption • Transit Signal Priority • Trailblazer Signs • Traffic Monitoring (CCTV System)
4. Transit Management System • Transit Signal Priority (TSP)
5. Traveler Information System • Changeable Message Signs • Highway Advisory Radio • Personalized 511 System • Comparative Travel Times • Parking Information System
6. Traffic Surveillance and Control System
• Traffic Detection • Traffic Monitoring
The analysis conducted as part of the I-80 ICM Project Traffic Operations Analysis Report focused on the three core freeway and incident management elements of the I-80 ICM project (adaptive Ramp Metering, VASS, and LUSs). That anlaysis indicated that the proposed combination of ICM strategies is projected to provide significant operational and safety benefits under both recurring and non-recurring conditions.
I-80 Integrated Corridor Mobility Project Final CSMP – Executive Summary
-10- November 30, 2010

I-80 Integrated Corridor Mobility Project Final CSMP – Executive Summary
-11- November 30, 2010
Under recurring conditions, the proposed I-80 ICM Project is projected to provide significant operational benefits to freeway operations, especially in the westbound direction, and an overall benefit to operations in the corridor. While the freeway benefits would be partially offset by increased delay at the on-ramps and the arterial approaches, the I-80 ICM Project is projected to still yield an overall reduction in network delay during both the AM and PM peak periods. The I-80 ICM Project is expected to have a generally minimal impact on trips originating within Contra Costa or Alameda Counties. A sampling of such trips indicates that in most cases ramp meter delay is offset by mainline speed improvement resulting in negligible change in overall travel time. Another important benefit of the I-80 ICM Project is the potential reduction in accident rates. In areas where metering has been implemented, accident rate reductions have been reported. The I-80 ICM Project can also produce greenhouse benefits in the form of reduced emissions and fuel consumption by improving freeway and network-wide performance. The 2015 AM and PM peak period system performance results are measured by vehicle hours of delay and average speeds. In the AM peak period, the recommended project produces a significant improvement to freeway operation under recurring condtions with 26% reduction in freeway delay and 7% increase in freeway average speed compared to the No Build alternative. Delay on the entire model network, including freeways, ramps and arterials, is projected to decrease 8%. During the PM peak, the I-80 ICM Project is expected to produce a 11% reduction in freeway delay and 7% increase in freeway average speed compared to the No Build alternative.Network delay is projected to decrease by 9%. Under non-recurring conditions, the proposed I-80 ICM Project is expected to provide significant network and freeway benefits. While the exact benefits of the proposed full Incident Management alternative (Ramp Metering + VASL + Lane Management) will vary depending upon the location, duration, and severity of the incident, the analysis of a sample accident during the AM peak period within the segment of westbound I-80 where Lane Management capabilities are proposed was found to yield a 12% reduction in westbound I-80 hours of delay reduced by 12%, including a 19% reduction within segment from Central to the 580/880 Split. For eastbound I-80, lane management capabilities are not included as part of the current I-80 ICM Project. However, a test analysis of an eastbound accident during the PM peak period showed that the combination of the three ICM strategies yields significant benefit in terms of reduced delay in the Central to SR 4 segment (-10%), total delay on eastbound I-80 (-5%). Furthermore, all of the proposed ICM strategies provide safety benefits. Depending on the extent and combination of strategies deployed, the potential safety benefits include not only a decrease in primary incidents of 3% to 30%, but also a decrease in secondary incidents of 40% to 50%1. In addition to the two projects identified above, it is recommended that the following activites be pursued in the near-term:
• establish an I-80 Corridor Management Committee, • conduct a before-and-after study of the I-80 ICM Project, • develop corridor wide land use policies, • conduct a Maze Study,
1 Freeway Management and Operations Handbook, FHWA, 2003 (revised 2006)
• conduct an I-580 Ramp Metering Study, • analyze effectiveness of the individual intermediate term projects identified in the CSMP,
and • analyze weekend conditions.
The objective of these last five activities is to further assess potential intermediate and long-term improvements and strategies for the corridor.
Intermediate Term Recommendations While the I-80 ICM Project and the currently planned extension of the eastbound HOV lane on I-80 are expected to provide significant operational and safety benefits on I-80 in the near-term (2015) timeframe, significant congestion affecting the freeway, ramps and arterials is projected to remain. A detailed review of the 2015 simulation models revealed several projected problem locations including several on- and off-ramps, interchanges, mainline merging and weaving areas, and arterials under 2015 demands. These findings, plus design considerations, were used to define a set of potential intermediate improvements defined as those that could be implemented in the next five to ten years.
The improvements recommended for intermediate term implementation are generally those which have support and require minor or moderate physical work or funding, but have not acquired funding and require environmental clearance or design. Proposed projects include expanded or enhanced deployment of ICM capabilities within the corridor, minor to moderate geometric improvements to both the freeway and arterial network, improved connectors between roadways, signalization of un-signalized interchange intersections, and an increase in public transit service.
A number of recommended intermediate term improvements were packaged into three scenarios for analysis. The first two scenarios involved singular, operational improvements intended to address mainline operations on I-80 ICM corridor, while the third included a package of freeway, ramp and arterial capital improvements. In each case, the scenarios build upon the I-80 ICM project improvements programmed for the corridor.
Under the first scenario, the metering of the I-580 Westbound connector to westbound I-80 was shown to yield a reduction in delays on I-80 westbound, local ramps and the arterials compared to the 2015 Build – ICM scenario, but these delay reductions were found to be offset by increased delay on the eastbound I-580 freeway segment. This leads to slight increase in network-wide vehicle hours of delay compared to the 2015 Build – ICM scenario. Furthermore, under the assumed design, forecasted AM peak period demands on this connector will exceed the maximum flow rate through the meter resulting in the cumulative build-up of queues.
The analysis also suggests that the re-striping of westbound I-80 approaching the split to I-580/I-880 (Scenario 2) will generate significant increases in network and freeway delay during both peak periods. Compared to the 2015 Build – ICM Project alternative. This increased delay is generally associated with the additional weaving required to access the lanes for eastbound I-580, especially for those coming on at the Powell on-ramp. This traffic would then have to get completely across four lanes of traffic rather than just three. This additional “turbulence” results in a worsening of conditions approaching the split.
I-80 Integrated Corridor Mobility Project Final CSMP – Executive Summary
-12- November 30, 2010
While this analysis suggests not going forward with this improvement, it is recommended that further study be conducted as part of a larger I-80/I-580/SR 24 Maze Area plan before a final decision is made. This may include examining other designs and the closure of the Powell on-ramp.
The package of capital improvements included in Scenario 3 provide for the greatest benefit in terms of network delay reduction. Compared to the No Build alternative, this scenario yields a reduction of approximately 1900 vehicles hours of delay (14%) during the AM peak period, and approximately 4200 hours (11%) during the PM peak period. This represents a reduction of 840 and 1060 hours of delay during the AM and PM peak periods, respectively, compared to the Build – ICM project alternative.
These benefits are achieved despite the fact that this package of improvements includes the re-striping of westbound I-80 approaching the split to I-580/I-880 that, as described above, appears to produce additional delay during both peak periods. From a network perspective, the disbenefit of the re-striping is offset by improved operations associated with the other proposed improvements. However, the re-striping still results in a negative impact to westbound I-80.
While the results indicate feasibility of the proposed intermediate term improvements, two further studies are recommended: (a) I-580E Corridor Metering Plan that not only further examines the possible metering of the I-580E connector to I-80W, but also metering all on-ramps on I-580 eastbound segment from Richmond Bridge to I-80/I-580 merge and (b) I-80/I-580/SR-24 Maze Area Design Plan that includes further examination of re-striping the I-580/I-880 split. These studies should expand the simulation corridor limit to cover a broader area to account for queues and congestion outside of the current corridor limit. Also, estimating cost in addition to benefit in monetary values would be very helpful to decision-makers to compare scenarios and prioritize capital investment.
Other efforts recommended for the intermediate term include improving the reliability of automatic data collection systems, and undertaking studies needed to facilitate the implementation of long-term improvements and strategies. Specific studies include those related to BART extensions and multimodal access improvements, analysis of Commercial Vehicle policies to reduce peak hour traffic, and an assessment of the benefits of converting the HOV Lanes to Express Lanes.
Long Term Recommendations By 2035, demands on some segments of I-80 in the study corridor are forecasted by up to 60%. With this level of growth, conditions along I-80 are expected to worsen considerably. This will result in not only the increased severity of congestion associated with existing bottlenecks, but also congestion occurring in more areas and in the off-peak direction. Conditions on the arterials in the corridor are also expected to worsen.
As noted previously, major capacity expansion along I-80 is unlikely due to physical and institutional constraints. Given this limitation, and the magnitude of projected growth, plans for the corridor must include an combination of more localized improvements plus strategies that further maximize the efficiency of the existing roadway system, reduce the occurrence and
I-80 Integrated Corridor Mobility Project Final CSMP – Executive Summary
-13- November 30, 2010
I-80 Integrated Corridor Mobility Project Final CSMP – Executive Summary
-14- November 30, 2010
impact of incidents, encourage increased use of other modes, and reduce or manage peak period vehicle travel demand.
A set of long term improvements was derived from existing planning and programming documents, plus the results from the 2015 traffic analysis simulation results and 2035 travel demand forecasts. In general, these longer-term improvements include those requiring more significant physical work and thus funding, and those that require considerable consensus-building and may face more significant institutional issues. Key projects include major public transportation expansion, additional roadway capacity, revised goods movement strategies, and large-scale ITS improvements. The latter may include the implementation of full ATM strategies within the corridor including new technologies such as Intellidrive. The recommended long term improvements also include numerous local roadway, pedestrian and bicycle improvements. The long term improvements presented in Table 1 represent a financially unconstrained listing of potential improvements. An analysis of these individual improvements was not conducted as part of this CSMP. Thus, further study of these improvements, individually or as packages, is required.
While these improvements are identified as being long term, it is important to recognize that the exact timing of any future improvement is dependent upon several factors including actual future conditons and funding levels.
I-80 Integrated Corridor Mobility Project Final CSMP – Executive Summary
-15- November 30, 2010
Table 1 I-80 CSMP Recommended Improvement Implementation Timeline Implementation Timeframe1
Proposed Improvement Near‐Term (2010‐2015)
Intermediate‐Term
(2015‐2020)
Long‐Term (2020‐2035)
Comments
Roadway Geometric Improvements Ramp Modifications:
• WB SR4: reconstruct bridge to allow for 3rd GP lane and moving meter limit line downstream
X
• WB Buchanan Street: widen to add 2nd GP lane X • WB Richmond off‐ramp: add 2nd thru lane X • WB Central off‐ramp: add 3rd lane X • WB Gilman off‐ramp: add 3rd lane X • EB San Pablo Dam Road off‐ramp: add 4th lane X • Powell Street: Widen eastbound off‐ramp X
Interchange Improvements: • Powell Street: Allow westbound left turn and
southbound through for the westbound off‐ramp X Further study of WB
left turn required • Gilman Street: Convert interchange to roundabout X PSR underway • Central Avenue: a) redirect I‐80 WB on‐ramp traffic to I‐
580 during weekend peaks, and b) Improve signalized intersection spacing by connecting Pierce St to San Mateo St, and relocating the traffic signal at Pierce to San Mateo intersection
X X Planned project – being studied by
CCTA
• Pinole Valley Road: Provide WB right turn lane and EB left‐turn lane to eastbound on‐ramp; add bus turnout/shelter on westbound ramp
X
• San Pablo Dam Road Interchange: Upgrade and improve; includes modifications at El Portal and McBride
X Planned project – Environmental
document approved • Cutting Boulevard: Construct new connector ramps to
the Del Norte BART station X
Freeway Geometric Improvements
• SR 4: Construct direct connectors between westbound I‐80 and eastbound SR 4
X
I-80 Integrated Corridor Mobility Project Final CSMP – Executive Summary
-16- November 30, 2010
Table 1 I-80 CSMP Recommended Improvement Implementation Timeline (cont.) Implementation Timeframe1
Proposed Improvement Near‐Term (2010‐2015)
Intermediate‐Term
(2015‐2020)
Long‐Term (2020‐2035)
Comments
Roadway Geometric Improvements (cont.) Mainline auxiliary lanes:
• WB San Pablo Dam Road on‐ramp to San Pablo Avenue off‐ramp – extend current aux lane between San Pablo Dam Road and Edwards/McBryde Av
X Coordinate with
SPDR I/C improvements
• WB Potrero on‐ramp to Carlson off‐ramp X • EB Ashby on‐ramp to University off‐ramp X • EB San Pablo Ave on‐ramp to San Pablo Dam Road off‐
ramp – extend current aux lane X
• EB San Pablo Dam Road on‐ramp to El Portal off‐ramp X • EB Hilltop off‐ramp to Richmond Parkway on‐ramp X
Other: • Westbound 80: Re‐stripe SB 80 to 880 connector to 4
lanes (currently three) X Further study
recommended
• Corridor‐wide: Convert HOV lanes to Express lanes X• SB San Pablo Avenue at Richmond Parkway – widen to
provide 2nd LT bay x
• SB San Pablo Avenue at San Pablo Dam Road – extend LT bay
X
• Carlson Boulevard: Reconstruction and restriping to add a 6’ median from Tehama Avenue to San Jose Avenue
X Underway
• Central Hercules: Improve and expand arterials for express bus and rail transit facilities to support transit‐oriented development
X
Arterial Geometric Improvements
• San Pablo Avenue at University Avenue, Cutting Boulevard, Richmond Parkway, and Roosevelt Avenue: Arterial widening where are necessary
X
I-80 Integrated Corridor Mobility Project Final CSMP – Executive Summary
-17- November 30, 2010
Table 1 I-80 CSMP Recommended Improvement Implementation Timeline (cont.) Implementation Timeframe1
Proposed Improvement Near‐Term (2010‐2015)
Intermediate‐Term
(2015‐2020)
Long‐Term (2020‐2035)
Comments
System Management and Operational Improvements • Corridor‐wide: I‐80 ICM Project‐Freeway Elements
(adaptive ramp metering, VASS, LUS) X
• Corridor‐wide: connector metering at I‐580 eastbound interchange
X Further study recommended
• Corridor‐wide: Implement lane management in eastbound direction for non‐recurring conditions
X
• Cummings Skyway to Cutting Boulevard: Shoulder utilization in the westbound direction for incident management and transit vehicles
X
• I‐80 Corridor‐wide: Allow shoulder use to add capacity during periods of congestion and/or an incident
X
Freeway Management
• Corridor‐wide: Implement Congestion Pricing X• I‐80 ICM Project‐Arterial Elements X • Carlson Boulevard: Signalize I‐80 ramp intersections X • Gilman Street: Signalize I‐80 ramp intersections X • San Pablo Avenue: Extend SMART Corridor throughout
entire study area X
• Corridor‐wide: enhance/implement freeway/ramp meter/surface street signal coordination
X X
Arterial Management
• Update signal timing plans X X Perform on regular basis
Transit Improvements Ferry:
• Provide service between Berkeley/Albany and San Francisco
X X
• Provide service between Richmond and San Francisco X• Provide service between Hercules and San Francisco X X
Rail:
• Hercules: Construct Capitol Corridor train station X

I-80 Integrated Corridor Mobility Project Final CSMP – Executive Summary
-18- November 30, 2010
Table 1 I-80 CSMP Recommended Improvement Implementation Timeline (cont.) Implementation Timeframe1
Proposed Improvement Near‐Term (2010‐2015)
Intermediate‐Term
(2015‐2020)
Long‐Term (2020‐2035)
Comments
Transit Improvements (cont.) BART:
• Berkeley: Improve Ashby Station to support Ed Roberts Campus and future TOD
X
• Richmond: Provide transportation improvements on the east side of the Richmond Station to accommodate TOD
X
• El Cerrito: Provide real‐time transit information displays X• System‐wide: Provide additional or new parking
capacity X
• Extend to Richmond Hilltop and Hercules X• Additional infill stations to fill in gaps between the
existing stations X
Bus • Northern Alameda County: Improve AC transit facilities
including new operating system X
• Expand WestCAT service including purchase of vehicles X• Install WestCAT‐furnished real‐time transit information
displays X
• Purchase new express buses for I‐80 express service to be provided by AC transit, Vallejo Transit, and WestCAT
X
• Expand Bus Rapid Transit from Richmond Parkway Transit Center to Hercules
X
• Bus Transit connections between new ferry terminals XTransit Centers
• Relocate and expand Hercules Transit Center, including relocation of park and ride facility and construction of express bus facilities
X
• Construct Phase 2 of Hercules Inter‐modal Station XOther Measures
• I‐80 ICM Project‐Transit elements X
I-80 Integrated Corridor Mobility Project Final CSMP – Executive Summary
-19- November 30, 2010
Table 1 I-80 CSMP Recommended Improvement Implementation Timeline (cont.) Implementation Timeframe1
Proposed Improvement Near‐Term (2010‐2015)
Intermediate‐Term
(2015‐2020)
Long‐Term (2020‐2035)
Comments
Non‐Motorized Mode Improvements Pedestrian
• Richmond: Install pedestrian count‐down signals, improve sidewalk conditions, construct mid‐block lighted crossings, and landscape Nevin Avenue, Barrett Ave & other areas
X
• El Cerrito: Develop pedestrian, transit stop and streetscape improvements along San Pablo Avenue
X
• Improve pedestrian access and safety for transit access routes.
X
• Close the Bay Trail gaps along Richmond Parkway between Pennsylvania Avenue and Gertude Avenue, north of Freethy Blvd to Payne Drive, from Payne to Cypress, and from Pinole Shores to Parker Ave
X
Bicycle • Richmond: Construct Class I Bicycle Trail from Carlson
Blvd to I‐80 along abandoned railroad property X
• Improve bike detection in the corridor. X• Provide exclusive right‐of‐way for bikes wherever
feasible to enhance bike safety. X
• Provide more room for bikes on BART. This will facilitate in the extension of hours that bike riders can use BART services and reduce the parking demand at BART stations.
X
• Increase the availability of bike lockers and bike parking at BART stations.
X
Other
• Berkeley: Improve Ashby/I‐80 interchange/Aquatic Park Access streetscaping, bicycle, and pedestrian facilities
X
I-80 Integrated Corridor Mobility Project Final CSMP – Executive Summary
-20- November 30, 2010
Table 1 I-80 CSMP Recommended Improvement Implementation Timeline (cont.) Implementation Timeframe1
Proposed Improvement Near‐Term (2010‐2015)
Intermediate‐Term
(2015‐2020)
Long‐Term (2020‐2035)
Comments
Demand Management/Land Use Strategies • Implement the Transit Commute Benefits Promotion to
encourage the region‐wide ridesharing X X X
• Encourage public and private agencies to implement flex work schedules to give more travel choices for the employees
X X X
• Incentive programs to agencies, that encourage carpool and non‐auto travel modes
X X X
• Encourage transit‐oriented development (TOD) around BART stations and other transit centers
X X X
• Promote urban infill development X X X Traveler Information Improvements
• I‐80 ICM Project – CMS and Highway Advisory Radio X • Extend traveler information dissemination to in vehicle
navigation systems and other personalized devices X X
Goods Movement Strategies • Cummings Skyway Truck Climbing Lane Extension:
Extend truck climbing lane in the eastbound direction to allow faster moving vehicles to safely pass slow moving trucks climbing existing 10% grade
X
• N. Richmond Truck Route: Extension of Soto Street from Market Avenue to Parr Boulevard
X
• Dynamic Truck restrictions in conjunction with queue warning
X
• Coordinate with commercial vehicle information source to support I‐80 ICM Commercial Vehicle Operations System
X
• Signage to designate truck routes and time of day restrictions
X
• Construct satellite freight consolidation facility X
I-80 Integrated Corridor Mobility Project Final CSMP – Executive Summary
-21- November 30, 2010
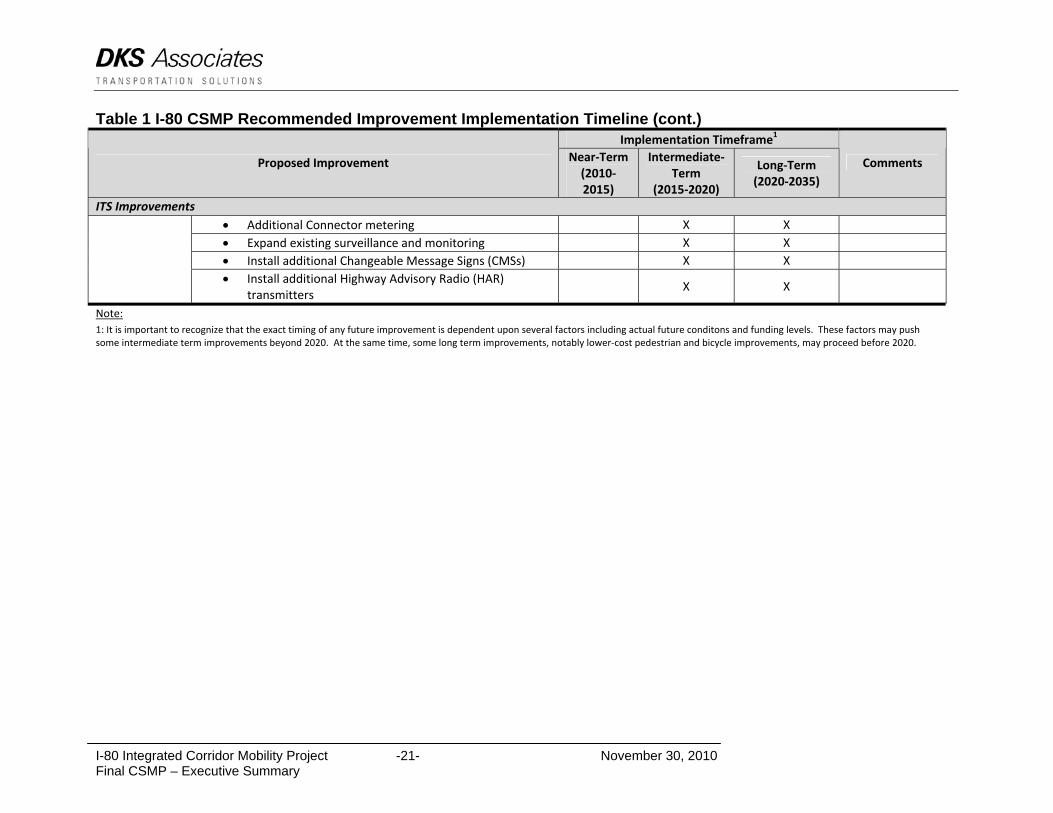
Table 1 I-80 CSMP Recommended Improvement Implementation Timeline (cont.) Implementation Timeframe1
Proposed Improvement Near‐Term (2010‐2015)
Intermediate‐Term
(2015‐2020)
Long‐Term (2020‐2035)
Comments
ITS Improvements • Additional Connector metering X X • Expand existing surveillance and monitoring X X • Install additional Changeable Message Signs (CMSs) X X
• Install additional Highway Advisory Radio (HAR) transmitters
X X
Note: 1: It is important to recognize that the exact timing of any future improvement is dependent upon several factors including actual future conditons and funding levels. These factors may push some intermediate term improvements beyond 2020. At the same time, some long term improvements, notably lower‐cost pedestrian and bicycle improvements, may proceed before 2020.

6. LIMITATIONS OF THE I-80 CSMP STUDY The I-80 ICM corridor is a very long, congested, and high incident corridor passing through Alameda and Contra Costa Counties. As a result of the highly saturated conditons and frequent occurrence of incidents, conditions within the corridor can vary significantly day-to-day and even within a single peak period making it very difficult to define a “typical day” for modeling. The best available data and modeling tools were used in the I-80 ICM CSMP study. It should be recognized that to overcome the reliability of available data, a variety of data sources were used. This, however, introduced issues regarding consistency between these sources and the days or periods when the different data was collected. While significant effort was taken to overcome these data reliability and consistency issues, it is important to recognize the variability of conditions that exists in this corridor. The analysis conducted for the I-80 CSMP involved a combination of applying travel demand models and micro-simulation models. Travel demand models were used to generate projections of base and future demands and assess long-term strategies. Micro-simulation models were used to conduct detailed operational analysis for various alternatives under 2015 demand conditions. In the case of the micro-simulation model, the testing of the various I-80 ICM system management elements (adaptive ramp metering, VASL, and incident lane management) pushed the limits of the software and required the development of new software modules. While both tools were invaluable to the conduct of this effort, it is important to recognize the limitations of these tools and the need to exercise professional judgment when interpreting the results and making recommendations or decisions based on the model outputs.
I-80 Integrated Corridor Mobility Project Final CSMP – Executive Summary
-22- November 30, 2010