
Failure in Structural Steels and Overview of I 35W Bridge Collapse

Preliminary Design Report
I-494/I-35W Interchange Preliminary Design Project
Bloomington, MN
S.P. No. 2785-350 SEH No. MNTCO 107371
March 30, 2010

I-494/I-35W Interchange Preliminary Design Project Preliminary Design Report
Bloomington, MN
S.P. NO. 2785-350 SEH No. MNTCO 107371
March 30, 2010
I hereby certify that this report was prepared by me or under my direct supervision, and that I am a duly Licensed Professional Engineer under the laws of the State of Minnesota.
Jeff Rhoda, PE
Date: Lic. No.: 26377
Reviewed by: Date
Short Elliott Hendrickson Inc. 10901 Red Circle Drive, Suite 300 Minnetonka, MN 55343-9302 952.912.2600

I-494/I-35W Interchange Preliminary Design Project MNTCO 107371 Minnesota Department of Transportation ES-1
Executive Summary
Background Information The I-494 and I-35W corridors are major transportation corridors in the Twin Cities metropolitan area. The ability to effectively move the users of these transportation corridors to their destinations with reduced congestion and improved safety continues to be a challenge today and in the foreseeable future. The I-494 and I-35W interchange area consistently remains as one of the higher ranked locations for congestion and safety deficiencies in the metro area and the country; a 2010 study, based on Travel Time Index (TTI), ranked I-494 17th worst commute in the nation. This condition will continue to erode without the implementation of improvements in the corridor and at the interchange. Through the completion of the 2001 Final Environmental Impact Statement (FEIS) for the I-494 Reconstruction: I-394 to the Minnesota River, major improvement strategies for the I-494 corridor were identified. Recent improvements from that study, such as the Penn Avenue and Lyndale Avenue interchanges on I-494, reconstruction of the 76th Street bridge, construction of the Lyle Berg Bridge (American Boulevard), plus the 2009 Urban Partnership Agreement (UPA) improvements to I-35W and the on-going work at the I-35W and TH 62/ Crosstown Interchange will help to ease congestion and improve safety through these corridors. Major interchange improvements were identified in the 2001 FEIS; including the reconstruction of the system-to-system interchange of I-494 and I-35W, the Portland Avenue interchange, which includes closure of the Nicollet Avenue and 12th Avenue interchanges along I-494, and ramp improvements to the Cedar Avenue (TH 77) and 34th Street interchanges. The current state of the economy in Minnesota and the nation has hampered the resources of the funding programs at both the federal and state levels to support future major interstate improvement projects. The Minnesota Department of Transportation (Mn/DOT) faces significant challenges for implementing the remaining improvements. Recognizing these limitations Mn/DOT has embarked on a new philosophy towards addressing the deficiencies throughout the metro interstate system. This new philosophy seeks to target funding toward prioritized deficiencies, through reduced project scope or phased implementation of key project elements to provide the highest return on investment for the available funding resources. In addition to the efforts in reducing project scopes and costs for the existing infrastructure, Bus Rapid Transit (BRT) has become a significant component of transportation system solutions for addressing congestion in major corridors on the interstate and state highways throughout the metro area. The I-35W corridor was enhanced with HOV/HOT lanes from Lakeville to downtown Minneapolis through the 2009 UPA. Construction is underway for a new in-line BRT station at the 46th Street overpass on I-35W in Minneapolis, with another station planned to be located just south of the I-494/I-35W interchange, near the American Boulevard overpass. Study Purpose and Need The I-494/I-35W Interchange Preliminary Design Project stemmed from the recognition that the remaining improvements identified in the 2001 FEIS were surpassing $400 million in overall project costs. Without reconsideration of the scope of these projects, there exists a risk that no major improvements can be made in the next 20 years or beyond. The I-494/I-35W interchange, as a system-to-system interchange, was targeted for review due to its significance to the southern ring of the interstate system in the metro area. Current congested traffic operations and safety issues at this interchange will continue to create significant delays during peak periods and trigger crash incidents throughout the immediate I-494 corridor. The main objectives of the I-494/I-35W Interchange Preliminary Design Project include:
• Develop an interchange alternative that reduces the overall scope of the project or provides the most flexibility for staged implementation.
• Develop an alternative that incorporates the provisions of an In-Line BRT station located at or between American Boulevard and 82nd Street.
The interchange alternative developed from the project would be considered for further evaluation leading into the development of a Level 1 Layout Approval by Mn/DOT and possible reevaluation of the 2001 FEIS. Existing Conditions and Prioritized Deficiencies Traffic congestion through the I-494 and I-35W corridors of the study area have been in existence and a major hindrance to efficient and safe traffic operations for many years. Field observations indicated significant congestion conditions for westbound I-494 in the AM and PM peak periods encompassing sections from 24th Street on the east limits of the study west to TH 100. I-35W experiences a directional split in volumes between the AM and PM peak periods and therefore congestion impacts are evident in the AM peak for northbound, and in the PM peak for southbound traffic. Indicators affecting the congested conditions on I-494 include the existing volumes that are over the basic capacity of the current three lanes for the majority of the eastbound traffic and west of I-35W for the westbound traffic. Heavy entering and exiting volumes at certain interchanges, and inadequate interchange and ramp spacing lead to significant weaving problems. CORSIM traffic modeling was conducted to develop baseline models for AM and PM peak periods of the project study limits utilizing volume data from 2007. The models were calibrated based on the field observations and analysis conducted to identify the key points of congestion. The modeling results were able to replicate the field observations and were utilized for development of forecast models for the years 2020 and 2040 based on regional model information. The 2020 forecast model was also utilized to identify the operational deficiencies that will lead to added congested conditions in the future. A system plan review of the major design features in the I-494 and I-35W corridors indicate a key inconsistency with the American Association of State Highway and Transportation Officials (AASTHO) criteria for interstate facilities in the area of interchange spacing. The desirable interchange spacing within urban areas is one mile. Between the Penn Avenue and TH 77 interchanges along the I-494 corridor, five interchanges exist with an approximate spacing between each of ½ mile. Along I-35W, three interchanges are positioned with a spacing of ½ mile or less, from the 76th Street interchange to the 82nd Street interchange. The corresponding impacts of the closely spaced interchanges are reflected in the substandard ramp spacing and weaving distances. Due to the closely spaced interchanges described above, deficiencies exist within the I-494 and I-35W corridors where traffic operations and safety are compromised due to the short weave sections. Even with full auxiliary lanes developed between many of the closely spaced ramps, the negative impacts of the weave movements on the mainline traffic are very apparent in the observed congested conditions and crash history. Crash data over a three year period (2006-2008) for the I-494/I-35W interchange indicates a total of 308 crashes were experienced. The corresponding crash and severity rates are 1.1 and 1.5 crashes per million vehicle miles (MVM) respectively. Mn/DOT Metro District average crash and severity rates for cloverleaf interchanges are 0.9 and 1.2. The I-494/I-35W interchange ranked as the 7th worst cloverleaf out of the 26 metro interchanges for crash incidents. Through the consideration of the existing field conditions, modeling results, and crash history data a list of priorities were developed to address the main deficiencies in the corridor and specifically at the I-494/I-35W interchange. The main two prioritized deficiencies that are recommended for improvements to the interchange include:
1. Northbound I-35W loop ramp to westbound I-494. High volumes and substandard weaving distances – involves three weaving operations. 50% of crash incidents at the interchange are related to this deficiency.

I-494/I-35W Interchange Preliminary Design Project MNTCO 107371 Minnesota Department of Transportation ES-2
2. Eastbound I-494 weave segment between the Penn Ave. entrance ramp and southbound I-35W exit ramp. High volumes and substandard weaving distance.
Concept Development The development of alternative concepts for the I-494/I-35W interchange first involved the creation of a set of guiding principles, through stakeholder input, to establish the framework for these concepts. The goal of the alternative concept development effort was to create concepts for cost-effective capacity and safety improvements based on prioritized operational deficiencies. The process involved the review of the existing 2001 FEIS interchange layout for opportunities to stage the project components and to develop an alternative concept that was scaled-back in overall scope. Included in the development of these concepts was the provision for the following Design Elements:
• BRT station at American Boulevard • Managed HOV/HOT Lanes on I-35W • Basic Number of Lanes: Four on I-494 and three on I-35W (includes managed lanes) • FEIS Access: Maintain 2001 FEIS layout access provisions • Existing Infrastructure: Preserve recent infrastructure investments in the corridor
Alternatives concepts developed with the Guiding Principles and the Design Elements created three main concepts. All three concepts sought to scale back the overall scope of the interchange to reduce costs and to provide added flexibility for staging. The concepts would tie in to the Penn Avenue, Lyndale Avenue, 76th Street, and 82nd Street interchanges in the same manner as the 2001 FEIS layout, preserving the recently constructed infrastructure. The concepts will also preserve the 26 feet “Future Transportation Use” median area along I-494. The concept figures do not accurately reflect the I-494 median, but it is correctly incorporated into the more detailed layouts. In addition, the local street “box” network was maintained in the alternative concepts. Each concept would also provide space in the I-35W median near American Boulevard for a potential in-line BRT station. The BRT station at American Boulevard, one of three BRT concepts developed, had the most impact for the geometrics of the interchange layout and was therefore used to represent the worst-case scenario. The concepts developed sought to meet the objective for the scaled-back layout by reducing the number /size of, or by eliminating, flyovers in the interchange layout. The alternative concepts developed were as follows:
• Alternative 1 – 2001 FEIS Preferred Alternative (comparison layout) • Alternative 2 – Three-Quad Cloverleaf Interchange • Alternative 3 – Turbine Interchange
Each alternative concept developed followed the Guiding Principles and the objections of the Design Elements. Advantages and Disadvantages were developed for each concept. Recognizing the main element from the 2001 FEIS layout that impacted the cost were the flyover structures, the three alternatives were reviewed based on a comparative summary of the overall square feet of bridge deck in each layout. The findings of this basic screening indicated Alternative 3 - Turbine Interchange had the lowest amount of bridge deck square footage. In addition, the Turbine layout provided the most flexibility for staging, indicating a lower amount of work required to implement priority deficiency number 1. Northbound I-35W loop ramp to westbound I-494. Based on these findings, Alternative 3 – Turbine Interchange was selected as the concept to be considered for further evaluation. A more detailed geometric layout was developed, including a BRT station at American Boulevard, to be utilized in the impact analysis compared to the original 2001 FEIS Preferred Alternative.
Figure 1 – Turbine Interchange Concept Layout
Modeling of the Turbine Interchange alternative concept for traffic operations was conducted for the 2020 and 2040 forecast conditions. In the 2040 model, due to the high volumes projected, certain bottlenecks on the outer limits of the models were mitigated to allow the traffic to reach the interchange unimpeded for this analysis. The 2040 forecast model indicates the Turbine concept would provide very similar operations in comparison to the 2001 FEIS. The AM peak hour shows acceptable operations for both eastbound and westbound traffic. The PM peak hour indicates congestion points exist in the models for both layouts at the France Avenue exit for eastbound I-494 resulting from the weaving movements between France Avenue and Penn Avenue ramps. The PM peak westbound traffic on I-494 experiences major congestion delays near the Portland Avenue interchange resulting from the high volumes and heavy weaving movements between Penn Avenue and Lyndale Avenue. The entrance ramp on I-494 from the northbound I-35W collector-distributor road also experiences some congestion as high entering volumes for this ramp and the Penn Avenue entrance ramp merge onto I-494. Modeling results for the I-35W corridor again indicate very similar operations between the two concepts and provide acceptable operations for both northbound and southbound traffic in the AM and PM peak periods. The 2020 forecast modeling looked at various options to the phased layout of the Turbine Interchange concept that included the prioritized deficiencies of the northbound I-35W to westbound I-494 movement and the eastbound I-494 to southbound I-35W movement. These options also were evaluated with and without the BRT station at American Boulevard. The results for these phasing options indicate the Turbine Interchange movement for the northbound I-35W to westbound I-494 provides a dramatic improvement for northbound and westbound traffic operations in both the AM and PM peak periods at the interchange. The removal of the two weaving operations on westbound I-494 provides critical improvements in both traffic operations and safety conditions. The evaluation of the eastbound I-494 to southbound I-35W movement indicates that there is a slight improvement for traffic operations specific to the I-35W exit ramp. However, traffic operations upstream of the I-35 interchange area are actually worse. This can be attributed to the effect of the exit ramp locations to Penn Avenue and I-35W in both the

I-494/I-35W Interchange Preliminary Design Project MNTCO 107371 Minnesota Department of Transportation ES-3
2001 FEIS and the Turbine Interchange layouts. The weave distance between the France Avenue entrance ramp and the Penn Avenue exit ramp is shortened from an existing 3,250 ft. to 2,600 ft. in the new layouts. This reduction in weaving distance is enough to trigger worsened congestion impacts back to the TH 100 interchange. Impact Analysis The focus of the Impact Analysis centered on the differences between the 2001 FEIS Preferred Alternative layout and the Turbine Interchange layout. Those differences were assessed to determine impacts that would be greater than the 2001 FEIS layout and that could trigger additional evaluation of environmental impacts. The refinement of the full layout for the Turbine Interchange concept involved the transfer of the conceptual layout developed on aerial photography into a Preliminary Geometric Layout. The horizontal and vertical design was completed based on a 40 mph design speed for the loop ramps. The proposed in-line BRT station located at American Boulevard was also incorporated with the interchange layout. Ramp connections were made to the Penn Avenue, Lyndale Avenue, 76th Street, and 82nd Street interchanges in the same manner as the 2001 FEIS. Infrastructure Footprint
The results of the Turbine Interchange layout in comparison to the 2001 FEIS Preferred Alternative, both with the in-line BRT included, indicate a wider infrastructure footprint in three of the I-494/I-35W interchange quadrants; with the southeast quadrant having a reduced impact. The image below illustrates the areas where the comparison identifies either increased or decreased footprint impact. The red indicates areas of increased footprint limits beyond the 2001 FEIS Preferred Alternative (with BRT included). The blue shading indicates areas of decreased footprint limits from the 2001 FEIS Preferred Alternative (with BRT included). The two western quadrants have impacts to private properties, which are mainly associated with losses in parking spaces to commercial businesses.
Figure 2 – Comparison of Footprint Impacts (See Figure D13B in Appendix D)
Options for reducing the impacts identified from the Turbine Interchange layout were evaluated, and potential options are available for consideration in the next level of design detail for the interchange. Loop ramp design speeds less that 40 mph, with a minimum of 35 mph, may be allowable in certain locations to tighten the geometry and reduce the pavement and retaining wall impacts in the two western quadrants. The I-494/I-35W interchange movements with the lower ramp volumes were modified to 35 mph design speeds. The corresponding adjustments to the overall layout are able to provide reduced impacts in the two western quadrants of the interchange. In addition, an optional layout for the braid layout of the Lyndale Avenue westbound entrance ramp and I-35W ramps on I-494 was investigated. Further review of this option would be necessary to confirm the feasibility of the concept. See Section 6.4 for additional details of the Infrastructure Footprint analysis. Impacts to private property resulting from the in-line BRT station to the infrastructure footprint are focused in the I-35W corridor. Frontage roads and parking lot areas on both sides of I-35W are impacted, with the east side having slightly increased impacts over the original 2001 FEIS layout. The Turbine Interchange layout (purple) actually provides a slightly reduced impact in comparison to the 2001 FEIS layout (green), when the BRT station is included. Utility Impacts
Utility impacts as a result of the Turbine Interchange, above that of which the 2001 FEIS Preferred Alternative would have impacted, are limited. Associated relocations or adjustments for sanitary sewers, watermain, fire hydrants, and other private utilities will be required throughout the project corridor. No major impacts that would significantly drive project costs were identified. Water Resources Management
The evaluation of the impacts to the water resources management plan for the project corridor and interchange indicate, through the heightened regulatory requirements for stormwater treatment, the addition of strategically placed stormwater ponds and infiltration basins will assist in attempting to meet current regulations. Only four of the eight drainage areas within the project corridors are able to meet these regulations. Additional right-of-way may be required to provide space for additional ponds and infiltration basins for these areas.
Figure 3 – Comparison of Footprint Impacts with BRT (See Figure D13B in Appendix D)
I-494/I-35W Interchange Preliminary Design Project MNTCO 107371 Minnesota Department of Transportation ES-4
Local Street Network Impacts
The 2001 FEIS Preferred Alternative developed corridor improvements for interchange spacing that resulted in access limitations to I-494 and I-35W from the Penn Avenue, Lyndale Avenue, 76th Street, and 82nd Street interchanges. The access limitations created the “Box” circulation network for the immediate local arterial street system. The Turbine Interchange layout matches the 2001 FEIS layout with regards to the connections to these adjacent interchanges and therefore the function of the local arterial street system (Box) will be the same. An analysis done previously for the 2008 Lyndale Avenue Interstate Access Report (IAR) indicated acceptable operations through the local arterial street network “box” for the 2037 forecast year PM Peak, based on proposed street lane configurations. An additional analysis was completed for the forecast volumes provided by Mn/DOT and results indicated a slight increase in delay values for the Penn Avenue and Lyndale Avenue corridors. See Section 6.5 for additional details of this evaluation.
The impact of the proposed BRT station, and a potential park-and-ride facility, on the local arterial street network was also evaluated. Two options were evaluated for the location of a park-and-ride facility that would support the BRT station. These locations were adjacent to American Boulevard on the east and west side of I-35W. The evaluation of the traffic impacts to the local arterial street network indicated that the immediate intersections that provide access to each park-and-ride, Dupont Avenue/American Boulevard on the east and Knox Avenue/81st Street on the west, would require improvements to accommodate the new turning movements. The installation of a new traffic signal would be required at the Dupont Avenue/American Boulevard intersection and median closure and left turn-lane extension would be needed at Knox Avenue for westbound American Boulevard traffic.
Construction Phasing
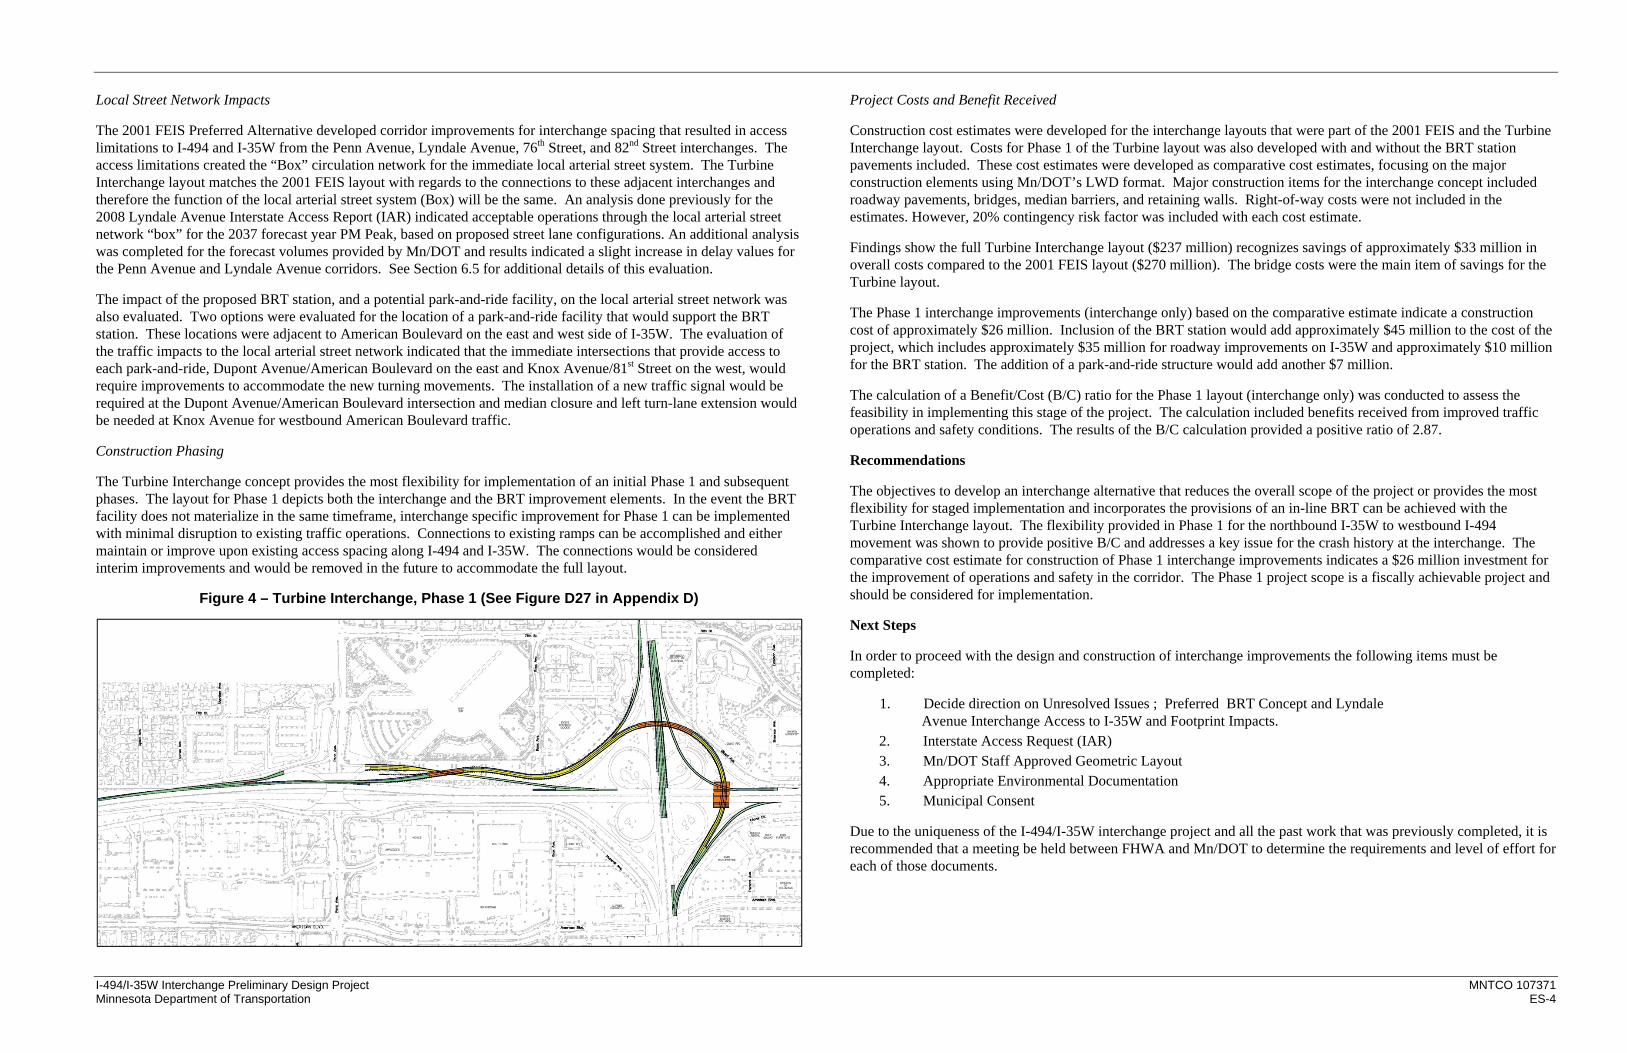
The Turbine Interchange concept provides the most flexibility for implementation of an initial Phase 1 and subsequent phases. The layout for Phase 1 depicts both the interchange and the BRT improvement elements. In the event the BRT facility does not materialize in the same timeframe, interchange specific improvement for Phase 1 can be implemented with minimal disruption to existing traffic operations. Connections to existing ramps can be accomplished and either maintain or improve upon existing access spacing along I-494 and I-35W. The connections would be considered interim improvements and would be removed in the future to accommodate the full layout.
Figure 4 – Turbine Interchange, Phase 1 (See Figure D27 in Appendix D)
Project Costs and Benefit Received
Construction cost estimates were developed for the interchange layouts that were part of the 2001 FEIS and the Turbine Interchange layout. Costs for Phase 1 of the Turbine layout was also developed with and without the BRT station pavements included. These cost estimates were developed as comparative cost estimates, focusing on the major construction elements using Mn/DOT’s LWD format. Major construction items for the interchange concept included roadway pavements, bridges, median barriers, and retaining walls. Right-of-way costs were not included in the estimates. However, 20% contingency risk factor was included with each cost estimate.
Findings show the full Turbine Interchange layout ($237 million) recognizes savings of approximately $33 million in overall costs compared to the 2001 FEIS layout ($270 million). The bridge costs were the main item of savings for the Turbine layout.
The Phase 1 interchange improvements (interchange only) based on the comparative estimate indicate a construction cost of approximately $26 million. Inclusion of the BRT station would add approximately $45 million to the cost of the project, which includes approximately $35 million for roadway improvements on I-35W and approximately $10 million for the BRT station. The addition of a park-and-ride structure would add another $7 million.
The calculation of a Benefit/Cost (B/C) ratio for the Phase 1 layout (interchange only) was conducted to assess the feasibility in implementing this stage of the project. The calculation included benefits received from improved traffic operations and safety conditions. The results of the B/C calculation provided a positive ratio of 2.87.
Recommendations
The objectives to develop an interchange alternative that reduces the overall scope of the project or provides the most flexibility for staged implementation and incorporates the provisions of an in-line BRT can be achieved with the Turbine Interchange layout. The flexibility provided in Phase 1 for the northbound I-35W to westbound I-494 movement was shown to provide positive B/C and addresses a key issue for the crash history at the interchange. The comparative cost estimate for construction of Phase 1 interchange improvements indicates a $26 million investment for the improvement of operations and safety in the corridor. The Phase 1 project scope is a fiscally achievable project and should be considered for implementation.
Next Steps
In order to proceed with the design and construction of interchange improvements the following items must be completed:
1. Decide direction on Unresolved Issues ; Preferred BRT Concept and Lyndale Avenue Interchange Access to I-35W and Footprint Impacts.
2. Interstate Access Request (IAR) 3. Mn/DOT Staff Approved Geometric Layout 4. Appropriate Environmental Documentation 5. Municipal Consent
Due to the uniqueness of the I-494/I-35W interchange project and all the past work that was previously completed, it is recommended that a meeting be held between FHWA and Mn/DOT to determine the requirements and level of effort for each of those documents.

I-494/I-35W Interchange Preliminary Design Project MNTCO 107371 Minnesota Department of Transportation ES-5
Table of Contents
Letter of Transmittal Certification Page Title Page Executive Summary Table of Contents
Page
1.0 Study Overview ..........................................................................................................1 1.1 Project Purpose and Need .................................................................................. 1 1.2 I-494/I-35W Project Approach ............................................................................. 1 1.3 Past Studies ........................................................................................................ 2 1.4 Study Area .......................................................................................................... 2
2.0 Methodology ..............................................................................................................3 2.1 Existing Traffic Volume Counts and Field Observations ..................................... 3 2.2 Traffic Volume Forecasts .................................................................................... 3 2.3 Operational Analysis Tools ................................................................................. 3
2.3.1 CORSIM Modeling Methodology ............................................................. 3 2.3.2 Level of Service Criteria .......................................................................... 3
2.4 Alternative Concept Development and Construction Cost Estimates ................. 3 2.4.1 Design Criteria ........................................................................................ 4
2.4.1.1 I-494 Cross Section ................................................................ 4 2.4.1.2 Interchange Spacing ............................................................... 4 2.4.1.3 Entrance Ramp and Exit Ramp .............................................. 4
2.4.2 Comparative Construction Cost Estimate ............................................... 4 2.4.3 Impact Analysis ....................................................................................... 4
3.0 Existing Conditions ...................................................................................................4 3.1 Current/Recent Construction .............................................................................. 4 3.2 Existing Volumes ................................................................................................ 4 3.3 System Plan ........................................................................................................ 5 3.4 Weaving Areas .................................................................................................... 6 3.5 Operations – Observations and Analysis ............................................................ 6
3.5.1 Eastbound I-494 AM Conditions .............................................................. 6 3.5.2 Westbound I-494 AM Conditions ............................................................. 6 3.5.3 Eastbound I-494 PM Conditions ............................................................. 7 3.5.4 Westbound I-494 PM Conditions ............................................................ 7 3.5.5 I-35W AM and PM Conditions ................................................................. 7
3.6 Crash Summary .................................................................................................. 7 4.0 Concept Development and Design ..........................................................................8
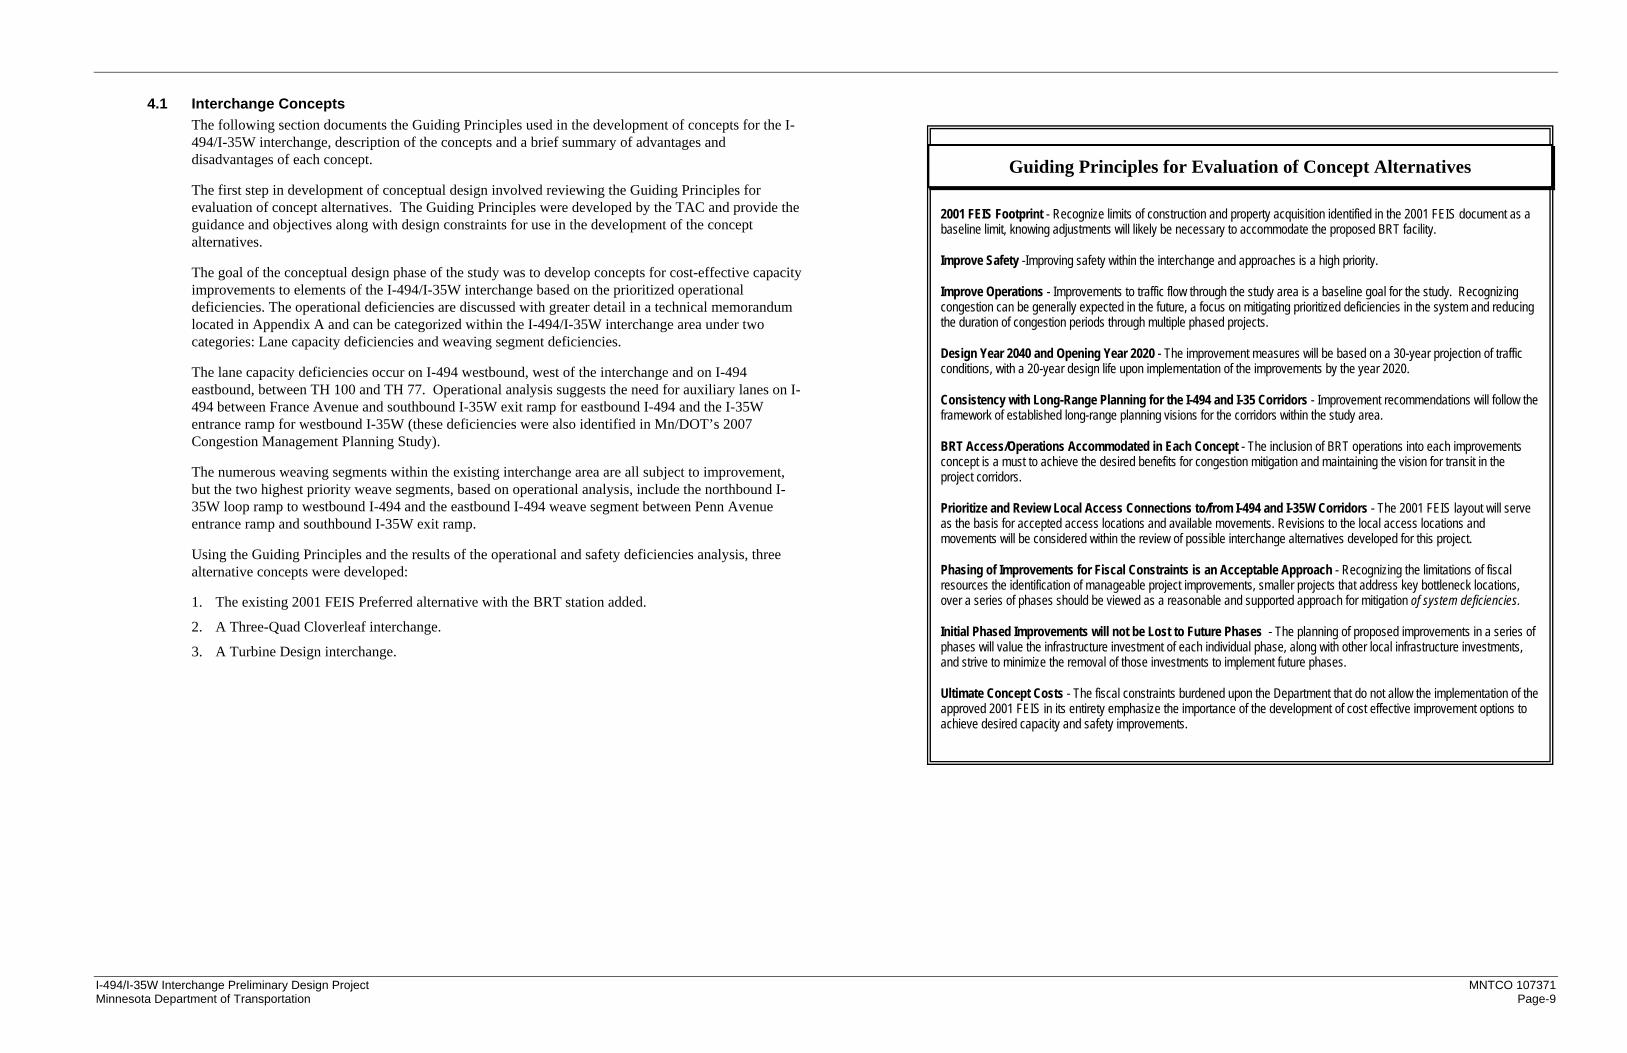
4.1 Interchange Concepts ......................................................................................... 9 4.2 Comparison of Alternatives ............................................................................... 11
4.2.1 Alternative Concept 1– 2001 FEIS Preferred Alternative ...................... 11
4.2.2 Alternative Concept 2– Three-Quad Cloverleaf .................................... 11 4.2.3 Alternative Concept 3– Turbine Interchange ........................................ 11 4.2.4 Alternative Concepts 1A, 2A and 3A – Split Diamond between American
Boulevard and 82nd Street ..................................................................... 11 4.3 Bus Rapid Transit (BRT) Station ...................................................................... 12 4.4 Water Resources .............................................................................................. 16
5.0 Future Year Analysis ............................................................................................... 16 5.1 Traffic Forecasts ............................................................................................... 16 5.2 5.2 2040 Operations ........................................................................................ 16
5.2.1 Bottlenecks Outside Study Interchange ................................................ 16 5.2.1.1 5.2.1.1 Eastbound I-494 ...................................................... 16 5.2.1.2 5.2.1.2 Westbound I-494 ..................................................... 16 5.2.1.3 Northbound I-35W ................................................................ 17 5.2.1.4 Southbound I-35W ................................................................ 17 5.2.1.5 TH 77 .................................................................................... 17
5.2.2 2001 FEIS and Turbine Concept Comparison ...................................... 17 5.2.2.1 I-494 ...................................................................................... 17 5.2.2.2 I-35W .................................................................................... 18 5.2.2.3 Ramp Connections ............................................................... 19
5.2.3 Conclusion ............................................................................................ 19 5.3 2020 No Build Conditions ................................................................................. 19
5.3.1 Operations ............................................................................................ 19 5.3.1.1 Eastbound I-494 ................................................................... 19 5.3.1.2 Westbound I-494 .................................................................. 20 5.3.1.3 Northbound I-35W ................................................................ 20 5.3.1.1 Southbound I-35W ................................................................ 21 5.3.1.2 TH 77 .................................................................................... 21
5.4 2020 Build Phased Conditions .......................................................................... 21 5.4.1 Northbound to Westbound .................................................................... 22
5.4.1.1 Operations ............................................................................ 22 5.4.2 Eastbound I-494 to Southbound I-35W ................................................. 23
5.4.2.1 Operations ............................................................................ 24 5.4.3 I-35W – 82nd Street Ramp Braiding ..................................................... 25
5.4.3.1 Operations ............................................................................ 25 5.4.4 Phase 1 Safety Improvements .............................................................. 26
6.0 Impact Analysis ....................................................................................................... 27 6.1 Local Streets - Bus Rapid Transit and Park-and-Ride Facility .......................... 27
6.1.1 Development Locations ........................................................................ 27 6.1.2 Forecast Volumes ................................................................................. 27 6.1.3 Development Trip Generation and Routing .......................................... 27

Table of Contents (Continued)
I-494/I-35W Interchange Preliminary Design Project MNTCO 107371 Minnesota Department of Transportation ES-ii
6.1.4 Synchro/SimTraffic Analysis .................................................................. 27 6.1.4.1 No Build ................................................................................ 27 6.1.4.2 Westside BRT Station ........................................................... 28 6.1.4.3 Eastside BRT Station ............................................................ 28
6.2 Utilities .............................................................................................................. 28 6.3 2040 Local Arterial Network .............................................................................. 28 6.4 Infrastructure Footprint ...................................................................................... 29 6.5 Construction Cost ............................................................................................. 29 6.6 Benefit / Cost Analysis ...................................................................................... 31
7.0 Recommendation .....................................................................................................32 7.1 Next Steps ........................................................................................................ 32
List of Tables Table 1 - Freeway Measures of Effectiveness ....................................................................... 3 Table 2 - Short Weaving Areas .............................................................................................. 6 Table 3 - 2006 – 2008 I-494 at I-35W Interchange Crashes .................................................. 8 Table 4 – 2006-2008 Approaching Leg Crash & Severity Rates ........................................... 8 Table 5 – Interchange Concepts Advantages/Disadvantages Summary ............................. 12 Table 6 - 2040 Eastbound I-494 Interchange Operations ................................................... 17 Table 7 - 2040 Westbound I-494 Interchange Operations ................................................... 18 Table 8 - 2040 – Northbound I-35W Interchange Operations .............................................. 18 Table 9 - Southbound I-35W Interchange Operations ......................................................... 19 Table 10 - 2020 No Build – Eastbound I-494 ....................................................................... 20 Table 11 - 2020 No Build – Westbound I-494 ...................................................................... 20 Table 12 - 2020 No Build – Northbound I-35W .................................................................... 21 Table 13 - 2020 No Build – Southbound I-35W ................................................................... 21 Table 14 - 2020 Comparison - Westbound I-494 ................................................................. 23 Table 15 - 2020 Comparison – Northbound I-35W .............................................................. 23 Table 16 - 2020 Comparison – Eastbound I-494 ................................................................. 24 Table 17 - 2020 Comparison – Northbound I-35W .............................................................. 26 Table 18 - 2020 Comparison – Southbound I-35W .............................................................. 26 Table 19 - Benefit Cost Summary ........................................................................................ 31
List of Figures Figure 1 – Turbine Interchange Concept Layout ................................................................... 2 Figure 2 – Comparison of Footprint Impacts (See Figure D13A in Appendix D) ................... 3 Figure 3 – Comparison of Footprint Impacts with BRT (See Figure D13A in Appendix D) .... 3 Figure 4 – Turbine Interchange, Phase 1 (See Figure D27 in Appendix D) .......................... 4 Figure 5 – CORSIM Modeling Limits ..................................................................................... 2 Figure 6 – Mn/DOT Interchange Ramp Spacing Guidelines.................................................. 5 Figure 7 – 2007 Peak Period Congestion (Source: Mn/DOT)................................................ 7 Figure 8 – Alternative Concept 1 - – 2001 FEIS Preferred Alternative ................................ 10 Figure 9 – Alternative Concept 2 – Three-Quad Cloverleaf ................................................. 10 Figure 10 – Alternative Concept 3 – Turbine Interchange ................................................... 10 Figure 11 – Single Platform with Weave .............................................................................. 13 Figure 12 – Plan View .......................................................................................................... 13 Figure 13 – Section View ..................................................................................................... 13 Figure 14 – Dual Platform without Weave ........................................................................... 14 Figure 15 – Plan View .......................................................................................................... 14 Figure 16 – Section View ..................................................................................................... 14 Figure 17 – Offline T Concept .............................................................................................. 15 Figure 18 – Plan View .......................................................................................................... 15 Figure 19 – Park and Ride Sites .......................................................................................... 15 Figure 20 – Northbound to Westbound Improvements ........................................................ 22 Figure 21 – Phase 1 Eastbound to Southbound Improvements .......................................... 24 Figure 22 – I-35W Phase Improvements ............................................................................. 25 Figure 23 – Crash Reduction Areas .................................................................................... 27 Figure 24 – Recommended Phase 1 Improvements (See Figure D27 in Appendix D) ....... 32
List of Appendices Appendix A Traffic Engineering Technical Memorandums Appendix B Water Resources Technical Memorandum Appendix C Interchange Concepts Appendix D Geometric Layouts Appendix E Bus Rapid Transit Layouts Appendix F Traffic Engineering Exhibits Appendix G Construction Cost Estimates Appendix H Agency Comments

March 30, 2010
SEH is a registered trademark of Short Elliott Hendrickson Inc. I-494/I-35W Interchange Preliminary Design Project MNTCO 107371 Minnesota Department of Transportation
Preliminary Design Report
I-494/I-35W Interchange Preliminary Design Project
Prepared for Minnesota Department of Transportation
1.0 Study Overview
The I-494 and I-35W corridors are major transportation corridors in the Twin Cities metropolitan area. The ability to effectively move the users of these transportation corridors to their destinations with reduced congestion and improved safety continues to be a challenge today and in the foreseeable future. The I-494 and I-35W interchange consistently remains as one of the higher ranked locations for congestion and safety deficiencies in the metro area. This condition will continue to erode without the implementation of improvements in the corridor and at the interchange. Through the completion of the 2001 Final Environmental Impact Statement (FEIS) for the I-494 Reconstruction: I-394 to the Minnesota River, major improvement strategies for the I-494 corridor were identified. Recent improvements from that study, such as the Penn Avenue and Lyndale Avenue interchanges on I-494, plus the 2009 Urban Partnership Agreement (UPA) improvements to I-35W and the on-going work at the I-35W and TH 62/ Crosstown Interchange will help to ease congestion and improve safety through these corridors.
Major interchange improvements were identified inthe 2001 FEIS; including the reconstruction of the system-to-system interchange of I-494 and I-35W, the Portland Avenue interchange, which includes closure of the Nicollet Avenue and 12th Avenue interchanges along I-494, and ramp improvements to the Cedar Avenue (TH 77)and 34th Street interchanges.
The current state of the economy in Minnesota and the nation has hampered the resources of the funding programs at both the federal and state levels to support future major interstate improvement projects. The Minnesota Department of Transportation (Mn/DOT) faces significant challenges for implementing the remaining improvements. Recognizing these limitations Mn/DOT has embarked on a new philosophy towards addressing the deficiencies throughout the metro interstate system. This new philosophy seeks to target funding toward prioritized deficiencies, through reduced project scope or phased implementation of key project elements to provide the highest return on investment for the available funding resources.
In addition to the efforts in reducing project scopes and costs for the existing infrastructure, Bus Rapid Transit (BRT) has become a significant component of transportation system solutions for addressing congestion in major corridors on the interstate and state highways throughout the metro area. The I-35W corridor was enhanced with HOV/HOT lanes from Lakeville to downtown Minneapolis through the 2009 UPA improvements. Construction is underway for a new in-line BRT station at the 46th Street overpass on I-35W in Minneapolis, with another station planned to be located just south of the I-494/I-35W interchange, near the American Boulevard overpass.
1.1 Project Purpose and Need The I-494/I-35W Interchange Preliminary Design Project stemmed from the recognition that the remaining improvements identified in the 2001 FEIS were surpassing $400 million in overall project costs. Without reconsideration of the scope of these projects, there exists a risk that no major improvements can be made in the next 20 years or beyond. The I-494/I-35W interchange, as a system-to-system interchange, was targeted for review due to its significance to the southern ring of the interstate system in the metro.
The I-494/I-35W interchange is one of the highest volume interchanges in the state of Minnesota. Recent capacity improvements throughout the I-494 corridor for additional lanes and adjacent interchange improvements have all benefited traffic flow along both I-494 and I-35W. While the improvements have benefited both corridors, they have not been able to keep up with the increasing car, transit, and freight-hauling volumes. As a result of the increased volume demand on the interstate corridors all vehicles traveling through the area experience significant traffic congestion, and related crashes, lasting several hours around the morning and afternoon peak periods.
In additional to the mainline experiencing heavy traffic volumes, vehicles traveling from one interstate to the other also cause significant vehicle backups, in excess of several miles in each direction, for both interstates. The queuing vehicles have raised concerns about safety for both interstate corridors. In 2008 the I-494/I-35W interchange was ranked as the 7th worst interchange in the Twin Cities Metropolitan area.
Plans to improve both corridors have been in motion for quite awhile. The 2001 FEIS provided a plan for improvements, but also noted that it would be difficult to implement based upon the 2001 funding levels for transportation infrastructure.
This project set out to satisfy two alternatives. The first was to identify a cost-sensitive option that would implement key components of the 2001 FEIS and the second was to determine the components for phases needed for a staged implementation of the concept developed for the 2001 FEIS.
1.2 I-494/I-35W Project Approach The I-494/I-35W Interchange Preliminary Design Project incorporates past study efforts from the 2001 FEIS, specifically the Preferred Alternative layout, to serve as the baseline for initiation of this current project. The approach for this project was framed through two main objectives established by Mn/DOT. These two objectives include:
• Develop an interchange alternative that reduces the overall scope of the project or provides the most flexibility for staged implementation.
• Develop an alternative that incorporates the provisions of an In-Line BRT station located at or between American Boulevard and 82nd Street.

I-494/I-35W Interchange Preliminary Design Project MNTCO 107371 Minnesota Department of Transportation Page-2
The project has incorporated CORSIM modeling for the 1-494 and I-35W corridor to establish baseline, no-build, and build alternatives based on the alternative concepts developed. Forecast years established for the project modeling efforts include a 2040 Design Year and a 2020 Opening Year.
The interchange and BRT alternative concepts developed during the project will be refined to include three feasible alternatives, with one alternative identified as the concept to be considered for further evaluation. The selected alternative provides the basis to identify a concept that will meet the purpose and need objectives of the project. The remaining alternatives will be considered as viable options pending final determination of the interchange and BRT layouts. Future documents such as an Interstate Access Request (IAR), a Mn/DOT Staff Approved Geometric Layout and the appropriate environmental documentation will draw upon the findings of this project.
The I-494/I-35W Interchange Preliminary Design Project also involved a collection of key agency stakeholders who are invested in the project corridors. A Technical Advisory Committee (TAC) was created for the review of the project findings and to provide additional direction on project issues.
The Agency Stakeholders involved in the TAC included the following:
• Minnesota Department of Transportation (Mn/DOT) • Federal Highway Administration (FHWA) • City of Bloomington • City of Richfield • Met Transit • Minnesota Valley Transit Authority (MVTA) • Metropolitan Council (METC) • Metropolitan Airports Commission (MAC) • Hennepin County
1.3 Past Studies The following past studies were utilized to establish a baseline of available historic information for the project.
• 2001 I-494 Reconstruction: I-394 to Minnesota River FEIS • I-494 & TH 77 Forecast Study • Stanley Consultants I-494 Stormwater Alternatives • IAR for Penn Avenue and Lyndale Avenue Interchange Projects • Penn American District Plan
Figure 5 – CORSIM Modeling Limits
1.4 Study Area The study area for evaluating the interchange options was determined by Mn/DOT and FHWA. The limits were chosen based on the potential impact area of the I-494/I-35W interchange operations.
The CORSIM modeling limits for I-494 extend from Valley View Road to the Minnesota River Bridge. The I-35W model limits include 90th Street to 66th Street and the TH 77 model limits extend from the Minnesota River Bridge to TH 62. The modeling limits are shown above in Figure 5.
Specific interchange intersections included in the study are listed below.
• France Avenue Interchange (I-494) − I-494 North Ramp Terminal Intersection − I-494 South Ramp Terminal Intersection − Penn Avenue Interchange (I-494) − I-494 Single Point Ramp Terminal Intersection
• Lyndale Avenue Interchange (I-494) − I-494 North Ramp Terminal Intersection (2007)

I-494/I-35W Interchange Preliminary Design Project MNTCO 107371 Minnesota Department of Transportation Page-3
− I-494 South Ramp Terminal Intersection (2007) − I-494 Single Point Ramp Terminal Intersection (open 2010)
• Nicollet Avenue Interchange (I-494) − I-494 North Ramp Terminal Intersection − I-494 South Ramp Terminal Intersection
• Portland Avenue Interchange (I-494) − I-494 North Ramp Terminal Intersection − I-494 South Ramp Terminal Intersection
• 76th Street Interchange (I-35W) − I-35W East Ramp Terminal Intersection − I-35W West Ramp Terminal Intersection
• 82nd Street Interchange (I-35W) − I-35W East Ramp Terminal Intersection − I-3W West Ramp Terminal Intersection
2.0 Methodology The methodology used for this study is reflective of the goals described in the study approach. The basic elements of the project include the following:
• Existing Traffic Volume Counts and Field Observations of Traffic Conditions • Traffic Volume Forecasts Based on Regional Models • Operational Analysis Tools – CORSIM Modeling and Level-of-Service Criteria • Alternative Concept Development and Construction Cost Estimates • Design Criteria • These elements are further described below in terms of the utility and relation to other project
components.
2.1 Existing Traffic Volume Counts and Field Observations Existing morning and afternoon peak period traffic counts were collected for key study area intersections and for the freeway mainline and ramps for I-494, I-35W, TH 100 and TH 77. Collected data was supplemented by peak period field observations of traffic operating conditions. The existing volume data was a key input into the operational modeling and the field observations assisted in “calibrating” the CORSIM operational model to actual conditions. Calibrating the CORSIM operational model provides the basis for future condition models and the operational evaluation of improvement alternatives.
A full description of the existing conditions and field observations is included in Appendix A, “Existing Conditions Memorandum”.
2.2 Traffic Volume Forecasts Future year 2020 and 2040 traffic volume forecasts were obtained from two separate studies conducted along the corridors by MnDOT. The 2008 Forecasting and Concept Development I-494 & TH 77 Study provided 2020 and 2030 forecasts numbers for the majority of the study network. These forecasts were combined with the 2009 TH 169/I-494 Interchange Reconstruction Study to obtain a full network of forecast demands. The 2030 forecasts were then grown to match 2040 socioeconomic projections based on the regional travel demand forecast model. The 2020 and 2040 traffic volume forecasts account for expected future development and the planned roadway system in the area.
2.3 Operational Analysis Tools 2.3.1 CORSIM Modeling Methodology
The 7-step modeling process documented in FHWA’s Traffic Analysis Tool Box Volume IV was followed to develop the CORSIM models. The models are documented with manuals and have been approved by Mn/DOT Metro Division Traffic Engineering Staff. The 7-step modeling process is summarized into the following 3-phase approach:
• Creation of exiting conditions CORSIM model. • Calibration of the existing condition CORSIM model based on loop detector data and field
observations. • Evaluation of interchange designs in study areas with comparison to No-Build condition for Build
year.
2.3.2 Level of Service Criteria The freeway Level of Service (LOS) criteria presented in the following table were used to evaluate the traffic operations in study area.
Table 1 - Freeway Measures of Effectiveness
Level of Service (LOS) Description
Density (pc/mi/ln)
A Free flow operations where free flow speeds and operating speeds are the same. Vehicles are unimpeded in their ability to maneuver. < 10.00
B Free flow speeds are generally maintained. Vehicle’s ability to maneuver is only slightly restricted. > 10.0 – 20.0
C Free flow speeds are generally maintained. Freedom to maneuver is noticeably restricted. Queues may be expected to form behind any significant blockage. > 20.0 – 28.0
D Speeds begin to decline with increased traffic. Freedom to maneuver is more noticeably restricted. Queues can be expected to form behind any minor incident.
> 28.0 – 35.0
E
The lower boundary of LOS E is considered at capacity. Operations are very volatile with extremely limited room to maneuver. Any disruption such as lane changing or vehicle entering from a ramp can cause a breakdown and extensive queuing.
> 35.0 – 43.0
F Total breakdown in vehicular flow. Traffic is under stop and go conditions.
> 43.0
Source: Highway Capacity Manual (Exhibit 24-2), Transportation Research Board, 2000.
2.4 Alternative Concept Development and Construction Cost Estimates Input from stakeholders and the operational analysis results for Existing and No-Build conditions were instrumental in the development of improvement alternative concepts for both the interchange and the BRT station.
The concept plan development task includes the physical layout of improvement alternatives on aerial base mapping. This provided a clear definition of roadway configuration and basic geometric details providing input into the operational analysis model. Using the concept plans, impacts on private

I-494/I-35W Interchange Preliminary Design Project MNTCO 107371 Minnesota Department of Transportation Page-4
property and sensitive environmental features can be identified. The concept plans also provided the basis for developing initial construction cost estimates.
Three alternative concepts were developed for both the interchange and the BRT station. The three alternative concepts were evaluated through basic review of advantages/disadvantages, screening matrix of identified key criteria, and comparative cost estimates. The result of the evaluation would select one alternative concept that the Stakeholder group accepted for further consideration and development.
2.4.1 Design Criteria The development of each concept plan was guided by several factors including but not limited to:
• Mn/DOT geometric design requirements • Mn/DOT’s planned expansion of I-494 (2001 FEIS)
The key design elements used for concept plan development and evaluation are as follows:
2.4.1.1 I-494 Cross Section Concepts needed to accommodate the widening of I-494 from a 6-lane to an 8-lane facility. All ramp concepts were designed for this phased expansion.
2.4.1.2 Interchange Spacing Freeways are intended to carry longer distance through traffic. Frequent interchanges create opportunities for shorter trips which can adversely affect traffic flow and degrade the safety of a freeway. The Mn/DOT Road Design Manual interchange spacing guidelines were considered in all concepts.
2.4.1.3 Entrance Ramp and Exit Ramp The Mn/DOT Road Design Manual requires that ramp designs must provide sufficient length for acceleration and deceleration based on the design speed of the freeway mainline. The concepts were all designed with a standard taper and the required acceleration or deceleration length.
2.4.2 Comparative Construction Cost Estimate Construction cost estimates for the interchange concepts were developed as a tool to aid in the determination of an alternative concept’s feasibility and for evaluation against the other concepts. The cost estimates utilized Mn/DOT’s LWD format with a 20% risk factor applied.
Project development/delivery (design) and right-of-way acquisition estimates were not determined for this level of cost development. Only major construction elements were included in the cost estimates, which includes pavement, bridge, retaining wall, and median barriers.
Construction cost estimates for the BRT station were developed from design estimates for the recently awarded 46th Street BRT station on I-35W. The 46th Street station is very similar to concepts developed for this project and provides a solid source for generation of cost estimates for the concepts on this project.
2.4.3 Impact Analysis Basic evaluation criteria have been developed for the comparative assessment of the alternative concepts evaluated against the 2001 FEIS Preferred Alternative. The impact analysis utilized the following evaluation criteria:
• Infrastructure Footprint
• Utility Impacts • Water Resource Management • Local Street Network Impacts • Construction Phasing • Project Cost and Benefits Received
3.0 Existing Conditions This section summarizes the key findings noted in the “Existing Conditions Memorandum” that is attached in Appendix A. The document provides details regarding current traffic operations and provides a crash summary for the last 3 years for the I-494 corridor and I-35W interchange area.
Additionally, the document reviewed the American Association of State Highway and Transportation Officials (AASHTO) System Plan which includes: basic numbers of lanes, lane balance, route continuity, interchange spacing, ramp spacing, and interchange type to identify potential issues within the I-494 corridor.
As previously noted, this section will highlight portions of the findings from the memorandum, for full details, refer to Appendix A.
3.1 Current/Recent Construction Due to continuing construction activity at various locations throughout the corridor over the past few years 2007 was chosen as the base year for the existing conditions CORSIM model. The existing freeway model reflects 2007 traffic volume data and freeway geometry.
Notable changes to the I-494 and I-35W corridors since the 2001 FEIS study that have an impact this analysis include:
• I-494 Stage 1 expansion project west of TH 100 (completed along I-494 in 2005). • I-494/Penn Avenue interchange reconstructed in 2002 as a single point urban interchange (SPUI). • The TH 62 Crosstown project: Started spring of 2007 (anticipated completion date - fall 2010). • I-494/Lyndale Avenue interchange with I-494: Started fall of 2008 (completion in 2009). • I-35W at I-494 interchange: Constructed three continuous northbound through lanes (completed in
2008). • I-35W UPA: Northbound CD Road at I-494 (completed in 2009). • I-35W UPA: HOT lanes (anticipated completion/opening date - fall 2010).
3.2 Existing Volumes The majority of the turning movement volumes were supplied from previous studies in 2007. At locations which there was no 2007 data, turning movement data was collected to augment the data gaps. Traffic conditions including freeway speed and volumes are based on 2007 Mn/DOT’s Regional Traffic Management Center (RTMC) data.
Field observations of traffic flow and congestion in the project corridor were conducted in April 2009. The field observations were then compared to the 2007 freeway data to ensure 2009 travel characteristics were similar to the 2007 conditions modeled. Comparing the 2009 traffic conditions to 2007 showed similar speed trends and congestion characteristics which secured confidence in the modeling analysis.

I-494/I-35W Interchange Preliminary Design Project MNTCO 107371 Minnesota Department of Transportation Page-5
3.3 System Plan Evaluation of the “system plan” involved reviewing major design features in the corridor in order to isolate issues that may contribute to the traffic congestion. These design features are described in the Mn/DOT design manual and in the AASHTO, A Policy on Geometric Design of Highways and Streets, 2004. These criteria include the following:
• Basic Number of Lanes • Lane Balance • Route Continuity • Interchange Spacing • Ramp Spacing • Interchange Type
A review of the I-494 and I-35W corridors indicate that the existing system plan has many segments that are inconsistent with AASHTO criteria.
The basic number of lanes criteria considers the capacity of the number of lanes over a significant length of a corridor and compares it to the traffic demand using that same segment of the corridor. This segment of I-494 does not meet the current basic number of lanes based on volume demands; eastbound I-494 from TH 100 to TH 77 is above a LOS D threshold while westbound from I-35W to TH 100 is above a LOS E threshold. The I-35W study area currently meets the basic number of lanes needed for the traffic volumes in experiences.
The concept of lane balance is intended to smooth traffic flow through and beyond an interchange. Lane balance along both the I-494 and I-35W study corridors is maintained with only a few exceptions.
A route continuity evaluation is used to determine if any forced lane changes are required to continue along a specific highway. The evaluation determined that route continuity is maintained for both I-494 and I-35W throughout the study area.
In urban areas, the minimum interchange spacing distance desired is one mile. In the study area the I-494 interchanges that are west of Penn Avenue meet or exceed the one mile desired spacing. The segment of I-494 between Penn Avenue and TH 77 has five interchanges: I-35W, Lyndale Avenue, Nicollet Avenue, Portland Avenue, and 12th Avenue. These five interchanges are spaced approximately ½ mile apart and hence are below the desired one mile minimum interchange spacing distance. Along I-35W the interchange spacing between 76th Street and 82nd Street is less than the desirable one mile. Specifically, the distance between 82nd and I-494 is approximately ½ mile and the distance between I-494 and 76th Street is approximately ¼ mile.
The distance between freeway ramps (ramp spacing) can be one of the most important factors impacting freeway operations. Building off of the AASHTO benchmarks for ramp spacing, Mn/DOT has established guidelines for desired interchange ramp spacing and these guidelines are documented in the Mn/DOT Design Manual and are shown in Figure 6.
Using this ramp spacing criterion against the current ramp spacing along I-494 and I-35W, there are many locations that do not meet the minimum spacing requirement. Some of these locations are enhanced with a full auxiliary lane between the ramps to help with weaving traffic. Most of the short ramp spacing occurs in and around the I-494/I-35W interchange.
Figure 6 – Mn/DOT Interchange Ramp Spacing Guidelines
Interchange Type considers the uniformity of different interchange styles. All of the system to system interchanges are cloverleaf designed while the service interchanges are all diamond configurations (SP01, half diamonds). The only exception in the area is the France Avenue interchange, which is a 4 Quad Parcle-A.

I-494/I-35W Interchange Preliminary Design Project MNTCO 107371 Minnesota Department of Transportation Page-6
Roadway From ToEB I-494 E. Bush Lake Rd Ent SB TH 100 Exit 520 640 310 950 640 510 1150 Auxiliary laneEB I-494 SB TH 100 Ent NB TH 100 Exit 300 1590 410 2000 1210 230 1440 Loop to loop - Aux LaneEB I-494 Penn Avenue Ent SB I-35W Exit 720 500 1090 1590 1100 830 1930 Auxiliary laneEB I-494 SB I-35W Ent NB I-35W Exit 450 520 400 920 390 460 850 Loop to loop - Aux LaneEB I-494 NB I-35W Ent Lyndale Avenue Exit 725 490 430 920 770 360 1130 Auxiliary laneEB I-494 Lydale Avenue Ent Nicollet Avenue Exit 640 250 300 550 620 210 830 Auxiliary laneEB I-494 Nicollet Avenue Ent Portland Avenue Exit 1225 330 400 730 330 320 650EB I-494 12th Avenue Ent SB TH 77 Exit 950 490 800 1290 1060 2130 3190 Auxiliary lane plus lane addWB I-494 TH 77 Ent 12th Avenue Exit 650 1720 920 2640 1300 760 2060 Auxiliary laneWB I-494 Portland Avenue Ent Nicollet Avenue Exit 1140 320 290 610 470 510 980WB I-494 Nicollet Avenue Ent Lyndale Avenue Exit 940 320 350 670 280 450 730 Auxiliary laneWB I-494 Lyndale Avenue Ent NB I-35W Exit 770 290 190 480 540 560 1100 Auxiliary laneWB I-494 NB I-35W Ent SB I-35W Exit 540 1170 320 1490 1040 360 1400 Loop to loop - Aux LaneWB I-494 SB I-35W Ent Penn Avenue Exit 600 820 580 1400 560 630 1190 Auxiliary laneWB I-494 NB TH 100 Ent SB TH 100 Exit 300 540 400 940 570 290 860 Loop to loop - Aux LaneWB I-494 SB TH 100 Ent E. Bush Lake Exit 750 400 590 990 1000 480 1480 Auxiliary laneNB I-35W 82nd Street Ent EB I-494 Exit 550 250 480 730 380 770 1150 Auxiliary laneNB I-35W EB I-494 Ent WB I-494 Exit 450 400 1170 1570 460 1040 1500 Loop to loop - Aux LaneSB I-35W WB I-494 Ent EB I-494 Exit 430 320 520 840 360 390 750 Loop to loop - Aux LaneSB I-35W EB I-494 Ent 82nd Street Exit 760 1090 390 1480 830 250 1080 Auxiliary lane
Weaving Area Entering Volume
Exiting Volume
Total Weave Volume
AM Peak Period
Weave Distance
(ft)
PM Peak Period
Comments
Total Weave Volume
Entering Volume
Exiting Volume
3.4 Weaving Areas Throughout the study area, both I-494 and I-35W combined have twenty ramp areas with short weave sections. Table 2 shows all of the locations of a weaving (entrance to exit) area that is less than the minimum 1,500 feet desired spacing. Many of these merge areas are aided by the use of auxiliary lanes between the ramps; however between Nicollet Avenue and Portland Avenue there are no auxiliary lanes. Highlighted cells indicate weaving sections that have at least 1,000 vehicles completing the weave movement during the AM or PM peak hour.
The heaviest weave sections (green highlighted cells) include eastbound I-494 between TH 77 and 12th Avenue. During the PM peak, this movement has almost 3,200 vehicles that weave between the two ramps which are located only 950 feet apart. Westbound I-494 in this same section also has a high weave volume during both peak periods with over 2,000 vehicles completing the weave within 650 feet.
A high weave volume is also exhibited in the AM peak period between the entrance and exit ramps of TH 100 on eastbound I-494.
Table 2 - Short Weaving Areas
3.5 Operations – Observations and Analysis Traffic operations along I-494 and I-35W exhibit congestion issues in both the AM and PM peak periods. A graphic from Mn/DOT’s Metropolitan Freeway System 2007 Congestion Report is illustrated on the next page in Figure 7 to show the congestion areas and levels of congestion in the AM & PM peak periods. Factors contributing to these conditions include traffic volumes over the capacity of the basic mainline section, heavy entering and exiting volumes, as well as closely spaced ramps which create weaving problems. While I-35W has a directional traffic split between the morning and afternoon peaks, I-494 has congestion in both directions during both peak periods. I-494 has a speed limit of 60 mph, while I-35W is 55 mph north of 82nd Street and 65 mph south of 82nd Street.
3.5.1 Eastbound I-494 AM Conditions Overall, eastbound I-494 experiences heavy congestion, LOS “F”, from East Bush Lake Road to northbound TH 100 entrance ramp. From TH 100 east to Penn Avenue the level of service varied between LOS “E” and “F”. The poor operations are the sum of a combination of factors that slow the mainline and cause traffic to spillback upstream of the bottleneck. Some of these factors include:
• Between France Avenue and Penn Avenue the AM volumes are reaching the capacity of the 3-lane freeway section. Full capacity causes traffic to slow down and hence spill back upstream of TH 100 interchange.
• SB TH 100 auxiliary lane drops at France Avenue and this lane drop, as expected, forces a majority of vehicles to make a lane change to be able to continue on eastbound I-494.
• The auxiliary lane from Penn Avenue to NB I-35W has a high weaving volume over a short distance of only 720 feet. Vehicles tend to slow down in order to merge into (and out of) gaps in traffic. In turn the slowdown then spills back upstream of the weave.
3.5.2 Westbound I-494 AM Conditions Level of service for westbound I-494 varied between “E” and “F” from the TH 77 Entrance Ramp all the way to France Avenue. The lower level of service is caused by a combination of factors that slow the mainline and cause traffic to spillback upstream of the bottleneck. Some of the key factors that cause the slowdown are:
• Between I-35W and East Bush Lake Road the AM volumes are reaching the capacity of the 3-lane freeway section. • Northbound I-35W entrance and southbound I-35W exit movements have a high weaving volume over short distance of 540 feet. • Southbound I-35W entrance and Penn Avenue exit also have a high weaving volume over short distance of only 600 feet. • TH 77 entrance and 12th Avenue exit have a high weaving volume over a short weave distance of 650 feet.

I-494/I-35W Interchange Preliminary Design Project MNTCO 107371 Minnesota Department of Transportation Page-7
Figure 7 – 2007 Peak Period Congestion (Source: Mn/DOT)
3.5.3 Eastbound I-494 PM Conditions Eastbound I-494 operated at LOS F from the France Avenue exit ramp to 12th Avenue entrance ramp. The lower level of service is caused by a mixture of factors that slow the mainline traffic speed and cause traffic slowdowns to spillback upstream of the bottleneck. Factors creating the spillback include but are not limited to the following:
• Cloverleaf I-494 system interchanges at both TH 100 and I-35W that have a high weaving volume but a short distance between the loop ramps to complete the lane change.
• 12th Avenue and TH 77 also have a high weaving volume but a short weaving distance of only 950 feet.
• Penn Avenue entrance and southbound I-35W have a high weaving volume but a short weaving distance of only 700 feet.
3.5.4 Westbound I-494 PM Conditions Westbound I-494 had a mixture of levels of services “E” or “F” from 24th Avenue to France Avenue. The lower level of service is caused by a mixture of factors that slow the mainline traffic flow and cause traffic to spillback upstream of the bottleneck. These factors include but are not limited to the following:
• PM peak traffic volumes reach capacity on I-494 between France Avenue and I-35W for the 3-lane freeway section.
• High northbound I-35W entrance volumes have a short space to merge into mainline I-494 traffic. • Short weaving sections exist between I-35W, Lyndale Avenue, Nicollet Avenue, and Portland
Avenue.
3.5.5 I-35W AM and PM Conditions Northbound I-35W experience levels of service “E” or “F” between 82nd Street and the westbound I-494 exit loop during both AM and PM peak periods. One of the factors for the lower level of service in the northbound direction is caused by the northbound I-35W loop ramp exit to westbound I-494. Westbound I-494 is at capacity at that point and so is the exit ramp, as a result traffic queues extend back onto the mainline I-35W northbound.
The southbound I-35W LOS was a “D” or better for both the AM and PM traffic conditions.
3.6 Crash Summary A crash analysis was completed for the approaching roadways to the I-494/I-35W interchange. Freeway crashes can be attributed to shock wave activity, merging traffic, and weaving traffic on congested roadways (Mn/DOT Freeway and Major Arterial Crash Summary, 2009).
The congestion stemming from the I-494/I-35W interchange area extends upstream in all directions creating potential for congestion related crashes (rear-end, sideswipe, etc). Therefore, the congested freeway segments approaching the interchange were included in the analysis.
To evaluate the crashes (suspected of being mostly congestion related) a three year crash history period between 2006 and 2008 was analyzed. The Mn/DOT Metro District average crash and severity rates for a basic freeway segment are 0.9 and 1.3 crashes per million vehicle miles (MVM), respectively. For a cloverleaf interchange, the average crash and severity rates are 0.9 and 1.2, respectively.

I-494/I-35W Interchange Preliminary Design Project MNTCO 107371 Minnesota Department of Transportation Page-8
The following table is a summary of the I-494/I-35W interchange crashes. For this interchange area, all of the actual police crash reports were reviewed individually in order to determine the exact location of each crash. The crashes in the table are sorted by crash severity; fatal involves a death, severity A is a severe or incapacitating injury, severity B is a moderate or non-incapacitating injury, severity C is a minor or possible injury and property is a non-injury crash.
There were a total of 308 crashes at the interchange between 2006 and 2008 resulting in a crash and severity rate of 1.1 and 1.5 crashes per MVM, which are higher than the metro average for cloverleaf interchanges.
Table 3 - 2006 – 2008 I-494 at I-35W Interchange Crashes
Road From To Fatal A B C Property Total
EB
I-49
4
Begin SB I-35W Exit 0 0 0 4 5 9
SB I-35W Exit SB I-35W Ent. 0 0 1 2 4 7
SB I-35W Ent. NB I-35W Exit 0 0 0 3 7 10
NB I-35W Exit NB I-35W Ent. 0 0 0 1 0 1
NB I-35W Ent. End 0 0 0 1 2 3
WB
I-49
4
Begin NB I-35W Exit 0 0 1 7 23 31
NB I-35W Exit NB I-35W Ent. 0 0 1 12 16 29
NB I-35W Ent. SB I-35W Exit 0 1 1 18 35 55
SB I-35W Exit SB I-35W Ent. 0 0 0 1 3 4
SB I-35W Ent. End 0 0 0 2 7 9
NB
I-35W
Begin EB I-494 Exit 0 0 1 0 11 12
EB I-494 Exit EB I-494 Ent. 0 0 0 5 13 18
EB I-494 Ent. WB I-494 Exit 0 1 3 3 37 44
WB I-494 Exit WB I-494 Ent. 0 0 0 1 6 7
WB I-494 Ent. End 0 0 0 3 4 7
SB
I-35
W
Begin WB I-494 Exit 0 0 0 1 1 2
WB I-494 Exit WB I-494 Ent. 0 0 0 1 1 2
WB I-494 Ent. EB I-494 Exit 0 1 0 1 9 11
EB I-494 Exit EB I-494 Ent. 0 0 0 0 2 2
EB I-494 Ent. End 1 0 1 1 10 13
Ramp Crashes 0 1 0 13 18 32
TOTAL 1 4 9 80 214 308
Westbound I-494 has the highest number of crashes by direction with a three year total of 128 crashes (42% of the total for the interchange). The weaving area between the I-35W loop ramps has the highest crash frequency and drivers know the risk and go slower, causing even greater levels of congestion. The congestion spills back along I-494 and creates more safety problems as shown by the high number of crashes upstream of the loop ramps. Northbound I-35W has the next highest number of crashes by direction with 88 (29% of the total for the interchange). The weaving area between the I-494 loop ramps have a high portion of crashes which can be directly related to the congestion problems. Eastbound I-494 has a bottleneck upstream of the interchange which regulates the amount of traffic at the cloverleaf. The bottleneck throttles traffic down and therefore the eastbound crashes directly at the interchange are lower compared to westbound I-494. Southbound I-35W operates at free flow speeds for most of the day and therefore doesn’t have any major congestion-safety related problems. Finally, construction on I-35W at TH 62 directly north of the study area has impacted traffic routes and thus most traffic using southbound I-35W are through trips meaning fewer lane changes and thus fewer crashes.
The approach legs to the I-494/I-35W interchange were analyzed based on the extent of congestion during the peak periods. The Table 4 below shows the crash analysis for the directional approaches to the interchange. All approaches to the interchange have crash and severity rates above the metro average for an urban freeway segment. The Mn/DOT metro average crash rate is 1.1 and the severity rate is 1.5 crashes per MVM. Westbound I-494 and northbound I-35W have severity rates above the metro average.
Table 4 – 2006-2008 Approaching Leg Crash & Severity Rates
Road From To Fatal A B C Property Total Crash Rate
Severity Rate
EB I-494 West of France I-35W 0 0 3 39 172 214 1.5 1.8
WB I-494 East of 12th Ave I-35W 0 0 6 71 254 331 2.0 2.5
NB I-35W South of 82nd St I-494 1 2 8 46 91 148 1.6 2.3
SB I-35W North of 76th St I-494 0 0 0 5 8 13 1.3 1.8
TOTAL 1 2 17 161 525 706
4.0 Concept Development and Design The development of alternative concepts for the I-494/I-35W interchange centered on two key objectives, as previously outlined, that include the following:
• Develop an interchange alternative that reduces the overall scope of the project or provides the most flexibility for staged implementation.
• Develop an alternative that incorporates the provisions of an In-Line Bus Rapid Transit station located at or between American Boulevard and 82nd Street.
Alternative concepts for both the interchange layout and an in-line BRT Station were developed at a conceptual level to address the guiding principles for the project. Three concepts were developed for both the interchange and the BRT alternatives. A comparative assessment of the concepts was conducted through the use of a set of developed criteria.
I-494/I-35W Interchange Preliminary Design Project MNTCO 107371 Minnesota Department of Transportation Page-9
Guiding Principles for Evaluation of Concept Alternatives
2001 FEIS Footprint - Recognize limits of construction and property acquisition identified in the 2001 FEIS document as a baseline limit, knowing adjustments will likely be necessary to accommodate the proposed BRT facility.
Improve Safety -Improving safety within the interchange and approaches is a high priority.
Improve Operations - Improvements to traffic flow through the study area is a baseline goal for the study. Recognizing congestion can be generally expected in the future, a focus on mitigating prioritized deficiencies in the system and reducing the duration of congestion periods through multiple phased projects.
Design Year 2040 and Opening Year 2020 - The improvement measures will be based on a 30-year projection of traffic conditions, with a 20-year design life upon implementation of the improvements by the year 2020.
Consistency with Long-Range Planning for the I-494 and I-35 Corridors - Improvement recommendations will follow the framework of established long-range planning visions for the corridors within the study area.
BRT Access/Operations Accommodated in Each Concept - The inclusion of BRT operations into each improvements concept is a must to achieve the desired benefits for congestion mitigation and maintaining the vision for transit in the project corridors.
Prioritize and Review Local Access Connections to/from I-494 and I-35W Corridors - The 2001 FEIS layout will serve as the basis for accepted access locations and available movements. Revisions to the local access locations and movements will be considered within the review of possible interchange alternatives developed for this project.
Phasing of Improvements for Fiscal Constraints is an Acceptable Approach - Recognizing the limitations of fiscal resources the identification of manageable project improvements, smaller projects that address key bottleneck locations, over a series of phases should be viewed as a reasonable and supported approach for mitigation of system deficiencies.
Initial Phased Improvements will not be Lost to Future Phases - The planning of proposed improvements in a series of phases will value the infrastructure investment of each individual phase, along with other local infrastructure investments, and strive to minimize the removal of those investments to implement future phases.
Ultimate Concept Costs - The fiscal constraints burdened upon the Department that do not allow the implementation of the approved 2001 FEIS in its entirety emphasize the importance of the development of cost effective improvement options to achieve desired capacity and safety improvements.
4.1 Interchange Concepts The following section documents the Guiding Principles used in the development of concepts for the I-494/I-35W interchange, description of the concepts and a brief summary of advantages and disadvantages of each concept.
The first step in development of conceptual design involved reviewing the Guiding Principles for evaluation of concept alternatives. The Guiding Principles were developed by the TAC and provide the guidance and objectives along with design constraints for use in the development of the concept alternatives.
The goal of the conceptual design phase of the study was to develop concepts for cost-effective capacity improvements to elements of the I-494/I-35W interchange based on the prioritized operational deficiencies. The operational deficiencies are discussed with greater detail in a technical memorandum located in Appendix A and can be categorized within the I-494/I-35W interchange area under two categories: Lane capacity deficiencies and weaving segment deficiencies.
The lane capacity deficiencies occur on I-494 westbound, west of the interchange and on I-494 eastbound, between TH 100 and TH 77. Operational analysis suggests the need for auxiliary lanes on I-494 between France Avenue and southbound I-35W exit ramp for eastbound I-494 and the I-35W entrance ramp for westbound I-35W (these deficiencies were also identified in Mn/DOT’s 2007 Congestion Management Planning Study).
The numerous weaving segments within the existing interchange area are all subject to improvement, but the two highest priority weave segments, based on operational analysis, include the northbound I-35W loop ramp to westbound I-494 and the eastbound I-494 weave segment between Penn Avenue entrance ramp and southbound I-35W exit ramp.
Using the Guiding Principles and the results of the operational and safety deficiencies analysis, three alternative concepts were developed:
1. The existing 2001 FEIS Preferred alternative with the BRT station added.
2. A Three-Quad Cloverleaf interchange.
3. A Turbine Design interchange.

I-494/I-35W Interchange Preliminary Design Project MNTCO 107371 Minnesota Department of Transportation Page-10
All of the Alternative Concepts include the following design elements:
• BRT station at American Boulevard – after reviewing the potential impacts of the various BRT concepts (see Section 4.3), the BRT alternative located under the American Boulevard bridge was considered the “Worst Case” scenario in terms of its impact on the I-494/I-35W interchange. This location is the furthest north of all the BRT concepts and therefore pushes the I-35W corridor outward further north into the system interchange area having the most effect on all of the system interchange ramps.
• Managed HOV/HOT Lanes on I-35W – all concepts include a managed lane in each direction on I-35W.
• Basic Number of Lanes – the basic number of lanes was determined to include four through lanes on I-494 in each direction and two through lanes (plus the managed lane for a total of three lanes) on I-35W through the interchange area. The I-494 corridor includes a 26-foot median width designated for “future transportation use”, per the 2001 FEIS. The future transportation use could include various transit options for either bur or rail. In the concept level, the 26-foot median width was not maintained; however in the next level of design concept evaluation the 26-foot median width was incorporated.
• FEIS Access – access provisions provided within the 2001 FEIS Preferred Alternative were maintained in all of the alternative concepts. A second version of each alternative concept also reviewed the possibility of adding access from I-35W to American Boulevard creating a split-diamond interchange between American Boulevard and 82nd Street.
• Existing Infrastructure – it was assumed that the recent investments in the adjacent bridges and infrastructure (new interchanges at Penn Avenue and Lyndale Avenue, new bridges at American Boulevard and 76th Street) would be considered constraints for the design.
The alternative concepts are described below with the advantages and disadvantages associated with each following this section and are summarized in a table at the end of this section. Concept layouts of the interchange layouts shown at right and can also be found in Appendix C.
• Alternative Concept 1 – 2001 FEIS Preferred Alternative - The 2001 FEIS Preferred Alternative, but with modifications to the I-35W corridor to include a future BRT station (same for each concept). (See Figure C1 in Appendix C)
• Alternative Concept 2 – Three-Quad Cloverleaf - Alternative 2 maintained three loops within the system interchange in order to minimize construction costs (more loops means less bridges necessary to make the traffic movements). (See Figure C2 in Appendix C)
• Alternative Concept 3 – Turbine Interchange - Alternative 3 is a version of a turbine design system interchange that also includes one loop for the southbound I-35W to eastbound I-494 movement. The turbine design provides a reduction in construction costs by using more of the existing right-of-way to “spread out” the interchange and reduce the number of bridges needed. (See Figure C3 in Appendix C)
• Alternative Concept 1A – 2001 FEIS Preferred Alternative with BRT and Split Diamond - The same as Alternative 1 with the addition of a split diamond concept between American Boulevard and 82nd Street. The split diamond provides ramps to the north at American Boulevard and a one-way frontage road system between American Boulevard and 82nd Street with ramps to the south at 82nd Street.
• Alternative Concept 2A – Three-Quad Cloverleaf with Split Diamond - Same as Alternative 2, but includes the split diamond concept between American Boulevard and 82nd Street.
Figure 8 – Alternative Concept 1 - – 2001 FEIS
Preferred Alternative
Figure 9 – Alternative Concept 2 – Three-Quad
Cloverleaf Figure 10 – Alternative
Concept 3 – Turbine Interchange

I-494/I-35W Interchange Preliminary Design Project MNTCO 107371 Minnesota Department of Transportation Page-11
• Alternative Concept 3A – Turbine Interchange with Split Diamond – Same as Alternative 3 but includes the split diamond concept between American Boulevard and 82nd Street. (See Figure C5 in Appendix C).
4.2 Comparison of Alternatives 4.2.1 Alternative Concept 1– 2001 FEIS Preferred Alternative
Alternative Concept 1 is the original 2001 FEIS preferred alternative but also includes the BRT station concept at American Boulevard. This alternative provides operational benefits to the system by removing all weave segments associated with the existing cloverleaf design. The removal of the weave segments is accomplished by providing directional ramps that are on the third level of the interchange (I-35W is considered Level 1, I-494 and the local streets would be Level 2 and the directional ramps are Level 3).The attempt to minimize right-of-way impacts to all adjacent quadrants, causes the interchange to have to be built up to the third level.
While this type of configuration does minimize the right-of-way, it also has a greater cost associated with the necessary structural components (long, high bridges for each of the directional ramps). And the location of the directional ramps also causes complexity to the eventual construction of the interchange and difficulties in management of traffic during construction due to the need to construct the bridge over the entire interchange. In addition, the ability to phase the construction of this interchange is minimal. Because of the connectivity of all of the directional ramps, it would be impossible to only build certain elements of the design without having to build most of the interchange. Therefore, the cost of the initial phase of this alternative concept is prohibitive because of the improvements that would have to be built in that first phase.
4.2.2 Alternative Concept 2– Three-Quad Cloverleaf Alternative Concept 2 attempted to reduce the overall cost of the interchange by maintaining loops, that are less costly than directional ramps, and requiring less third level bridges. This alternative concept maintains loops in the southwest, southeast and northwest quadrants (giving it the name Three-Quad Cloverleaf). Maintaining the loops does mean that one weave section within the system interchange is maintained – the weave between the southbound I-35W entrance ramp to I-494 and the westbound I-494 to northbound I-35W exit ramp. To minimize the impacts on traffic operations due to this weave section, the weave is moved onto a collector-distributor ramp so the weaving does not impact the mainline of I-494. This is also beneficial for safety reasons due to a reduced speed differential between the lanes within the weave segment. The configuration of the loop in the northwest quadrant (westbound I-494 to southbound I-35W) eliminates the existing weave segment.
As shown by the operational analysis, the heaviest movement within the system interchange is the northbound I-35W to westbound I-494 in the AM peak and the reverse eastbound I-494 to southbound I-35W in the PM peak. The loop that accommodates the north to west movement is eliminated in Alternative Concepts and is replaced with the only third level directional ramp in the system interchange. The reduction in third-level structures decreases the overall cost of the interchange. In addition, the ability to implement an initial phase (the construction of just the north to west directional ramp) is more feasible and requires less additional construction of other interchange elements to accommodate the first phase.
The disadvantages associated with Alternative Concepts include additional right-of-way than the 2001 FEIS Preferred Alternative footprint in the three quadrants with loops. In addition, the loop ramps require lower designs speeds at a little over 25 miles per hour for a loop radius of 150-feet. One mitigation strategy considered for this lower design speed was to have sufficiently longer ramps to accommodate the need for deceleration and acceleration from the loops and to provide collector-distributor roadways when possible.
4.2.3 Alternative Concept 3– Turbine Interchange Alternative Concept 3 takes advantage of the right-of-way available due to the existing cloverleaf interchange. The Turbine design, a conventional solution for upgrading cloverleaf interchanges, allows for 40 mph ramps for three of the four movements. The southbound I-35W to westbound I-494 would remain a loop ramp in the southwest quadrant of the interchange. The main advantage of this type of system interchange configuration is the ability to lower the overall profile of the interchange – no third level structures are required. This configuration also removes all weave segments within the system interchange providing all of the operational benefits of the original 2001 FEIS Preferred Alternative.
The disadvantage associated with Alternative Concept 3 is the need for additional right-of-way beyond the footprint established in the 2001 FEIS Preferred Alternative in all four quadrants. The new right-of-way footprint requires additional strips of land along each of the four quadrants, and impacts commercial parking lots, but does not appear to require the acquisition of complete parcels. Mitigation measures may be required to meet parking code requirements at some locations.
An initial review of the ability to implement a first phase of Alternative Concept 3 was favorable, specifically that the initial phase does not require the construction of a third level structure. The longest and highest structure for this alternative would be over I-35W at the second level of the interchange.
4.2.4 Alternative Concepts 1A, 2A and 3A – Split Diamond between American Boulevard and 82nd Street A split diamond interchange was included between American Boulevard and 82nd Street in Alternative Concepts 1A, 2A and 3A. The City of Bloomington and the City of Richfield have invested in the development of local streets that make up a “box” around the I-494/I-35W system interchange including: Penn Avenue, American Boulevard, Lyndale Avenue and 76th/77th Street. The addition of the split diamond provided direct access to the “box” for traffic on I-35W to American Boulevard. The split diamond concept would provide more flexibility for the BRT station location since grade separation between the I-494 eastbound to I-35W southbound ramp and the American Boulevard ramp would be located north of American Boulevard, where the braiding of the ramps occurs between American Boulevard and 82nd Street in the first three concepts without the split diamond. The braided ramp would create a barrier between I-35W and the adjacent land on the west side, creating some challenges in provided pedestrian walkways and other BRT amenities. The one way local street system that would provide the connection between American Boulevard and 82nd Street would also maintain the existing access that adjacent parcels currently have onto the existing frontage road system along I-35W – the other Alternative Concepts would remove this access and the parcels would be provided access one block over on Knox Avenue on the west or Fremont Avenue on the east side of I-35W or other adjacent local streets.
The disadvantages of the split diamond concept included the traffic impact to the local street system. The change in access to I-35W would potentially remove significant amounts of traffic from 82nd Street to American Boulevard. A preliminary traffic analysis with Synchro/Simtraffic determined that it was not feasible to accommodate the left-turning traffic demands on the American Boulevard bridge deck with the addition of the two closely spaced intersections at the terminals of the ramps. Widening of the American Boulevard Bridge to accommodate a six-lane section with parallel left-turn lane would be required. There were also concerns over the feasibility of connecting the ramps to the existing American Boulevard bridge structurally and completing the one-way frontage road connections between American Boulevard and 82nd Street due to the grade issues south of American Boulevard.

I-494/I-35W Interchange Preliminary Design Project MNTCO 107371 Minnesota Department of Transportation Page-12
Table 5 – Interchange Concepts Advantages/Disadvantages Summary
Alternative 1 – FEIS Preferred Alternative Advantages Disadvantages • Within FEIS footprint (except for needed ROW in
southern quadrants to accommodate BRT) • Overall Costs
• Removes all existing weave segments within the system interchange
• Large Phase I investment
Alternative 2 – ThreeQuad Cloverleaf Advantages Disadvantages • Use of three loop ramps minimizes construction
cost of system interchange – minimizes number of level 3 structures
• Loop ramps have lower design speeds (a little over 25 mph for 150’ radius)
• Removes all weave sections within the system interchange from mainline (one remaining weave section – between SB to EB entrance ramp and EB to NB exit ramp – is on CD road)
• Requires additional ROW in three of the four quadrants
• Initial review suggests a lower Phase I investment than FEIS alternative
• Maintains one weave segment on CD road
• Ultimate construction cost significantly lower than FEIS alternative
Alternative 3 – Turbine Design System Interchange Advantages Disadvantages • Lowers overall profile of system interchange (no
Level 3 structures) • Requires additional ROW in all four
quadrants • Removes all existing weave segments within the
system interchange
• Initial review suggests a lower Phase I investment than FEIS alternative
• Conventional solution for cloverleaf interchanges • Provides higher speeds for three of the four
system movements (40 mph or more)
• Ultimate construction cost significantly lower than FEIS alternative
Split Diamond Concept between American Boulevard and 82nd Street Advantages Disadvantages • Provides more flexibility in BRT station design • Changes local traffic patterns • Emphasizes the “Box” by providing access directly to American Boulevard
• Impacts to private property. Proximity to buildings and parking impacts.
• Maintains local access for parcels adjacent to the freeway
• Construction Tie-in to American Boulevard bridge structure.
• Potential to remove significant amount of traffic from 82nd Street
• Insufficient storage for left-turn traffic on American Boulevard bridge deck.
4.3 Bus Rapid Transit (BRT) Station The inclusion of an in-line BRT station into the consideration of interchange alternatives at I-494/I-35W follows the current transit emphasis for the I-35W corridor. HOV/HOT lanes were established from Lakeville to downtown Minneapolis through the UPA improvements in 2009. The current on-going construction of the TH 62/ Crosstown Interchange project includes a new in-line BRT station at the 46th Street overpass on I-35W in Minneapolis.
The development of alternative concepts for a BRT station in the I-35W corridor south of the I-494 interchange started with the same concept as the 46th Street BRT station. Early concept layouts developed before this study were created by Mn/DOT with the geometrics of the 2001 FEIS interchange layout and positioned the BRT station at the 82nd Street interchange. Through discussions with the City of Bloomington the desired location of the new I-35W in-line BRT station would be moved closer to the American Boulevard overpass to better coordinate with a proposed future local bus transit operation on American Boulevard. The project objectives developed for this project, and previously stated, includes the follow with regards to the I-35W BRT station:
• Develop an alternative that incorporates the provisions of an in-line BRT station located at or between American Boulevard and 82nd Street.
In addition, concepts developed to accommodate this objective also included the additional feature of providing a park-and-ride facility that could also serve the proposed BRT station. Information provided by Met Transit indicated that a 500 stall park-and-ride facility would be adequate to serve the future needs of their transit system.
Several alternative concepts were identified with the desire to narrow the alternatives to a list of three viable concepts. Concept sketches of these various alternatives are illustrated in Figure E5 located in Appendix E. The initial list of concept alternatives included the following:
• 82nd St. In-Line 35W - Site A Park-and-Ride • 82nd St. In-Line 35W - Site B Park-and-Ride • American Blvd. In-Line 35W - Site C Park-and-Ride • American Blvd. In-Line 35W - Site D Park-and-Ride • Off-Line West of 35W - Site A or C Park-and-Ride • Off-Line 82nd St. Ramps - Site A Park-and-Ride • T (Bus) w/ Off-Line - Site D Transfer Facility • Site C BRT/Local Transfer Facility and Park-and-Ride • T (Ped) w/ In-line 35W (center crossover) - Site C Local Transfer Facility and Park-and-Ride • T (Ped) w/ In-line (center) 35W - Site C Local Transfer Facility and Park-and-Ride • T (Ped) w/ In-line (center offset) 35W - Site C Local Transfer Facility and Park-and-Ride
The evaluation of these concept alternatives included an initial evaluation based on a set of criteria developed through input from the TAC. The concepts were evaluated based on the impacts that each alternative was expected to generate and rated on a simple positive, neutral, and negative scale. Appendix E contains an evaluation matrix for the BRT concept alternative. The results of the rating from the evaluation provided the three alternative concepts to evaluate in more detail (highlighted yellow on the matrix). The three concepts identified in the evaluation process are described on the following page.

I-494/I-35W Interchange Preliminary Design Project MNTCO 107371 Minnesota Department of Transportation Page-13
Single Platform with Weave
The single platform alternative is the same concept as currently being constructed along I-35W at the 46th Street overpass. (See Figure E1 in Appendix E.) This concept provides one platform area in the median of I-35W with in-line BRT access for both northbound and southbound bus traffic. Bus movements are required to weave before and after the platform area to accommodate the entrance and exit from the bus on the right hand side. Consideration was given for left side door configured buses during the development of the original concept for the 46th Street BRT station, but was later eliminated as an option due to cost of purchasing new fleet of vehicles for this type of operation. The weaving movement for the buses would be controlled through a special traffic signal control system with barrier gates to avoid conflicts between northbound and southbound buses.
The layout of the single platform concept is positioned at the American Boulevard overpass bridge structure. Elevator and stairwell buildings would be positioned on the north and south sides of the American Boulevard bridge to provide pedestrian access from the bridge deck to the I-35W platform. Pedestrian drop-offs for westbound American Boulevard buses would use the elevator or stairs on the north side of American Boulevard to gain access to a walkway beneath the bridge, at ground elevation, to reach the I-35W platform area. Pedestrian movements across the American Boulevard bridge at deck level would be discouraged through a median fence (ornamental) for safety of the users. Pedestrian drop-offs for eastbound American Boulevard would gain access to the elevator and stairwell building from a short section of elevated skyway extending south from the American Boulevard bridge.
The American Boulevard bridge would be widened to accommodate the bus drop-off areas for eastbound and westbound traffic and maintain an adequate width for a pedestrian walkway along the bridge. Figure E2, located in Appendix E, illustrates the widening of the American Boulevard bridge.
The Single Platform with Weave concept alternative provides the most direct access and transfer efficiency between the I-35W BRT and pedestrian access from the American Boulevard corridor. Pedestrian access from the American Boulevard corridor would be provided through both bus drop-offs on the American Boulevard bridge and existing walkways east and west to potential park-and-ride facilities. Two locations along American Boulevard were identified as potential sites for a park-and-ride facility that would ultimately provide up to 500 parking stalls. A two-story parking ramp would accommodate the desired number of parking stalls for the sites identified. One of the sites is located immediately west of I-35W and adjacent to American Boulevard. Another potential site is located east of I-35W, along American Boulevard stretching to the Dupont Avenue intersection. See page 15 for an illustration of these park and ride sites.
Figure 11 – Single Platform with Weave
Figure 12 – Plan View
Figure 13 – Section View

I-494/I-35W Interchange Preliminary Design Project MNTCO 107371 Minnesota Department of Transportation Page-14
Dual Platform without Weave
The dual platform without weave alternative provides two platforms at the I-35W level for in-line access to BRT operations on I-35W. (See Figure E3 in Appendix E). This concept alternative positions the bus lanes inside of the platform and elevator/stairwell buildings to accommodate the right-side bus doors, eliminating the need for the weaving operations. The width of the bus lanes and platform areas is slightly wider than that of the Single Platform with Weave concept alternative. Due to the wider section and the location of the American Boulevard bridge piers the layout is not able to be positioned closer to the American Boulevard bridge than shown in Figure 3, located in Appendix E. Access to the platform area would be provided through an elevated skyway between the west side park-and-ride facility and the elevator/stairwell buildings, as shown on the layout of Figure E3, located in Appendix E. Pedestrian access from the American Boulevard corridor would enter the park-and-ride facility and then to the skyway. Details regarding the bus operations on American Boulevard and where the bus stops would be located provided challenges for this concept alternative.
Bus stops along American Boulevard could be positioned with the eastbound stop at the park-and-ride facility. A westbound bus stop presents the challenge with regards to where that stop would be located and where would pedestrian movements cross American Boulevard. Positioning a bus near the Knox Avenue intersection, with a traffic signal installed, would provide a safe crossing location. The distance from this bus stop location to the park-and-ride facility would introduce additional walking distance and time for users changing between the I-35W BRT and a local bus route.
An option for this alternative concept could be to maintain the American Boulevard bridge bus stop locations on the bridge deck and provide a skyway from the bridge south to the elevator/stairwell buildings. This would also include adding an overhead skyway on the American Boulevard bridge to provide access from the north side bus stop to the south side of the bridge and then continued access to the I-35W BRT platform.
The Dual Platform without Weave concept alternative would provide a slightly more efficient operation for the I-35W BRT, but would create additional transfer time for interaction with a local bus route on American Boulevard.
Figure 14 – Dual Platform without Weave
Figure 15 – Plan View
Figure 16 – Section View

I-494/I-35W Interchange Preliminary Design Project MNTCO 107371 Minnesota Department of Transportation Page-15
Offline T Concept The offline T concept is based on providing entrance and exit ramps in the median of I-35W and then an elevated crossing of the I-35W southbound lanes to a park-and-ride facility on to the west side of I-35W. Figure E4, located in Appendix E, illustrates this layout. The premise for this concept alternative is to centralize the transfer operations between I-35W BRT and the local bus system inside the park-and-ride facility. The space required for the bus movements and drop-off areas would likely require the use of the majority of one floor of the park-and-ride structure.
The median width required for this concept alternative is less than the Single or Dual Platform alternatives. The position of the ramps and elevated crossing of the southbound I-35W lanes is required to be centered between the American Boulevard overpass and the 82nd Street interchange to achieve the necessary height requirement for the crossing.
Access for the local bus traffic would use Knox Avenue and 81st Street to enter and exit the park-and-ride facility.
The Offline T Concept provides a high level of flexibility and efficiency for the user at the transfer points between the I-35W BRT and the local bus system. In addition, the local bus routes would have the ability to become BRT buses with access between to the I-35W corridor. A positive feature of this concept alternative is the ability to utilize the park-and-ride structure for a potential public-private partnership that could allow office space above the park-and-ride levels. A limitation for the concept involves introducing an increase in the travel time for the I-35W BRT bus routes to leave the I-35W corridor and enter the central facility.
The determination of which of these three alternative concepts would be considered for inclusion with the interchange layout was decided to be based on the impact the BRT layouts had on the interchange geometrics, considering the worst-case scenario to be conservative in the determination of impacts resulting from the overall interchange and BRT layout. The worst-case scenario approach led to the use of the Single Platform with Weave concept alternative. This BRT layout impacts the I-35W corridor the furthest north into the interchange geometry and therefore establishes the worst-case impact to the interchange.
All three BRT concept alternatives remain as viable options for the I-35W corridor and would be recommended for further evaluation in the next phases of the interchange design and development process.
Figure 17 – Offline T Concept
Figure 18 – Plan View
Figure 19 – Park and Ride Sites

I-494/I-35W Interchange Preliminary Design Project MNTCO 107371 Minnesota Department of Transportation Page-16
4.4 Water Resources The Preliminary Water Resources Technical Memorandum (TM) is included in this report as Appendix B. It describes the water resources impact, identifies feasible mitigation measures, and describes regulatory permitting and review required for the proposed Turbine Design - Phase 1 and for the Turbine Design - Ultimate interchange geometric design. Presently stormwater runoff from the project area is mostly untreated. Stormwater runoff from I-494 west of the existing interchange, the interchange itself, and I-35W from 76th Street to 90th Street, drains to Nine Mile Creek via Upper Penn Lake and Lower Penn Lake. North of 76th Street, I-35W in the project limits drains to Wood Lake. Runoff from I-494 east of the interchange is directed east, and enters the Minnesota River east of 34th Avenue. The Water Resources TM focus includes: • Reviewing existing stormwater plans and studies • Summarizing input from stakeholders • Estimating required stormwater treatment volumes for two of the geometric layouts to meet current
stormwater regulations • Describing a stormwater management approach • Considering whether adequate right of way is available for stormwater treatment devices • Discussing anticipated permits and approvals • Reviewing potential conflicts with public utilities and associated resolution for each of the
geometric layouts.
5.0 Future Year Analysis The years 2020 and 2040 were chosen as the future analysis years for this project. The 2040 forecast year was analyzed as the ultimate build condition; this relates to the previous 2001 FEIS analysis which used an ultimate build forecast year of 2037. Only two alternatives were modeled in 2040, the original 2001 FEIS Preferred Alternative and the new Turbine Design concept.
For the forecast year 2020, the year of opening analysis, only the phased improvements from the preferred 2040 concepts were analyzed. The phasing analysis includes improving two major movements at the interchange.
5.1 Traffic Forecasts The forecasts used in this analysis are based mainly from the I-494 & TH 77 Corridor Forecasting and Concept Development Study, completed in 2008. This was supplemented by the TH 169/I-494 Interchange Reconstruction Study that was completed in 2009.
The I-494 & TH 77 study provided a 2020 No Build and 2030 Build forecast for much of the study area. This study analysis included I-494 from TH 100 to TH 5, I-35W from TH 62 to 90th Street and TH 77 from TH 62 to Old Shakopee Road.
The TH 169/I-494 study provided 2030 No Build and Build forecasts for the remaining portion of the I-494/I-35W interchange study area; it included I-494 from Valley View Road to France Avenue.
This analysis includes 2020 and 2040 forecast years. Therefore, the forecasts from the two previously completed studies needed to be balanced accordingly in order to obtain a good working volume set for this analysis.
For the 2020 forecasts, the I-494 & TH 77 forecast were used as a starting point and the 2030 TH 169 forecasts were factored down and incorporated into the final forecasts.
For the 2040 analysis year, both the 2030 forecasts were balanced and then factored up to 2040 based on the regional travel demand models growth from 2020 to 2030, the final product was a 4% increase in travel demands.
Appendix F contains a set of figures that show the 2020 and 2040 forecasts for the interchange study area. The 2020 forecasts are shown on the existing geometric configuration while the 2040 forecasts are shown based on the 2001 FEIS geometric configuration.
5.2 5.2 2040 Operations Due to the current congestion on the corridor and the forecast year being 30 years away, a No Build 2040 scenario was not analyzed. This was done because it was thought the congestion that far in the future, with no improvements to the corridor, would yield no relevant information for making project decisions. Therefore, for the 2040 forecast year, only the two build scenarios were received to confirm that operational differences between the two were minimal.
With new forecast volumes, it was determined that some of the previous design features for the 2001 FEIS Preferred Alternative will not operate at acceptable levels. Therefore two scenarios were created, one being the base model which has the same geometric design and number of lanes as the 2001 FEIS Preferred Alterntative and the second being a mitigation version that incorporates more capacity where needed in order to compare the concepts with full demand volumes.
5.2.1 Bottlenecks Outside Study Interchange Analyzing the base 2001 FEIS number of lanes with the updated 2040 forecast volume demands yields some major bottlenecks on the I-494 and I-35W corridor. This section will go over areas of concern that are apparent in both the 2001 FEIS analysis and the Turbine Design concept analysis. These bottlenecks are outside of the study interchange area.
5.2.1.1 5.2.1.1 Eastbound I-494 The first major bottleneck on I-494 occurs between TH 169 and TH 100. In the morning peak hour the traffic volumes fully consume the mainline capacity. Major weaving and heavy entrance and exit volumes between the two interchanges add to the traffic congestion and result in speeds around 30 mph.
The next major bottleneck occurs between I-35W and TH 77. In the afternoon peak hours, this bottleneck created major congestion upstream with speeds below 10 mph. Modeling showed that an additional auxiliary lane was needed to help the weaving vehicles between the two system interchanges and the two service interchanges.
5.2.1.2 5.2.1.2 Westbound I-494 Congestion on southbound I-35W between 82nd Street and 90th Street spilled back across the system movements and created major congestion for westbound I-494 in the PM peak period. This bottleneck caused speeds of 10 mph or less as far back as the river bridge along I-494. The model was then modified so that the southbound I-35W bottleneck was improved. This resulted in better traffic flow westbound on I-494 and caused another bottleneck west of I-35W at TH 100. The bottleneck at TH 100 was a combination of improved traffic flow at I-35W and forecasted volumes in the corridor.
The forecast volumes between TH 100 and US 169 are much greater than the capacity of the planned roadway; this added to a major bottleneck at TH 100. Modeling showed that a full auxiliary lane from France Avenue to US 169 was needed to help mitigate congestion.

I-494/I-35W Interchange Preliminary Design Project MNTCO 107371 Minnesota Department of Transportation Page-17
5.2.1.3 Northbound I-35W Northbound I-35W had no bottlenecks and operated at acceptable levels of service.
5.2.1.4 Southbound I-35W In the afternoon peak hour, southbound I-35W has a major bottleneck south of 82nd Street. This creates major congestion along I-35W and spills back onto I-494 creating major safety and operational problems along that corridor as well. Continuing four southbound lanes beyond the 90th Street exit ramp relieves congestion and would no longer create spills back onto I-494.
5.2.1.5 TH 77 With the new forecast demand on the TH 77 river bridge, a fourth lane will be needed for both northbound and southbound TH 77.
5.2.2 2001 FEIS and Turbine Concept Comparison Both 2040 Design options process the traffic volume demands well. The analysis includes some minor differences in the traffic operations of the two alternatives. However, both options are viable based solely on traffic operations.
5.2.2.1 I-494 Operations for both the 2001 FEIS and the Turbine concepts are very similar along mainline I-494 at the study interchange. The only difference for mainline I-494 between the concepts is the eastbound Lyndale Avenue exit ramp and the westbound Penn Avenue exit ramp are accessed from collector-distributor roads in the 2001 FEIS Preferred Alternative and from the mainline in the Turbine Design concept.
The AM peak hour experiences little congestion under either scenarios; the PM peak hour has spot congestion that is the same in both concepts.
Eastbound I-494 has some spot congestion at the I-35W exit ramp in both concepts in the PM peak hour from traffic weaving between France Avenue, Penn Avenue and the I-35W exit. Maintaining the Lyndale Avenue exit ramp on the mainline has no impact on traffic operations for eastbound I-494.
In the PM peak hour, westbound I-494 also experiences spot congestion at the I-35W exit ramp under both concepts. The weaving and heavy volume demands from Portland Avenue, Lyndale Avenue, and the I-35W exit are the main culprits of the congestion. Keeping the Penn Avenue exit ramp on the mainline has no impact on traffic operations for westbound I-494.
The tables below show the eastbound and westbound I-494 operations at the study interchange.
Table 6 - 2040 Eastbound I-494 Interchange Operations
2001 FEIS CONCEPT AM Peak Hour PM Peak Hour
Location Link Statistics Link Statistics
From To Speed
(mph) Density(vplpm) LOS Speed
(mph) Density(vplpm) LOS
Eas
tbou
nd I-
494
NB/SB TH 100 Combined Ent. 58 25 C 59 24 C
France Ave. Exit 60 23 C 61 23 C
France Ave. Exit SB France Ave. Entrance Loop 61 20 C 61 21 C
SB France Ave. Entrance Loop NB France Ave. Ent. 60 21 C 49 30 D
NB France Ave. Ent. 56 21 C 41 35 E
Penn Ave. Exit 55 22 C 46 30 D
Penn Ave. Exit I-35W CD Rd/Lyndale Exit 58 22 C 56 27 C
I-35W CD Rd/Lyndale Exit 61 19 B 61 25 C
61 19 B 61 25 C
Penn Ave. Ent. 61 20 B 60 25 C
Penn Ave. Ent. 59 21 C 54 29 D
61 22 C 60 29 D
NB/SB I-35W Combined Ent. 61 22 C 60 29 D
NB/SB I-35W Combined Ent. Lyndale Ave. Ent. 58 22 C 59 26 C
Lyndale Ave. Ent. 60 21 C 58 28 C
Portland Ave. Exit 61 20 B 60 26 C
TURBINE CONCEPT AM Peak Hour PM Peak Hour
Location Link Statistics Link Statistics
From To Speed
(mph) Density(vplpm) LOS Speed
(mph) Density(vplpm) LOS
Eas
tbou
nd I-
494
NB/SB TH 100 Combined Ent. 57 25 C 59 24 C
France Ave. Exit 60 23 C 61 23 C
France Ave. Exit SB France Ave. Entrance Loop 61 20 C 61 21 C
SB France Ave. Entrance Loop NB France Ave. Ent. 60 21 C 48 31 D
NB France Ave. Ent. 57 21 C 41 37 E
Penn Ave. Exit 55 21 C 46 30 D
Penn Ave. Exit I-35W CD Rd 59 22 C 57 27 C
I-35W CD Rd 61 22 C 60 28 D
61 23 C 60 28 D
Penn Ave. Ent. 60 23 C 59 28 D
Penn Ave. Ent. Lyndale Ave. Exit 60 20 C 57 26 C
Lyndale Ave. Exit 61 22 C 60 29 D
NB/SB I-35W Combined Ent. 61 22 C 60 29 D
NB/SB I-35W Combined Ent. Lyndale Ave. Ent. 59 22 C 59 26 C
Lyndale Ave. Ent. 60 20 C 59 27 C
Portland Ave. Exit 61 19 B 60 26 C

I-494/I-35W Interchange Preliminary Design Project MNTCO 107371 Minnesota Department of Transportation Page-18
Table 7 - 2040 Westbound I-494 Interchange Operations 2001 FEIS CONCEPT AM Peak Hour PM Peak Hour
Location Link Statistics Link Statistics
From To Speed
(mph) Density (vplpm) LOS Speed
(mph) Density(vplpm) LOS
Wes
tbou
nd I-
494
Portland Ave. Exit 58 26 C 39 54 F
57 27 C 37 55 F Portland Ave. Ent. 53 29 D 36 54 F Portland Ave. Ent. Lyndale Ave Exit 53 26 C 42 41 E Lyndale Ave Exit 58 24 C 54 34 D WB I-494/I-35W CD Rd Exit 60 24 C 58 31 D WB I-494/I-35W CD Rd Exit 62 21 C 61 27 C Lyndale Ave Ent. 62 21 C 60 27 C Lyndale Ave Ent. 58 21 C 54 30 D 61 23 C 58 32 D
61 23 C 59 31 D
61 23 C 60 31 D
WB I-494/I-35W CD Rd Ent. 61 23 C 59 31 D
WB I-494/I-35W CD Rd Ent. Penn Ave. Ent. 57 24 C 51 35 E
Penn Ave. Ent. 50 27 C 43 40 E
France Ave. Exit 57 25 C 55 33 D
TURBINE CONCEPT AM Peak Hour PM Peak Hour
Location Link Statistics Link Statistics
From To Speed
(mph) Density (vplpm) LOS Speed
(mph) Density(vplpm) LOS
Wes
tbou
nd I-
494
Portland Ave. Exit 59 26 C 45 45 F 58 27 C 41 49 F Portland Ave. Ent. 54 28 D 38 50 F Portland Ave. Ent. Lyndale Ave Exit 53 26 C 43 40 E Lyndale Ave Exit 59 24 C 55 33 D
WB I-494/I-35W CD Rd Exit 61 23 C 59 31 D
WB I-494/I-35W CD Rd Exit 61 25 C 60 31 D Lyndale Ave Ent. 61 25 C 59 31 D Lyndale Ave Ent. 59 22 C 57 30 D 61 21 C 58 29 D Penn Ave. Exit 60 22 C 59 29 D Penn Ave. Exit 61 23 C 60 31 D WB I-494/I-35W CD Rd Ent. 61 23 C 59 31 D WB I-494/I-35W CD Rd Ent. Penn Ave. Ent. 58 24 C 48 37 E Penn Ave. Ent. 50 26 C 42 41 E France Ave. Exit 57 25 C 54 34 D
5.2.2.2 I-35W The only difference between the two concepts for mainline I-35W is that the northbound entrance ramps from I-494 are split in the 2001 FEIS and they are combined with one entrance in the Turbine concept.
Northbound I-35W operates at near posted speeds during both peak hours under both concepts. Southbound I-35W experiences some spot congestion that is identical between the two concepts.
The tables below represent the operations of the interchange study area along I-35W.
Table 8 - 2040 – Northbound I-35W Interchange Operations 2001 FEIS CONCEPT AM Peak Hour PM Peak Hour
Location Link Statistics Link Statistics
From To Speed
(mph) Density(vplpm) LOS Speed
(mph) Density(vplpm) LOS
Nor
thbo
und
I-35W
82nd St Exit 60 23 C 60 23 C
62 23 C 61 23 C NB 35W/494 CD Rd Exit 62 23 C 61 23 C NB 35W/494 CD Rd Exit 65 17 B 66 13 B 66 17 B 66 13 B 82nd St Ent. 63 18 B 62 14 B 82nd St Ent. EB I-494 Ent. 59 19 B 55 20 C EB I-494 Ent. 62 18 B 62 18 B WB I-494 Ent. 64 17 B 64 17 B WB I-494 Ent. 76th St Ent. 63 19 B 60 22 C
76th St Ent. 56 22 C 50 29 D
TURBINE CONCEPT AM Peak Hour PM Peak Hour
Location Link Statistics Link Statistics
From To Speed
(mph) Density(vplpm) LOS Speed
(mph) Density(vplpm) LOS
Nor
thbo
und
I-35W 82nd St Exit 61 23 C 60 23 C
62 23 C 61 23 C
NB 35W/494 CD Rd Exit 62 23 C 61 23 C
NB 35W/494 CD Rd Exit 65 17 B 66 13 B
66 17 B 66 13 B
82nd St Ent. 63 18 B 62 14 B 82nd St Ent. 59 20 B 55 20 C 64 19 B 63 18 B I-494 Ent. 65 19 B 64 18 B I-494 Ent. 76th St Ent. 64 18 B 61 21 C
76th St Ent. 55 23 C 50 29 D
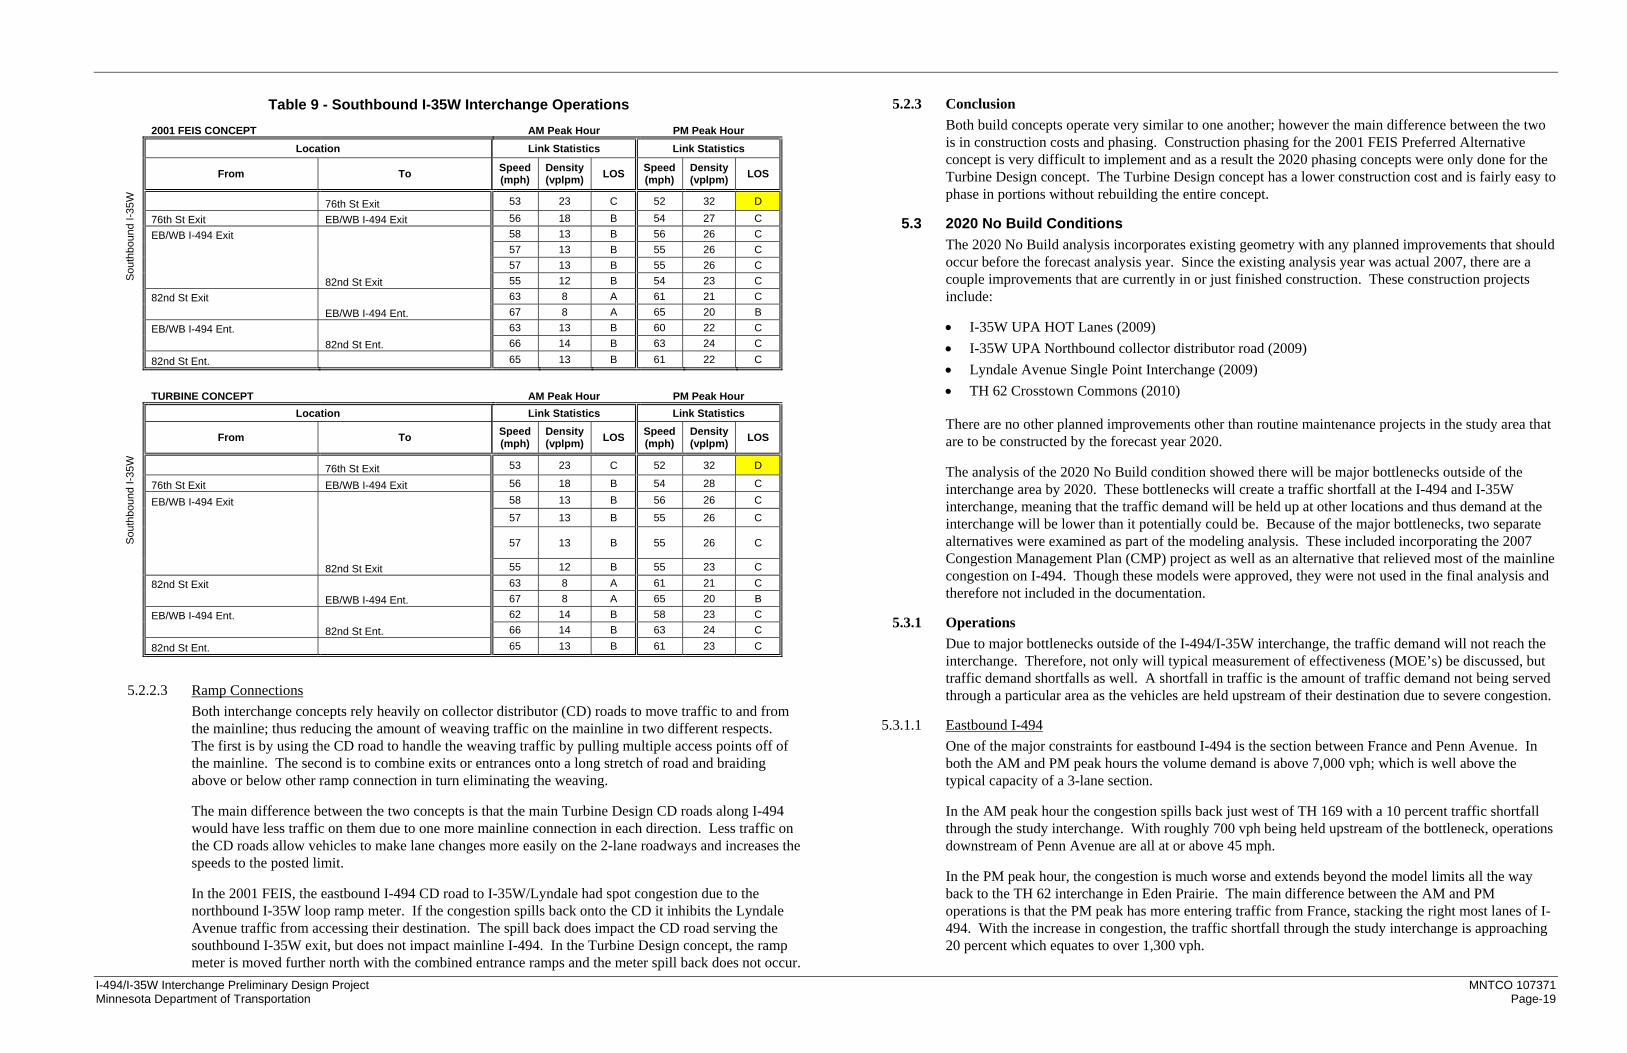
I-494/I-35W Interchange Preliminary Design Project MNTCO 107371 Minnesota Department of Transportation Page-19
Table 9 - Southbound I-35W Interchange Operations 2001 FEIS CONCEPT AM Peak Hour PM Peak Hour
Location Link Statistics Link Statistics
From To Speed
(mph) Density (vplpm) LOS Speed
(mph) Density(vplpm) LOS
Sou
thbo
und
I-35W
76th St Exit 53 23 C 52 32 D
76th St Exit EB/WB I-494 Exit 56 18 B 54 27 C EB/WB I-494 Exit 58 13 B 56 26 C 57 13 B 55 26 C 57 13 B 55 26 C 82nd St Exit 55 12 B 54 23 C 82nd St Exit 63 8 A 61 21 C EB/WB I-494 Ent. 67 8 A 65 20 B EB/WB I-494 Ent. 63 13 B 60 22 C 82nd St Ent. 66 14 B 63 24 C
82nd St Ent. 65 13 B 61 22 C
TURBINE CONCEPT AM Peak Hour PM Peak Hour
Location Link Statistics Link Statistics
From To Speed
(mph) Density (vplpm) LOS Speed
(mph) Density(vplpm) LOS
Sou
thbo
und
I-35W 76th St Exit 53 23 C 52 32 D
76th St Exit EB/WB I-494 Exit 56 18 B 54 28 C
EB/WB I-494 Exit 58 13 B 56 26 C
57 13 B 55 26 C
57 13 B 55 26 C
82nd St Exit 55 12 B 55 23 C 82nd St Exit 63 8 A 61 21 C EB/WB I-494 Ent. 67 8 A 65 20 B EB/WB I-494 Ent. 62 14 B 58 23 C 82nd St Ent. 66 14 B 63 24 C
82nd St Ent. 65 13 B 61 23 C
5.2.2.3 Ramp Connections Both interchange concepts rely heavily on collector distributor (CD) roads to move traffic to and from the mainline; thus reducing the amount of weaving traffic on the mainline in two different respects. The first is by using the CD road to handle the weaving traffic by pulling multiple access points off of the mainline. The second is to combine exits or entrances onto a long stretch of road and braiding above or below other ramp connection in turn eliminating the weaving.
The main difference between the two concepts is that the main Turbine Design CD roads along I-494 would have less traffic on them due to one more mainline connection in each direction. Less traffic on the CD roads allow vehicles to make lane changes more easily on the 2-lane roadways and increases the speeds to the posted limit.
In the 2001 FEIS, the eastbound I-494 CD road to I-35W/Lyndale had spot congestion due to the northbound I-35W loop ramp meter. If the congestion spills back onto the CD it inhibits the Lyndale Avenue traffic from accessing their destination. The spill back does impact the CD road serving the southbound I-35W exit, but does not impact mainline I-494. In the Turbine Design concept, the ramp meter is moved further north with the combined entrance ramps and the meter spill back does not occur.
5.2.3 Conclusion Both build concepts operate very similar to one another; however the main difference between the two is in construction costs and phasing. Construction phasing for the 2001 FEIS Preferred Alternative concept is very difficult to implement and as a result the 2020 phasing concepts were only done for the Turbine Design concept. The Turbine Design concept has a lower construction cost and is fairly easy to phase in portions without rebuilding the entire concept.
5.3 2020 No Build Conditions The 2020 No Build analysis incorporates existing geometry with any planned improvements that should occur before the forecast analysis year. Since the existing analysis year was actual 2007, there are a couple improvements that are currently in or just finished construction. These construction projects include:
• I-35W UPA HOT Lanes (2009) • I-35W UPA Northbound collector distributor road (2009) • Lyndale Avenue Single Point Interchange (2009) • TH 62 Crosstown Commons (2010)
There are no other planned improvements other than routine maintenance projects in the study area that are to be constructed by the forecast year 2020.
The analysis of the 2020 No Build condition showed there will be major bottlenecks outside of the interchange area by 2020. These bottlenecks will create a traffic shortfall at the I-494 and I-35W interchange, meaning that the traffic demand will be held up at other locations and thus demand at the interchange will be lower than it potentially could be. Because of the major bottlenecks, two separate alternatives were examined as part of the modeling analysis. These included incorporating the 2007 Congestion Management Plan (CMP) project as well as an alternative that relieved most of the mainline congestion on I-494. Though these models were approved, they were not used in the final analysis and therefore not included in the documentation.
5.3.1 Operations Due to major bottlenecks outside of the I-494/I-35W interchange, the traffic demand will not reach the interchange. Therefore, not only will typical measurement of effectiveness (MOE’s) be discussed, but traffic demand shortfalls as well. A shortfall in traffic is the amount of traffic demand not being served through a particular area as the vehicles are held upstream of their destination due to severe congestion.
5.3.1.1 Eastbound I-494 One of the major constraints for eastbound I-494 is the section between France and Penn Avenue. In both the AM and PM peak hours the volume demand is above 7,000 vph; which is well above the typical capacity of a 3-lane section.
In the AM peak hour the congestion spills back just west of TH 169 with a 10 percent traffic shortfall through the study interchange. With roughly 700 vph being held upstream of the bottleneck, operations downstream of Penn Avenue are all at or above 45 mph.
In the PM peak hour, the congestion is much worse and extends beyond the model limits all the way back to the TH 62 interchange in Eden Prairie. The main difference between the AM and PM operations is that the PM peak has more entering traffic from France, stacking the right most lanes of I-494. With the increase in congestion, the traffic shortfall through the study interchange is approaching 20 percent which equates to over 1,300 vph.

I-494/I-35W Interchange Preliminary Design Project MNTCO 107371 Minnesota Department of Transportation Page-20
Even with such a large decrease in traffic served, another bottleneck emerges at TH 77 in the PM peak hour. At 12th Avenue nearly 1,300 vph enter eastbound I-494 and the southbound TH 77 exits 2,400 vph. These two heavy movements create a major weaving problem since the ramp spacing distance is only 950 feet. The congestion results in traffic speeds being slower all the way back to Lyndale Avenue; however if all of the demand was being served from the France-Penn area, this weaving problem would be much worse.
Table 10 - 2020 No Build – Eastbound I-494 AM Peak Hour PM Peak Hour
Location Link Statistics Link Statistics
From To Speed (mph)
Density (vplpm) LOS Speed
(mph) Density(vplpm) LOS
NB TH 169 Entrance Ramp 22 79 F 7 131 F 21 76 F 8 126 F 21 70 F 8 114 F 24 63 F 10 100 F East Bush Lake Road Exit Ramp 28 54 F 11 89 F East Bush Lake Road Exit Ramp 28 62 F 11 111 F
East Bush Lake Road Entrance Ramp 27 64 F 11 112 F
East Bush Lake Road Entrance Ramp SB TH 100 Exit Ramp 26 55 F 11 98 F
SB TH 100 Exit Ramp SB TH 100 Entrance Loop 31 52 F 11 99 F SB TH 100 Entrance Loop NB TH 100 Exit Loop 26 53 F 11 94 F NB TH 100 Exit Loop NB TH 100 Entrance Ramp 34 45 F 16 73 F NB TH 100 Entrance Ramp 40 38 E 16 72 F France Ave. Exit Ramp 39 42 E 15 80 F France Ave. Exit Ramp SB France Ave. Entrance Loop 35 52 F 14 103 F SB France Ave. Entrance Loop NB France Ave. Entrance Ramp 37 48 F 20 78 F NB France Ave. Entrance Ramp 43 44 F 33 54 F Penn Ave. Exit Ramp 50 39 E 49 38 E Penn Ave. Exit Ramp 55 34 D 57 31 D Penn Ave. Entrance Ramp 51 38 E 53 33 D Penn Ave. Entrance Ramp SB I-35W Exit Ramp 53 27 C 55 23 C SB I-35W Exit Ramp SB I-35W Entrance Loop 52 28 D 56 24 C SB I-35W Entrance Loop NB I-35W Exit Loop 46 26 C 54 19 B NB I-35W Exit Loop NB I-35W Entrance Ramp 47 33 D 55 24 C NB I-35W Entrance Ramp Lyndale Ave. Exit Ramp 47 28 D 55 22 C Lyndale Ave. Exit Ramp Lyndale Ave. Entrance Ramp 48 36 E 50 32 D Lyndale Ave. Entrance Ramp Nicollet Ave. Exit Ramp 45 34 D 37 41 E Nicollet Ave. Exit Ramp 49 40 E 50 40 E Nicollet Ave. Entrance Ramp 47 42 E 51 39 E Nicollet Ave. Entrance Ramp Portland Ave. Exit Ramp 47 36 E 47 38 E Portland Ave. Exit Ramp 56 35 D 48 44 F 58 33 D 42 51 F 58 33 D 36 57 F 12th Ave. Entrance Ramp 56 35 D 38 52 F 12th Ave. Entrance Ramp SB TH 77 Exit Ramp 54 24 C 49 30 D SB TH 77 Exit Ramp SB TH 77 Entrance Loop 56 32 D 57 30 D
5.3.1.2 Westbound I-494 There are two major constraints for westbound I-494. The first constraint is the area between 12th Avenue and Nicollet Avenue which has high weaving volumes, mainline capacity issues and a mainline lane drop. The second occurs in the existing condition which is the I-35W to France Avenue area which has high weaving volumes and mainline capacity issues.
The main congestion point between TH 77 and Nicollet Avenue holds back over 20 percent of the traffic demand traveling through the area. In the AM peak the shortfall is 1,300 vph and it climbs up to almost 1,600 vph in the PM peak. The heavy weaving volumes between TH 77 and 12th Avenue, the short weaving distance between Portland and Nicollet Avenues and mainline capacity constraints all contribute to the problem.
At the study interchange, congestion occurs even with a 10 to 15 percent shortfall in traffic being served through the area. There are many issues that occur in this area including short weaving distances with high weaving volumes and mainline capacity constraints. In the AM congestion is slightly worse due to the heavy entrance volume from northbound I-35W and higher mainline volumes through the area.
Table 11 - 2020 No Build – Westbound I-494 AM Peak Hour PM Peak Hour
Location Link Statistics Link Statistics
From To Speed (mph)
Density(vplpm) LOS Speed
(mph) Density(vplpm) LOS
NB TH 77 HOV Entrance Loop SB TH 77 Exit Loop 20 55 F 19 66 F
SB TH 77 Exit Loop NB/SB TH 77 Entrance Ramp 18 78 F 16 90 F NB/SB TH 77 Entrance Ramp 12th Ave. Exit Ramp 15 95 F 15 96 F 12th Ave. Exit Ramp 12 108 F 13 102 F 17 77 F 19 70 F 23 74 F 27 64 F Portland Ave. Entrance Ramp 25 71 F 29 61 F Portland Ave. Entrance Ramp Nicollet Ave. Exit Ramp 34 47 F 37 44 F Nicollet Ave. Exit Ramp 47 38 E 50 37 E Nicollet Ave. Entrance Ramp 53 34 D 53 34 D Nicollet Ave. Entrance Ramp Lyndale Ave Exit Ramp 56 26 C 57 25 C Lyndale Ave Exit Ramp Lyndale Ave Entrance Ramp 59 28 C 58 28 D Lyndale Ave Entrance Ramp NB I-35W Exit Ramp 57 21 C 56 22 C NB I-35W Exit Ramp NB I-35W Entrance Loop 52 28 D 53 26 C NB I-35W Entrance Loop SB I-35W Exit Loop 28 50 F 43 31 D SB I-35W Exit Loop SB I-35W Entrance Ramp 31 57 F 41 40 E SB I-35W Entrance Ramp Penn Ave. Exit Ramp 42 40 E 44 36 E Penn Ave. Exit Ramp 49 43 F 45 43 E Penn Ave. Entrance Ramp 43 50 F 33 57 F
Penn Ave. Entrance Ramp 42 48 F 37 51 F
France Ave. Exit Ramp 53 38 E 52 36 E France Ave. Exit Ramp NB France Ave. Entrance Loop 59 30 D 57 30 D NB France Ave. Entrance Loop SB France Ave. Entrance Ramp 56 31 D 49 37 E SB France Ave. Entrance Ramp 60 25 C 57 29 D 62 24 C 58 29 D
NB TH 100 Exit Ramp 63 24 C 59 28 D
5.3.1.3 Northbound I-35W Along northbound I-35W there is only one main constraint on the system. That is the northeast exit loop ramp to westbound I-494, the AM and PM peak hour volume demands are 1,350 and 1,250 vph

I-494/I-35W Interchange Preliminary Design Project MNTCO 107371 Minnesota Department of Transportation Page-21
respectively. These volumes are near capacity of a 25 mph loop ramp; however with the congestion along I-494 the traffic has a tough merge and spills back along the ramp and onto I-35W.
In the AM peak hour the spill back extends from I-494, around the loop and through the newly constructed CD road. Traffic then stacks in the right lanes all the way back to the 82nd Street exit ramp. This creates a big safety issue along I-35W with high speed differentials between lanes.
The PM peak hour operates with free flow conditions.
Table 12 - 2020 No Build – Northbound I-35W AM Peak Hour PM Peak Hour
Location Link Statistics Link Statistics
From To Speed (mph)
Density (vplpm) LOS Speed
(mph) Density(vplpm) LOS
Begin Northbound I-35W 54 35 D 60 26 C
60 31 D 65 24 C 90th St Entrance Ramp 60 32 D 65 24 C 90th St Entrance Ramp 56 30 D 64 20 C 49 38 E 65 20 B 82nd St Exit Ramp 41 43 E 65 19 B 82nd St Exit Ramp 33 48 F 65 18 B 82nd St Entrance Ramp 34 42 E 64 18 B 82nd St Entrance Ramp EB I-494 Exit Ramp 33 36 E 57 19 B EB I-494 Exit Ramp CD Rd Exit Ramp 31 40 E 59 20 B CD Rd Exit Ramp CD RD Entrance Ramp 61 18 B 65 18 B CD RD Entrance Ramp WB I-494 Entrance Ramp 59 18 B 61 18 B WB I-494 Entrance Ramp 76th St Entrance Ramp 61 19 B 57 23 C 76th St Entrance Ramp 59 23 C 55 30 D 63 24 C 61 29 D 62 24 C 61 29 D 66th St Exit Ramp 62 23 C 61 27 C 66th St Exit Ramp 65 19 B 64 25 C
End Northbound I-35W 65 18 B 64 25 C
5.3.1.1 Southbound I-35W
The AM peak hour for southbound I-35W operates at or above the posted speed limit. The PM peak hour has a capacity constraint that creates poor operations for the entire study area.
The volume demand between the 82nd Street and 90th Street interchanges is right at the typical capacity of a 3-lane section, the PM peak hour volume is 6,600 vph. The weaving between the two interchanges and the left most lane being an HOV lane are the two main factors that reduce the capacity of the section and create a major bottleneck. The HOT/MnPASS lane will not operate at the full capacity of a typical normal freeway lane, this reduces the overall capacity of southbound I-35W and creates the bottleneck.
The congestion along southbound I-35W spills upstream to the end of our model limits which would then impact the TH 62/I-35W cross-town commons area.
Table 13 - 2020 No Build – Southbound I-35W AM Peak Hour PM Peak Hour
Location Link Statistics Link Statistics
From To Speed (mph)
Density(vplpm) LOS Speed
(mph) Density(vplpm) LOS
Begin Southbound I-35W 56 24 C 20 86 F 66th St Entrance Ramp 57 23 C 16 98 F 66th St Entrance Ramp 54 24 C 19 90 F
55 26 C 20 91 F 53 27 C 22 85 F 76th St Exit Ramp 50 27 C 24 75 F 76th St Exit Ramp WB I-494 Exit Ramp 54 21 C 20 81 F WB I-494 Exit Ramp WB I-494 Entrance Loop 57 17 B 14 107 F WB I-494 Entrance Loop EB I-494 Exit Loop 51 17 B 13 97 F EB I-494 Exit Loop EB I-494 Entrance Ramp 56 16 B 13 114 F EB I-494 Entrance Ramp 82nd St Exit Ramp 58 17 B 16 85 F 82nd St Exit Ramp 63 17 B 18 95 F
82nd St Entrance Ramp 64 17 B 19 90 F 82nd St Entrance Ramp 59 18 B 29 61 F 63 19 B 44 45 F 90th St Exit Ramp 64 18 B 52 35 E 90th St Exit Ramp 65 17 B 59 32 D 65 17 B 60 31 D
End Southbound I-35W 65 17 B 61 31 D
5.3.1.2 TH 77 Northbound and southbound TH 77 are impacted in the 2020 forecast year as well. The first constraint occurs at the Minnesota River Bridge, in the AM peak hour the northbound demand is over capacity and in the PM peak hour the southbound demand is over capacity.
An issue of more concern is the spill back from westbound I-494 to the TH 77 entrance ramp and sequentially back onto TH 77 in both directions. In the AM peak hour only northbound TH 77 is impacted. However in the PM peak hour both northbound and southbound TH 77 experience heavy levels of congestion due to I-494 problems.
5.4 2020 Build Phased Conditions With the 2040 recommended alternative being scaled back from the original 2001 FEIS Preferred Alternative to the Turbine Design option, the cost of construction can be reduced by phasing in portions of the interchange over time. The year 2020 analysis looked at the initial phasing plan in order to fix the most deficient movements.
Based on the 2020 No Build analysis, combined with the existing geometric deficiencies from the system plan, it was determined that the northbound I-35W to westbound I-494 is the most critical movement at the interchange; the second most critical is the eastbound I-494 to southbound I-35W movement.
There are three scenarios that were analyzed in the 2020 Build operations analysis. Phase 1A includes both the north to west and east to south improvements, with no BRT improvements. Phase 1B includes both the north to west and east to south improvements with the BRT improvements. The BRT station and associated improvements adds ramp braiding between the south I-494 ramps and the north 82nd Street ramps. The last scenario analyzed was Phase 1; this includes only the north to west improvements without the BRT improvements. Phase 1 is the recommended build scenario.

I-494/I-35W Interchange Preliminary Design Project MNTCO 107371 Minnesota Department of Transportation Page-22
5.4.1 Northbound to Westbound The phased improvement for this movement involves removing three short weaving segments along I-494; The BRT portion along I-35W would remove two additional short weaving segments. The northeast loop ramp is removed from the current cloverleaf interchange and replaced with a turbine (low level flyover type ramp) movement from northbound I-35W to westbound I-494.
The new ramp removes the loop ramp weaving sections involved for the movement from I-35W northbound to I-494 westbound. Due to construction implication, the southbound I-35W to westbound I-494 will also be tied into the new turbine ramp which also results in removing the short weave section between I-35W and the Penn Avenue exit.
The figure below shows the changes that occur at the interchange with this phased improvement with and without the BRT project.
Figure 20 – Northbound to Westbound Improvements
5.4.1.1 Operations The geometric change in northbound I-35W to westbound I-494 has a big impact on traffic operations when compared to the no build scenario.
Tables 14 and 15 show the improvement from this change in design. The BRT changes have little to no impact on the I-494 operations.
The westbound I-494 improvements between the northbound I-35W exit ramp and France Avenue go from a LOS F to LOS C and D through the area. Removing the two short weaving areas along I-494 greatly improves operations and safety in both peak periods. The bottleneck between TH 77 and Nicollet Avenue is in place for both scenarios and is unaffected by this change.
For northbound I-35W the improvements are very drastic in the morning peak hours. In the no build conditions, traffic spills back from the northeast loop ramp along the CD road and back onto I-35W. The stacking caused by this deficient exit ramp extends upstream of the 82nd Street exit ramp, with almost 1-mile of queuing. This is a major safety concern as vehicles in the adjacent lanes will be operating at much faster speeds.
Improving operations along I-494 and providing a higher speed connection between northbound I-35W and westbound I-494 allows the traffic demand to exit I-35W more efficiently and improves operations from LOS E/F to LOS B/C in the interchange area.
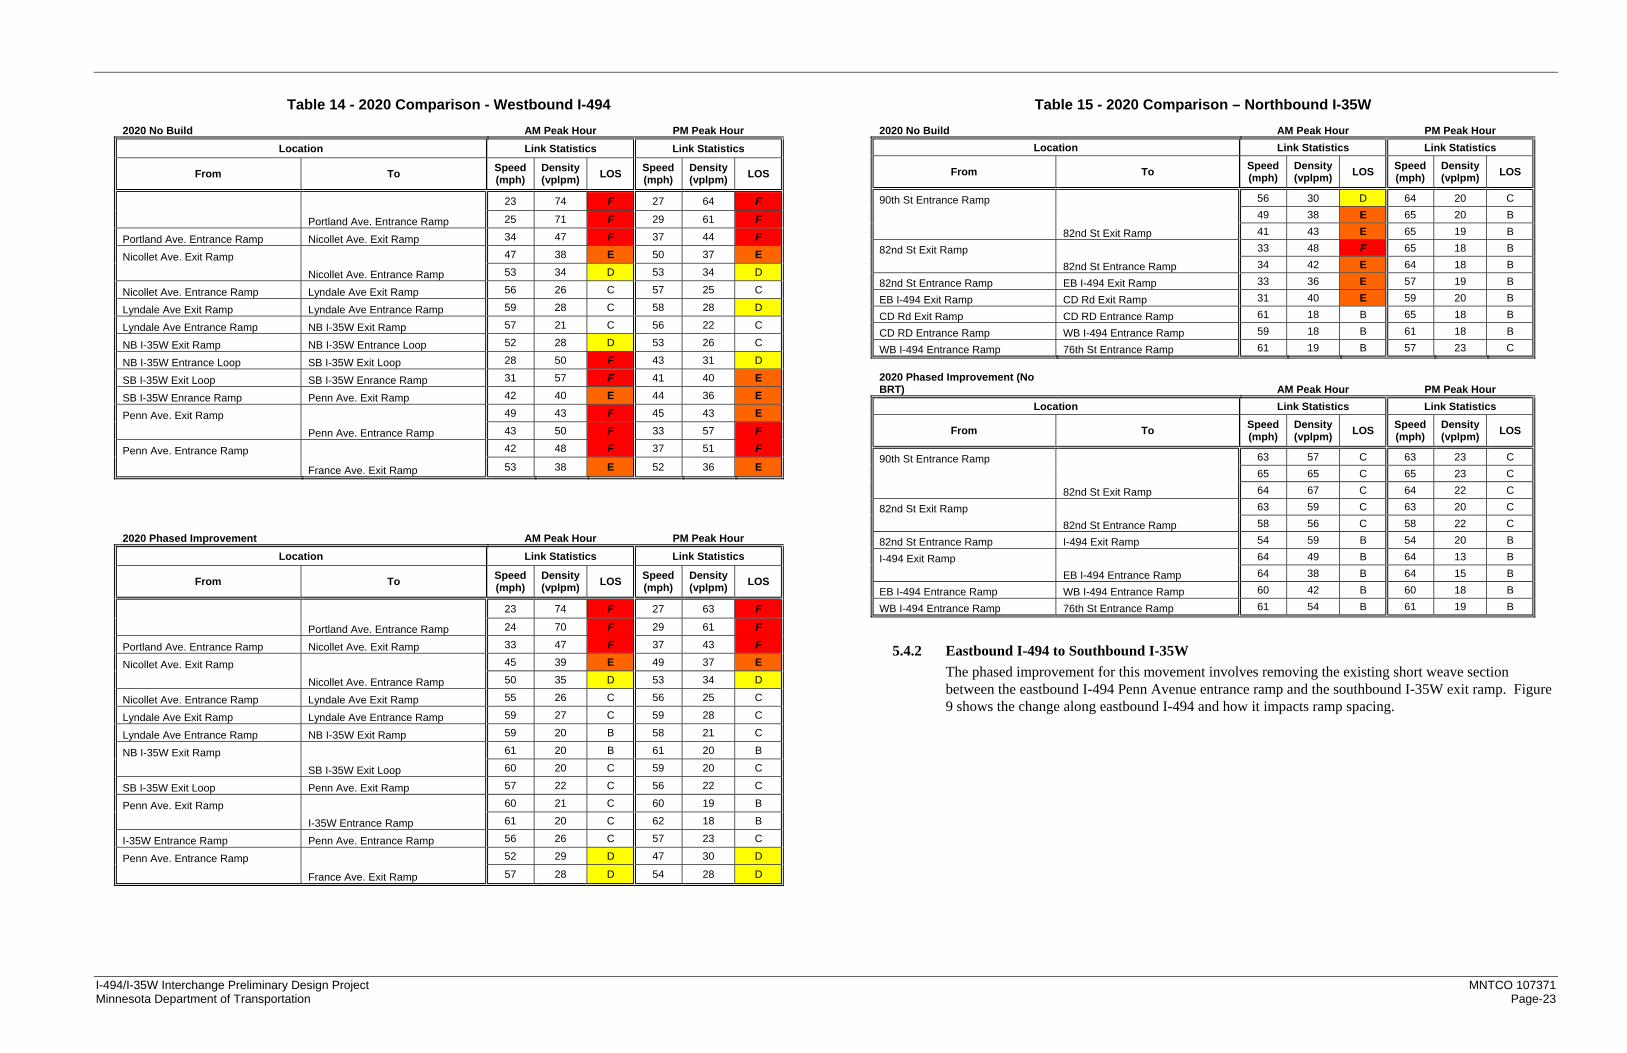
I-494/I-35W Interchange Preliminary Design Project MNTCO 107371 Minnesota Department of Transportation Page-23
Table 14 - 2020 Comparison - Westbound I-494 2020 No Build AM Peak Hour PM Peak Hour
Location Link Statistics Link Statistics
From To Speed (mph)
Density (vplpm) LOS Speed
(mph) Density(vplpm) LOS
23 74 F 27 64 F
Portland Ave. Entrance Ramp 25 71 F 29 61 F
Portland Ave. Entrance Ramp Nicollet Ave. Exit Ramp 34 47 F 37 44 F
Nicollet Ave. Exit Ramp 47 38 E 50 37 E
Nicollet Ave. Entrance Ramp 53 34 D 53 34 D
Nicollet Ave. Entrance Ramp Lyndale Ave Exit Ramp 56 26 C 57 25 C
Lyndale Ave Exit Ramp Lyndale Ave Entrance Ramp 59 28 C 58 28 D
Lyndale Ave Entrance Ramp NB I-35W Exit Ramp 57 21 C 56 22 C
NB I-35W Exit Ramp NB I-35W Entrance Loop 52 28 D 53 26 C
NB I-35W Entrance Loop SB I-35W Exit Loop 28 50 F 43 31 D
SB I-35W Exit Loop SB I-35W Enrance Ramp 31 57 F 41 40 E
SB I-35W Enrance Ramp Penn Ave. Exit Ramp 42 40 E 44 36 E
Penn Ave. Exit Ramp 49 43 F 45 43 E
Penn Ave. Entrance Ramp 43 50 F 33 57 F
Penn Ave. Entrance Ramp 42 48 F 37 51 F
France Ave. Exit Ramp 53 38 E 52 36 E
2020 Phased Improvement AM Peak Hour PM Peak Hour
Location Link Statistics Link Statistics
From To Speed (mph)
Density (vplpm) LOS Speed
(mph) Density(vplpm) LOS
23 74 F 27 63 F
Portland Ave. Entrance Ramp 24 70 F 29 61 F
Portland Ave. Entrance Ramp Nicollet Ave. Exit Ramp 33 47 F 37 43 F
Nicollet Ave. Exit Ramp 45 39 E 49 37 E
Nicollet Ave. Entrance Ramp 50 35 D 53 34 D
Nicollet Ave. Entrance Ramp Lyndale Ave Exit Ramp 55 26 C 56 25 C
Lyndale Ave Exit Ramp Lyndale Ave Entrance Ramp 59 27 C 59 28 C
Lyndale Ave Entrance Ramp NB I-35W Exit Ramp 59 20 B 58 21 C
NB I-35W Exit Ramp 61 20 B 61 20 B
SB I-35W Exit Loop 60 20 C 59 20 C
SB I-35W Exit Loop Penn Ave. Exit Ramp 57 22 C 56 22 C
Penn Ave. Exit Ramp 60 21 C 60 19 B
I-35W Entrance Ramp 61 20 C 62 18 B
I-35W Entrance Ramp Penn Ave. Entrance Ramp 56 26 C 57 23 C
Penn Ave. Entrance Ramp 52 29 D 47 30 D
France Ave. Exit Ramp 57 28 D 54 28 D
Table 15 - 2020 Comparison – Northbound I-35W 2020 No Build AM Peak Hour PM Peak Hour
Location Link Statistics Link Statistics
From To Speed (mph)
Density(vplpm) LOS Speed
(mph) Density(vplpm) LOS
90th St Entrance Ramp 56 30 D 64 20 C
49 38 E 65 20 B
82nd St Exit Ramp 41 43 E 65 19 B
82nd St Exit Ramp 33 48 F 65 18 B
82nd St Entrance Ramp 34 42 E 64 18 B
82nd St Entrance Ramp EB I-494 Exit Ramp 33 36 E 57 19 B
EB I-494 Exit Ramp CD Rd Exit Ramp 31 40 E 59 20 B
CD Rd Exit Ramp CD RD Entrance Ramp 61 18 B 65 18 B
CD RD Entrance Ramp WB I-494 Entrance Ramp 59 18 B 61 18 B
WB I-494 Entrance Ramp 76th St Entrance Ramp 61 19 B 57 23 C 2020 Phased Improvement (No BRT) AM Peak Hour PM Peak Hour
Location Link Statistics Link Statistics
From To Speed (mph)
Density(vplpm) LOS Speed
(mph) Density(vplpm) LOS
90th St Entrance Ramp 63 57 C 63 23 C
65 65 C 65 23 C
82nd St Exit Ramp 64 67 C 64 22 C
82nd St Exit Ramp 63 59 C 63 20 C
82nd St Entrance Ramp 58 56 C 58 22 C
82nd St Entrance Ramp I-494 Exit Ramp 54 59 B 54 20 B
I-494 Exit Ramp 64 49 B 64 13 B
EB I-494 Entrance Ramp 64 38 B 64 15 B
EB I-494 Entrance Ramp WB I-494 Entrance Ramp 60 42 B 60 18 B
WB I-494 Entrance Ramp 76th St Entrance Ramp 61 54 B 61 19 B
5.4.2 Eastbound I-494 to Southbound I-35W The phased improvement for this movement involves removing the existing short weave section between the eastbound I-494 Penn Avenue entrance ramp and the southbound I-35W exit ramp. Figure 9 shows the change along eastbound I-494 and how it impacts ramp spacing.

I-494/I-35W Interchange Preliminary Design Project MNTCO 107371 Minnesota Department of Transportation Page-24
Figure 21 – Phase 1 Eastbound to Southbound Improvements
Since the existing Penn Avenue Bridge has a portal adjacent to the mainline that was intended to be used for the 2001 FEIS Preferred Alternative, the new southbound I-35W exit ramp will utilize this space. However, using the portal results in the need to push the Penn Avenue exit ramp further west, creating less weaving distance between France and Penn Avenues.
The new exit-exit design also creates more traffic demand for the right most lanes. The combined exit volumes from both exits are 1,700 and 1,800 vph in the AM and PM peak periods. The stacking that occurs in the right most lanes reduces the number of available gaps that are needed for vehicles entering from France Avenue; this in turn creates slower speeds and increases the impact of the bottleneck.
5.4.2.1 Operations The change in ramp configuration along eastbound I-494 has a negative impact on traffic operations without other capacity improvement on mainline I-494.
Table 16 shows the operation changes that result from this change in design. The BRT improvements have little to no impact on the I-494 operations.
Eastbound I-494 has a major bottleneck between TH 100 and Penn Avenue in the year 2020; the bottleneck limits the amount of traffic served through the I-494/I-35W interchange. Directly at the study interchange, both the no build and build scenarios show LOS D or better. However most of the traffic demand trying to reach this destination or further downstream are held up at the upstream bottleneck.
Table 16 also shows the area between the TH 100 entrance ramp and the Penn Avenue exit ramp as where the main capacity constraint occurs. Comparing the speeds and density of the no build and build scenarios in this area shows the decline in traffic operations with the changes along eastbound I-494.
Braiding the southbound I-35W exit ramp with the 82nd Street entrance ramp will remove a major weave and safety concern along I-494. However, the operations analysis shows that this improvement is not ideal without other major capacity improvements between TH 100 and I-35W.
Table 16 - 2020 Comparison – Eastbound I-494 2020 No Build AM Peak Hour PM Peak Hour
Location Link Statistics Link Statistics
From To Speed (mph)
Density(vplpm) LOS Speed
(mph) Density(vplpm) LOS
NB TH 100 Entrance Ramp 40 38 E 16 72 F
France Ave. Exit Ramp 39 42 E 15 80 F
France Ave. Exit Ramp SB France Ave. Entrance Loop 35 52 F 14 103 F
SB France Ave. Entrance Loop NB France Ave. Entrance Ramp 37 48 F 20 78 F
NB France Ave. Entrance Ramp 43 44 F 33 54 F
Penn Ave. Exit Ramp 50 39 E 49 38 E
Penn Ave. Exit Ramp 55 34 D 57 31 D
Penn Ave. Entrance Ramp 51 38 E 53 33 D
Penn Ave. Entrance Ramp SB I-35W Exit Ramp 53 27 C 55 23 C
SB I-35W Exit Ramp SB I-35W Entrance Loop 52 28 D 56 24 C
SB I-35W Entrance Loop NB I-35W Exit Loop 46 26 C 54 19 B
NB I-35W Exit Loop NB I-35W Entrance Ramp 47 33 D 55 24 C
NB I-35W Entrance Ramp Lyndale Ave. Exit Ramp 47 28 D 55 22 C
Lyndale Ave. Exit Ramp Lyndale Ave. Entrance Ramp 48 36 E 50 32 D
Lyndale Ave. Entrance Ramp Nicollet Ave. Exit Ramp 45 34 D 37 41 E
Nicollet Ave. Exit Ramp 49 40 E 50 40 E
2020 Phased Improvement AM Peak Hour PM Peak Hour
Location Link Statistics Link Statistics
From To Speed (mph)
Density(vplpm) LOS Speed
(mph) Density(vplpm) LOS
NB TH 100 Entrance Ramp 28 52 F 13 82 F
France Ave. Exit Ramp 26 60 F 13 90 F
France Ave. Exit Ramp SB France Ave. Entrance Loop 24 72 F 12 113 F
SB France Ave. Entrance Loop NB France Ave. Entrance Ramp 27 65 F 17 89 F
NB France Ave. Entrance Ramp 32 58 F 28 59 F
Penn Ave. Exit Ramp 44 40 E 45 36 E
Penn Ave. Exit Ramp SB I-35W Exit Ramp 55 30 D 56 26 C
SB I-35W Exit Ramp 60 25 C 61 21 C
Penn Ave. Entrance Ramp 60 25 C 61 21 C
Penn Ave. Entrance Ramp SB I-35W Entrance Loop 53 27 C 55 22 C
SB I-35W Entrance Loop NB I-35W Exit Loop 45 27 C 54 18 B
NB I-35W Exit Loop Lyndale Ave. Exit Ramp 46 34 D 56 23 C
Lyndale Ave. Exit Ramp NB I-35W Entrance Ramp 49 28 C 55 20 C
NB I-35W Entrance Ramp Lyndale Ave. Entrance Ramp 51 35 E 53 28 D
Lyndale Ave. Entrance Ramp Nicollet Ave. Exit Ramp 48 33 D 39 37 E
Nicollet Ave. Exit Ramp 52 38 E 52 36 E
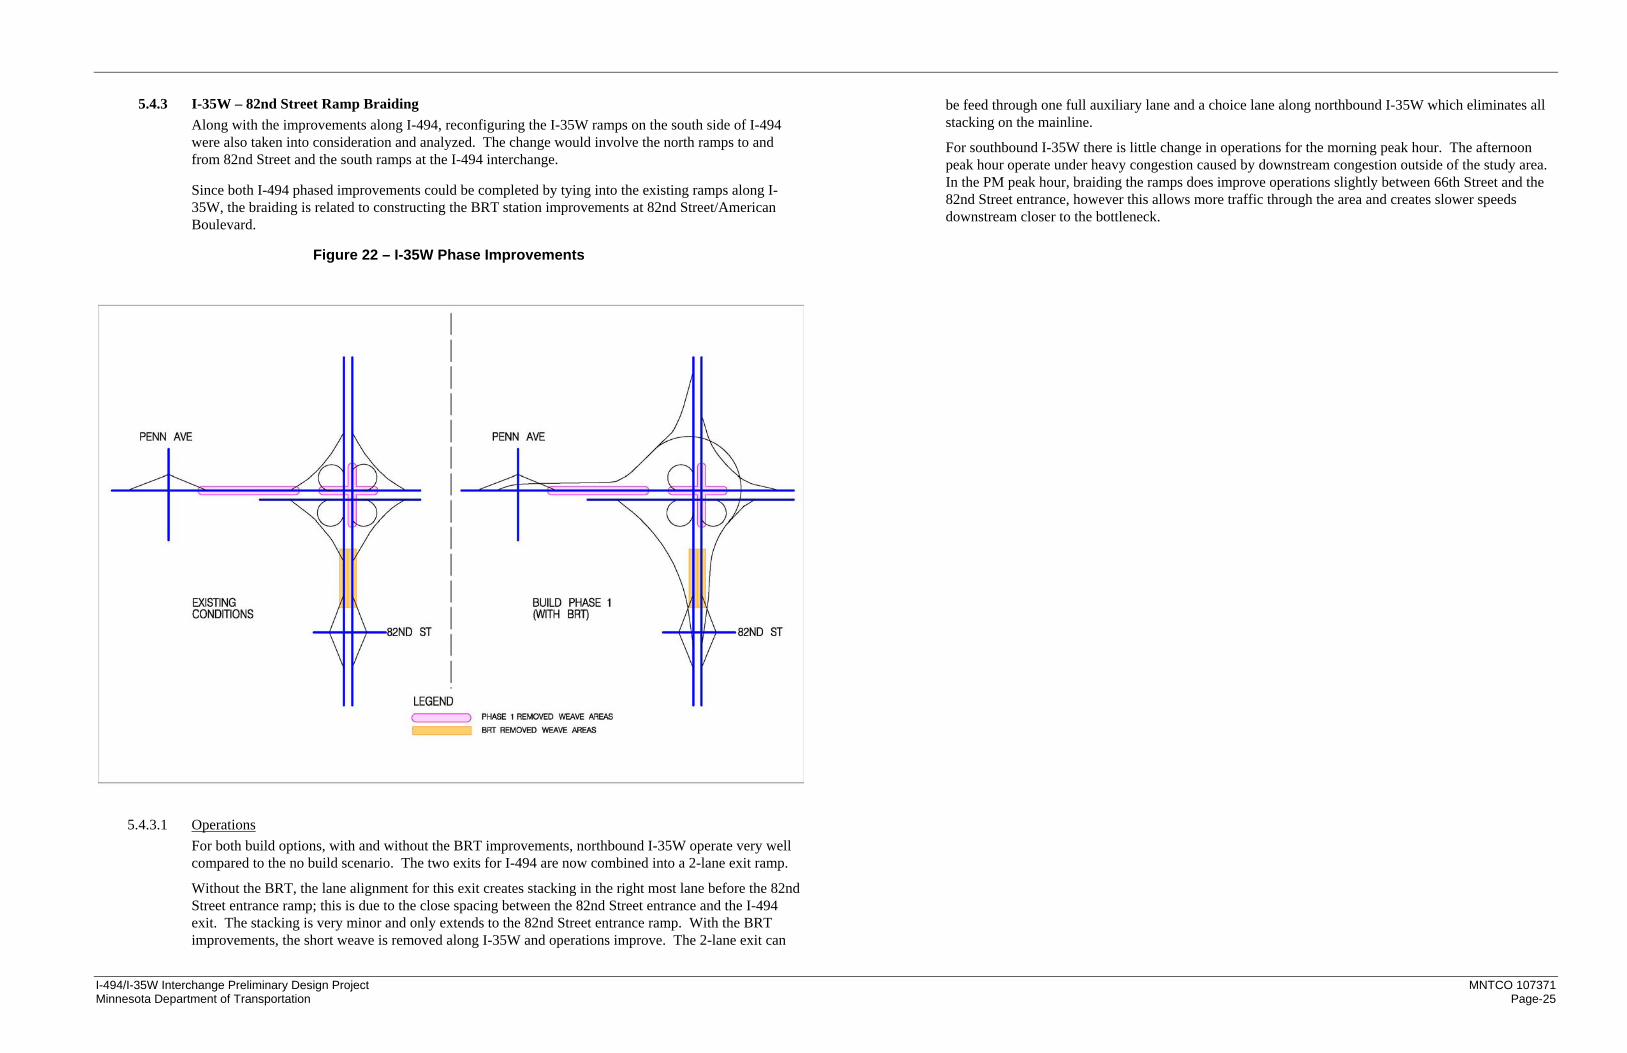
I-494/I-35W Interchange Preliminary Design Project MNTCO 107371 Minnesota Department of Transportation Page-25
5.4.3 I-35W – 82nd Street Ramp Braiding Along with the improvements along I-494, reconfiguring the I-35W ramps on the south side of I-494 were also taken into consideration and analyzed. The change would involve the north ramps to and from 82nd Street and the south ramps at the I-494 interchange.
Since both I-494 phased improvements could be completed by tying into the existing ramps along I-35W, the braiding is related to constructing the BRT station improvements at 82nd Street/American Boulevard.
Figure 22 – I-35W Phase Improvements
5.4.3.1 Operations
For both build options, with and without the BRT improvements, northbound I-35W operate very well compared to the no build scenario. The two exits for I-494 are now combined into a 2-lane exit ramp.
Without the BRT, the lane alignment for this exit creates stacking in the right most lane before the 82nd Street entrance ramp; this is due to the close spacing between the 82nd Street entrance and the I-494 exit. The stacking is very minor and only extends to the 82nd Street entrance ramp. With the BRT improvements, the short weave is removed along I-35W and operations improve. The 2-lane exit can
be feed through one full auxiliary lane and a choice lane along northbound I-35W which eliminates all stacking on the mainline.
For southbound I-35W there is little change in operations for the morning peak hour. The afternoon peak hour operate under heavy congestion caused by downstream congestion outside of the study area. In the PM peak hour, braiding the ramps does improve operations slightly between 66th Street and the 82nd Street entrance, however this allows more traffic through the area and creates slower speeds downstream closer to the bottleneck.

I-494/I-35W Interchange Preliminary Design Project MNTCO 107371 Minnesota Department of Transportation Page-26
Table 17 - 2020 Comparison – Northbound I-35W 2020 No Build AM Peak Hour PM Peak Hour
Location Link Statistics Link Statistics
From To Speed (mph)
Density (vplpm) LOS Speed
(mph) Density(vplpm) LOS
90th St Entrance Ramp 56 30 D 64 20 C
49 38 E 65 20 B
82nd St Exit Ramp 41 43 E 65 19 B
82nd St Exit Ramp 33 48 F 65 18 B
82nd St Entrance Ramp 34 42 E 64 18 B
82nd St Entrance Ramp EB I-494 Exit Ramp 33 36 E 57 19 B
EB I-494 Exit Ramp CD Rd Exit Ramp 31 40 E 59 20 B
CD Rd Exit Ramp CD RD Entrance Ramp 61 18 B 65 18 B
CD RD Entrance Ramp WB I-494 Entrance Ramp 59 18 B 61 18 B
WB I-494 Entrance Ramp 76th St Entrance Ramp 61 19 B 57 23 C 2020 Phased Improvement (No BRT) AM Peak Hour PM Peak Hour
Location Link Statistics Link Statistics
From To Speed (mph)
Density (vplpm) LOS Speed
(mph) Density(vplpm) LOS
90th St Entrance Ramp 63 57 C 63 23 C
65 65 C 65 23 C
82nd St Exit Ramp 64 67 C 64 22 C
82nd St Exit Ramp 63 59 C 63 20 C
82nd St Entrance Ramp 58 56 C 58 22 C
82nd St Entrance Ramp I-494 Exit Ramp 54 59 B 54 20 B
I-494 Exit Ramp 64 49 B 64 13 B
EB I-494 Entrance Ramp 64 38 B 64 15 B
EB I-494 Entrance Ramp WB I-494 Entrance Ramp 60 42 B 60 18 B
WB I-494 Entrance Ramp 76th St Entrance Ramp 61 54 B 61 19 B
2020 Phased Improvement (With BRT) AM Peak Hour PM Peak Hour
Location Link Statistics Link Statistics
From To Speed (mph)
Density (vplpm) LOS Speed
(mph) Density(vplpm) LOS
90th St Entrance Ramp 63 23 C 64 20 C
82nd St Exit Ramp 63 21 C 64 18 B
82nd St Exit Ramp 63 20 C 64 18 B
I-494 Exit Ramp 60 21 C 60 19 B
I-494 Exit Ramp 65 15 B 66 13 B
82nd St Entrance Ramp 66 15 B 66 13 B
82nd St Entrance Ramp 62 14 B 58 16 B
EB I-494 Entrance Ramp 64 17 B 63 18 B
EB I-494 Entrance Ramp WB I-494 Entrance Ramp 60 18 B 61 18 B
WB I-494 Entrance Ramp 76th St Entrance Ramp 61 19 B 57 23 C
Table 18 - 2020 Comparison – Southbound I-35W 2020 No Build AM Peak Hour PM Peak Hour
Location Link Statistics Link Statistics
From To Speed (mph)
Density(vplpm) LOS Speed
(mph) Density(vplpm) LOS
76th St Exit Ramp WB I-494 Exit Ramp 54 21 C 20 81 F
WB I-494 Exit Ramp WB I-494 Entrance Loop 57 17 B 14 107 F
WB I-494 Entrance Loop EB I-494 Exit Loop 51 17 B 13 97 F
EB I-494 Exit Loop EB I-494 Entrance Ramp 56 16 B 13 114 F
EB I-494 Entrance Ramp 82nd St Exit Ramp 58 17 B 16 85 F
82nd St Exit Ramp 63 17 B 18 95 F
82nd St Entrance Ramp 64 17 B 19 90 F
82nd St Entrance Ramp 59 18 B 29 61 F
63 19 B 44 45 F
90th St Exit Ramp 64 18 B 52 35 E 2020 Phased Improvement (No BRT) AM Peak Hour PM Peak Hour
Location Link Statistics Link Statistics
From To Speed (mph)
Density(vplpm) LOS Speed
(mph) Density(vplpm) LOS
76th St Exit Ramp WB I-494 Exit Ramp 54 20 C 17 82 F
WB I-494 Exit Ramp WB I-494 Entrance Loop 56 19 B 13 115 F
WB I-494 Entrance Loop EB I-494 Exit Loop 49 19 B 12 101 F
EB I-494 Exit Loop EB I-494 Entrance Ramp 55 17 B 13 117 F
EB I-494 Entrance Ramp 82nd St Exit Ramp 57 17 B 16 86 F
82nd St Exit Ramp 63 17 B 18 95 F
82nd St Entrance Ramp 64 17 B 19 91 F
82nd St Entrance Ramp 59 19 B 29 62 F
63 20 B 44 45 F
90th St Exit Ramp 64 18 B 52 36 E 2020 Phased Improvement (With BRT) AM Peak Hour PM Peak Hour
Location Link Statistics Link Statistics
From To Speed (mph)
Density(vplpm) LOS Speed
(mph) Density(vplpm) LOS
76th St Exit Ramp WB I-494 Exit Ramp 54 20 C 27 58 F
WB I-494 Exit Ramp WB I-494 Entrance Loop 56 19 B 20 83 F
WB I-494 Entrance Loop EB I-494 Exit Loop 45 20 C 17 83 F
EB I-494 Exit Loop 82nd St Exit Ramp 55 14 B 23 61 F
82nd St Exit Ramp 61 11 B 22 68 F
EB I-494 Entrance Ramp 66 10 A 21 72 F
EB I-494 Entrance Ramp 64 12 B 22 64 F
82nd St Entrance Ramp 66 11 B 22 64 F
82nd St Entrance Ramp 64 11 B 24 58 F
90th St Exit Ramp 65 13 B 36 45 F
5.4.4 Phase 1 Safety Improvements There were a total of 276 mainline crashes at the cloverleaf interchange between 2006 and 2008. The proposed geometric improvements not only improve operations for I-494 and I-35W, but also provide a major safety benefit with these improvements. Removing short weaving section will generally improve

I-494/I-35W Interchange Preliminary Design Project MNTCO 107371 Minnesota Department of Transportation Page-27
both traffic operations and safety. Two of the weaves being removed under the Phase 1 interchange improvements are the main safety problems at the I-494/I-35W interchange.
The weave between the loop ramps along northbound I-35W had a total of 44 crashes between 2006 and 2008 while the westbound I-494 loop ramp weave had 55 crashes. The spillback from slow operations along northbound I-35W had little impact on crashes during the analysis period, however for westbound I-494 the congestion upstream played a major role in safety operations.
The figure below shows that upstream of the loop ramp weave along westbound I-494 there were other high crash locations caused by the congestion of the interchange. In total the Phase 1 improvements will reduce four crash sections, currently totaling up to 159 crashes, down to the metro average for basic freeway segments which estimates only 45 crashes.
Figure 23 – Crash Reduction Areas
6.0 Impact Analysis 6.1 Local Streets - Bus Rapid Transit and Park-and-Ride Facility
6.1.1 Development Locations As part of the larger I-494/I-35W Interchange study one component was to evaluate a in-line BRT station that would be located along the I-35W corridor, just south of I-494. Analysis of the BRT station considered two different locations as potential build scenarios. The first location was on the west side of I-35W between American Boulevard and 82nd Street. Access to this location would be provided from 81st Street connecting to Knox Avenue. Drivers on I-35W going to the BRT station would exit at 82nd Street, head west to Knox Avenue, then north on Knox Avenue to 81st Street. Drivers coming from other areas would use the local street systems to get to American Boulevard or 82nd Street, and use either of those two streets to get to Knox Avenue, then 81st Street.
The second potential BRT station location is along American Boulevard between the I-35W frontage road and Dupont Avenue. Access to this station would be from the intersection of American Boulevard and Dupont Avenue. Drivers traveling to the second BRT location would use the local street system to get to American Boulevard to connect with the entrance to the parking ramp on Dupont Avenue.
6.1.2 Forecast Volumes The base traffic volumes were obtained using volumes from the Penn-American Study (conducted in March 2008) and supplemental traffic counts completed in August 2009 by SEH staff. In the Penn-American study 2030 PM traffic volumes had been determined. These volumes were factored down to the year 2020 and then balanced with the more recent counts forecasted to 2020 using the same growth rate as the Penn-American Study. Since there was no AM peak hour information from the Penn-American Study, the AM peak hour counts that were completed were forecast to 2020 using the same growth rate as was used for the PM peak in the Penn-American study.
6.1.3 Development Trip Generation and Routing To include the development trips from the new BRT station it was assumed that there would be 500 available parking spaces in the new parking ramp; at either the east or west location. Using the ITE Trip Generation manual entering, exiting, and daily trips were calculated for both time periods. During the AM and PM Peak hours 360 and 310 trips, respectively, were generated by the BRT station.
The following list is the directional percentages used for routing the BRT Station parking lot traffic:
• 40% to/from south on I-35W • 20% to/from southwest on Penn Avenue • 14% to/from southeast on Lyndale Avenue • 12% to/from east on I-494 • 8% to/from east on American Boulevard • 5% to/from west on American Boulevard • 1% to/from west on I-494
The development trips were added to the existing traffic count information to develop 2020 build scenarios for BRT stations on both the east and west sides of I-35W. Additional analysis was done for the east side BRT station when considering the impacts of a split diamond configuration between American Boulevard and 82nd Street.
6.1.4 Synchro/SimTraffic Analysis Table F1, located in Appendix F, provides detailed results of the SimTraffic analysis for existing conditions, 2020 No Build, 2020 Build for both the east and west parking ramp.
6.1.4.1 No Build The existing traffic control and geometrics were used in the models of the BRT station at both locations. The one exception to this is that a traffic signal was modeled at the intersection of Dupont Avenue and American Boulevard to accommodate all the traffic exiting the BRT station during the PM peak hour. Existing conditions analysis showed that both the AM and PM operate with intersection LOS C or better.
The 2020 No Build analysis evaluated the existing roadway network while only taking into account the background growth in the area. SimTraffic analysis reported that all the intersection in the model had a LOS D or better. The only intersection that had a LOS D was American Boulevard and Knox Avenue during the PM Peak.

I-494/I-35W Interchange Preliminary Design Project MNTCO 107371 Minnesota Department of Transportation Page-28
6.1.4.2 Westside BRT Station As expected, the BRT station had the biggest impact on traffic at the intersection of Knox Avenue and 81st Street. Under the 2020 Build conditions all but two intersections have LOS C or better. The intersections of Knox Avenue and American Boulevard as well as Knox Avenue and 81st Street both drop to LOS D during the PM Peak. One thing that is important to note is that the westbound approach at the 81st Street and Knox Avenue intersection operates at LOS F. That said, the geometric control at the intersection was not changed and was modeled as a two way stop.
To address the congestion for westbound traffic at Knox Avenue and 81st Street a mitigated model was also evaluated. The mitigated version simply added in a traffic signal at the intersection to provide more of an opportunity for westbound lefts to turn onto Knox Avenue. Adding a signal at Knox Avenue and 81st Street basically allows the road network to operate comparable to the 2020 No Build condition.
6.1.4.3 Eastside BRT Station In light of the SimTraffic results from the westside BRT station and the projected left turning volume coming from the eastside BRT station, a traffic signal was added at the intersection of American Boulevard and Dupont Avenue. Additionally the south leg of the intersection was widened from the existing intersection to provide a left, thru-left, and right turn lane configuration.
Operationally all of the intersections operate with a LOS C or better except for American Boulevard at Knox Avenue during the PM peak. The American Boulevard at Knox Avenue had a LOS D during the PM peak. Once again, these levels of service are in line with the 2020 No Build operation, but only with the use of a traffic signal at the exit point of the BRT station.
One very important component of the BRT station being on the east side of I-35W is that the route that drivers have to take to get to the facility is about twice as far as to the west side facility. Our analysis assumed that 40 percent of all the vehicles that use the BRT station will come from and go to I-35W south of 82nd Street. The closest ramp to both BRT stations is the 82nd St ramp, from there drivers can either use Knox Avenue or Lyndale Avenue to get to the east side BRT station. If they use Knox Avenue, then they will drive by the west side location at about the halfway point to the east side location. On the other hand, if they use Lyndale Avenue, that route involves some doubling back to get to the east side location. While, operationally both BRT locations are able to be supported by the roadway network, a significantly larger portion of the network is used to serve vehicles going to the east side BRT station.
6.2 Utilities Utility impacts as a result of the improvement of the I-494/I-35W interchange will occur throughout most of the project area. Storm water conveyance systems (catch basins, pipes, and drainage areas) are the most impacted by any improvements. Refer to Appendix C for the Water Resources Technical Memorandum, which details a listing of existing utilities that may be impacted. The stormsewer systems are able to be modified or reconstructed to meet the demands of the increase impervious areas associated with the improvements. Along the existing frontage road fire hydrants and street lighting will need to be removed and relocated as necessary. South of I-494 buried communications lines may need to be relocated as well. A Metropolitan Council Environmental Services major sanitary line runs under 76th Street and was recently reconstructed. The largest potential issue is the raised power transmission lines that also run along the south side of I-494. Based on current proposed roadway alignments, the existing support superstructures would not be impacted by the new alignment however, they will be close to the roadway and protection would be needed.
Local utilities such as power lines, sanitary sewer lines and water services lines may need to be relocated as a result of the improved interchange. These issues are on a much smaller scale and will be fleshed out in further design.
6.3 2040 Local Arterial Network The 2001 FEIS Preferred Alternative modified access along I-494 and I-35W near the study interchange to utilize the local arterial network for access to/from certain locations. The resulting arterial street network “Box” relies on Penn Avenue, Lyndale Avenue, 76th Street, and 82nd Street as a way for local traffic to reach their freeway destination. This change has been analyzed previously in both the 2001 FEIS and the Lyndale Avenue IAR; the arterial network area is referred to as the Penn-Lyndale Box (see Figure F23 in Appendix F).
Evaluation of the local arterial network operations was a part of the impact analysis for the study. Highway Capacity Manual (HCM) calculations were used for the evaluation in order to best compare the results with previous studies. However, a SimTraffic (micro-simulation) analysis was also conducted to evaluate the interaction between intersections to show the impacts of the proposed improvements on the local network.
The first step for the analysis was to determine the geometrics for the build year analysis. The geometrics utilized were from the “2004 Mn/DOT Preferred Design Lyndale Avenue-Penn Avenue Traffic Box: Modified Arterials - Turn Bays Only” (see Figure F24 located in Appendix F). The improved Traffic Box design was selected as previous studies showed these mitigations will handle future traffic volumes. It should be noted that all previous studies only included a PM peak hour analysis.
With the geometrics determined, traffic forecast volumes for the year 2040 were needed to complete the analysis. The scope of this project did not include creating a full arterial/freeway forecast; therefore existing data from various sources were increased based on previous work in the area. A range of data was used to develop the existing count network including recent project (Penn-American Study) counts, Mn/DOT data and new additional supplemental turning movement counts. The existing data (2007 volumes) were balanced (due to large discrepancies between available count data) and a growth rate of 1% per year was applied, similar to the Penn-American Study to obtain a forecast for the local arterial network. The 2040 freeway ramp volumes provided by Mn/DOT for the CORSIM analysis were held constant and the surrounding local arterial network traffic volumes were balanced to complete the forecast.
The comparison of the 2040 forecasts used in this analysis to the 2037 Lyndale IAR forecasts shows some large discrepancies in the arterial volumes. The 2040 forecasts, supplied by Mn/DOT, have much higher freeway ramp traffic volumes and were not modified in any way in order to maintain consistency between the freeway and arterial forecasts. Higher volumes along the major east/west corridors including 76th Street and American Boulevard are present as well in the 2040 forecasts. 76th Street and American Boulevard act as relievers routes for I-494 under existing traffic conditions. With additional capacity along I-494, traffic patterns will shift and possibly limit the overall growth along 76th Street. This traffic pattern shift was not accounted for in this analysis as the Twin Cities Regional Model was not incorporated.
Analyzing the 2040 traffic volumes using the HCM methodology shows that all intersections in the Penn-Lyndale Box will operate at a LOS D or better for both the AM and PM peak hours. These results are comparable to the 2037 analysis done for the Lyndale Avenue IAR Study. Table F2, located in Appendix F, shows the AM and PM peak hour delays and LOS for all intersections included in this analysis and includes the PM peak for the 2037 analysis.
Congestion resulting from queue spillback between intersections or disproportioned lane utilization/balance can have a major impact on adjacent intersections and would not show up in an

I-494/I-35W Interchange Preliminary Design Project MNTCO 107371 Minnesota Department of Transportation Page-29
HCM analysis. Therefore, a SimTraffic analysis was conducted to model the interactions between intersections and the corresponding effect on the intersection operations. Table F3, located in Appendix F, details the MOE’s from the SimTraffic analysis.
The AM peak hour shows comparable delays to the HCM analysis; however the Penn Avenue corridor between 76th Street and 82nd Street has slightly increased delays caused by disproportioned lane utilization due to the heavy turning volumes at all major intersections. The PM peak hour shows more delay along Penn Avenue and Lyndale Avenue where queue spillback between intersections and poor lane utilization increase delays at many of the major intersections. The Lyndale Avenue and 77th Street intersection experiences the worst performance, with intersection delays of 162 seconds per vehicle (LOS F).
Due to the forecast volume discrepancies, it is recommended that further study be done on the Penn-Lyndale Box network in order to determine what improvements, if any, beyond the “2004 Mn/DOT Preferred Design Lyndale Avenue - Penn Avenue Traffic Box: Modified Arterial – Turn Bays Only” (Figure F24 in Appendix F) need to be implemented prior to the complete construction of the I-494/I-35W interchange. A detailed forecast should be conducted utilizing the Twin Cities Regional Model in order to properly address changes in access and I-494 capacity improvements that could pull more traffic off of the arterial network.
6.4 Infrastructure Footprint The impact of the Turbine Interchange layout including the in-line I-35W BRT was compared to the original 2001 FEIS Preferred Alternative (Figure D13) with the in-line I-35W BRT (Figure D13A). Figure D13B located in Appendix D illustrates the differences between these two layouts. The Turbine Interchange layout exhibits a wider infrastructure footprint (construction limits; 35 feet beyond pavement, 15 feet beyond retaining walls) in three of the I-494/I-35W interchange quadrants; with the southeast quadrant having a reduced impact. The two western quadrants have impacts to private properties. These private property impacts are mainly associated with losses in parking spaces to commercial businesses.
Options for reducing the impacts identified from the Turbine Interchange layout were evaluated, and potential options are available for consideration in the next level of design detail for the interchange. Loop ramp design speeds less that 40 mph, with a minimum of 35 mph, may be allowable in certain locations to tighten the geometry and reduce the pavement and retaining wall impacts in the two western quadrants.
The I-494/I-35W interchange movements with the lower ramp volumes were modified to 35 mph design speeds. (See Figure D14 in Appendix D.) The corresponding adjustments to the overall layout are able to provide reduced impacts in the two western quadrants of the interchange.
The Dick’s Sporting Goods property in the northwest quadrant is impacted by the ramps and retaining walls for the Turbine Design. Parking in the outside limits of the parking lot is eliminated from the impact of the interchange layout. The use of the 35 mph design reduced the impacts, and with a modification to the existing parking lot layout, the parking levels can be maintained for the property. Figure D15, located in Appendix D, provides an illustration of this design option.
The southwest quadrant of the interchange can also have the impacts from the Turbine Design reduced with the 35 mph design, allowing the ramps to shift slightly east and position the edges of the new ramp pavement closer to the outer edges of the existing parking lot areas. Reduction in available parking will still result in a few locations, but at a significantly lower level than the 40 mph layout.
Another area of impact that exists with the 2001 FEIS Preferred Alternative and the Turbine Design is on the north side of I-494 between Lyndale Avenue and the I-35W interchange. While the Turbine
Design actually provides a slightly reduced impact to the parking lot of The Shops at Lyndale, there are still significant impacts to the property. While the study’s objective is to compare the impacts between the 2001 FEIS Preferred Alternative and the Turbine Design, and address location of increased impact, an optional concept for the braid layout of the Lyndale Avenue westbound entrance ramp and I-35W ramps on I-494 was investigated. This is illustrated in the inset of Figure D14, located in Appendix D. A longer, elevated ramp for the Lyndale Avenue westbound entrance ramp may allow the I-35W ramps to run beneath for a longer distance and reduce the impacts to the private parking lots. Further review of this design option would be necessary to confirm the feasibility of the concept.
Impacts to private property resulting from the in-line BRT station to the infrastructure footprint are focused in the I-35W corridor. Frontage roads and parking lot areas on both sides of I-35W are impacted, with the east side having slightly increased impacts over the layout of the original 2001 FEIS Preferred Alternative. The Turbine Interchange layout actually provides a slightly reduced impact in comparison to the 2001 FEIS Preferred Alternative with the BRT station included.
6.5 Construction Cost Construction cost estimates were developed for the interchange layouts that were part of the 2001 FEIS Preferred Alternative and the Turbine Interchange layout. Costs for Phase 1 of the Turbine Design layout were also developed with and without the BRT station pavements included. These cost estimates were developed as comparative cost estimates, focusing on the major construction elements using Mn/DOT’s LWD format. Major construction items for the interchange concept included roadway pavements, bridges, median barriers, and retaining walls. Right-of-way costs and project delivery costs were not included in the estimates. A 20 percent contingency risk factor was included.
Findings of the cost estimates show the full Turbine Interchange layout ($237 million) recognizes savings of approximately $33 million in overall costs compared to the 2001 FEIS Preferred Alternative layout ($270 million). The bridge costs were the main item of savings for the Turbine Design.
The Phase 1 interchange improvements (interchange only) based on the comparative estimate indicate a construction cost of approximately $26 million. Inclusion of the BRT station (Single Platform with Weave) would add approximately $45 million to the cost of the project; which includes approximately $35 million for roadway improvements on I-35W and approximately $10 million for the BRT station itself. The addition of a park-and-ride structure would require an additional $7 million.
A part of the construction cost estimating effort was to identify the elements of the Phase 1 layouts that would ultimately be removed to accommodate the full Turbine Design. While a timeframe to accomplish the full Turbine Design interchange has not been established and would likely be well beyond a 20 year window, the identification of those costs were completed. The Phase 1 layout figures show the interim pavement areas in green, Figures D16 to D21 in the Appendix D.
The comparative cost table summarizes the detailed sheets in Appendix G for the LWD estimates of the interchange.
Construction costs for the BRT station improvements and park-and-ride facility were estimated and shown in Table G9 in Appendix G. The construction costs developed for the BRT facility were based off estimates developed for the 46th Street BRT station on I-35W currently under construction. Features, like the length of the station platform, were prorated between the 46th Street layout and the layout concept at the American Boulevard bridge to determine a basis for the costs of the major elements of the facility.
The comparison of the estimated costs for the three alternative BRT concepts indicate a range from approximately $10 million for the Single Platform with Weave, $10-$14 million for the Dual Platform
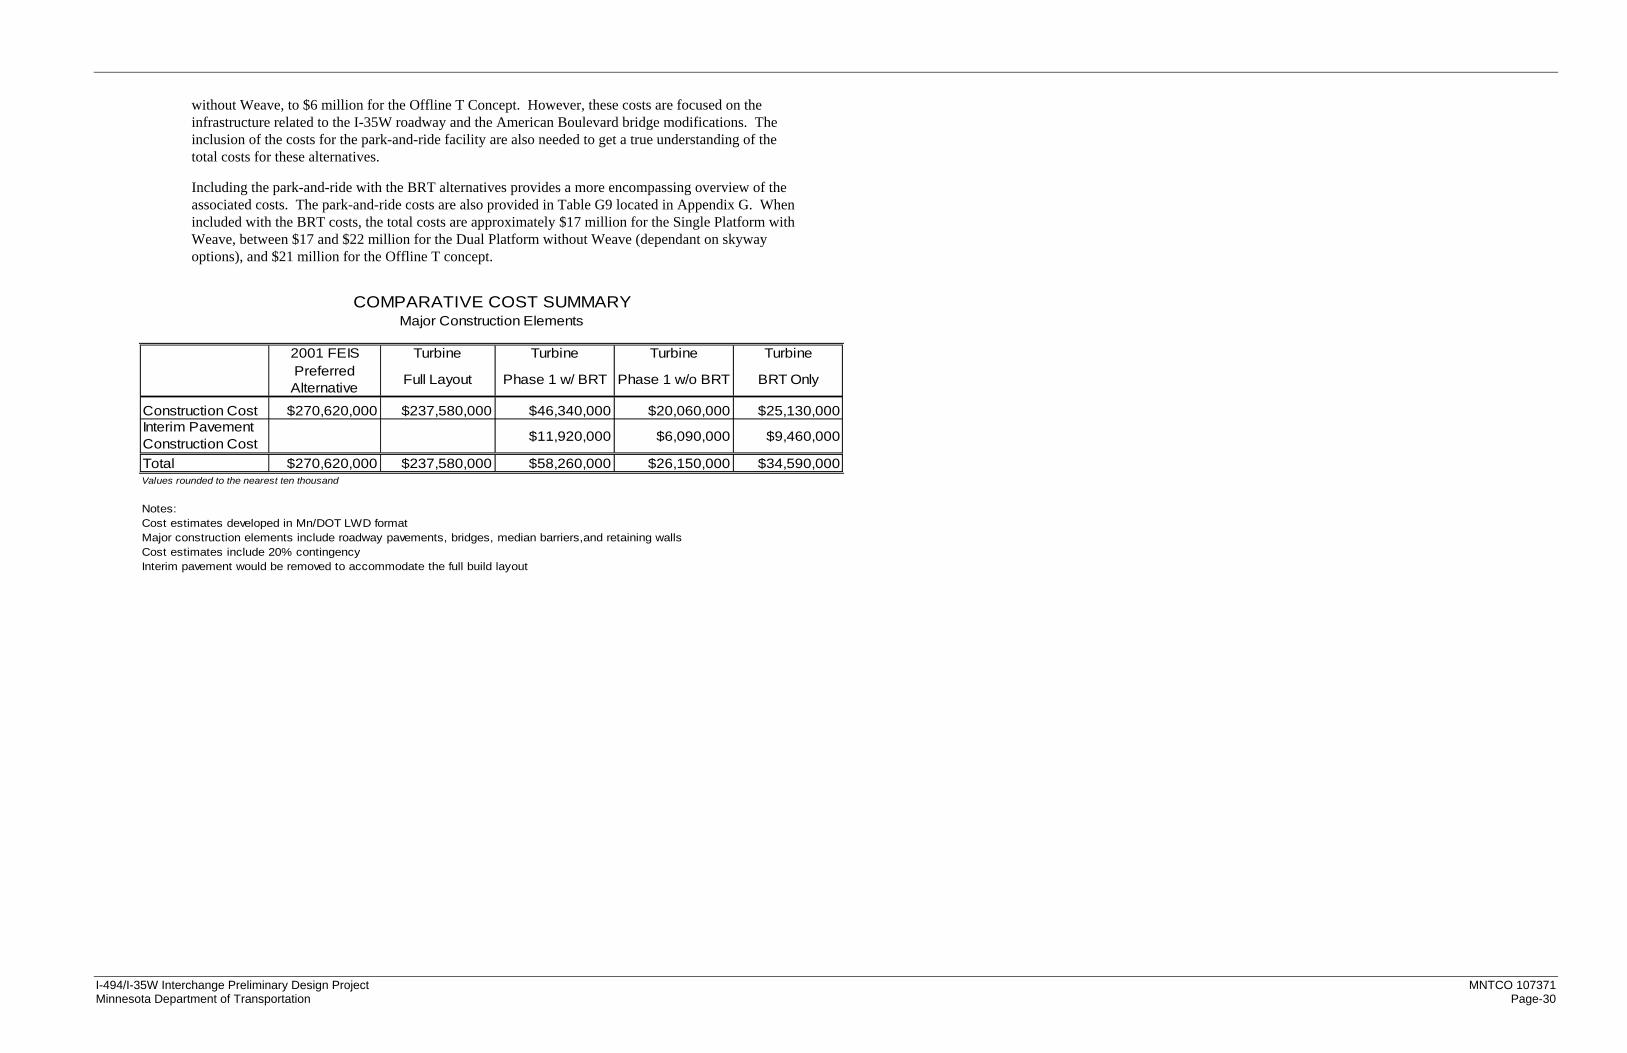
I-494/I-35W Interchange Preliminary Design Project MNTCO 107371 Minnesota Department of Transportation Page-30
without Weave, to $6 million for the Offline T Concept. However, these costs are focused on the infrastructure related to the I-35W roadway and the American Boulevard bridge modifications. The inclusion of the costs for the park-and-ride facility are also needed to get a true understanding of the total costs for these alternatives.
Including the park-and-ride with the BRT alternatives provides a more encompassing overview of the associated costs. The park-and-ride costs are also provided in Table G9 located in Appendix G. When included with the BRT costs, the total costs are approximately $17 million for the Single Platform with Weave, between $17 and $22 million for the Dual Platform without Weave (dependant on skyway options), and $21 million for the Offline T concept.
2001 FEIS Turbine Turbine Turbine TurbinePreferred Alternative Full Layout Phase 1 w/ BRT Phase 1 w/o BRT BRT Only
Construction Cost $270,620,000 $237,580,000 $46,340,000 $20,060,000 $25,130,000Interim Pavement Construction Cost $11,920,000 $6,090,000 $9,460,000
Total $270,620,000 $237,580,000 $58,260,000 $26,150,000 $34,590,000Values rounded to the nearest ten thousand
Notes:Cost estimates developed in Mn/DOT LWD formatMajor construction elements include roadway pavements, bridges, median barriers,and retaining wallsCost estimates include 20% contingencyInterim pavement would be removed to accommodate the full build layout
COMPARATIVE COST SUMMARYMajor Construction Elements

I-494/I-35W Interchange Preliminary Design Project MNTCO 107371 Minnesota Department of Transportation Page-31
6.6 Benefit / Cost Analysis For this project, a quick benefit/cost (B/C) analysis was performed to determine if the phased improvement will provide an economical benefit. The idea is that capital/construction costs occur upfront, while safety benefits and travel benefits occur over a longer period of time. Typically a 20-year timeframe is chosen from when the project will be constructed to a 20-year lifespan of the design.
The analysis shown here was done with only the information from this project. Some data had to be extrapolated to meet the B/C calculation requirements. Therefore it is recommended that a full scale B/C analysis be conducted at a later time in the project development
A B/C analysis consists of comparing any costs with economic benefits provided by the project. Costs include construction costs, right of way acquisition, major rehabilitation costs, routine maintenance costs and remaining capital value (RCV). The benefits from a project include savings from vehicle travel time, vehicle travel distance and the safety benefit from a project.
For the project, the year of opening (estimated construction date) is 2020; therefore the anticipated life of the project for the benefit cost analysis is 2040. While the cost estimating for this project is straight forward, the benefit analysis needed data interpolation in order to fit the guidelines of a typical B/C analysis.
The safety benefit was calculated by removing high crash locations that will be removed with the project and calculating a new crash rate for these segments based on the metro average for a basic freeway segment. The build improvements reduce the four highest crash locations at this interchange, showing a monetary benefit of over $21 million dollars.
For the vehicle miles traveled (VMT) and vehicle hours traveled (VHT), an estimate from the Twin Cities Regional Model was needed. The CORSIM analysis for this project did not provide the necessary data inputs into this analysis.
Typically, VMT and VHT data for the year of opening (2020) and design year (2040) are obtained for both the no build (base condition) and build alternatives. For this project, 2020 data for both the no build and build scenario were obtained; however 2040 data for both the no build and build Phase 1 projects were not analyzed. Therefore, VMT and VHT data was pulled from the Twin Cities Regional Model and extrapolated out to the correct forecast years.
Using this information, the VMT benefit creates a negative impact as more traffic is being served with the proposed design. The monetary value of this benefit reduction is almost $17.4 million dollars. The VHT projections create a great benefit for the project and its users as travel time will be reduced with the build improvements. The monetary value of the benefit calculated to will be over $59 million dollars.
The benefits are then compared to the cost associated with the project. The construction costs for this project are slightly over $26 million dollars. The remaining capital value of the construction project will yield almost $6 million dollars.
The table at right summarizes the inputs into the B/C analysis and shows a positive ratio of 2.87, meaning the project provides a benefit that is over 2 times the cost of completing the project.
Table 19 - Benefit Cost Summary
ITEM Build
Operating Benefit $ (17,405,923)
Travel Time Benefit $ 55,335,363
Crash Benefit $ 21,354,297
Operating and Maintenance Benefit $ -
Total Benefit $ 59,283,738
Roadway $ 6,152,000
Bridge $ 10,375,900
Retaining Wall $ 5,198,400
Median Barrier $ 51,700
Drainage Costs Above Normal $ -
Roadway Lighting $ -
Right of Way $ -
Risk Factor ( 20% ) $ 4,355,600
Engineering ( 0% ) $ -
Total Cost $ 26,133,600
PV Total Cost $ 26,133,600
Project Salvage Value $ 5,486,253
(PV Total Cost - Salvage Value) $ 20,647,347
Benefit-Cost Ratio 2.87

I-494/I-35W Interchange Preliminary Design Project MNTCO 107371 Minnesota Department of Transportation Page-32
7.0 Recommendation The objectives of this study was to develop an interchange alternative that reduces the overall scope of the project or provides the most flexibility for staged implementation and incorporates the provisions of an in-line BRT station. This study has determined that the Turbine Interchange layout can achieve these objectives. The evaluation of the scope of the three alternatives, based on the bridge deck square footage, provided a reasonable assessment of the ability for the Turbine Design interchange to reduce the overall scope of the project.
The flexibility provided by Phase 1 of the Turbine Design interchange layout for the northbound I-35W to westbound I-494 movement allows the improvements to be build without third level structures, reducing bridge construction costs. The Phase 1 improvements can also be accomplished with connections to the existing roadway that limit the amount of construction necessary.
Evaluation of the Phase 1 interchange improvements utilizing the modeling results and crash reduction factors was shown to provide a positive benefit to cost ratio of 2.87. The Phase 1 improvements also address an important segment for westbound I-494 regarding the crash history at the interchange.
The comparative cost estimate for construction of Turbine Design Phase 1 interchange improvements indicates a $26 million investment for the improvement of operations and safety in the corridor. The Phase 1 project scope is a fiscally achievable project and should be considered for implementation.
Figure 24 – Recommended Phase 1 Improvements (See Figure D27 in Appendix D)
7.1 Next Steps In order to proceed with the design and construction of interchange improvements the following items must be completed:
1. Decide direction on unresolved issues; Preferred BRT concept, Lyndale Avenue Interchange access to I-35W, and Lyndale Avenues access footprint impacts.
2. An Interstate Access Request (IAR)
3. A Mn/DOT Staff Approved Geometric Layout
4. The appropriate environmental documentation
5. Municipal Consent
Due to the uniqueness of the I-494/I-35W interchange project and all the past work that was previously completed, it is recommended that a meeting be held between FHWA and Mn/DOT to determine the requirements and level of effort for each of those documents.

Appendix A Traffic Engineering Technical Memorandums
Existing Conditions Technical Memorandum Interchange Deficiencies Technical Memorandum

Appendix B Water Resources Technical Memorandum

Appendix C Interchange Concepts
Alternative 1 – FEIS Concept with BRT - Figure C1 Alternative 2 – Three-Quad Cloverleaf - Figure C2
Alternative 3 – Turbine Design (One Loop) - Figure C3 Alternatives Phase 1Layouts - Figure C4
Turbine Design with Split Diamond Layout - Figure C5

Appendix D Geometric Layouts
Turbine - Full Build - Figures D1 – D12
Turbine – Full Build Profiles Figures D12A-D12H 2001 FEIS Preferred Alternative - Figure D13
2001 FEIS Concept – BRT at American Boulevard – Figure D13A Turbine – Full Build vs 2001 FEIS – BRT at American Boulevard – Figure D13B
Turbine – Full Build vs. Turbine with 35 mph Design - Figure D14 Dick’s Sporting Goods Parking Lot Spaces - Figure D15
Turbine – Phase 1 - Figures D16 – D21 Turbine – Phase 1 – Profiles – Figures D22-D26
Turbine – Phase 1A – No BRT – Figure D27 Turbine – Phase 1B – BRT Only – Figure D28
Turbine – Full Build Typical Sections – Figure D29

Appendix E Bus Rapid Transit Layouts
Alternatives Evaluation Matrix
BRT – Single Platform with Weave - Figure E1 American Blvd. Bridge Modification: Plan and Detail - Figure E2
BRT – Dual Platforms without Weave - Figure E3 BRT – Offline T Concept - Figure E4
BRT – Preliminary Alternatives – Figure E5

Appendix F Traffic Engineering Exhibits
Existing Conditions – 2007 Volumes - Figure F1
No Build Alternative – 2020 Forecasts - Figure F2 Alternative 3 Turbine Phase 1 – 2020 Forecasts - Figure F3
Alternative 1 FEIS – 2040 Forecasts - Figure F4 Alternative 2 Three-Quad Cloverleaf – 2040 Forecasts - Figure F5
Alternative 3 Turbine – 2040 Forecasts - Figure F6 Alternative 3 Turbine Phase 1A – 2040 Forecasts - Figure F7 Alternative 3 Turbine Phase 1B – 2040 Forecasts - Figure F8
Crash Reduction - Figure F9 Interchange Weave Areas - Figure F10
2020 Corsim Speeds - Figures F11 – F22 Penn – Lyndale “Box” Network – Access to I-494/I-35W - Figure F23
Penn – Lyndale Traffic Box - Figure F24

Appendix G Construction Cost Estimates
Tables G1 – G9

Appendix H Agency Comments


