[I, · 1. INTRODUCTION: The objective of this project is the acquisition of fundamental knowledge...
136
rDC [I, S5NUV I Z i4 UNIVERSITY OF PENNSYLVANIA ELECTROCHEMISTRY LABORATORY PHILADELPHIA 4, PENNSYLVANIA • / ii, I
Transcript of [I, · 1. INTRODUCTION: The objective of this project is the acquisition of fundamental knowledge...

rDC
[I,
S5NUV I Z i4
UNIVERSITY OF PENNSYLVANIA
ELECTROCHEMISTRY LABORATORY
PHILADELPHIA 4, PENNSYLVANIA
• / ii,
I

SCIENTIFIC AND TECHNICAL INFORMATION FACllITYoperated for National Aeronautics and Space Administrction by Documentation Incorporated
Post Office Box 5700Bethesda, Md. 20014
Telephone 1656-28501656-2851
FACILITY CONTROL NO, ________
DATE .
ATTACHED IS A DOCUMENT ON LOAN
SFROM: Scientific and Technical Information Facility
TO: Defense Documentation CenterAttn: DDC-IRC (Control Branch)Cameron Station
Alexandria, Va. 22314
I-i accordance with the NASA-DOD Cooperative AD Number Assignment Agreement it isrequested that an AD number be assigned to the attached report.
Iv<"As this is our only available copy the return of the document (with ADnumber and any applicable distribution liinitations) to the address belowis essential.
_- This document may be retained by DDC. If retained, please indicate ADnumber 'and any applicable distribution limitations on the reproducedcopy of the title page and return to the address below.
Return Address: Scientific and Technical
Information FacilityAttn: INPUT BRANCHP. 0. Box 5700Bethesda, Md. 20014
DDC
FL2-IRA C
FL 244! i

HYDROG3EN EVOLUTION:
THE EFECT (F SURFACE CONCENTRATION
FnlRep ort~
to
Office of Navil ResearchContract Nonr 551(22) NR 036-028Contract Ending March 31, 1962
Principal Invest.gator - J. 01M. Bockris
Research Associate - M. A. V. Devanathan
Electrochemirtry Laboratory
The University of Pennsylvania
Philadelphia 41, Pennsylvania
Reproduction in whole or in part of this report is permitted
for any purpose of the United States Government.
1o qI
-4- ~ - ~
1. INTRODUCTION:
The objective of this project is the acquisition of fundamental
knowledge concerning the behavior of atomic hydrogen at corrodible wmtal
surfaces, in particular the formation and transfer of atomic hydrogen
into the bulk metal. Such h:nowledge is a prer:equisite to the control and
the final elimination of hy:*rogen embrittlement which causes weakening
Lnd eventual breakdown of stractures in corrosive environments.
The problem can be resolved into two stages. First, a knowledge
of the concentration of atomic hydrogen on the surface of the corroding
metal must be determined. Secondly, the rate of transfer of the hydrogen
into the metal bulk under various conditions must be measured. The
solution, therefore, requires first the development of new techniques
whereby the necessary information may be acquired. The establishment
from this data of a general theory of the kinetics of formation and
transfer of atomic hydrogen into metals will then enable the development
of practical methods of control of hydrogen embrittlement.
2. FACTORS WHICH CONTPOL THE SURFACE COICENTIATION OF HYDROGEN
Atomic hydrogen is produced during the natural corrosion of
ferrous materials, during cathodic protection by externally impressed
cathodic currents, and during plating of protective netal films. In all
these instances the hydrogen is produced by a cathodic hydrogen evolution
reaction. The problem of surface concentration with adsorbed atomic
hydrogen is therefore intimately connected with the kinetics and mech-
anism of the hydrogen evolution reaction. The variation of the surface
concentration or coverage factor 9 can therefore be formulated in general

2
terms as follows.
(A) Hdr.ogen embrittlement and surface concentration of H
Consider a metal surface in solution upon which H2 is evolved
(fig. 1).
Then, if the surface coverage with H is in the steady state,kl - - k_1 - - (k = (1)
where the k values are rate constants appropriate t. the reactions
indicated in fig. 1; cH+ is the proton source concentration in the
double layer.
Hence (1)
kI cH+
CH+ + k_1 + k2 + (kD)l (2)
H+ +0 o--Hads
Thus, suppose klcH+KQk 2 , and V-i
k2y? k_1 (condition of slow discharge
control of the hydrogen evolution reactions), Hads Hads
then:kI cH+ Metal
k + (kD)1 (3)
Or, suppose that k2 k kI and kl- CH+ then: Fig. 1Solution
1 HV 21 + (kD)/ki cH+ (4) H+ + Hads + e - ) H2
(3) and (4) represent limiting exprezsion for the coverage oi"
an electrode with H, assuming a path of electrochemical desorption.
Thus, the rate of diffusion of H into the metal is:
£
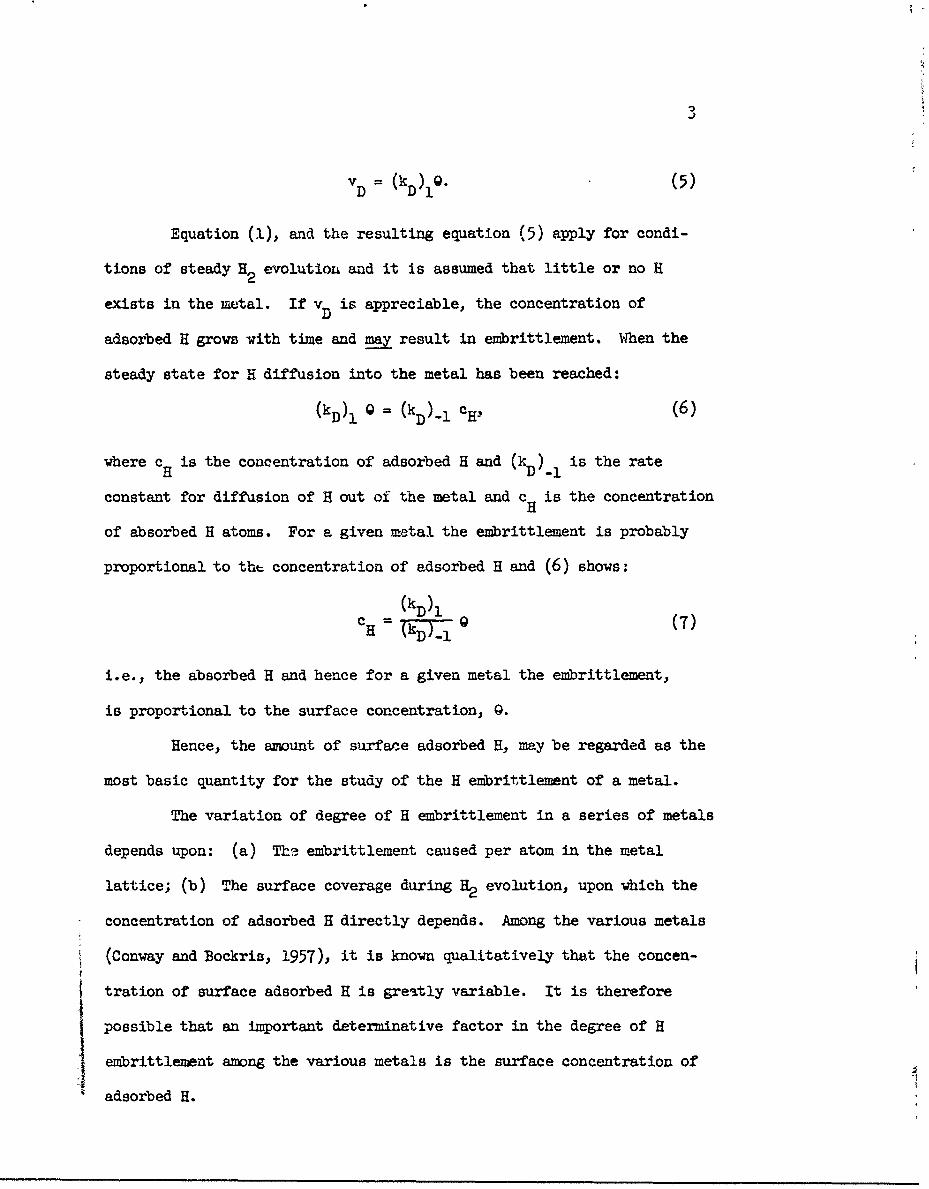
VD ( (5)
Equation (1), and the resulting equation (5) apply for condi-
tions of steady H2 evolutioL and it is assumed that little or no H
exists in the metal. If VD is appreciable, the concentration of
adsorbed H grows with time and may result in embrittlement. When the
steady state for H diffusion into the metal has been reached:
(kD)l 0 = (kD).l CH, (6)
where cH is the concentration of adsorbed H and (k ) is the rate
constant for diffusion of H out of the metal and cH is the concentration
of absorbed H atoms. For a given metal the embrittlement is probably
proportional to the concentration of adsorbed H and (6) shows:
c (kD)l (7)HE 3ý JkD). _1)
i.e., the absorbed H and hence for a given metal the embrittlement,
is proportional to the surface concentration, 9.
Hence, the amount of surface adsorbed H, may be regarded as the
most basic quantity for the study of the H embrittlement of a metal.
The variation of degree of H embrittlement in a series of metals
depends upon: (a) Tha embrittlement caused per atom in the metal
lattice; (b) The surface coverage during H2 evolution, upon which the
concentration of adsorbed H directly depends. Among the various metals
(Conway and Bockris, 1957), it is known qualitatively that the concen-
tration of surface adsorbed H is greatly variable. It is therefore
possible that an important determinative factor in the degree of H
embrittlement among the various metals is the surface concentration of
adsorbed H.

4
3. THE DOUJBLE CHARGIN M.THC
The methods available for the determination of the fraction of
electrode surface covered, Q, have been reviewed in detail elsewhere
(Bockris and Devanathan, 1957).
The most direct method is that of:
(A ) Rapid galvanostatic charg
The method was originated by Bowden (1929) and used by Pavson
and Butler (1939) and others (Breiter, Knorr and Vdlkl, 1955). Diffi-
culties associated with the readsorption of hydrogen from dissolved
hydrogen molecules in solution, or from bubbles on the electrode, are
minimized by the use of high anodic current densities, whereby the
anodic dissolution of the adsorbed atomic hydrogen is completed before
readsorption becomes appreciable. Breiter, Knorr and Vdlkl (1955)
used this method for the noble metals Pt, Pd, Ir, Rh and Au under
cathodic polarization. The method can only be successfully applied if
there is a considerable potential difference between the potential cor-
responding to the completion of hydrogen dissolution eiid that corres-
ponding to the commencement of the next anodic proc-ess (e.g., oxide
formation, evolution of oxygen, etc.), a condition found only with the
noble -metals. When the succeeding anodic processes overlap the hydrogen
dissolution, the definition of the potential region of hydrogen dissolution
becomes diffuse, and the rapid galvanostatic charging method becomes
inapplicable.

5
S) Double charging method
Figure 2, which represents a typical potential time curve obtained
on platinum by the rapid charging method, shows the potential gap B-C
separating the hydrogen dissolution stage A-B and the oxide formation
stage C-D. Figure 3 (curve 1) shows a similar curve for silver under
analogous conditions. No clear region attributable to hydrogen dissolu-
tion is discernible. In the present method, a compensating curve enables
subtraction of the current due to the irrelevant anodic processes to
be made from the total current due to hydrogen dissolution and these
other anodic processes.
4. Tuwy c' TBE DOUBLE CHARGING lTD
Suppose an electrode is polarized to an overpotential, T I , with
a steady cathodic current, ic. Let this current be switched off and a
constant anodic current of magnitude i switched on "immediately".a
Then, after switching in a (total) galvanostatic current density, ia,
Cv( )t ia "',t (8)
where Cv is the capacity of the double layer at a potential V,t is the
time, and 1F the total c.d. for the Faradaic processes occurring at the
potential V (i.e. for the dissolution of adsorbed H, together with the
formation of oxides).
If the degree of surface coverage with H is 9,
'F = 'HQ+ an(1 - 0)(9)where i H, is the current due to the dissolution of H from a total of
1 en? of electrode area (whatever the fraction of this area occupied by H);

6
and ian is the current due to some anodic process vhen this process
occurs on I =2 of an electrode surface which is free from H. Thus il,Q
and ian(l - 0) are both partial currents on 1 am of electrode.
Fro (( aw (10)
'-(I -- d
v• •t,. 1 a ,o+ nl-0)
Suppose galvanostatic charging is now begum on an electrode free
from H (e.g., suppose it is b-gun at a potential sufficiently anodic to
the reversible "2 potential, so that all the adsorbed H has been dis-
solved off the electrode before charging is commenced). Then:
CAI) a (1at tj,2 a an
C For a given potential in the first charging process, from (10)
and (11),
- ' H~ an Q (12)
If, therefore, the potential-time gradients at a series of identical
potentials, i.e. (dV/dt) 1 ,v and (dV'dt) 2 ,v are measured, the value of
('H,e i 'an @)v at a series of potentials can be obtained, knowing the
value of Cv at the various potentials chosen for the series of (dV/dt)v
values.
Consider now a plot of [iH,e + (l - @)ianjv as a function of
a potential. Such a plot is shown in fig. 4., where the corresponding
values of ian are also shown. For sufficiently cathodic values of V,
both [iH, + (1 - G)ian]continues to increase because of the increasing
( contribution of ian. Correspondingly, ian is initially small because the

7
potential is not sufficiently anodic, but at sufficiently high anodic
potentials it increases rapidly and finally coincides with •,I + (1 - @)Jan.
This occurs when the adsorbed atomic hydroger. has dissolved completely
from the surface of the metal and the entire faradaic current is carried
by anodic processes such as oxide formation.
The corresponding plot of the difference of the functions
[i,e+ ian(l- 9)]I and (ian)V is shown in an example in fig. 5. In
the vicinity of the reversible electrode potential, the difference of
the two functions rises sharply, passes through a maximum and falls
asymptotically towards zero at the potential corresponding to the com-
pletion of H dissolution.
The difference of the two functions [i He + ian(l - 9)] and
ian plotted as a function of potential in fig. 4 can now be plotted as
a function of the time needed to reach given potentials during the first
tye of charging process (nmmely, that described by equation (10),
when H is being dissolved from the surface). Examples of a plot of this
difference (i.e., of ilHe - ian 9) against V are given in figs. 6 and
7. The area under this curve is equal to:
too ian e
A = f iH,(8(1 - -- )dt (13)
0 1H..1,
where too is the time at which the plot falls to zero value.
When this function has a maxim= value, namely, at small times,
and potentials near to the reversible potential, it is seen from the plot
in Fig. 7 that ian is very small. This suggests that ian @/l'H 1H, .
-I ,

8
Further,
i~j e + As Ja
where A = - Jan and Jl i je + (1 - G)ian, the faradaic current in
the first charging process. At short times, inspection of fig. 4 shows
that /i an>> I and therefore the "error term" in equation (13) tends
to be negligible. At long times, Q -4 0, and the error term is hence
correspondingly small.
Neglecting, therefore, the effect of the term iang/i,, the
integral of equation (13) gives the amount of adsorbed H on the electrode
under the conditions of cathodic polarization corresponding to the be-
ginning of the first anodic charging process.
r
5. STUDIES ON SILV.
Silver was selected for these studies. With alkaline solutions
on anodic charging, oxide formation should overlap with and succeed the
dissolution of H, and then be followed by oxygen evolution. Thus, the
solution would not be contaminated by silver ions in successive anodic
discharges.
(A) The cell and gas purification trains were similar to those
already described (Azzam, Bockris and others, 1950).
(B) Preparation of alkaline solutions: The solutions of HaOH
were made from electrolytic Na amalgam. Hg was distilled three times,
and the cathode was placed in a 20, solution of A.R. Is.OH. The electrolysis

9
was continued until the amalgam was viscous., the electrolyte siphoned
off and the amalgam washed in conductivity water. It was transferred
by means of helium pressure into a solution preparation vessel and
covered with conductivity water. During the dissolution of the amalgam,
the solution was in contact with purified helium only.
The NaOH solution was pre4lectrolyzed cathodically for at least
two days. The c.d. for the pre4lectrolysis was 10-2 amps cm-2. The
solution during pre4lectrolysis was about 0.5 N and was diluted with
conductivity water., distillcd into the test electrode compartment of
the cell., to 0.1 N NaOH (determined by titration of portions drawn
through a trap from the cell).
(c) water: This was prepared as described (Azzam, Bockris andothers, 1950). It had a conductivity of "'. 5.10-7 -1
jA- cm It was tested
frequently for traces of permanganate.
The water was refluxed in purified He for three hours. After
distillation into the cell it had a conductance of < 2.107_n_ =-I.
(D) Electrodes: Spectroscopically pure Ag wire, diameter 0.2 mm,
was spot welded to W as follows: 3 mm of the wire was dipped into
colloidal Pt solution and heated in a small (cold) flame to form an
adherent deposit of Pt. Alternatively., the Pt was deposited electrolyt-
ically from a solution of H2PtCl6. The Pt coated end was spot welded
to 0.5 mm W wire.
Other details concerning electrode preparation resemble those of
Bockris, Conway and Mehl and are detailed in Bockris and Devanathan
(1957).

10
(E) Circut: The circuit Is shov in fig. 8. A is a conven-
tional cathodic polarizing circuit. B consisted of a 90 V battery
source with a variable high resistance in series. The auxiliary electrode
for the anodic charging was the Pt plate, and the low resistance (about
10.AL) between this And the test electrode ensured that the current was
controlled only by the high resistance, so that it remained constant
during an anodic charging pulse.
Change-over from the cathodic to anodic circuit was affected in
a time interval of about 2^s-e, by means of a special switch S, des-
cribed by Mehl, Devanathan and Bockris (1958).
(F) Procedure:
(1) The cell was allowed to stand in contact with chromic-
(-- sulpburic acid for 2 - i days. The acid was removed, the cell filled
with distilled water and emptied about ten times and care was taken to
wash out acid in the sintered discs by streaming distilled water through
them under pressure.
(2) Before each run the cell was allowed to stand in nitric-
sulphuric acid uxitures for 2 - 3 hours. The above washing procedure
was repeated. The cell was thereafter rinsed three times with equilib-
rium water.
(3) The cell was filled with equilibrium water. The auxiliary
"bridge" connections were made to the cell, the cap removed and the
electrodes sealed in thin -lass protecting bulbs placed in position in
the cap, whereafter the latter was returned to tha cell.

(4) The conductivity water was removed under Ae pressure and
the distillation of water into the test electrode compartment and in He
comenced. The distillate was allowed to fill the cell and drain away.
This procedure was repeated until the water had the specific conductance
of 2.10 "7/ cmam The cell was filled completely with conductance water
distilled into the cell in helium and again drained.
(5) A small quantity of the preglectrolyzed NaOH solution was
admitted to the cathode compartment and diluted by distilling in more
conductance water.
(6) The solution was admitted into the reference electrode and
cnode compartments and pre~lectrolyzed on a Ag electrode at a c.d. of
10"1 soMps cm-2 for 36 hours, while purified oxygen-free He was bubbled
through cathode and anode compartments.
(7) The preglectrolysis current was interrupted by raising the
preglectrolysis electrode above the level of the solution; one of the
bulbs surrounding a spherical Ag electrode was broken cautiously (to
avoid breaking the stem) under the solution with the &id of a glass
probe in the cell, connected to the exterior by mebns of a slip joint
lubricated with conductance water. On this electrode, 2 overpotential
measurements were carried out over the c.d. range lO"2 - lO"7 amps cM" 2
(the sphere was positioned so as almost to touch the Duggin capillary).
These measurements were unsatisfactory, the galvanostatic measurements
were not carried out, or pre~lectrolysis was continued for a further
period, until satisfactory q -log i current density relations were
obtained, indicating a satisfactory degree of removal of impurities and
depolarizers from the solution.

12
(8) An auxilialy cylindrical Pt electrode was lowered into
position around an Ag electrode.
(9) The test electrode was polarized to the desired steady
cathodic potential, and the change-over switch pressed (S, Fig. 8), the
emodic circuit having been previously adjusted so that the desired
constant anodic current would be thereupon impressed upon the electrode.
(10) The potential-time relation was registered on an oscillo-
scope (Tektronix 535) with preamplifier (53-54D., Tektronix). To avoid
excessive drain from the cell through the preamplifier, an attenuator
probe, with an input impedance of 10 M XL was used between the test
electrode and the preamplifier.
(ii) The transients were recorded on an Exakta camera with short
1. focus attachment (f - 1.9; exposure 1/10 sec approx.). Persistence of
the image made use of a synchronization device unnecessary.
(12) The transients were traced onto graph paper at a magnifica-
tion of 50 times that of the oscilloscope screen size.
6. RESULTS
(A) Typical relations
The Tafel plot for the hydrogen evolution on silver in aqueous
0.1 N NaOH solution is reproduced in Fig. 9. The Tafel constants were
found to be b = 0.124 + 0.001 and io U 10-6.5 + 0.1 as mean of ten
results.
In Fig. 3 are shown a typical pair of charSing curves. The
mnber of coulombs required to dissolve off the adsorbed atomic hydrogen
under various conditions of polarization were obtained from each set of

13
curves as follows. From the curve of type (I) (transient starts from
cathodic condition) the capacity C of the electrode system was calculated
from the gradient of the charging curve in its linear region at low times,
i.e., before the commencement of any dissolution of adsorbed hydrogen.
A number of these points was measured (front silvered mirror and set
square) for both curves of type I (see above) and type 2 (transient starts
at a potential anodic to the reversiobl H2 electrode). The currents
and ian were calculated from equations (8) and (11) for various potentials
using the previously obtained value for C which was assumed to be constant
throughout the potential range. (Errors involved in this assumption are
discussed below.) Fig. 4 shows these currents plotted against the poten-
tial. A plot of the difference in these values against the potential is
shown in Fig. 5. The dissolution of the adsorbed atomic hydrogen is
assumed to be complete when the difference of 'F and ian, namely, the
current function of Fig. 5, becomes insignificant. The same difference
in current densities, plotted against the time required to attain the
respective potentials in the case of the first type of charging curve,
is shown in Figs. 6 and 7. ( H is obtained from the area under the plots
examplified by these figures (cf. Section 4, equations (13) and (14)).
(B) QH as a function of the anodic current density
In Table 1 is shown the results for Q. at a constant cathodic
polarizing current density of 10-3 A. cm"2 for c•urrent densities of anodic
charging from 5.10-3 to 4.10-1 A. M-2. The results are presented
graphically in Fig. 10. QH becomes constant at about 55/AC.cm" 2 when
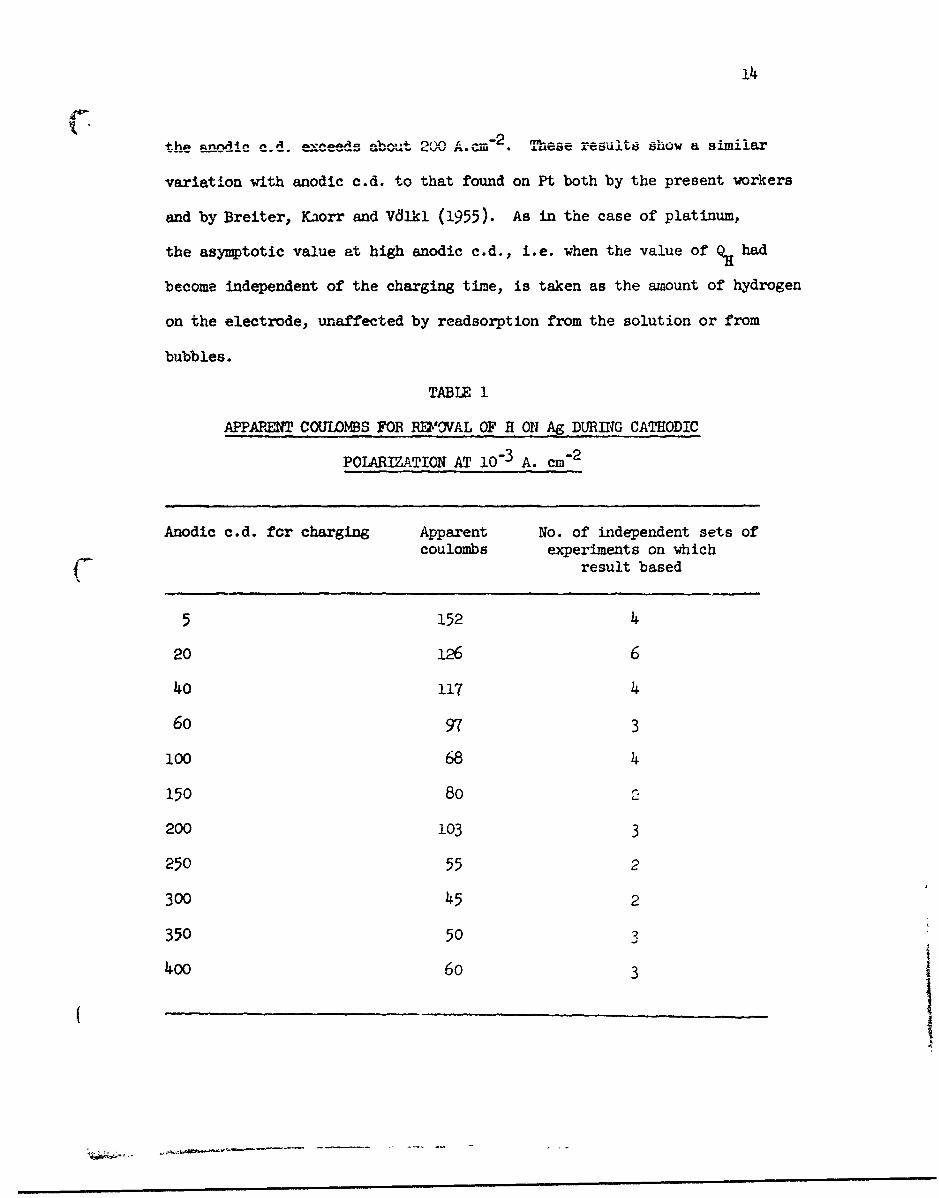
14
the sannA~.i' CAd _,:_nj aboA20 These result,3 show a. similar
variation with anodic c.d. to that found on Pt both by the present workers
and by Breiter, Kaorr and Vdlkl (1955). As in the case of platinum,
the asymptotic value at high anodic c.d., i.e. when the value of % had
become independent of the charging time, is taken as the amount of hydrogen
on the electrode, unaffected by readsorption from the solution or from
bubbles.
TABLE 1
APPAPENT COTJLOMBS FOR RE'OVAL OF H ON Ag DURING CATHODIC
POLARIZATION AT 10-3 A. cm- 2
Anodic c.d. for charging Apparent No. of independent sets ofcoulombs experiments on which
result based
5 152 4
20 126 6
40 117 4
6o 97 3
100 68 4
150 80
200 103 3
250 55 2
300 45 2
350 50 3
400 6o 3

15
(c) qH as a function of cathodic current density
Results obtained at various cathodic c.d.'s at a constant anodic
charging c.d. of 100 mA. cm"2 are given in Fig. 11. QH varies linearly
with the logarithm of the cathodic c.d.
(D) QH as a function of poison concentration
The cathodic c.d. was 10-3 A. cm" 2 and the anodic c.d. was 200
mA. cm" 2 . Arsenious oxide was used as the poison. The As203 concen-
tration was varied from 10-6 to 10-4 moles per litre. Change of As2 03
from zero to IC-4 moles per litre caused a 250% increase in the surface
hydrogen concentration.
7. DISCUSSION
(A) Validity and accuracy of the method
(1) Evaluation of
The hydrogen on the electrode surface is given by means of the
integral
% = f iH,9dt, (15)0
whereas in the above described method, the integral
tOD i an
JI G ( H - -Hdt (16)
is used for the evaluation. It is necessary, therefore, to analyze the
error thereby introduced.

16
In Figures 3, 4 and 6 and 7 are shown, respectively, charging
curves for Ag in 0.1 N NaOH; the derived curves of iHQ + (i - Q)ian
and Jan as a function of potential, and the corresponding relation of
iHQ 11 - (iano/iR.,Q)] as a function of time.
Referring to the points on Fig. 4 by the number there given, it
is clear that values of iH,@ [i- (ianQliH, )] are effectively free of
error up to point 6. At point 7, the small error introduced into the
plot can be calculated as follows. The "error term" in equation (13) is:
ian. = 1 /n (17)
where 6 is defined in Section 4.
For point 7, uf Fig. 4, the error term has the numerical value:
1i/(I + 1.9/0( 7 )). Now Q(7) i.e. the coverage with H corresponding to
point 7, can be evaluated with negligible error because the foregoing
point 6, 5, etc., yield data free from error (ian -9 0). Subtracting
the QH up to 7 from the total, one obtains 24 coulombs of charge which
correspond to the H still to be removed from one cm2 of the electrode
(Veselovsky, 1939). The ratio of real to apparent surface area of Ag
is not less than 2 (Kortnm and Bockris, 1951). Removal of one true
em2 of H from a Ag surface requires 238 microcoulonfs. He.,ce, the
maximum fraction of Ag covered with H at point 7 is 24/476 :c 0.05.
Hence, the value of the error term for point 7 is 1/(i + 1.9/0.05) =
1/38 - 2.7%. Similar analysis for all further points to the right of
7 in Fig. 4, shows a smaUer error than this owing to the rapid decrease
of 9 at times greater than that of point 7. The correct value of the
4

17
A... r•4+Ij i F1 - (i o/i I. is found to be never 3• less" H L-7 "-an-' -H, "j"
than i.. The fact that in, e.g., Figs. 6 and 7, the relation plotted
is i H L1 - (ian 9/iH, 9)] and not iH therefore implies an error of less
than 3ý.
(2) Capacity
In principle, it is necessary to use in, e.g., equation (12), the
value of the double layer capacity from independent measurements at the
various potentials for which iH - ian@ is evaluated. In the absence of
such independent values of Cv, approximate values of the capacity can be
obtained from the charging curves themselves at low times, e.g., for the
second type of charging curve at low times, when i = 0, andan
c 2 ia (18)
Alternatively, for the first charging curve at sufficiently low times,
c 21) 1 i(19)v• att, a
The latter equation is more convenient to use because the potential-time
relation at the commencement of the second charging curve is obtained in
the presence of an appreciable IR drop, at high anodic c.d.'s.
The error introduced by the use of a Cv value independent of
potential can be estimated as follows. Let it be assumed that the
maximum capacity change which occurs over the potential region investi-
gated is 10(OJ, i.e., the percentage change observed on a Hg electrode
during the transition from the extreme negative to The extreme positive

18
side of the electrocapillary maximm. (This assumption represents an
overestimate of the probable change in Cv with V because, in the potential
range of the transients, the potential is always in a region negative
to chat of the e.c.m., so that, by analogy with thi behavior of Hg,
the probable change is likely to be < 20%.) The larger part of any
change in Cv would be expected to occur in the most positive potential
range (cf. Hg). Reference to Fig. 4 shows that this is the region at
which mst of the H has already been dissolved off and the curves I
and Ly are rapidly coming close together. Let it be assumed that the
capacity becomes 75% greater over the potential range + 200 to 600 V
(cf. Fig. 4). Let the capacity increase linearly with potential over
this range. Numerical computation upon these assumptions utilizing
C equation (12) and the results of Figs. 4 and 5 show that the resulting
error on the overall result arising from the capacity changes assumed
is less than 4% (results reported are too small).
A further error might arise from increase in capacity in the less
positive potential region, e.g.,. that near the reversible potential.
Here, the maximum reasonable capacity change will be much less than that
discussed for the positive region. However, the effect on the results
will be greater than effects in the positive region because the value of
(dy/dt) 2 - (dV/dt) 1 is greater in the more negative potential regions (cf.
equation (12)). Let it be assumed, referring to the typical results in
Figs. 4, 6 and 7, that the capacity increases linearly with potential by
25% between the reversible potential (V = 0) and that of V = + 200 mV.
The resulting computed error is about lOC (reported results too low).
~ ( The total from the reasonable maximum capacity change is hence some 14%

19
for the example of Figs. 4, 6 and 7. Application of a similar analysis
to charging curves at other potentials shows a similar percentage error
for the portion at lower potential. The total error arising from possible
capacity changes may be assumed to be less than 20% (stated results too
small).
(3) Partial pressure of H2 in solution
He is bubbled through the solution in the test electrode compart-
ment during the measurements so that the reference electrode, and the test
electrodes are under different partial pressures of 12, However, this
is true only of the bulk of the solution. In the vicinity of the test
electrode during anodic charging, the solution is likely to be saturated
with H2, due to the evolution of H2 during the cathodic polarization
which precedes the anodic pulse. Suppose this pressure were to fall
to 1/10 of atmospheric pressure, due to presence of He. The potential
of the test electrode in the absence of current would become 29 mV more
positive than that in contact with H2 at 1 A. The actual change is
likely to be negligible for reason stated.
(B) Degree of coverage on silver in alkaline solution
The results for the number of coulombs required to ionize the
adsorbed hydrogen present per unit area of the electrode under steady
state cathodic hydrogen evolution are given in Table I as a function of
anodic current density'. The asymptotic value free from errors of read-
sorption is some 50.,A C.cm- 2 for an overpotential of - 400 WV, in 0.1 N

20
NaOH. Results at other overpotentials are given in Fig. 11. Assuming-2
that the apparent area is twice the real area• one has some 25 )LA C. cmn.
This (see above) indicates a Q value of about I0( under the stated con-
ditions.
8. STUDIES ON NICKEL
Ni electrodes find extensive application in strongly alkaline
solutions and therefore this system was selected for study.
(A) Ni electrode
B.D.H. nickel rod fitted with a polythene sleeve was used as the
test electrode. A polythene rod 1/2 in. diam. and 2 in. long was drilled
axially to an lat. diam. of 3/32 in. A nickel rod 4 in. long and i/8 in.
diem. was then forced through the hole in the polythene rod to obtain a
water-tight fit. The polythene-covered end was machined flat Do as to
expose only the area of cross-section (0.083 sq. cm.).
(B) Cell and Auxillay Eiectrodes
The cell (see fig. 12) was made of Pyrex glass and had three
compartments. The test electrode was a B34 test-tube and was connected
on either side to B14 test-tubes, which served as the anode in the
reference electrode compartments. The diffusion of oxygenated anolyte
into the test chamber was pievented by means of a sintered disc inserted
between the compartments. The Luigin capillary from the reference elec-
trode compartment was centered vertically upwards in the test chamber.

21
Provision waa made to admit purified hydrogen into the test and reference
electrode compartments through capillary •ubes.
The anode compartment was fitted with a bright sheet of platinum
and this was used for the cathodic polarizatiun of the test electrode.
The reference electrode was the hydrogen electrode prepared in the con-
ventional manner. In the test electrode compartment were two electrodes;
the polythene-sleeved nickel electrode was surrounded by a platinum
cylinder 3/4 in diam. and 2 in. long. The platinum cylinder was used
as the cathode, first during the pre-electrolysis and later, for the
anodic polarization of the test electrode. These two electrodes were
mounted on a polythene stopper whicn fitted tightly the B34 cone. The
B34 cone and the reference electrode had bubblers containing distilled
water to prevent diffusion of air into the cell.
(C) Electrolyte
Sodium hydroxide solution (2 N) was used as the electrolyte.
Merck's pellets (extra pure quality) of sodium hydroxide were dissolved
in conductivity water, which was prepared by alkaline permanganate oxid-
ation of distilled vatcr, followed by two distillations from an al' -gloss
well-seasoned Basa still. the specific conductivity of this water was
0.4A- mhos.
(D) Purification of HyIrogen
Commercial electrolytic hydrogen was deoxygenated by passage
through a palladized asbestos furnace. The gas was bu`,bled through water

22
and fed by 2 tubing to the test and reference electrode .ompart-
ments. The rate of bubbling of hydrogen was easily controllid using
plastic aquarium-type regulator valves.
(E) Electrical Circuit
The circuit izscd Is given in Fig. 13. There were two polarizng
circuits - one to polarize the Ni electrode cathodically and the other
to polarize it anodically. The Ni electrode was first polarized catnod-
ically and the change to anodic polarization effected instantaneously.
This was achieved by using a special relay with a rise time of 10-7 secý
The cathodic polarizing circuit was never shut off. On switching on the
anodic current by means of this relay, the test electrode became anodically
polarized. Since the anodic current was at least a hundred times larger
than the cathodic current the effect of the latter is negligible when
calculating the anodic c.d. Leakage of the anodic pulse into the cathodic
polarizing circuit was prevented by including a high-calacity choke.
For cathodic polarization, a conventional battery-powered circuit
was used. The current through the circuit was measured by a Cambridge
unipivot multirange microasmeter. For very small currents, the potential
across a standard 10 x 1 megohm resistor was measured with a Doran
valve potentiometer, and the current calculated.
For anodic polarization the current source was a high-capacity
90 V battery. The current through the circuit was varied by adjusting
the resistance in a resistance box. Since the resistance between the
platinum cylinder and the test electrode was negligibly small the anodlc
current wes controlled only by the resistance box.

23
(F) The Rely
A Western electric relay using mercury-wetted contacts in high-
pressure nitrogen (type 275B) was used. It was operated by a 90 V
battery and a micrusvitch vith a suftable filtering circuit.
(G) Measurin& a&d Etcording Apparatus
(a) Potentiometer: Doran pH meter reading to + 0.0005 V;
(b) Oscilloscope: Tektronix type 535 with 53/,54 D high-gain
differential d.c. amplifier;
(c) Camera: Exakta Varex IiA fitted with Makro Kilar D 1:2.8/4 cm.
(H) Procedure
The cell was cleaned with dichromate + sulphuric acid mixture and
washed thoroughly with distilled water. It was rinsed several times with
sodium hydroxide before introducing the solution. The exposed area of
the nickel electrode was scraped with a clean grease-free blade to give a
bright surface. The solution was pre-elect.-oly7ed at 25 mA (power pack)
for 3 - 4 hrs. using the bright platinum sheet as anode and the platinum
cylinder as cathode. During pre-electrolysis as well as during measure-
ments, a steady stream of hydrogen was bubbled through the test and the
reference electrode co:partments.
After pre-electrolysis, hydrogen overpotential measurements were
carried out over the c.d. raxge 10-1 to 10-6 A. cm" 2 , the test electrode
being fitted so as almst to touch the Luggin capilary. Galvanostatic
anodic charging was then carried out. The test electrode was polarized

24
cathodically at any desired c.d. An anodic pulse of predetermined
magnitude was then passed through the nickel electrode by pressing the
microswitch. The Ni electrode imnediately became anodic and the rate of
change of potential from cathodic to that of oxygen evolution was
registered on the oscilloscope. The oscilloscope trace was photographed
on a fast green-sensitive recording film using the Exakta camera fitted
with the close-up lens (exposure for about 3 sec at B). For any com-
bination of cathodic and anodic c.d., 2 oscilloscope traces, the normal
and the compensation, were obtained. The normal curve was that obtained
starting from the equilibrium overvoltage at any cathodic c.d. The
compensation curve was obtained imnediately after the normal curve. When
the microswitch was released, there was only cathodic polarization of Ni
and the potential of the electrode gradually changed from the anodic
towards the cathodic side. The compensation curve was produced by
switching on the anodic polarization circuit when the potential of the Ni
electrode had fallen from + 25 to 50 mV, as measured by the potentiometer.
The compensation curve obtained starting at + 25 mV was nearly identical
with that obtained starting at + 50 mV, indicating the absence of adsorbed
hydrogen on the surface between these potentials. This is also supported
by the low values for the capacity (20A F), calculated from the compen-
sation curve. The film was placed in an enlarger and the oscilloscope
trace was drawn on cm. graph paper at a linear magnification of four times
the oscilloscope screen size. The gradients of the normal and compensation
curves were found at various points by graphical differentiation using
a front-silvered mirror and set square. All measurements were carried
out at room temperature (26 - 280 C).

25
9. RESULTS
(A) O ontilResults
Overpotential measuremeuts or Ni cathodes in alkaline solutions
have been published only for dilute solutions (Bockris a&-d Thacker,
1959). These results, which were obtained with hydrogen-saturated wire
electrodes, show that overpotential decreases with increase in alkali
concentration. Our results are for electrodes which had not been
previously heated in a hydrogen atmosphere. Hence, one would expect
lower energies of activation for the discharge of H+ ion. This, conse-
quently, is another factor causing low overpotential values. Our
results are in accordance with expectations and are sho;n in Fig. 14.
The reproducibility was + 2 mV at low c.d.'s rising to + 10 mV at high c.d.'s.
(B) Calculation of qH
In Fig. 15 are shown a typical pair of galvanostatic charging
curves. The term (iH - iang) at any potential was calculated from the
gradients of the normal and the compensation curves using eqn. (16). A
plot of (i H - iang) against tN' where tN is the time required to reach
this potential on the normal curve, is given in Fig. 16. The area under
the curve gives the quantity of electricity (qH) required to dissolve all
the adsorbed atomic hydrogen which was present on the cathodically polar-
ized surface.

26
(C) Variation of qH with Anodic c.d.
This variation at a constant cathodic c.d. of 10-4 A. cm" 2 is
given in Fig. 17. It is seen that qH has a constant value of about
55JAC cm.- 2 at anodic c.d.'s exceeding 0.6 A cm"2 . This shows that
re-adsorption of hydrogen is negligible at anodic c.d.'s above 0.6 A.
cm. -2. The results were reproducible to + 5 ,wC except in the regions
where there was re-adsorption.
(D) Variation of ql with Cathodic c.d.
To stud- this variation, the anodic c.d. vas kept constant at 1
A. cm. -2. At this value there is no re-adsorption of hydrogen. The
results given in table 2 show that q. values at cathodic c.d. 's exceeding
10"3 were very large and variant. This is evidently due to re-adsorption
from hydrogen bubbles sticking to the electrode. This phenomenon has
also been observed on noble metals by Breiter, Knorr, and Vdlkl (1955),
and on Ag by Devanathan, Boe.:kris and Mehl (1959/60).
(E) Degree of Coverage
For this calculation the roughness factor (r.f.) should be first
obtained. This was calculated from the capacity of the electrode. The
average value obtained for the capacity was 20,u F. Since the capacity
of the Hg electrode under cathodic polarization has been shown by various
workers to have a value of 16 .L F, the roughness factor of our nickel
electrode was 1.25.
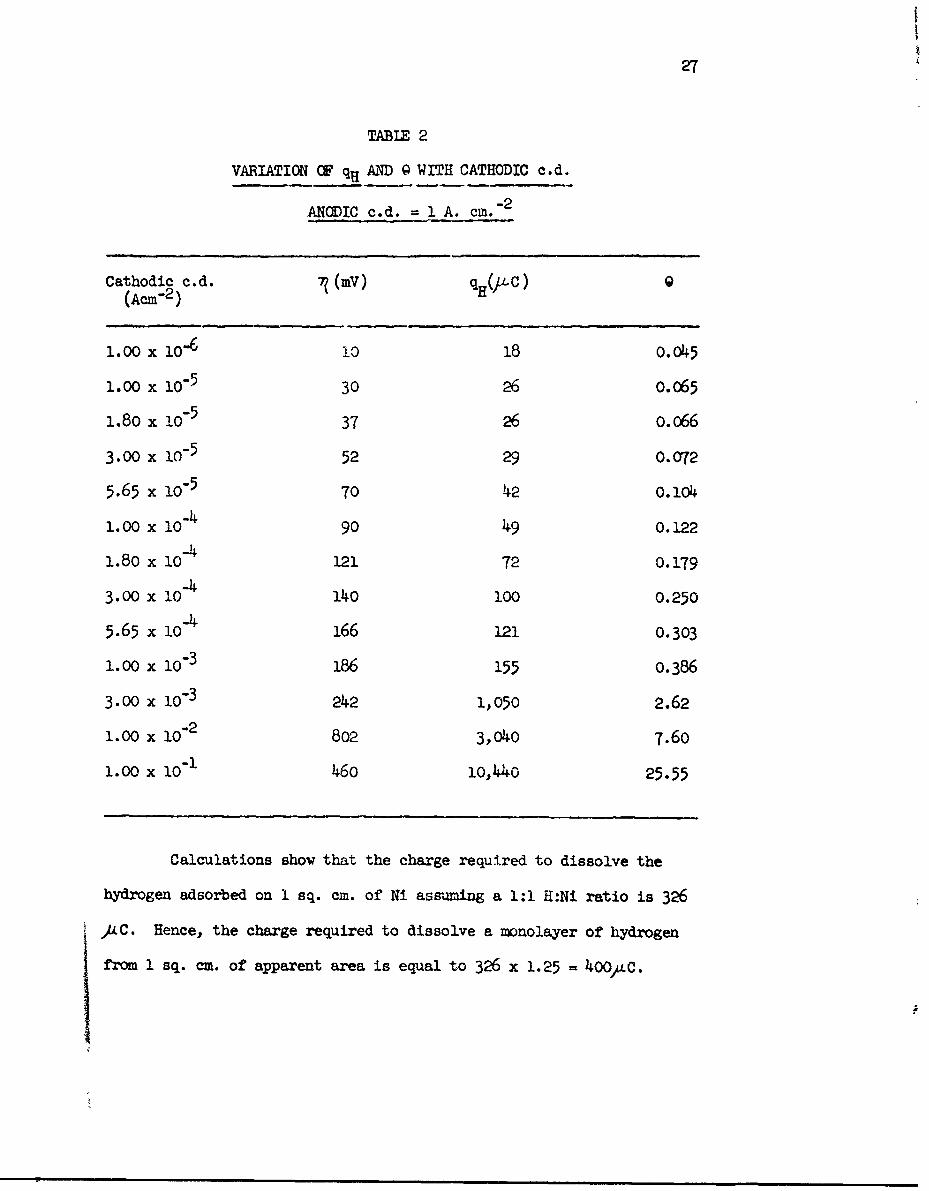
27
TABLE 2
VARIATION OF qH AND Q WITH CATHODIC c.d.
ANODIC c.d. 1 A. cm. 2
Cathodic c.d. 7?(mV) qH(,L.C) 0(Acre2 )
1.00 x 10⁻⁶ io 18 0.045
1.00 x 10⁵ 30 26 o.o65
1.80 x 10⁻⁵ 37 26 0.066
3.00 x 1O"5 52 29 o.C072
5.65 x 10"5 70 42 0.104
1.00 x 10⁻⁴ 90 49 0.122
1.80 x 10"4 121 72 0.179
3.00 x 10⁻⁴ 140 100 0.250
5.65 x 10⁻⁴ 166 121 0.303
1.00 x 10⁻³ 186 155 0.386
3.00 x 10⁻³ 242 1,050 2.62
1.00 x I0"2 8o2 3,040 7.60
1.00 x I0"1 460 10,440 25.55
Calculations show that the charge required to dissolve the
hydrogen adsorbed on I sq. cm. of Ni assuming a 1:1 H:Ni ratio is 326
AC. Hence, the charge required to dissolve a monolayer of hydrogen
from 1 sq. cm. of apparent area is equal to 326 x 1.25 = 400)4C.

28
Values of Q calculated in this way are recorded in column 4 of
Table 2.
10. STUDIES ON C(TPER
Some experiments were carried out on copper in 0.2 N NaOH
using the same technique and apparatus used for silver. As expected
the number of coulombs for the dissolution of hydrogen decreased asyMp-
totically as the anodic current increased. The results are given in
Table 2.
TABLE 3
Anodic cd. mA/cm&2 H C/cM. 2
5 300
250 180
4oo 4o
Ui. MECHANISM OF THE HYOGEN EVOUJTION REACTION ON SILVER
(A) Dissolution of H at Cathodic Potentials
According to Figs. 4 and 5, the dissolution of H commences at
potentials of about -150 mW with respect to the reversible 2 electrode.
This is not a thermodynamic anomaly because the electrode during anodic
charging is not under reversible conditions. Consideration of this
potential of dissolution gives information concerning the rate-determining
reaction for the hydrogen evolution reaction at Ag in 0.1 N NaOH.

29
Suppose that this step is the rate or proton discharge from
water molecules (the following desorption step being combination of
adsorbed H atoms). Then, if 9 is the degree of coverage at the
overpotential corresponding to the cathodic current density obtaining
before anodic charging commenced, and 9 that corresponding to theR
reversible potential,
Mi02 e - 7(I- ( o)-?F/RT] (20)1 -OR,
where ic is the steady cathodic current density before anodic charging,
° is the exchange current density, and - is the steady state over-
potential corresponding to time t = o, i.e., the time of commencement
of anodic charging.
When the steady cathodic current is replaced by the anodic charg-
ing current, this is at first used largely to bring about rapid change
to the potential of the electrode, i.e. as a capacitative current. During
this early part of the anodic sweep, it may be assumed that the value of
0 lags behind the steady state coverage corresponding to the (ri\pidly
changing) nt. Let it be assumed as an approximation that, in the period
of the anodic pulse referred to, 9 = "t.o From (20), the current, ic,
becomes anodic when (assuming Q and Q are not near to I),
Se'l- )'" tF/RT >e',- e tF/RT (21)
i.e.RT OR (22)
t,dissoiltion = ( 2n
wtt=o
where 71t.~ dissolution is the electrode potential, with respect to the

30
of H Comenced during the adie weep.
From Fig. 1i,
,R 10"75; "H 102.1 (23)
Hence, ýtdissolution - 80 mV. in reasonable agreement with
the - 100 to - 200 mW observed.
Assumptions concerning the rate-determining step other than
that suggested (see above) are not consistent with the potential at
which dissolution becomes appreciable.
(B) Variation of Coverage with Potential
On the basis of the above stated rate-determining step, it can
be shown that :8
- Ke -F/4RT (24)
where K is a constant, i.e.:
- - 4 x 2.303 RT/F-n -0.24 at 250C (25)Slog
The results of Fig. 9 are quaiitatively in agreement with this
equation and yield b/3 ln Q = - 0.31. The results at the highest
overpotentials show a tendency to decrease in slope, i.e., for Q to
become decreasingly dependent upon potential. If the electrochemical
mechanism were the rate-controlling step in the h.e.r. (Bockris, 1954)
on Ag,*Q $ f(q). The tendency observed may, therefore, indicate the
commencement of partial control by the le + + e° + .e H2 reaction at
the highest overpotentials examined.

31
The results of Fig. 11 are inconsistent with a rate-determiningst-p o " ̂- oth than that nf porton discharge, followed by non rate-
determining desorption by means of combination of adsorbed atomic H. Thus,
were the desorption step the non rate-determining reaction H+ + Had + e-0
-* H, 9 would be independent of potential (Bockris, 1954). Were the
rate-determining step 2 Hads -ý H 2.
G = K' e- F/RT (26)
at low coverages, i.e. O •/c log Q = - 2.303 RT/F.2-- 0.c6 at 25 C, in
marked disagreement with the results of Fig. 11.
These observations hence support a rate-determining discharge,
followed by atomic combination as the mechanism of the evolution of H2
on Ag in 0.1 N NaOH. This obseivation supports the mechanism suggested
from determination of the stoichio-metric number (Pentland, Bockris and
Shelden, 1957).
A rate-determining electrochemical desorption reaction has been
indicated for the hydrogen evolution reaction in acid solutions (Pentland,
Bockris and Shelden, 1957; Conway and Bockris, 1957). (However, as a
result of potentiostatic studies in acid solutions a rate-determinlng
discharge with descrption by the electrochemical reaction has also been
reported (Ger-.scher and Mehl, 1955)). A change from a rate-determining
step of electrochemical desorpticn to that of slow discharge upon passage
from acid to alkaline solution has been indicated as a probably general
tendency (Pentland, Bockris and Shelden, 1957); because discharge from
water molecules would be expected to be associated with a heat of acti-
vation considerably greater than the corresponding discharge from protons

32
(Parsons and Bockris, 1951; cf. also Frnin; 18521)
12. MSCHANISM OF THE HYDROGEN EVOLUTION REACTION ON COPPER
The Tafel slope, stoichiometric number and the order of magnitude of
the coverage with hydrogen atoms suggest thalt the mechanism on copper is
also the same as that on silver, namely slow discharge followed by recom-
bination.
13. MCHANTSM CF THE HYDROGEN EVOLUTION REACTION ON NICKEL
Our measurements of " at various c.d. s on Ni in alkaline solu-
tions enables us to determine the stages involved in the cathodic evolution
of hydrogen. The first step in the evolution of hydrogen must be the
discharge of a hydronium ion bath A), or a water molecule (path B),
to yield adsorbed atomic hydrogen on the Ni surface:
(A) H30+ + Ni + e = NiH 2 0,
(B) O+ Ni + e =NiH + OH_.
In strongly alkaline solutions (2 N.) path A is unlikely as the concentra-
tion of hydrogen ions ij negligibly small and it appears that the discharge
of a water molecule is the first step in the formation of adsorbed atomic
hydrogen.
The removal of this adsorbed atomic hydrogen from the surface
could proceed either by electrochemical desorption (path C), or by Tafel
recombination (path D):
(C) 30 + e = 2+ H2 0+ Ni,1
(D) NiH +NO =H1 2 +2Mi.
jt .---- --" -,

33
I4. RATE-Rn nING STEP
Since for reasons already given, path A is unlikely, any one of
the steps B, C or D could be rate-determining. It has been shoun that
when discharge is the rate-determining step the stoichiometric number is 2.
This nunlber v can be determined using the equation,
v = 2i IT ,0 ( di a (27)
or, approximately, from the point at which the overpotentiLal deviates
f.om the Tafel line due to the ionization of hydrogen. v is then given
by the equation,
v = v'/0.038, (28)
where VI is the potential at which there is the break in the overpotential
curve. We have calculated v by both methods and found the stoichiometric
number to be 2. Therefore, the rate-determining step in the evolution
of hydrogen on aickel in strongly alkaline solutions is slow discharge
frcm a water molecule. If slow dircharge is the rate-determining step,
it is reasonable to expect small values for 0. Fig. l16 shows Q plotted
as a function of log c.d. It will be seen that the values indicate low
coverage up to & c.d. of 5 x 10⁻⁴ A. cm"2 . Thereafter, there is an
extremely rapid rise whi-h we attribute to re-ad- orptin from hydrogen
bubbles sticking to the electrode surface.
!5-. DESORPITION MiMCHAUSM
I The desorption of adsorbed hydrogen atoms can proceed through
STafel recomnbintion or by am electrochemical mechanism. If Tafel recom-
a binatiwn is the desorption step, then

k
34
2kT (29)
Electrochemical desorption can be fast, or slow and rate-determining.
For the latter case,
i= K. (30)
For fast electrochemical desorption.. should be independent of the c.d.
A plot of log i against log 9 would therefore give a gradient of zero for
fast electrochemical desorption, 1 for slow electrochemical desorption and
2 for Tafel Tecombination. Our results plotted in this way are given
in Fig. 19. The gradient is two, thus proving that Tafel recombination is
the desorption step. It should also be noted that this result is not
affected by the value of roughness factor assigned in the calculation of
0. For a different value only the intercept is changed.
The value, 10-2.2 A. cm"2 of i at log @ = 0 gives the ratec
constant in A, for the recombination step.
16. THE TAFEL EQM'MION
The Tafel equation is based on the formula
i = io exp (-oc 7 F/RT). (31)
In this equation, i. is the rate of discharge of hydrogen ions on 1 sq.
cm. of the electrode surface when 17 = 0. It is apparent that this i ,
comonly called the exchange current, is only a partial current, since
even at the reversible potential there is some coverage with atomic
hydrogen. In order to get the rate constant for the discharge of hydrogen
ions it is necessary to correct for the coverage. We therefore modify
the Wf el equation to read
ic - 1o(1 - 9) exp (-X F/RT), (32)

35
where 9 is the coverage at the overpotential 7, Here i is the current
through 1 sq. cm. of apparent area, the fraction G being blocked for the
discharge of H+ ions (except, of course, for an electrochemical desorption
process); 1 is the c.d. for the dischzrge process on a hydrogen-free
surface when ý = 0. For this reason, we have not calculated the Tafel
constants from the graph of V against log i (Fig. 14). A true value for
the constants could be obtained only after correction for the degree of
coverage. We have therefore plotted ' against log [ ic/(A - Q)] (Fig. 20).
it will be seen that above 75 mV the graph is a straight line giving
"i- 0" A cm. 2 and b = 38 mV.
The deviation from the Tafel line at low cathodic c.d.'s has
been attributed to the reverse reaction (i.e. ionization) becoming
appreciable. If, therefore, a quantitative correction could be applied
for this ionization current, then all the points should fall on a straight
line when 71 is plotted against log [ ic(corr. )/(l - @)].
The measured cathodic current is the difference between the dis-
charge and the ionization currents, i.e.,
i = ? -t. (33)
Smust depend on 9 and the overpotential. It may be expressed in terms
oft by the equation
' = t-9 exp [(1 - 0(~) yF/RT].(~
Hence, the complete equation for the cathodic current is obtained from
eqn. (32), (33) and (34) and is given by
0 0
ýThis equation may be contrasted with an equation by Breiter, Knorr and
-.Vdlkl (1955)t

36
S-0 L RT j) (6
If one puts 9 =Q and = 0 in this equation., ic = O, which means
that = = i . As we have pointed out earlier, i cannot be the trueo 0
c.d. as it is only a partial current on 1 sq. cm. of a partly covered
surface. In contrast, our equation reduces to
0 = - ) QA. (37)0 R 0~
<-- can be equal to i-* only if R = 2"i However, if G is known, it is
possible to calculate 10 from 1 0 by using the above equation. QR is deter-
mined by extrapolating a grzph of Q against I to 0= . A straight line
was obtained for overpotential values less than 50 mV and "R was found
to have a value of 0.04.
Therefore,*_ . (lo( -2i C 1 - 0.04)/0.04 = 240,aA cm. - (38)
We can check the validity of eqn. (35) in the following manner. We
write our equation in the form,
l- 1 0 1o 0 -qR (39)
and plot the log of the left-hand term against overpotential (Fig. 20).
It will be seen that all the points lie on the same line with i'* = 10-50
A cm."2 and the slope b = 88 mV (as before). The data used in this cal-
culation are recorded in Table 4.
A perusal of column 5 shows that the ionization current is
approximately 10/4A thi'oughoat the range covered. At a c.d. of l104 A cm.-2
it forms lO0 of the total current, thus confirming Bockris and Potter's
observation that departure of the Tafel line from linearity is due to the

37
ionization current. The results and the graph con-irm the validity of
eqn. (35).
Up to a c.d. of 10"3 A cm.-2, desorption proceeds by Tafel recom-
bination. The double charging method cannot be applied to determine G at
higher c.d. 's because of errors arising from re-adsorption of hydrogen.
TABLE 4
I II III IV V VI VII
S(MV Q ( 1F~ ex T-9o e ix c_+1°e-xl - -o1g eRT =0ex 1- log 1
10 0.o45 0.123 0.887 9.60 11.1 .-. O45
30 0.065 0.355 0.705 11.00 22.5 1.352
37 0.066 0.453 o.636 11.20 30.2 1.480
52 0.072 0.600 0.549 9.45 42.5 1.628
70 0.104 0.833 0.436 10.80 75 1.875
90 0.122 1.09 0.336 9.82 125 2.097
121 0.179 1.45 0.237 10.18 232 2.365
140 0.250 1.70 o.183 11.0 414 2.617
166 0.303 2.03 0.131 9.5 824 2.916
186 0.386 2.30 0.100 9.32 1630 3.212
I.. ..... n • • . r m , ,

38
F17. THE CONDITIONS NECESSARY FOR THE SUCCESSFUL APPLICATI-V OF THE
GALVANOSTATIC NWHOD
A detailed analysis (ref. ONR Report No. 3) showed that the
fýollowing conditions must be fulfilled.
(A): The reversible potential of the metal must occur at a
potential more positive than 100 mV referred to the reversible hydrogen
potential in the same solution in order to avoid the presence of H on
the surface at potentials anodic to that of the reversible H2 electrode.
(B): The time of the sweep must be long enough so that thedt
hydrogen has sufficient time to dissolve off. This is at least 0.3
see.
(C): On the other hand, the sweep time mast be less than
lO'5/ic sec., where ic is the! cathodic current density existing before
the sweep, in order to avoid appreciable loss of H by combination during
the sweep.
(D): The anodic c.d. nmist be sufficiently high so that the
effect of the readsorption of hydrogen is negligible. Approximately the
order of the lowest values in 100 ma. cm.-2
Consideration of these conditions in respect to the known kinetic
and thermodynamic parameters for a range of metals L,..dicates that the
galvanostatic method may successfully be applied on.y to Ag, Cu, in
acid and alkaline solutions, and to a wide range of transition metals in
alkaline solutions; and the noble metals. (For these latter Lae oxide
formation occurs at a potential much more positive than that of the
reversible H2 electrode and determinations can be made by a s (non
double pulse) coalometric method.

39
tf M" 4,AaArr~a~ ^-P' 1thia mMahne in- n? nir~ni'p ita rpa-
tricted applicability in acid solutions.
18. PcETIOSTATI(w METHOD
In the potentiostatic method (Slygin and Frumkin, 1935, 1936),
the cathodic potential during the steady state evolution of hydrogen is
changed in about one microsecond to an anodic potential which is sufficiently
noble to correspond to the complete absence of H. The dissolution of
adsorbed hydrogen will be coaplete in a time less than 1 millisec., and
will be uninfluenced by passivation of the metal, which would not commence,
in most practical solutions, until after 1 sec. or more.
However, when the anodic pulse is passed, it causes not only
the dissolution of the adsorbed hydrogen, but also the dissolution of
the substrate, so that it is necessary to ascertain the conditions of
iH, PH, c.d., and order of concentration of atomic hydrogen on the
surface, whereby a measurable anodic pulse of H, clearl s from
the pulse for the metal dissolution, would be e)Tected.
After the switching in of the anodic potential V, let i be the
total current at any instant, iH the current for the dissolution of
adsorbed H, ±an that for dissolution of the metal which takes place at
a potential V, C the capacity of the double layer, and t the time.
Then:
i + ian + C (40)dt
After charging of the double layer is complete,
i iH +i (41)
If (9 )t is the fraction of the surface covered with adsorbed

4o
hydrogen at time t:
= ( rev)H e
and o( F
t an = (io)an [1 - ()t] e "T (43)
The potential terms are constant, whereupon:
H= 7HHE)t (14)
where dH?1F
0 H r e T (45)
Srev
and
i an I a - (QU~] (46)
where: V ý F
I = (io) an e RT (47)
al~sod( H)ti H =-FZ at =IH(9R)t (48)
P (44)
FZ d()t (49)
Or:d(GH)t Id(- 1 -t dt (50)
Hence, -It
S()° e-- (51)
where (QU)t=o is the coverage during the cathodic polarization.

41
Thus,
it IK(%)o e + ÷ m[ - (J)o (52)
[I Z :a (53)
It - FZ (54)• Ian (Ian Ho
The quantity 'U contains Grev, (cf. equation (43)), and this can be
expressed in terms of t- 0o, e.g., for a mechanism of hydrogen evolution
+ -slow fastH + eo - Hads; 2HMade 2 by means of the equation:
- ))F
=rev = e (55)
If the cathodic overpotential during the cathodic polarization
before the application of the anodic pulse is n. then it can be shown
(Bockris and Devanathan, 1959) that:
h= 1+0.1 (56)
where * is the minimu allowable for the anodic overpotential in the
anodic pulse.
Further,
"7an -erevM (57)
where e rev is the reversible potential of the metal in the given solu-
tion. Making the relevant substitution in (54), one obtains:
42
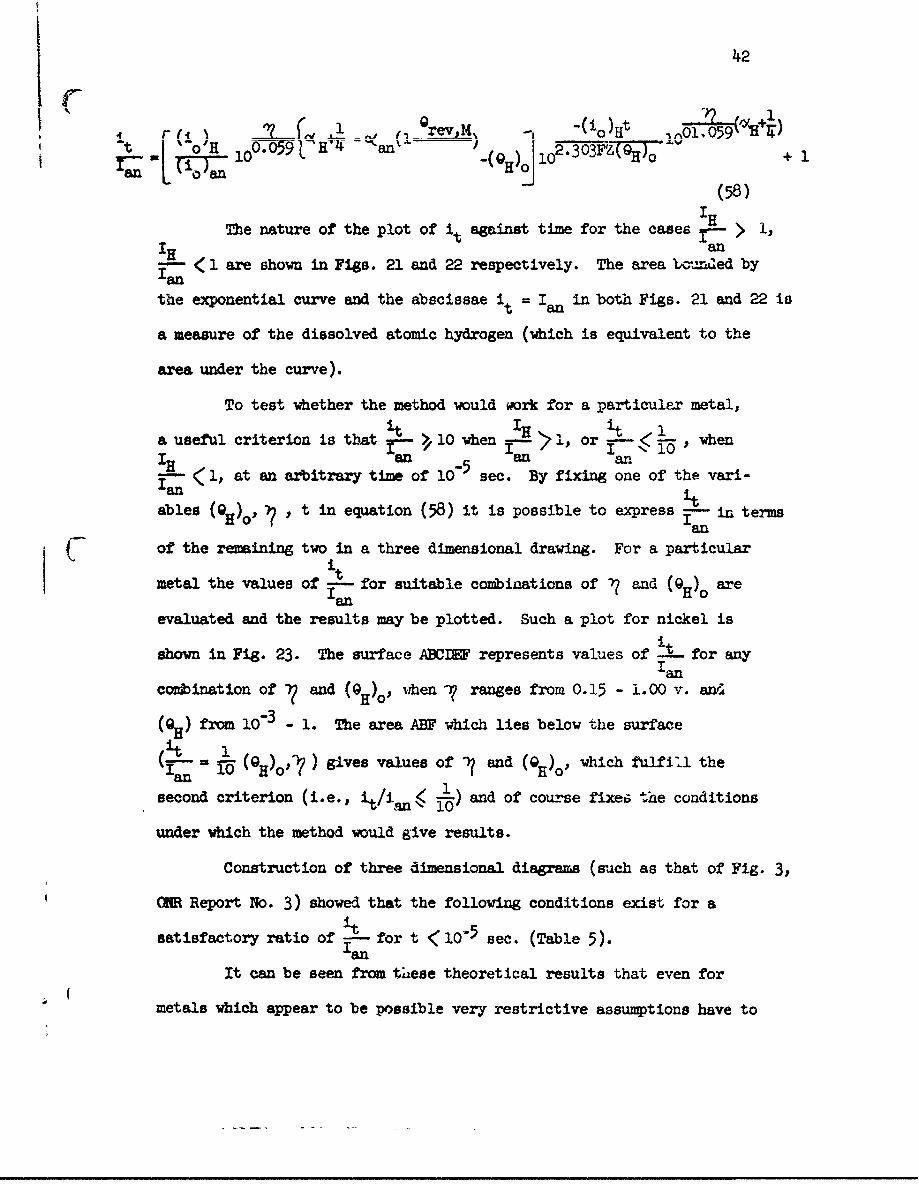
4 j-ft I -ý 1 - 1(i9)ut
_t m IJ' 1H 1 9_0V.U2_ f1 nt - an (Q)I1o2 .303F KC% Yo + 1%.
an 0a H(58 )IH
The nature of the plot of it against time for the cases I- > i,Han
(1 are shown in Figs. 21 and 22 respectively. The area Lc'.n=ed by
the exponential curve and the abscissae it = Ian in both Figs. 21 and 22 is
a measure of the dissolved atomic hydrogen (which is equivalent to the
area under the curve).
To test whether the method would work for a particular metal,itIH ita useful criterion is that i t l0 when ->I, ori < L , when
'H an an anIa < 1, at an arbitrary time of 10-5 sec. By fixing one of the vari-
ables (O)0, , t in equation (58) it is possible to express - in terms
of the remaining two in a three dimensional drawing. For a particular
metal the values of -i-- for suitable combinations of I and (9H)0 areFan
evaluated and the results may be plotted. Such a plot for nickel is
shown in Fig. 23. The surface ABCOMW represents values of -h for anyIan
combination of and (H)o , when -? ranges from 0.15 - 1.00 v. and)from 1- 3 - 1. The area ABF which lies below the surface
(ý- - 1 (%H)o',) gives values of ý and (Q1 )o, which fulfill theIan 1
10second criterion (i.e., i./i~qn y< ) and of course fixes thie conditions
under which the method would give results.
Construction of three dimensional diagrams (such as that of Fig. 3,
M•R Report No. 3) showed that the following conditions exist for a
satisfactory ratio of it- for t < 10-5 sec. (Table 5).Ian
It can be seen from tiiese theoretical results that even for
metals which appear to be possible very restrictive assumptions have to

43
TABiB 5
EXAMINATION OF PEPOMM0STATIC THIJD
FCR EVAULRTION OF ADS8BED H
It when (Q) -0.89- 1.0In and = ol5 - o.26 v.
Cu
Fe No values of ( )° and ") in chosen ranges, give
Ag /it i It- /1/10 or f >/ l0
t i-t >/ llo when (ý)o - 0 an -ýj - 0. 15 - 04
Au i >/ 10 'when (0,,)° = 0 - 1.O 0 ad 10 15 -Ian 0.48 v.
be made for a successful application. Similar results appt.ar likely
for other metals, and the chances of success with the potentiostatic
method are therefore not good (principally because of the difficulty
of obtaining suitable (H)o - ý comibinations in practical ranges).
19. EXAMA.TIM OF OTHE POSSIBLE MTHODS OF MEASURfIN SLMFACE COVRAGE
(A) Direct measurement of the Adsorbed Hydrogen by Transfer from a
continuous Rotating Wire Passing through Two Vessels
Consider a continuous wire which passes through two vessels,
as shown in Fig. 24. Vessel A contains a solution in which the wire is
cathodically polarized. B is a vessel cout~ining a solution of identical
composition, initially free from H2 . The wire is moved continuously

sp4i of passage of the wire is much that there ie (a) enough time for
the wire to attain a steady state hydrogen evolution, and (b) insuf-
ficient time for significAwwt evapolrtion to occur between the vessels
A aru B. The time to reach a steady state is given by the rise time
of the circuit, i.e., 4 CR, vhere C is the double lryer capacity and
R the differential resistance of the electrnde reaction, i.e., •/ i ,
Ubee i - ioe for > > 20 mves. The rise tine at current der-
sittes of 10°3 ap. cm. -2 can thus be shown to be about l.1A sec. If
the gap between the vessels is 0.1 cms. the speed of passage of the
wire has to be about 50 ft. see.-1
The orifices at D, D1 , B and E1 are prevented from spillage
by enclosing the arTangement in a Co.partment with variable pressure.
At D and E, the wire passes thoh a capillary (or is subjected to
jets of N2) which limits the ammwt. of electrolyte swept out to about
one thousand 13yers (see below).
The originaly HR-1free coapartment B. contains a Ag cathode and
sufficient Ag salt so that when the cathode is working Ag is deposited.
(B) Variation of the Permeation .Rate with Current Dens,.tt
The variation of the electrolytic permestion rate of H through
a metal with current density can lead to r 1anowledge of the mechanism
of the % evolution reaction, and henc qualitatively the coverage. The
corresponding eperimental data can also be used to obtain a quantitative
estimate of the coreryge.
Consider electrochemical desorption to be the slow step in the H2

45
evolution reaction. The relevant steps are (Bockris, 1954):
M . I+ + e- --- 1i4 - H (59)
MH +e k +M (60)
where the k's are the appropriate rate constants. Let V1 , V2 , V3 be
the rates of (59) in the forward direction, (59) in the backward
direction, and (60) in the forward direction respectivtly. Then:
V, k" A &Hl+ (1 - 9) eW_ .= a(l(1-@ (61)
4- 7,F/2RTV'I kA 9 e_ý a a2 0 •.
V3 k c a El e a Q
al+ is the activity of H+ in solution in the double layer.
Assuming that the back reaction rate of (60) is negligible,
V1 V 2 + V3 (64)
i.e.
a1 l(1 )=a 2 0 + a3 0 (65)
anda11a +a +a (66)
a1+a2 +a3
If (60) is the rate-determining step then:
a 3 a1 +a 2 and a2 > 10a
Nence,
a = a!/a 2 (67)
i.e.
k A e -ýF/!••T
-E I FW(8!A

46
Vnrn t~hs ornAitinnii n'rvnwsmnA-tirz to (6j7);
" =3"F- 0n 3°--FI (9
S"= K a H+ e-2/3(In i0 - In i) (70)
In Q a C + 2/3 In i (71)
d • i 9 (72)
We make the assumption that the permeation rate is proportional
to the surface coverage. Thuis basic assumption was proved explicitly
by Ward for H diffusion through Cu from the gas phase. It appears to
be a reasonable assumption that either the surface reaction or the
bulk diffusion is the rate-determining step in the permeation process.
Thus, from these assumptions and (72),
P 0(,i2/3 (73)
The Tafel slope which would be associated with (73) is:
-2RT b
ini T3F 2.303
=-0.04 at 250C (74)
In a similar way, the current dependence of permeation rate
for other possible mechanisms can be worked out. The results are
sumiaarized in the Table 6 below.
It can be seen from Table 6 that the dependence of P on i,
together with the Tafel slope, distiguishes among mechannisms except B
and E. As the mechanism ts azsociated with characteristic. coverages,
information on Q can thus be obtained.

47
TABiz 6
PERMEATION OF ELECTROLYTIC H AS A FUMCTIO OF CURRENT DENSITY
BUPEM E ON MECHAMISM
Slow Step Tafel Slope Permeation Qualitativeat 250 C - Crremnt Coverage
Relation
A 0.12 P~i1/2 <0.1Slow dischargefollowed by rapidcombination
BSlow discharge 0.12 P independent < 0.1followed by rapid of ielectrochemicaldesorption
C 1/2Rapid discharge 0. 03 P C(i' < 0.1followed by slowcombin-aat iondesorption
D 2/3Fast discharge 0.04 PC(i <0. ifollowe.A by slowelectrochemicaldtsc•-rption (low potentials)
EFast discharge followed 0.12 P independent iby biow; electrochemical of idesorption (high potential)
The successful development of the low prcssure vacuum systems
and pressure measurement to l0-1 0 ram. Hg was followed by development
of techniques for the permeation measurements. During this work,

48
higher pressure (10-7 mm. Hg) were used, and the metal was SAE 1010
steel., In the course of this development, it was found possible to
make crude exploratory measurements with U, Ta, Ti, Cu, Ni.
20. ThCIQU (1 WPOPATCY PEPATICIK M~ASMJEMMEM
(A) VaumSse
The vacuum system consisted of a manifold 3 cm. diametzr tube,
1.5 toter long, which could be evacuated to 10 m Hg. by a two stage
mercaury diffusion pump, backed by a rotary oil p-ip. The high pressure
side of the diffusion pump is connected to a 5 1. bulb which could
be used as a fore pump instead of the rotary o0l p'ump. Such a system
works well for long periods so long as the pressure on the 5 1. bulb
remains at least a power of ten less than the mairnim pressure (0.1 mm
Hg) required to back the diffusion pump. (This eliminates pump wear.)
Pressures down to 107 1m Hg on the manifold were measured on a P- 09
ionization gauge. Continuous evacuation of the manifold duriDg the
period of this work was found to be necessary to avoid the poasibility
of readsorption of gases by the walls of the system, and by the grease.
(B) Blectrodes
The material under consideration was fabricated in the form of
a disc 1.3 cm diameter, 0.5 m thickness which was silver soldered to
a Kovar tube of the same diameter. The tube was joincd to a Kovar glass
tube by a housexeeper seal, which was in turn joined to a pyrex glass
tube by a graded seal. The cathode asse!mbiy was tested for vacuum
tightness by incorporating it in a systeit of appr'oximately 100 cc.

49
capacity (A in Fig. (25)) which could be evacuated through a greased
vacuum stopcock. The pressure in the volume A was measured by a Stokes TP5
vacuum gauge. After several hours of evacuaticn: A was isolated from
the line, and the pressure was measured at five minute intervals. The
nature of the plot of p against t clearly indicates whether the pressure
increase with time is due to a leak or to outgassing of the walls of
Dhe system. (A linear plot of p against t indicates a leak). This can
be confirmed by enclosing the suspected area of the leak in an atmosphere
of H2 gas, which results in a sudden increased rate of change of p with t.
An expotential change of p with t indi'cates outgassing of the walls.
The two types of behavior are shown in Fig. 26.
Electrical contact with the disc is made with Pt wire wrapped round
the Kovar tube. The Kovar tube and Pt wire are coated with Apiezon Vex
such that only the metal disc is available for contact with the solution.
Metals, such as Ti, Ta, and U, which are difficult. to silver-
solder to Kovar metal, can be waxed directly to a glass tube. It was
fourd that the seal was able to withstand satisfactorily a vacuum of
10-7 m•. Hg with practice. Before final connection of the electrodes
to the volume A, the internal surfaces were cleaned mechanically by thde
use of an abrasive, and finally pickled in concentrated HC1, washed with
water, and then carefully dried. The external surface of the metal di3c
was polished with fine emery paper just before use.
(C) Cell
The cell Fig. (25) consisted of 1 1. be-aker to which has been
attached an anode compartment, and a cooling coil. The anode compartment

50
was connected to the rest of the cell through two holes at the lover end.
The anode consisted of a piece of Pt foil 1 cm. square, which was con-
nected to an electrical circuit by a Pt lead. The electrolyte was sitrred
by a glass propeller. The H2 overpotential at the cathode was measured
against a saturated calomel electrode.
(D) Procedure
The electrode compartment A was assembled as described in
section (B), and evacuated to 10-7 mm. Ng for 24 hours. Tap T was
closed to isolate A from the line, and the pressure change at 5 min.
intervals recorded. If the rate of outgassing was negligibly small,
the cathode surface was polished, and the cell raised into position. The
cel! was then filled with N/10 1El solution and the current is switched
on. Pressure readings are recorded at 2 min. intervals, until the steady
state permeation conditions have been attained. Experiments were carried
out over the current density range 10-4 amp. cm -. At the lower current
densities, where there is little evolution of hydrogen, vigorous agitation
of the electrolyte was necessary to facilitate the removal of gas bubbles
from the metal surface. At current densities between 0.5 and 1 amp. cm-2
there was a mari'ed heating of the electrolyte. The temperature was kept
down by circulating ice water through the ccoling coil. The simple anode
comtpertment usO, in the cell described here was effective in removing
cathode depolarization.
"21. RESULTS
In Fig. 27 is shown a typical plot of increasing H2 pressure as
recorded on the vacuum gauge on the electrode assembly A it Fig. 25. Such

51
plots were prece-ed by a test of" pressure constancy over a time of 2 - 3
hours.
Fig. 28 gives a summary of the permeation data for H2 on SAE 1010
steel, in 0.1 N ICl (without decontamination) as a function of current
density. The data comprise the results from some thirty-five independent
runs. The leaat square analysis shows:
log P = 0.52 + 0.07 (75)log I=
In Fig. 29, similar data is summarized for Pd in 0.. N 1El. The
least squares analysis shows:
log o0.6 + o.0o4 (76)log I
Measurements of hydrogen overpoten;ial on Fe (Fig. 30) show an
exchange c.d. of 6.10-6 A. cm.-2 is in excellent agreement with the recent
measurements of D. F. A. Koch.
Figs. 31 and 32 give *.he p - t date for Ni and Cu; and Fig. 16
gives the change of pressure with time oai the diffusion side after
charging Ta, Ti and U for some 4 hours. (Parameters, and derived difia-
sion coefficients are giver. in Table 7.)
TABLE 7
VAILM OF DIFFUSION COEFFICIENTS
Metal D (cm2 sec-) Lit. values
Fe 1.5 x O1-6 2 x 10 (6 Davis and Butler, 1958)
P 7-3 x 1O" 2 x 1.C (BaLrer, 1951)
Ni 7.6 x 10⁻⁹
Cu . x 10O

52
A sample calculation of p is given: the plot of p with time
shown in Fig. 27 was obtained for a cylindrical cathode (6.35 length,
1.3 cm diameter and 0.38 mm wall thickness) of 1010 steel immersed in
the electrolyte to a depth of 1 cm. Thus, the change in the number of
moles of H2 in the electrode assembly A with time is given by
Sk(77)dt RT dt
where T is the absolute temperature, R the gas constant and V the volume
of electrode assembly A (Fig. 25). 2 is the change of pressure in thedt
volume A with time in the steady state.
The permeation rate P is given by
P dn 1P x (78)
where I is the thickness, and a is the area of the electrode imaersed
in the electrolyte.
Volume of section A in Fig. 25 = 109.7 cc
Area of immersion = 6.14 sq. cm.
Slope - SA/min.
T ' 300°C
R 82.05 cal deg"' mole"-
Thickness = 0.38 urm.
Permeation rute
108.7 3 x 10⁻³ xo.3892.05 x 300 x 760 x oO x1 4T
O.18 x oi mole mm ec"I cms2 (a)
Tn the contaminated silutions used, Fig. 28 indicates that
P X11/2 for SAE 1010 steel. Reference to Table 6 shows that this
"result is conwisttmt only with a mechanism for the hydrogen evolution
_K -, 't - - I
53
reaction on Fe for 0.1 n HIU of slow proton transfer followed by rapid
combinative desorption. This conclusion indicates qualitatively that
the coverage of adsorbed H on the metal is low (i.e., about one tenth).
22. INVMSTIGATION OF PERMEATION UNKE= HIGH PURITY CCUDITIONB
It has been shown that the rate of permeation of electrolytic
H through metals is highly sensitive to small traces of surface contam-
inants. It is therefore necessary to obtain a state in which the electrode
surface is "clean." This necessity arises not only because of the need to
make investigations in a standard state but also to find a "zero position"
in the investigation of the effect of capillary active substances on the
permeation rate.
23. TBCEWQUE CF PEMATIC EXPIOMENTS CARIED OUT UNDER CONDITIONS OF
HIGH PURITY
(A) Vacuum System
The vacuum system is substantially the same as that described in
(ONR Report No. 3 ).
(B) Electrodes
The two essential requirements (a) that the surface of the metal
must be cleaned in H2 at uO0O and (b) only the metal under investigation
should come into contact with the highly purified solution.
Investigations were carried out on electrodas fabricated in the
form of a closed cylinder of the material (length 6 to 10 cm. diameter
0.7 cm. and wall thickness 0.038 cm.). Connection of this electrode tube

to the evacuable volu,;e , Fig. 33, is made by a Kovar seal, the vacuum
joint, being made with silver solder. Possible contamination of the elec-
trolyte with Ni, Co, Ag and Cu fz-m the Kovar and the silver solder is
minimized by immersion of the lower end of the cylinder in the electrolyte.
In this case it is only necessary to subject the and of the electrode
tube to high temperature 12 treatment, thus reducing the possibility of
breakdown of the silver soldered joint. Vacuum testing of the electrode
assembly B (Fig. 33) is carried out in a similar manner to that described
in ONR Report No. 3. Electrical contact to the electrode tube is made
with a nickel wire inside the tube at the silver ioldered joint. The nickel
wire passes up the glass slide and is welded to a W wire which is vacuum-
atically sealed through the glass bulb (Fig. 33).
(C) The Cell
The considerations which resulted in the ce'2 I design described
below are:
(a) For purposes of determining the dfagnostic criteria it is-'I
necessary to have the permeation rates at a miniurm of five values of the
current density. (b) For each measurement of the permeation rate at a
particular current density the electrode tube mist be in the same initial
standard state. (c) The electrode surface *2st be cleaned by reduction
in hydrogen at 80o0C. (d) The electrode assemblies must be thoroughly
outgassed by continuous evacuation for several hours. (e) Electrolysis
must be carried out in highly purified solutions. (f) Final purification
of the electrolyte by pre-electrolysis muat be carried out in the cathode
coMPartment. (g) The volume of electrolyte must be kept down to a miiniuml
to facilitate speedy purification.

55
It emerges from these considerations that the cell must be provided
with at least five electrode assemblies. An arratnemrt, similar to the
standard type of electrolytic cell for studying the mechanism of the
hydrogen evolution reaction on metal wires was found to be impractical.
because of the difficulty of producing a small enough ca.hhode compartment
to house all the electrodes. As a result of this it was concluded in order
to fulfill condition (g) each electrode assemdbly should have a separate
cathode compartment. The possibility of seven such compartments having a
common anode compartment was considered, but was ruled out because of
overheating wAich would take place during simultaneous pre-electrolysis in
all of the seven cathode compartments. (Total current - 10 amps) to
avoid the difficulty each cathode compartment was fitted with a separate
(. anode compartment.
A typical unit cell is depicted in Fig. 33. The electrode
assembly B is essentially the same as A in Fig. 25 (cOR Report No. 3)- In
the upper position the electrode tube is contained in a furnace, where the
high temperature hydrogen pretreatment can be carried out, and the bulb B
can be connected to a vacuum line. The height of the electrode assembly can
be adjusted by a ground glass slide, and on disconnection from the vacuum
line can be moved to a lower position such that the tip of the electrode
tube reaches almost to the base of the cathode compartment. The cathode
compartment is provided with a pre-electrolysis electrode attached to a
ground glass slide so that it can be moved clear of the electrolyte. The
anode compartment is connected through a glass sintered disc and a ground
Sglass stopcock to the cathode compartment. Seven such unit cells are
banked together side by side as depicted in Fig. 34. The two outer

56
cells are used for potential measurements against a saturated calomel
electrode which has a salt bridge of purified electrolyte terminating in
a Luggin capillary. The height of the electrolyte in the outer compart-
ment is adjusted so the tip of the Dagg~n capillary is 1 mm. below the
level of the electrolyte, For the potential measurements the electrode
tube is lowered so that only the lower surface touches the sorface of the
electrolyte thus keeping the ohmic drop to a minimum. The initial prepa-
ration of HCU solution is carried out in a separate vessel which is con-
nected to the cells by a manifcld.
24. PROCFMURE IN THE HIGH PURITY MEASO
(A) Cleaning of Components
At the termination of each experiment, the entire cell sections,
in their seven parts, were subject to emptying and washing with tap water,
with particular reference to the removal of the previous solution from
the sintered discs. The cells were then immersed in the Beckmann solution
and allowed to remain therein for two hours. A fresh Beckmann solution was
made up about every five runs.
After removing the Beckmann solution, the cells were washed with
a number of (about six) rinses of equilibrium water and then allowed to
stand in equilibrium water (filling the whole cell) overnight. There-
after, the cells were once more rinsed with six changes of conductance
water (conductivity lO" mhos cm-1 ) and preserved out of contact with air,
filled with conductance water.
(

57
(B) Preparation of the electrodes
Electrodes were mechanically polished, electropolished, and
then introduced into the H2 atmosphere at 8000C, and maintained in this
for 20 minutes when they became bright.
(C) Procedure
At the commencement of thŽ 7.-u, the hydrogen overpotential was
measured on two independent Fe electrodes in the compartments M and N
(Fig. 34) in order to establish the overpotential c.d. relation for the
given condition of solution, etc.
Thereafter, the purified electrodes, after H2 treatment, were
lowered in the H2 atmosphere, into the electrolyte, and electrolysis
commenced at a series of c.d. 's. The lover limit of c.d. is set by the
rate of corrosion of Fe, the higher limit by the heating effects in the
solution. The pressure increase with time was measured on the Stokes
TP 3 gauges. Measurements were carried out in parallel on five electrodes.
25. NEW T•MHNIQUE FOR PIRMI TION STUDIES
It was apparent in the above studies that the experimental tech-
nique of permeation into a vacuum was extraordinarily complex and exacting
in its demands. It was therefore essential to devise a simpler technique
of permeation measurements in order that it may be used in routine
measurements. The following purely electrochemical technique was devised,
and tested wdth palladium membranes before being applied to iron membranes.
A study of the behavior of electrolytic hydrogen in palladium was necessary
for the following reasons. The application of this electrochemical technique

58
of measuriig the permeation rate in corrodible metals requires the use
of thin coetings of palladium. Consequently the diffusion behavior in
palladium membrane had to be investigated first. Anomalies in the thick-
ness dependence of the permeation of hydrogen through palladium have been
reported (Wahliln and Naumann 1953, Silberg and Bachman 1958). Hence it
is necessaxy to find out whether such anomalies exist with electrolyti3
hydrogen in palladium. Further the easy permeation of hydrogen in palla-
dium make this metal a first choice for verifying the diffusion formulae
deduced below.
26. TBEORY CF THE NEW METHOD
(A) Diffusion Theory Relevant to the Method
Consider unit area of a membrane of thickness L and diffusion
constant for hydrogen D (see Figure 35) where the diffusion is in the
direction of decreasing x. Let the concentration of hydrogen at x = 0 and
x = L be maintained at C. and C2 respectively. In the steady state the
through-put of hydrogen is given by
dc D(c2 - C,) (8o)L
For the non-staticnary state the general solution of the Fieks Law
equation
)c D x) - (if D is constant) (81) V
for this problem is
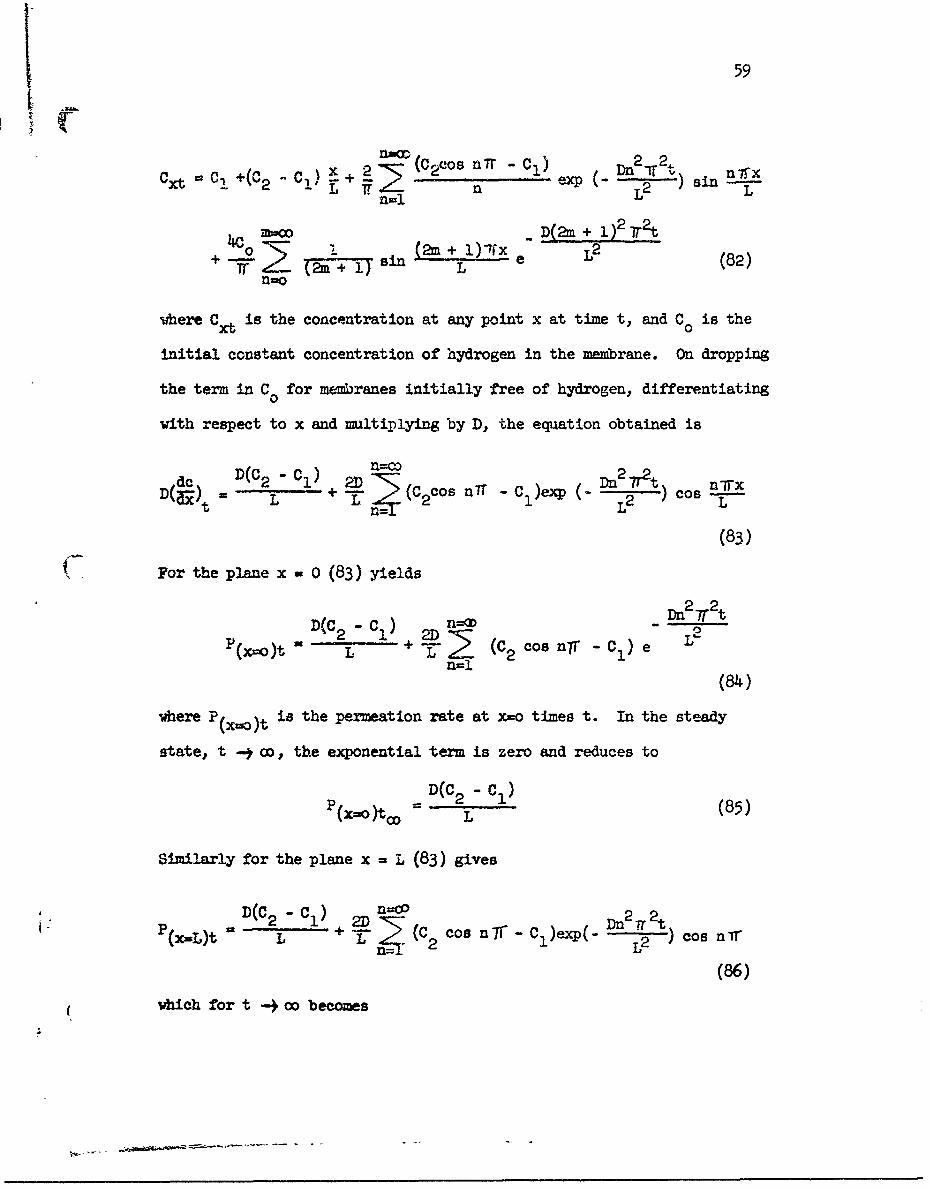
59
( C X (C.(Cos niT - CI) Dn 2I2.t n nxCxt•1 +,(C2 - c), a sin L
L4C in. 2m ) . e 1.2 (82)
+ 02 841 t~TTY +L 7X(2nmo
where Cxt is the concentration at any point x at time t, and Co is the
initial constant concentration of hydrogen in the me brane. On dropping
the term in CO for membranes initially free of hydrogen, differentiating
with respect to x and multiplying by D), the equation obtained isn=co D2 2
dc D(C2 -Cl) + 2D n (C cos niT -C)exp D- L2t ) cos n-Tx
(83)
(* For the plane x = 0 (83) yields
2(c - c1) 0_ n tP(x~o)t a L +. ?a- (C2 cos nir -C 1 ) e
n--l
(84)
where P(x-o)t is the permeation rate at x=o times t. In the steady
state, t -y co, the exponential term is zero and reduces to
D(c2 - c1)P(X' = L (85)
Similarly for the plane x = L (83) gives
: (x=L)t D(C2 - L + M- (C 2 cos n -C 1 )exp(- 2ol
L 2 )cos nT
(86)
which for t -4 co becomes

6o
tD(C 2 - 1 ) (87)
The diffusion constant, D. may be evaluated from permeation transients
in the following ways:
(1) Time lag method
This is the method used hitherto, when only the quantity oft
hydrogen permeating was measurable as a function of time, i.e. fP(xo)tdt0
Vwich is denoted Qt. For this purpose integration of (84) from o to t
yields
n=00 Dn2 -T2tD(C2 - C1 )t 2L "• (C2 cos nw - C1 ) L2
L n2 -e (88)n=l
It is well known that the intercept Tlag (time lag) on the time axis of a
S - t plot for large t is given by
L2
lag (89)When C2 >> C! this yields thus permitting the calculation of D. Formula
(89) has been extensively used, but as we shall show elsewhere a correc-
tion to the experimentally determined time lag is required in order to
apply (89).
(2) Rise time constant
When the permeation raze can be continuously recorded, the dif-
fusion* constant can be calculated as follows. From equations (84) and
(85) the following is obtained. 2 2
flO Dn2 Tt-)x I- o-(C2Poo (C2 cos niT - C,) e(90)
/ n=l
For >2, C1 (90) reduces to

61
~2 2
P 2 ( e (9.0CO x-O nml
2 2On substituting 1/to for L2 , and expanding (91) the series form (92)
is obtained
F- t 4t 9tPt ( POL i- " to to (92)-Poo a =2 e e + e ...
This may be written az: V 3t 8t P tt0 2 11-e °+ ee (93)
The term within the brackets is indeterminate when t=o for it could be
unity or zero, depending on vhiethe: an odd n or even n is considered. On
taking logarithms.
3t 8t
l e F 0: loge . + e o - - log 2-l o g ( O O -0 Le t o 0
(94)
The log of the term within the brackets, though indeterminate at t=o,p -pPt "POD
rapidly becomes zero at t increases. Hence a plot of log. - - -
versus t yields as gradient 1/t. and intercept loge 2. %-us from the
gradient of this graph D can be calculated, using the fonmla
lD-Trgradient a- a7- (95)
(3) Time-lag from rIse transient
The time lag is obtained by a linear trapolation of the Qt
ve z plot when t is large, i.e. after staidy state haM been established
S(.oit A of Fivire 15). Therefore the time lag 9lg given by oq~tation

62
ko9) represents the time at which the diff'usion prVc-5 ( -1 t UUI A
proceed always at steady state value) should start in order that, the amount
permeating will be the same as that for the ordinary diffusion process
in the steady state for large t. An inspection of figure 36 shows that
this time is that which makes the area of the rectangle ABCD equal to
that under the rise curve CECD. That is, the ',ertically hatched area
EBF should be equal to the horizontally hatched region EAG. Equation
(94) shows that for b > o the rise of the permeation is approximately[ "t/t° "St/to - ailexponential since the term [1 - e + e - - - ] rapidly
reaches unity at for t > o. It is easy to show that for an exponential
curve of time constant this point E corresponds to a permeation rate
of 0.6299 times the steady state value. Thus the interval from zero time
to the time the permeation rate is 0.6299 times the steady state value is
Tlag. Hence 2
lag = to. 62 99 (96)
(4) Break through time t½
For an exponential curve the time taken to obtain 0.6299 times
the steady state value is the time constant. Hence, if tb represents
the time at which the permeation rate begins to rise fror zero, the
connection between these quantities as shown by Figure (36) is
Tl -= tb + to (97)
Therefore from t½ the diffusion constant can also be obtained with the
formula
. L2 (1 1 L2

63
(5) Decm iime constant
Equation (82) is the general solution when an initially uniform
concentration exists in the membrane. If the concentration were some
function of x in the membrane, the general solution is given by
n-00 (co2 C°osn - Cl) _____ n-Xc = c1 . (c 2 - c1) • • 2-+- - exp(- Six" -='L-
n-i
S ef(., f2 A (x') sin (99)+L L o
0
Where C C! at x = o for all t
C C =2 t x = L for all t
C f ((z) at t o for 0 < x <L
If the steady state bas been established in a membrane initially
free of hydrogen, then the concentration gradient is linear. and the
concentration is C' at x=o and (2 at x=L. if now the source of hydrogen
is suddenly sto;ed and the time reckoned from this point, it follows
that the initial distribution functicn required in the second term of
equation (99) is simply
f~x') (C2 - C1 )x + ~ (10
f(x' ) L 1 .- "
since C 0. The decay of the permeation a&t - me-y then be described
by equation (99) with the boundary ccnditions
C C ---- t x f 'oh aLL t
C C •2 •0 at x. = L for a).1 t
C f(X) z~ at t uo r 0 .(x' ( L(

64
Under these conditions, (99) reduces to
n=oD 2 2 L
C exp (- D ) sin ni x ' sin -x' (101)
where a = e'L
Integration by parts of (101) yields
n 2x - LOOS n-Dn T Lt nTX Fa' L nlTx:' aL.=~exp (A~~ ~ n M~ K'L
(102)
where the last term is zero. Substituting for the limits, differentiating
with respect to x and multiplying by D, we get for the permeaticn at x=o
2T2+Dn2 t
Px=o 2D ) (-i)l e (103)
Using the symbol t for L as before and expanding (103) may be written
asP =o.,t - 2aD e-t/t° (I -e-et/t. -tt - -- )(1)P- 2 D t~~ett+ e"tt -) (104)
For t=o, let the permeation be P (x-oP0" For reasons already given
only the first term of the series is important and hence (104) can be
transfcrmed into the simple exponential decay form
-t/to(1)P.-.., t = P(x-1o)t.O e -/ (105)
Hene't a plot C-f log, (L)x againxt time has a gradient l/t 0 and thus
the d:;rusion <onttant can oe calculated from the decay time constant
with the aid of equation (95). The above analysis shows that the diffusion
constant cay be ev'alcate4 by fve different methods when transients can be

65
(B) Formulae for the Determination of Coverage
When the above equations are to be used difficulties arise, for
the concentrations C1 and C2 refer to the concentrations within the
membrane at x = 0 and x = L whereas only the concentrations outside
the membrane are amenable to control. As shown by Barrer (1939) and Ash
and Barrer (1960) large discontinuities in concentration exist et phase
boundaries and these have to be considered in the application of these
formulae to real systems. A detailed analysis of this p-rc-ble-ra has been
given by Barrer (1959) and what we give here is a simple treatment adapted
for the electrochemical systems which interest us.
Consider the same membrane but let some electrochemical reaction
produce a steady state coverage with adsorbed atomic hydrogen atH a the
interface at x = L. let the opposite interface at x = o be maintained at
some anodic potential sufficient to cause rapid ionization of any hydrogen
atoms on the surface, thereby producing a steady coverage of zero. Ls%
the rate constant for the transfer of hydrogen from the surface into the-+b b -b4s
metal be k and for the reverse process, k in the absence of
any diffusion process within the membrane, let the equilibrium concen-
tration of h•drogen in the smetal at x = L be Ce. This equilibrium is
represented by the equation
s-4b b s
k Q H k Ce(ol
when on is small, and Ce is much less than the eattiration con.•atratiOn
a5. if' due to a diffusion process within the rembrane, the fioncen-
tration at x - o is altered from Ce to C,, then -ht pezreation of
hydrogen into the membrane is given by

66
( k C! - k C-) = P (107)-e
For steady state diffusion within the membrane, the concentration
gradient is uniform, and if the eoncentration in the membrane at x = o
is Ci the rate of permeation ie given by
D(C2 - C,)
S2.L
-1 (108)
AL the interface at x = o the equilibrium is
b4 sk C =. (139)
From (i06), (107), (008) ana (109) the following equation is obtained:
b -- ý
! L k 2Do s -4 b + a -j,b (&o)k k 9
The gradient of a plot of against L is given by
b-4s "
k DO
azn its intercept by22-,b (112)
k 9
The minimim values of g and I are reached with - ' 1, hence
b -4sk--)b' (113)
k D
and
s-b
s -ý b(114)k
Hence 0 can be calculated using the eqaation
(;

I.67
In the above deduction it .has been aasumed that diffusion is the rate
s --jb b -ýacontrolling process, i.e., k , k D. Under these conditions,
the forwalae prewiously deduced for the evaluation of D apply, and hence
D can be obtained independently. Therefore, with the aid of (113) and
(114) both rate constants can be evaluated with a knowledge of D obtained
from an analysis of the transients. When diffusion is rate controlling,
the permeation rate will depend on the thickness of the membrane useds-tb b-9s
according to equation (80). When k and k are both smaller than
D, then, the surface reaction is rate controlling. In this case the
permeation rate will be independent of the thickness of the membrane.
r • In the event of it being inpossible to realize a surface com-
pletely covered with atomic hydrogen (i.e. H = 1) but only one of acertain maxifmm coverage 9.,' then equation (115) gives the coverage as
a fra&tion of this maxiwam coverage only. An independent determination
of the absolute coverage at one point will then enable the calculation
of the dbsolute coverage at all potentials.
27. FRflEIPI • TE MTHO
Diftusion theory requires that the coverage of the membrane
with adsorbed atomic hydrogen on one side be maintained at a certain
fixed level, vhile on the oppvp.site side it should be always zero. These
conditions are easily satisifed by cathodic polarization of one side
and anodic polarization of the opposite side using potentios-atic cir-
cuils. The simplicity of this technique is due to the fact that the
current in the ancdic potentiostatic circuit which maintains zeno

68
coverage on one side of the membrane, is by Faraday's LW-;s a direct
measure of the instantaneous rate of permeation of hydrogen. It is
thus possible to obtain a continuous record of the instantaneous rate
of permeation of hydrogen with all the sensitivity associated with
current measurement. Thus with a current recorder of sensitivity 0.003
,LA/mm. co~only used in polarographs in the anodic circuit, and a
membrane of one square centimeter area, a permeation rate of 3 x 10
gram atoms per secondor 3 x 10⁻⁹ ml. of hydrogen per second can be
detected. The sensitivity of this method reveals details in the per-
meation not detectable by previous methods especially with metals
susceptible to hydrogen embrittlement, as we shall show in a later
communication.
28. EMOfAlNTAL
(A) Cell
The electrochemical cell used is shown diagramnatically in
figure 37. It consisted of two identical units terminating in standard
half inch pyrex pipe flanges. Each flange carried its teflon gasket
with the side facing the membrane polished flat. The assembly was then
bolted on with the membrane in between the gaskets. The "give" of the
gaskets ensured a water tight seal with the thickest membranes used.
Each unit carried a bright platinum auxiliary electrode and a Luggin
capillary-calomel reference electrode system as shown in Figure 37.
Facilities for bubbling nitrogen were also provided. The combination
of float and sintered disc shown in the figure isolated the auxiliary
electrode without increasing the electrical resistance appreciably.

69
Palladium membranes of various thicknesses were obtained from
E. Bishop & Co. They were degreased with benzene in a Soxhiet extractor
before use.
Sodium hydroxide solutions were prepared from Baker Analytical
Reagent grade pellets with conductivity water. The solutions were pre-
electrolysed in an external cell before admission into the cell.
Nitrogen vz.s deoxygenated by active copper and passed through
cooled charcoal traps before admission into the cell. Standard proce-
dures wxre used in cleaning the cell and auxiliary glassware.
(C) Electrical Circuit
This is shown in figure 38. The cathodic polarization was effected
by a Wenking electronic potentiostat and the current read on the ammeter
of the instrument. When necessary the output of the instrument was
fed to a Sargent S. R. recorder to monitor the cav'odic polarization
current. The anodic circuit was simi.'.ar but the potentiostat output
was fed to a Sargent XXI polarograph with its bridge set at zero. This
enabled the wide sensitivity range control of the polarograph to be used
to record the current on a suitable scale. Small residual currents could
also be opposed with the zero shifting control of the polarograph.
(D) Procedure
A 0.1 N. solution of sodium hydroxide pre-electrolysed for 24
hours in a separate cell, was admitted into both compartments. The
solution in each compartment was again pre-electrolysed for a further

70
-noi n? 1-1/2 hours with ',he system of auxiliary electrodes while
nitrogen was being bubbled ou both sides to promote stitring. Cathodic
polarization was then commenced at a potential corresponding to a
cathodic current density of 1j"4 A em" 2 . The anodic potential applied to
the membrane was then varled over a wide range and the steady values of
the anodic current measured. A plot of anodic current against the
applied potential with respect to the saturated calomel electrode re-
vealed a plateau between -600 =T and -300 my. In order to ensure rapid
ionization of the hydrogen the anodic potentiostat was set at the
highest permissible anodic potential namely -300 mv on the calomel
scale for all subsequent experiweits.
The cathodic polarization potential was next set also to -300
mv tluus ensuring the complete absence of hydrogen and the small residual
curreant in the anodic circuit compensated by means of the zero shift.
The cathodic potential was nov switched from -300 mr to a fixed value
of -850 mv on the calomel scale which resulted in cathodic polarization
of the palladium to a current density of about 10, azips. ,m2. The
instant of switch-on was marked on the recorder chart. The srr.xival of
the first traces of hydrogen on the anodic side of the membrane was
registered by the rucorder as an increase in the current. This current
continued to increase and reached the steady value. Several minutes
after steady state had been reached the cathodic polurization was
switched back to -300 mv thds stopping the production of electrolytic
hydrogen. The recorder thereupon showed a decrease in the current which
soon decayed to zero after some time. Reproducibility was very good
Vhen precautions were taken to avoid contalaination by Tzaces of surfactants.

71
In this manner records were obtained for various thicknesses of
palladium maintainin the same polarization conditions. Several runs
were carried out for each thickness. All experiments were made at room
temperature which was 25 + 20C.
29. FBESJJ~~
Figure 39 shows a dra-•ng of a typical record. Starting from
zero time the point marked tb repzesento the breakthrough time. The
time required for the permeation to reach 0.6299 times the steady z:ate
value is marked TL, since as previously shown it is also the time lag.
30. CAICULATIONS
The diffusion forzmulae previously dedbced (Devanathan 1961, 1962)
were verified as follows.
(A) Time Constants
According to equation (9 4) t plot of log ( FtL- Poo versus time
should yield a straight line of gradient vo where t is -L for
tol 0 -2
the rising transient. Simllarly for the decay transient according to
(ptequation (105), a plot of lcg p--) versus time should give the same
slope. In figure 40 a typical plot is shown., for the rise and decay
transienta. The straight lines are parallel indicating the indentity of
their gradients. This identity has not been previously demonstrated. At
large times the oecay rate is somewhat different. This in dlie to the
fact that when the cathodic potential is switohed from -950 mV io -300 mV,
anodic disgolution occurs on both sides. Hence with time the !L.near

72
concentration profile which existed at the early stages of the decay
will be altered by additional diffusion to the originally cathodic
side. The decay formula will therefore not apply for long times.
Frank end Thomas (1960) obtained continuous records of the permeation
of gaseous hydrogen through cylindrical single crystal germanium, but
used the classical time lag plot for the rise transient, while using
a logarithmic plot for the decay transient.
(B) Intercepts and Relaxation Time
According to equation (105) the logarithmic plot has a zero
intercept, but figures 39 and 40 show ttat even when the cathodic
potential is switched to a potential representing zero coveiage, the
perneation current continues at its steady value, for a period of time
marked tr, and only then does it start to decay. Tne reason for this
behavior is clear when one considers the derivation of these diffusion
equations, all of which refer to concentrations withbn the membrane
and not surface concentrations on the membranes. Whan the pctentiostat
is switched to a different potential, the surface Coverage changes in a
time interval o. the order of microsecods. But the concentration of
hydrogen just inside ths surface vill require a much longer time for
adju3tment to a value c ,-responding to equilibrium with the new surface
coverage. This time of relaxation can be regarded as due to finite
rate constant for the transfer of hydrogen atoms from the s°Jrface into
the metal phase. However, w•hy this relaxation time is thickness depen-
dert according zo an approximately cubic lav, as wJll) be shown Later, is
not clear. This appears to be general phenomena, and has also, been
73
(1960). Since the equations apply only to membrane concentrations,
it is reasonable to subtract, t r from the switch-on time and thee switch-
off time, to obtain the transients on a time scale which refers to
concentrations in the membrane. When this is done it is found that
equations (105) and (94) are obeyed -1ith respect of the intercepts,
-h1hch should be zero &ad log 02 or 0.301 respectively. This carA be
seen in figure 40 where the c( rected time scale Is shown as the dashed
line while the electrical time scale is shovn as a continuous line.
(C) Time Lag T1
The classical method (Daymes 1920, Ba-rrer 1939) of obtaining
the diffision constant is by evaluating the time lsa. This was done by
integration of the rising transient. As shown previously (Devanathan 1961,
1962) the same value can be readily obtained by spotting the time at
which the permeation is 0.6299 times the iteady state value. When the
time lag was evaluated by both methods the agreement was always within
2%. However the time lag obtained by either method will be in error
by an amount equal to the relaxation time. Thus particularly for
larger thicknesses, the diffusion constant was as much as 20% smaller
than the value calculated from the time constant to. But when a correc-
tion was made for the relaxation time agreement was very good, as shown
in Table 8.
i

o~ 0o 0 0 0 01'3
0t -P PH WW H
oo bN
0 .iJ w Lo
o H 0 w
0 .l\0 V O \4A) 10 \J
0
- -4CD LI
0 IJ-- ,
CH -4 0~
W ED 0 f
SD o H 0A 0 w \ J1
F-I ~ C ;Ji k o Hn
o 0\0 0 CD'
0O p -0 0
'"'1+p OH 0o w H I.H,
I-' 0 * t0ft * f
01'0 H j H m H0 H
1+ t
'1 +
0 F 0
o4o~
75
(D) Breakthrough Time, tb
Since the time lag is the sum of the breakthrough time th ad
the time constant t as shown previously, a s.milar correction Las to0
be made in the breakthrough time in order to obtain concordant values.
In Table 8, the corrected and uncorrected breakthrough times are compared
with t.. The consistency of the results proves the validity of the
diffusion equations previously deduced for these transients. Since th
is the smallest va:lue measure4, it is more subject to error in subtracting
the time of relaxation. Hence in the final value for the diffusion
constant, only the time lag and the rise and decay time constants have
been used in obtaining the mean.
f (E) Thickness Dependence
In the derivation of these equations, it has been assumed that
the permeation is controlled by diffusion in the bulk of the metal. 11f
this is so, then the diffusion constant should be independent of thickness.
This can be easily verified by plotting Tlag. or to againlst L2 . Straigfht
lines of gradient 1 ad 1.6and ,- should be obtained. Such plots are shown in
figure 41. The points, which cover a thickness range of 0.0035 to 0.055 cm
corresponding to an L2 variation by a factor of 250, fall clearly on
straight lines passing through the origin. This provides conclu~viv-
proof for the first time that the diffusion constant is indeed indepen-
dent of the thickness under z'on-stationary con-.iticns. The points for
the uncorrected time lag fall on a straight line for sma.ll thickness and
( then curve away as the thickness is increased (see also Table 8).

76
(F) Va-_~o f coeto
r.r ateady state permeation. even thou&h the diffusion constant
is indepeodent o thickness, the permeatioa %ate couu]d nhezge irregularly
if bho covearge of the rtathodic side of thie membrane =11angcs for any
cause: e.g., adeorption of impurities. Acco'ýding to the simple theory
deve~lopec the a plot of i against the thicknt-ss should b, a straightP
line. Such a plot is shown in Figure 42. The points are clearly seen
to be on a straight line. The intercept as shown previously is -related
to the rate constant for th,* transfer of hydrogen fxom the surface to
the bulk of the metal.
(G, Thiffusion Constant
The r-uan diffusion -onstant calacleted from the uncorrected time
l&Z points in figure 41 was found to te about 1.Ci x l107 cm2 sec-1 while
t~hat fromi the corr--cted timze lag was 'i.25 x 10-, c 2 se 1 rath
gradiea•, of the t line T.ie diffusion constant vaz 1.27 X X-7 cv. aeea,
in harmony v'.,th the corrected time lag -clue. The data of Frank and
Thomas (?.j60) presented in figure k'l of their paper a],st shows a consider-
able d.fference between the cl.kssical time lag and the decay transient
diffusion constant. But they computed the r~ean of these two sets of
values without applying a correction for the relaxatlcn ti•n. Thus it
appears thiat the cl&hsicalJ time lag method may be in error depenizig on
the ratio of the time of relaxation to the true time lag. Thib aspect
is Aurther discussed, later. in this peper.
The mean value for the diffasion %onstant for hydrogen in
o()-palladium at room temperature can therefor? be t-ken as 1.30 + .20

77
. -.-7 2 s -x .Lv , • lue obtained a sUMj Vth- *t - '-' -V LOY
methods have been discussed by Barrer (1941) and the best value calculated
for 2500 is 1.56 x lO7 =m2 sec-1 in good agreement with our result.
31. DISCUSSION
(A) Consistency of the Results
The consistency of the results in respect of the various ietJods
of calculation of the diffusion constant from the recorder traces shows
that the equations previously deduced are correct, ThC' fact that the
time lag is directly proportional to the square of the thickness shows
that the quantity being measured is the diffusion constant of hydrogen
-- in the bulk of the metal. The linesr variation of the reciprocal of the
permeation with thickness then shows that the surface coverage is constant
and that transport processes across the surfaces are not rate ccat'solling.
This consistent behavior of electrolytic hydrogen is in contrast to
the behavior of gaseous hydrogen when diffusing through palladi.um
membranes. As is well known despite the variety of methods used to
measure the diffusion constants in palladium, no concordant values are
reported in the literature (Barrer 1941). Furthermore the permeation
has not been found to be inversely proportional to the thickness
(Wahlin and Naumann, 1953) nor has it followed the expected p1/2 law for
diffusion from the gas phase (Silberg and Bachman 1958).
(B) Anomalies in Diffusion
It is unlikely that the diffusing species at rcom temperatures
is different from that in the range 200-6 0 C°C which is the usual range for

78
studies of diffusion from the gas phase. It is generuily accepted that
gaseous hydrogen dissociates into atoms on adsorption. Hence the mi-
Lrating species mast be same vliether the h-drogen atomz are produced
e1tctrolytically or frot: nioe l aular hydrogein. The -.nomaloue behavlo:-
reported for the diffaiTion :f hyd~ogen must therefore arise from a fal-
tre of the experimental set u to maintain conditions required by theory,
Provided the diffusion constr.nt is invarisn, the permeation should be
directly depeudent on the surfa'ze coverage -ilth etomic hydrogen er, ho-;praviousiy. But tne possibilit, of altem ci~n of surface coverage, frm
experiment ko experiment due to &isorption of trace impurities in diffusion
swudies., cannot be excluded. Tn our experiments, the use of potentlo-
stat-s znd purified solutions 'ks a simple method of -mainta-.ning constant
coverage, an4i it is probably this one fuct vhich has led to consistent
results.
(C) Pon-stoichiometric Phase Formation
Ona significant di_.ierence in the two methods is in the extent
of hydrogen Qbcorption during the experiment. At the cathodic potentials
used the current density was about 10'5 amps cmz 2 or only 10"10 gram atoms
of harogen per second. Eve-n during an experiment lasting -m hour the
total quantity of hydrcgen, produced will b, only about 10 6 gram atoms.
This quantitlf is insignificant compared to the number of gram atcj• of
palladium in the thinnest membranes used. Thus the palladium membranes
cannot absorb hydrogen in signif iant amounts to form any 8 -phases. But
with gas phase diffusion stue-iev it is very lihely that a hydrogan rich
A -phase forms. The movement of nuch concetraticn discontuities may

79
+ht itmit n h an~jta ift~inin beahnvior smaiwvi-utt.Pc1 'by
gaseous hydrogen by passiag hydrogea gas into the dry cathode polari.-
zation unit gave very large currents. When.ever the permeation currents
were large the, anodic cde of the palladium showed a tendency to passi-
vate with formation of visible oxide films. The current time curves,
nevertheless -ere of the same tyve given in figure 39. A calculation of the
diffusion constant gave values which were as low as 0.02 x 10⁻⁷ cm2 sec -_
for membranes of thickness 0.0035 rm gradually rising to about 0.58 x
lO7 cm2 sec-1 to membranes of thickness 0.014 cm. Although no sys-
tematic experiments were carried out on gas phase diffusion the trend
suggests that with thia membranes significant amounts of P -phase with
a presumably smaller diffusion constant are formed thus leading to
anomalies. Norberg (1952) found a diffusion constant about one-tenth
smaller than our values, in palladium wires charged with hydrogen
thereby forming presumably a P- phase. This result would tend to con-
firm our data with hydrogen rich pall-dium. However the formation of
visible oxide films on the auodic side of the membrane suggests that
perhaps this film is responsible for reducing the apparent diffusion
constant. Hence our results cannot be regarded as giving unambiguous
support to the view that the diffusion constants in o( and 3 palladium
a:-e different. On the contrary the igreement of our results with the
extrapolated values from high temperature measurements seem to suggest
that both c( and 3 forms may have the same diffusion constant despite
the difference in hydrogen content.
(,,> : .'• •., • •a•"" " •• " " -• " •• o-• • ,,, t

8o
The results which we have obtained for the permeation of elec-
trolytic hyrdrogen are, in contrast to permeation fror- the gas phase, con-
sistent in the dependence on the thickness. The linearity of the to and
T versus L2 and the 1 versus L plots shows that the criteria for non-L p
stationary and steady state diffusion are satisfied. Hence we can
conclude that for small cathodic current densities no P -phase moving
boundaries are produced, and that the diffusion constant obtained is
that for the hydrogen poor O(-palladium.
(D) Errors in Classical Time Lag Method
It appears that measurements based on the time lag method may
be in error to about 15% in the absence of any coxTection for the
relaxation time. As already shown relaxation times are easily measured
when a continuous record of the permeation is made. Our results on
thickness variation show that the relaxation times increase approxi-
mately as the cube of the thickness of the membrane. Thus a spurious
thickness dependence will be noticed in the determination of diffusion
constant by the classical time lag method. The reason for the variation
of the time of relaxation with thickness is not easy to explain. One
should expect this to be & constant if indeed it represents the time
required for the concentration in the membrane to adjust itself to
equilibrium with the 3urface coverage, and hence the explanation
advanced earlier must be regarded as inadequate. The correction never-
theless is important for the calculation of the time lag and must be
applied in this empirical way in order to get results concordant with
the rise and decay time constants.
*e1e amd Thomas' (1060) results (Figure 41) for the temperature
. _,,. .÷ +1,+ ttg time nf rlaatinn may also be temperature
dependent to a different degree from the diffusion constant. Thus
the decay constant points (t0) seem to be less temperature dependent
than the time lag points. It therefore appears that the time lag method
may also give rise to a spurious temperature dependence of the diffusion
constant. In view of these drawbacks in the time lag method it seems
necessary to apply this continuous recording method in order to study
the diffusion of hydrogen in metals. It will then be possible to apply
a correction for the time of relaxation in the time lag, in the manner
described, or the rise and decay transients can be used without any
correction.
32. EXPERIMNTS WITH ARMO IRON MEMBRANES
(A) Permeation Measurements
Details of the cell snd auxiliary apparatus used in these experi-
ments have already been described (Devanathan and Stachurski, in press).
For these investigations Armeo iron sheets prepared in the following way
were used. Sheets of various thickness were degreased in benzene and
treated to 7000 C in an atmosphere of pure hydrogen and allowed to anneal.
The membranes were then mounted in the cell as described elsewhere
(Devanathan and Stachurski, in press). The anodic compartment contained
N NaOH and to reduce the possibility of passivation, this side was
coated with a thin electrodeposit of palladium. This thin coating did
( not materially affect the rate of permeation of atomic hýdrogen which
was rate controlled only in the iron membrane (Devanathan (1961).

82
Attention was paid to purification of the solution and pro-.
electrolysis was carried out in an external cell, before admitting the
solution in to the cell. In the permeation studies, the transients
were recorded as described earlier for various cathodic potentials and
various thicknesses of the membrane.
(B) Capacity Determinations
The capacity of the iron electiode at various potentials was
measured by using single sweep galvanostatic cathodic pulses. The
electrode was polarised at a low cathodic current density about 10-5
amp cm"2 with a simple galvaaostatic circuit consisting of two decade
power resistors in series and a 120 v dry battery (Figure 43). Across
one decade box a fast rise time mercury relay was connected so that on
closing the contacts the decade resistance box was shorted. Thus, it
was possible to obtain a rapid change of current density from a low
value to the required high value. The attendant change in potential
measured with respect to calomel reference electrode was registered
by a Tektronix 535 A oscilloscope with a type D preamplifier. The
trace was recorded on polaroid 46-C film with a Tektronix C12 camera.
Calculations were made from tracings on graph paper at a magnification
of 4 per cm of oscilloscope screen. The electrolyte solutions used
were sulphuric acid, sodium hydroxide and acetate buffer solutions.
All measurements were carried out at room temperature which was about
25 + 20C.

83
33. RESUIS AND DISCUSSION
(A) Anomalies in the Permeation
A typical permeation transient is shown in Figure 44. As ahown
elewhere the diffusion constant can be calculated from this curve in
as many as five different ways (Devanathan, 1961, 1962). Since the
identity of the diffusion constant evaluated by the various methods has
already been established, we have calculated D by measuring the time
tekea for the permeation to reach 0.6299 of its limiting value. Thus
tiie P5 the rAm* a6 the classiceJ. time lag related to the diffusion
constant by
-r2
""=ý.6 P, - (116)
Hence a olot of Tp=o.62F.Q vo vs, I? s±ould tWe a atralht lizt vhat.ever
the cathodic polarization conditionsa, Such a plot is showi in Figure 45.,
and thus !inearitZ i* prnot of the con-stwcy of Ithe -liffusion oonstant.
-4. muzary of these determtA~tona for 7arlous thieknesses is pri-sented
iU Table 9. In tze first pl-n 'do way note that the diffu5,on consta!Z
is independent •Žf thickness. Sev~rrl investlgators Lave -ported a
variation of the dlfTusion constarnt with thiclness, when calculated accord-
IG i to the classica.! time laa m'tho4, Thus Freczewska and Ratajczyic (1961)
find that for diffusion f.m thre ss phase the diftusion constant increases
mfrm about 3.8 x 1,07 cm2 sec"- for Armco iron memrsanes of thickness
0.02 M tr about 3.1 x !G-6 CM2 Oec"I for a thickness of 0.12 cm. The;.,
concluded t1 Ži above a thicimass of about 0.M78 cm the diffusion con-
stant is a&moet indepen~ent o± thickness. It appears likely that tiiis

84
TABtL 9
DIFFUSION COEFFICIENTS WASUME FOR VARIOUS THICKSSES
to(seeC)
L/cm) -1000 MR -14oo mv
0.129 33.0 ... 8.4 x io-5
0.129 --.. 33•7 8.2 x 10-
o.104 20.1. ---- 8.9 x 1o"5
o.o4 ---- 21.0 8.6 x 1o-5
0.079 i6.o ---- 6.5 x 10⁻⁵
o0079 ---- 1;.4 8.4 x lO
0.059 8.7 ---- 6.6 x 1O-5
0.059 .... 7.0 8.3 y 1O
0.026 3.2 ---- 3.5 x i0-5
0.026 ---- 2.6 4.3 x 10⁻⁵
0.0101 ---- 2 x 10⁻⁵
0.010 ---- 1 2 x 10⁻⁵
Average D taken from Figure 45 is: 8.3 x 10⁻⁵
effect is due to the surface exerting a controlling influence on the
diffuson.. •n our experiments in erid solutions we observel a black
film, of f'inely divided iron depositing on the cathode if the solution
weat io? a'equately pre-electrolyzed and if the corrosive solutions were
&1.lowed to ?e in contact with the electrode without a cathodic protec-
Lton cv-'rent. Whenever such a film was formed the permeation current

85
d--opped to about 3LL amp. Thus only membranes of sufficient thie-kness di
whici hae in ove-1 y1 pemetion rate unch less than IL, a*m will be tr
uneffected by this film. All thinner membranes -.i!l show a constant ti
yermestion of 3A am whatever the thickness beca~ase the film eor~trolc th, bf
overall rate of permeation. With careful purification and pre-t•lectrolysis fc
complicationa due to surface control by this fi)m can be avoided end bc
reliable permeation transients can be recorded. As shown zarlier, the hi
plot of the reciprocal of the permeation rate against the thickness ir
should be a straight line. In Figure 46 (Devasnathan, 1961, 1962) we show
such a plot for film free iron. The correspoading plot for membranes ac
covered by film is also shown for comparison as dashed lines. It is ti
seen that since the permeation rate is constant and controlled by the vi
film, its equivalent thickness apparently depends on the slope of the t]
line so that only for a higher thickness can any rational thickness C(
dependence be observed. The above results and those obtained wi'rh il
palladium show that attention rmst be paid to removing films which can o:
control permeation when at ti.e surface (Devanathan and Stachurski, in 11
press). It also appears that complex theories developed for explaining
apparent anomalieK, in permeation must be revdised. 3ýIt has been shown earlier that the rate of permeation cf
hydrogen under these experimental condltiom should follow tne equation
(Devanathan, 1961, 1962) r
s-4b
1 -+ ( 117)DO k Q k
where P 48 the permeation rate through a mexbwane of thickness 1 and
-,i-

s-b b-•s
diffusion constan'; D. k and k are the rate constant for the
transfer of hydrogei aiross the mentai solution boundary. Under potem-
tiostatic control the coverage of the cathode with hydrogen atoms Q w.ll
be constant. Hence at constant 7, equation (117) predicts a linear plots k-b 2
for VP vs. L. The gradient and the intercept ar
kboth dependent on the reciprocal of 6. Since in general Q is larger the
higher the ; value, for hMgn overpotentials, both the gradient and the
intercept shcould be smal.
Such plots for iron in 0.1 N sulphuri' acid solutions and in an
acetate buffer of pH 3.6 are given in figures 46 and 47. It is evideat
that the predictions of equation (117) are borne out and thus proof of the
validity of the assumptiona used in its derivation. One of these iss -*b b-+s
that the rate constants k and k be large compared to the diffusions-4b b-4
constant. From these plots it is possible to evaluate k since Q k
is known from the intercept and D is also known independently. Theb 4 s -2 2 -1
order of magnitude of k has been found to be 10 "cm sec , which iss-+b
larger than the value of D. It will not be possible to evaluate k
until the value ox G Is obtained by independent methods.
3b . MECHANISM OF THE HYDROGEN EVOLUTION REACTION ON IRON
he follo�-ing stager, are possible for the hydrogen evrclution
reaction on iron.
Fe + H + e0 -4 Fel (A)
Fel + Fe'-[ -- ). 2Fe + H2 (B)
Fel + A+ + e0 --- 2Fe + H2 (C)

87
The results of the permeation plots are shcvn in Figure3 46 an4
47. The gradient of the 1/P vs. 1 plot at constant I is according to
(117) given by
k'b -gs (118)
D kG
Hence
d logQ . d log& (019)
In order to evaluate d 1oE 9 it suffices to plot - log g against
Since the gradients of these lines are proportional to the siurface
coverage of the membrane with atomic hydrogen 9, the gradient of a plot
of log g against • yields the ratio dlog . This ratio has character-
istic values for certain mecuaniam sequences.
Thus if the reaction sequence is rate determining slow discharge
(A), followed by rapid Tafel recombination (B), then in the steady state
we have
= e (i. k T) e k 2 (120)
Since -when discharge is rate-determining G is usually small we may
write the approximate form
iD e kT (121)
Thowefoie the expression tor 9 as a function of ý from (121)
k D e (122)
Noting that o( is 0.5, since the Ttfei plot has a gradient of

8%
logrithmic differentiation of (122) yields,
- -i = IiR
If the reaction sequence is rate-determining discbarge (A)
follcwed by fast electrochemn-cal desorpt ion (C) then for the steady
state we have
i c = -Qe ((Qek )
Hence
k- -- = constant (125'
That is Q is potential independent, i.e.
d log - (026)
We show in Figare 48 such plots for the various solutions. The
curves consist of two linear sections. The first has a gradient of
F1 Fabout 0.36 (volt-) compared to 2.3 x 4,RT which is 0.42, the second hae
zero gradient. Hence in the above solutions the mechanism of the
hydrogen evolution reaction must be slow discharge always; iolloved by
Tafel recombination at low overpotentials, and electrochemical desorp-
tion at high overpotentials.
(A) Pseudo Capacity
With iron in acid solutions, the view that electrochemic'al
desorption might be rate-determining has also been suggested. Should
this be the case then the preceding step (A) must be in equilibrium

runless A is irreversible. Te th:i ease as shown by Bockris and Ktta
(1961) a pseudo capacity should be observed. A typi.cEi transient used
in evaluating the double laydr capacity is shown in Figure 49. The
capacity in the early stages vhcn the favad&ic current is negligible is
found to be about - 40}L F (See ?igure 50). -These values are much too
close to the double iayer valuies, a•d it is re~sonabl.e to Ponclude the
absence of pseudo capacity. This re_=At also confir-s the mechanisms
suggested all of which involve dischargc ao The rate-CetExmining step.
35. CW•CLWIONS
From the above it is clear that the mechanism of the hyirogen
evolution reaction is rate-determining discharge follcwe& by Taffe L
recombiizion at low overpotential, and electrochemnical desorption at
high .verx~tentials (> 600 mv). These conclusions are also irn hzzuowy
with the findings of Frumkin (1957), vho used a qgalitative method cf
establish;ng the mechanism, by observing the increase or decrease of
overpotential at constaunt current when additional amounts of hydrogen
are introduced by perieation.

RE:.ZCEf
Ash. P. atz. i.arre!Ž, R. ?-, Phil. Mae. b. l197, 1959-
Ash: R. and Barrer, R. M., J. Phys. Chem. 53lids, 16, 246, 1960.
Barrer, R. M., TrAns. Faraday zic., 3.3, 628, 1939.
Barrer, R. M., Diifusion in and throoigh Solids, Camibridge University
PrAss, p. 220, i94l.
Bockrisý J. 0'M., et -1., Trans. Faradcy Soc. 1i6 , 918, 1950.
Bockris, J. 01M., Hodern Aspects of Electro-chamistry, Elsevier PtUbl. Co.,
AjnuterdwiT, 1P51.
Bockris, J. O'1. and Parsons, R., Trans. Faraday Soc., h70, 91h, 1951.
Bockris, J. •,1O. and Devanathrao, M. A. V,, O.N.R. Tech. Rep. No. ONR
551(22), Nc. 1 (Aizzg 31, 1957).
Buckris, J. 0'M. and Conuay, B. E,, J. Chbm. Phys., 26, 532, 1957.
Bockris, J. O'1M., Pentland, N. and Sheldon., E. J., .Lectrochem. Soc.
124, 182,, 1957.
Bock-is, J. 0'?4. anJ Tnacker, iR., O.N.R. Tech. Rep. No. 3 MR 551(22)
(Dec. 31, 1959)
Dockris, J. 0'1M., Devanathan, M. A. V., and Meh], W., J. Electroanal.
Chem. I, 143, 1959/60.
Bockris, J, 01'M. and Kita, H., J. Electrochem. Soc., 108, 676, 1961.
Bcvden, F. P., Prrc. Roj. Scc., A125, h40, 1929.
Breiter, M., Knorr, C. A-, and Volkl, V., Z. Elektrochem., 59, 681, 1955.
Daynes, H. A., proc. Rcy. Soc. A97, 236, 1920.
Devanathan, M. A. V., and Selvaratnam, M., Trans. Faraday Soc. 56, 1, 1960.
Devarathan, M. A. V.a O._.R. eca. Rep. No. 3, OfR 551(22) N•R036-028
(Feb. 28, 1961) 4
Devanathan. M. A. V., In couirse of publication, 1962.

91
Devanathan, M. A. V. and Stachurski, Z., Proc. Roy. Soc. (London) A1962
(in press).
Devanathan, M. A. V., Trans. Faraday Soc., 1962 (In press).
Devanathan, M. A. V. and Stachurski, Z., J. of Electrotechuology, 1962
(In press).
Frank, R. C. and Thomas, J. E., J. Phys. Chem. Solids, 16, 144, 1960.
Frumkin, A. N., and Slysin, Acta Physicochimica, U.S.S.R.,
ý3_ 791, 1935.
4, 911, 1936.
5, 819, 1936.
Frumkin, A. N. et al., Kinetika Elektrodnokh, Protsessov, Izdatel'stuo
Moskov, Univ. Moscow, pp. 45-46, 1952.
- Frumkin, A. N., Z. Physik. Chemie, 207, 321, 1957.
Kortum, G. and Bockris, J. 01M. Textbook of Electrochemistry, Elsevier
Publ. Co., Amsterdam, p. 362, 1951.
Norberg, R. E., Phys. Rev. 86, 745, 1952. C
Palezewska, W. and Ratajczyk, I., Bull, De L'Acad. Polon. des Sciences,
IX. 267, 1961
Parson, J. and Butler, J. A. V., Tranrs. Faraday Soc., 3h, 1163, 1939.
Silberg, P. A. and Bachman, C. H., J. Chem. Phys. 29, 777, 1958.Velselovsky, V., Acta Physicochim., U.R.S.S., 1l, 85. 1939.
Wahlin, H. B. and Nauman, V. 0., J. Appl. Phys. 2b, L2, 1953.

POTENTIAL w.rt. REVERSIBLE H ELECTRODE IN SAME SOL
0"
n -Uroo
F b z -n i
1N N0 .-. >zol --o 0
o >b4 z>O ;a 0
000 5 0
00
0"-) -43• 33 o'4
(31r, - 'o I -o N 3
A.-
3~

POTENTIAL VOLTS
,1
i•-
bJ)
1-Ti
r
z
0) 0>0
"3 3
0-
31O310z

" -, '.FIG.4
I IA4 0 0 8
~ P 1 A I•. lI5
Vx250
6\
200 5
150- 4/ /
o/ o
S00- 3II
50 2/I
0 _ _ 1 / I
-4 2 0 .2 .4 .6
POTENTIAL VOLTS
FIG.5
300
250iH _ ane
200-
030
•:150-
50
42 0 .2 .4 .6
POTENTIAL VOLTS
"Mglao)i' -;W --' W__ • . ...

FIG. 7400[
-I.3001-
P-50
cn zoo-CIL
�(�100-
50,-
Z2 .4 .6 .8 ID 1.2
MiLLISFCONDS
.. 5 -FIG.6
a.
4
I
t. I _ ! I ..
0 20 40 60 80 100 120
MILLISECONDS

01 (D<K
-C'--
MG£

ri(A 4 (P00 0 0 0
C0 0 0 0 0
Ix
Z-
p
o m
E Z
Pm o
zp
00
o -
o.r-rn
- o c
P1 0
z(Agz
•"0
\0, 0
-d o

0) c) 04s[ 0 0 T-
0
z
0 -1 0 <
> >)
400GC>Z zz
C)3 0
>1 00
1- 0 -
00
0 0
NU)
N

COULOMBS PER APPARENT SO. CM,___ ___ __C-) OD Z5__ _
I I I I I I
\0 o" - - t- 0
z ~C)
I3X
rto 0 o0
0 -
> C
i I Ii III I II II •> i I

HZ
FIG. 12
50KA 50Kf
CCATHODIC CIRCUIT90VE
INVI O, jOHANODE01 A H ELECTRODE C.R.O23 4 -,,, -•E T O • c
53/54 D TEKTRONIX
'E 15.53CYL. 5°o20 DORANIk
90V ANODIC CIRCUIT WITCHA 5o MTWIC gf- METER
RES A NCE 6 G 6I
FIG. 13

500
400-
300-
200-
100-
504.0 3.0 2.0- Ioo i,. (A cm-2)
FIG.14
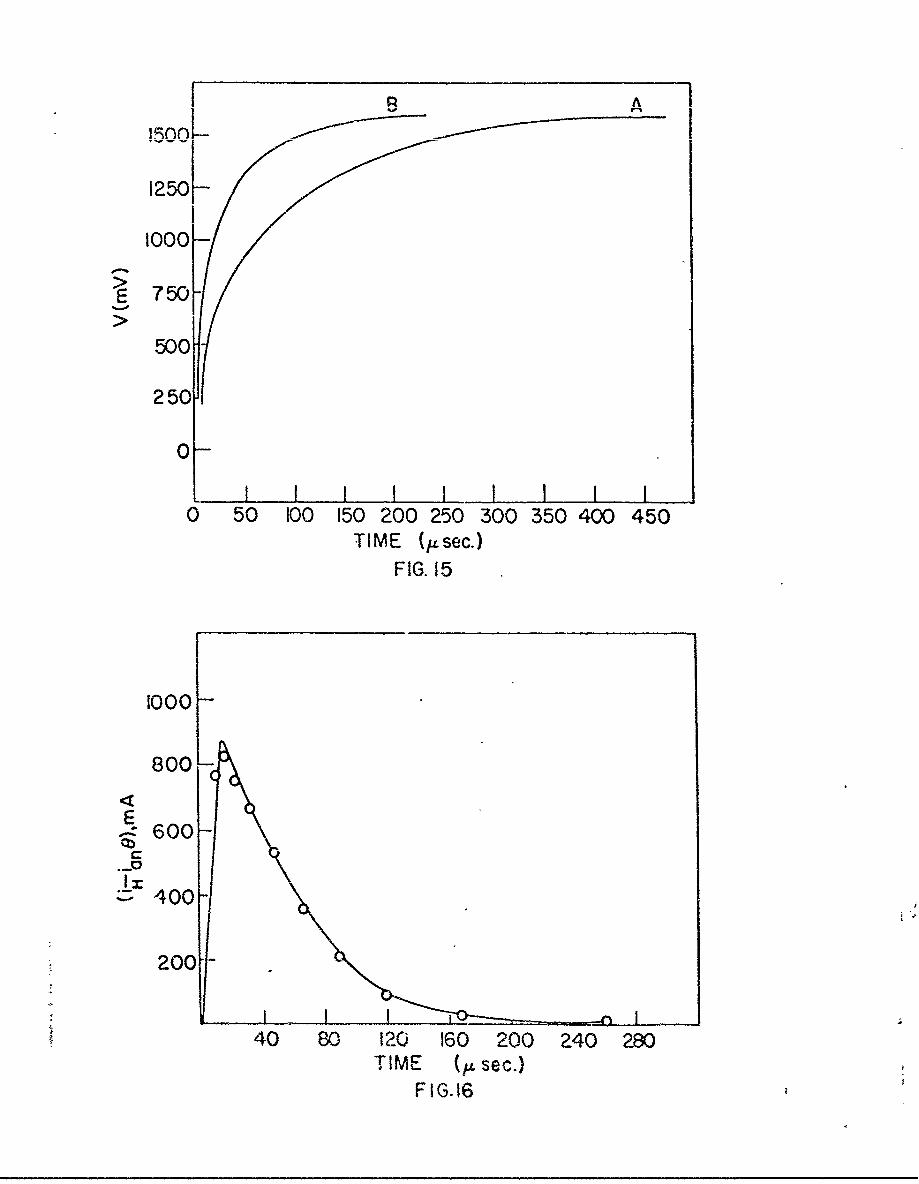
fl A li~nnV
1250-
1000 HE750L
500
250
0-! I III!II
0 50 100 150 200 250 300 350 400 450TIME (,4sec.)
FIG. 15
1000-
800-
E' 600.C
-400
"200
40 80 120 160 200 240 280TIME (f sec.)
FIG.16

"C 7700k-
600
500
400
300-
IO 0a0200-
100r 0 0
I !1 i I 1 I0.2 0.4 0.6 0.8 10 1.2 1.4 1.6 I8
Anodic c.d. (Acrre 2 )FIG. 17
7 P6
5
e 4
3-
2-
6 5 4 3 2,-I ogl ic (AG cre- )
SFI G. 18

0
0/4.8.- o/
440
0 40
a3.2
0
2.8
24
1 I ! 10.2 04 0.6 0.8 1.0 12
-log 10 8
FIG. 19
200-
7(mN150
100-
50- -
5.5 4.5 3.5 2.5logi 0corr (A cm- 2 )
FIG. 20

H >I Ian
it
Ian
FiG.21

'H
t Kit
Ion <
it
II
ion
FIG.22

I
II
x
V
I. �N.
I -% I-4L--i
_ 81 9) IIv -% $I
N% I11'I'I
* -
0
4
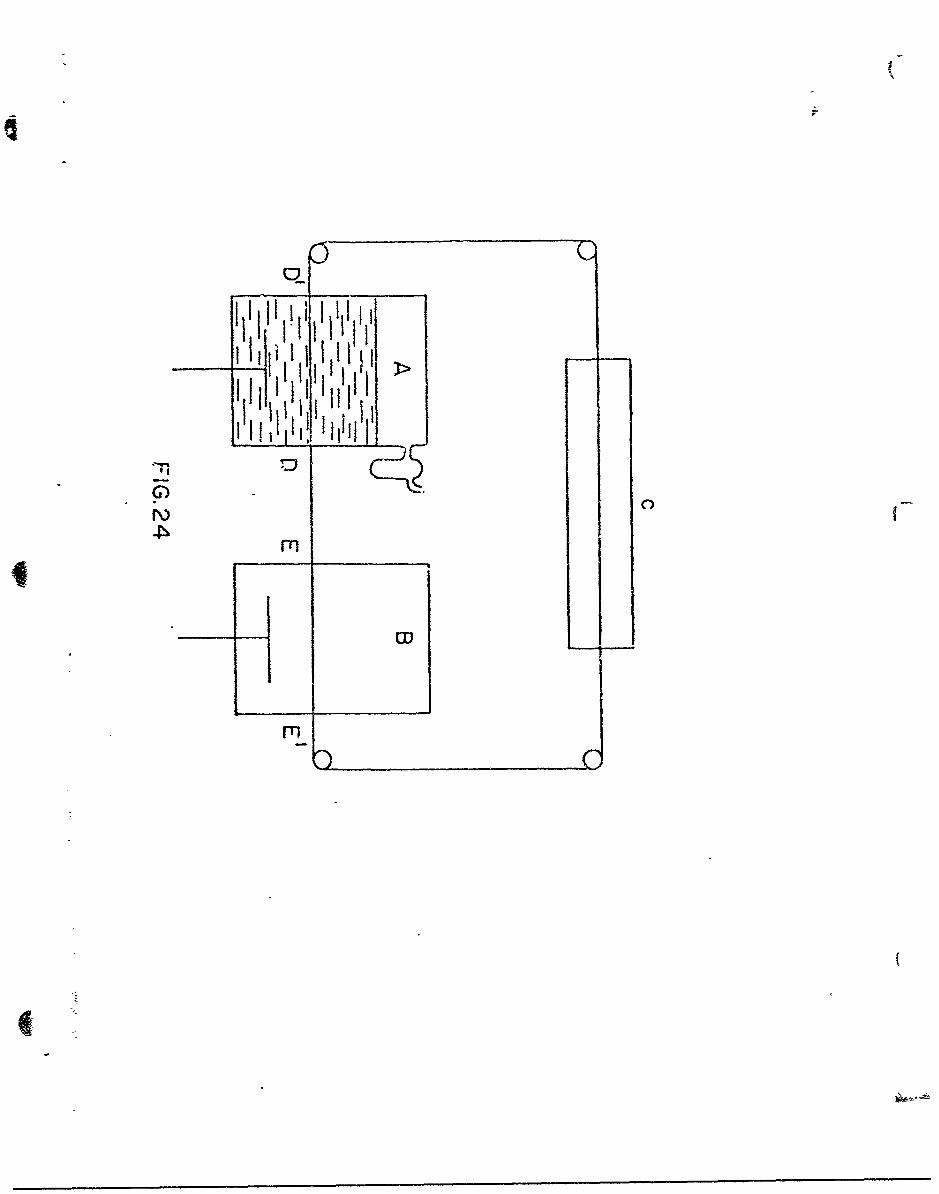
I
0
I 111i I 1111
'I
C)
m
w
P1

FIG.25
\T
[+
1 1
" *
I
I -
ID -.B

it"OL..JUIXL.- /-L iy
W (A5 0 0F-7
JI
0I1
z0-
IN))

PRESSSURE tHg
010
'C:
I0103 ,X\
x
0-x
I k

- f FIG. 28
1.0-
x
xx0.6- X
x04
0-i x
x0-
-0.2- X
-04 X
-0.6
* 0.8:-2-IT2 I0'
LoI

FIG. 29
1.0- x x
0.8-x)( x
xx0.6- x
x
04-x
0.2-
0-
o-0.2ý
-04-
-0.6-x
-0.8-
-1!00
L-og10 I

FIG. 30
0
w-ii
Lii
0.
0
oo-
wil

PRESSURE pLHg(A ,4 cn 0) (-j 0
S0 0 0 0 0 0 0 001 A
II
rnr
OD"0)--
1U
(O
L _ _ _ _ _ _ _ _ _ _ _ _ _ _ _ _ _ _ __ _ _ _ _ _ _ _ _ _ _ _ _ _ _ _ _

P F"ESSURE,. aHg-N (A 4s° 1I I Ii :
I-LOx
_0
O xH x
xx
ma)0-
OD0
tx(D0
0

R. FIG.33
-J B
Td
"_S "

I N N
I-~
-TI

RISE TRANSIENT
STEADY STATE moo
iK2 9 9 Lut "
SWITCHON t --
DECAY TRANSIENT
SWITCHOFF
tFIG. 36
MEM2RANC
CATHODICALLY - - ANOD'CLLYPOLARISED'-- POLARISED
vakOHb-" a
V2 : kc 2 I x,
COO
IDIrFU6?ON
XxL D X7%0
FIG.35

4AA

pO
VW-b
Lniii w-. 4 - I
U l
0:0c

F 1
063
1Log
o~
of-D

FIG.40
21
15 + 4c
Log A + /
1.2
09 + 3C
I /S 0.6 -
06' +Ir
+ + 2C
0. -- I
ii
I
I
-0.3 -
0 500 1000 1500SEC.

FIG. 41
"lag o (D (D
rise E4000F ~0 coEg.deco•T•to, - • 1
E0
3000 CL
x
2000- +
++
xx
1000 -
1 000 2000 3000tL2
- - ~- a -- ~ t rL

FIG.42II
'a 12ci.
E
1, 0--
8-
6-
4 --
2-+
I I II l 10 0.02 0.04 0.06 cm. 4
L

I0-NO
0
R,, RA P-
Potentiostatl Potentiostat C -C "A 0P
Si I,, Dr
q' ~00
0
ii
r iA
L -
--I
-'

~ch
I1I
-41 0.63 Pow
0-
0'
0t
0- P0
-4.
0
0
-op
I

F IG.45
Tlag
(sec)
36 0.
32 0.32
28.
- 26 0.
20 0.J -=L16- 0
12- 0
8 0.8$
4 0C
0.2 0.4 0.6 0.8 .0 [.3 1.5 1.7 ý(rmM) 2*

FIG.46
0.7-
0.6-
8001mV",0.5-
sa-
04-
0.3 0DIOOOmV
0.2-1200 a 1400mV
0.1I
0 0 0I.0 0 0 0 0L (0.02 0.04 0.06 0.08 0.10 0.12 0.14 L(cm)

F IG.47
/ 600nVt
0.22
650mV
0.20 0/~0)
0.18
0.16+I ~/ 0
0
~0.14 - +
0.12 -
0.10 //C
0.08 750Vc
0.06 +/ 800mV/C
900alOOOmV
0.04-
0.02-
L I _ _ _ 1 31___0 0.02 0.04 0.06 0.08 0.K0 0.12 0.14 L (cm)

(I-) C) Uu uýjk "0 0 0 0 0 0 0 0 01 1 11 !t!
br-
0
a,\
00+
0
+)+0
0
+
0
0
O,
31

POTENTIAL WITH RESP. TO CORROSION POTENTIAL
'{ • -I-- j umvI
II0
- 0
mm
m i, im i. rz i

F IG.50
(p F/c mZ)-J41~
50-
w -0
~30-
w
20)
20
o 0 -
300 500 700 mV
EN HE