Hypothesis Tests OR Tests of Significance One Sample Means.
52
OR OR Tests of Tests of Significance Significance One Sample One Sample Means Means
-
Upload
tyler-parsons -
Category
Documents
-
view
238 -
download
1
Transcript of Hypothesis Tests OR Tests of Significance One Sample Means.
Hypothesis TestsHypothesis TestsOR OR
Tests of Tests of SignificanceSignificance
One Sample One Sample
MeansMeans

Basketball AppletBasketball Applet
►http://bcs.whfreeman.com/tps4e/#628644__666398__
Level of Significance Level of Significance ActivityActivity
►Fish Oil vs Regular OilFish Oil vs Regular Oil
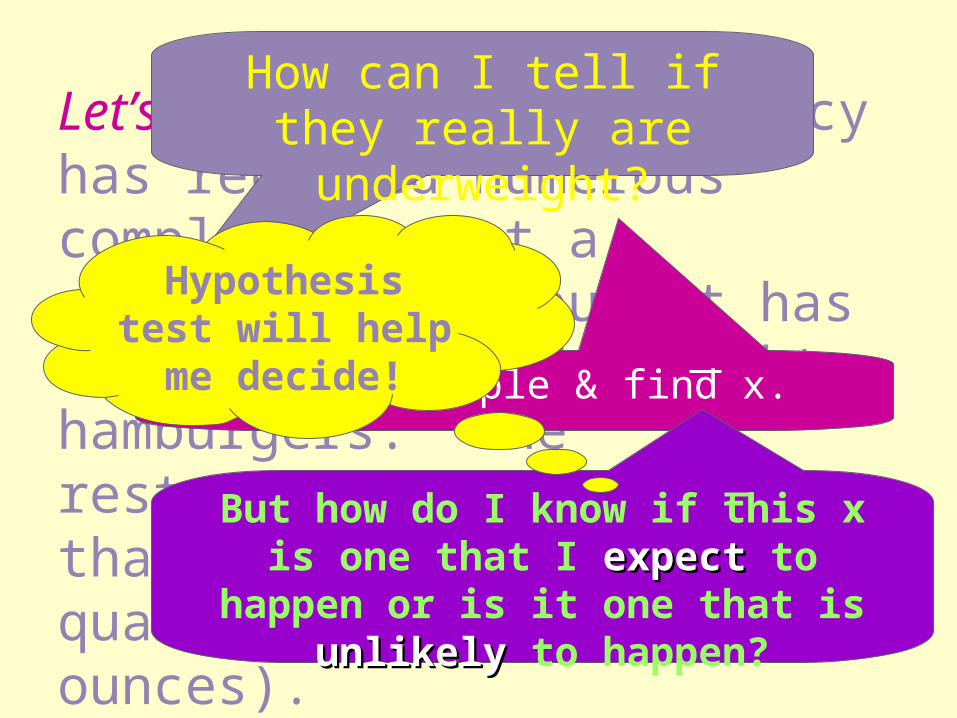
Let’s say a government agency has received numerous complaints that a particular restaurant has been selling underweight hamburgers. The restaurant advertises that it’s patties are “a quarter pound” (4 ounces).
How can I tell if they really are underweight?
Take a sample & find x.
But how do I know if this x is one that I expectexpect to happen or
is it one that is unlikelyunlikely to happen?
Hypothesis test will help me decide!
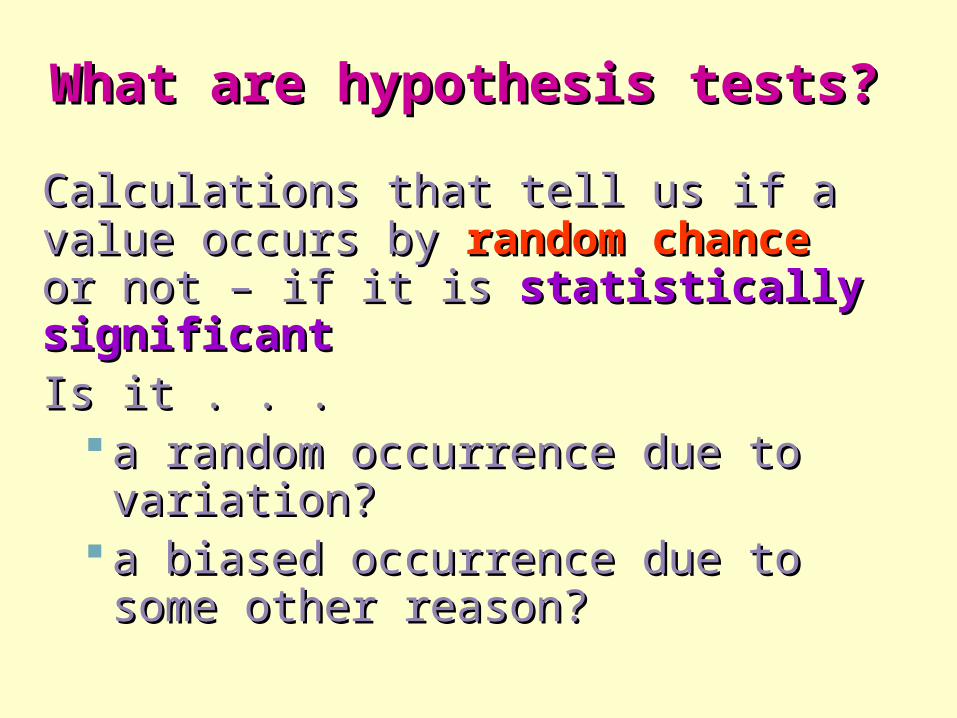
What are hypothesis tests?What are hypothesis tests?
Calculations that tell us if a value Calculations that tell us if a value occurs by occurs by random chancerandom chance or not or not – if it is – if it is statistically significantstatistically significantIs it . . .Is it . . .
a random occurrence due to a random occurrence due to variation?variation?
a biased occurrence due to a biased occurrence due to some other reason?some other reason?
Nature of hypothesis Nature of hypothesis tests -tests -►First begin by supposing the First begin by supposing the
claim or “effect” is claim or “effect” is NOTNOT presentpresent
►Next, see if data provides Next, see if data provides evidence evidence againstagainst the the suppositionsupposition
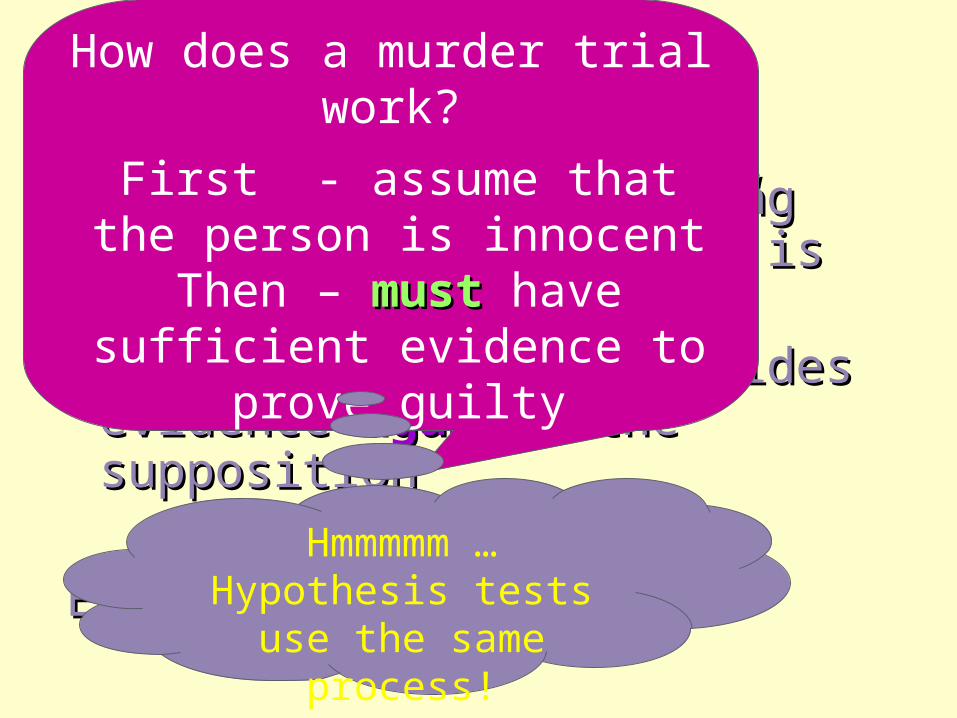
Example:Example: murder trialmurder trial
How does a murder trial work?
First - assume that the person is innocentThen – mustmust have
sufficient evidence to prove guilty
Hmmmmm …Hypothesis tests use the same process!
Debra InterpretationDebra Interpretation
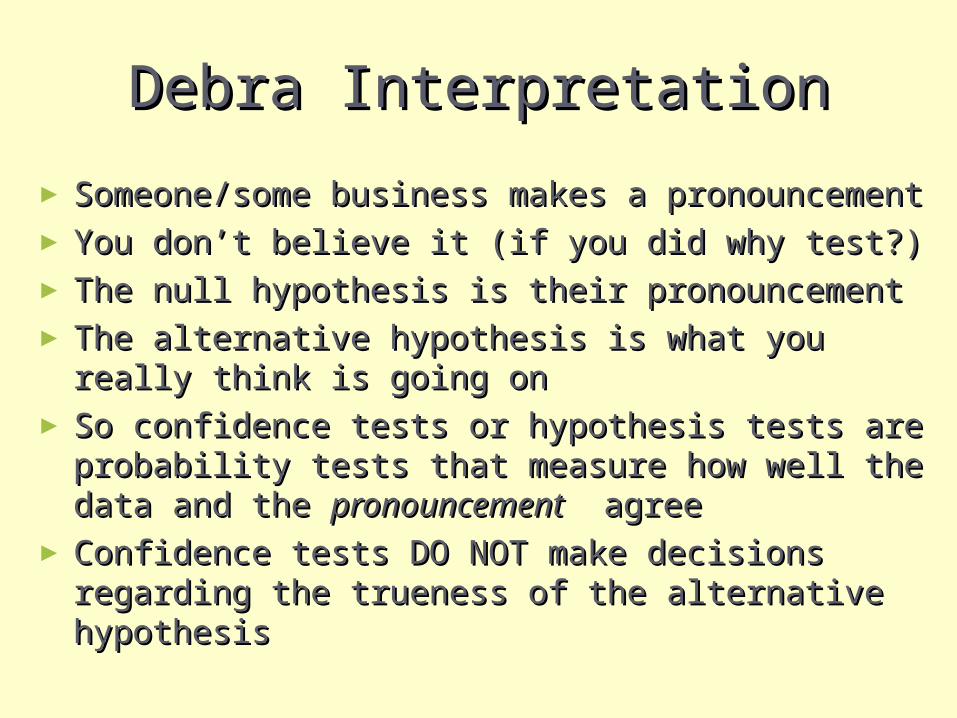
► Someone/some business makes a Someone/some business makes a pronouncementpronouncement
► You don’t believe it (if you did why test?)You don’t believe it (if you did why test?)► The null hypothesis is their pronouncementThe null hypothesis is their pronouncement► The alternative hypothesis is what you really The alternative hypothesis is what you really
think is going onthink is going on► So confidence tests or hypothesis tests are So confidence tests or hypothesis tests are
probability tests that measure how well the probability tests that measure how well the data and the data and the pronouncementpronouncement agree agree
► Confidence tests DO NOT make decisions Confidence tests DO NOT make decisions regarding the trueness of the alternative regarding the trueness of the alternative hypothesishypothesis
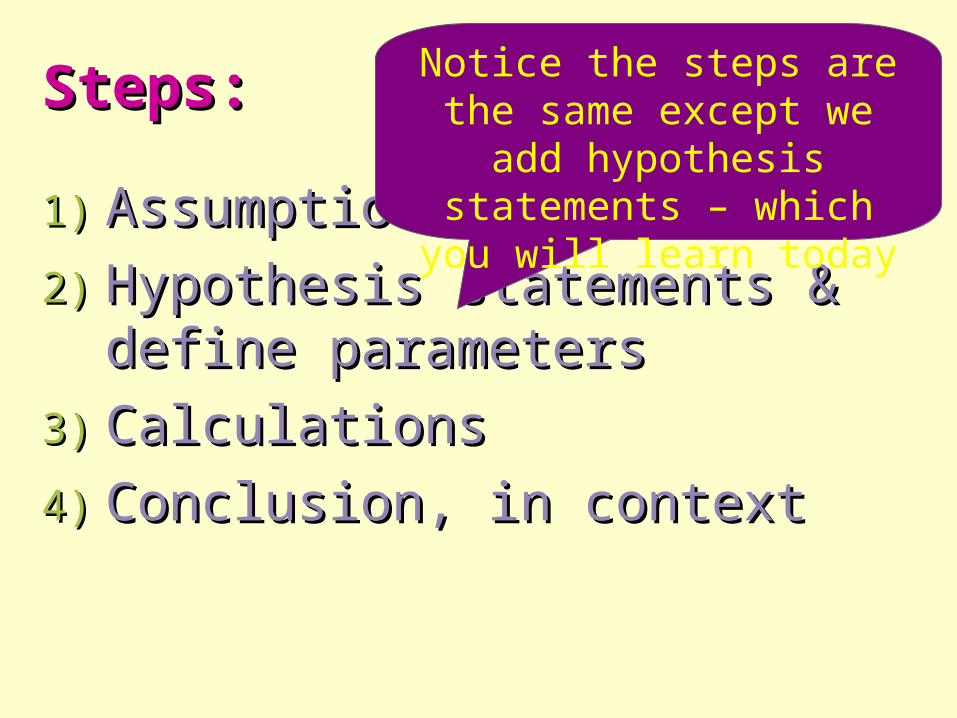
Steps:Steps:
1)1) AssumptionsAssumptions
2)2) Hypothesis statements & Hypothesis statements & define parametersdefine parameters
3)3) CalculationsCalculations
4)4) Conclusion, in contextConclusion, in context
Notice the steps are the same except we add
hypothesis statements – which you will learn
today
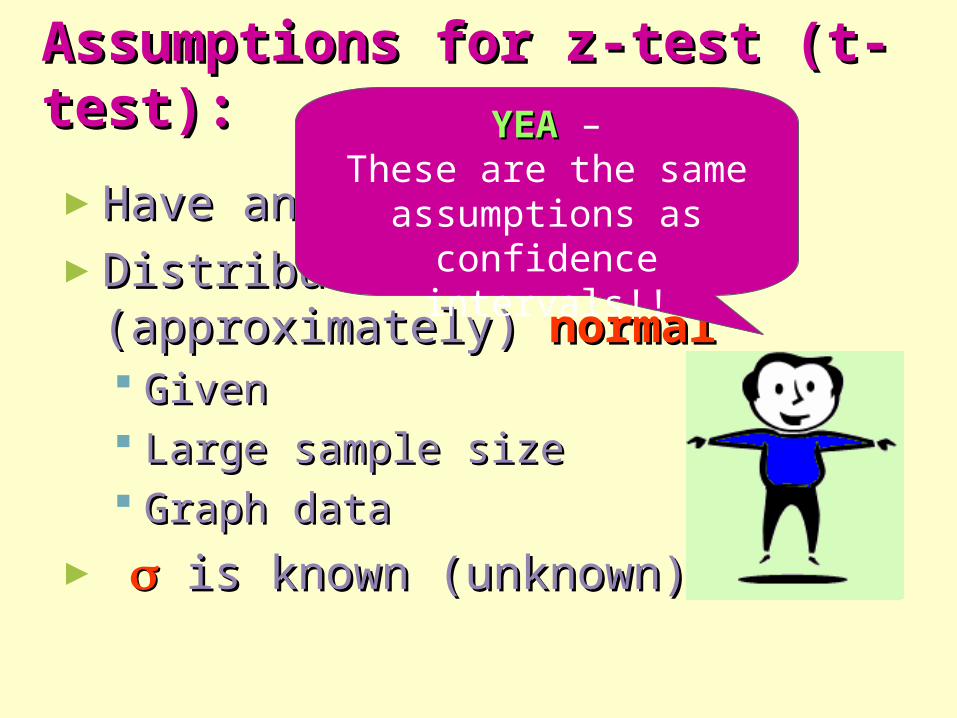
Assumptions for z-test (t-Assumptions for z-test (t-test):test):
►Have an Have an SRSSRS of of contextcontext►Distribution is (approximately) Distribution is (approximately)
normalnormal GivenGiven Large sample sizeLarge sample size Graph dataGraph data
► is known (unknown)is known (unknown)
YEA YEA –These are the same
assumptions as confidence intervals!!
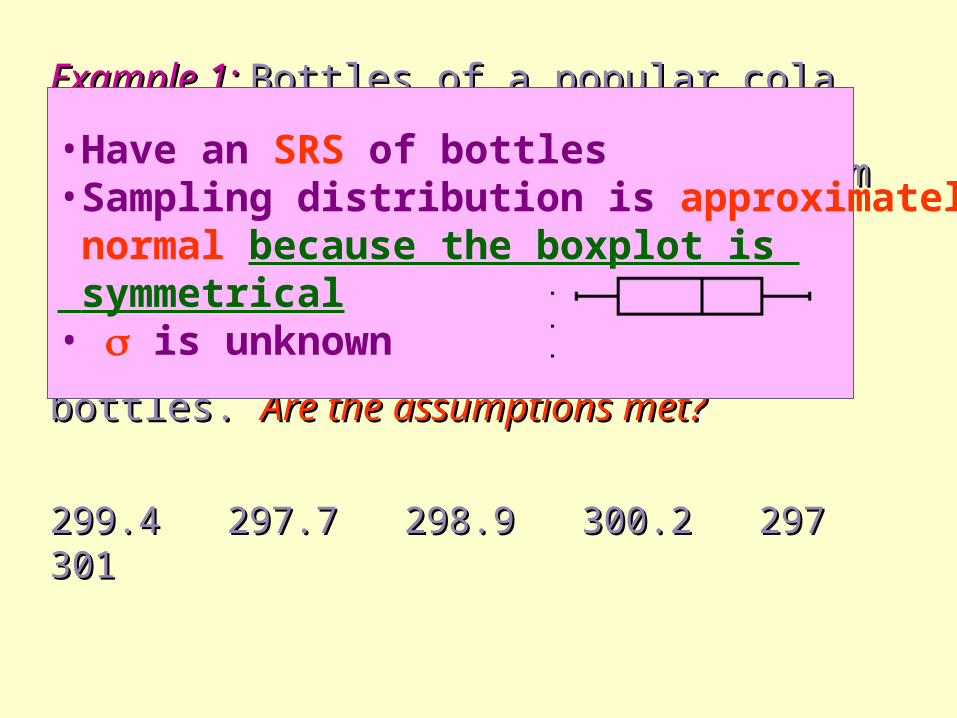
Example 1:Example 1: Bottles of a popular cola Bottles of a popular cola are supposed to contain 300 mL of are supposed to contain 300 mL of cola. There is some variation from cola. There is some variation from bottle to bottle. An inspector, who bottle to bottle. An inspector, who suspects that the bottler is under-suspects that the bottler is under-filling, measures the contents of six filling, measures the contents of six randomly selected bottles. randomly selected bottles. Are the Are the assumptions met?assumptions met?
299.4 297.7 298.9 300.2 297 299.4 297.7 298.9 300.2 297 301301
•Have an SRS of bottles•Sampling distribution is approximately normal because the boxplot is symmetrical• is unknown
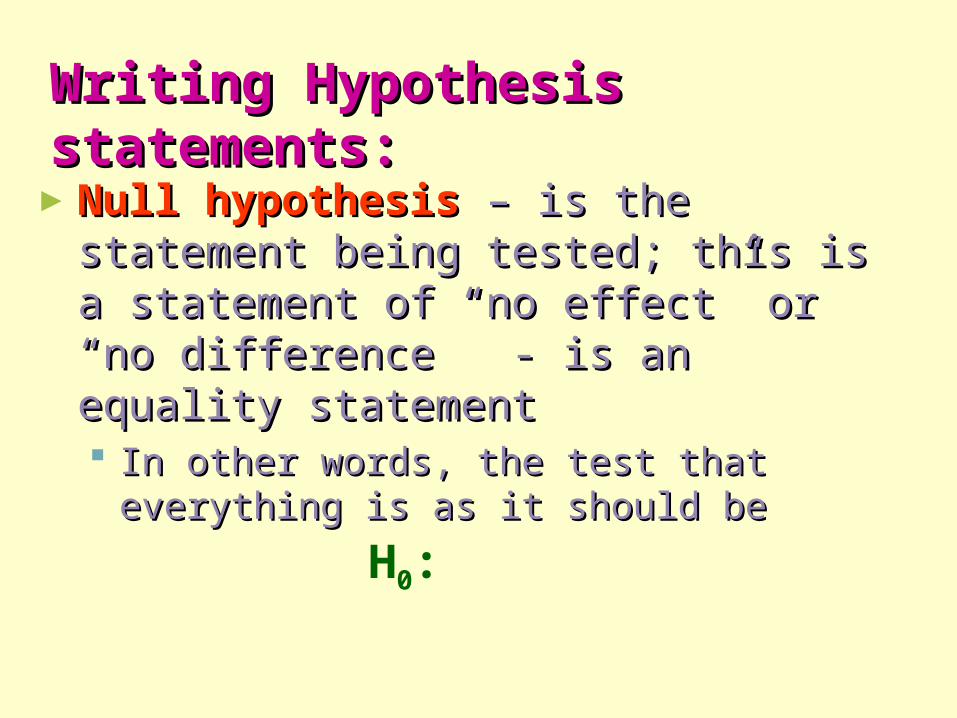
Writing Hypothesis Writing Hypothesis statements:statements:►Null hypothesisNull hypothesis – is the statement – is the statement
being tested; this is a statement of “no being tested; this is a statement of “no effect” or “no difference” - is an effect” or “no difference” - is an equality statementequality statement In other words, the test that everything is In other words, the test that everything is
as it should be as it should be
H0:
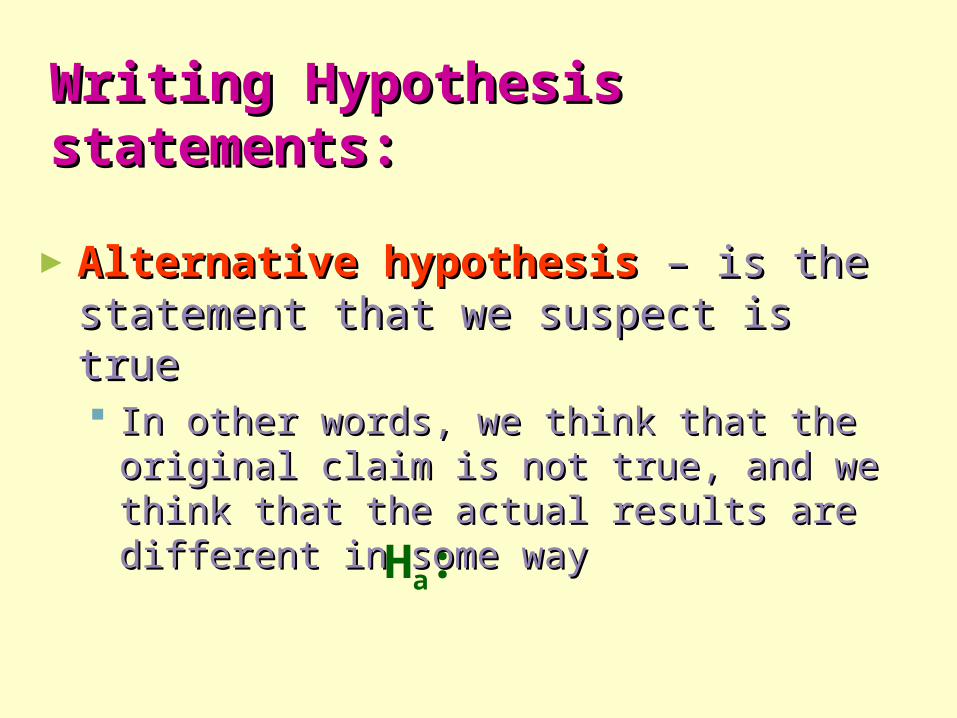
Writing Hypothesis Writing Hypothesis statements:statements:
►Alternative hypothesisAlternative hypothesis – is the – is the statement that we suspect is truestatement that we suspect is true In other words, we think that the original In other words, we think that the original
claim is not true, and we think that the claim is not true, and we think that the actual results are different in some way actual results are different in some way
Ha:
The form:The form:
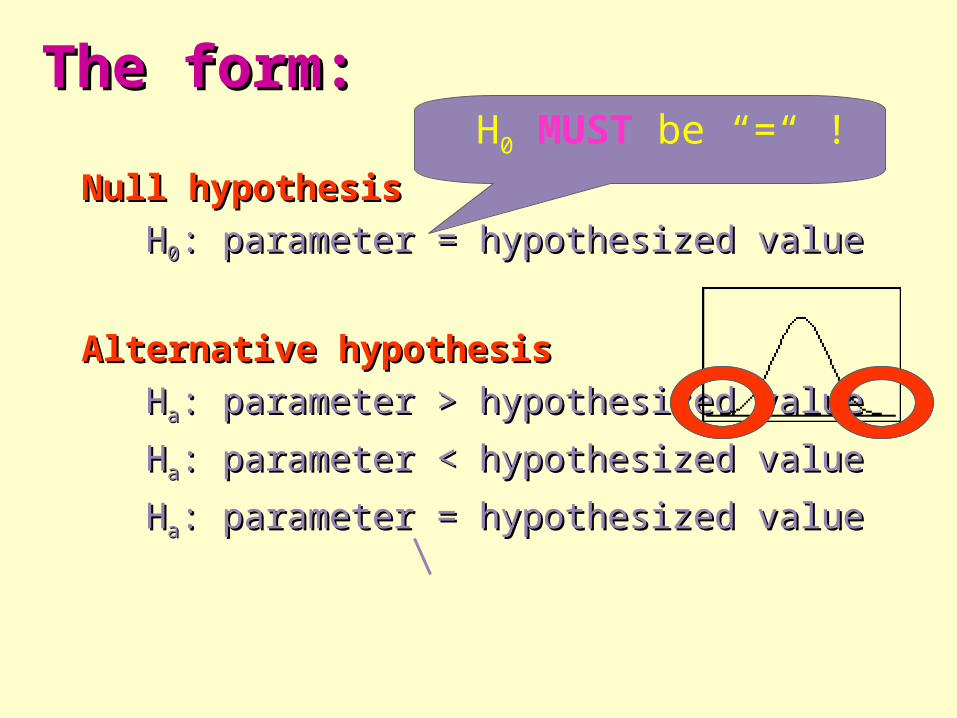
Null hypothesisNull hypothesis
HH00: parameter = hypothesized value: parameter = hypothesized value
Alternative hypothesisAlternative hypothesis
HHaa: parameter > hypothesized value: parameter > hypothesized value
HHaa: parameter < hypothesized value: parameter < hypothesized value
HHaa: parameter = hypothesized value: parameter = hypothesized value
H0 MUST be “=“ !
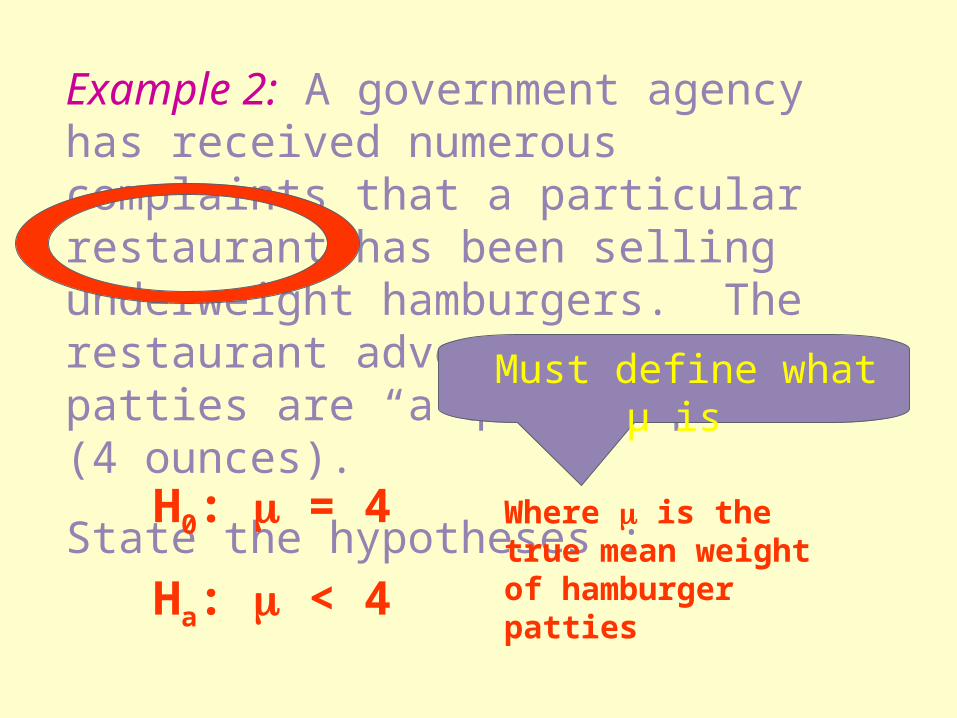
Example 2: A government agency has received numerous complaints that a particular restaurant has been selling underweight hamburgers. The restaurant advertises that it’s patties are “a quarter pound” (4 ounces).
State the hypotheses :Where is the true mean weight of hamburger patties
H0: = 4
Ha: < 4
Must define what µ is
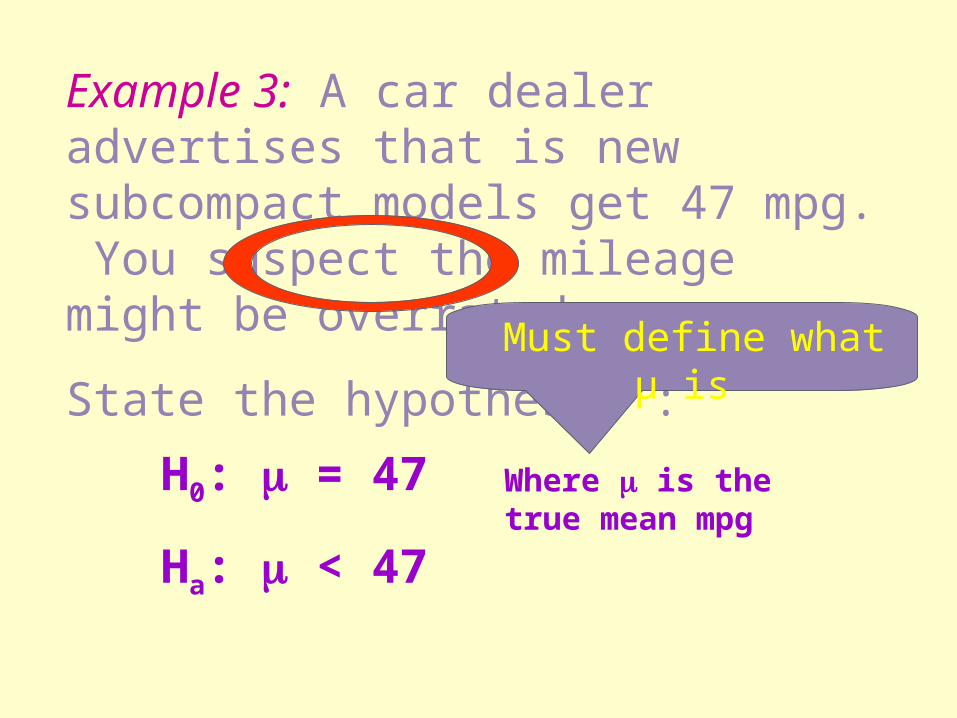
Example 3: A car dealer advertises that is new subcompact models get 47 mpg. You suspect the mileage might be overrated.
State the hypotheses :
Where is the true mean mpg
H0: = 47
Ha: < 47
Must define what µ is
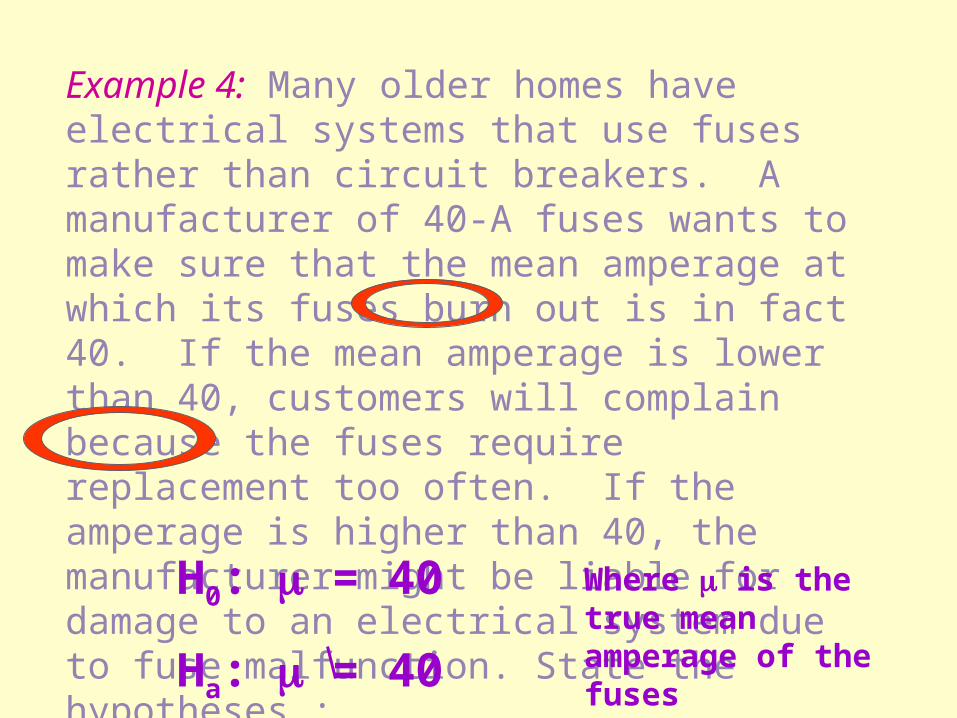
Example 4: Many older homes have electrical systems that use fuses rather than circuit breakers. A manufacturer of 40-A fuses wants to make sure that the mean amperage at which its fuses burn out is in fact 40. If the mean amperage is lower than 40, customers will complain because the fuses require replacement too often. If the amperage is higher than 40, the manufacturer might be liable for damage to an electrical system due to fuse malfunction. State the hypotheses :Where is the
true mean amperage of the fuses
H0: = 40
Ha: = 40
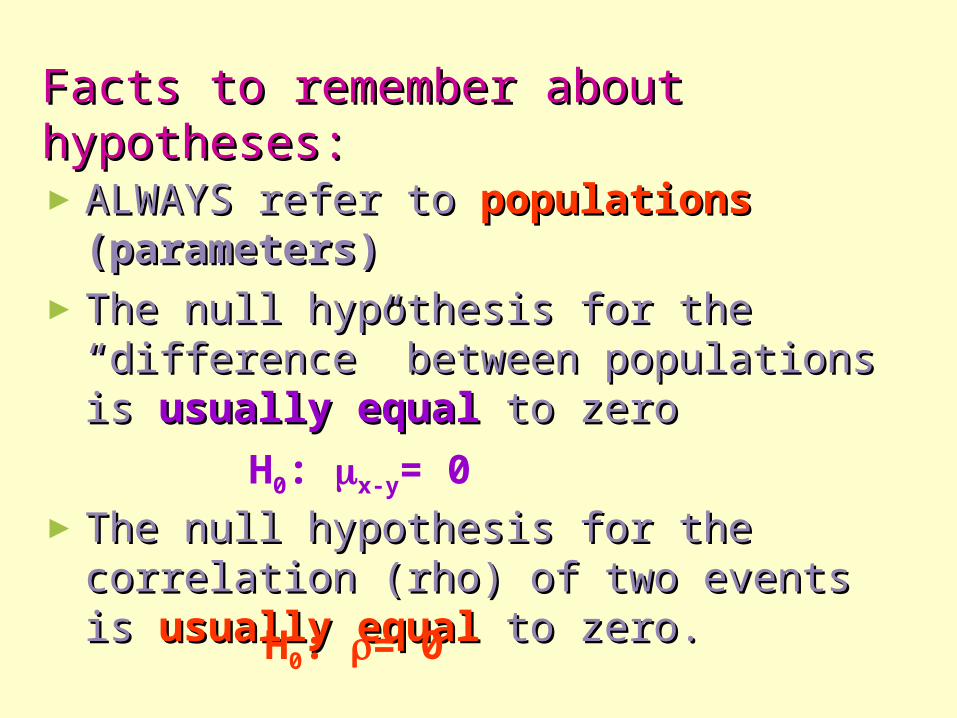
Facts to remember about Facts to remember about hypotheses:hypotheses:►ALWAYS refer to ALWAYS refer to populations populations
(parameters)(parameters)►The null hypothesis for the The null hypothesis for the
“difference” between populations is “difference” between populations is usually equalusually equal to zero to zero
►The null hypothesis for the The null hypothesis for the correlation (rho) of two events is correlation (rho) of two events is usually equalusually equal to zero. to zero.
H0: x-y= 0
H0: = 0
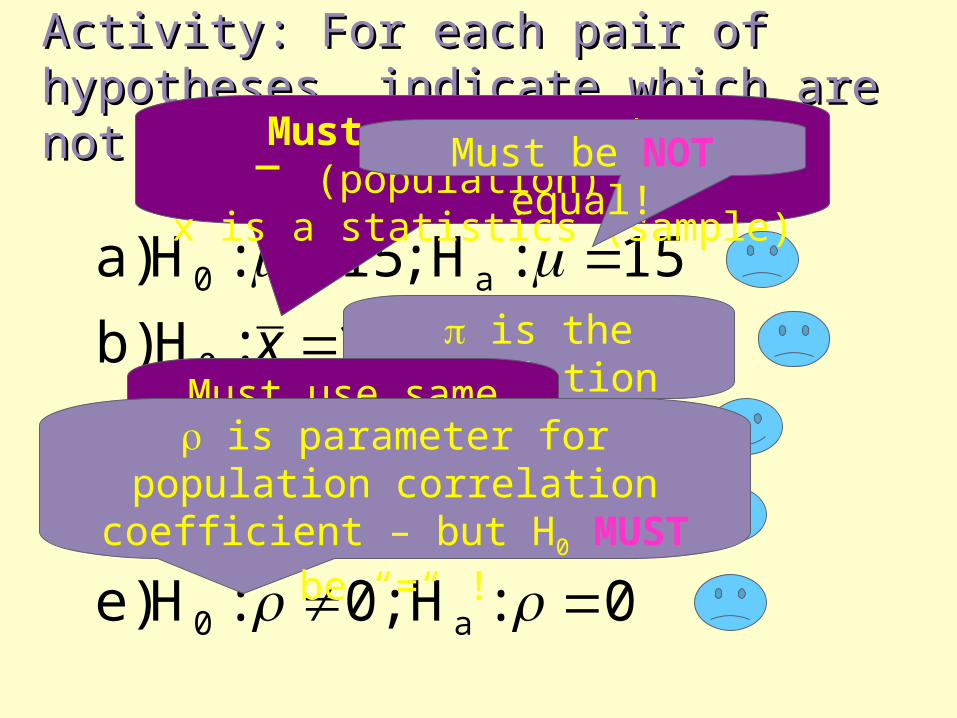
Activity: For each pair of hypotheses, Activity: For each pair of hypotheses, indicate which are not legitimate & indicate which are not legitimate & explain whyexplain why
0:H;0:H e)
6.:H;4.:H d)
1.:H;1.:H c)
123:H;123:H b)
15:H;15:H a)
a0
a0
a0
a0
a0
xx
Must use parameter (population)
x is a statistics (sample)
is the population proportion!
Must use same number as H0! is parameter for population
correlation coefficient – but H0 MUST be “=“ !
Must be NOT equal!
P-values -P-values -
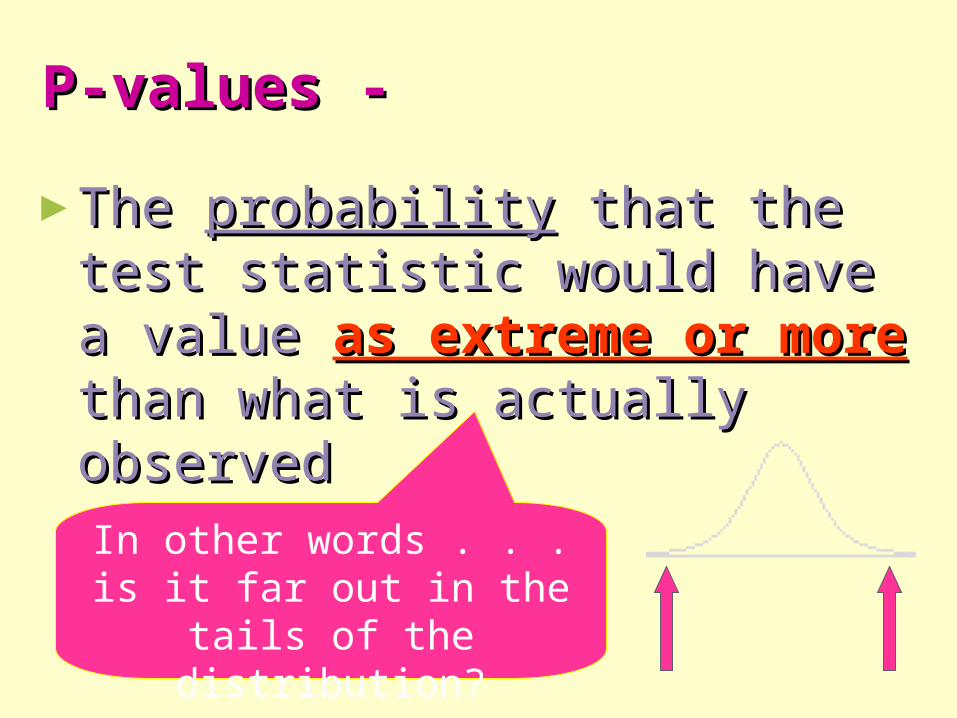
►The The probabilityprobability that the test that the test statistic would have a value statistic would have a value as as extreme or moreextreme or more than what than what is actually observedis actually observed
In other words . . . is it far out in the tails of the
distribution?
P-values -P-values -
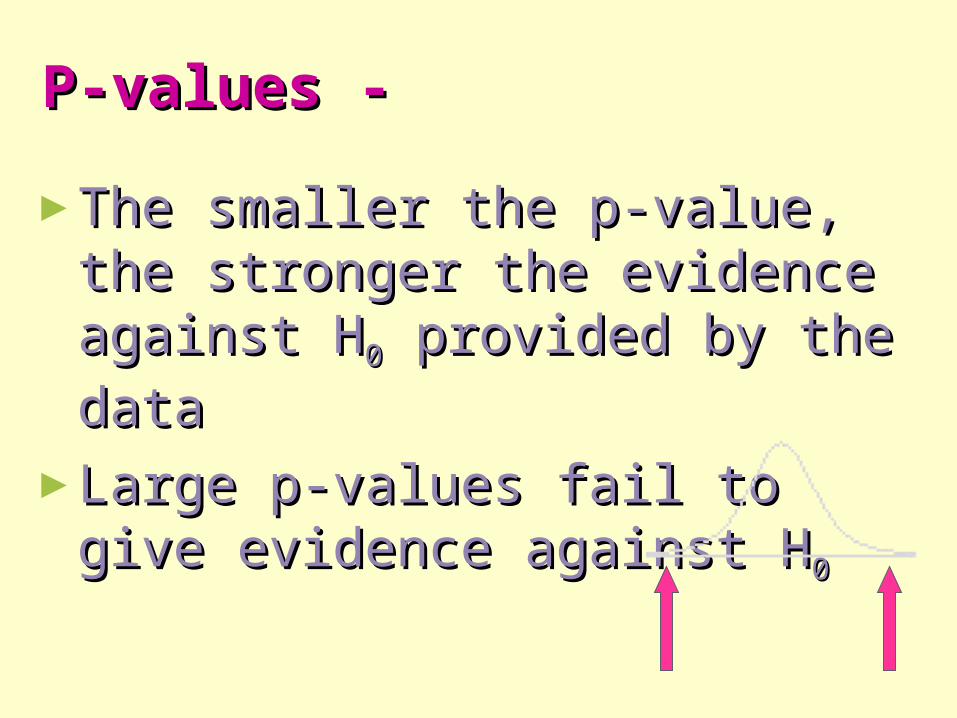
►The smaller the p-value, the The smaller the p-value, the stronger the evidence against stronger the evidence against HH00 provided by the data provided by the data
►Large p-values fail to give Large p-values fail to give evidence against Hevidence against H00
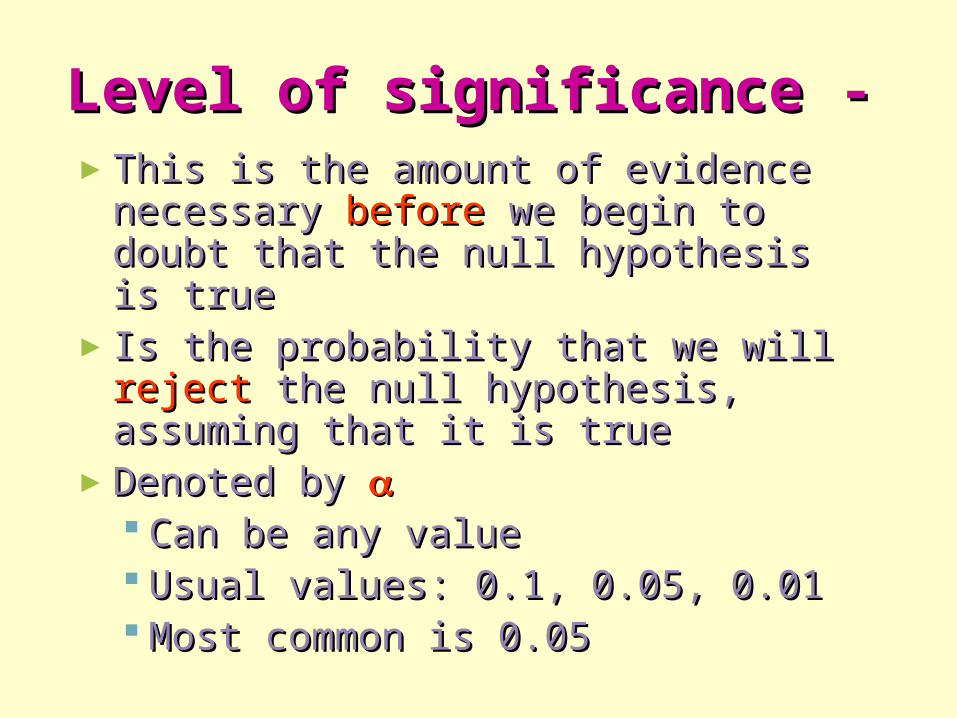
Level of significance -Level of significance - ►This is the amount of evidence This is the amount of evidence
necessary necessary beforebefore we begin to doubt we begin to doubt that the null hypothesis is truethat the null hypothesis is true
►Is the probability that we will Is the probability that we will rejectreject the null hypothesis, assuming that the null hypothesis, assuming that it is trueit is true
►Denoted by Denoted by Can be any valueCan be any value Usual values: 0.1, 0.05, 0.01Usual values: 0.1, 0.05, 0.01 Most common is 0.05Most common is 0.05
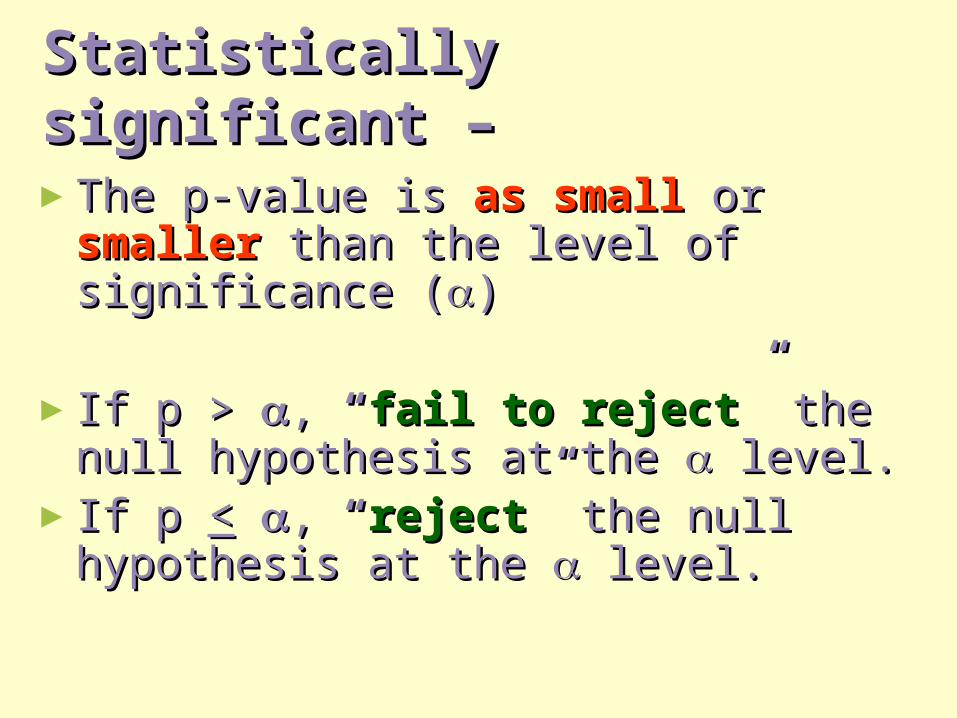
Statistically significant –Statistically significant –
►The p-value is The p-value is as smallas small or or smaller smaller than the level of significance (than the level of significance ())
►If p > If p > , , ““fail to rejectfail to reject”” the null the null hypothesis at the hypothesis at the level. level.
►If p If p << , , ““rejectreject”” the null the null hypothesis at the hypothesis at the level. level.
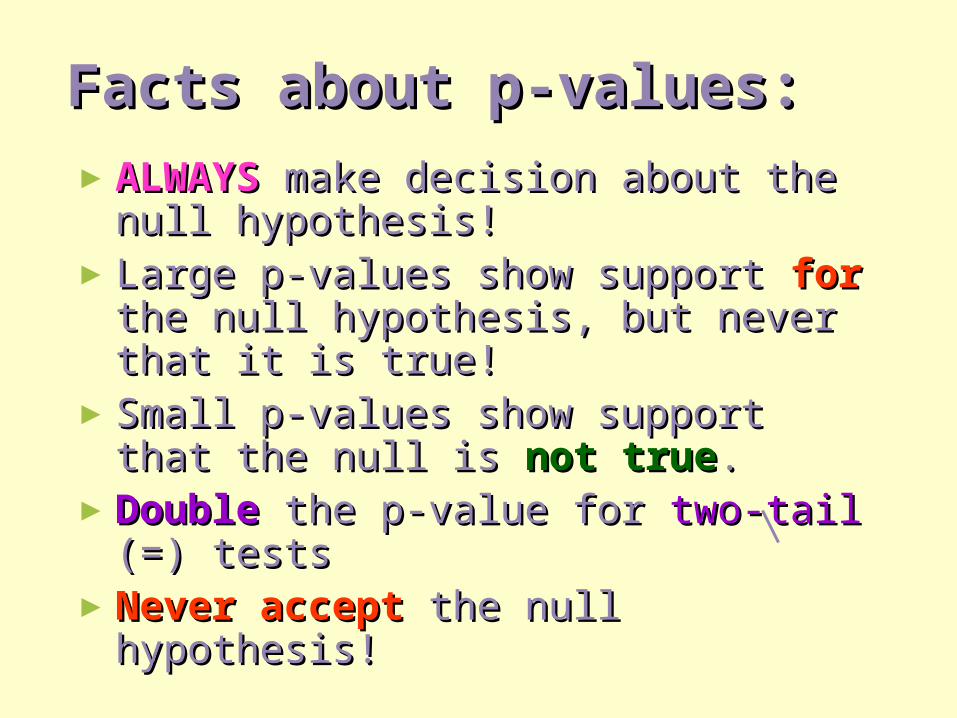
Facts about p-values:Facts about p-values:►ALWAYSALWAYS make decision about the make decision about the
null hypothesis!null hypothesis!►Large p-values show support Large p-values show support forfor
the null hypothesis, but never that the null hypothesis, but never that it is true!it is true!
►Small p-values show support that Small p-values show support that the null is the null is not truenot true..
►DoubleDouble the p-value for the p-value for two-tail two-tail (=)(=) teststests
►Never acceptNever accept the null hypothesis! the null hypothesis!
Never “accept” the null hypothesis!
Never “accept” the null hypothesis!
Never “accept” the null hypothesis!
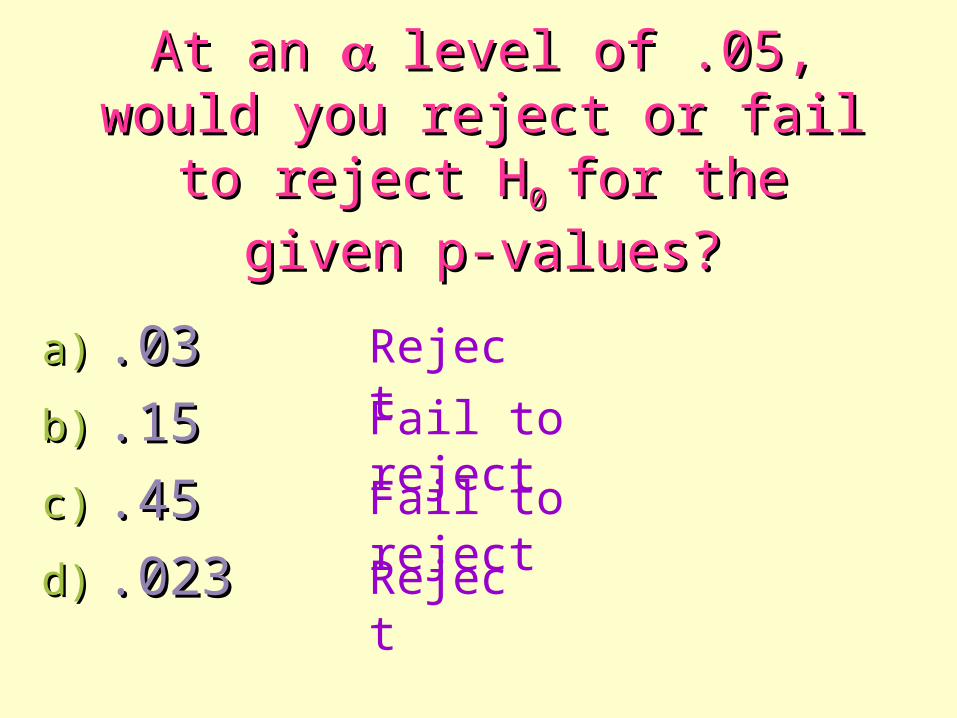
At an At an level of .05, would level of .05, would you reject or fail to reject Hyou reject or fail to reject H0 0
for the given p-values?for the given p-values?
a)a) .03.03
b)b) .15.15
c)c) .45.45
d)d) .023.023
Reject
Reject
Fail to reject
Fail to reject
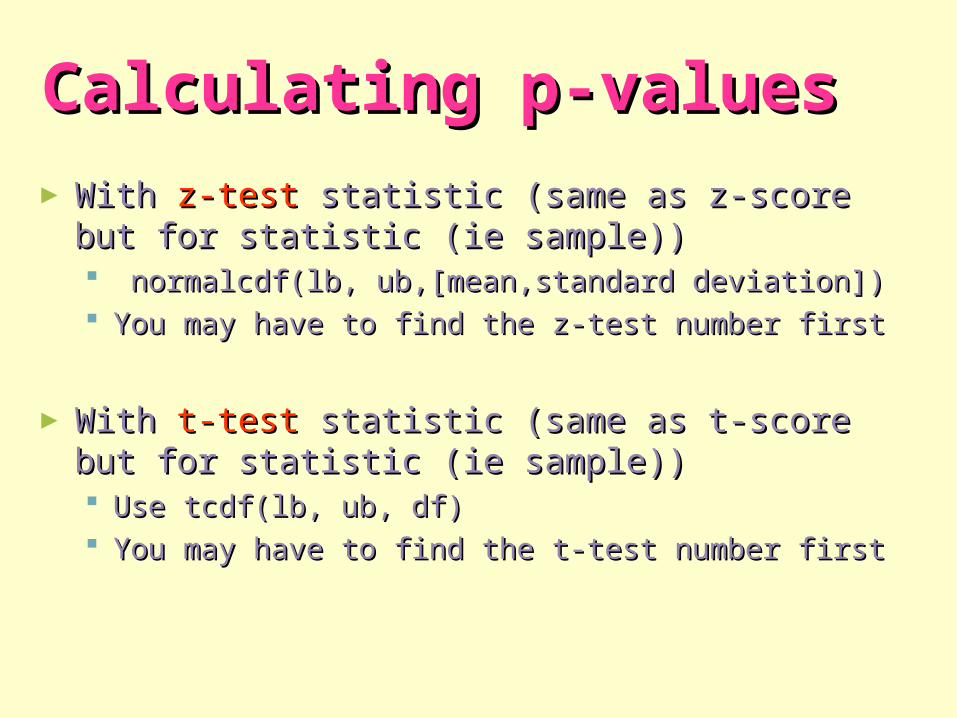
Calculating p-valuesCalculating p-values►With With z-testz-test statistic (same as z-score but for statistic (same as z-score but for
statistic (ie sample))statistic (ie sample)) normalcdf(lb, ub,[mean,standard deviation])normalcdf(lb, ub,[mean,standard deviation]) You may have to find the z-test number firstYou may have to find the z-test number first
►With With t-testt-test statistic (same as t-score but for statistic (same as t-score but for statistic (ie sample))statistic (ie sample)) Use tcdf(lb, ub, df)Use tcdf(lb, ub, df) You may have to find the t-test number firstYou may have to find the t-test number first
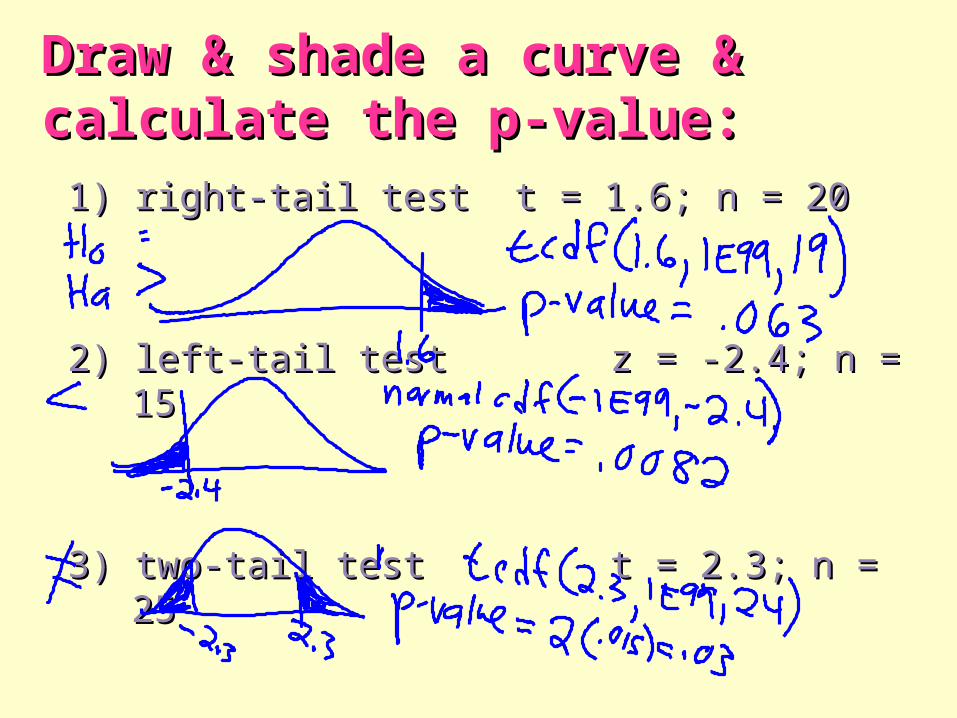
Draw & shade a curve & Draw & shade a curve & calculate the p-value:calculate the p-value:
1) right-tail test 1) right-tail test t = 1.6; n = 20t = 1.6; n = 20
2) left-tail test2) left-tail test z = -2.4; n = 15z = -2.4; n = 15
3) two-tail test3) two-tail test t = 2.3; n = 25t = 2.3; n = 25
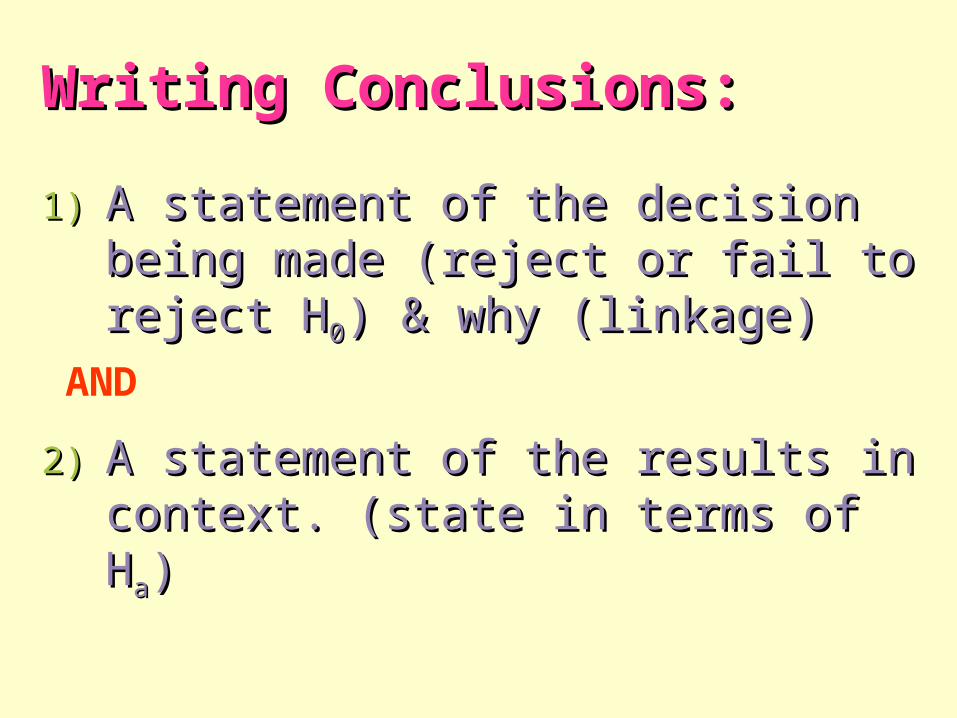
Writing Conclusions:Writing Conclusions:
1)1) A statement of the decision being A statement of the decision being made (reject or fail to reject Hmade (reject or fail to reject H00) & ) & why (linkage)why (linkage)
2)2) A statement of the results in A statement of the results in context. (state in terms of Hcontext. (state in terms of Haa))
AND
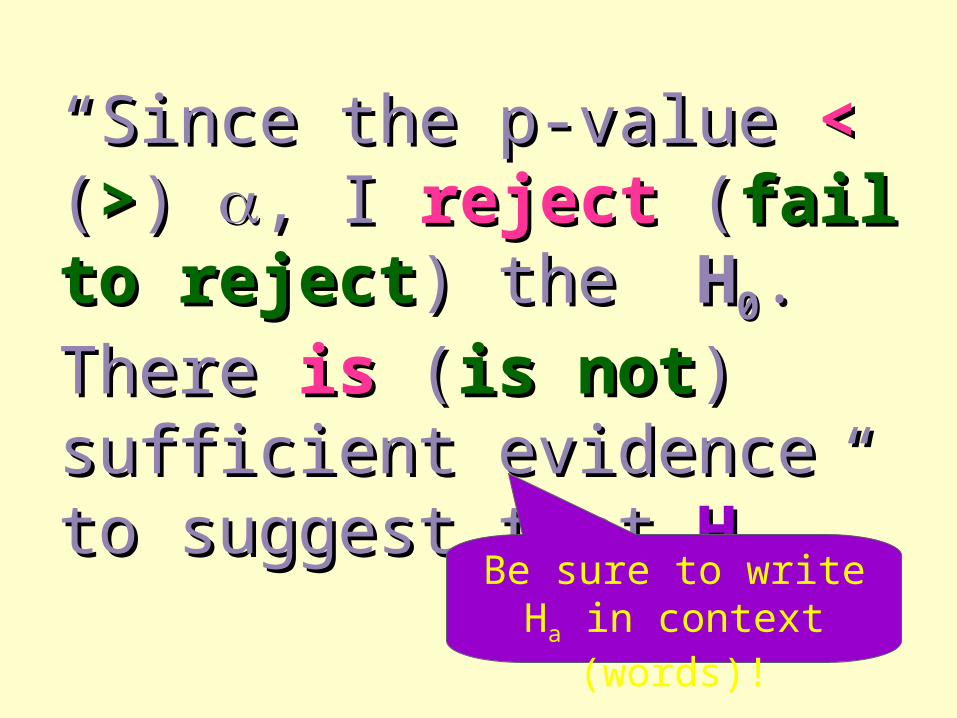
““Since the p-value Since the p-value << ( (>>) ) , I , I rejectreject ( (fail to fail to rejectreject) the ) the HH00. There . There isis ((is notis not) sufficient ) sufficient evidence to suggest that evidence to suggest that HHaa.”.” Be sure to write Ha
in context (words)!
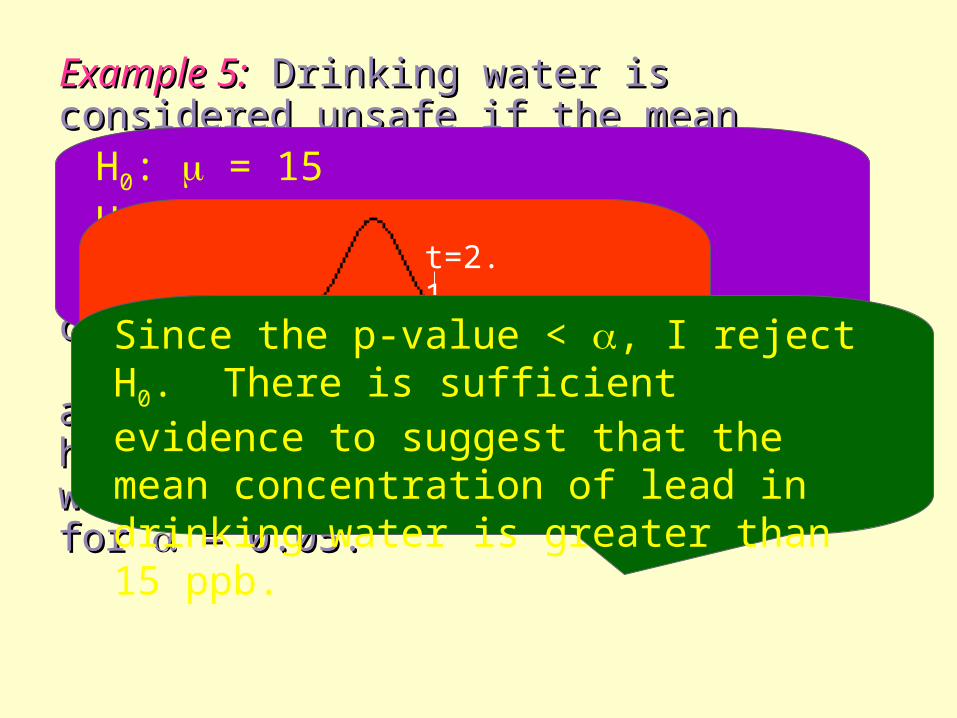
Example 5:Example 5: Drinking water is Drinking water is considered unsafe if the mean considered unsafe if the mean concentration of lead is 15 ppb (parts concentration of lead is 15 ppb (parts per billion) or greater. Suppose a per billion) or greater. Suppose a community randomly selects of 25 community randomly selects of 25 water samples and computes a t-test water samples and computes a t-test statistic of 2.1. Assume that lead statistic of 2.1. Assume that lead concentrations are normally concentrations are normally distributed. Write the hypotheses, distributed. Write the hypotheses, calculate the p-value & write the calculate the p-value & write the appropriate conclusion for appropriate conclusion for = 0.05. = 0.05.
H0: = 15Ha: > 15Where is the true mean concentration of lead in drinking waterP-value = tcdf(2.1,10^99,24) =.0232
t=2.1
Since the p-value < , I reject H0. There is sufficient evidence to suggest that the mean concentration of lead in drinking water is greater than 15 ppb.
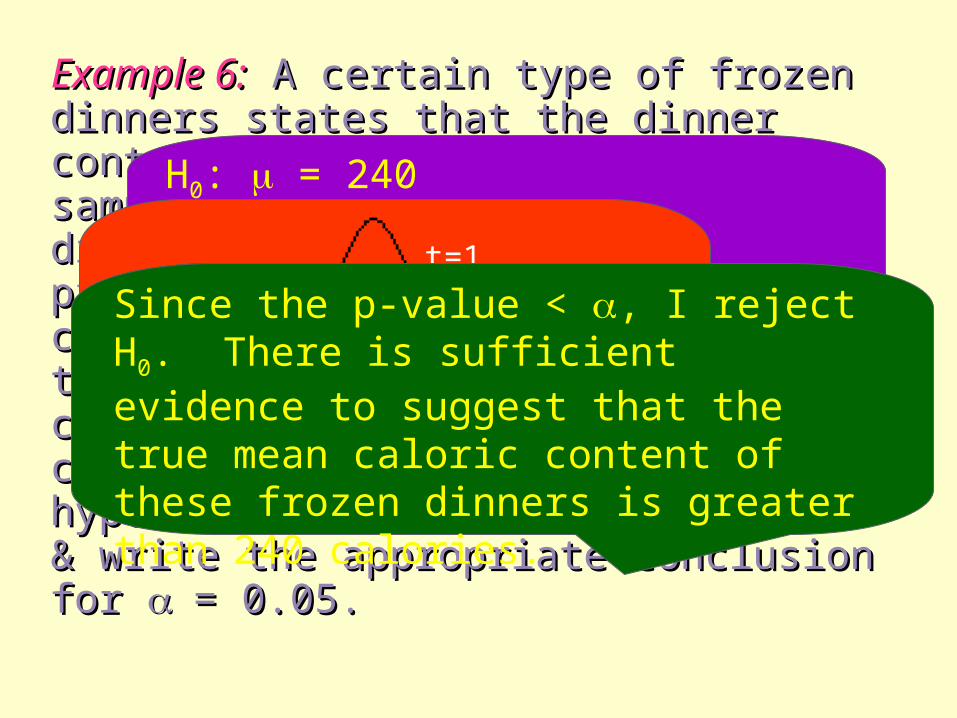
Example 6:Example 6: A certain type of frozen A certain type of frozen dinners states that the dinner dinners states that the dinner contains 240 calories. A random contains 240 calories. A random sample of 12 of these frozen dinners sample of 12 of these frozen dinners was selected from production to see was selected from production to see if the caloric content was greater if the caloric content was greater than stated on the box. The t-test than stated on the box. The t-test statistic was calculated to be 1.9.statistic was calculated to be 1.9. Assume calories vary normally.Assume calories vary normally. Write the hypotheses, calculate the Write the hypotheses, calculate the p-value & write the appropriate p-value & write the appropriate conclusion for conclusion for = 0.05.= 0.05.
H0: = 240Ha: > 240Where is the true mean caloric content of the frozen dinners
P-value = tcdf(1.9,10^99,11) =.0420
t=1.9
Since the p-value < , I reject H0. There is sufficient evidence to suggest that the true mean caloric content of these frozen dinners is greater than 240 calories.
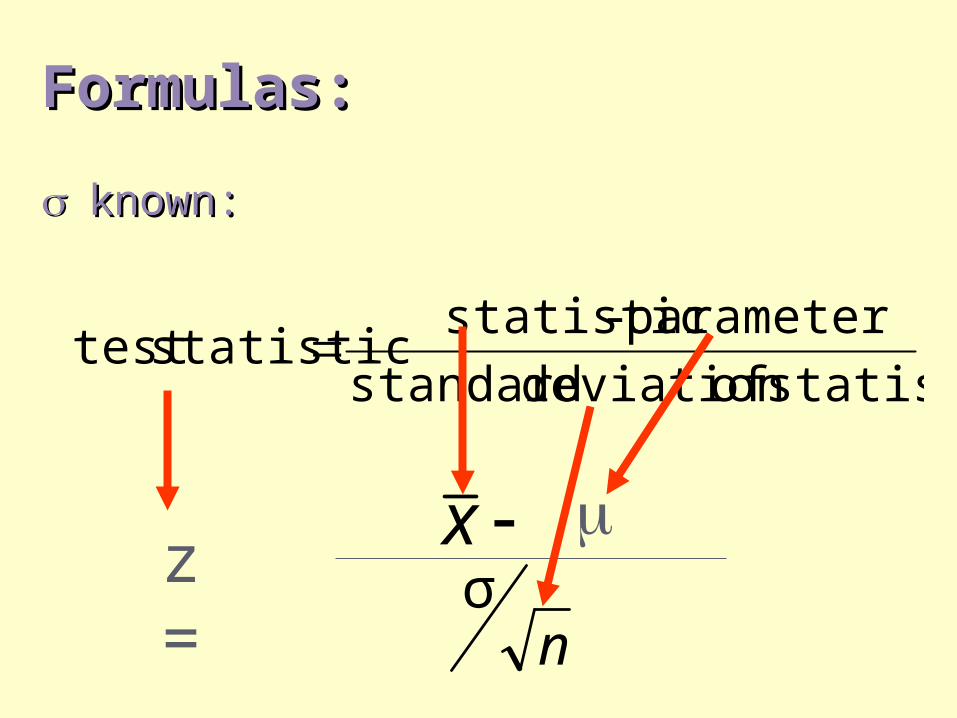
Formulas:Formulas:
known:known:
statistic ofdeviation standard
parameter - statisticstatistictest
z =x
nσ
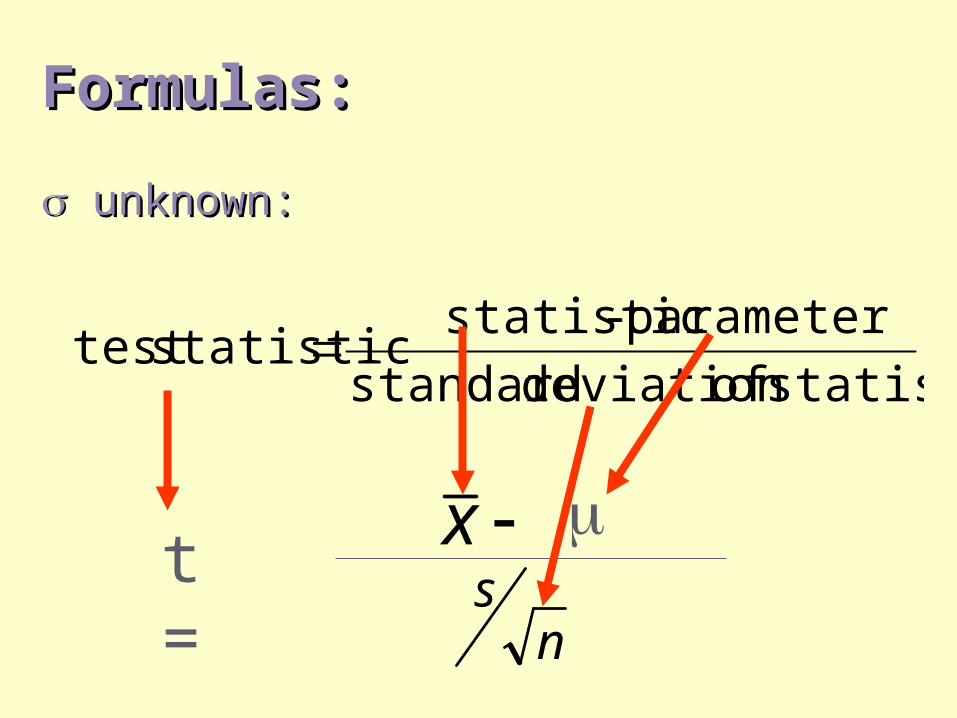
Formulas:Formulas:
unknown:unknown:
statistic ofdeviation standard
parameter - statisticstatistictest
t =x
ns
Example 7: The Fritzi Cheese Company buys milk from several suppliers as the essential raw material for its cheese. Fritzi suspects that some producers are adding water to their milk to increase their profits. Excess water can be detected by determining the freezing point of milk. The freezing temperature of natural milk varies normally, with a mean of -0.545 degrees and a standard deviation of 0.008. Added water raises the freezing temperature toward 0 degrees, the freezing point of water (in Celsius). The laboratory manager measures the freezing temperature of five randomly selected lots of milk from one producer with a mean of -0.538 degrees. Is there sufficient evidence to suggest that this producer is adding water to his milk?
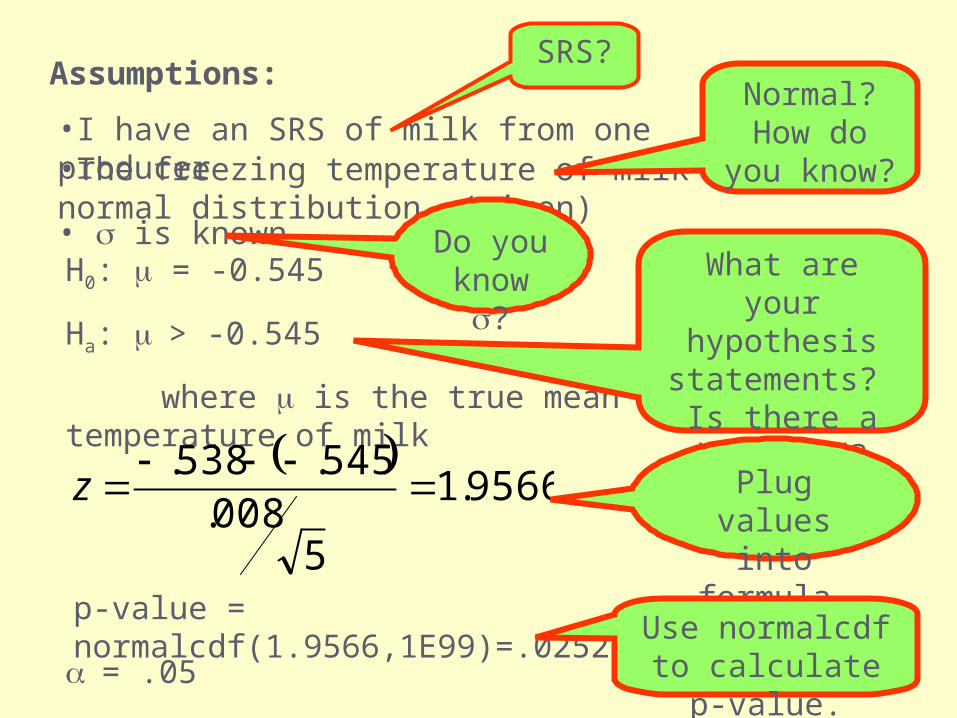
Assumptions:
•I have an SRS of milk from one producer•The freezing temperature of milk is a normal distribution. (given)• is known
SRS?Normal?
How do you know?
Do you know ?H0: = -0.545
Ha: > -0.545
where is the true mean freezing temperature of milk
What are your hypothesis
statements? Is there a key word?
9566.1
5008.
545.538.
z Plug values
into formula.
p-value = normalcdf(1.9566,1E99)=.0252Use normalcdf to calculate p-value.= .05
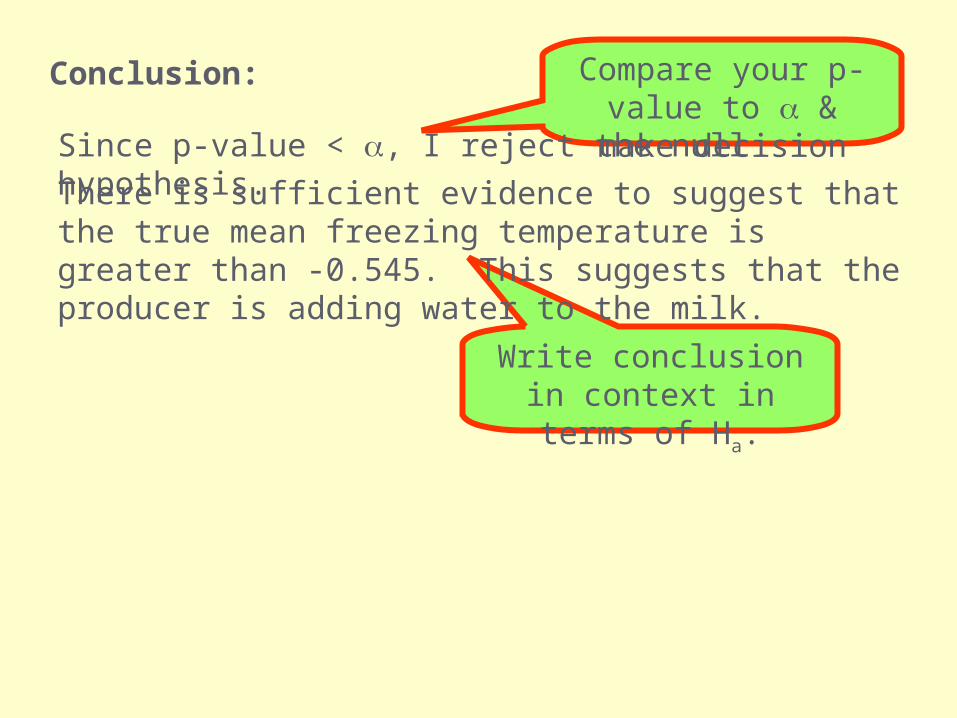
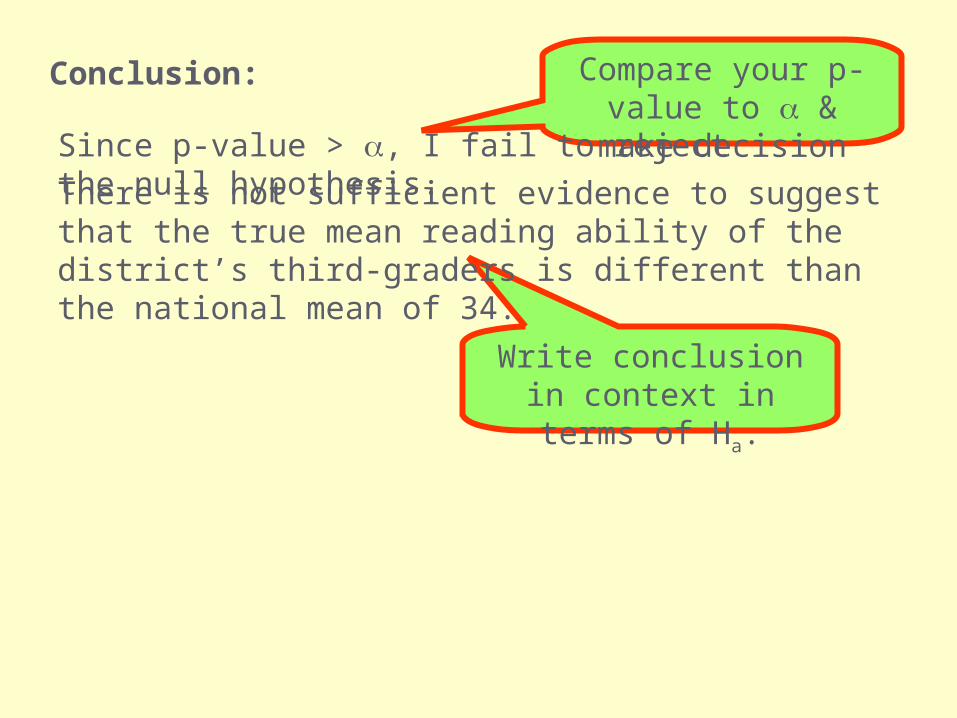
Conclusion: Compare your p-value to & make decision
Since p-value < , I reject the null hypothesis.
Write conclusion in context in terms of Ha.
There is sufficient evidence to suggest that the true mean freezing temperature is greater than -0.545. This suggests that the producer is adding water to the milk.
Example 8: The Degree of Reading Power (DRP) is a test of the reading ability of children. Here are DRP scores for a random sample of 44 third-grade students in a suburban district:
(data on note page)
At the = .1, is there sufficient evidence to suggest that this district’s third graders reading ability is different than the national mean of 34?
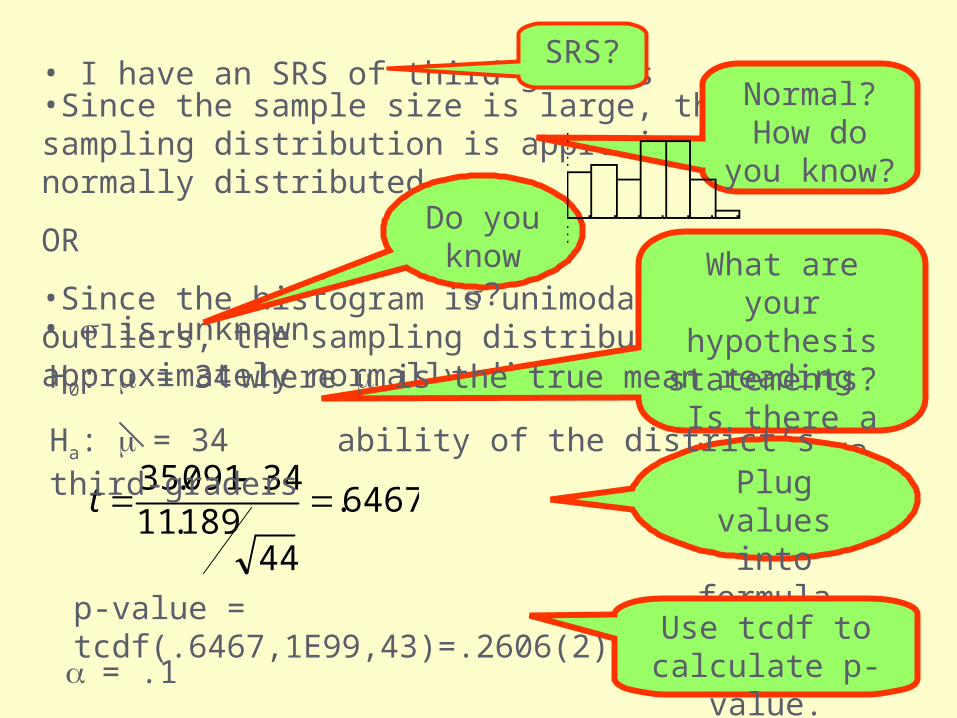
• I have an SRS of third-graders•Since the sample size is large, the sampling distribution is approximately normally distributed
OR
•Since the histogram is unimodal with no outliers, the sampling distribution is approximately normally distributed• is unknown
SRS?Normal?
How do you know?
Do you know ? What are your
hypothesis statements? Is
there a key word?
6467.
44189.11
34091.35
t Plug values
into formula.
p-value = tcdf(.6467,1E99,43)=.2606(2)=.5212Use tcdf to
calculate p-value.= .1
H0: = 34 where is the true mean reading
Ha: = 34 ability of the district’s third-graders
Conclusion: Compare your p-value to & make decision
Since p-value > , I fail to reject the null hypothesis.
Write conclusion in context in terms of Ha.
There is not sufficient evidence to suggest that the true mean reading ability of the district’s third-graders is different than the national mean of 34.
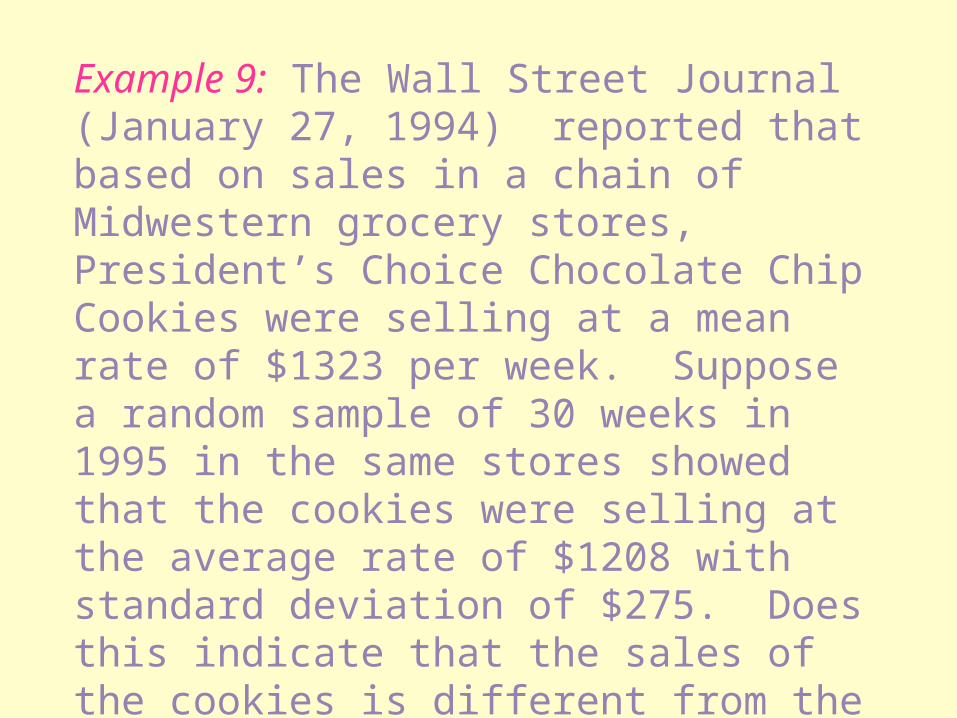
Example 9: The Wall Street Journal (January 27, 1994) reported that based on sales in a chain of Midwestern grocery stores, President’s Choice Chocolate Chip Cookies were selling at a mean rate of $1323 per week. Suppose a random sample of 30 weeks in 1995 in the same stores showed that the cookies were selling at the average rate of $1208 with standard deviation of $275. Does this indicate that the sales of the cookies is different from the earlier figure?
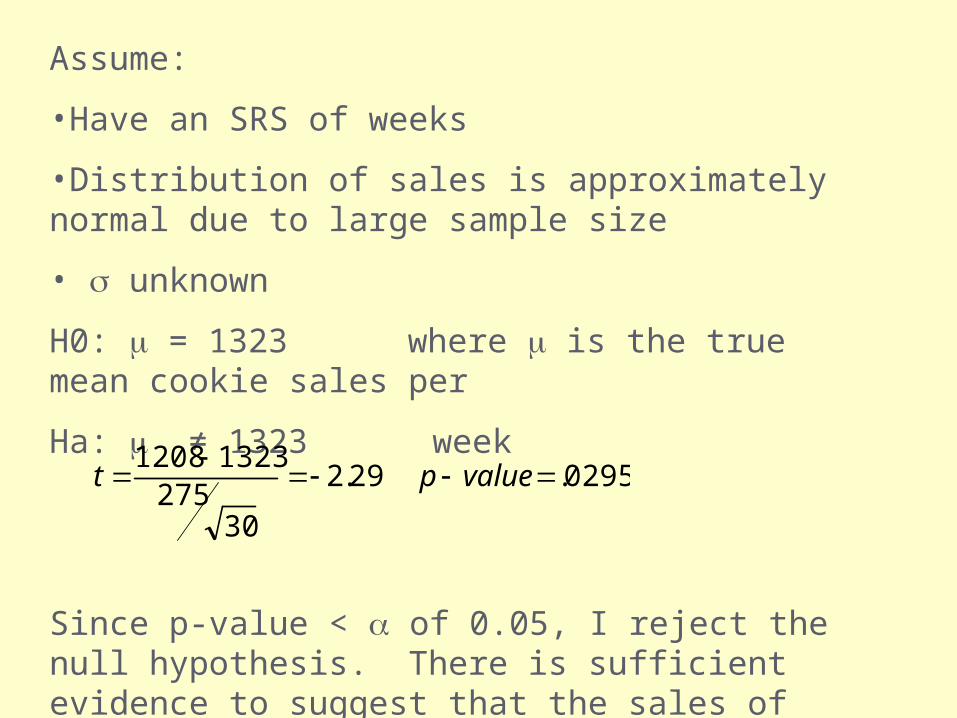
Assume:
•Have an SRS of weeks
•Distribution of sales is approximately normal due to large sample size
• unknown
H0: = 1323 where is the true mean cookie sales per
Ha: ≠ 1323 week
Since p-value < of 0.05, I reject the null hypothesis. There is sufficient evidence to suggest that the sales of cookies are different from the earlier figure.
0295.29.2
30275
13231208
valuept
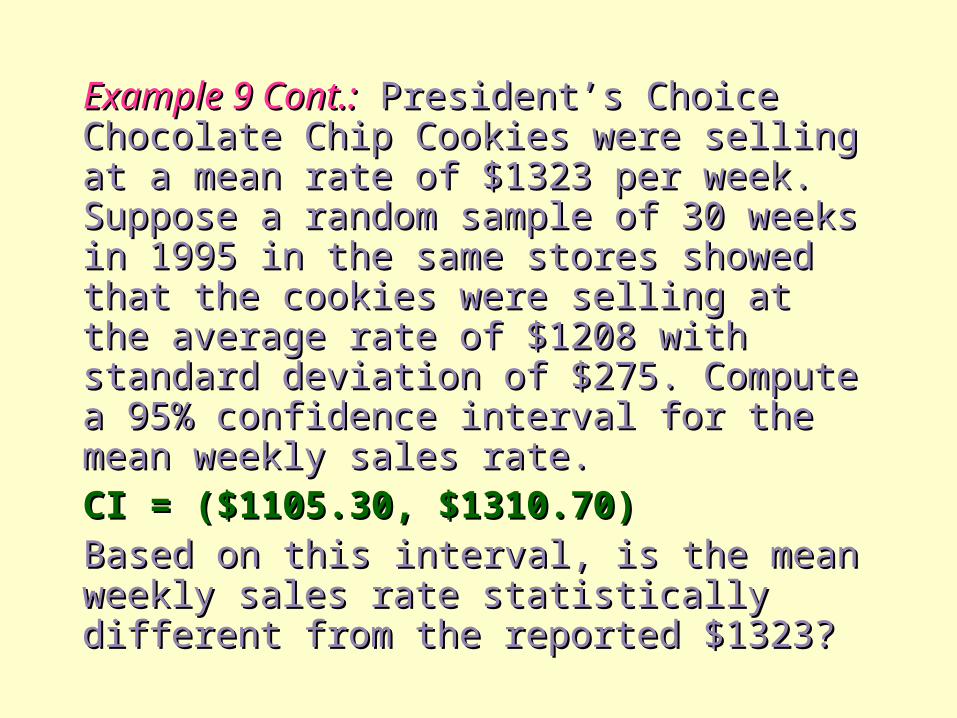
Example 9 Cont.:Example 9 Cont.: President’s Choice President’s Choice Chocolate Chip Cookies were selling at Chocolate Chip Cookies were selling at a mean rate of $1323 per week. a mean rate of $1323 per week. Suppose a random sample of 30 weeks Suppose a random sample of 30 weeks in 1995 in the same stores showed that in 1995 in the same stores showed that the cookies were selling at the average the cookies were selling at the average rate of $1208 with standard deviation rate of $1208 with standard deviation of $275. Compute a 95% confidence of $275. Compute a 95% confidence interval for the mean weekly sales rate.interval for the mean weekly sales rate.CI = ($1105.30, $1310.70)CI = ($1105.30, $1310.70)Based on this interval, is the mean Based on this interval, is the mean weekly sales rate statistically different weekly sales rate statistically different from the reported $1323?from the reported $1323?
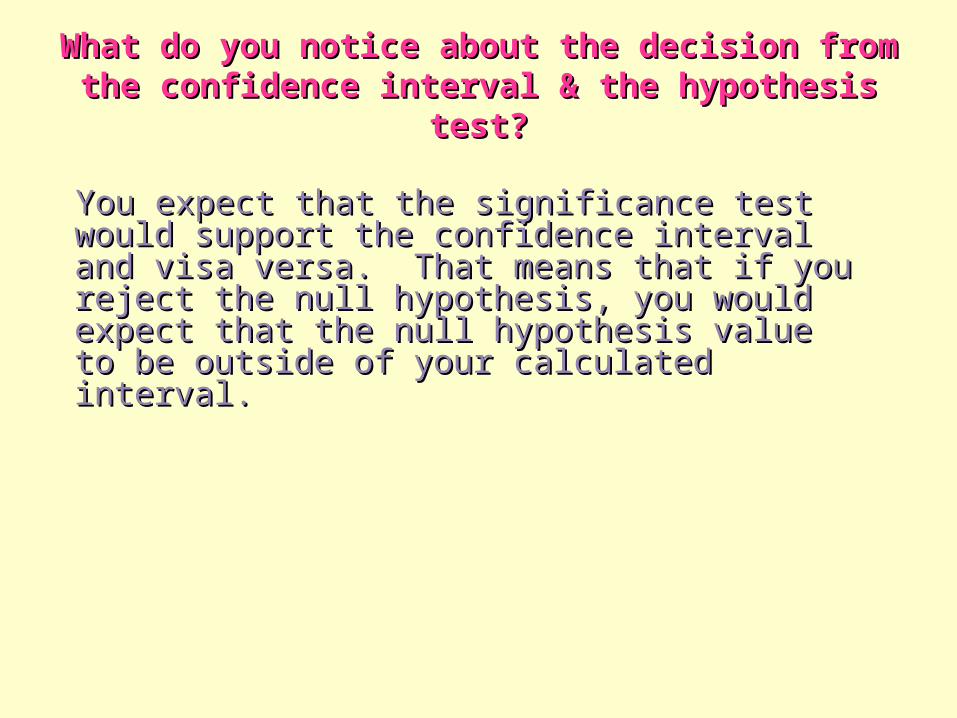
What do you notice about the decision from What do you notice about the decision from the confidence interval & the hypothesis test?the confidence interval & the hypothesis test?
You expect that the significance test would You expect that the significance test would support the confidence interval and visa versa. support the confidence interval and visa versa. That means that if you reject the null That means that if you reject the null hypothesis, you would expect that the null hypothesis, you would expect that the null hypothesis value to be outside of your hypothesis value to be outside of your calculated interval.calculated interval.
Matched Matched Pairs TestPairs TestA special type of t-A special type of t-
inferenceinference
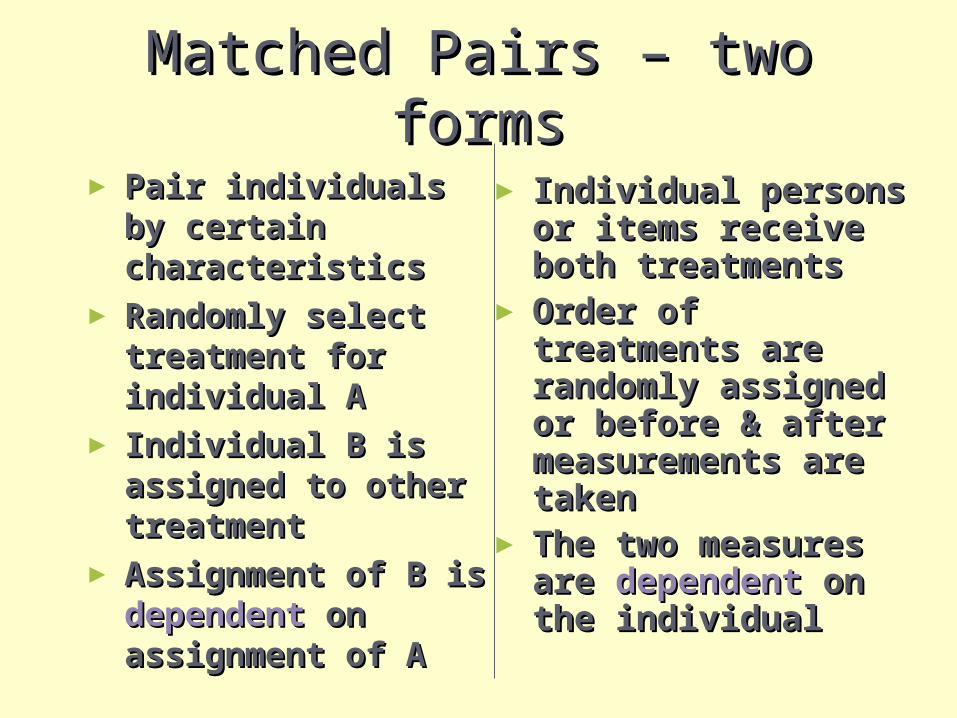
Matched Pairs – two formsMatched Pairs – two forms
► Pair individuals by Pair individuals by certain certain characteristicscharacteristics
► Randomly select Randomly select treatment for treatment for individual Aindividual A
► Individual B is Individual B is assigned to other assigned to other treatmenttreatment
► Assignment of B is Assignment of B is dependentdependent on on assignment of Aassignment of A
► Individual persons or Individual persons or items receive both items receive both treatmentstreatments
► Order of treatments Order of treatments are randomly are randomly assigned or before & assigned or before & after measurements after measurements are takenare taken
► The two measures are The two measures are dependentdependent on the on the individualindividual
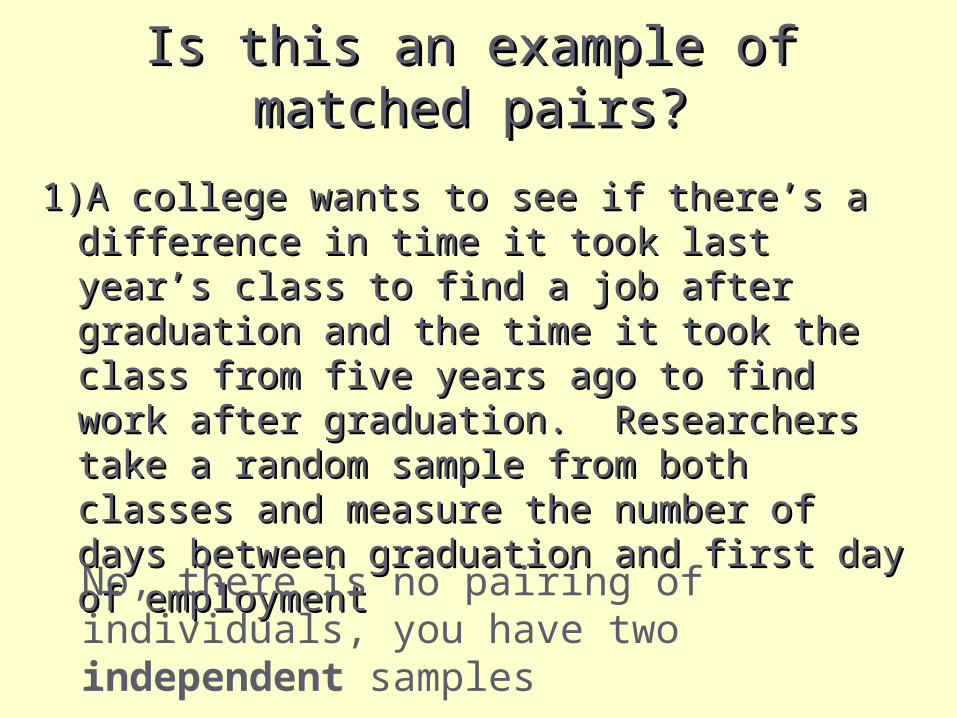
Is this an example of matched Is this an example of matched pairs?pairs?
1)A college wants to see if there’s a difference 1)A college wants to see if there’s a difference in time it took last year’s class to find a job in time it took last year’s class to find a job after graduation and the time it took the after graduation and the time it took the class from five years ago to find work after class from five years ago to find work after graduation. Researchers take a random graduation. Researchers take a random sample from both classes and measure the sample from both classes and measure the number of days between graduation and number of days between graduation and first day of employmentfirst day of employment
No, there is no pairing of individuals, you have two independent samples
Is this an example of matched Is this an example of matched pairs?pairs?
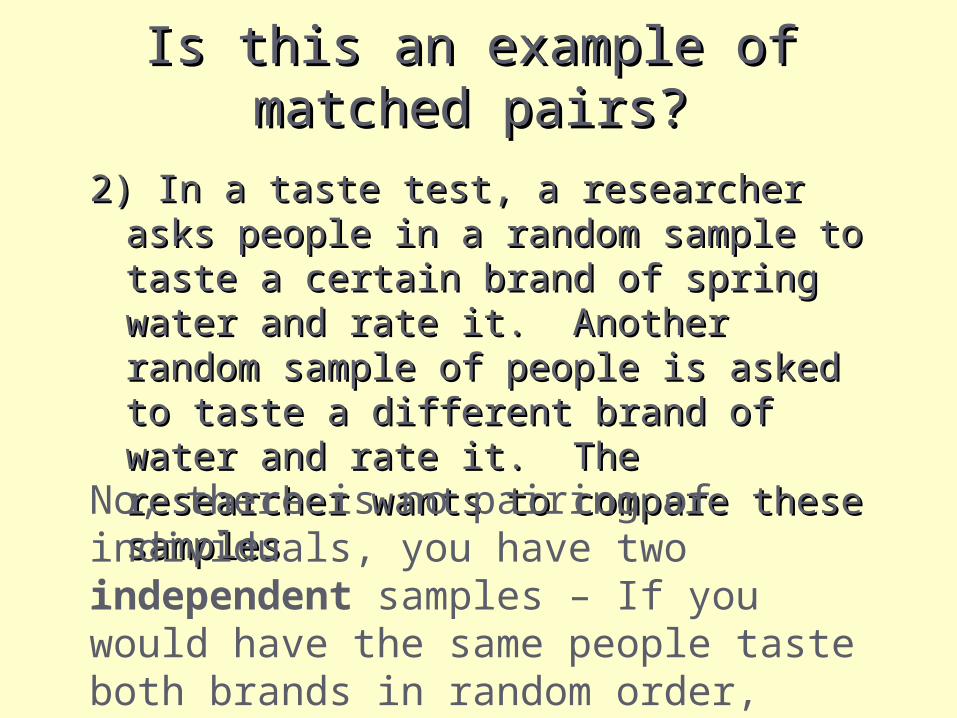
2) In a taste test, a researcher asks 2) In a taste test, a researcher asks people in a random sample to taste a people in a random sample to taste a certain brand of spring water and rate certain brand of spring water and rate it. Another random sample of people is it. Another random sample of people is asked to taste a different brand of water asked to taste a different brand of water and rate it. The researcher wants to and rate it. The researcher wants to compare these samplescompare these samples
No, there is no pairing of individuals, you have two independent samples – If you would have the same people taste both brands in random order, then it would bean example of matched pairs.
Is this an example of matched Is this an example of matched pairs?pairs?
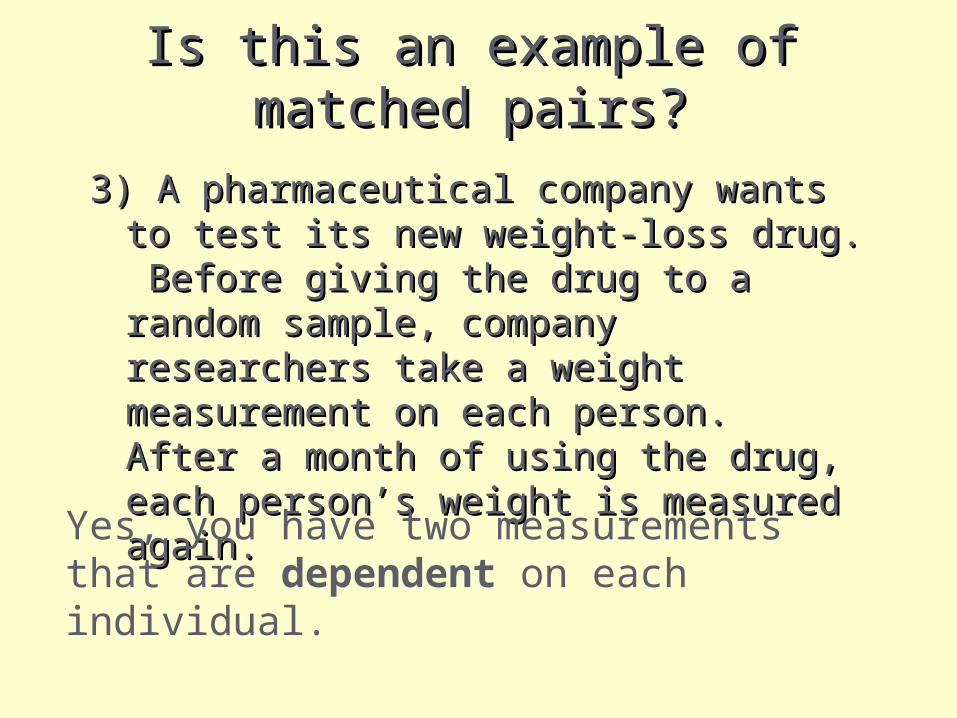
3) A pharmaceutical company wants to 3) A pharmaceutical company wants to test its new weight-loss drug. Before test its new weight-loss drug. Before giving the drug to a random sample, giving the drug to a random sample, company researchers take a weight company researchers take a weight measurement on each person. After a measurement on each person. After a month of using the drug, each person’s month of using the drug, each person’s weight is measured again.weight is measured again.
Yes, you have two measurements that are dependent on each individual.
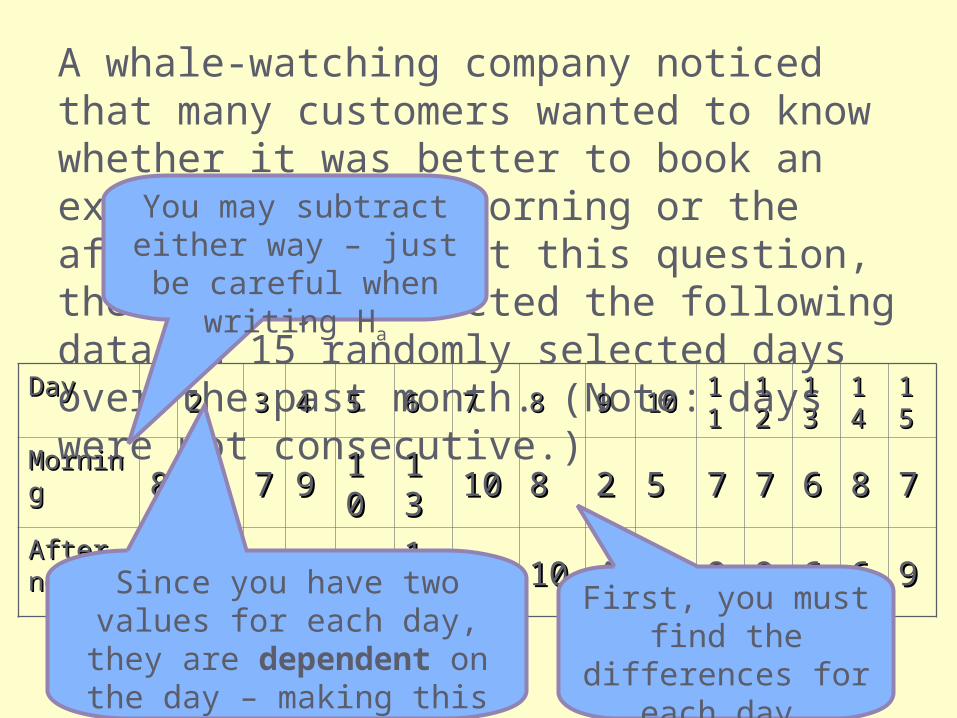
A whale-watching company noticed that many customers wanted to know whether it was better to book an excursion in the morning or the afternoon. To test this question, the company collected the following data on 15 randomly selected days over the past month. (Note: days were not consecutive.)
DayDay11 22 33 44 55 66 77 88 99 1010 11
111122
1133
1144
1155
MorninMorningg 88 99 77 99
1100
1133
1010 88 22 55 77 77 66 88 77
After-After-noonnoon 88 1010 99 88 99
1111
88 1010 44 77 88 99 66 66 99First, you must find the differences for
each day.
Since you have two values for each day, they are dependent on
the day – making this data matched pairs
You may subtract either way – just be careful
when writing Ha
DayDay11 22 33 44 55 66 77 88 99 1010 11
111122
1133
1144
1155
MorninMorningg 88 99 77 99
1100
1133
1010 88 22 55 77 77 66 88 77
After-After-noonnoon 88 1010 99 88 99
1111
88 1010 44 77 88 99 66 66 99
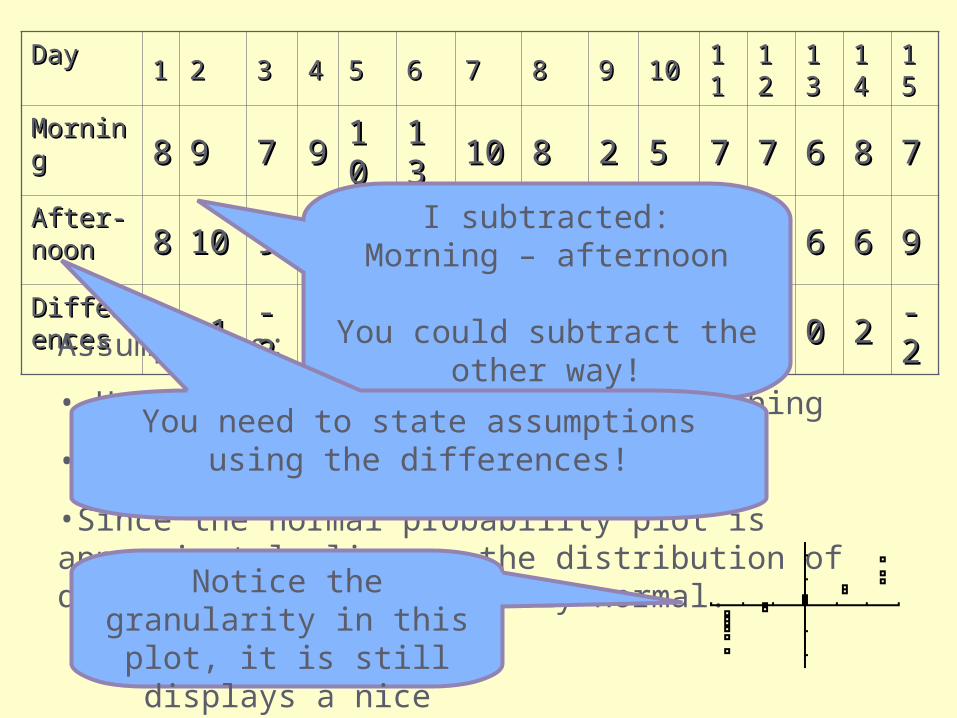
DiffereDifferencesnces 00 -1-1
--22
11 11 22 22 -2-2--22
-2-2--11
--22
00 22--22Assumptions:
• Have an SRS of days for whale-watching
• unknown
•Since the normal probability plot is approximately linear, the distribution of difference is approximately normal.
I subtracted:Morning – afternoon
You could subtract the other way!
You need to state assumptions using the differences!
Notice the granularity in this plot, it is still displays a nice
linear relationship!
DiffereDifferencesnces 00 -1-1
--22
11 11 22 22 -2-2--22
-2-2--11
--22
00 22--22
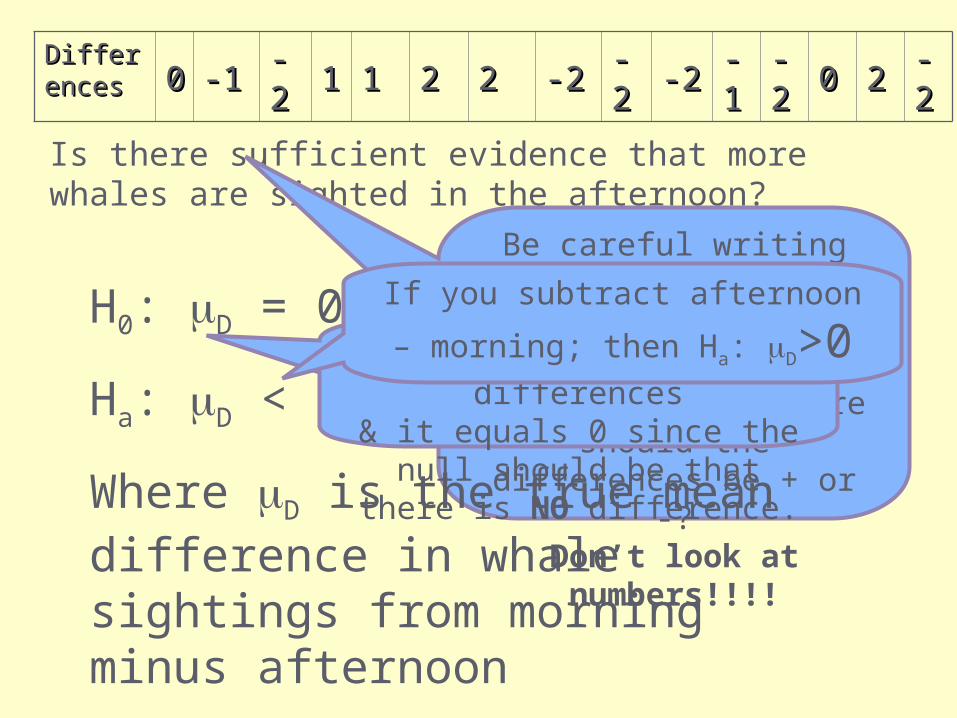
Is there sufficient evidence that more whales are sighted in the afternoon?
Be careful writing your Ha!Think about how you
subtracted: M-AIf afternoon is more should the
differences be + or -?Don’t look at numbers!!!!
H0: D = 0
Ha: D < 0
Where D is the true mean difference in whale sightings from morning minus afternoon
Notice we used D for differences& it equals 0 since the null should
be that there is NO difference.
If you subtract afternoon – morning;
then Ha: D>0
DiffereDifferencesnces 00 -1-1
--22
11 11 22 22 -2-2--22
-2-2--11
--22
00 22--22
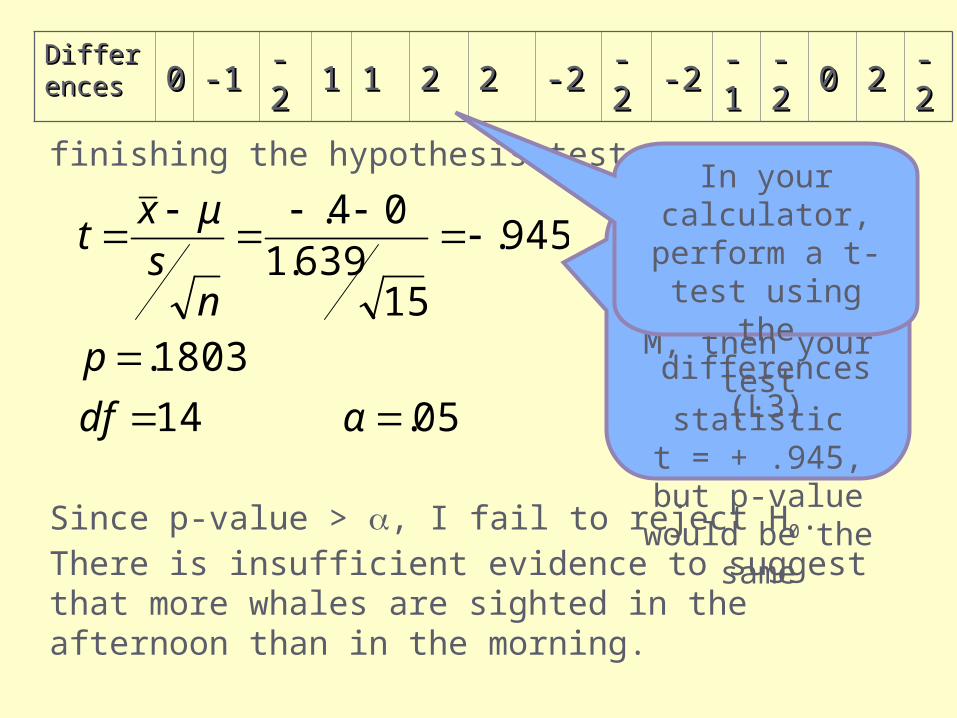
finishing the hypothesis test:
Since p-value > , I fail to reject H0. There is insufficient evidence to suggest that more whales are sighted in the afternoon than in the morning.
05.14
1803.
945.
15639.1
04.
αdf
pn
sμx
t Notice that if you subtracted A-M,
then your test statistic
t = + .945, but p-value would be the
same
In your calculator, perform a t-test
using the differences (L3)


![[a] SCHWAB 2011 - Researchers Should Make Thoughtful Assessments Instead of Null-Hypothesis Significance Tests](https://static.fdocuments.us/doc/165x107/577d25e31a28ab4e1e9fce86/a-schwab-2011-researchers-should-make-thoughtful-assessments-instead-of.jpg)