Hypothesis Testing: Two Means, Paired Data, Two …myweb.astate.edu/sbounds/Statistics_AP/3 Week...
42
Chapter 10 Hypothesis Testing: Two Means, Paired Data, Two Proportions 10.1 Hypothesis Testing: Two Population Means and Two Population Proportions 1 10.1.1 Student Learning Objectives By the end of this chapter, the student should be able to: • Classify hypothesis tests by type. • Conduct and interpret hypothesis tests for two population means, population standard deviations known. • Conduct and interpret hypothesis tests for two population means, population standard deviations unknown. • Conduct and interpret hypothesis tests for two population proportions. • Conduct and interpret hypothesis tests for matched or paired samples. 10.1.2 Introduction Studies often compare two groups. For example, researchers are interested in the effect aspirin has in preventing heart attacks. Over the last few years, newspapers and magazines have reported about various aspirin studies involving two groups. Typically, one group is given aspirin and the other group is given a placebo. Then, the heart attack rate is studied over several years. There are other situations that deal with the comparison of two groups. For example, studies compare var- ious diet and exercise programs. Politicians compare the proportion of individuals from different income brackets who might vote for them. Students are interested in whether SAT or GRE preparatory courses really help raise their scores. In the previous chapter, you learned to conduct hypothesis tests on single means and single proportions. You will expand upon that in this chapter. You will compare two averages or two proportions to each other. The general procedure is still the same, just expanded. 1 This content is available online at <http://cnx.org/content/m17029/1.6/>. 387
Transcript of Hypothesis Testing: Two Means, Paired Data, Two …myweb.astate.edu/sbounds/Statistics_AP/3 Week...
Chapter 10
Hypothesis Testing: Two Means, PairedData, Two Proportions
10.1 Hypothesis Testing: Two Population Means and Two PopulationProportions1
10.1.1 Student Learning Objectives
By the end of this chapter, the student should be able to:
• Classify hypothesis tests by type.• Conduct and interpret hypothesis tests for two population means, population standard deviations
known.• Conduct and interpret hypothesis tests for two population means, population standard deviations
unknown.• Conduct and interpret hypothesis tests for two population proportions.• Conduct and interpret hypothesis tests for matched or paired samples.
10.1.2 Introduction
Studies often compare two groups. For example, researchers are interested in the effect aspirin has inpreventing heart attacks. Over the last few years, newspapers and magazines have reported about variousaspirin studies involving two groups. Typically, one group is given aspirin and the other group is given aplacebo. Then, the heart attack rate is studied over several years.
There are other situations that deal with the comparison of two groups. For example, studies compare var-ious diet and exercise programs. Politicians compare the proportion of individuals from different incomebrackets who might vote for them. Students are interested in whether SAT or GRE preparatory coursesreally help raise their scores.
In the previous chapter, you learned to conduct hypothesis tests on single means and single proportions.You will expand upon that in this chapter. You will compare two averages or two proportions to each other.The general procedure is still the same, just expanded.
1This content is available online at <http://cnx.org/content/m17029/1.6/>.
387
388 CHAPTER 10. HYPOTHESIS TESTING: TWO MEANS, PAIRED DATA, TWOPROPORTIONS
To compare two averages or two proportions, you work with two groups. The groups are classified eitheras independent or matched pairs. Independent groups mean that the two samples taken are independent,that is, sample values selected from one population are not related in any way to sample values selectedfrom the other population. Matched pairs consist of two samples that are dependent. The parameter testedusing matched pairs is the population mean. The parameters tested using independent groups are eitherpopulation means or population proportions.
NOTE: This chapter relies on either a calculator or a computer to calculate the degrees of freedom,the test statistics, and p-values. TI-83+ and TI-84 instructions are included as well as the the teststatistic formulas. Because of technology, we do not need to separate two population means,independent groups, population variances unknown into large and small sample sizes.
This chapter deals with the following hypothesis tests:Independent groups (samples are independent)
• Test of two population means.• Test of two population proportions.
Matched or paired samples (samples are dependent)
• Becomes a test of one population mean.
10.2 Comparing Two Independent Population Means with UnknownPopulation Standard Deviations2
1. The two independent samples are simple random samples from two distinct populations.2. Both populations are normally distributed with the population means and standard deviations un-
known unless the sample sizes are greater than 30. In that case, the populations need not be normallydistributed.
The comparison of two population means is very common. A difference between the two samples dependson both the means and the standard deviations. Very different means can occur by chance if there is greatvariation among the individual samples. In order to account for the variation, we take the difference ofthe sample means, X1 - X2 , and divide by the standard error (shown below) in order to standardize thedifference. The result is a t-score test statistic (shown below).
Because we do not know the population standard deviations, we estimate them using the two samplestandard deviations from our independent samples. For the hypothesis test, we calculate the estimatedstandard deviation, or standard error, of the difference in sample means, X1 - X2.The standard error is: √
(S1)2
n1+
(S2)2
n2(10.1)
The test statistic (t-score) is calculated as follows:T-score
(x1 − x2)− (µ1 − µ2)√(S1)
2
n1+ (S2)
2
n2
(10.2)
where:2This content is available online at <http://cnx.org/content/m17025/1.13/>.
389
• s1 and s2, the sample standard deviations, are estimates of σ1 and σ2, respectively.• σ1 and σ2 are the unknown population standard deviations.• x1 and x2 are the sample means. µ1 and µ2 are the population means.
The degrees of freedom (df) is a somewhat complicated calculation. However, a computer or calculator cal-culates it easily. The dfs are not always a whole number. The test statistic calculated above is approximatedby the Student-t distribution with dfs as follows:Degrees of freedom
d f =
[(s1)
2
n1+ (s2)
2
n2
]2
1n1−1 ·
[(s1)
2
n1
]2+ 1
n2−1 ·[
(s2)2
n2
]2 (10.3)
When both sample sizes n1 and n2 are five or larger, the Student-t approximation is very good. Notice thatthe sample variances s1
2 and s22 are not pooled. (If the question comes up, do not pool the variances.)
NOTE: It is not necessary to compute this by hand. A calculator or computer easily computes it.
Example 10.1: Independent groupsThe average amount of time boys and girls ages 7 through 11 spend playing sports each day is
believed to be the same. An experiment is done, data is collected, resulting in the table below:
Sample Size Average Number ofHours Playing Sports
Per Day
Sample StandardDeviation
Girls 9 2 hours√
0.75
Boys 16 3.2 hours 1.00
Table 10.1
ProblemIs there a difference in the average amount of time boys and girls ages 7 through 11 play sports
each day? Test at the 5% level of significance.
SolutionThe population standard deviations are not known. Let g be the subscript for girls and b be the
subscript for boys. Then, µg is the population mean for girls and µb is the population mean forboys. This is a test of two independent groups, two population means.
Random variable: Xg − Xb = difference in the average amount of time girls and boys play sportseach day.
Ho: µg = µb(µg − µb = 0
)Ha: µg 6= µb
(µg − µb 6= 0
)The words "the same" tell you Ho has an "=". Since there are no other words to indicate Ha, thenassume "is different." This is a two-tailed test.
Distribution for the test: Use td f where d f is calculated using the d f formula for independentgroups, two population means. Using a calculator, d f is approximately 18.8462. Do not pool thevariances.
390 CHAPTER 10. HYPOTHESIS TESTING: TWO MEANS, PAIRED DATA, TWOPROPORTIONS
Calculate the p-value using a Student-t distribution: p-value = 0.0054
Graph:
Figure 10.1
sg =√
0.75
sb = 1
So, xg − xb = 2− 3.2 = −1.2
Half the p-value is below -1.2 and half is above 1.2.
Make a decision: Since α > p-value, reject Ho.
This means you reject µg = µb. The means are different.
Conclusion: At the 5% level of significance, the sample data show there is sufficient evidence toconclude that the average number of hours that girls and boys aged 7 through 11 play sports perday is different.
NOTE: TI-83+ and TI-84: Press STAT. Arrow over to TESTS and press 4:2-SampTTest. Arrow overto Stats and press ENTER. Arrow down and enter 2 for the first sample mean,
√0.75 for Sx1, 9
for n1, 3.2 for the second sample mean, 1 for Sx2, and 16 for n2. Arrow down to µ1: and arrowto does not equal µ2. Press ENTER. Arrow down to Pooled: and No. Press ENTER. Arrow down toCalculate and press ENTER. The p-value is p = 0.0054, the dfs are approximately 18.8462, and thetest statistic is -3.14. Do the procedure again but instead of Calculate do Draw.
Example 10.2A study is done by a community group in two neighboring colleges to determine which one grad-uates students with more math classes. College A samples 11 graduates. Their average is 4 mathclasses with a standard deviation of 1.5 math classes. College B samples 9 graduates. Their aver-age is 3.5 math classes with a standard deviation of 1 math class. The community group believesthat a student who graduates from college A has taken more math classes, on the average. Test ata 1% significance level. Answer the following questions.
391
Problem 1 (Solution on p. 424.)Is this a test of two means or two proportions?
Problem 2 (Solution on p. 424.)Are the populations standard deviations known or unknown?
Problem 3 (Solution on p. 424.)Which distribution do you use to perform the test?
Problem 4 (Solution on p. 424.)What is the random variable?
Problem 5 (Solution on p. 424.)What are the null and alternate hypothesis?
Problem 6 (Solution on p. 424.)Is this test right, left, or two tailed?
Problem 7 (Solution on p. 424.)What is the p-value?
Problem 8 (Solution on p. 424.)Do you reject or not reject the null hypothesis?Conclusion:At the 1% level of significance, from the sample data, there is not sufficient evidence to concludethat a student who graduates from college A has taken more math classes, on the average, than astudent who graduates from college B.
10.3 Comparing Two Independent Population Means with Known Pop-ulation Standard Deviations3
Even though this situation is not likely (knowing the population standard deviations is not likely), thefollowing example illustrates hypothesis testing for independent means, known population standard de-viations. The distribution is Normal and is for the difference of sample means, X1 − X2. The normaldistribution has the following format:Normal distribution
X1 − X2 ∼ N
u1 − u2,
√(σ1)
2
n1+
(σ2)2
n2
(10.4)
The standard deviation is: √(σ1)
2
n1+
(σ2)2
n2(10.5)
The test statistic (z-score) is:
z =(x1 − x2)− (µ1 − µ2)√
(σ1)2
n1+ (σ2)
2
n2
(10.6)
3This content is available online at <http://cnx.org/content/m17042/1.8/>.
392 CHAPTER 10. HYPOTHESIS TESTING: TWO MEANS, PAIRED DATA, TWOPROPORTIONS
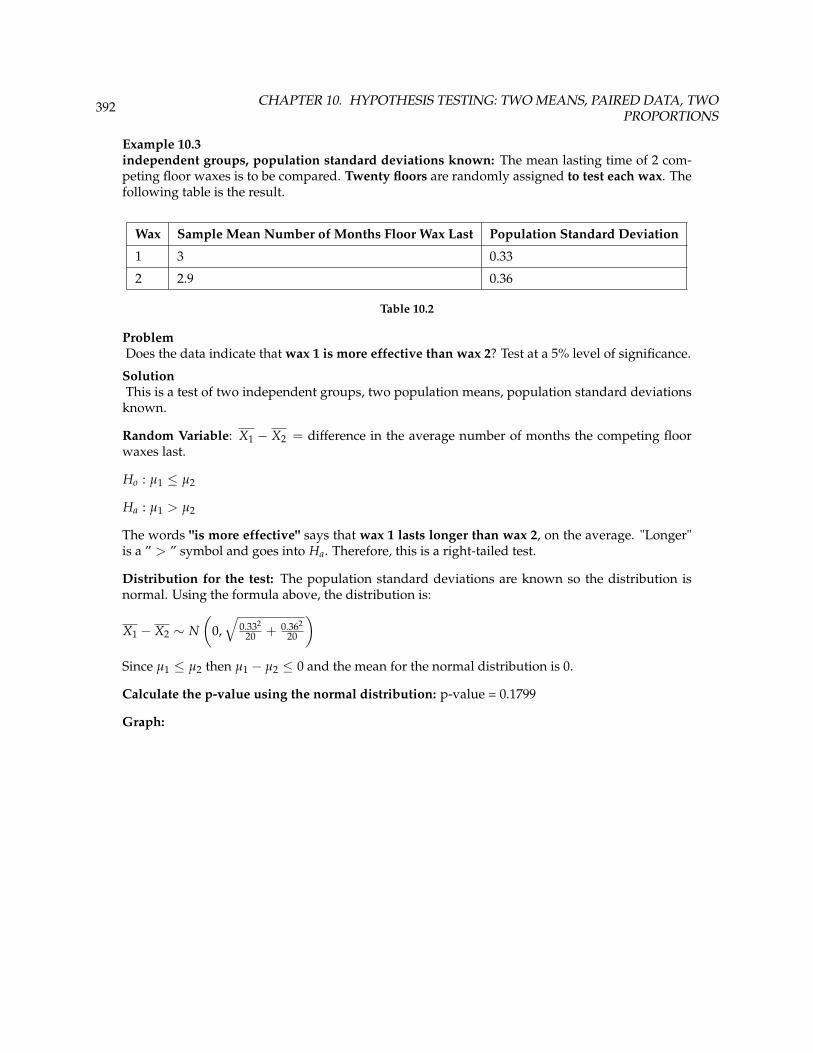
Example 10.3independent groups, population standard deviations known: The mean lasting time of 2 com-peting floor waxes is to be compared. Twenty floors are randomly assigned to test each wax. Thefollowing table is the result.
Wax Sample Mean Number of Months Floor Wax Last Population Standard Deviation
1 3 0.33
2 2.9 0.36
Table 10.2
ProblemDoes the data indicate that wax 1 is more effective than wax 2? Test at a 5% level of significance.
SolutionThis is a test of two independent groups, two population means, population standard deviations
known.
Random Variable: X1 − X2 = difference in the average number of months the competing floorwaxes last.
Ho : µ1 ≤ µ2
Ha : µ1 > µ2
The words "is more effective" says that wax 1 lasts longer than wax 2, on the average. "Longer"is a ” > ” symbol and goes into Ha. Therefore, this is a right-tailed test.
Distribution for the test: The population standard deviations are known so the distribution isnormal. Using the formula above, the distribution is:
X1 − X2 ∼ N(
0,√
0.332
20 + 0.362
20
)Since µ1 ≤ µ2 then µ1 − µ2 ≤ 0 and the mean for the normal distribution is 0.
Calculate the p-value using the normal distribution: p-value = 0.1799
Graph:
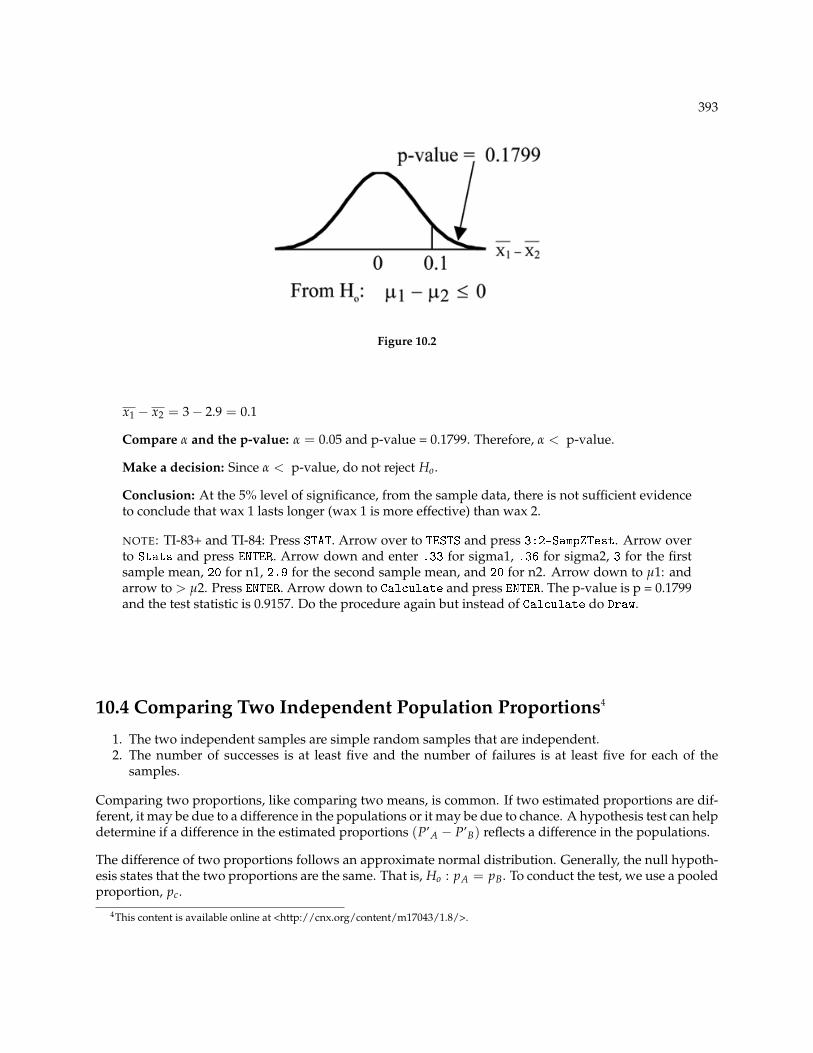
393
Figure 10.2
x1 − x2 = 3− 2.9 = 0.1
Compare α and the p-value: α = 0.05 and p-value = 0.1799. Therefore, α < p-value.
Make a decision: Since α < p-value, do not reject Ho.
Conclusion: At the 5% level of significance, from the sample data, there is not sufficient evidenceto conclude that wax 1 lasts longer (wax 1 is more effective) than wax 2.
NOTE: TI-83+ and TI-84: Press STAT. Arrow over to TESTS and press 3:2-SampZTest. Arrow overto Stats and press ENTER. Arrow down and enter .33 for sigma1, .36 for sigma2, 3 for the firstsample mean, 20 for n1, 2.9 for the second sample mean, and 20 for n2. Arrow down to µ1: andarrow to > µ2. Press ENTER. Arrow down to Calculate and press ENTER. The p-value is p = 0.1799and the test statistic is 0.9157. Do the procedure again but instead of Calculate do Draw.
10.4 Comparing Two Independent Population Proportions4
1. The two independent samples are simple random samples that are independent.2. The number of successes is at least five and the number of failures is at least five for each of the
samples.
Comparing two proportions, like comparing two means, is common. If two estimated proportions are dif-ferent, it may be due to a difference in the populations or it may be due to chance. A hypothesis test can helpdetermine if a difference in the estimated proportions (P’A − P’B) reflects a difference in the populations.
The difference of two proportions follows an approximate normal distribution. Generally, the null hypoth-esis states that the two proportions are the same. That is, Ho : pA = pB. To conduct the test, we use a pooledproportion, pc.
4This content is available online at <http://cnx.org/content/m17043/1.8/>.
394 CHAPTER 10. HYPOTHESIS TESTING: TWO MEANS, PAIRED DATA, TWOPROPORTIONS
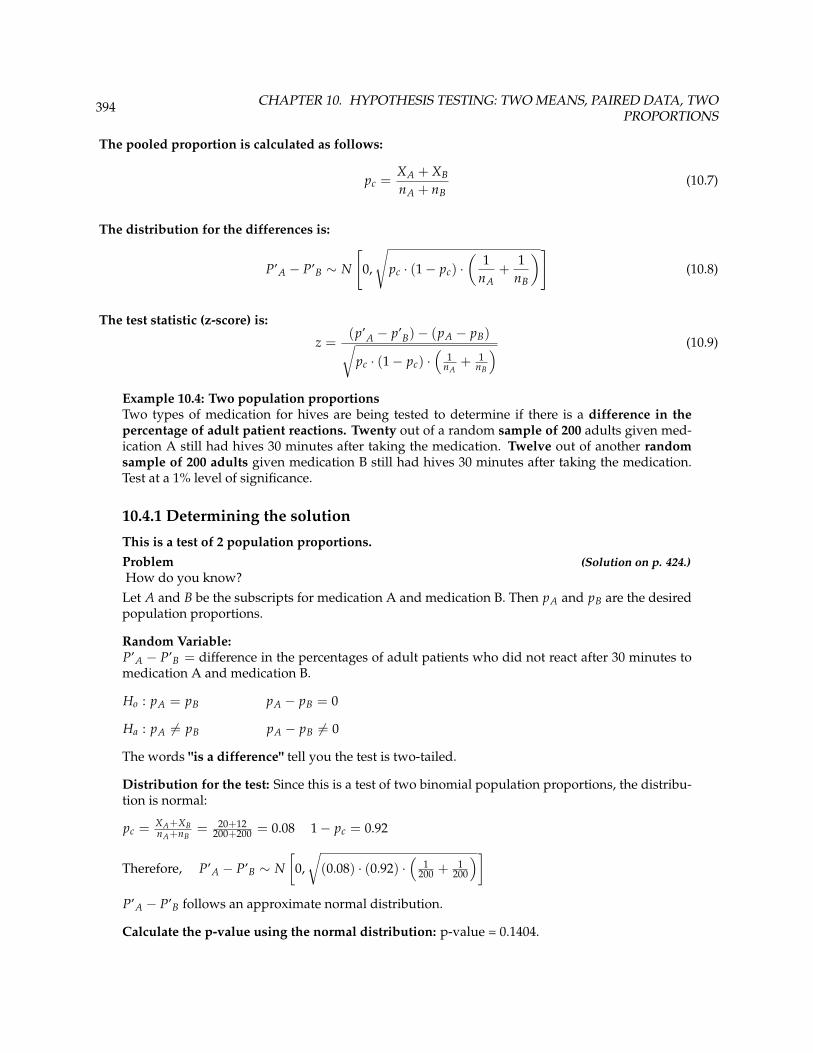
The pooled proportion is calculated as follows:
pc =XA + XBnA + nB
(10.7)
The distribution for the differences is:
P’A − P’B ∼ N
[0,
√pc · (1− pc) ·
(1
nA+
1nB
)](10.8)
The test statistic (z-score) is:
z =(p’A − p’B)− (pA − pB)√
pc · (1− pc) ·(
1nA
+ 1nB
) (10.9)
Example 10.4: Two population proportionsTwo types of medication for hives are being tested to determine if there is a difference in thepercentage of adult patient reactions. Twenty out of a random sample of 200 adults given med-ication A still had hives 30 minutes after taking the medication. Twelve out of another randomsample of 200 adults given medication B still had hives 30 minutes after taking the medication.Test at a 1% level of significance.
10.4.1 Determining the solution
This is a test of 2 population proportions.Problem (Solution on p. 424.)How do you know?
Let A and B be the subscripts for medication A and medication B. Then pA and pB are the desiredpopulation proportions.
Random Variable:P’A − P’B = difference in the percentages of adult patients who did not react after 30 minutes tomedication A and medication B.
Ho : pA = pB pA − pB = 0
Ha : pA 6= pB pA − pB 6= 0
The words "is a difference" tell you the test is two-tailed.
Distribution for the test: Since this is a test of two binomial population proportions, the distribu-tion is normal:
pc = XA+XBnA+nB
= 20+12200+200 = 0.08 1− pc = 0.92
Therefore, P’A − P’B ∼ N[
0,√
(0.08) · (0.92) ·(
1200 + 1
200
)]P’A − P’B follows an approximate normal distribution.
Calculate the p-value using the normal distribution: p-value = 0.1404.

395
Estimated proportion for group A: p’A = XAnA
= 20200 = 0.1
Estimated proportion for group B: p’B = XBnB
= 12200 = 0.06
Graph:
Figure 10.3
P’A − P’B = 0.1− 0.06 = 0.04.
Half the p-value is below -0.04 and half is above 0.04.
Compare α and the p-value: α = 0.01 and the p-value = 0.1404. α < p-value.
Make a decision: Since α < p-value, you cannot reject Ho.
Conclusion: At a 1% level of significance, from the sample data, there is not sufficient evidence toconclude that there is a difference in the percentages of adult patients who did not react after 30minutes to medication A and medication B.
TI-83+ and TI-84: Press STAT. Arrow over to TESTS and press 6:2-PropZTest. Arrow down andenter 20 for x1, 200 for n1, 12 for x2, and 200 for n2. Arrow down to p1: and arrow to does not
equal p2. Press ENTER. Arrow down to Calculate and press ENTER. The p-value is p = 0.1404and the test statistic is 1.47. Do the procedure again but instead of Calculate do Draw.
10.5 Matched or Paired Samples5
1. Simple random sampling is used.2. Sample sizes are often small.3. Two measurements (samples) are drawn from the same pair of individuals or objects.4. Differences are calculated from the matched or paired samples.5. The differences form the sample that is used for the hypothesis test.6. The matched pairs have differences that either come from a population that is normal or the number
of differences is greater than 30 or both.
5This content is available online at <http://cnx.org/content/m17033/1.11/>.
396 CHAPTER 10. HYPOTHESIS TESTING: TWO MEANS, PAIRED DATA, TWOPROPORTIONS
In a hypothesis test for matched or paired samples, subjects are matched in pairs and differences are cal-culated. The differences are the data. The population mean for the differences, µd, is then tested usinga Student-t test for a single population mean with n − 1 degrees of freedom where n is the number ofdifferences.The test statistic (t-score) is:
t =xd − µd(
sd√n
) (10.10)
Example 10.5: Matched or paired samplesA study was conducted to investigate the effectiveness of hypnotism in reducing pain. Results
for randomly selected subjects are shown in the table. The "before" value is matched to an "after"value.
Subject: A B C D E F G H
Before 6.6 6.5 9.0 10.3 11.3 8.1 6.3 11.6
After 6.8 2.5 7.4 8.5 8.1 6.1 3.4 2.0
Table 10.3
ProblemAre the sensory measurements, on average, lower after hypnotism? Test at a 5% significance level.
SolutionCorresponding "before" and "after" values form matched pairs.
After Data Before Data Difference
6.8 6.6 0.2
2.4 6.5 -4.1
7.4 9 -1.6
8.5 10.3 -1.8
8.1 11.3 -3.2
6.1 8.1 -2
3.4 6.3 -2.9
2 11.6 -9.6
Table 10.4
The data for the test are the differences: {0.2, -4.1, -1.6, -1.8, -3.2, -2, -2.9, -9.6}
The sample mean and sample standard deviation of the differences are: xd = −3.13 andsd = 2.91 Verify these values.
Let µd be the population mean for the differences. We use the subscript d to denote "differences."
Random Variable: Xd = the average difference of the sensory measurements
Ho : µd ≥ 0 (10.11)
397
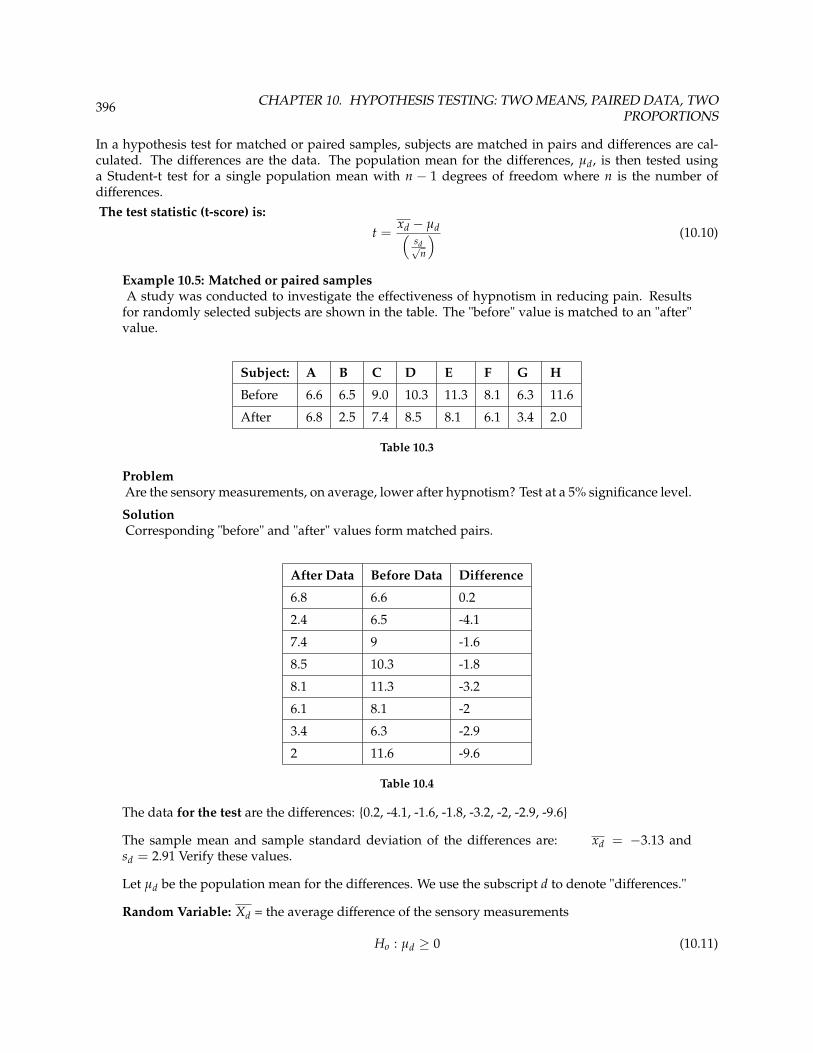
There is no improvement. (µdis the population mean of the differences.)
Ha : µd < 0 (10.12)
There is improvement. The score should be lower after hypnotism so the difference ought to benegative to indicate improvement.
Distribution for the test: The distribution is a student-t with d f = n − 1 = 8− 1 = 7. Use t7.(Notice that the test is for a single population mean.)
Calculate the p-value using the Student-t distribution: p-value = 0.0095
Graph:
Figure 10.4
Xd is the random variable for the differences.
The sample mean and sample standard deviation of the differences are:
xd = −3.13
sd = 2.91
Compare α and the p-value: α = 0.05 and p-value = 0.0095. α > p-value.
Make a decision: Since α > p-value, reject Ho.
This means that µd < 0 and there is improvement.
Conclusion: At a 5% level of significance, from the sample data, there is sufficient evidence to con-clude that the sensory measurements, on average, are lower after hypnotism. Hypnotism appearsto be effective in reducing pain.
NOTE: For the TI-83+ and TI-84 calculators, you can either calculate the differences ahead of time(after - before) and put the differences into a list or you can put the after data into a first list andthe before data into a second list. Then go to a third list and arrow up to the name. Enter 1st listname - 2nd list name. The calculator will do the subtraction and you will have the differences inthe third list.
398 CHAPTER 10. HYPOTHESIS TESTING: TWO MEANS, PAIRED DATA, TWOPROPORTIONS
NOTE: TI-83+ and TI-84: Use your list of differences as the data. Press STAT and arrow over toTESTS. Press 2:T-Test. Arrow over to Data and press ENTER. Arrow down and enter 0 for µ0, thename of the list where you put the data, and 1 for Freq:. Arrow down to µ: and arrow over to <µ0. Press ENTER. Arrow down to Calculate and press ENTER. The p-value is 0.0094 and the teststatistic is -3.04. Do these instructions again except arrow to Draw (instead of Calculate). PressENTER.
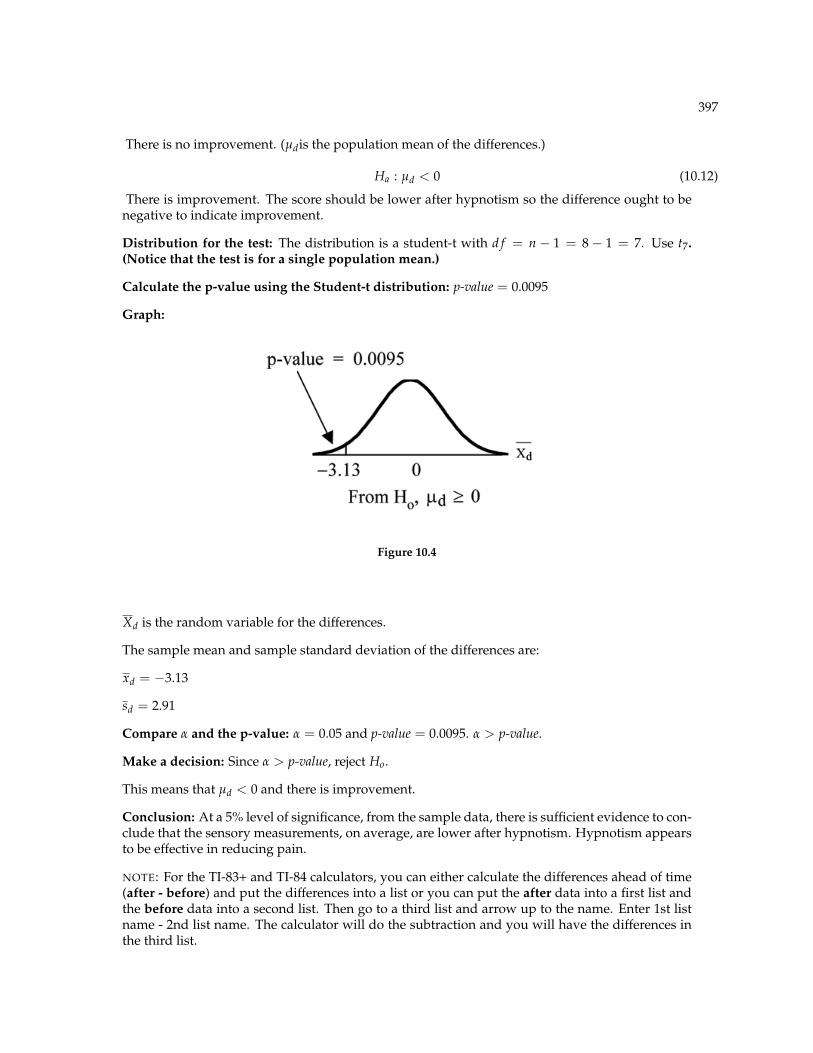
Example 10.6A college football coach was interested in whether the college’s strength development class in-creased his players’ maximum lift (in pounds) on the bench press exercise. He asked 4 of hisplayers to participate in a study. The amount of weight they could each lift was recorded beforethey took the strength development class. After completing the class, the amount of weight theycould each lift was again measured. The data are as follows:
Weight (in pounds) Player 1 Player 2 Player 3 Player 4
Amount of weighted lifted prior to the class 205 241 338 368
Amount of weight lifted after the class 295 252 330 360
Table 10.5
The coach wants to know if the strength development class makes his players stronger, onaverage.Problem (Solution on p. 424.)Record the differences data. Calculate the differences by subtracting the amount of weight lifted
prior to the class from the weight lifted after completing the class. The data for the differences are:{90, 11, -8, -8}
Using the differences data, calculate the sample mean and the sample standard deviation.
xd = 21.3 sd = 46.7
Using the difference data, this becomes a test of a single __________ (fill in the blank).
Define the random variable: Xd = average difference in the maximum lift per player.
The distribution for the hypothesis test is t3.
Ho : µd ≤ 0 Ha : µd > 0
Graph:
399
Figure 10.5
Calculate the p-value: The p-value is 0.2150
Decision: If the level of significance is 5%, the decision is to not reject the null hypothesis becauseα < p-value.
What is the conclusion?
Example 10.7Seven eighth graders at Kennedy Middle School measured how far they could push the shot-put
with their dominant (writing) hand and their weaker (non-writing) hand. They thought that theycould push equal distances with either hand. The following data was collected.
Distance(in feet)
using
Student 1 Student 2 Student 3 Student 4 Student 5 Student 6 Student 7
DominantHand
30 26 34 17 19 26 20
WeakerHand
28 14 27 18 17 26 16
Table 10.6
Problem (Solution on p. 424.)Conduct a hypothesis test to determine whether the differences in distances between the chil-dren’s dominant versus weaker hands is significant.
HINT: use a t-test on the difference data.
CHECK: The test statistic is 2.18 and the p-value is 0.0716.
What is your conclusion?
400 CHAPTER 10. HYPOTHESIS TESTING: TWO MEANS, PAIRED DATA, TWOPROPORTIONS
10.6 Summary of Types of Hypothesis Tests6
Two Population Means
• Populations are independent and population standard deviations are unknown.• Populations are independent and population standard deviations are known (not likely).
Matched or Paired Samples
• Two samples are drawn from the same set of objects.• Samples are dependent.
Two Population Proportions
• Populations are independent.
6This content is available online at <http://cnx.org/content/m17044/1.5/>.

401
10.7 Practice 1: Hypothesis Testing for Two Proportions7
10.7.1 Student Learning Outcomes
• The student will explore the properties of hypothesis testing with two proportions.
10.7.2 Given
In the 2000 Census, 2.4 percent of the U.S. population reported being two or more races. However, thepercent varies tremendously from state to state. (http://www.census.gov/prod/2001pubs/c2kbr01-6.pdf)Suppose that two random surveys are conducted. In the first random survey, out of 1000 North Dakotans,only 9 people reported being of two or more races. In the second random survey, out of 500 Nevadans,17 people reported being of two or more races. Conduct a hypothesis test to determine if the populationpercents are the same for the two states or if the percent for Nevada is statistically higher than for NorthDakota.
10.7.3 Hypothesis Testing: Two Averages
Exercise 10.7.1 (Solution on p. 424.)Is this a test of averages or proportions?
Exercise 10.7.2 (Solution on p. 424.)State the null and alternative hypotheses.
a. H0 :b. Ha :
Exercise 10.7.3 (Solution on p. 424.)Is this a right-tailed, left-tailed, or two-tailed test? How do you know?
Exercise 10.7.4What is the Random Variable of interest for this test?
Exercise 10.7.5In words, define the Random Variable for this test.
Exercise 10.7.6 (Solution on p. 424.)Which distribution (Normal or student-t) would you use for this hypothesis test?
Exercise 10.7.7Explain why you chose the distribution you did for the above question.
Exercise 10.7.8 (Solution on p. 424.)Calculate the test statistic.
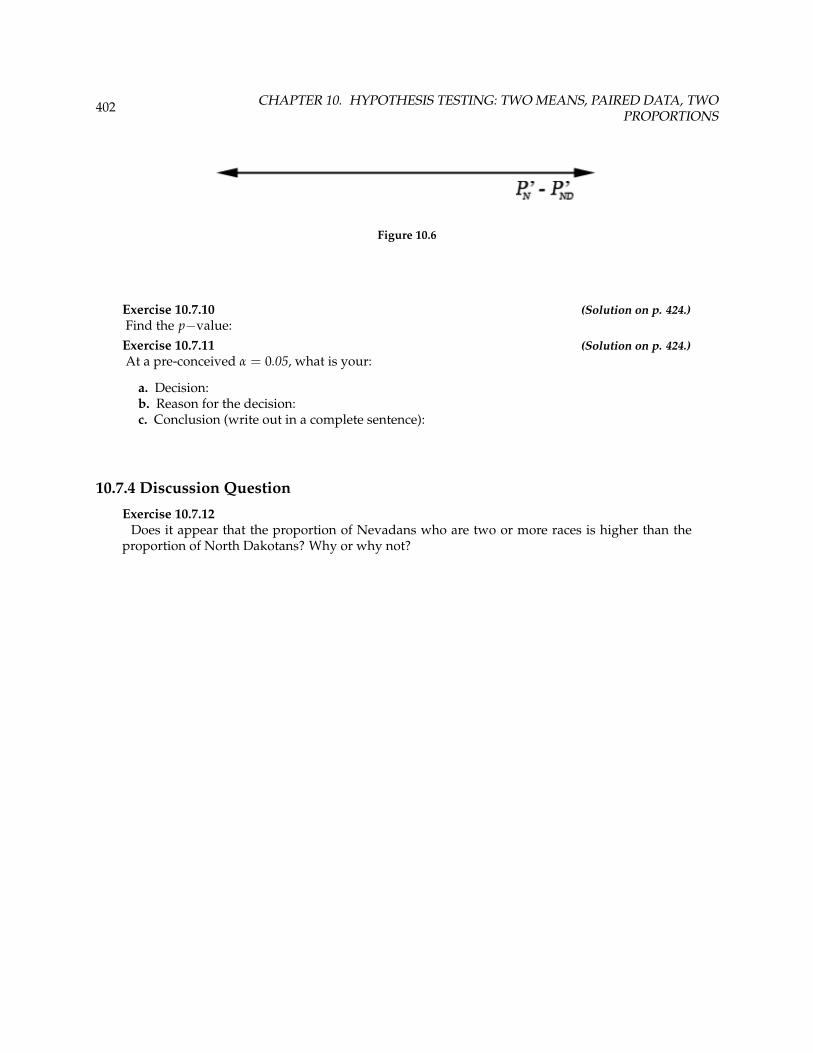
Exercise 10.7.9Sketch a graph of the situation. Label the horizontal axis. Mark the hypothesized difference and
the sample difference. Shade the area corresponding to the p−value.
7This content is available online at <http://cnx.org/content/m17027/1.9/>.
402 CHAPTER 10. HYPOTHESIS TESTING: TWO MEANS, PAIRED DATA, TWOPROPORTIONS
Figure 10.6
Exercise 10.7.10 (Solution on p. 424.)Find the p−value:
Exercise 10.7.11 (Solution on p. 424.)At a pre-conceived α = 0.05, what is your:
a. Decision:b. Reason for the decision:c. Conclusion (write out in a complete sentence):
10.7.4 Discussion Question
Exercise 10.7.12Does it appear that the proportion of Nevadans who are two or more races is higher than the
proportion of North Dakotans? Why or why not?
403
10.8 Practice 2: Hypothesis Testing for Two Averages8
10.8.1 Student Learning Outcome
• The student will explore the properties of hypothesis testing with two averages.
10.8.2 Given
The U.S. Center for Disease Control reports that the average life expectancy for whites born in 1900 was47.6 years and for nonwhites it was 33.0 years. (http://www.cdc.gov/nchs/data/dvs/nvsr53_06t12.pdf )Suppose that you randomly survey death records for people born in 1900 in a certain county. Of the 124whites, the average life span was 45.3 years with a standard deviation of 12.7 years. Of the 82 nonwhites,the average life span was 34.1 years with a standard deviation of 15.6 years. Conduct a hypothesis test tosee if the average life spans in the county were the same for whites and nonwhites.
10.8.3 Hypothesis Testing: Two Averages
Exercise 10.8.1 (Solution on p. 425.)Is this a test of averages or proportions?
Exercise 10.8.2 (Solution on p. 425.)State the null and alternative hypotheses.
a. H0 :b. Ha :
Exercise 10.8.3 (Solution on p. 425.)Is this a right-tailed, left-tailed, or two-tailed test? How do you know?
Exercise 10.8.4 (Solution on p. 425.)What is the Random Variable of interest for this test?
Exercise 10.8.5 (Solution on p. 425.)In words, define the Random Variable for this test.
Exercise 10.8.6Which distribution (Normal or student-t) would you use for this hypothesis test?
Exercise 10.8.7Explain why you chose the distribution you did for the above question.
Exercise 10.8.8 (Solution on p. 425.)Calculate the test statistic.
Exercise 10.8.9Sketch a graph of the situation. Label the horizontal axis. Mark the hypothesized difference and
the sample difference. Shade the area corresponding to the p−value.
8This content is available online at <http://cnx.org/content/m17039/1.7/>.

404 CHAPTER 10. HYPOTHESIS TESTING: TWO MEANS, PAIRED DATA, TWOPROPORTIONS
Figure 10.7
Exercise 10.8.10 (Solution on p. 425.)Find the p−value:
Exercise 10.8.11 (Solution on p. 425.)At a pre-conceived α = 0.05, what is your:
a. Decision:b. Reason for the decision:c. Conclusion (write out in a complete sentence):
10.8.4 Discussion Question
Exercise 10.8.12Does it appear that the averages are the same? Why or why not?
405
10.9 Homework9
For questions Exercise 10.9.1 - Exercise 10.9.10, indicate which of the following choices best identifies thehypothesis test.
A. Independent group means, population standard deviations and/or variances knownB. Independent group means, population standard deviations and/or variances unknownC. Matched or paired samplesD. Single meanE. 2 proportionsF. Single proportion
Exercise 10.9.1 (Solution on p. 425.)A powder diet is tested on 49 people and a liquid diet is tested on 36 different people. The pop-ulation standard deviations are 2 pounds and 3 pounds, respectively. Of interest is whether theliquid diet yields a higher average weight loss than the powder diet.Exercise 10.9.2Two chocolate bars are taste-tested on consumers. Of interest is whether a larger percentage ofconsumers will prefer one bar over the other.Exercise 10.9.3 (Solution on p. 425.)The average number of English courses taken in a two–year time period by male and female col-lege students is believed to be about the same. An experiment is conducted and data are collectedfrom 9 males and 16 females.Exercise 10.9.4A football league reported that the average number of touchdowns per game was 5. A study isdone to determine if the average number of touchdowns has decreased.Exercise 10.9.5 (Solution on p. 425.)A study is done to determine if students in the California state university system take longer tograduate than students enrolled in private universities. 100 students from both the California stateuniversity system and private universities are surveyed. From years of research, it is known thatthe population standard deviations are 1.5811 years and 1 year, respectively.Exercise 10.9.6According to a YWCA Rape Crisis Center newsletter, 75% of rape victims know their attackers. Astudy is done to verify this.Exercise 10.9.7 (Solution on p. 425.)According to a recent study, U.S. companies have an average maternity-leave of six weeks.Exercise 10.9.8A recent drug survey showed an increase in use of drugs and alcohol among local high schoolstudents as compared to the national percent. Suppose that a survey of 100 local youths and 100national youths is conducted to see if the percentage of drug and alcohol use is higher locally thannationally.Exercise 10.9.9 (Solution on p. 425.)A new SAT study course is tested on 12 individuals. Pre-course and post-course scores arerecorded. Of interest is the average increase in SAT scores.Exercise 10.9.10University of Michigan researchers reported in the Journal of the National Cancer Institute thatquitting smoking is especially beneficial for those under age 49. In this American Cancer Society
9This content is available online at <http://cnx.org/content/m17023/1.10/>.
406 CHAPTER 10. HYPOTHESIS TESTING: TWO MEANS, PAIRED DATA, TWOPROPORTIONS
study, the risk (probability) of dying of lung cancer was about the same as for those who had neversmoked.
10.9.1 For each problem below, fill in a hypothesis test solution sheet. The solutionsheet is in the Appendix and can be copied. For the online version of the book, it issuggested that you copy the .doc or .pdf files.
NOTE: If you are using a student-t distribution for a homework problem below, including forpaired data, you may assume that the underlying population is normally distributed. (In general,you must first prove that assumption, though.)
Exercise 10.9.11 (Solution on p. 425.)A powder diet is tested on 49 people and a liquid diet is tested on 36 different people. Of interestis whether the liquid diet yields a higher average weight loss than the powder diet. The powderdiet group had an average weight loss of 42 pounds with a standard deviation of 12 pounds. Theliquid diet group had an average weight loss of 45 pounds with a standard deviation of 14 pounds.Exercise 10.9.12The average number of English courses taken in a two–year time period by male and female col-lege students is believed to be about the same. An experiment is conducted and data are collectedfrom 29 males and 16 females. The males took an average of 3 English courses with a standarddeviation of 0.8. The females took an average of 4 English courses with a standard deviation of1.0. Are the averages statistically the same?Exercise 10.9.13 (Solution on p. 425.)A study is done to determine if students in the California state university system take longer tograduate than students enrolled in private universities. 100 students from both the California stateuniversity system and private universities are surveyed. Suppose that from years of research, itis known that the population standard deviations are 1.5811 years and 1 year, respectively. Thefollowing data are collected. The California state university system students took on average 4.5years with a standard deviation of 0.8. The private university students took on average 4.1 yearswith a standard deviation of 0.3.Exercise 10.9.14A new SAT study course is tested on 12 individuals. Pre-course and post-course scores arerecorded. Of interest is the average increase in SAT scores. The following data is collected:
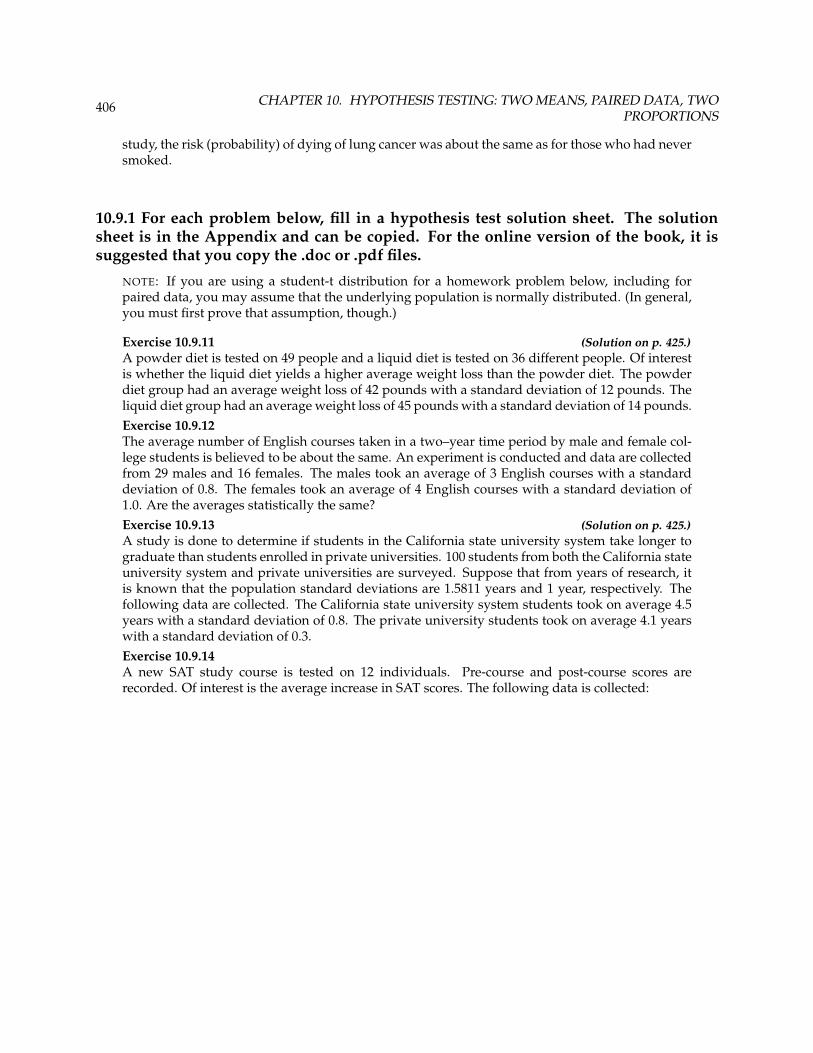
407
Pre-course score Post-course score
1200 1300
960 920
1010 1100
840 880
1100 1070
1250 1320
860 860
1330 1370
790 770
990 1040
1110 1200
740 850
Table 10.7
Exercise 10.9.15 (Solution on p. 425.)A recent drug survey showed an increase in use of drugs and alcohol among local high schoolseniors as compared to the national percent. Suppose that a survey of 100 local seniors and 100national seniors is conducted to see if the percentage of drug and alcohol use is higher locally thannationally. Locally, 65 seniors reported using drugs or alcohol within the past month, while 60national seniors reported using them.Exercise 10.9.16A student at a four-year college claims that average enrollment at four–year colleges is higher thanat two–year colleges in the United States. Two surveys are conducted. Of the 35 two–year collegessurveyed, the average enrollment was 5068 with a standard deviation of 4777. Of the 35 four-yearcolleges surveyed, the average enrollment was 5466 with a standard deviation of 8191. (Source:Microsoft Bookshelf )Exercise 10.9.17 (Solution on p. 426.)A study was conducted by the U.S. Army to see if applying antiperspirant to soldiers’ feet for afew days before a major hike would help cut down on the number of blisters soldiers had on theirfeet. In the experiment, for three nights before they went on a 13-mile hike, a group of 328 WestPoint cadets put an alcohol-based antiperspirant on their feet. A “control group” of 339 soldiersput on a similar, but inactive, preparation on their feet. On the day of the hike, the temperaturereached 83 ◦ F. At the end of the hike, 21% of the soldiers who had used the antiperspirant and 48%of the control group had developed foot blisters. Conduct a hypothesis test to see if the percentof soldiers using the antiperspirant was significantly lower than the control group. (Source: U.S.Army study reported in Journal of the American Academy of Dermatologists)Exercise 10.9.18We are interested in whether the percents of female suicide victims for ages 15 to 24 are the samefor the white and the black races in the United States. We randomly pick one year, 1992, to comparethe races. The number of suicides estimated in the United States in 1992 for white females is 4930.580 were aged 15 to 24. The estimate for black females is 330. 40 were aged 15 to 24. We will letfemale suicide victims be our population. (Source: the National Center for Health Statistics, U.S.Dept. of Health and Human Services)
408 CHAPTER 10. HYPOTHESIS TESTING: TWO MEANS, PAIRED DATA, TWOPROPORTIONS
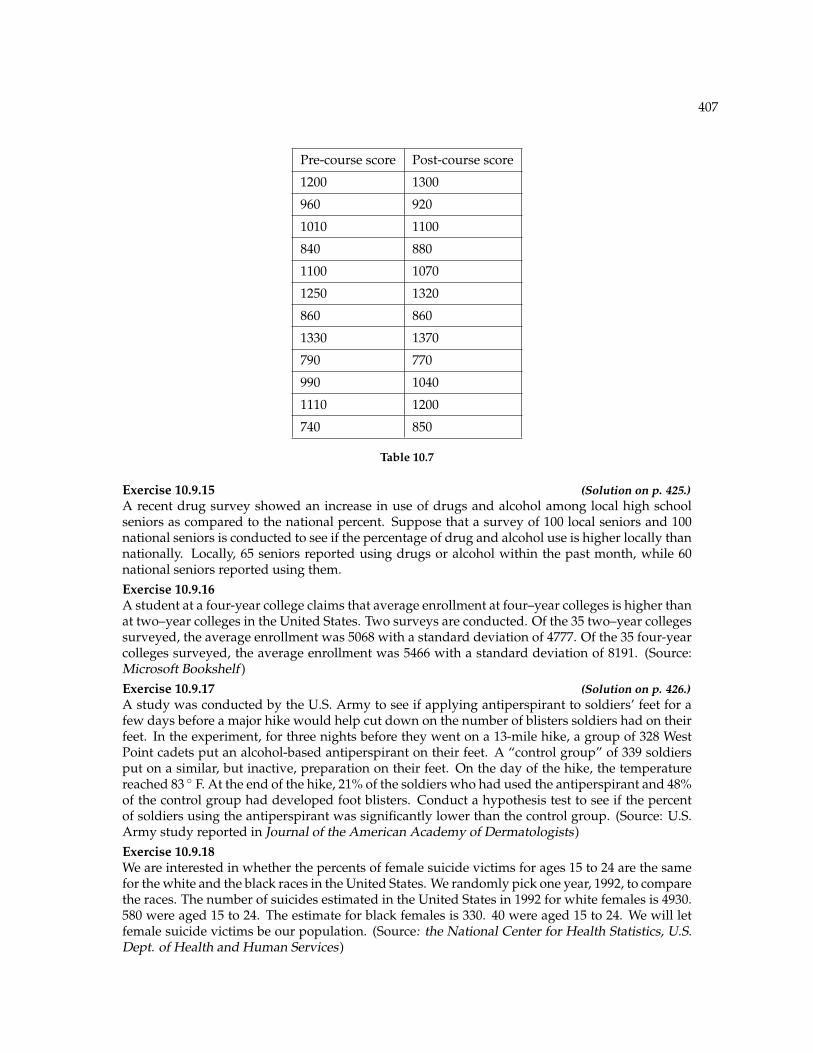
Exercise 10.9.19 (Solution on p. 426.)At Rachel’s 11th birthday party, 8 girls were timed to see how long (in seconds) they could holdtheir breath in a relaxed position. After a two-minute rest, they timed themselves while jumping.The girls thought that the jumping would not affect their times, on average. Test their hypothesis.
Relaxed time (seconds) Jumping time (seconds)
26 21
47 40
30 28
22 21
23 25
45 43
37 35
29 32
Table 10.8
Exercise 10.9.20Elizabeth Mjelde, an art history professor, was interested in whether the value from the GoldenRatio formula,
(larger+smaller dimension
larger dimension
)was the same in the Whitney Exhibit for works from 1900
– 1919 as for works from 1920 – 1942. 37 early works were sampled. They averaged 1.74 witha standard deviation of 0.11. 65 of the later works were sampled. They averaged 1.746 with astandard deviation of 0.1064. Do you think that there is a significant difference in the GoldenRatio calculation? (Source: data from Whitney Exhibit on loan to San Jose Museum of Art )Exercise 10.9.21 (Solution on p. 426.)One of the questions in a study of marital satisfaction of dual–career couples was to rate the state-ment, “I’m pleased with the way we divide the responsibilities for childcare.” The ratings wentfrom 1 (strongly agree) to 5 (strongly disagree). Below are ten of the paired responses for husbandsand wives. Conduct a hypothesis test to see if the average difference in the husband’s versus thewife’s satisfaction level is negative (meaning that, within the partnership, the husband is happierthan the wife).
Wife’s score 2 2 3 3 4 2 1 1 2 4
Husband’s score 2 2 1 3 2 1 1 1 2 4
Table 10.9
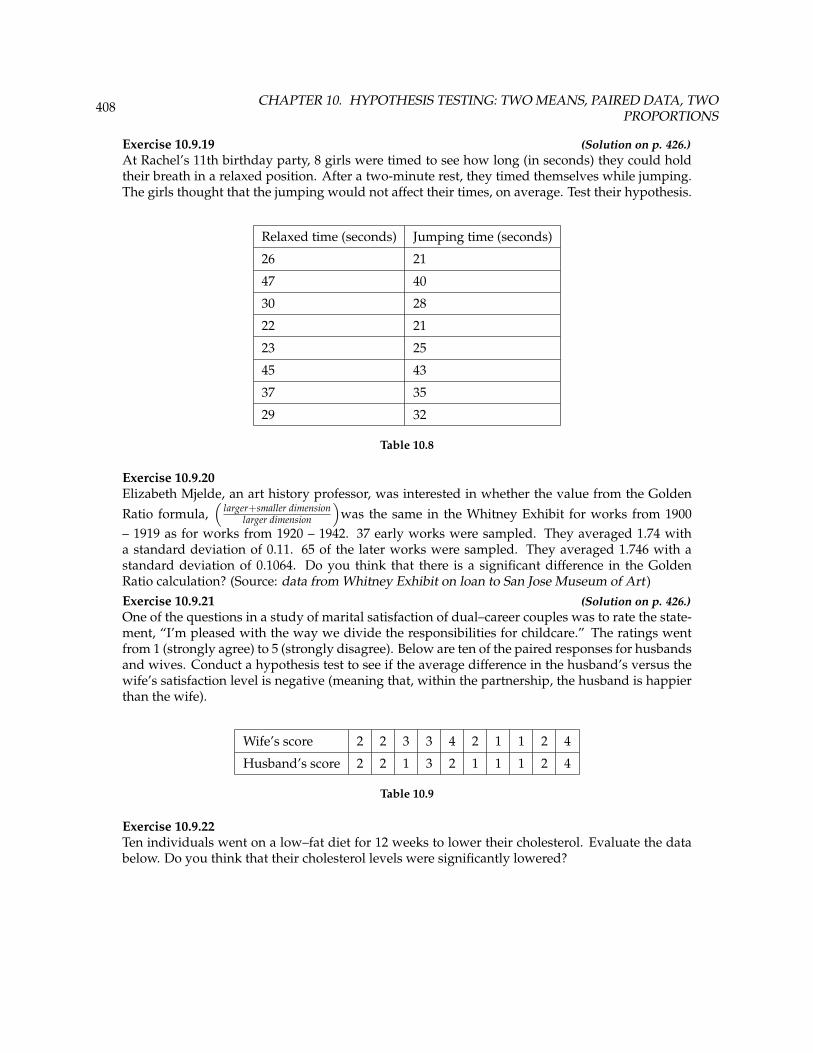
Exercise 10.9.22Ten individuals went on a low–fat diet for 12 weeks to lower their cholesterol. Evaluate the databelow. Do you think that their cholesterol levels were significantly lowered?
409
Starting cholesterol level Ending cholesterol level
140 140
220 230
110 120
240 220
200 190
180 150
190 200
360 300
280 300
260 240
Table 10.10
Exercise 10.9.23 (Solution on p. 426.)Average entry level salaries for college graduates with mechanical engineering degrees andelectrical engineering degrees are believed to be approximately the same. (Source: http://www.graduatingengineer.com10 ). A recruiting office thinks that the average mechanical engi-neering salary is actually lower than the average electrical engineering salary. The recruitingoffice randomly surveys 50 entry level mechanical engineers and 60 entry level electrical engi-neers. Their average salaries were $46,100 and $46,700, respectively. Their standard deviationswere $3450 and $4210, respectively. Conduct a hypothesis test to determine if you agree that theaverage entry level mechanical engineering salary is lower than the average entry level electricalengineering salary.Exercise 10.9.24A recent year was randomly picked from 1985 to the present. In that year, there were 2051 Hispanicstudents at Cabrillo College out of a total of 12,328 students. At Lake Tahoe College, there were321 Hispanic students out of a total of 2441 students. In general, do you think that the percentof Hispanic students at the two colleges is basically the same or different? (Source: Chancellor’sOffice, California Community Colleges, November 1994 )Exercise 10.9.25 (Solution on p. 426.)Eight runners were convinced that the average difference in their individual times for running onemile versus race walking one mile was at most 2 minutes. Below are their times. Do you agreethat the average difference is at most 2 minutes?
10http://www.graduatingengineer.com/
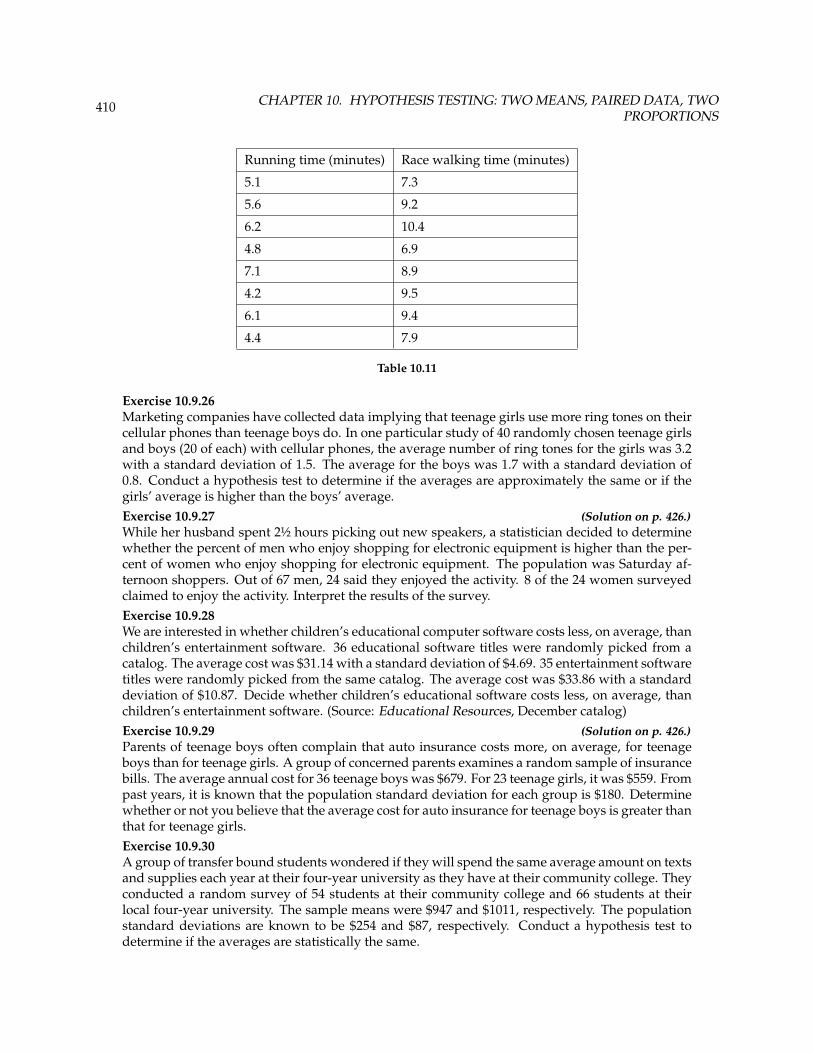
410 CHAPTER 10. HYPOTHESIS TESTING: TWO MEANS, PAIRED DATA, TWOPROPORTIONS
Running time (minutes) Race walking time (minutes)
5.1 7.3
5.6 9.2
6.2 10.4
4.8 6.9
7.1 8.9
4.2 9.5
6.1 9.4
4.4 7.9
Table 10.11
Exercise 10.9.26Marketing companies have collected data implying that teenage girls use more ring tones on theircellular phones than teenage boys do. In one particular study of 40 randomly chosen teenage girlsand boys (20 of each) with cellular phones, the average number of ring tones for the girls was 3.2with a standard deviation of 1.5. The average for the boys was 1.7 with a standard deviation of0.8. Conduct a hypothesis test to determine if the averages are approximately the same or if thegirls’ average is higher than the boys’ average.Exercise 10.9.27 (Solution on p. 426.)While her husband spent 2½ hours picking out new speakers, a statistician decided to determinewhether the percent of men who enjoy shopping for electronic equipment is higher than the per-cent of women who enjoy shopping for electronic equipment. The population was Saturday af-ternoon shoppers. Out of 67 men, 24 said they enjoyed the activity. 8 of the 24 women surveyedclaimed to enjoy the activity. Interpret the results of the survey.Exercise 10.9.28We are interested in whether children’s educational computer software costs less, on average, thanchildren’s entertainment software. 36 educational software titles were randomly picked from acatalog. The average cost was $31.14 with a standard deviation of $4.69. 35 entertainment softwaretitles were randomly picked from the same catalog. The average cost was $33.86 with a standarddeviation of $10.87. Decide whether children’s educational software costs less, on average, thanchildren’s entertainment software. (Source: Educational Resources, December catalog)Exercise 10.9.29 (Solution on p. 426.)Parents of teenage boys often complain that auto insurance costs more, on average, for teenageboys than for teenage girls. A group of concerned parents examines a random sample of insurancebills. The average annual cost for 36 teenage boys was $679. For 23 teenage girls, it was $559. Frompast years, it is known that the population standard deviation for each group is $180. Determinewhether or not you believe that the average cost for auto insurance for teenage boys is greater thanthat for teenage girls.Exercise 10.9.30A group of transfer bound students wondered if they will spend the same average amount on textsand supplies each year at their four-year university as they have at their community college. Theyconducted a random survey of 54 students at their community college and 66 students at theirlocal four-year university. The sample means were $947 and $1011, respectively. The populationstandard deviations are known to be $254 and $87, respectively. Conduct a hypothesis test todetermine if the averages are statistically the same.
411
Exercise 10.9.31 (Solution on p. 426.)Joan Nguyen recently claimed that the proportion of college–age males with at least one piercedear is as high as the proportion of college–age females. She conducted a survey in her classes. Outof 107 males, 20 had at least one pierced ear. Out of 92 females, 47 had at least one pierced ear. Doyou believe that the proportion of males has reached the proportion of females?Exercise 10.9.32Some manufacturers claim that non-hybrid sedan cars have a lower average miles per gallon(mpg) than hybrid ones. Suppose that consumers test 21 hybrid sedans and get an average 31mpg with a standard deviation of 7 mpg. Thirty-one non-hybrid sedans average 22 mpg with astandard deviation of 4 mpg. Suppose that the population standard deviations are known to be 6and 3, respectively. Conduct a hypothesis test to the manufacturers claim.
Questions Exercise 10.9.33 – Exercise 10.9.37 refer to the Terri Vogel’s data set (see Table of Contents).Exercise 10.9.33 (Solution on p. 426.)Using the data from Lap 1 only, conduct a hypothesis test to determine if the average time forcompleting a lap in races is the same as it is in practices.Exercise 10.9.34Repeat the test in Exercise 10.9.33, but use Lap 5 data this time.Exercise 10.9.35 (Solution on p. 427.)Repeat the test in Exercise 10.9.33, but this time combine the data from Laps 1 and 5.Exercise 10.9.36In 2 – 3 complete sentences, explain in detail how you might use Terri Vogel’s data to answer thefollowing question. “Does Terri Vogel drive faster in races than she does in practices?”Exercise 10.9.37 (Solution on p. 427.)Is the proportion of race laps Terri completes slower than 130 seconds less than the proportion ofpractice laps she completes slower than 135 seconds?Exercise 10.9.38"To Breakfast or Not to Breakfast?" by Richard Ayore
In the American society, birthdays are one of those days that everyone looks forward to. People ofdifferent ages and peer groups gather to mark the 18th, 20th, . . . birthdays. During this time, onelooks back to see what he or she had achieved for the past year, and also focuses ahead for moreto come.
If, by any chance, I am invited to one of these parties, my experience is always different. Insteadof dancing around with my friends while the music is booming, I get carried away by memoriesof my family back home in Kenya. I remember the good times I had with my brothers and sisterwhile we did our daily routine.
Every morning, I remember we went to the shamba (garden) to weed our crops. I remember oneday arguing with my brother as to why he always remained behind just to join us an hour later. Inhis defense, he said that he preferred waiting for breakfast before he came to weed. He said, “Thisis why I always work more hours than you guys!”
And so, to prove his wrong or right, we decided to give it a try. One day we went to work as usualwithout breakfast, and recorded the time we could work before getting tired and stopping. Onthe next day, we all ate breakfast before going to work. We recorded how long we worked againbefore getting tired and stopping. Of interest was our average increase in work time. Though notsure, my brother insisted that it is more than two hours. Using the data below, solve our problem.
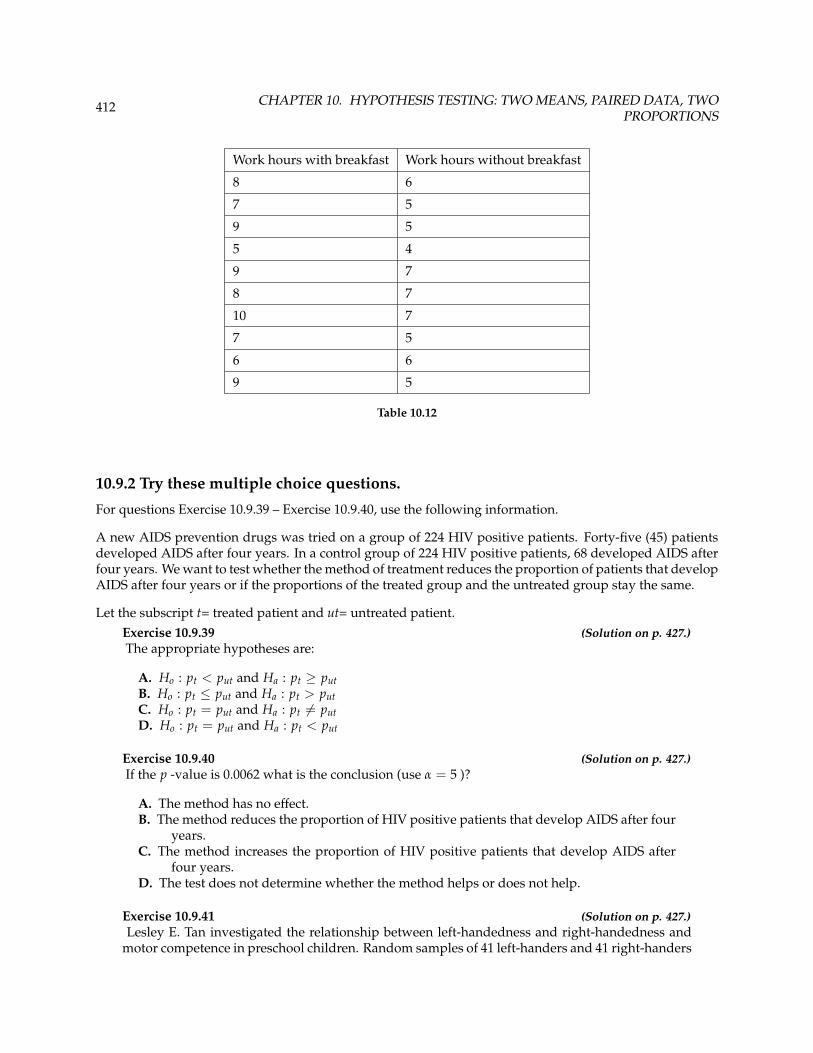
412 CHAPTER 10. HYPOTHESIS TESTING: TWO MEANS, PAIRED DATA, TWOPROPORTIONS
Work hours with breakfast Work hours without breakfast
8 6
7 5
9 5
5 4
9 7
8 7
10 7
7 5
6 6
9 5
Table 10.12
10.9.2 Try these multiple choice questions.
For questions Exercise 10.9.39 – Exercise 10.9.40, use the following information.
A new AIDS prevention drugs was tried on a group of 224 HIV positive patients. Forty-five (45) patientsdeveloped AIDS after four years. In a control group of 224 HIV positive patients, 68 developed AIDS afterfour years. We want to test whether the method of treatment reduces the proportion of patients that developAIDS after four years or if the proportions of the treated group and the untreated group stay the same.
Let the subscript t= treated patient and ut= untreated patient.Exercise 10.9.39 (Solution on p. 427.)The appropriate hypotheses are:
A. Ho : pt < put and Ha : pt ≥ putB. Ho : pt ≤ put and Ha : pt > putC. Ho : pt = put and Ha : pt 6= putD. Ho : pt = put and Ha : pt < put
Exercise 10.9.40 (Solution on p. 427.)If the p -value is 0.0062 what is the conclusion (use α = 5 )?
A. The method has no effect.B. The method reduces the proportion of HIV positive patients that develop AIDS after four
years.C. The method increases the proportion of HIV positive patients that develop AIDS after
four years.D. The test does not determine whether the method helps or does not help.
Exercise 10.9.41 (Solution on p. 427.)Lesley E. Tan investigated the relationship between left-handedness and right-handedness and
motor competence in preschool children. Random samples of 41 left-handers and 41 right-handers
413
were given several tests of motor skills to determine if there is evidence of a difference between thechildren based on this experiment. The experiment produced the means and standard deviationsshown below. Determine the appropriate test and best distribution to use for that test.
Left-handed Right-handed
Sample size 41 41
Sample mean 97.5 98.1
Sample standard deviation 17.5 19.2
Table 10.13
A. Two independent means, normal distributionB. Two independent means, student-t distributionC. Matched or paired samples, student-t distributionD. Two population proportions, normal distribution
For questions Exercise 10.9.42 – Exercise 10.9.43, use the following information.
An experiment is conducted to show that blood pressure can be consciously reduced in people trained in a“biofeedback exercise program.” Six (6) subjects were randomly selected and the blood pressure measure-ments were recorded before and after the training. The difference between blood pressures was calculated(after− before) producing the following results: xd = −10.2 sd = 8.4. Using the data, test the hypothesisthat the blood pressure has decreased after the training,
Exercise 10.9.42 (Solution on p. 427.)The distribution for the test is
A. t5B. t6C. N (−10.2, 8.4)D. N
(−10.2, 8.4√
6
)Exercise 10.9.43 (Solution on p. 427.)If α = 0.05, the p-value and the conclusion are
A. 0.0014; the blood pressure decreased after the trainingB. 0.0014; the blood pressure increased after the trainingC. 0.0155; the blood pressure decreased after the trainingD. 0.0155; the blood pressure increased after the training
For questions Exercise 10.9.44– Exercise 10.9.45, use the following information.
The Eastern and Western Major League Soccer conferences have a new Reserve Division that allows newplayers to develop their skills. As of May 25, 2005, the Reserve Division teams scored the following numberof goals for 2005.
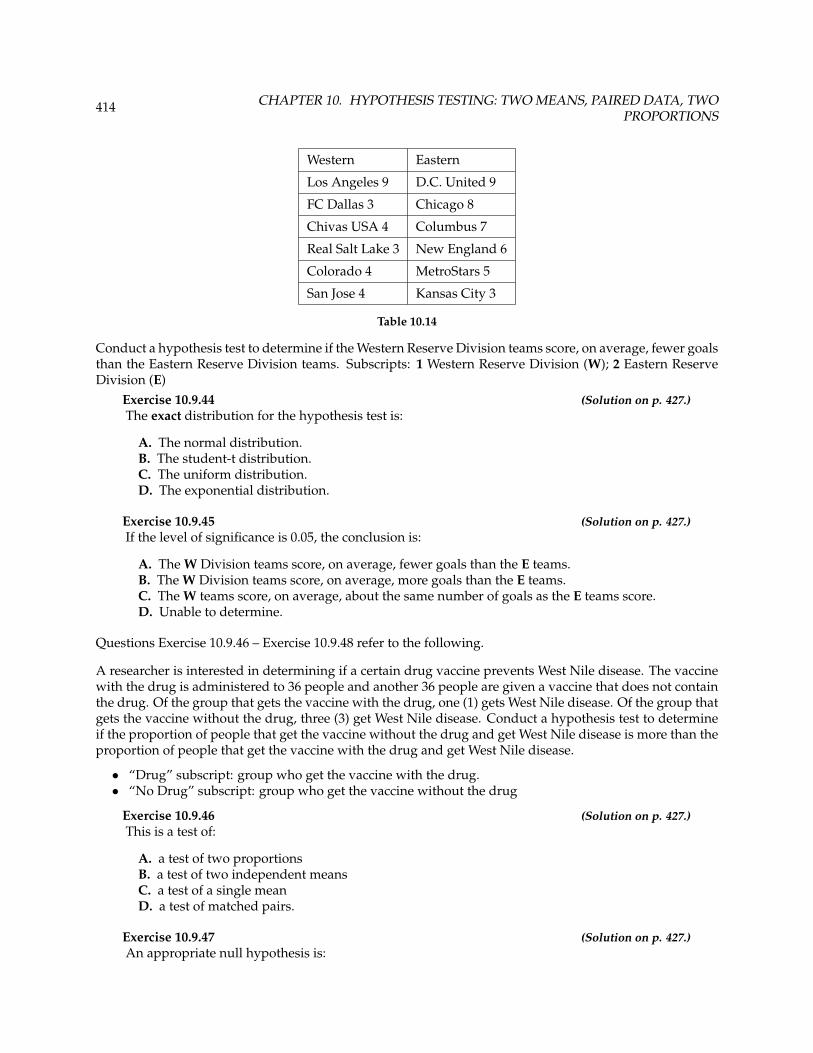
414 CHAPTER 10. HYPOTHESIS TESTING: TWO MEANS, PAIRED DATA, TWOPROPORTIONS
Western Eastern
Los Angeles 9 D.C. United 9
FC Dallas 3 Chicago 8
Chivas USA 4 Columbus 7
Real Salt Lake 3 New England 6
Colorado 4 MetroStars 5
San Jose 4 Kansas City 3
Table 10.14
Conduct a hypothesis test to determine if the Western Reserve Division teams score, on average, fewer goalsthan the Eastern Reserve Division teams. Subscripts: 1 Western Reserve Division (W); 2 Eastern ReserveDivision (E)
Exercise 10.9.44 (Solution on p. 427.)The exact distribution for the hypothesis test is:
A. The normal distribution.B. The student-t distribution.C. The uniform distribution.D. The exponential distribution.
Exercise 10.9.45 (Solution on p. 427.)If the level of significance is 0.05, the conclusion is:
A. The W Division teams score, on average, fewer goals than the E teams.B. The W Division teams score, on average, more goals than the E teams.C. The W teams score, on average, about the same number of goals as the E teams score.D. Unable to determine.
Questions Exercise 10.9.46 – Exercise 10.9.48 refer to the following.
A researcher is interested in determining if a certain drug vaccine prevents West Nile disease. The vaccinewith the drug is administered to 36 people and another 36 people are given a vaccine that does not containthe drug. Of the group that gets the vaccine with the drug, one (1) gets West Nile disease. Of the group thatgets the vaccine without the drug, three (3) get West Nile disease. Conduct a hypothesis test to determineif the proportion of people that get the vaccine without the drug and get West Nile disease is more than theproportion of people that get the vaccine with the drug and get West Nile disease.
• “Drug” subscript: group who get the vaccine with the drug.• “No Drug” subscript: group who get the vaccine without the drug
Exercise 10.9.46 (Solution on p. 427.)This is a test of:
A. a test of two proportionsB. a test of two independent meansC. a test of a single meanD. a test of matched pairs.
Exercise 10.9.47 (Solution on p. 427.)An appropriate null hypothesis is:
415
A. pNo Drug ≤ pDrugB. pNo Drug ≥ pDrugC. µNo Drug ≤ µDrugD. pNo Drug > pDrug
Exercise 10.9.48 (Solution on p. 427.)The p-value is 0.1517. At a 1% level of significance, the appropriate conclusion is
A. the proportion of people that get the vaccine without the drug and get West Nile diseaseis less than the proportion of people that get the vaccine with the drug and get WestNile disease.
B. the proportion of people that get the vaccine without the drug and get West Nile diseaseis more than the proportion of people that get the vaccine with the drug and get WestNile disease.
C. the proportion of people that get the vaccine without the drug and get West Nile diseaseis more than or equal to the proportion of people that get the vaccine with the drug andget West Nile disease.
D. the proportion of people that get the vaccine without the drug and get West Nile diseaseis no more than the proportion of people that get the vaccine with the drug and getWest Nile disease.
Questions Exercise 10.9.49 and Exercise 10.9.50 refer to the following:
A golf instructor is interested in determining if her new technique for improving players’ golf scores iseffective. She takes four (4) new students. She records their 18-holes scores before learning the techniqueand then after having taken her class. She conducts a hypothesis test. The data are as follows.
Player 1 Player 2 Player 3 Player 4
Average score before class 83 78 93 87
Average score after class 80 80 86 86
Table 10.15
Exercise 10.9.49 (Solution on p. 427.)This is a test of:
A. a test of two independent meansB. a test of two proportionsC. a test of a single proportionD. a test of matched pairs.
Exercise 10.9.50 (Solution on p. 427.)The correct decision is:
A. Reject HoB. Do not reject HoC. The test is inconclusive
Questions Exercise 10.9.51 and Exercise 10.9.52 refer to the following:
Suppose a statistics instructor believes that there is no significant difference between the average classscores of her two classes on Exam 2. The average and standard deviation for her 8:30 class of 35 students
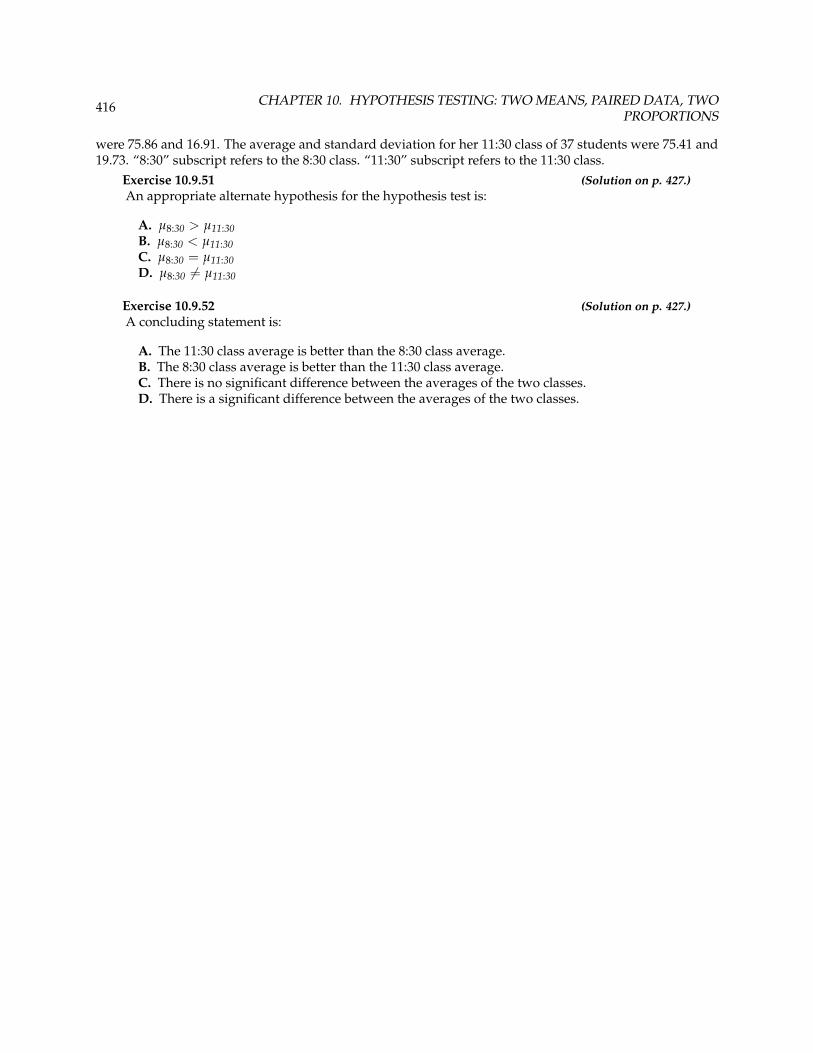
416 CHAPTER 10. HYPOTHESIS TESTING: TWO MEANS, PAIRED DATA, TWOPROPORTIONS
were 75.86 and 16.91. The average and standard deviation for her 11:30 class of 37 students were 75.41 and19.73. “8:30” subscript refers to the 8:30 class. “11:30” subscript refers to the 11:30 class.
Exercise 10.9.51 (Solution on p. 427.)An appropriate alternate hypothesis for the hypothesis test is:
A. µ8:30 > µ11:30B. µ8:30 < µ11:30C. µ8:30 = µ11:30D. µ8:30 6= µ11:30
Exercise 10.9.52 (Solution on p. 427.)A concluding statement is:
A. The 11:30 class average is better than the 8:30 class average.B. The 8:30 class average is better than the 11:30 class average.C. There is no significant difference between the averages of the two classes.D. There is a significant difference between the averages of the two classes.

417
10.10 Review11
The next three questions refer to the following information:
In a survey at Kirkwood Ski Resort the following information was recorded:
Sport Participation by Age
0 – 10 11 - 20 21 - 40 40+
Ski 10 12 30 8
Snowboard 6 17 12 5
Table 10.16
Suppose that one person from of the above was randomly selected.Exercise 10.10.1 (Solution on p. 427.)Find the probability that the person was a skier or was age 11 – 20.
Exercise 10.10.2 (Solution on p. 427.)Find the probability that the person was a snowboarder given he/she was age 21 – 40.
Exercise 10.10.3 (Solution on p. 427.)Explain which of the following are true and which are false.
a. Sport and Age are independent events.b. Ski and age 11 – 20 are mutually exclusive events.c. P (Ski and age 21− 40) < P (Ski | age 21− 40)d. P (Snowboard or age 0− 10) < P (Snowboard | age 0− 10)
Exercise 10.10.4 (Solution on p. 428.)The average length of time a person with a broken leg wears a cast is approximately 6 weeks.
The standard deviation is about 3 weeks. Thirty people who had recently healed from brokenlegs were interviewed. State the distribution that most accurately reflects total time to heal for thethirty people.Exercise 10.10.5 (Solution on p. 428.)The distribution for X is Uniform. What can we say for certain about the distribution for X whenn = 1?
A. The distribution for X is still Uniform with the same mean and standard dev. as thedistribution for X.
B. The distribution for Xis Normal with the different mean and a different standard devia-tion as the distribution for X.
C. The distribution for X is Normal with the same mean but a larger standard deviation thanthe distribution for X.
D. The distribution for X is Normal with the same mean but a smaller standard deviationthan the distribution for X.
Exercise 10.10.6 (Solution on p. 428.)The distribution for X is uniform. What can we say for certain about the distribution for ∑ X
when n = 50?11This content is available online at <http://cnx.org/content/m17021/1.8/>.
418 CHAPTER 10. HYPOTHESIS TESTING: TWO MEANS, PAIRED DATA, TWOPROPORTIONS
A. The distribution for ∑ Xis still uniform with the same mean and standard deviation asthe distribution for X.
B. The distribution for ∑ X is Normal with the same mean but a larger standard deviationas the distribution for X.
C. The distribution for ∑ X is Normal with a larger mean and a larger standard deviationthan the distribution for X.
D. The distribution for ∑ X is Normal with the same mean but a smaller standard deviationthan the distribution for X.
The next three questions refer to the following information:
A group of students measured the lengths of all the carrots in a five-pound bag of baby carrots. Theycalculated the average length of baby carrots to be 2.0 inches with a standard deviation of 0.25 inches.Suppose we randomly survey 16 five-pound bags of baby carrots.
Exercise 10.10.7 (Solution on p. 428.)State the approximate distribution for X, the distribution for the average lengths of baby carrots
in 16 five-pound bags. X~Exercise 10.10.8Explain why we cannot find the probability that one individual randomly chosen carrot is greaterthan 2.25 inches.Exercise 10.10.9 (Solution on p. 428.)Find the probability that X is between 2 and 2.25 inches.
The next three questions refer to the following information:
At the beginning of the term, the amount of time a student waits in line at the campus store is normallydistributed with a mean of 5 minutes and a standard deviation of 2 minutes.
Exercise 10.10.10 (Solution on p. 428.)Find the 90th percentile of waiting time in minutes.
Exercise 10.10.11 (Solution on p. 428.)Find the median waiting time for one student.
Exercise 10.10.12 (Solution on p. 428.)Find the probability that the average waiting time for 40 students is at least 4.5 minutes.
419
10.11 Lab: Hypothesis Testing for Two Means and Two Proportions12
Class Time:
Names:
10.11.1 Student Learning Outcomes:
• The student will select the appropriate distributions to use in each case.• The student will conduct hypothesis tests and interpret the results.
10.11.2 Supplies:
• The business section from two consecutive days’ newspapers• 3 small packages of M&Ms®• 5 small packages of Reeses Pieces®
10.11.3 Increasing Stocks Survey
Look at yesterday’s newspaper business section. Conduct a hypothesis test to determine if the proportionof New York Stock Exchange (NYSE) stocks that increased is greater than the proportion of NASDAQ stocksthat increased. As randomly as possible, choose 40 NYSE stocks and 32 NASDAQ stocks and complete thefollowing statements.
1. Ho2. Ha3. In words, define the Random Variable. ____________=4. The distribution to use for the test is:5. Calculate the test statistic using your data.6. Draw a graph and label it appropriately. Shade the actual level of significance.
a. Graph:
12This content is available online at <http://cnx.org/content/m17022/1.10/>.
420 CHAPTER 10. HYPOTHESIS TESTING: TWO MEANS, PAIRED DATA, TWOPROPORTIONS
Figure 10.8
b. Calculate the p-value:
7. Do you reject or not reject the null hypothesis? Why?8. Write a clear conclusion using a complete sentence.
10.11.4 Decreasing Stocks Survey
Randomly pick 8 stocks from the newspaper. Using two consecutive days’ business sections, test whetherthe stocks went down, on average, for the second day.
1. Ho2. Ha3. In words, define the Random Variable. ____________=4. The distribution to use for the test is:5. Calculate the test statistic using your data.6. Draw a graph and label it appropriately. Shade the actual level of significance.
a. Graph:

421
Figure 10.9
b. Calculate the p-value:
7. Do you reject or not reject the null hypothesis? Why?8. Write a clear conclusion using a complete sentence.
10.11.5 Candy Survey
Buy three small packages of M&Ms and 5 small packages of Reeses Pieces (same net weight as the M&Ms).Test whether or not the average number of candy pieces per package is the same for the two brands.
1. Ho:2. Ha:3. In words, define the random variable. __________=4. What distribution should be used for this test?5. Calculate the test statistic using your data.6. Draw a graph and label it appropriately. Shade the actual level of significance.
a. Graph:
422 CHAPTER 10. HYPOTHESIS TESTING: TWO MEANS, PAIRED DATA, TWOPROPORTIONS
Figure 10.10
b. Calculate the p-value:
7. Do you reject or not reject the null hypothesis? Why?8. Write a clear conclusion using a complete sentence.
10.11.6 Shoe Survey
Test whether women have, on average, more pairs of shoes than men. Include all forms of sneakers, shoes,sandals, and boots. Use your class as the sample.
1. Ho2. Ha3. In words, define the Random Variable. ____________=4. The distribution to use for the test is:5. Calculate the test statistic using your data.6. Draw a graph and label it appropriately. Shade the actual level of significance.
a. Graph:
423
Figure 10.11
b. Calculate the p-value:
7. Do you reject or not reject the null hypothesis? Why?8. Write a clear conclusion using a complete sentence.

424 CHAPTER 10. HYPOTHESIS TESTING: TWO MEANS, PAIRED DATA, TWOPROPORTIONS
Solutions to Exercises in Chapter 10
Solution to Example 10.2, Problem 1 (p. 391)two meansSolution to Example 10.2, Problem 2 (p. 391)unknownSolution to Example 10.2, Problem 3 (p. 391)Student-tSolution to Example 10.2, Problem 4 (p. 391)XA − XB
Solution to Example 10.2, Problem 5 (p. 391)
• Ho : µA ≤ µB• Ha : µA > µB
Solution to Example 10.2, Problem 6 (p. 391)rightSolution to Example 10.2, Problem 7 (p. 391)0.1928Solution to Example 10.2, Problem 8 (p. 391)Do not reject.Solution to Example 10.4 (p. 394)The problem asks for a difference in percentages.
Solution to Example 10.6 (p. 398)means; At a 5% level of significance, from the sample data, there is not sufficient evidence to conclude thatthe strength development class helped to make the players stronger, on average.Solution to Example 10.7 (p. 399)H0: µd equals 0; Ha: µd does not equal 0; Do not reject the null; At a 5% significance level, from the sampledata, there is not sufficient evidence to conclude that the differences in distances between the children’sdominant versus weaker hands is significant (there is not sufficient evidence to show that the childrencould push the shot-put further with their dominant hand). Alpha and the p-value are close so the test isnot strong.
Solutions to Practice 1: Hypothesis Testing for Two Proportions
Solution to Exercise 10.7.1 (p. 401)Proportions
Solution to Exercise 10.7.2 (p. 401)
a. H0:PN=PND
a. Ha:PN> PND
Solution to Exercise 10.7.3 (p. 401)right-tailed
Solution to Exercise 10.7.6 (p. 401)Normal
Solution to Exercise 10.7.8 (p. 401)3.50
Solution to Exercise 10.7.10 (p. 402)0.0002
Solution to Exercise 10.7.11 (p. 402)
a. Reject the null hypothesis
425
Solutions to Practice 2: Hypothesis Testing for Two Averages
Solution to Exercise 10.8.1 (p. 403)Averages
Solution to Exercise 10.8.2 (p. 403)
a. H0 : µW = µNWb. Ha : µW 6= µNW
Solution to Exercise 10.8.3 (p. 403)two-tailed
Solution to Exercise 10.8.4 (p. 403)XW − XNW
Solution to Exercise 10.8.5 (p. 403)student-t
Solution to Exercise 10.8.8 (p. 403)5.42
Solution to Exercise 10.8.10 (p. 404)0.0000
Solution to Exercise 10.8.11 (p. 404)
a. Reject the null hypothesis
Solutions to Homework
Solution to Exercise 10.9.1 (p. 405)ASolution to Exercise 10.9.3 (p. 405)BSolution to Exercise 10.9.5 (p. 405)ASolution to Exercise 10.9.7 (p. 405)DSolution to Exercise 10.9.9 (p. 405)CSolution to Exercise 10.9.11 (p. 406)
d. t68.44e. -1.04f. 0.1519h. Dec: do not reject null
Solution to Exercise 10.9.13 (p. 406)Standard Normal
e. z = 2.14f. 0.0163h. Decision: Reject null when α = 0.05; Do not reject null when α = 0.01
Solution to Exercise 10.9.15 (p. 407)
e. 0.73f. 0.2326h. Decision: Do not reject null
426 CHAPTER 10. HYPOTHESIS TESTING: TWO MEANS, PAIRED DATA, TWOPROPORTIONS
Solution to Exercise 10.9.17 (p. 407)
e. -7.33f. 0h. Decision: Reject null
Solution to Exercise 10.9.19 (p. 408)
d. t7e. -1.51f. 0.1755h. Decision: Do not reject null
Solution to Exercise 10.9.21 (p. 408)
d. t9e. t = −1.86f. 0.0479h. Decision: Reject null, but run another test
Solution to Exercise 10.9.23 (p. 409)
d. t108e. t = −0.82f. 0.2066h. Decision: Do not reject null
Solution to Exercise 10.9.25 (p. 409)
d. t7e. t = 2.9850f. 0.0103h. Decision: Reject null; The average difference is more than 2 minutes.
Solution to Exercise 10.9.27 (p. 410)
e. 0.22f. 0.4133h. Decision: Do not reject null
Solution to Exercise 10.9.29 (p. 410)
e. z = 2.50f. 0.0063h. Decision: Reject null
Solution to Exercise 10.9.31 (p. 411)
e. -4.82f. 0h. Decision: Reject null
Solution to Exercise 10.9.33 (p. 411)
d. t20.32e. -4.70f. 0.0001h. Decision: Reject null
427
Solution to Exercise 10.9.35 (p. 411)
d. t40.94e. -5.08f. 0h. Decision: Reject null
Solution to Exercise 10.9.37 (p. 411)
e. -0.95f. 0.1705h. Decision: Do not reject null
Solution to Exercise 10.9.39 (p. 412)D
Solution to Exercise 10.9.40 (p. 412)B
Solution to Exercise 10.9.41 (p. 412)B
Solution to Exercise 10.9.42 (p. 413)A
Solution to Exercise 10.9.43 (p. 413)C
Solution to Exercise 10.9.44 (p. 414)B
Solution to Exercise 10.9.45 (p. 414)C
Solution to Exercise 10.9.46 (p. 414)A
Solution to Exercise 10.9.47 (p. 414)A
Solution to Exercise 10.9.48 (p. 415)D
Solution to Exercise 10.9.49 (p. 415)D
Solution to Exercise 10.9.50 (p. 415)B
Solution to Exercise 10.9.51 (p. 416)D
Solution to Exercise 10.9.52 (p. 416)C
Solutions to Review
Solution to Exercise 10.10.1 (p. 417)77
100Solution to Exercise 10.10.2 (p. 417)1242
Solution to Exercise 10.10.3 (p. 417)
a. Falseb. Falsec. True
428 CHAPTER 10. HYPOTHESIS TESTING: TWO MEANS, PAIRED DATA, TWOPROPORTIONS
d. False
Solution to Exercise 10.10.4 (p. 417)N (180, 16.43)
Solution to Exercise 10.10.5 (p. 417)A
Solution to Exercise 10.10.6 (p. 417)C
Solution to Exercise 10.10.7 (p. 418)N(
2, .25√16
)Solution to Exercise 10.10.9 (p. 418)0.5000
Solution to Exercise 10.10.10 (p. 418)7.6
Solution to Exercise 10.10.11 (p. 418)5
Solution to Exercise 10.10.12 (p. 418)0.9431