
HYPOGLYCEMIC INTERACTION OF TWO DRUGS IN CONTROL …
131
HYPOGLYCEMIC INTERACTION OF TWO DRUGS IN CONTROL RATS AND IN A RAT MODEL OF DIABETES Ilona Iso-Mustajärvi University of Helsinki Faculty of Pharmacy Division of Biopharmaceutics and Pharmacokinetics May 2013
Transcript of HYPOGLYCEMIC INTERACTION OF TWO DRUGS IN CONTROL …

HYPOGLYCEMIC INTERACTION OF TWO DRUGS IN CONTROL RATS AND
IN A RAT MODEL OF DIABETES
Ilona Iso-Mustajärvi
University of Helsinki
Faculty of Pharmacy
Division of Biopharmaceutics
and Pharmacokinetics
May 2013


TABLE OF CONTENTS
1 INTRODUCTION ...................................................................................................... 1
I REVIEW OF THE LITERATURE
2 TYPE 2 DIABETES MELLITUS .............................................................................. 3
2.1 The role of insulin ................................................................................................ 3
2.2 Characters of type 2 diabetes mellitus ................................................................. 4
2.3 Other subtypes of diabetes mellitus ..................................................................... 5
2.4 Chronic complications of diabetes ....................................................................... 7
2.4.1 Nephropathy .................................................................................................. 8
2.4.2 Cardio vascular disease ................................................................................. 8
2.4.3 Retinopathy ................................................................................................... 9
2.4.4 Neuropathy .................................................................................................... 9
3 MEDICATION OF TYPE 2 DIABETES MELLITUS ............................................ 10
3.1 Biguanides ......................................................................................................... 11
3.2 Sulphonylureas ................................................................................................... 12
3.3 Glinides .............................................................................................................. 13
3.4 -glucosidase inhibitors ..................................................................................... 13
3.5 Glitazones .......................................................................................................... 14
3.6 Gliptins ............................................................................................................... 14
3.7 Incretin mimetics ............................................................................................... 15
3.8 Insulin ................................................................................................................ 16
3.9 Guar gum ........................................................................................................... 16
4 ANIMAL MODELS OF TYPE 2 DIABETES MELLITUS .................................... 16
4.1 Chemically induced rat model of diabetes ......................................................... 18
4.2 Spontaneous or genetically derived rat model of diabetes ................................ 19
4.2.1 Goto-Kakizaki rats ...................................................................................... 19
4.2.2 Zucker Diabetic Fatty rats ........................................................................... 23
4.2.3 Comparison of Goto-Kakizaki and Zucker diabetic fatty rat models ......... 24

5 DRUG INTERACTIONS ......................................................................................... 25
5.1 The significance of drug interactions ................................................................. 25
5.2 Pharmacokinetic interactions ............................................................................. 27
5.3 Pharmacodynamic interactions .......................................................................... 29
5.4 Drug interactions of clinical importance with antihyperglycemic agents ......... 30
5.4.1 Interactions with antihyperglycemic agents ............................................... 30
5.4.2 Interaction between angiotensin-converting enzyme inhibitors and
sulphonylureas ........................................................................................................ 33
II EXPERIMENTAL STUDY
6 AIMS OF THE STUDY ........................................................................................... 35
7 MATERIALS AND METHODS .............................................................................. 35
7.1 Animals .............................................................................................................. 35
7.2 Study design ....................................................................................................... 36
7.3 Analytical procedures ........................................................................................ 38
7.3.1 Analytical instrumentation and conditions ................................................. 38
7.3.2 Sample preparation ..................................................................................... 39
7.4 Pharmacokinetic analysis ................................................................................... 40
7.5 Blood glucose concentration measurement and oral glucose tolerance test ...... 40
7.6 Statistical analysis .............................................................................................. 41
8 RESULTS ................................................................................................................. 41
8.1 Analytical procedures ........................................................................................ 41
8.2 Blood glucose concentration measurement ....................................................... 43
8.2.1 Control rat ................................................................................................... 44
8.2.2 Rat model of diabetes ................................................................................. 44
8.3 Oral glucose tolerance test ................................................................................. 46
8.3.1 Control rats ................................................................................................. 47
8.3.2 Animal model of diabetes ........................................................................... 48
8.4 The pharmacokinetic interaction between gliclazide and fosinopril ................. 49
8.5 Pharmacokinetics of gliclazide in control rat and rat model of diabetes ........... 51
8.6 Pharmacokinetics of gliclazide after single and repeated dosing ...................... 54

9 DISCUSSION ........................................................................................................... 56
10 CONCLUSIONS .................................................................................................... 62
11 REFERENCES ....................................................................................................... 64
APPENDICES
APPENDIX 1 Application for animal experiments
APPENDIX 2 Protocol Outline for the animal experiment
APPENDIX 3 Development and validation of HPLC-MS/MS method for simultaneous
determination of gliclazide and fosinoprilat in rat plasma
APPENDIX 4 Raw data of the pharmacokinetic studies

ABBREVIATIONS
ACE Angiotensin Converting Enzyme
AUC Area Under the Curve
ATP Adenosine Triphosphate
CVD Cardio Vascular Disease
CYP Cytochrome P-450
DPP-4 Dipeptidyl Peptidase 4
EMA European Medicines Agency
F Fosinopril
FDA Food and Drug Administration
G Gliclazide
GAD Glutamic Acid Decarboxylase
GIP Glucose-dependent Insulinotropic Polypeptide
GK Goto-Kakizaki rat
GLP-1 Glucagon-like Peptide-1
GLUT-2 Glucose Transporter 2
HbA1c Glycosylated Hemoglobin
HOPE The Heart Outcomes Prevention Evaluation
HPLC-MS/MS High Performance Liquid Chromatography Tandem Mass Spectrometry
IFG Impaired Fasting Glucose
IGT Impaired Glucose Tolerance
ISTD Internal Standard
i.v. Intravenous
LADA Latent Autoimmune Diabetes of Adults
LOQ Limit Of Quantification
MODY Maturity Onset Diabetes of the Young
MRT Mean Residence Time
OGT Oral Glucose Tolerance
p.o. Per oral
PK Pharmacokinetic
QC Quality Control
S/N Signal-to-Noise
SPC Summary of Product Characteristics
STOP-NIDDM Study to Prevent Noninsulin-Dependent Diabetes Mellitus
SUR Sulphonylurea Receptor
UKPDS The United Kingdom Prospective Diabetes Study
WHO World Health Organization
WI Wistar rat
ZDF Zucker Diabetic Fatty
ZFR Zucker Fatty Rat

1
1 INTRODUCTION
There were circa 285 million adults with diabetes in the world in 2010 and
approximately 90-95% of them had type 2 diabetes mellitus (Shaw et al. 2010,
International Diabetes Federation 2011). The prevalence of diabetes patients increased
from 194 million in 2003, and it is expected to be approximately 439 million by 2030.
In Finland, the number of subjects with diabetes is more than 250 000 and also in here
90% of the patients have type 2 diabetes mellitus (Diabetesliitto 2011). Also in Finland
the number of patients with diabetes is expected to raise, even double during next 10-15
years. Type 2 diabetes mellitus is very under-diagnosed and even half of the patients
have not been diagnosed (Harris 1993). Type 2 diabetes mellitus is associated with
severe and disabling comorbidities, such as nephropathy and retinopathy. The treatment
of the comorbidities is expensive and often leads to hospitalizations. Early diagnosis
would help diminishing the amount of diabetic complications (Colagiuri et al 2002). In
1997 diabetes took about 12% of the costs of the health care system in Finland (Kangas
2002). Approximately 90% of this amount was taken by the treatment of diabetic
complications, which can partly be prevented.
Patients with diabetes typically use a wide variety of drugs concurrently. In addition to
antidiabetic medicine, patients with type 2 diabetes mellitus also have for example
antihyperlipidemic, antihypertensive and antiplatelet medications. Polypharmacy
significantly increases the risk of interactions (Reimche et al. 2011). Potential
interactions can occur between different antidiabetic drugs, and between antidiabetic
drugs and other widely co-administered pharmacological agents. Drug interactions
cause major costs through unnecessary medications and increased number of
hospitalizations (McDonnell and Jacobs 2002). A significant interaction has been
reported between the antihyperglycemic agents sulphonylureas and the antihypertensive
agents angiotensin-converting enzyme (ACE) inhibitors (Arauz-Pacheco et al. 1990;
Herings et al. 1995; Moore et al. 1997; Morris et al. 1997; Thamer et al. 1999).
Together these compounds decrease blood glucose concentration more than
sulphonylureas alone and might cause hypoglycemic episodes in patients with type 2
diabetes mellitus. The mechanism of the interaction is not known.

2
El-Batran and co-workers (2004) reported that fosinopril (ACE inhibitor) and gliclazide
(sulphonylurea) administered together cause a greater hypoglycemic effect in control
rats and in a rat model of diabetes than gliclazide alone. On the basis of the study,
gliclazide and fosinopril were chosen for test items for the current study. The main
purpose of the study was to clarify the mechanism of the interaction between
sulphonylureas and ACE inhibitors. Since a pathological condition, for example type 2
diabetes mellitus, might have an effect on the pharmacokinetics of drugs, the purpose
was also to compare the interaction in control rats and in an animal model of type 2
diabetes mellitus. No known single animal species is exactly identical to human
diabetes in all its complexity. However, different models can be used as tools for
studying the onset, the mechanisms and the treatment of type 2 diabetes mellitus. Goto-
Kakizaki (GK) rat model was chosen for this study because it is widely known, well
characterized and versatile.
This work consists of two parts: the literature review and the experimental study. The
aim of the literature review was to consider type 2 diabetes mellitus as a disease and to
acquaint with the medication. Another purpose was to clarify different mechanisms of
interactions and to describe some of the typical interactions. In addition to these, the
aim was to concentrate on the characteristics of various rat disease models and their use
in research. The aim of the experimental study was to investigate the hypoglycemic
interaction of fosinopril and gliclazide in control rats and in rat model of diabetes by
examining the effects of fosinopril on the pharmacokinetics of gliclazide. Also the
effects of experimental diabetes on pharmacokinetics of gliclazide after single and
repeated dosing were studied. To study the pharmacokinetics of the test items,
approximately 700 plasma samples were collected after single and repeated p.o. and/or
i.v. administration. A high performance liquid chromatography tandem mass
spectrometry (HPLC-MS/MS) method was developed for the measurement of the test
item concentrations in the plasma samples and the pharmacokinetic parameters were
determined. Blood glucose concentrations were determined regularly during the study
to explore the effects of the test items on blood glucose. Oral glucose tolerance (OGT)
test was also performed at baseline and in the end of the study.

3
I REVIEW OF THE LITERATURE
2 TYPE 2 DIABETES MELLITUS
Diabetes mellitus is a group of diseases characterized by chronic hyperglycemia and
other metabolic abnormalities resulting from the deficient action of insulin. Diabetes
has several disabling complications and if untreated, it will lead to death. Subjects with
diabetes have a lower life expectancy (Gu et al. 1998). The cause of diabetes is partly
unknown. Inheritance is a very important factor as well as external factors, such as diet
and former diseases. There are almost 300 million adults in the world with diabetes and
90-95% of them have type 2 diabetes mellitus (Shaw et al. 2010, International Diabetes
Federation 2011).
2.1 The role of insulin
Insulin is a hormone secreted by the -cells in the islets of Langerhans (Cheatham and
Kahn 1995). The most important factor stimulating endogenous insulin release is the
elevation of plasma glucose concentration in the circulation. After meals carbohydrates
absorb from the bowel to the circulation and the blood glucose level rises. As a result,
the insulin secretion from the -cells in the pancreas increases. Glucose enters the
pancreatic -cells using glucose transporter 2 (GLUT2) (Navarro-Tableros et al. 2007).
This leads to a reduction of efflux of the adenosine triphosphate (ATP) -dependent K+-
channel and depolarization. The depolarization causes the opening of the voltage-gated
Ca2+
-channels and influx of Ca2+
-ions. Insulin granules are then released from vesicles
into the blood stream by exocytosis. Insulin rapidly lowers blood glucose concentration
and this in return diminishes the release of insulin and insulin levels return to basal
values (Cheatham and Kahn 1995). Normal pancreas produces small amounts of insulin
constantly to control the function of liver and the basal metabolism.
There are insulin receptors all over the body, but the most essential tissues for insulin
action are the liver, the muscular tissue and the adipose tissue (Cheatham and Kahn

4
1995). Insulin affects the metabolism of glucose, lipids and proteins. In the muscular
and the adipose tissue, insulin enhances the intake of glucose into the tissues. In the
muscular tissue, it also enhances the storing of glucose into glycogen. In the liver,
insulin enhances the storing of glucose by inhibiting gluconeogenesis and
glycogenolysis and by enhancing the production of glycogen. Insulin also affects the
metabolism of lipids. Insulin reduces the lipolysis and the concentration of free fatty
acids and enhances the storing of triglycerides. In the liver, insulin stimulates the
formation of fatty acids and triglycerides. In the adipose tissue, insulin enhances the
intake of fatty acids and the synthesis of triglycerides. In addition to this, insulin
enhances the protein synthesis and the intake of amino acids. Insulin also reduces the
catabolism of proteins.
2.2 Characters of type 2 diabetes mellitus
Type 2 diabetes mellitus is characterized by insulin resistance and disordered insulin
secretion from the pancreas (WHO 1999). Type 2 diabetes mellitus develops as a result
of -cell dysfunction, peripheral insulin resistance and elevated hepatic glucose
production. However, it is not known which is the primary abnormality and which are
abnormalities secondary to the elevated plasma glucose, so-called glucose toxicity.
Years before the diagnosis of type 2 diabetes mellitus, patients already might have signs
of insulin resistance. The effect of insulin is deranged and the intake of glucose into
cells is decreased. To compensate this, the pancreas produces more insulin. Over time
the insulin producing cells in the pancreas deplete, which leads to elevated blood
glucose levels and the onset of diabetes. Over the years the production of insulin from
the pancreas deteriorates further and in the end the use of exogenous insulin is needed.
About one third of all people have a genetic tendency for diabetes. If one of the parents
has type 2 diabetes mellitus, the risk of the child to fall ill is 40%, and if both of the
parents have type 2 diabetes mellitus, the risk of the child to fall ill is 70% (Groop and
Tuomi 1997). If normal weight and physical activity are maintained, the genetic burden
seldom leads to the onset of diabetes (Tuomilehto 2001). However, abdominal obesity
and lack of exercise easily trigger type 2 diabetes mellitus. On the other hand, a weight

5
loss of only a few kilograms can prevent or delay the onset of diabetes for many years.
Caloric reduction and regular exercise showed a 58% reduction in the progression to
diabetes in people with impaired glucose tolerance (Knowler et al. 2002). The risk
factors causing type 2 diabetes mellitus are obesity, especially abdominal obesity,
decreased glucose tolerance, gestational diabetes, lack of exercise, a family burden, high
age, metabolic disorder, a fatty diet, and smoking (Lyssenko et al 2008; Järvelä et al.
2006). Many patients having type 2 diabetes mellitus also suffer from the metabolic
disorder. Especially people with one or more risk factors for type 2 diabetes mellitus
should pay special attention to life style changes.
Type 2 diabetes mellitus is difficult to diagnose since there are no radical symptoms
included and thus it has often been latent for years before the diagnosis (Harris 1993).
Usually type 2 diabetes mellitus is diagnosed by chance during routine doctor’s
appointments or when diabetic complications appear. By that time the disease may
already have caused damage in the body and many complications of type 2 diabetes
mellitus may be present (UKPDS 1990a). These are for example retinopathy,
nephropathy and neuropathy. If diabetes is diagnosed early, the risk of complications is
smaller (Colagiuri et al. 2002). In Finland, type 2 diabetes mellitus is diagnosed when
the fasted blood glucose concentration (fP-gluk) is greater than 7.0 mmol/L (or 11
mmol/L with clear diabetic signs) or when the two-hour value of the glucose tolerance
test is more than 11 mmol/L or when HbA1c exceeds 6.5% (Käypä hoito
recommendation 2011). A person is said to be prediabetic if the two-hour value is
between 7.8-11.0 mmol/L and the state is called Impaired Glucose Tolerance (IGT). If
the fasted blood glucose value is slightly elevated (6.1–6.9 mmol/L), the state is called
Impaired Fasting Glucose (IFG). A raised amount of glycosylated glucose (HbA1c) in
blood is a sign of elevated blood glucose values during a longer time.
2.3 Other subtypes of diabetes mellitus
The main types of diabetes are type 1 and type 2 diabetes mellitus, formerly known as
juvenile diabetes and adult-onset diabetes (WHO 1999). However, diabetes can be
divided into several etiological subgroups. Type 1 diabetes, Maturity Onset Diabetes of

6
the Young (MODY), Latent Autoimmune Diabetes of Adults (LADA) and gestational
diabetes will be described in more detail. The boundaries between different types of
diabetes are very hazy and many patients have features of several types. The disease can
also change over time.
Type 1 diabetes is the second most common type of diabetes in Finland (Reunanen
2006). About 45 000 patients have type 1 diabetes. The cause of type 1 diabetes is the
destruction of insulin producing islets of Langerhans, which leads to depletion of
insulin and thus rise of blood glucose concentration (WHO 1999). Type 1 diabetes can
be idiopathic or it can be caused by an autoimmune reaction. The cause of the more
common autoimmune type is still unknown. The only treatment for type 1 diabetes is
the use of exogenous insulin. Although more than 85% of patients with type 1 diabetes
do not have a family history for the disease, the onset of type 1 diabetes is strongly
influenced by genetic predisposition (Steck and Rewers 2011). If one child in the family
has type 1 diabetes, the risk of the other children to fall ill is 5-10%. If father has
diabetes, child has a risk of approximately 12% and if mother has diabetes, a risk of 6%
to fall ill by the age of 20 years.
LADA is similar to type 1 diabetes mellitus characterized by slow onset and some
features of type 2 diabetes mellitus (Turner et al. 1997; Tuomi et al. 1999). The criteria
for LADA have been suggested to be adult age at onset (>35 years), presence of
circulating glutamic acid decarboxylase (GAD) antibodies and absence of a requirement
for insulin at diagnosis. LADA accounts for about 10% of all cases of diabetes
(Niskanen et al. 1995).
Less than 5% of subjects with diabetes have MODY (Velho and Froguel 1998). This
disease is inherited dominantly meaning that if one of the parents has MODY, half of
the children develop it (Tattersall and Fajans 1975). MODY develops already at young
age and usually the patients are normal weight (Velho and Froguel 1998). There are
many types of MODY. Usually the blood glucose concentration is only mildly elevated
and it can be treated by diet or using oral diabetic medication. Some MODY types
require use of exogenous insulin at later age.

7
Gestational diabetes means the elevation of blood glucose concentration during
gestation (Ali and Dornhorst 2011). This is caused by insulin resistance and depleted
insulin secretion, and it might be fatal for the fetus. The most important treatment of
gestational diabetes is a healthy diet but insulin treatment is also used when needed.
Blood glucose concentrations normalize after labor but if untreated, these women are in
danger of developing diabetes. For example in the study of Järvelä et al. (2006), 4.6%
of women with gestational diabetes developed type 1 and 5.3% type 2 diabetes mellitus
during six following years.
Diabetes can as well be caused by secondary reasons such as infections, diseases of the
exocrine pancreas, endocrinopathies or genetic defects in insulin action (WHO 1999).
Also drugs or chemicals can induce diabetes.
2.4 Chronic complications of diabetes
Type 2 diabetes mellitus is associated with severe and disabling comorbidities. High
blood glucose concentrations increase the risk of diabetic micro- and macrovascular
complications (UKPDS 1998a; Stratton et al. 2000; Holman et al. 2008 a). The risk of
complications can roughly be evaluated by measuring the values of glycosylated
hemoglobin (glycohemoglobin, HbA1c), which reflects the long-term glucose balance of
blood (Stratton et al. 2000). According to Stratton and co-workers each 1% reduction in
mean HbA1c was associated with reductions in risk of 21% for any end point related to
diabetes, 21% for deaths related to diabetes, 14% for myocardial infarction, and 37%
for microvascular complications. The lowest risk is in the normal range of HbA1c
(HbA1c values <6.0%).
The effort to keep glycemia near normal should be maintained by a combination of diet,
exercise and drug therapy (UKPDS 1990b; Turner et al. 1999; Manley et al. 2000). The
strict control of blood pressure is also important because it helps preventing the diabetic
complications (UKPDS 1998a; UKPDS 1998b; Adler et al. 2000). It is expected that
the incidence of diabetic complications will be reduced by periodic monitoring of
8
glycemic parameters and by appropriate treatment (Holman et al. 2008a; Matthews et
al. 2004).
2.4.1 Nephropathy
In diabetic nephropathy excessive albumin is filtrated into urine. Almost 20% of all
patients diagnosed with type 2 diabetes mellitus already have symptoms of
microalbuminuria (Cull et al. 1993). Untreated microalbuminuria might turn into overt
proteinuria and eventually renal disease (Retnakaran et al. 2006). A small amount of
protein in urine is harmless but greater amounts cause among other things nephritic
syndrome and kidney impairment. Dialysis or a kidney transplant might be needed
(Adler et al. 2003). Subjects with nephropathy also have a greater risk of dying due to
cardiovascular reasons. The progression of diabetic nephropathy can be prevented or
slowed down with medication (Retnakaran et al. 2006). Especially hypertension and
hyperglycemia need to be controlled. Angiotensin converting enzyme inhibitors and
angiotensin II receptor blockers have been shown to have renoprotective effects and to
prevent the development of microalbuminuria in subjects with diabetes and
hypertension (HOPE 2000; Parving et al. 2001; Ruggenenti et al. 2006). Smoking,
heredity and hyperlipidemia are some of the risk factors for diabetic nephropathy
(Retnakaran et al. 2006).
2.4.2 Cardio vascular disease
Arteriosclerosis and diseases attached to it, like heart failures, strokes and cerebral
bleedings, are 2-3 times more common among patients with diabetes than in the rest of
the population (Gu et al. 1998). Cardiovascular disease (CVD) is the major cause of
death in people with diabetes, accounting in most populations for 50% or more of all
diabetes fatalities (Turner et al. 1998). CVD is associated with typical features in type 2
diabetes mellitus patients: increased HbA1c, fasting plasma glucose concentration,
systolic blood pressure, triglyceride concentration, increased concentrations of low-
density lipoprotein cholesterol, decreased concentrations of high-density lipoprotein
cholesterol and a history of smoking. The risk of CVD can be reduced using routine

9
anticoagulation medication therapy and an efficient antihypertensive medication (Davis
et al. 1999; Holman et al. 2008b).
2.4.3 Retinopathy
Retinopathy is an illness of the retina. Retinopathy manifests among other things as
intraretinal or -vitral bleeding, microinfarctions, angiogenesis and retinal dislocation.
These can lead to temporary or lasting visual disturbances. Regular observations need to
be done for patients with type 2 diabetes mellitus to discover already the early changes
in the eyes (Kohner et al. 1999). Microaneurysms are the first clinically recognized
signs and they strongly predict the onset of diabetic retinopathy. About every third of
type 2 diabetes mellitus patients have retinopathy at diagnosis (Kohner et al. 1998). The
most important cause for the retinopathy is the high blood glucose level, but other risk
factors are hypertension and low serum insulin level. Tight blood pressure control
prevents the risk of clinical complications from diabetic retinopathy (Matthews et al.
2004). A healthy life style and an effective medical treatment are the best ways to
prevent retinopathy.
2.4.4 Neuropathy
The cause of diabetic neuropathy is not known. Neuropathy causes aches, muscular
debility and numbness. It is thought that neuropathy may be caused by excessive
glucose piling up in the nerves and then turning into sorbitol, which causes swelling and
disturbs the function of the nerves (Ziegler 2006). Diabetic neuropathy can be
autonomic or somatic. Somatic neuropathy damages sensory nerves or motor nerves.
Autonomic neuropathy affects for example the bowel movements. When the circulation
and the sense of touch in the lower limbs deteriorate, it may cause difficult long-term
wounds and infections. Even amputation might be needed and it is one of the most
common reasons for the lower limb amputations (Abbott et al. 1998). Approximately
16-26% of all patients with diabetes develop chronic neuropathic pain (Daousi et al.
2004). Poor glycemic control is a risk factor for diabetic neuropathy in type 2 diabetes
mellitus and thus a constant treatment of hyperglycemia is essential for the prevention

10
of neuropathy (Adler et al. 1997). Other risk factors are age and height (Adler et al.
1997) as well as alcohol consumption, smoking, hypertension and visceral obesity
(Ziegler 2006).
3 MEDICATION OF TYPE 2 DIABETES MELLITUS
One of the main goals in the treatment of diabetes is to normalize the blood glucose
levels. This improves the condition of the patient and effectively prevents diabetic acute
and chronic complications (Holman et al. 2008a). The target values in the treatment of
type 2 diabetes mellitus in Finland are < 7.0% for HbA1c, 4-6 mmol/L for fasting
plasma glucose and < 8 mmol/L for postprandial plasma glucose (circa two hours after)
according to Käypä hoito recommendations (2011). Type 2 diabetes mellitus patients
have a significantly higher risk of atherosclerosis and strokes (Gu et al. 1998). It is very
important to prevent these states. A healthy diet, exercise and weight loss have a
positive effect on the blood glucose levels and the risk of strokes and atherosclerosis
(Manley et al. 2000). In addition to these life style factors, there are several medications
available (Table 1). The drugs mentioned here are all available on the Finnish market.
In addition to antihyperglycemic medication, type 2 diabetes mellitus patients typically
also have medicines for hypertension and cholesterol and a low-dose acetylsalicylic acid
for the prevention of thrombi. These additional medications reduce the risk of diabetic
complications (UKPDS 1998a; UKPDS 1998b; Davis et al. 1999; Adler et al. 2000).
The first medication, in addition to life style changes, to be used in the treatment of type
2 diabetes mellitus in Finland is metformin (Käypä hoito recommendations 2011).
Metformin treatment will usually be started already during the diagnosis phase and after
3-6 months the efficiency of the treatment will be evaluated. Metformin and the life
style changes will be continued, but if the HbA1c value is more than 6.5%, an additional
medication will be added. If the symptoms are mild, another oral hypoglycemic agent
will be chosen, but if the symptoms are severe, insulin or an incretin mimetic treatment
will be started. If HbA1c value after this exceeds 6.5%, a third oral agent will be added
or, alternatively, insulin or incretin mimetic will be started at this point. If metformin

11
and two oral agents will not keep the HbA1c value under 6.5%, insulin or an incretin
mimetic treatment will still be added. If the HbA1c value is more than 7%, an enhanced
insulin treatment is needed.
Table 1. Drugs for type 2 diabetes mellitus available on Finnish market.
Group of drugs Drug
Biguanides Metformin
Sulphonylureas Glibenclamide
Glimepiride
Glipizide
Glinides Nateglinide
Repaglinide
α-glucosidase inhibitors Acarbose
Miglitol
Thiazolidinediones (glitazones) Pioglitazone
Rosiglitazone
DPP-4 inhibitors (gliptins) Saxagliptin
Sitagliptin
Vildagliptin
Incretin mimetics Exenatide
Liraglutide
Other Guar gum
Insulin
3.1 Biguanides
The only biguanide on the Finnish market is metformin. Phenformin and buformin were
withdrawn from the market in most countries due to toxic effects (Williams and Palmer
1975). The mechanism of action of metformin is not completely known. It seems to
lower the blood glucose concentrations by preventing the gluconeogenesis (generation
of glucose) in the liver (Hundal et al. 2000) and by enhancing the insulin sensitivity of
muscles by enhancing the glucose intake and metabolism (Nosadini et al. 1987).
Metformin might also slow down the rate of absorption of glucose from the small
12
intestine. Metformin might help reduce weight (Morgan et al. 2011) and it also lowers
the serum triglyceride and cholesterol levels (Landin et al. 1991; DeFronzo et al. 1995).
It also might lower the elevated blood pressure (Landin et al. 1991). In the Diabetes
Prevention Program study, metformin reduced the risk of progression from impaired
glucose tolerance to type 2 diabetes mellitus by 31 % compared to placebo (Knowler et
al. 2002).
The most common side effects of metformin are abdominal, such as lack of appetite,
pain and diarrhea (DeFronzo et al. 1995). The absorption of vitamin B12 and folate often
decrease during metformin therapy but that rarely causes clinical problems. Metformin
absorbs slowly from the small intestine and the bioavailability is only 50-60 %
(Pentikäinen et al. 1979; Tucker et al. 1981). Metformin has a volume of distribution of
63-276 litres, it does not bind to the plasma proteins and it is secreted unchanged to the
urine. Metformin clearance is significantly affected by the renal clearance. The plasma
half-life of metformin is 1.5-4 hours. Metformin binds to red blood cells and the half-
life of blood is significantly longer, 17 hours.
3.2 Sulphonylureas
Sulphonylureas (glibenclamide, glimepiride and glipizide) lower the blood glucose
concentration by activating endogenous insulin production in the pancreas (Rendell
2004). They act by binding to the sulphonylurea receptors 1 (SUR1) located near the
ATP-dependent K+-channel on -cells and inhibit potassium ion efflux through the
channel like glucose. This eventually leads to the release of insulin. A long-term
sulphonylurea treatment improves the impact of insulin in the liver, adipose and
muscular tissues (Kolterman and Olefsky 1984). It is not known, however, whether this
is caused by the improved glucose metabolism or directly by the drug, possibly through
an extrahepatic mechanism. The most important of the scarce side effects of
sulphonylureas is hypoglycemia (Rendell 2004). Irritation in the digestive tract and liver
dysfunctions are also possible. Sulphonylureas also cause weight gain. All
sulphonylureas absorb well and relatively fast from the digestive tract. They bind
relatively strongly to proteins in the serum and they are eliminated by metabolism in the

13
liver. Their elimination half-life varies from 3 (glipizide) to 10 hours (glibenclamide)
but their effect lasts clearly longer.
3.3 Glinides
Glinides (repaglinide and nateglinide) are novel insulin secretagogues with a similar but
slightly different mechanism of action as the sulphonylureas (Balfour and Founds 1998;
Dunn and Faulds 2000). Nateglinide binds at the same site in the -cells on the SUR1-
receptor as the sulphonylureas, whereas repaglinide binds at a different but nearby site
causing the closure of ATP-dependent K+-ion channels. Glinides improve the prandial
early-phase insulin secretion and reduce the post-prandial glucose peaks in blood. They
absorb rapidly and act fast and effectively but are quickly eliminated. Due to this, the
insulin levels between meals are normal and thus the risk of hypoglycemia is smaller.
The elimination half-life of glinides is only approximately 1 hour. Glinides are almost
entirely metabolized. The most important but scarce side effect of glinides is
hypoglycemia.
3.4 -glucosidase inhibitors
-glucosidase inhibitors (such as acarbose) competitively and reversibly prevent -
glucosidase enzyme in the mucous membrane of small intestine (Bischoff 1994). -
glucosidase enzyme chops prandial carbohydrates into monosaccharides. This inhibition
delays the cleavage of large unabsorbable carbohydrates into absorbable
monosaccharides and thus lowers the postprandial blood glucose concentration peak.
Fasting blood glucose values are not significantly changed. In the Study to Prevent
Noninsulin-Dependent Diabetes Mellitus (STOP-NIDDM) trial, acarbose reduced the
risk of progression from impaired glucose tolerance to type 2 diabetes mellitus
(Chiasson et al. 2002). Acarbose also led to a remarkable reduction in the incidence of
cardio vascular diseases and hypertension (Chiasson et al. 2003). Only 1-2 % of
acarbose is absorbed and therefore systemic side effects are scarce (Holman et al 1999).
The most relevant side effects are flatulence, abdominal pain and diarrhea.

14
3.5 Glitazones
Thiazolidinediones (pioglitazone, rosiglitazone), also known as glitazones, lower the
blood glucose concentration by reducing insulin resistance in the adipose tissue, skeletal
muscles and liver (Day 1999). They are agonists of the peroxisome proliferator
activated receptor PRAR-receptor in the nucleus and by activating the receptor they
regulate the expression of several genes involved in glucose and lipid metabolism.
Glitazones increase peripheral glucose disposal for example by increasing the glucose
uptake and decrease hepatic glucose output by reducing gluconeogenesis and
glycogenolysis. Glitazones mostly have a positive effect on the lipid metabolism (King
2000). Pioglitazone reduces low-density lipoproteins (LDL) and triglycerides whereas
rosiglitazone slightly increases them. Pioglitazone also increases high-density
lipoproteins (HDL) but rosiglitazone has no effect on it. Glitazones cause weight gain
and edema as side effects. They also cause decreased bone mineral density in both men
and women, which is a risk factor for fractures (Yaturu et al 2007, Scwarz and
Sellmeyer 2008). Pioglitazone absorbs fast and it strongly binds to the plasma proteins.
Half-life of pioglitazone in plasma is approximately 5 hours. In 2010 Food and drug
administration (FDA) recommended that rosiglitazone would be withdrawn from the
market due to an increase in cardiovascular risks (Mullard 2011).
3.6 Gliptins
Gliptins or dipeptidyl peptidase-4 (DPP-4) inhibitors (sitagliptin, vildagliptin,
saxagliptin) are a novel class of type 2 diabetes mellitus drugs. They prevent the activity
of the incretin hormones-degrading DPP-4 enzyme (Ahrén 2009). GLP-1 (glucagon-like
peptide-1) and GIP (glucose-dependent insulinotropic polypeptide) are endogenous
incretin hormones secreted in the gastrointestinal tract (Baggio and Drucker 2007).
GLP-1 and GIP both stimulate insulin secretion from the pancreas and GLP-1 also
inhibits the release of glucagon from the pancreas. Native GIP and GLP-1 are quickly
degraded by DPP-4 enzyme. Inhibition of DPP-4 enzyme prolongs the effect of GLP-1
and GIP in the system and enhances the glycemic control (Ahrén 2009). Gliptins thus
lower blood glucose values. Because GLP-1 and GIP are secreted in the presence of

15
glucose, secretion of insulin is mainly stimulated after meals, and the risk of
hypoglycemia using DPP-4 inhibitors between meals is therefore minimal. Due to the
recent availability of gliptins, the effects of the long-term use are not known well.
Sitagliptin, vildagliptin and saxagliptin are all very selective and strong DPP-4
inhibitors (Ahrén 2009). They are all safe and well tolerated. Adverse effects, including
hypoglycemia, headache and different infections, are very rare. Gliptins do not have any
effect on body weight. Gliptins absorb fast and their biological availability is good
(Scheen 2010a). Gliptins do not significantly bind to plasma proteins. Sitagliptin is
mostly secreted unchanged into the urine and only a small part is metabolized whereas
metabolism is the main elimination route of vildagliptin. Saxagliptin is eliminated in the
liver and kidneys. The elimination half-life of gliptins varies from 2-3 hours for
vildagliptin and saxagliptin to 12.5 hours for sitagliptin.
3.7 Incretin mimetics
Incretin mimetics (exenatide, liraglutide) are GLP-1-analogs, which bind to GLP-1-
receptors and act as endogenous GLP-1 (Kolterman et al. 2005; Ryan and Hardy 2011).
The structures of exenatide and liraglutide are similar with the GLP-1 but they are
modified in a way, which enables them to absorb slower and affect significantly longer
before cleavage by DPP-4 enzyme. Incretin mimetics reduce postprandial and fasting
blood glucose levels in type 2 diabetes mellitus patients by increasing the secretion of
insulin after meals. Due to their protein structure incretin mimetics can not be
administered orally but require a subcutaneous injection once or twice a day.
Exenatide and liraglutide are slowly absorbed after a subcutaneous injection and they
both strongly bind to plasma proteins (Kolterman et al. 2005; Ryan and Hardy 2011).
The exact route of elimination is not clear. As side effects incretin mimetics cause
nausea, vomiting and mild hypoglycemia. Acute pancreatitis and acute necrotizing or
hemorrhagic pancreatitis has been found in patients receiving incretin mimetics but the
causality is not clear. Exenatide and liraglutidi have an advantage in producing a
significant weight loss. The mechanism is thought to be their ability to slow gastric
16
emptying and reduce food intake. Incretin mimetics might also reduce blood pressure
and cholesterol values.
3.8 Insulin
Type 2 diabetes mellitus is a progressive disease, which as time goes on is more
challenging to manage (Peters 2011). As the production of the endogenous insulin
production depletes, most patients with type 2 diabetes mellitus eventually will start
using exogenous insulin. Since insulin is a peptide hormone, it decomposes if it is
administered orally and insulin is thus administered subcutaneously or intramuscularly.
Exogenous insulin possesses a similar effect in the body as the endogenous insulin.
Insulin is metabolized by insulinase enzyme. All insulin products nowadays are fully or
at least partly synthetic. The differences between insulin products are in the length of
action, Cmax, origin and formulation. The most common side effect of insulin is
hypoglycemia. Typical are also reactions in the injection site and weight gain.
3.9 Guar gum
Guar gum is a gel forming fiber product, which activates in the gastrointestinal track
and slows down the absorption of carbohydrates (Uusitupa et al 1990). In combination
with other diabetic medication it lowers the postprandial blood glucose concentration
peaks. It also lowers the serum cholesterol levels. Guar gum can cause diarrhea and
flatulence as side effects.
4 ANIMAL MODELS OF TYPE 2 DIABETES MELLITUS
Animal models used for the research of type 2 diabetes mellitus are mostly rats and
mice (Srinivasan and Ramarao 2007). Rodents are applicable because they are small,
easily available and inexpensive and they reproduce quickly. No known single animal
species is exactly identical to human diabetes in all its complexity. However, different

17
models can be used as tools for studying the onset, the mechanisms and the treatment of
type 2 diabetes mellitus.
Table 2. Classification of type 2 diabetes mellitus in animals (Srinivasan and Ramarao
2007).
Model category
Obese Non obese
I Spontaneous or
genetically ob/ob mouse Cohen diabetic rat
derived diabetic animals db/db mouse GK rat
KK mouse Torri rat
KK/Ay mouse (Akita) mutant mouse
NZO mouse
NONcNZO10 mouse ALS/Lt mouse
TSOD mouse
M16 mouse
Zucker fatty rat
ZDF rat
SHR/N-cp rat
JCR/LA-cp rat
OLETF rat
Obese rhesus monkey
II Diet/nutrition induced Sand rat ---
diabetic animals C57/BL 6J mouse
Spiny mouse
III Chemically induced
diabetic animals
GTG treated obese mice Low dose ALX or STZ adult rats,
mice etc.
Neonatal STZ rat
IV Surgical diabetic animals VMH lesioned dietary obese
diabetic rat
Partial pancreatectomized animals
e.g. dog, primate, pig and rats
V Transgenic/knock-out
diabetic animals
β3 receptor knockout mouse Transgenic or knock out mice
involving genes of insulin and
insulin receptor and its
components of downstream insulin
signaling e.g. IRS-1, IRS-2,
GLUT-4, PTP-1B and other
Uncoupling protein (UCP1)
knock-out mouse
PPAR-γ tissue specific knockout
mouse
Glucokinase or GLUT 2 gene
knockout mice
Human islet amyloid polypeptide
overexpressed rat (HIP rat)
KK, Kuo Kondo; KK/Ay, yellow KK obese; VMH, ventromedial hypothalamus; ZDF, Zucker diabetic fatty; NZO, New Zealand
obese; TSOD, Tsumara Suzuki obese diabetes; SHR/N-cp, spontaneously hypertensive rat/NIH-corpulent; JCR, James C Russel;
OLETF, Otuska Long Evans Tokushima fatty; GTG, gold thioglucose; ALX, alloxan; STZ, streptozotocin; GLUT-, glucose transporter;
IRS, insulin receptor substrate; GK, Goto-Kakizaki; PPAR, Peroxisome proliferator activated receptor, PTP, phosphotyrosine
phosphotase; ALS, alloxan sensitive
Type 2 diabetic models

18
There are several ways to induce diabetes and to create an animal model of diabetes.
The disease and the symptoms might be spontaneously developed, they might be
generated using a special diet or they can be caused by chemical exposure or by surgical
manipulations (Srinivasan and Ramarao 2007). In recent years, a number of new models
have also been developed using genetic engineering or molecular biological techniques
including transgenic and knock-out mice. Different animal models of diabetes have
been mentioned in Table 2. Some rat models are then introduced as examples.
4.1 Chemically induced rat model of diabetes
One of the simplest and most common ways to generate diabetes is the induction using
chemicals. Diabetes can be induced using many chemicals, such as vacor and dithizone,
but alloxan and streptozotocin are the most common ones (Rees and Alcolado 2004).
Chemical induction of diabetes is widely used because it is economical and easy.
Alloxan induced diabetes was first discovered incidentally in 1943 when Dunn et al.
(1943) were studying the effects of different substances on the kidneys of rabbits.
Alloxan first caused low blood glucose values in the rabbits but shortly after a
remarkable hyperglycemia. Histological studies showed significant necrosis of the
pancreatic islets. Alloxan selectively destroys pancreatic β-cells (Rerup 1970). Alloxan
induced diabetes causes the classical symptoms of human diabetes like acidosis,
polyphagia, hyperglycemia, polydipsia, polyuria, glucosuria and ketonuria (Srinivasan
and Ramarao 2007). Alloxan treated animals also develop diabetic complications such
as neuropathy, retinopathy and cardiomyopathy. In addition to rabbits, alloxan has also
been discovered to induce diabetes in the cat, dog, hamster, man turtle, monkey, mouse,
pigeon, rat and sheep (Rerup 1970).
Alloxan induced diabetes is not, however, permanent (Lazarow 1952, Bunnag et al.
1967). Especially if the alloxan dose is too small, the effect of alloxan can be overruled
by the ability of the pancratic cells to regenerate. This sets limits to the duration of the
studies using alloxan rats. Another disadvantage in this model is that the mechanism of
alloxan induced diabetes is very different from human diabetes (Lukens 1948). The
symptoms are similar but the disease is not.

19
Because of the limitations of alloxan, streptozotocin has recently become more common
for induction of diabetes in laboratory animals. A single large dose of streptozotocin
leads to the development of type 1 diabetes, but several small doses neonatally or soon
after birth produce type 2 diabetes mellitus in the adult age (Portha et al. 1974).
Streptozotocin specifically causes irreversible necrosis in the β-cells leading to
reduction in β-cell mass and insulin deficiency (Junod et al. 1967). At 8-10 weeks of
age rats neonatally treated with streptozotosin reflect mild basal hyperglycemia,
impaired glucose tolerance (Portha et al. 1979) and a loss of -cell sensitivity to glucose
(Giroix et al. 1983). Streptozotocin causes diabetes in the dog, guinea pig, hamster,
monkey, mouse and rat (Rerup 1970). Streptozotocin can also be used together with
nicotinamide (Masiello et al. 1998). A right amount of nicotinamide prior to
streptozocin injections to rats protects the pancreatic -cells from a total destruction.
With the 40% preservation of the pancreatic insulin stores, the produced stage better
resembles human type 2 diabetes mellitus than with the streptozocin given alone. A too
large amount of nicotinamide reverses the effects of streptozocin.
4.2 Spontaneous or genetically derived rat model of diabetes
Goto-Kakizaki (GK) rat is a widely used animal model for the research of type 2
diabetes mellitus and the comormidities related to it (Portha 2005). GK rat is used as an
animal model in the experimental part of this study because it is well characterized and
it is suitable for the study of the test items. Another suitable model would have been
Zucker Diabetic Fatty (ZDF) rat. Thus GK and ZDF rats are described and compared
here in more detail than the other rat models of diabetes.
4.2.1 Goto-Kakizaki rats
The Goto-Kakizaki (GK) rat strain was developed in Japan, Sendai at Tohoku
University by Goto and Kakizaki in 1973 (Goto et al. 1976). They performed an oral
glucose tolerance (OGT) test to 211 normal Wistar rats and chose 18 of them having a
reduced glucose tolerance. They mated them and continued by selective breeding using
glucose tolerance as the selection index. After the 10th
generation all of the offspring

20
had a diabetic glucose tolerance test and the diabetic state became stable after the 30th
generation (Goto et al. 1988). The first signs of glucose intolerance in GK rats are seen
at the age of two weeks but the stage becomes prominent at 8 weeks of age (Goto et al.
1988).
GK rats do not have a tendency for obesity (Goto and Kakizaki 1981). In fact, they are
slightly leaner than the sex- and age-matched normal Wistar rats. The progression of the
diabetic stage of GK rats is shown in Table 3. The genetic background of GK rats has
been studied in order to better understand the mechanism of type 2 diabetes mellitus
(Galli et al. 1996, Gauguier et al. 1996). Already Goto and coworkers (1981) suspected
that the inheritance of type 2 diabetes mellitus in GK rats is polygenic, but is was shown
when Gauguier and coworkers (1996) found 6 independent loci responsible for example
for hyperglycemia, glucose intolerance and altered insulin secretion.
Table 3. Progression of diabetic state in Goto-Kakizaki rats. Modified from Movassat et
al. 2007
FETAL SUCKLING ADULT
-cell mass Reduced Reduced Reduced
Blood glucose
concentration
Normal Basal hyperglycemia; glucose
intolerance
-cell secretory
function
Normal Defective; defective postprandial
insulin secretion
Hepatic glucose
production
Increased
Insulin resistance Hepatic after 4 weeks, peripheral
after 8 weeks
Other defects Islet inflammation, angiopathy and
fibrosis
Glomerulopathy, neuropathy,
nephropathy, retinopathy
In 1988, a colony of GK rats was started in Paris using breeding pairs from the 35th
generation of the original colony (Portha et al. 1991) and in 1980 a colony was started
in Stockholm using pairs from the 40th
generation (Abdel-Halim et al. 1993). There are
small differences between the different colonies of GK rats but the characteristics are
very similar (Portha et al. 1991, Portha 2005). All GK rats have a mild hyperglycemia
as early as 4 weeks after birth with elevated non-fasting blood glucose concentrations

21
(10-14 mmol/L) compared to Wistar control rats (6-8 mmol/L). Already at an early age
(4 weeks old) GK rats show some signs of insulin resistance in the liver (Picarel-
Blanchot et al. 1996). At an older age (8 weeks old) GK rats show remarkable insulin
resistance also in the skeletal muscles and the adipose tissue (Bisbis et al. 1993). The
non-fasting plasma insulin levels of GK rats are also deranged. Murakawa et al. (2002)
reported hyperinsulinemia in GK rats at the age of two months and hypoinsulinemia at
the age of 18 months, although according to Portha et al. (1991) GK rats were
hyperinsulinemic during the entire 32-week follow-up. The glucose-induced insulin
release in GK rats is sluggish and delayed, and the total concentration of insulin in
blood after a glucose load is significantly smaller than in Wistar rats (Goto et al. 1981).
Both the early and the late phase of glucose-induced insulin release, which are also seen
in humans, are decreased in GK rats (Goto et al. 1988). The impairment of glucose-
induced insulin response as well as the glucose intolerance have maintained relatively
stable over the generations in all different colonies (Portha 2005).
Differences between colonies have, however, been seen in -cell number, insulin
content and islet metabolism. Decreased size of the pancreatic islets and reduced
number of -cells in GK rats were described already by Goto et al. in 1988. Goto and
Kakizaki (1981) also reported earlier that the shape of the islets of the pancreata of GK
rats changed from round to irregular starfish shape by the age of four months. Movassat
et al. (1997) showed that in the colony of Paris, the relative volume and the total mass
of the -cells in GK rats are significantly decreased already at the neonatal age. The
relative volume represents only 38% and the total mass only 23% of the values of age-
related control rats. Movassat et al. also noticed that the pancreatic insulin contents
were significantly smaller in GK rats, only 23% of the value of control rats. The
pancreatic defects remain prominent also at the adult age. The reason for these defects is
probably a gestational metabolic impairment, which leads to inadequacy of the
pancreatic growth factors necessary for the growth and development of fetal pancreatic
cells. As a result, the neogenesis and the proliferation of β-cells is decreased. Due to
chronic exposure to hyperglycemia, a secondary (acquired) loss of β-cell differentiation
will be seen at a later age (glucotoxicity). Glucotoxicity possibly then leads to the
impaired glucose-induced insulin release (Picarel-Blanchot et al. 1996). In the adult GK

22
rats of the Stockholm colony, however, decreased as well as normal pancreatic insulin
contents and normal islet -cell density have been reported (Abdel-Halim et al. 1993,
Östenson et al. 1993, Guenifi et al. 1995). This suggests that different local breeding
environments could have an effect on the characteristics of GK rats or that new genetic
changes would have occurred inside the colonies (Portha 2005). Nowadays there are
also GK rat colonies in UK, USA and Portugal.
In 1978 Yagihashi et al. studied the first diabetic complications in GK rats. They
discovered that the GK rats implement greater thickening of the glomerular basement
membrane than control rats. Thickening of the glomerular basement membrane
becomes prominent with age but it also is an early sign of diabetic nephropathy (Mauer
et al. 1984). In 1979 Yagihashi et al. studied the formation of glomerular lesions in GK
rats and the results indicated that the development of diabetic glomerulopathy might be
destined very early in life of the spontaneously diabetic rats perhaps by their genes.
Glomerular changes in GK rats have later been studied for example by Phillips et al.
(2001), Sato et al. (2003) and Schrijvers et al. (2004). Phillips et al. (2001) and Sato et
al. (2003) suggested that the renal structural changes might be induced by the constant
hyperglycemia. GK rat has been noticed to implement similar glomerular changes as
seen in human type 2 diabetes mellitus (for example glomerular hypertrophy and a
decline in GFR) at later stage and it can be used as a model in studying renal structures
and functional changes (Schrijvers et al. 2004). Also diabetic neuropathy has been
discovered in GK rats (Yagihashi et al. 1982). Yagihashi et al. (1982) reported slowing
of nerve conduction velocity, axonal atrophy and segmental demyelination as the
characteristic features of the neuropathy in GK rats. Later Murakawa et al. (2002)
suggested that peripheral neuropathy in GK rats is caused by the impaired glucose
tolerance and insulinopenia. Changes in nerve conduction velocity, loss of small
myelinated fibers and loss of unmyelinated axons could be seen at the age of 18 months
in their study. GK rats also show signs of diabetic retinopathy at an older age and this
rat model can be used to study the mechanism of retinopathy in humans (Miyamoto et
al. 1996, Agardh et al. 1997 and Sone et al. 1997).

23
Goto-Kakizaki is a well-characterized rat model of type 2 diabetes mellitus. GK rats
implement all the typical symptoms of human type 2 diabetes mellitus and also features
of some diabetic complications seen in humans. GK rats are not obese, hypertensive or
hyperlipidemic unlike most rat models of type 2 diabetes mellitus. That makes them a
good model for studying the properties and mechanisms of human type 2 diabetes
mellitus without the effect of these states.
4.2.2 Zucker Diabetic Fatty rats
Lois and Theodore Zucker first found the Leprfa
mutation in rats in 1961 (Zucker and
Zucker 1961). Leprfa
is a spontaneous autosomal recessive Leptin receptor gene
mutation. It leads to obesity, insulin resistance, mild glucose intolerance,
hyperinsulinemia, hyperlipidemia and moderate hypertension. The discovery of the
mutation led to the development of Zucker Fatty Rat (ZFR). Zucker fatty rats can be
used at the research of glucose intolerance, insulin resistance, metabolic syndrome and
genetic obesity but not type 2 diabetes mellitus.
The Zucker Diabetic Fatty (ZDF) rats derive from the selectively inbred hyperglycemic
Zucker fatty rats. A mutation first occurred in a colony of outbred Zucker fatty rats in a
laboratory in Indianapolis, USA in 1974 (Clark et al. 1983) but it was not until the late
1980`s that Peterson et al. (1990) started breeding Zucker rat model of diabetes
purposely in bigger scale. ZDF rats carry a genetic defect in the -cell transcription in
addition to the leptin receptor mutation (Griffen et al. 2001). After ten generations of
inbreeding all male ZDF rats developed a constant and durable type 2 diabetes mellitus
(Peterson et al. 1990). ZDF rats are less obese but more insulin resistant than Zucker
fatty rats. Female ZDF rats only become diabetic if they are fed on a special high-fat
diet (Etgen and Oldham 2000). Female ZDF rats, thus, usually serve as controls in the
studies.
Zucker diabetic fatty rats spontaneously develop a diabetic state at the age of about ten
weeks (Etgen and Oldham 2000). Their muscles first become insulin resistant at around
7 weeks of age and at around 20 weeks of age they have an overt state resembling
24
human type 2 diabetes mellitus with marked glucose intolerance and hyperglycemia
(>22 mM, non-fasted). In the early age (4-10 weeks) ZDF rats are hyperinsulinemic but
later (12- weeks) they become hyperglycemic and hypoinsulinemic. The reduction in
the insulin levels is caused by the greater -cell death compared to new -cell formation
in the pancreas between ages 6-12 weeks (Pick et al. 1998). It seems that when the
hyperinsulinemia starts to fade, the pancreas and the insulin-resistant peripheral tissues
can no longer compensate the excess amount of glucose produced by the liver and the
hyperglycemia takes over. The non-diabetic Zucker fatty rats avoid the progression of
hyperglycemia due to a sustained compensatory hyperinsulinemia.
In addition to type 2 diabetes mellitus, ZDF rats also possess obesity, mild
hypertension, hypertriglyceridemia and hypercholesterolemia (Peterson 1990). Later in
life they show symptoms of diabetic nephropathy (Vora et al. 1996), microvascular
retinopathy (Danis and Yang 1993), neuropathic complications (Shimoshige et al. 2000)
and impaired wound healing (Slavkovsky et al. 2011). Zucker diabetic fatty rats can be
used at the research of type 2 diabetes mellitus, glucose intolerance, hyperinsulinemia,
obesity, impaired wound healing and hyperlipidemia.
4.2.3 Comparison of Goto-Kakizaki and Zucker diabetic fatty rat models
Zucker diabetic fatty and Goto-Kakizaki are both selectively bred rat models for type 2
diabetes mellitus (Goto et al. 1976; Clark et al. 1983). They are both versatile and
widely studied models. They both have glucose intolerance and insulin resistance and
they both also embody symptoms of diabetic comorbidities such as nephropathy and
neuropathy (Yagihashi et al. 1979; Yagihashi et al. 1982; Vora et al. 1996; Shimoshige
et al. 2004). The origins of the defects in the animal models are different. In GK rat the
polygenic changes in -cells originate already from the neonatal age (Movassat et al.
1997). The proliferation of -cells is not adequate and they are deformed. Pancreatic -
cells in GK rat are thus not able to produce enough insulin. At a later age the beta-cell
destruction is continued by glucotoxicity. In ZDF rat, the disease is caused by a leptin-
gene mutation and the destruction of -cells only begins after birth (Clark et al. 1983).
The -cells in the pancreas of ZDF rat are brittle and have a limited ability to endure

25
pressure (Pick et al. 1998). Pancreas compensates the insulin resistance by increasing
insulin production and this causes pressure to the -cells. The deficit of -cells in ZDF
rat is thus not caused by the low proliferation or malfunction of -cells, but by the
massive rate of apoptosis. GK rats are not obese, hypertensive or hyperlipidemic unlike
most rat models of type 2 diabetes mellitus, also ZDF rats. That makes them a good
model for studying type 2 diabetes mellitus without the effect of these states. Both rat
models would have been suitable for studying the chosen test items, gliclazide and
fosinopril, in the experimental study. Sulphonylureas, such as gliclazide, improve the
secretion of insulin from the pancreas and diminish the insulin resistance and ACE
inhibitors, such as fosinopril, possibly enhance the insulin sensitivity (Rendell 2004;
Chen et al. 1996). Goto-Kakizaki rat model was chosen for its non-obesity and more
reasonable price. Gliclazide had also been studied on GK rats before and it was thus
known that gliclazide improves -cell function, increases -cell insulin stores and
increases the glucose-induced insulin release in the adult GK rats (Dachicourt et al.
1998).
5 DRUG INTERACTIONS
5.1 The significance of drug interactions
Drugs can have a beneficial or a harmful effect on each other’s action. Food, stimulants,
herbs and health products might also have an impact on the effect and safety of drugs.
Drug interactions can be divided into pharmacokinetic and pharmacodynamic
interactions. Not all interactions are clinically significant. More severe drug interactions
are most likely to occur for drugs with a narrow margin of safety and for drugs used for
a prolonged period of time (Reimche et al. 2011). The use of several different drugs
concurrently, alias polypharmacy, also increases the risk of interactions. One group of
patients prone to polypharmacy is patients with type 2 diabetes mellitus. In addition to
antidiabetic medicine, patients with type 2 diabetes mellitus also have for example
antihyperlipidemic, antihypertensive and antiplatelet medications.

26
Drug interactions are of great importance not only for the individuals concerned, but
also for the entire community. Drug interactions cause significant costs through
unnecessary medications and increased number of hospitalizations. For example
McDonnell and Jacobs (2002) reported that 26 % of the studied 437 hospitalizations
were due to drug-drug interactions. The probability of drug interactions increases with
the growing number of drugs used per person and the number is the single most
important risk factor for interactions (Reimche et al. 2011). According to a study made
in the USA the probability for a clinically significant interaction is more than 50% in
patients using minimum four, but more than 90% in patients using eight concomitant
medications (Weideman et al. 1998). World Health Organization (WHO) has
recommended that each patient only had at maximum five concomitant medicines. In
Kuopio 75+ –study elders aged over 75 years used approximately 7,5 different drugs
(Jyrkkä et al. 2006). In addition to the number of drugs used, other risk factors for drug
interactions are age and comorbidities, including renal insufficiency (Reimche et al.
2011).
Drug interactions have been an essential reason for adverse effects of drugs and for the
cancellations of drug selling licenses in recent years (SoRelle 1998; Hondeghem et al.
2011). As a result the pharmaceutical companies have a financial interest to study the
interaction already early during the development of drugs. If a drug is for example a
strong inhibitor of some important metabolizing enzyme, the development might be
discontinued. The authorities have given detailed instructions for the necessary research
of interactions (U.S. Food and Drug Administration 2006; European Medicines Agency
2010). For example the features and the target group of the drug guide the design of the
interaction studies. Comprehensive in vitro and in vivo studies precedes clinical studies.
If any interactions are found in preclinical studies, they must be certified in clinical
studies. Most of the drug interaction studies are performed in healthy individuals.
However, diseases might have an impact on the behavior of drugs in the system. The
extrapolation of results from interaction studies into clinical situations might thus not be
straightforward. It is for example well known that kidney diseases reduce the clearance
of many drugs (Joy 2012). Other diseases might also have an impact on the
pharmacokinetics of drugs and research on patients is thus needed.

27
5.2 Pharmacokinetic interactions
Pharmacokinetic interactions can be present in any phase of the drug through the
system. A pharmacokinetic interaction always leads to an altered plasma concentration
of one of the drugs (Hines and Murphy 2011). This might lead to a stronger or weaker
effect of this drug. There are also compensatory mechanisms, which might suppress the
clinical significance of interactions. If a drug, for example, has two pathways of
metabolism, the inhibition of one can lead to a more efficient use of the other.
The most important route of drug administration is oral. After oral dosing, drugs first
need to dissolve and then absorb through the lumen of the intestinal tract. There are
many possible drug-drug interactions during this phase. The drug can, among other
things, be absorbed by another drug, for example activated charcoal or resins
(Neuvonen and Olkkola 1984). The transport of the drug through the wall of the bowel
can also be induced or inhibited by another drug (Endres et al. 2006). A drug can also
change the pH of the stomach, which can prevent the dissolution and the absorption of
another drug, or a drug can get chelated with another drug, for example metallic ions
(Shiba et al. 1992; Tomilo et al. 2006).
After the absorption the drug distributes into the system. During the distribution the
drug can for example be displaced by another drug from a plasma carrier protein, which
leads to an increased concentration of unbound drug in the circulation (Panjehshahin et
al. 1991). Only the unbound fraction of the drug can absorb into the tissues. The
distribution of a drug can also be affected by transporter proteins, which are in charge of
taking the drugs into the target tissues (Endres et al. 2006). The action of transporter
proteins can be induced or inhibited by another drug. Quinidine, for example, inhibits
the action of P-glycoprotein, an important transporter protein, which for example
protects the brain by effectively pumping foreign subjects back to the circulation from
the blood brain barrier (Sadeque et al. 2000). For example loperamide is a substrate of
P-glycoprotein. The inhibition of P-glycoprotein by quinidine thus leads to a significant
increase in the concentration of co-administrated loperamide in the central nervous
system.

28
The next phase of the drug in the system is the metabolism. The purpose of the
metabolism is to transform lipophilic drugs and foreign matters into more water-soluble
form for the kidneys and the bile to excrete them out of the system. Metabolism is two-
stage. The most important catalysts in the oxidative phase I metabolism are the
cytochrome P450 (CYP) enzymes (Pelkonen et al. 2008). Usually, but not always,
phase I is followed by phase II metabolism where a very polar endogenous conjugate is
attached to the metabolite from phase I (McCarver and Hines 2002). The more relevant
and more widely studied part concerning drug interactions is the phase I metabolism.
The most important organ for drug metabolism is the liver, but there are CYP enzymes
also for example in the wall of the small intestine, the lungs, the heart, the brain and the
placenta (Pelkonen et al. 2008). Essential parts of drug metabolism are the genetic
families of CYP enzymes CYP1, CYP2 and CYP3. Diseases, nutrients and some
stimulants, like caffeine, can also affect the activity of oxidative metabolism. Genetic
polymorphism in CYP enzymes is relatively common and thus inter-individual
differences in metabolism can be major. Clinically most important ones are CYP2C9,
CYP2C19 and CYP2D6.
The inhibition and the induction of cytochrome P450 are the most remarkable
mechanisms of drug interactions (Pelkonen et al. 2008). The inhibition of the
metabolism of a drug might lead into increased plasma concentration, accumulation and
increased side effects or even toxicity. Induction of the metabolism might lead into
decreased plasma concentrations and possibly to a lack of the effect. In clinical use,
when a drug seems ineffective, the dose of the drug is increased and other drugs with
the same indication are added in addition to the original medicine. Induction can thus
lead to polypharmacy.
Inhibition or induction of metabolism can be significant if a pro-drug is concerned
(Pelkonen et al. 2008). For the action of a pro-drug the normal metabolism is essential.
If the metabolism of a pro-drug into its active form is inhibited the desired action of the
medicine will not be achieved. If the metabolism of a pro-drug is induced, the

29
concentration of the active drug might increase and the possibility of side effects
increases.
The CYP enzymes in the wall of the small intestine and the liver have a very important
role in the first-pass metabolism (Pelkonen et al. 2008). Significant first-pass
metabolism of a drug can reduce its bioavailability remarkably. If the first-pass
metabolism is inhibited by another drug, the bioavailability might increase and this can
lead to dangerously high plasma concentrations of the first drug.
Some of the essential phase II metabolism reactions are glucuronidation, acetylation and
methylation (McCarver and Hines 2002). These reactions are catalyzed by a large group
of broad-specificity enzymes, such as uridine 5'-diphospho-glucuronosyltransferase
(UDP-glucuronosyltransferase). Also conjugative enzyme can be induced or inhibited
by other drugs. For example rifampicin induces the glucuronidation and thus decreases
the concentration of for example lamotrigine (Ebert et al. 2000). Polymorphism is also
common in phase II metabolism enzymes.
The last phase of the drug in the system is the excretion of the drug through the bile or
the kidneys. In this phase a drug can change the urinal pH or it can change the blood
circulation in the kidneys, which might prevent or enhance the excretion of another drug
into the urine (Nilsson et al. 1982; Kristoff et al. 1986). A drug can also inhibit or
induce the transporters in the kidneys or in the bile and thus lead to faster or slower
elimination of another drug from the system. For example verapamil increases the half-
life and the plasma concentration of digoxin significantly (Verschraagen et al. 1999).
Verapamil is an inhibitor and digoxin a substrate of P-glycoprotein. The interaction is
probably caused by the inhibition of P-glycoprotein by verapamil, which leads to
decreased tubular secretion of digoxin.
5.3 Pharmacodynamic interactions
A pharmacodynamic interaction leads to a change in at least one drug action without the
change in the drug concentration (Hines and Murphy 2011). Many drugs bind to a
30
receptor and cause a similar but usually stronger effect than the endogenous transmitters
in the system. This is called agonism. Some drugs bind to receptors but they prevent the
binding of the transmitters. This is called antagonism. Antagonism can be competitive
i.e. an agonist can displace the antagonist from the receptor, or it can be non-
competitive, in which case no amount of agonist can displace the antagonist. Drugs can
function as antagonists or agonists to each other. This is for example commonly utilized
in the treatment of drug poisonings. Many antidotes, for example naloxone, work as
antagonist for the relevant receptors, in this case for opiate-receptor (Dahan et al. 2010).
Agonism-antagonism can also be harmful. For example some asthma medicines work as
agonists for adrenergic -receptors whereas many antihypertensive medicines work as
antagonists for them (Chen et al. 2001). Concomitant use of these medications can
therefore prevent the effect of both medicines.
Additive interaction means that the effect of the dosed drugs is similar or that they
affect the same organs. This can lead to increased toxicity (van Dijk et al. 2004).
Additive interaction can, however, also be useful. For example many antihypertensive
medicines have a different mechanism of action but the effect on hypertension is
similar, decreasing (Everett et al. 2008). This can be utilized in the treatment of
hypertension. Drugs designed for totally different purposes can cause a potentiative
interaction by affecting the same organs. Typical example of this is the interaction of
non-selective anti-inflammatory medicines and the selective serotonin reuptake
inhibitors (Tata et al. 2005). Both drugs have a deteriorating effect on platelet function,
but the mechanism is different.
5.4 Drug interactions of clinical importance with antihyperglycemic agents
5.4.1 Interactions with antihyperglycemic agents
Patients with diabetes typically use a wide variety of drugs. They have a significant risk
of interactions due to this polypharmacy (Reimche et al. 2011). Potential interactions
can occur between different antidiabetic drugs, and between antidiabetic drugs and
other widely co-administered pharmacological agents (antihypertensive, lipid-lowering

31
and antiplatelet agents). In addition to these, especially agents with a narrow safety
index (digoxin, warfarin) and those that are known to induce or inhibit the CYP
enzymes are also in a great risk of causing interactions. Scheen (2005) has written a
comprehensive article about interactions between antihyperglycemic agents and
between antihyperglycemic agents and other pharmacological compounds that are
typically used with diabetes medicines. The article concerns metformin, sulphonylureas,
thiazolidinediones, -glucosidase inhibitors and glinides. The interactions of gliptins
are described in a latter article of Scheen (2010b).
In general, only minor drug-drug interactions appear between antihyperglycemic agents
and antihyperglycemic agents and other drugs (Scheen 2005). For example cimetidine
competes for a transport system in the renal tubules with metformin. This reduces the
rate of urinary excretion of metformin. In a study of Somogyi et al. (1987) in healthy
volunteers cimetidine caused a 50 % increase in the plasma AUC and a 27 % decrease
in the 24-hour renal excretion of metformin. Incidents of chronic cardiac insufficiency
have been reported to increase when insulin and rosiglitazone are used concurrently
(Marceille et al. 2004). The exact mechanism of this interaction is unknown but it
probably is related to fluid retention induced by rosiglitazone and insulin. A third
example of the interactions of antidiabetic drugs is between acarbose and digoxin.
Acarbose has been shown to decrease the absorption of co-administered digoxin (Miura
et al. 1998). Acarbose reduced the serum level of digoxin by 30-40% and AUC by 40%.
Several antihyperglycemic agents have a pharmacodynamic, blood glucose-lowering
additive interaction when used simultaneously (Scheen 2005). This effect can be
utilized in the treatment of type 2 diabetes mellitus, especially because the risk of
adverse effects does not increase proportionally. Combinations of antidiabetic drugs are
already widely used. The traditional combination has been metformin-sulphonylurea,
but new combined therapies are now available, for example metformin plus
thiazolidinedione and sulphonylurea plus thiazolidinedione. A higher possibility for
hypoglycemic episodes is present in the co-administration of antihyperglycemic drugs,
especially those acting through release of insulin, such as sulphonylureas and

32
meglitinide analogues, and for example gliptins (Scheen 2010b). These episodes can,
however, be prevented with dose corrections.
Cytochrome P450 isoenzymes are strongly involved in the metabolism of the glucose-
lowering drugs and they cause the most important drug-drug interactions. Glinides are
all metabolized via CYP3A4 enzyme (Scheen 2007b). In addition to CYP3A4,
repaglinide is metabolized via CYP2C8 and nateglinide via CYP2C9. The metabolism
of pioglitazone is mainly catalyzed by CYP2C8 and CYP3A4, whereas rosiglitazone is
metabolized by CYP2C9 and CYP2C8 (Scheen 2007a). DPP-4 inhibitors do not
interfere with CYP enzymes (Scheen 2010b). The only exception is saxagliptin, which
is metabolized to an active metabolite by CYP3A4/5. The most important enzyme
responsible for the metabolism of sulphonylureas is CYP2C9 (Scheen 2005).
Metformin is not metabolized in humans after oral or intravenous administration but it
is eliminated by renal excretion. The most relevant pharmacokinetic interaction can be
found between gemfibrozil, a fibric acid derivative, and repaglinide (Scheen 2005).
Gemfibrozil inhibits the CYP2C8 enzyme. In a study of Niemi et al. (2003b),
gemfibrozil increased the plasma AUC of repaglinide by 8-fold and the Cmax by 140%.
A less significant interaction has been reported between gemfibrozil and rosiglitazone
(Niemi et al. 2003a). Gemfibrozil raised the plasma AUC of rosiglitazone by 2.3-fold
and prolonged the elimination half-life of rosiglitazone from 3.6 to 7.6 hours (Niemi et
al. 2003a). Caution is always needed when strong CYP inhibitors (like ketoconazole) or
inducers (like rifampicin) are co-administered with antihyperglycemic compounds
metabolized by CYP enzymes (Scheen 2005). If the metabolism is inhibited, there is a
risk for increased side effects, such as hypoglycemia. If the metabolism is induced, it
can lead to lack of efficiency and the need for addition of another antihyperglycemic
agent. A dose adjustment of the diabetes medicine might then be needed.
Polymorphism is widely described in CYP2C8 and CYP2C9 enzymes, two very
important enzymes also for antihyperglycemic agents (Scheen 2005). Polymorphism
may influence the pharmacokinetics of glucose-lowering drugs and there is a risk of
increased adverse effects or a lack of the antihyperglycemic effect. However, to date,
the clinical relevance of polymorphism is unknown in patients with type 2 diabetes

33
mellitus and more research on the subject is needed. One major problem in the research
of interactions of glucose-lowering drugs is that the studies are mainly performed only
in healthy volunteers. The disease can, however, change the behavior of the compounds
in the system and studies in subjects with type 2 diabetes mellitus are thus also needed.
5.4.2 Interaction between angiotensin-converting enzyme inhibitors and
sulphonylureas
A significant interaction has been reported between the antihyperglycemic agents
sulphonylureas and the antihypertensive agents angiotensin-converting enzyme (ACE)
inhibitors (Arauz-Pacheco et al. 1990; Herings et al. 1995; Moore et al. 1997; Morris et
al. 1997; Thamer et al. 1999). Together these compounds decrease blood glucose
concentration more than sulphonylureas alone and might cause hypoglycemic episodes
in patients with type 2 diabetes mellitus. The mechanism of the interaction is not
known. It is thought that ACE inhibitors improve insulin sensitivity in the tissues (Chen
et al. 1996). Increased hypoglycemic episodes can cause hospitalization and thus
increased costs in the treatment of type 2 diabetes mellitus. According to Thamer et al.
(1999) health care costs are 3 times higher in type 2 diabetes mellitus patients
hospitalized for hypoglycemia compared with controls. Hospitalization for
hypoglycemia in subjects using sulphonylureas and ACE inhibitors could be prevented
with decent follow-up of these patients.
The relationship between sulphonylureas and ACE inhibitors is controversial, however.
Herings et al. (1995) claimed that as many as 14% of hospital admissions for
hypoglycemia might be consequential to the use of ACE inhibitors. Other authors
argued that the study design did not take into account of potential confounders such as
renal function, heart failure or coexistent cardiovascular disease, factors that can
predispose to hypoglycemia themselves (van Haeften 1995; Feher and Amiel 1995).
Shorr and coworkers (1997) studied the interaction of sulphonylureas and ACE
inhibitors in elders (mean age 787 years). They found no statistically significant
difference in the occurrence of hypoglycemic episodes between subjects receiving the

34
test subjects or placebo. According to Shorr et al. the hypoglycemic interaction between
sulphonylureas and ACE inhibitors is not present at least in elders.
ACE inhibitors are reported to have cardio- and renoprotective features (Tashko and
Gabbay 2010). For example in the HOPE (Heart Outcomes Prevention Evaluation)
study (2000) ramipril lowered the risk of the myocardial infarction by 22%, stroke by
33%, cardiovascular death by 37%, total mortality by 24%, revascularisation by 17%
and overt nephropathy by 24%. Considering these beneficial effects of ACE inhibitors
in addition to the insulin sensitivity increasing effect, ACE inhibitors are a very
important part of the treatment of type 2 diabetes mellitus. ACE inhibitors are the
primary treatment for hypertension in patients with type 2 diabetes mellitus also in
Finland (Käypä hoito recommendation 2011). The hypoglycemic interaction between
ACE inhibitors and sulphonylureas must be taken into account in the treatment of
subjects with type 2 diabetes mellitus, but with decent monitoring these compounds can
safely be used together.
The mechanism of this significant interaction is not known. It has been thought to be
caused by the ACE inhibitors ability to increase insulin sensitivity but the mechanism
can as well be pharmacokinetic. The mechanism of this interaction will be studied in the
experimental part of this study.

35
II EXPERIMENTAL STUDY
6 AIMS OF THE STUDY
The aim of the experimental study was to study the hypoglycemic interaction of
fosinopril and gliclazide in control rats and in a rat model of diabetes by studying the
effects of fosinopril on the pharmacokinetics of gliclazide. Fosinopril and gliclazide
have been documented to have an interaction, which leads to a greater decrease in blood
glucose concentrations in human patients than gliclazide alone. The mechanism of this
interaction is not known. In this study the mechanism of the interaction was studied and
it was hypothesized to be pharmacokinetic. Also the effects of experimental diabetes on
pharmacokinetics of gliclazide after single and repeated dosing were studied. To study
the pharmacokinetics of the test items, approximately 700 plasma samples were
collected after single and repeated per oral and/or intravenous administration. An
HPLC-MS/MS method was developed for the measurement of the test item
concentrations in the plasma samples and the pharmacokinetic parameters were
determined. Plasma glucose concentrations were determined regularly during the study
to explore the effects of the test items on blood glucose. Oral glucose tolerance (OGT)
test was performed at baseline and in the end of the study.
7 MATERIALS AND METHODS
7.1 Animals
Goto-Kakizaki (GK) rat strain was used in the study because it embodies insulin
intolerance and insulin resistance. A total of 18 adult male Goto-Kakizaki (GK) rats
weighing circa 310 grams were obtained from Taconic, Denmark and 18 adult male
Wistar (WI) rats weighing circa 340 grams were obtained from Harlan, Netherlands.
GK male rats develop a condition resembling type 2 diabetes mellitus at approximately

36
14-16 weeks of age. The onset of diabetes was verified by measuring blood glucose
levels.
All procedures with animals were performed according to European Community
Guidelines for the use of experimental animals (European Communities Council
Directive 86/609/EEC) and the experimental setup was reviewed and approved by the
Animal Care and Use Committee of the State Provincial Office of Southern Finland
(APPENDIX 1). Animals were subjected to a constant daily cycle of 12 hours of light
and 12 hours of darkness (06:00-18:00), constant temperature (21 ± 3 ºC) and relative
humidity of 55 ± 15 %. Makrolon 3 cages (Bayer MaterialScience AG, Germany) were
used and two animals were housed in each cage. Rats had access to commercial pelleted
non-sterilised chow (RM1 E SQC, SDS England) and normal tap water ad libitum,
except during fasting when access to food was restricted. Aspen chips (Tapvei Oy,
Kaavi, Finland) were used as bedding.
Animals were weighed once a week during the study and observed for clinical signs two
times a day to ensure welfare. During weekends observations were done once a day. As
it was described in the license for animal experiments, if the weight of an animal was
reduced more than 10 % from the previous measuring or if the animal had any
significant problems concerning welfare, it was euthanized (APPENDIX 1).
Each rat was individually identified by tail numbering (1-36). Cages were respectively
marked with cage cards indicating study number, animal numbers, group number, sex,
strain, medication, dose of the item/items and the study period to avoid mixing.
7.2 Study design
Study was performed as described in Figure 1. A Protocol Outline was compiled (APPENDIX 2). Oral glucose tolerance
(OGT) test was performed twice during the study, at the beginning and the end, and
plasma glucose concentrations were determined weekly except when pharmacokinetic
experiments were performed. Four separate pharmacokinetic experiments were
performed during the study. Plasma samples were collected as described in Figure 2

37
after single and repeated per oral (p.o.) and intravenous (i.v.) administration of the test
items in order to measure the concentrations of test items in plasma. After the single i.v.
administration there was a wash-out period of one week before p.o. administration.
plasma glucose, OGTT i.v. kinetics p.o. kinetics plasma glucose plasma glucose i.v. kinetics p.o. kinetics
plasma glucose, OGTT
week -2 week -1 week 1 week 2 week 3 week 4 week 5 week 6 Figure 1. The study design. The time period when oral dosing was performed daily is
marked in red. OGTT stands for oral glucose tolerance test.
The control and diabetic animals were divided into three groups each (n=6). The first
two subgroups were treated daily with 10 mg/kg/day gliclazide (Sigma-Aldrich,
Germany), the second subgroups were treated with 10 mg/kg/day fosinopril (Euroasian
Chemicals, Mumbai, India) and the third subgroups received a combination of
gliclazide and fosinopril (Figure 2). Dosing was performed orally every day except on
the days of intravenous pharmacokinetic experiments when all animals treated with
gliclazide received their dose of 6 mg/kg intravenously. Test items were dissolved in a
vehicle of 4.6% glycerine, 87.6% polyethylene glycol 400 and 7.8% distilled water for
p.o. dosing and in a vehicle of NaOH in distilled water for i.v. dosing. For the
preparation of the i.v. vehicle the same molar amount of NaOH and gliclazide was
added.
Figure 2. Grouping of the animals and the doses of the test items.

38
The time points for the pharmacokinetic studies, shown in Figure 2, were carefully
selected to get a comprehensive picture of the pharmacokinetics of the test items in rats.
For ten time points, the amount of blood withdrawn from each animal would have been
too large. To avoid excess removal of blood, a sample was taken from each rat only
every other time point. As a result, the number of studied rats is six in each group but
only three in each time point. When the results were calculated, the results from two
rats were united to form “complete” rats with ten time points. Each group formed 9
“complete” rats when the results of all rats were combined with each other. If results
were missing from some rats, the number of “complete” rats was smaller. In the results
of pharmacokinetic experiments the number of studied individuals is therefore 6-9.
7.3 Analytical procedures
7.3.1 Analytical instrumentation and conditions
Samples were analyzed using a modified method of Cui et al. (2007) (APPENDIX 3).
The experiments were performed using Agilent HP 1100 liquid chromatograph
(Hewlett-Packard GmbH, Waldbronn, Germany) and A PE Sciex API 3000 triple-
quadrupole mass spectrometer (Applied Biosystems/MDS Sciex, Canada). The column
was an AtlantisTM
dC-18 (50 x 2.1 mm, 3 m particle size, Waters). The data were
collected and processed with MDS Sciex Analyst 1.5 software.
The LC method was slightly modified by using 15 mM ammonium acetate instead of 10
mM and a linear gradient of 40-60% MeOH for 0-0.1 min, 60-90% MeOH for 0.1-3.5
min and 90% MeOH for 3.5-5.5 min. The new method was validated modified
according to the FDA guideline for validation of bioanalytical methods (FDA 2001).
Method validation was carried out in terms of accuracy, precision, linearity, specificity,
reproducibility and stability. Also the extraction recoveries and matrix effect was
studied.

39
7.3.2 Sample preparation
Blood samples (0.2 ml) were collected from the lateral tail vein of the rats as described
in the study design (Figure 2). Samples were always taken from the opposite side of the
tail than where the i.v. dose was given to avoid contaminations during sampling. Blood
samples treated with the anticoagulant K2-EDTA were centrifuged (2870 g for 10
minutes at 4 °C) to obtain plasma. After centrifugation, plasma samples were
transferred into labeled plastic Eppendorf reaction tubes and stored at –20 ºC until
analysis.
The sample preparation method of Cui et al. (2007) was slightly modified using a 15-
minute shaker-extraction instead of a 3-minute vortex-extraction (APPENDIX 3). All
the samples were made in duplicates for the analysis. Samples were prepared using
diethyl ether-dichloromethane (3:1, v/v) liquid-liquid extraction. A mixture of methanol
and ammonium acetate solution (4:6, v/v) was used to dissolve the analytes.
A standard curve in triplicates was prepared approximately once a week at
concentrations covering the expected concentration range in the plasma samples (5, 10,
20, 35, 45 and 60 M for gliclazide and 0.4, 2, 4, 8, 14, 18 and 24 M for fosinoprilat).
It was run separately or at intervals along with the test samples. Quality control (QC)
samples in triplicates at three concentrations (3, 12 and 20 M for fosinoprilat and 7.5,
30 and 50 M for gliclazide), also covering the expected concentration range, were
prepared every day and analyzed with the samples to ensure the proper function of the
system.
Some of the samples needed to be diluted with blank plasma because there was not
enough of the plasma sample left. The results of these samples were integrated normally
and then a coefficient was used to calculate the actual concentration in the plasma
sample.

40
7.4 Pharmacokinetic analysis
Pharmacokinetic parameters for gliclazide were calculated by non-compartmental
methods using the WinNonLin software package (version 5.2.1; Pharsight, Mountain
View, California, USA). On the basis of the group plasma concentration–time data the
area under the plasma concentration–time curve (AUC; in mg*h/L), the maximum
plasma concentration of the drug (Cmax; in mg/L), the time to reach Cmax (Tmax; in h), the
volume of distribution (V; in L), the clearance (CL; in L/h), the elimination rate
constant determined as the negative slope of the terminal log-linear phase of the curve
(kel; in h-1
) and the mean residence time (MRT; in h) were determined. F is the oral
bioavalilability of gliclazide and it was counted using Equation 1, where AUCp.o. and
AUCi.v. are the area under the curves after per oral and intravenous dosing, and Dosep.o.
and Dosei.v. the doses of per oral and intravenous dosing. The raw data for the
pharmacokinetic analysis is in APPENDIX 4.
F=(AUCp.o./AUCi.v.)*(Dosei.v./Dosep.o) Equation 1
7.5 Blood glucose concentration measurement and oral glucose tolerance test
Blood glucose concentrations were measured from the lateral tail vein four times during
the study after an overnight fast (14-18 h) using HemoCUE® Glucose 201+ analyzer.
Blood glucose levels were considered as a marker for the effect of the medical
treatments. Blood glucose levels were also used to determine the onset of diabetes in the
GK rats.
Oral glucose tolerance test was performed at baseline and at the end of the study.
Animals received 2 g/kg D-glucose monohydrate (Sigma, Germany) before daily test
item dosing after an overnight fast (14-18 h) by gavage. Blood glucose concentrations
were determined using HemoCUE® Glucose 201+ analyzer at time points 0, 30, 60 and
120 minutes. Because the concentrations in the samples of GK rats were above the
working range of the device, all the blood samples of GK rats were diluted 1:1 (10 µl +

41
10 µl) using saline (0.9 %) before analysis. The samples of WI rats were analyzed
without dilution to avoid too low values.
Animals were divided into groups according to the results of the OGT test performed in
the beginning of the study. GK rats formed three groups (I-III) and WI rats another
three groups (IV-VI). Area under the curve (AUC) for the OGT test was calculated for
each animal. Groups were formed to have similar average AUC to ensure similar ability
to use glucose between groups. AUC of the blood glucose levels was determined using
the trapezoidal method using Equation 2.
AUC=[((Ca-C0)+(Cb-C0))/2] x t Equation 2
In Equation 2, C0 is the nominal blood glucose concentration, Ca and Cb are blood
glucose concentrations at certain time points and t is the change of time between Ca
and Cb. The nominal value of blood glucose was determined to be the zero point and the
area was calculated above that and under the time-concentration curve.
7.6 Statistical analysis
Means and standard deviations were calculated using EXCEL® software (Microsoft
Corporation, USA).
8 RESULTS
8.1 Analytical procedures
The main results concerning the analytical method used in this study are described
shortly in this section. More detailed information can be found in APPENDIX 3.
All the samples in this study were quantitatively analyzed for gliclazide and fosinoprilat
using a modified validated version of the work of Cui et al. (2007) (APPENDIX 3).
Fosinopril is a pro-drug and it is rapidly hydrolyzed into fosinoprilat both in the mucosa

42
of the gastrointestinal tract and the liver. Fosinoprilat was thus analyzed from the
plasma samples in addition to gliclazide in this study. The analytical method was
developed also to analyze fosinopril. It was suggested that there might be some
differences between different groups in the amount of hydrolysis of fosinopril into
fosinoprilat. Fosinopril could not, however, be detected reliably using the new method
due to sensitivity problems.
The method was successfully validated modified according to the FDA guideline for
validation of bioanalytical methods (FDA 2001). The accuracy, precision, linearity,
specificity, stability and reproducibility of the method were shown to comply with the
requirements of FDA (Table 4, APPENDIX 3). The extraction recovery and matrix
effect complied also with requirements. Accuracy and precision of the QC-samples
were accepted when the Relative Standard Deviation (RSD%) did not exceed 15%
(20% for low QC) and the accuracy was within 20% of the nominal value. There were
some contamination problems in the analytical system for fosinoprilat but they
diminished when a column wash of 0.1 % trifluoroacetic acid was added after every
analytical batch.
Table 4. The validation results of the analytical method.
Gliclazide Fosinoprilat
Retention time (min) 3.2 3.8
Linearity range (μM) 5-60 0.4-24
r2 0.9905 - 0.9990 0.9934 - 0.9999
Between-days repeatability (%RSD) 5.5% (8.3 μM) 6.1% (3.3 μM)
4.2% (30 μM) 8.1% (12 μM)
3.9% (50 μM) 3.8% (20 μM)
The slope, the intercept and the correlation coefficient were determined from every
standard curve. On the basis of acceptable accuracy and good correlation coefficients
(≥0.9905), the relationship between area ratio and concentrations was linear within the
studied concentration range (Table 4). The limit of quantification (LOQ, signal-to-noise
ratio S/N of at least 10) was determined for all analytes. In the cases where
contamination was observed in the blank samples, LOQs were determined with a
concentration that produced a S/N ratio ten times higher than the peak of the blank

43
sample. The LOQ for gliclazide in plasma was 1 μM and the LOQ for fosinoprilat
varied from 0.4 μM to 14 μM depending on the amount of contamination.
The highest concentration in the plasma samples for gliclazide was approximately 260
µM and 13 µM for fosinoprilat. The concentration of fosinoprilat in the plasma samples
was very small and this caused sensitivity issues. The contamination of fosinoprilat in
the analytical system was also remarkable. The aim of the study, however, was to study
the effect of fosinopril on the pharmacokinetics of gliclazide and thus only the plasma
concentrations of gliclazide are presented.
8.2 Blood glucose concentration measurement
Blood glucose concentrations were determined from all rats four times during the study
to determine the effect of the medical treatments on the blood glucose levels. Rats were
fasted approximately 14 hours before the experiment. Blood glucose levels were
significantly higher in all the diabetic groups compared to the control groups (Figure 3).
Figure 3. The results of the blood glucose measurement in the beginning and the end of
the study in all groups. Blood glucose concentrations decreased during the study in all
the groups except in the WI group receiving fosinopril alone (n=3-6, mean SD,
GK=Goto-Kakizaki rat, WI=Wistar rat, G=gliclazide, F=fosinopril,
G+F=gliclazide+fosinopril).
0
2
4
6
8
10
12
G GK F GK G+F GK G WI F WI G+F WI
Blo
od
glu
cose
co
nce
ntr
atio
n (
mm
ol/
L)
Group
week 0
week 6

44
8.2.1 Control rat
The progression of the blood glucose concentrations in control rats during the study was
variable (Figure 4). In the combination treatment group, blood glucose levels were
lower than in the other two groups already in the beginning of the study. The blood
glucose first increased slightly but then decreased. In the fosinopril group, blood
glucose stayed similar during the entire study. A contradictory result was found in the
control rats receiving gliclazide alone because the blood glucose concentration first
decreased but then increased towards the end of the study. The difference in the results
between the baseline and the end of the study was most remarkable in the gliclazide
group (-4.5%) and slightly smaller in the combination treatment group (-2.0%) (Table
5). The blood glucose concentration in the fosinopril group increased 2.5% during the
study. The concomitant administration of fosinopril and gliclazide in control rats had a
lowering effect on the blood glucose concentrations during the study. Gliclazide alone,
however, had a more significant effect.
Figure 4. The progress of blood glucose concentrations during the study in Wistar rats
(n=5-6, mean ± SD).
8.2.2 Rat model of diabetes
The progression of the blood glucose concentrations in Goto-Kakizaki rats during the
study is shown in Figure 5. The blood glucose levels of the GK combination group were
3
4
5
6
7
0 1 2 3 4 5 6Blo
od
glu
cose
co
nce
ntr
atio
ns
(mm
ol/
L)
Study week
fosinopril
gliclazide
combination

45
lower than in the other two groups in the beginning of the study and they increased until
the second week of the study. This might be a sign that not all the rats had developed
diabetes by the beginning of the study. Blood glucose levels in the combination group
decreased after two weeks but stayed similar for the rest of the study. Glucose levels of
gliclazide group decreased until the week three but increased after that ending up to be
similar than in the fosinopril group. Blood glucose in the fosinopril group first
decreased and then increased but decreased again.
Figure 5. The progress of blood glucose concentrations during the study in Goto-
Kakizaki rats (n=3-5, mean ± SD).
Table 5. The percent of change in the blood glucose concentrations (mmol/L) during the
study (n=3-6, mean ± SD, G=gliclazide, F=fosinopril, G+F=gliclazide+fosinopril).
Treatment Week 0 Week 6 % of change
Mean ± SD Mean ± SD
Rat model
of diabetes
G 8.9 0.79 8.3 0.86 -5.8 %
F 8.8 0.70 8.3 0.94 -5.8 %
G+F 8.0 0.86 7.3 0.12 -8.5 %
Control rat
G 6.0 0.31 5.7 0.53 -4.5 %
F 6.0 0.65 6.2 0.91 2.5 %
G+F 5.6 0.48 5.4 0.52 -2.0 %
6
7
8
9
10
11
0 1 2 3 4 5 6
Blo
od
glu
cose
co
nce
ntr
atio
n (
mm
ol/
L)
Study week
fosinopril
gliclazide
combination

46
In GK rats, gliclazide alone caused a similar decrease of 5.8% in the blood glucose
concentration between the beginning and the end of the study than fosinopril (Table 5).
A more significant decrease of 8.5% was seen when fosinopril and gliclazide were
administered together. In conclusion, the concomitant administration of gliclazide and
fosinopril might have a stronger effect on the blood glucose concentration in the GK
rats than gliclazide treatment alone. Three animals of the combination group were lost
during the study, but due to reasons unrelated to the test items.
8.3 Oral glucose tolerance test
Oral glucose tolerance test was performed at the baseline and at the end of the study.
Rats were grouped for the study according to the AUC of the first OGT test to get
groups, which have a similar usage of glucose (Figure 6). As seen from the deviation of
the figure, the differences between different WI groups and different GK groups were
very small. Similar ability to use glucose between the groups was important for the
comparison of the results in the study. Rats were fasted (14-18 h) before the experiment.
The length of the fast was different between GK rats numbered 1-9 than 10-18 and WI
rats numbered 19-27 than 28-36. The length of the fast had, however, no significant
effect on the results of OGT test.
Figure 6. The results of the rat model of diabetes and control rats of the first OGT test.
The deviation is the standard deviation between the groups (n=6, mean ± SD,
GK=Goto-Kakizaki rat, WI=Wistar rat).
0
5
10
15
20
25
30
0,0 0,5 1,0 1,5 2,0
Blo
od
glu
cose
co
nce
ntr
atio
n (
mm
ol/
L)
Time (h)
GK
WI

47
There was a significant difference in the AUC of control rats and rat model of diabetes
in the beginning of the study (Figure 7). Control rats had lower nominal blood glucose
levels than GK rats, and when glucose was administered, the blood glucose rose
controlled but returned close to the nominal value by the end of the experiment (Figure
6). The insulin response to glucose in GK rats is deranged and thus GK rats produced a
stronger effect on glucose. Glucose levels reached high quickly and did not return back
to the nominal values in two hours.
Figure 7. The AUC of OGT test results in the beginning and the end of the experiment
in different groups. A more significant decrease was only seen in the diabetic group
receiving combination treatment (n=3-6, mean ± SD, GK=Goto-Kakizaki rat,
WI=Wistar rat, G=gliclazide, F=fosinopril, G+F=gliclazide+fosinopril).
8.3.1 Control rats
There was no decrease in the AUC between the beginning and the end of the study in
any group in control rats (Figure 7). On the contrary, the AUC in all the groups
increased slightly. The increase in the combination group was largest, 16% (Table 6).
0
5
10
15
20
25
30
35
GK G GK F GK G+F WI G WI F WI G+F
Are
a U
nd
er t
he
Curv
e (h
*m
mo
l/L
)
Group
week 0
week 6

48
Table 6. The AUC (h*mmol/L) of the OGT tests compared at baseline and at the end of
the study (n=3-6, mean ± SD, G=gliclazide, F=fosinopril, G+F=gliclazide+fosinopril).
Treatment Week 0 Week 6 % of change
Mean ± SD Mean ± SD
Rat model
of diabetes
G 25.3 2.20 27.0 3.22 6.66%
F 25.6 2.43 23.4 2.82 -8.62%
G+F 25.7 4.77 18.6 9.27 -27.6%
Control rat
G 3.54 1.02 3.69 1.33 4.31%
F 3.60 1.05 3.89 1.42 7.86%
G+F 3.63 0.93 4.21 0.79 16.0%
8.3.2 Animal model of diabetes
Figure 8. The results of the OGT test for GK groups receiving gliclazide or combination
treatment in the beginning (week 0) compared to combination treatment at the end
(week 6). There was a significant difference between the results but the standard
deviation seems to fade it out a bit. The combination treatment lowered the AUC more
than gliclazide treatment alone (n=3-6, mean ± SD).
0
5
10
15
20
25
30
0,0 0,5 1,0 1,5 2,0
Blo
od
glu
cose
co
nce
ntr
atio
n (
mm
ol/
L)
Time (h)
week 0, combination
week 6, combination
week 6, gliclazide
week 0, gliclazide
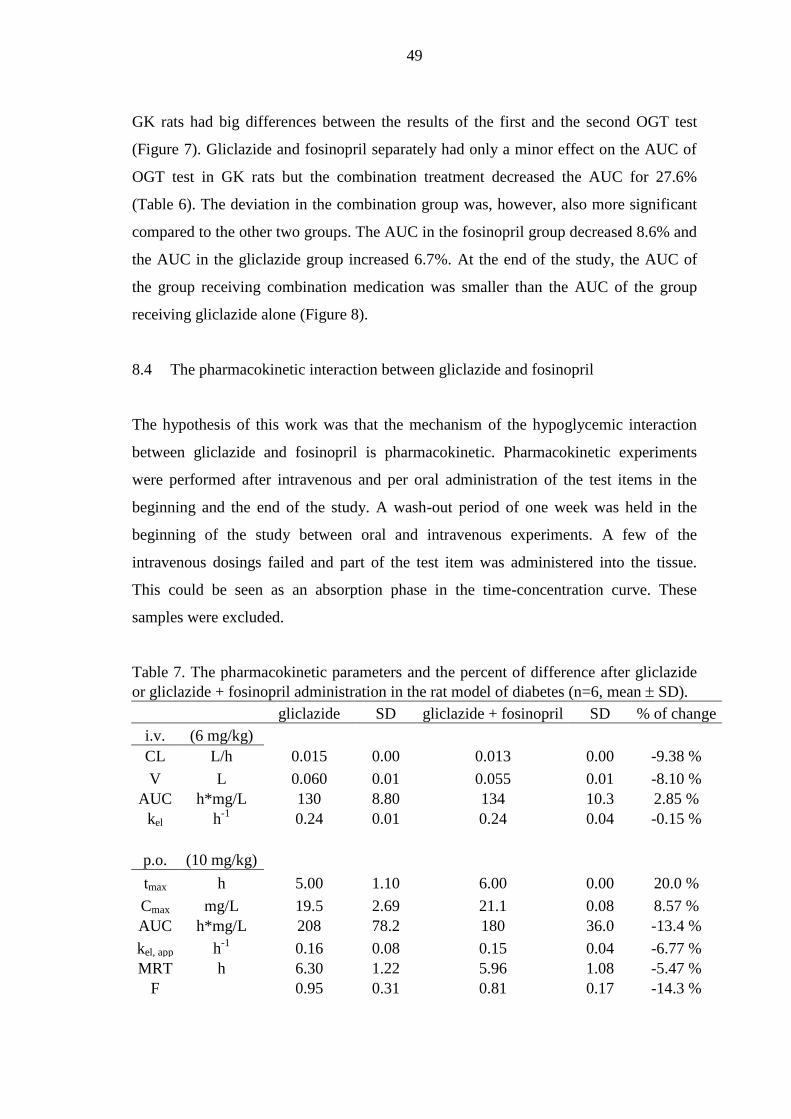
49
GK rats had big differences between the results of the first and the second OGT test
(Figure 7). Gliclazide and fosinopril separately had only a minor effect on the AUC of
OGT test in GK rats but the combination treatment decreased the AUC for 27.6%
(Table 6). The deviation in the combination group was, however, also more significant
compared to the other two groups. The AUC in the fosinopril group decreased 8.6% and
the AUC in the gliclazide group increased 6.7%. At the end of the study, the AUC of
the group receiving combination medication was smaller than the AUC of the group
receiving gliclazide alone (Figure 8).
8.4 The pharmacokinetic interaction between gliclazide and fosinopril
The hypothesis of this work was that the mechanism of the hypoglycemic interaction
between gliclazide and fosinopril is pharmacokinetic. Pharmacokinetic experiments
were performed after intravenous and per oral administration of the test items in the
beginning and the end of the study. A wash-out period of one week was held in the
beginning of the study between oral and intravenous experiments. A few of the
intravenous dosings failed and part of the test item was administered into the tissue.
This could be seen as an absorption phase in the time-concentration curve. These
samples were excluded.
Table 7. The pharmacokinetic parameters and the percent of difference after gliclazide
or gliclazide + fosinopril administration in the rat model of diabetes (n=6, mean SD).
gliclazide SD gliclazide + fosinopril SD % of change
i.v. (6 mg/kg)
CL L/h 0.015 0.00 0.013 0.00 -9.38 %
V L 0.060 0.01 0.055 0.01 -8.10 %
AUC h*mg/L 130 8.80 134 10.3 2.85 %
kel h-1
0.24 0.01 0.24 0.04 -0.15 %
p.o. (10 mg/kg)
tmax h 5.00 1.10 6.00 0.00 20.0 %
Cmax mg/L 19.5 2.69 21.1 0.08 8.57 %
AUC h*mg/L 208 78.2 180 36.0 -13.4 %
kel, app h-1
0.16 0.08 0.15 0.04 -6.77 %
MRT h 6.30 1.22 5.96 1.08 -5.47 %
F 0.95 0.31 0.81 0.17 -14.3 %

50
The hypoglycemic interaction of gliclazide and fosinopril was not seen in the control
rats. Interaction was only visible in the rat model of diabetes after the oral glucose
tolerance test and the blood glucose concentration measurements. Therefore, only the
results of the GK rats will be reported here. The results of GK rats after a single dose
and after multiple doses of gliclazide alone or gliclazide and fosinopril together were
similar. Therefore only the results after repeated dosing will be reported here.
Figure 9. Plasma concentration-time profiles after i.v. administration of gliclazide alone
and with fosinopril in the rat model of diabetes (n=1-3, med min-max).
The concentration–time profiles for gliclazide alone and for gliclazide with fosinopril
after i.v. and p.o. administration in rat model of diabetes were similar (Figure 9 and
Figure 10). The mean pharmacokinetic (PK) parameters of gliclazide alone and with
fosinopril are shown in Table 7. There was no significant unequivocal difference in the
pharmacokinetics of gliclazide between the administration of gliclazide alone and the
administration with fosinopril either after i.v. or p.o. dosing. After i.v. dosing CL and V
were 9.38% and 8.10% smaller for gliclazide with fosinopril (0.013 L/h; 0.055 L) than
for gliclazide alone (0.015 L/h; 0.060 L). AUC was 2.85 % greater and kel only 0.15 %
smaller after combination treatment (134 h*mg/L; 0.24 h-1
) compared to gliclazide
treatment (130 h*mg/L; 0.24 h-1
).
0
10
20
30
40
50
60
0 2 4 6 8 10
Co
nce
ntr
atio
n o
f gli
claz
ide
(mg/L
)
Time (h)
combination
gliclazide

51
Figure 10. Plasma concentration-time profiles after p.o. administration of gliclazide
alone and with fosinopril in the rat model of diabetes (n=1-3, med min-max).
After p.o. dosing tmax was 20.0 % greater for gliclazide with fosinopril (6.00 h) than for
gliclazide alone (5.00 h), but AUC was 13.4% smaller for gliclazide with fosinopril
(180 h*mg/L) than for gliclazide alone (208 h*mg/L) (Table 7). MRT was 5.47% and F
14.3% smaller after combination treatment (5.96 h; 0.81) than after gliclazide treatment
(6.30 h; 0.95). After p.o. administration of gliclazide with fosinopril, Cmax was 8.57%
greater and kel, app 6.77% smaller than after administration of gliclazide alone. Under the
circumstances, the interaction between gliclazide and fosinopril seemed not to be
pharmacokinetic.
8.5 Pharmacokinetics of gliclazide in control rat and rat model of diabetes
The concentration–time profiles for gliclazide after p.o. and i.v. administration in
control rats and in rat model of diabetes are shown in Figure 11 and Figure 12. The
profile was similar in WI and GK rats but bigger in GK rats. The mean pharmacokinetic
parameters are shown in
Table 8. Results of the control and diabetic groups receiving gliclazide alone after
repeated dosing will be discussed in more detail here. Results of the groups receiving
combination treatment after single and repeated dosing and results of the groups
0
5
10
15
20
25
0 4 8 12 16 20 24
Co
nce
ntr
atio
n o
f gli
claz
ide
(mg/L
)
Time (h)
combination
gliclazide

52
receiving gliclazide after single dosing were all similar and comparable with the results
shown here.
Table 8. The pharmacokinetic parameters and the percent of difference of gliclazide in
control rats and in rat model of diabetes (n=6-9, mean SD).
control rat SD rat model of diabetes SD % of change
i.v. (6 mg/kg)
CL L/h 0.024 0.01 0.015 0.00 -40.7 %
V L 0.065 0.02 0.060 0.01 -6.85 %
AUC h*mg/L 102 30.1 130 8.80 27.3 %
kel h-1
0.39 0.09 0.24 0.01 -37.7 %
p.o. (10 mg/kg)
tmax h 2.67 1.94 5.00 1.10 87.5 %
Cmax mg/L 20.6 1.49 19.5 2.69 -5.68 %
AUC h*mg/L 131 13.3 208 78.2 58.9 %
kel, app h-1
0.15 0.04 0.16 0.08 6.59 %
MRT h 4.47 0.28 6.30 1.22 41.0 %
F 0.81 0.17 0.95 0.31 17.2 %
Figure 11. Plasma concentration-time profiles of gliclazide after i.v. administration in
control rats and in rat model of diabetes (n=1-3, med min-max).
After i.v. administration, the CL of gliclazide was 40.7% smaller in the rat model of
diabetes (0.015 L/h) than in control rats (0.024 L/h) (
0
10
20
30
40
50
60
70
80
90
0 2 4 6 8 10
Co
nce
ntr
atio
n o
f gli
claz
ide
(m
g/L
)
Time (h)
rat model of diabetes
normal rat

53
Table 8). Volume of distribution was similar in the rat model of diabetes (0.060 L) and
in the control rats (0.065 L) with the percent of difference of 6.85%. In accordance with
CL, AUC was 27.3 % greater in the rat model of diabetes (130 h*mg/L) than in control
rats (102 h*mg/L). The elimination rate constant was also smaller in the rat model of
diabetes (0.24 h-1
) compared to normal rats (0.39 h-1
). In conclusion, the elimination of
gliclazide in the rat model of diabetes seemed to be slower than in control rats after
intravenous administration.
Figure 12. Plasma concentration-time profiles of gliclazide after p.o. administration in
control rats and in the rat model of diabetes (n=1-3, med min-max).
After p.o. administration gliclazide absorbed slower in the rat model of diabetes than in
control rats and tmax was different being 2.67 hours for control rats and 5.00 hours for
the rat model of diabetes (percent of difference 87.5%) (
Table 8). Cmax was similar, 20.6 mg/L for control rats and 19.5 mg/L for the rat model
of diabetes, with percent of difference of 5.68%. AUC and MRT were bigger for the rat
model of diabetes (208 h*mg/L; 6.30 h) than for control rats (131 h*mg/L; 4.47 h) with
percent of difference of 58.9% and 41.0%, and the oral bioavailability was better for the
rat model of diabetes (0.95) than for the control rats (0.81). The apparent elimination
rate constant of gliclazide was somewhat greater in the rat model of diabetes than in the
control rats with kel, app 6.59% bigger in the rat model of diabetes (0.16 h-1
) than in
control (0.15 h-1
) rats. In conclusion, pharmacokinetics of gliclazide in the rat model of
0
5
10
15
20
25
0 4 8 12 16 20 24
Co
nce
ntr
atio
n o
f gli
claz
ide
(mg/L
)
Time (h)
rat model of diabetes
normal rat

54
diabetes seemed to be slower and the bioavailability better than in the control rats after
per oral administration.
8.6 Pharmacokinetics of gliclazide after single and repeated dosing
The concentration–time profile for gliclazide after single and repeated p.o. and i.v.
administration in the rat model of diabetes are shown in Figure 13 and Figure 14. The
mean PK parameters are shown in Table 9. Results of the rat model of diabetes
receiving gliclazide alone are shown here. Similar results were also seen in control rats
receiving combination treatment or gliclazide alone, and in the rat model of diabetes
receiving combination treatment.
Table 9. The pharmacokinetic parameters and the percent of change after single and
repeated dosing of gliclazide in the rat model of diabetes (n=6-9, mean SD).
single dosing SD repeated dosing SD % of change
i.v. (6 mg/kg)
CL L/h 0.014 0.00 0.015 0.00 2.42 %
V L 0.063 0.01 0.060 0.01 -5.02 %
AUC h*mg/L 116 14.7 130 8.80 12.5 %
kel h-1
0.23 0.03 0.24 0.01 6.93 %
p.o. (10 mg/kg)
tmax h 4.67 1.00 5.00 1.10 7.14 %
Cmax mg/L 16.7 4.09 19.5 2.69 16.8 %
AUC h*mg/L 106 17.5 208 78.2 96.1 %
kel, app h-1
0.12 0.02 0.16 0.08 35.7 %
MRT h 5.18 0.18 6.30 1.22 21.6 %
F 0.58 0.14 0.95 0.31 63.9 %
After both single and repeated i.v. administration of gliclazide, the concentration-time
profile was similar (Figure 13 and Figure 14). The concentration-time curve was,
however, little bigger after repeated dosing, especially after repeated p.o. dosing. After
i.v. dosing, the clearance was similar, only 2.42% bigger after repeated (0.015 L/h)
compared to single (0.014 L/h) dosing (Table 9). Volume of distribution was also
similar after single dosing (0.063 L) and repeated dosing (0.060 L). Elimination rate
constant of gliclazide was bigger after repeated (0.24 h-1
) than after a single (0.23 h-1
)

55
dose with percent of change of 6.93%. The biggest difference in the pharmacokinetics
of gliclazide after single and repeated i.v. dosing was seen in the value of AUC. AUC
was greater, 130 h*mg/L, after repeated dosing compared to 116 h*mg/L after a single
dose, with the percent of change of 12.5%. In conclusion, pharmacokinetics after a
single intravenous dose of gliclazide was somewhat similar than after repeated dosing.
Figure 13. I.v. plasma concentration-time profiles after single and repeated dosing of
gliclazide in the rat model of diabetes (n=1-3, med min-max).
Tmax was similar after repeated per oral dosing (5.00 h) and after a single per oral dose
(4.67 h) of gliclazide with percent of change of 7.14% in the rat model of diabetes
(Table 9). AUC and Cmax were different after single and repeated dosing. Oral
bioavailability was also better after repeated dosing (0.95) than after a single dose
(0.58). Cmax and AUC were 16.8% and 96.1% greater after repeated (19.5 mg/L; 208
h*mg/L) than after single (16.7 mg/L; 106 h*mg/L) dosing. Elimination rate constant of
gliclazide was also different after repeated dosing compared to a single dose with kel
35.7% greater after repeated (0.16 h-1
) dosing than after a single (0.12 h-1
) dose. MRT
was greater after repeated dosing (6.30 h) compared to single dosing (5.18 h) with
percent of change of 21.6%, respectively. In conclusion, pharmacokinetics of gliclazide
in the rat model of diabetes after a single per oral dose of gliclazide seemed to be
different compared to repeated dosing.
0
10
20
30
40
50
60
70
0 2 4 6 8 10
Co
nce
ntr
atio
n o
f gli
claz
ide
(mg/L
)
Time (h)
single dosing
repeated dosing

56
Figure 14. P.o. plasma concentration-time profiles after single and repeated dosing of
gliclazide in the rat model of diabetes (n=1-3, med min-max).
9 DISCUSSION
The aim of the experimental research was to study the hypoglycemic interaction of
fosinopril and gliclazide in control rats and in a rat model of diabetes by studying the
effects of fosinopril on the pharmacokinetics of gliclazide. ACE inhibitors and
sulphonylureas have been documented to have an interaction, which produces a greater
decrease in blood glucose concentrations in human patients than a sulphonylurea alone
(Arauz-Pacheco et al. 1990; Herings et al. 1995; Moore et al. 1997; Morris et al. 1997;
Thamer et al. 1999). The mechanism of this interaction is not known. In this study the
mechanism of the interaction was studied and it was hypothesized to be
pharmacokinetic. Also the effects of experimental diabetes on pharmacokinetics of
gliclazide after single and repeated dosing were studied. To study the pharmacokinetics
of the test items, approximately 700 plasma samples were collected after single and
repeated per oral and/or intravenous administration. A HPLC-MS/MS method was
developed for the measurement of the test item concentrations in the plasma samples,
and the pharmacokinetic parameters were determined. Plasma glucose concentrations
were determined regularly during the study to explore the effects of the test items on
0
5
10
15
20
25
0 4 8 12 16 20 24
Co
nce
ntr
atio
n o
f gli
claz
ide
(mg/L
)
Time (h)
single dosing
repeated dosing

57
blood glucose. Oral glucose tolerance test was performed at baseline and in the end of
the study.
There were a lot of problems, which were solved during the analysis of the test items.
The analytical procedure of Cui et al. (2007), which was validated for fosinopril, was
developed further to also cover gliclazide. The concentrations for fosinoprilat were very
low, the peak shapes were poor at times and the contamination in the analytical system
was remarkable. To improve these, the buffer concentration was changed, the pH was
changed and washes were added between the samples and the batches. The injection
volume had to also be changed when the concentrations of gliclazide were too high. The
conditions were optimized, however, and a validated HPLC-MS/MS method was
developed. Some samples could not be analyzed due to human errors and some had to
be excluded, which diminished the number of parallel samples.
Some problems also occurred during the administration of the test substances to the test
animals. Some samples had to be excluded because administration had failed, and some
rats had to be eliminated due to errors in administration. A few animals also died due to
reasons not related to the study. These factors also diminished the number of parallel
samples. The number of parallel samples was only three in some cases and this
deteriorates the reliability of the results. More research is therefore needed to verify the
results of this sudy.
The test items for the study were chosen on the basis of the work of El-Batran and
coworkers (2004). Gliclazide and fosinopril were shown to decrease blood glucose
concentration in rats more when administered concurrently than when gliclazide was
administered alone. Rats were given 10 mg/kg of gliclazide and/or fosinopril orally in
this study. The doses were chosen on the basis of literature. Dachicourt and coworkers
(1998) reported that the dose of 10 mg/kg of gliclazide produces plasma levels of
gliclazide similar to those seen in humans. They also reported that this dose results in an
increase in insulin secretion in control rats and in a rat model of diabetes similar to that
seen in humans. Grove and coworkers (1995) wrote that the dose of 10 mg/kg of
fosinopril is scaled to match a human clinical treatment dose of 1 mg/kg/day.

58
Gliclazide has been reported to have variable effects on plasma and blood glucose
concentration in rats. Dachicourt et al. (1998) for example studied the effect of
gliclazide (10 mg/kg/day) in Wistar and Goto Kakizaki rats for four weeks, and reported
plasma glucose levels of 10.7 mmol/L for untreated GK rats, 8.1 mmol/L for treated GK
rats and 6.6 mmol/L for untreated WI rats at the end of the experiment. Dachicourt and
coworkers measured plasma glucose concentration instead of blood glucose, and plasma
glucose levels are 10-15 % higher than blood glucose concentrations. In the work of
Louro et al. (2011), GK rats receiving a high cholesterol diet were administered 10
mg/kg/day of gliclazide in drinking water for one month. At the end of the study, their
blood glucose levels were 7.8 mmol/L for untreated and 5.5 mmol/L for treated rats.
Sena et al. (2009) administered 10 mg/kg/day gliclazide for four weeks for GK rats fed
on a high-fat diet. Blood glucose concentrations were also 7.8 mmol/L for untreated rats
and 5.5 mmol/L for treated rats. These results are in accordance, and in all of these
studies gliclazide affected the glucose concentration remarkably. The results show that
gliclazide can be used to study the effects of gliclazide in Goto-Kakizaki rats. In the
current study, blood glucose concentrations were 8.3 mmol/L for the control GK rats
(=fosinopril group), 8.3 mmol/L for gliclazide treated GK rats, 6.2 mmol/L for control
WI rats (=fosinopril group) and 5.7 mmol/L for gliclazide treated WI rats after six
weeks of gliclazide or fosinopril administration. In control, but not in the rat model of
diabetes, there is a small difference between treated and untreated individuals. Either
gliclazide does not lower the blood glucose concentration in GK rats compared to
controls, or fosinopril also lowers the blood glucose concentration. There are studies
indicating that ACE inhibitors would have an effect on blood glucose concentrations but
the impact is not clear (Murad et al. 2009). Compared to the results of the other studies,
gliclazide had virtually no effect on the blood glucose concentrations in this study. Also
the difference in blood glucose concentrations in different groups between the
beginning and the end in this study was minor. One reason may be that diabetes had not
broken out in the studied rats in the beginning of the study. Another explanation could
be that the daily gliclazide administration was performed after the measurement of
blood glucose concentration. A stronger effect might have been seen if gliclazide was
administered a certain period of time before the experiment on the days of the blood
glucose concentration measurements. Gliclazide is known to increase -cell insulin

59
stores and increase the glucose-induced insulin release in the adult GK rats (Dachicourt
et al. 1998). It would have been easy and informative also to measure insulin levels
during the study.
El-Batran et al. (2004) used a similar study design as was used in this study. They
administered gliclazide (7.2 mg/kg) and fosinopril (0.9 mg/kg) separately and
concurrently to control (Sprague-Dawley) rats and alloxan-induced rat model of
diabetes for 30 days and performed serum glucose measurements every two weeks. All
drugs showed an effect on serum glucose levels. Gliclazide decreased glucose levels
from 5.4 mmol/L to 4.1 mmol/L in control rats and from 11.8 mmol/L to 8.8 mmol/L in
the rat model of diabetes during the study. Fosinopril decreased glucose levels less,
from 5.3 mmol to 4.7 mmol/L in control and from 11.6 mmol/L to 10.0 mmol/L in the
rat model of diabetes. Gliclazide and fosinopril administered together had the greatest
impact on the serum glucose concentrations during the study. Concurrent administration
decreased glucose levels from 5.6 mmol/L to 4.1 mmol/L in control and from 11.3
mmol/L to 8.2 mmol/L in the rat model of diabetes. The decreases in percentages vary
from 12% for fosinopril to 38% for concurrent gliclazide and fosinopril administration.
Serum glucose levels are about 15% higher than blood glucose levels.
In the current study, blood glucose concentrations were determined weekly from all rats
except when pharmacokinetic experiments were performed. Blood glucose
concentrations in the rat model of diabetes (7.3-8.9 mmol/L) were higher in all groups
compared to control rats (5.4-6.2 mmol/L) during the entire experiment. The
administration of gliclazide, fosinopril or gliclazide and fosinopril concurrently had no
significant effect on the blood glucose concentration in control rats. In the rat model of
diabetes, however, gliclazide and fosinopril had a similar small effect on the blood
glucose concentrations and gliclazide and fosinopril administered together produced a
bigger effect. The percents of change in the study of el-Batran et al. (2004) were,
however, considerably greater than in the current study. In this study the percentages
vary from a 2.5% increase for fosinopril to an 8.5% decrease for combination
medication. According to the results of this study, gliclazide and fosinopril might have

60
an additive effect on blood glucose concentration in Goto Kakizaki rats when
administered simultaneously, but the effect is rather feeble.
Someya et al. (2009) administered 10 mg/kg gliclazide to Zucker fatty rats for two
weeks and performed an OGT test after the first and the last dose. Gliclazide had a more
significant effect on the AUC of the OGT test after the first dose of gliclazide, but had
no effect after the last dose. This, in their opinion, is due to secondary failure.
Secondary failure is a state known to occur in some patients after a period of time using
sulphonylureas. For an unknown reason, the effect of sulphonylureas on blood glucose
levels weakens. Also in the current study gliclazide first caused a decrease in the blood
glucose levels in most groups but in many groups the levels increased again toward the
end of the study. This could be explained by the secondary failure. The study of
Someya et al. (2009) on Zucker fatty rats lasted for two weeks but secondary failure in
humans occurs after years of sulphonylurea use.
In the previous studies, administration of gliclazide has virtually had no effect on the
outcome of OGT test in GK rats. Sena with coworkers (2009) and Louro with
coworkers (2011) reported that the 2-hour glucose concentration value after a glucose
load was actually higher in gliclazide treated (17.6 mmol/L; 19.0 mmol/L) than in non-
treated rats (16.8 mmol/L; 16.8 mmol/L). Dachicourt and coworkers (1998) reported a
marginally lower incremental plasma glucose area for gliclazide treated rats (20.8
min*mmol/L) than for non-treated rats (21.4 min*mmol/L). These results are in
agreement with the results of this study. In this study, the administration of gliclazide
alone had no effect on the AUC of OGT test in the rat model of diabetes and in control
rats. In control rats, the administration of fosinopril or gliclazide and fosinopril
concurrently had no significant effect either. In the rat model of diabetes, however, the
administration of gliclazide and fosinopril concurrently lowered the AUC of OGT test.
In accordance with the results of plasma blood glucose concentration measurement,
gliclazide and fosinopril seem to have an additive effect on the AUC of OGT test. Also
fosinopril alone had a minor effect. The oral glucose tolerance test was performed in the
beginning and at the end of the study. The AUC of OGT test was significantly greater

61
for the rat model of diabetes (18.6-27.0 h*mmol/L) than for control rats (3.54-4.21
h*mmol/L).
Pharmacokinetics of gliclazide has been reported to differ between control rats and rat
models of diabetes in several studies (Stetinová et al. 2007; Al-Salami et al. 2008;
Mikov et al. 2008; Talari et al. 2010). Al-Salami with coworkers and Mikov with
coworkers administered 20 mg/kg gliclazide to control Wistar rats and compared them
with alloxan-induced (30 mg/kg) rat model of diabetes. They reported greater gliclazide
plasma concentrations for control than for the rat model of diabetes. Stetinová and
coworkers (2007) administered 25 mg/kg gliclazide to control Wistar rats and to
alloxan-induced (50 mg/kg) rat model of diabetes. They found slightly higher gliclazide
concentration in the rat model of diabetes than in control rats. Talari and coworkers
(2010) induced diabetes to Wistar rats using an intraperitoneal injection of
streptozotocin (45 mg/kg) and compared them to control Wistar rats. After
administration of 40 mg/kg of gliclazide, they reported similar pharmacokinetic
parameters for control rats and for rat model of diabetes. These results partly agree with
the results seen in this study. A difference was found in all groups in the
pharmacokinetics of gliclazide when control rats and the rat model of diabetes were
compared. Plasma concentrations of gliclazide were higher in the rat model of diabetes
and pharmacokinetic parameters were greater for them. The pharmacokinetics of
gliclazide was slower in the rat model of diabetes, especially when measured at the end
of the study. These results indicate that it is important to study drugs also on animal
models and not only in normal animals.
In the current study, no significant difference was seen in the pharmacokinetics of
control rats and the rat model of diabetes when they were compared after the
administration of gliclazide and fosinopril concurrently or gliclazide alone. The
hypoglycemic interaction, which can be seen in GK rats after blood glucose
concentration measurement and OGT test, is thus probably not pharmacokinetic. A
difference was also seen in the pharmacokinetics of gliclazide after single compared to
repeated dosing. The pharmacokinetics of gliclazide is slower after repeated than after
single dosing. A similar change was seen in all the groups receiving gliclazide.

62
Although several papers have been written concerning the hypoglycemic interaction of
sulphonylureas and ACE inhibitors, including this study, it still remains unclear, what is
the mechanism of the interaction and the actual significance and severity of it. Also the
influences of ACE inhibitors on glucose metabolism are still contradictory. The results
of this study refer, that there is a non-pharmacokinetic interaction and that ACE
inhibitors do have an effect on glucose metabolism. In the future, the interaction and the
effects of ACE inhibitors should be studied systematically using different
sulphonylureas and ACE inhibitors under a similar study design. It is possible that the
effects are greater in certain ACE inhibitors and sulphonylureas than others.
There are more than 200 million people with type 2 diabetes mellitus in the world, and a
great percentage of them use sulphonylureas as medication, though new, more effective
drugs conquer the markets. People with type 2 diabetes mellitus are in a greater risk for
kidney and cardiovascular diseases and they are thus also on medication for for example
cholesterol and hypertension. This polypharmacy is a serious risk for drug-drug
interactions, which can lead to unnecessary use of drugs, expensive hospitalizations or
even death. For example sulphonylureas and ACE inhibitors have been reported to
cause hypoglycemic episodes in patients with type 2 diabetes mellitus when used
concurrently. This was also shown in the current study. On a daily basis, hypoglycemia
is mostly an unpleasant disorder for patients with type 2 diabetes mellitus but it can
even be life threatening. To prevent the unease caused to the patients and the extra costs
to the society, it is very important to study drug interactions and to understand their
mechanism. It is also very important to study drug interactions in animal models and
not only in control rats because many diseases are known to affect the behavior of the
drugs in the system.
10 CONCLUSIONS
Gliclazide, a sulphonylurea, lowers blood glucose levels in Goto Kakizaki rats more
when administered with fosinopril, an ACE inhibitor, than when administered alone.
This is shown in the results of blood glucose concentration measurement and OGT test.

63
On the basis of the pharmacokinetic studies performed in this study, the mechanism of
the interaction seems not to be pharmacokinetic. It might be additive pharmacodynamic.
Based on the results of this study, the pharmacokinetics of gliclazide seems to be slower
in the rat model of diabetes than in the control rats. The pharmacokinetics of gliclazide
also seems to change over time when it is repeatedly administered per orally. More
research is, however, needed to verify the results.

64
11 REFERENCES
Abbott CA, Vileikyte L, Williamson S, Carrington AL, Boulton AJ: Multicenter study
of the incidence of and predictive risk factors for diabetic neuropathic foot ulceration.
Diabetes Care 21: 1071-1075, 1998
Abdel-Halim SM, Guenifi A, Efendić S, Ostenson CG: Both somatostatin and insulin
responses to glucose are impaired in the perfused pancreas of the spontaneously
noninsulin-dependent diabetic GK (Goto-Kakizaki) rats. Acta Physiol Scand 148: 219-
226, 1993
Adler IA, Boyko EJ, Ahroni JH, Stensel V, Forsberg RC, Smith DG: Risk factors for
diabetic peripheral sensory neuropathy. Results from the Seattle Prospective Diabetic
Foot Study. Diabetes Care 20: 1162-1167, 1997
Adler AI, Stratton IM, Neil HA, Yudkin JS, Matthews DR, Cull CA, Wright AD,
Turner RC, Holman RR: Association of systolic blood pressue with macrovascular and
microvascular complications of type 2 diabetes: prospective observational study. British
Medical Journal 321: 412-419, 2000
Adler AI, Stevens RJ, Manley SE, Bilous RW, Cull CA, Holman RR: Development and
progression of nephropathy in type 2 diabetes: the United Kingdom Prospective
Diabetes Study (UKPDS 64). Kidney Int 63: 225-232, 2003
Agardh CD, Agardh E, Zhang H, Ostenson CG: Altered endothelial/pericyte ratio in
Goto-Kakizaki rat retina. J Diabetes Complications 11: 158-162, 1997
Ahrén B: Clinical results of treating type 2 diabetic patients with sitagliptin, vildagliptin
or saxagliptin -diabetes control and potential adverse events. Best Pract Res Clin
Endocrinol Metab 23: 487-498, 2009
Ali S, Dornhorst A: Diabetes in pregnancy: health risks and management. Postgrad
Med J 87: 417-427, 2011
Al-Salami H, Butt G, Fawcett JP, Tucker IG, Golocorbin-Kon S, Mikov M: Probiotic
treatment reduces blood glucose levels and increases systemic absorption of gliclazide
in diabetic rats. Eur J Drug Metab Pharmacokinet 33: 101-106, 2008
Arauz-Pacheco C, Ramirez LC, Rios JM, Raskin P: Hypoglycemia induced by
angiotensin-converting enzyme inhibitors in patients with non-insulin-dependent
diabetes receiving sulfonylurea therapy. Am J Med 89: 811-813, 1990
Baggio LL, Drucker DJ: Biology of incretins: GLP-1 and GIP. Gastroenterology 132:
2131-2157, 2007
Balfour JA, Faulds D: Repaglinide. Drugs Aging 13: 173-180, 1998

65
Bisbis S, Bailbe D, Tormo MA, Picarel-Blanchot F, Derouet M, Simon J, Portha B:
Insulin resistance in the GK rat: decreased receptor number but normal kinase activity
in liver. Am J Physiol 265: E807-813, 1993
Bischoff H: Pharmacology of alpha-glucosidase inhibition. Eur J Clin Invest 24 Suppl
3: 3-10, 1994
Bunnag SC, Warner NE, Bunnag S: Effect of alloxan on the mouse pancreas during and
after recovery from diabetes. Diabetes 16: 83-89, 1967
Cheatham B, Kahn CR: Insulin action and the insulin-signaling network. Endocr Rev
16: 117-142, 1995
Chen S, Noguchi Y, Izumida T, Tatebe J, Katayama S: A comparison of the
hypotensive and hypoglycaemic actions of an angiotensin converting enzyme inhibitor,
an AT1a antagonist and troglitazone. J Hypertens 14: 1325-30, 1996
Chiasson JL, Josse RG, Gomis R, Hanefeld M, Karasik A, Laakso M; STOP-NIDDM
Trail Research Group: Acarbose for prevention of type 2 diabetes mellitus: the STOP-
NIDDM randomised trial. Lancet 359: 2072-2077, 2002
Chiasson JL, Josse RG, Gomis R, Hanefeld M, Karasik A, Laakso M, STOP-NIDDM
Trial Research Group: Acarbose treatment and the risk of cardiovascular disease and
hypertension in patients with impaired glucose tolerance: the STOP-NIDDM trial.
JAMA 290: 486-494, 2003
Chen J, Radford MJ, Wang Y, Marciniak TA, Krumholz HM: Effectiveness of beta-
blocker therapy after acute myocardial infarction in elderly patients with chronic
obstructive pulmonary disease or asthma. J Am Coll Cardiol 37: 1950-1956, 2001
Clark JB, Palmer CJ, Shaw WN: The diabetic Zucker fatty rat. Proc Soc Exp Biol Med
173: 68-75, 1983
Colagiuri S, Cull CA, Holman RR: Are lower fasting plasma glucose levels at diagnosis
of type 2 diabetes associated with improved outcomes? Diabetes Care 25: 1410-1417,
2002
Cui S, Feng F, Ma M, Liu H, Chen Y: Development and validation of liquid
chromatography-tandem mass spectrometric method for simultaneous determination of
fosinopril and its active metabolite fosinoprilat in human plasma. J Chromatogr B
Analyt Technol Biomed Life Sci 854: 143-151, 2007
Cull CA, Manley S, Frighi V, Holman RR, Turner RC: Urinary albumin excretion over
3 years in diet-treated Type 2 (non-insulin-dependent) diabetic patients, and association
with hypertension, hyperglycaemia and hypertriglyceridaemia. Diabetologia 36: 1021-
1029, 1993

66
Dahan A, Aarts L, Smith TW: Incidence, Reversal, and Prevention of Opioid-induced
Respiratory Depression. Anesthesiology 112: 226-238, 2010
Dachicourt N, Bailbé D, Gangnerau MN, Serradas P, Ravel D, Portha B: Effect of
gliclazide treatment on insulin secretion and beta-cell mass in non-insulin dependent
diabetic Goto-Kakisaki rats. Eur J Pharmacol 361: 243-251, 1998
Danis RP, Yang Y: Microvascular retinopathy in the Zucker diabetic fatty rat. Invest
Ophthalmol Vis Sci 34: 2367-2371, 1993
Daousi C, MacFarlane IA, Woodward A, Nurmikko TJ, Bundred PE, Benbow SJ:
Chronic painful peripheral neuropathy in an urban community: a controlled comparison
of people with and without diabetes. Diabet Med 21: 976-982, 2004
Davis TM, Millns H, Stratton IM, Holman RR, Turner RC: Risk factors for stroke in
type 2 diabetes mellitus: United Kingdom Prospective Diabetes Study (UKPDS) 29.
Archives of Internal Medicine 159: 1097-1103, 1999
Day C: Thiazolidinediones: a new class of antidiabetic drugs. Diabet Med 6: 179-192,
1999
DeFronzo RA, Goodman AM: Efficacy of metformin in patients with non-insulin-
dependent diabetes mellitus. The Multicenter Metformin Study Group. N Engl J Med
333: 541-549, 1995
Diabetesliitto: Diabetes estimates retrieved from the internet 26.10.2011:
http://www.diabetes.fi/diabetestietoa/ yleista_diabeteksesta/tilastotietoa
Dunn JS, Sheehan HL, McLethie NG: Necrosis of islets of Langerhans produced
experimentally. Lancet 1: 484-487, 1943
Dunn CJ, Faulds D: Nateglinide. Drugs 60: 607-615, 2000
Duodecim: Käypä hoito recommendation for diabetes 2011. Retrieved from the internet
19.1.2012: http://www.kaypahoito.fi/web/kh/suositukset/naytaartikkeli/tunnus/hoi50056
Ebert U, Thong NQ, Oertel R, Kirch W: Effects of rifampicin and cimetidine on
pharmacokinetics and pharmacodynamics of lamotrigine in healthy subjects. Eur J Clin
Pharmacol 56: 299-304, 2000
el-Batran SA, el-Shenawy SM, Nofal SM, Abdel-Salam OM, Arbid MS: Studies on the
glycemic and lipidemic effect of monopril and losartan in normal and diabetic rats.
Pharmacol Res 50: 131-136, 2004
Endres CJ, Hsiao P, Chung FS, Unadkat JD: The role of transporters in drug
interactions. Eur J Pharm Sci 27: 501-517, 2006

67
Etgen GJ, Oldham BA: Profiling of Zucker diabetic fatty rats in their progression to the
overt diabetic state. Metabolism 49: 684-688, 2000
European Medicines Agency, Committee for Human Medicinal Products: Guideline on
the Investigation of Drug Interactions, 2010
Everett BM, Glynn RJ, Danielson E, Ridker PM: Combination therapy versus
monotherapy as initial treatment for stage 2 hypertension: a prespecified subgroup
analysis of a community-based, randomized, open-label trial. Clin Ther 30: 661- 672,
2008
Feher MD, Amiel S: ACE inhibitors and hypoglycaemia. Lancet 346: 125-126, 1995
Galli J, Li LS, Glaser A, Ostenson CG, Jiao H, Fakhrai-Rad H, Jacob HJ, Lander ES,
Luthman H: Genetic analysis of non-insulin dependent diabetes mellitus in the GK rat.
Nat Genet 12: 31-37, 1996
Gauguier D, Froguel P, Parent V, Bernard C, Bihoreau MT, Portha B, James MR,
Penicaud L, Lathrop M, Ktorza A: Chromosomal mapping of genetic loci associated
with non-insulin dependent diabetes in the GK rat. Nat Genet 12: 38-43, 1996
Giroix MH, Portha B, Kergoat M, Bailbe D, Picon L: Glucose insensitivity and amino-
acid hypersensitivity of insulin release in rats with non-insulin-dependent diabetes. A
study with the perfused pancreas. Diabetes 32: 445-451, 1983
Goto Y, Kakizaki M, Masaki N: Production of spontaneous diabetic rats by repetition of
selective breeding. Tohoku J Exp Med 119: 85-90, 1976
Goto Y, Kakizaki M: The spontaneous-diabetes rat: A model of noninsulin dependent
diabetes mellitus. Proc Japan Acad Ser B 57: 381-384, 1981
Goto Y, Suzuki K, Ono T, Sasaki M, Toyota T: Development of diabetes in the non-
obese NIDDM rat (GK rat). Adv Exp Med Biol 246: 29-31, 1988
Griffen SC, Wang J, German MS: A genetic defect in beta-cell gene expression
segregates independently from the fa locus in the ZDF rat. Diabetes 50: 63-68, 2001
Groop LC, Tuomi T: Non-insulin-dependent diabetes mellitus -a collision between
thrifty genes and an affluent society. Ann Med 29: 37-53, 1997
Grove KL, Mayo RJ, Forsyth CS, Frank AA, Speth RC: Fosinopril treatment of
pregnant rats: developmental toxicity, fetal angiotensin-converting enzyme inhibition,
and fetal angiotensin II receptor regulation. Toxicol Lett 80: 85-95, 1995
Gu K, Cowie CC, Harris MI: Mortality in adults with and without diabetes in a national
cohort of the US population, 1971–1993. Diabetes Care 21: 1138–1145, 1998

68
Guenifi A, Abdel-Halim SM, Höög A, Falkmer S, Ostenson CG: Preserved beta-cell
density in the endocrine pancreas of young, spontaneously diabetic Goto-Kakizaki (GK)
rats. Pancreas 10: 148-53, 1995
Harris MI: Undiagnosed NIDDM: clinical and public health issues. Diabetes Care 16:
642-652, 1993
Heart Outcomes Prevention Evaluation (HOPE) Study Investigators: Effects of ramipril
on cardiovascular and microvascular outcomes in people with diabetes mellitus: results
of the HOPE study and MICRO-HOPE substudy. Lancet 355: 253-259, 2000
Herings RM, de Boer A, Stricker BH, Leufkens HG, Porsius A: Hypoglycaemia
associated with use of inhibitors of angiotensin converting enzyme. Lancet 345: 1195-
1198, 1995
Hines LE, Murphy JE: Potentially Harmful Drug-Drug Interactions in the Elderly: A
Review. Am J Geriatr Pharmacother 9: 364-377, 2011
Holman RR, Cull CA, Turner RC: A randomized double-blind trial of acarbose in type
2 diabetes shows improved glycemic control over 3 years. Diabetes Care: 960-964,
1999
Holman RR, Paul SK, Bethel MA, Matthews DR, Neil HA: 10-Year Follow-up of
Intensive Glucose Control in Type 2 diabetes. N Eng J Med 359: 1577-1589, 2008a
Holman RR, Paul SK, Bethel MA, Neil HA, Matthews DR: Long-Term Follow-up after
Tight Control of Blood Pressure in Type 2 diabetes. N Eng J Med 359: 1565-1576,
2008b
Hondeghem LM, Dujardin K, Hoffmann P, Dumotier B, De Clerck F: Drug-induced
QTC prolongation dangerously underestimates proarrhythmic potential: lessons from
terfenadine. J Cardiovasc Pharmacol 57: 589-597, 2011
Hundal RS, Krssak M, Dufour S, Laurent D, Lebon V, Chandramouli V, Inzucchi SE,
Schumann WC, Petersen KF, Landau BR, Shulman GI: Mechanism by which
metformin reduces glucose production in type 2 diabetes. Diabetes 49: 2063-2069, 2000
International Diabetes Federation: Diabetes Atlas: Diabetes estimates retrieved from the
internet 20.7.2011: http://www.idf.org/node/23640
Junod A, Lambert AE, Stauffacher W, Renold AE. Diabetogenic action of
streptozotocin. Proc Soc Exp Biol Med 26: 201-205, 1967
Joy MS: Impact of glomerular kidney diseases on the clearance of drugs. J Clin
Pharmacol 52: 23S-34S, 2012
Jyrkkä J, Hartikainen S, Sulkava R, Enlund H: Vanhusten monilääkitys huolen aiheena.
Tuloksia Kuopio 75+ -tutkimuksesta. Suom Lääkäril 61: 984-986, 2006

69
Järvelä IY, Juutinen J, Koskela P, Hartikainen AL, Kulmala P, Knip M, Tapanainen JS:
Gestational diabetes identifies women at risk for permanent type 1 and type 2 diabetes
in fertile age: predictive role of autoantibodies. Diabetes Care 29: 607-612, 2006
Kangas T: Diabeetikkojen terveyspalvelut ja niiden kustannukset. Studies in Social
Security and Health 67, KELA, 2002
King AB: A Comparison in a Clinical Setting of the Efficacy and Side Effects of Three
Thiazolidinediones. Diabetes Care 23: 557-557, 2000
Knowler WC, Barrett-Connor E, Fowler SE, Hamman RF, Lachin JM, Walker EA,
Nathan DM: Reduction in the incidence of type 2 diabetes with lifestyle intervention or
metformin. N Engl J Med 346: 393-403, 2002
Kohner EM, Aldington SJ, Stratton IM, Manley SE, Holman RR, Matthews DR, Turner
RC: Diabetic retinopathy at diagnosis of non-insulin-dependent diabetes mellitus and
associated risk factors. Arch Ophthalmol 116: 297-303, 1998
Kohner EM, Stratton IM, Adlington SJ, Turner RC: Microaneurysms in the
development of diabetic retinopathy. Diabetologia 42: 1107-1112, 1999
Kolterman OG, Olefsky JM: The impact of sulfonylurea treatment upon the
mechanisms responsible for the insulin resistance in type II diabetes. Diabetes Care 7
Suppl 1: 81-88, 1984
Kolterman OG, Kim DD, Shen L, Ruggles JA, Nielsen LL, Fineman MS, Baron AD:
Pharmacokinetics, pharmacodynamics, and safety of exenatide in patients with type 2
diabetes mellitus. Am J Health Syst Pharm 62: 173-181, 2005
Kristoff CA, Hayes PE, Barr WH, Small RE, Townsend RJ, Ettigi PG: Effect of
ibuprofen on lithium plasma and red blood cell concentrations. Clin Pharm 5: 51-55,
1986
Landin K, Tengborn L, Smith U: Treating insulin resistance in hypertension with
metformin reduces both blood pressure and metabolic risk factors. J Intern Med 229:
181-187, 1991
Lazarow A: Spontaneous recovery from alloxan diabetes in the rat. Diabetes 1: 363-
372, 1952
Louro TM, Matafome PN, Nunes EC, da Cunha FX, Seiça RM: Insulin and metformin
may prevent renal injury in young type 2 diabetic Goto-Kakizaki rats. Eur J Pharmacol
653: 89-94, 2011
Lukens FD: Alloxan diabetes. Physiol Rev 28: 304-330, 1948
70
Lyssenko V, Jonsson A, Almgren P, Pulizzi N, Isomaa B, Tuomi T, Berglund G,
Altshuler D, Nilsson P, Groop L: Clinical risk factors, DNA variants, and the
development of type 2 diabetes. N Engl J Med 359: 2220-2232, 2008
Manley SE, Stratton IM, Cull CA, Frighi V, Eeley EA, Matthews DR, Holman RR,
Turner RC, Neil HA: Effects of three months' diet after diagnosis of Type 2 diabetes on
plasma lipids and lipoproteins. Diabet Med 17: 518-523, 2000
Marceille JR, Goins JA, Soni R, Biery JC, Lee TA: Chronic heart failure-related
interventions after starting rosiglitazone in patients receiving insulin. Pharmacotherapy
24: 1317-1322, 2004
Masiello P, Broca C, Gross R, Roye M, Manteghetti M, Hillaire-Buys D, Novelli M,
Ribes G: Experimental NIDDM: development of a new model in adult rats administered
streptozotocin and nicotinamide. Diabetes 47: 224-229, 1998
Matthews DR, Stratton IM, Aldington SJ, Holman RR, Kohner EM: Risks of
progression of retinopathy and vision loss related to tight blood pressure control in type
2 diabetes mellitus. Archives of Ophthalmology 122: 1631-1640, 2004
Mauer S, Steffes M, Ellis E, Sutherland D, Brown D, Goetz FC: Structural-functional
relationships in diabetic nephropathy. J Clin Invest 74: 1143–1155, 1984
McCarver DG, Hines RN: The ontogeny of human drug-metabolizing enzymes: phase
II conjugation enzymes and regulatory mechanisms. J Pharmacol Exp Ther 300: 361-
366, 2002
McDonnell PJ, Jacobs MR: Hospital admissions resulting from preventable adverse
drug reactions. Ann Pharmacother 36: 1331-1336, 2002
Mikov M, Al-Salami H, Golocorbin-Kon S, Skrbic R, Raskovic A, Fawcett JP: The
influence of 3alpha,7alpha-dihydroxy-12-keto-5beta-cholanate on gliclazide
pharmacokinetics and glucose levels in a rat model of diabetes. Eur J Drug Metab
Pharmacokinet 33: 137-142, 2008
Miura T, Ueno K, Tanaka K, Sugiura Y, Mizutani M, Takatsu F, Takano Y, Shibakawa
M: Impairment of absorption of digoxin by acarbose. J Clin Pharmacol 38: 654-657,
1998
Miyamoto K, Ogura Y, Nishiwaki H, Matsuda N, Honda Y, Kato S, Ishida H, Seino Y:
Evaluation of retinal microcirculatory alterations in the Goto-Kakizaki rat. A
spontaneous model of non-insulin-dependent diabetes. Invest Ophthalmol Vis Sci 37:
898-905, 1996
Moore N, Kreft-Jais C, Haramburu F, Noblet C, Andrejak M, Ollagnier M, Bégaud B:
Reports of hypoglycaemia associated with the use of ACE inhibitors and other drugs: a
case/non-case study in the French pharmacovigilance system database. Br J Clin
Pharmacol 44: 513-518, 1997

71
Morgan CL, Jenkins-Jones S, Evans M, Barnett AH, Poole CD, Currie CJ: Weight
change in people with type 2 diabetes: secular trends and the impact of alternative
antihyperglycaemic drugs. Diabetes Obes Metab 14: 424-432, 2012
Morris AD, Boyle DI, McMahon AD, Pearce H, Evans JM, Newton RW, Jung RT,
MacDonald TM: ACE inhibitor use is associated with hospitalization for severe
hypoglycemia in patients with diabetes. Diabetes Care 20: 1363-1367, 1997
Movassat J, Saulnier C, Serradas P, Portha B: Impaired development of pancreatic beta-
cell mass is a primary event during the progression to diabetes in the GK rat.
Diabetologia 40: 916-925, 1997
Mullard A: The long Avandia endgame. Lancet 378: 113, 2011
Murad M, Coto-Yglesias F, Wang A, Sheidaee N, Mullan R, Elamin M, Erwin ,
Montori V: Drug-induced hypoglycemia: a systematic review. J Clin Endocrinol Metab
94: 741-745, 2009
Murakawa Y, Zhang W, Pierson CR, Brismar T, Ostenson CG, Efendic S, Sima AA:
Impaired glucose tolerance and insulinopenia in the GK-rat causes peripheral
neuropathy. Diabetes Metab Res Rev 18: 473-483, 2002
Navarro-Tableros V, Fiordelisio T, Hernández-Cruz A, Hiriart M: Physiological
development of insulin secretion, calcium channels, and GLUT2 expression of
pancreatic rat beta-cells. Am J Physiol Endocrinol Metab 292: E1018-1029, 2007
Neuvonen PJ, Olkkola KT: Activated charcoal and syrup of ipecac in prevention of
cimetidine and pindolol absorption in man after administration of metoclopramide as an
antiemetic agent. J Toxicol Clin Toxicol 22: 103-114, 1984
Niemi M, Backman JT, Granfors M, Laitila J, Neuvonen M, Neuvonen PJ: Gemfibrozil
considerably increases the plasma concentrations of rosiglitazone. Diabetologia 46:
1319-1323, 2003a
Niemi M, Backman JT, Neuvonen M, Neuvonen PJ: Effects of gemfibrozil,
itraconazole, and their combination on the pharmacokinetics and pharmacodynamics of
repaglinide: potentially hazardous interaction between gemfibrozil and repaglinide.
Diabetologia 46: 347-351, 2003b
Nilsson MI, Widerlöv E, Meresaar U, Anggård E: Effect of urinary pH on the
disposition of methadone in man. Eur J Clin Pharmacol 22: 337-342, 1982
Niskanen LK, Tuomi T, Karjalainen J, Groop LC, Uusitupa MI: GAD antibodies in
NIDDM. Ten-year follow-up from the diagnosis. Diabetes Care 18: 1557-1565, 1995

72
Nosadini R, Avogaro A, Trevisan R, Valerio A, Tessari P, Duner E, Tiengo A, Velussi
M, Del Prato S, De Kreutzenberg S: Effect of metformin on insulin-stimulated glucose
turnover and insulin binding to receptors in type II diabetes. Diabetes Care 10: 62-67,
1987
Panjehshahin MR, Bowmer CJ, Yates MS: Effect of valproic acid, its unsaturated
metabolites and some structurally related fatty acids on the binding of warfarin and
dansylsarcosine to human albumin. Biochem Pharmacol 41: 1227-1233, 1991
Parving HH, Lehnert H, Bröchner-Mortensen J, Gomis R, Andersen S, Arner P: The
effect of irbesartan on the development of diabetic nephropathy in patients with type 2
diabetes. N Engl J Med 345: 870–878, 2001
Pelkonen O, Turpeinen M, Hakkola J, Honkakoski P, Hukkanen J, Raunio H: Inhibition
and induction of human cytochrome P450 enzymes: current status. Arch Toxicol 82:
667-715, 2008
Pentikäinen PJ, Neuvonen PJ, Penttilä A: Pharmacokinetics of metformin after
intravenous and oral administration to man. Eur J Clin Pharmacol 16: 195-202, 1979
Peters KR: Intensifying treatment of type 2 diabetes mellitus: adding insulin.
Pharmacotherapy 31: 54S-64S, 2011
Peterson RG, Shaw WN, Neel M, Little LA, Eichberg J: Zucker diabetic fatty rats as a
model for non-insulin dependent diabetes mellitus. Inst Lab Animal Res News 32: 16-
19, 1990
Phillips AO, Baboolal K, Riley S, Gröne H, Janssen U, Steadman R, Williams J, Floege
J: Association of prolonged hyperglycemia with glomerular hypertrophy and renal
basement membrane thickening in the Goto Kakizaki model of non-insulin-dependent
diabetes mellitus. Am J Kidney Dis 37: 400-410, 2001
Picarel-Blanchot F, Berthelier C, Bailbé D, Portha B: Impaired insulin secretion and
excessive hepatic glucose production are both early events in the diabetic GK rat. Am J
Physiol 271: E755-762, 1996
Pick A, Clark J, Kubstrup C, Levisetti M, Pugh W, Bonner-Weir S, Polonsky KS: Role
of apoptosis in failure of beta-cell mass compensation for insulin resistance and beta-
cell defects in the male Zucker diabetic fatty rat. Diabetes 47: 358-364, 1998
Portha B, Levacher C, Picon L, Rosselin G: Diabetogenic effect of streptozotocin in the
rat during the perinatal period. Diabetes 23: 889-895, 1974
Portha B, Picon L, Rosselin G: Chemical diabetes in the adult rat as the spontaneous
evolution of neonatal diabetes. Diabetologia 17: 371-377, 1979

73
Portha B, Serradas P, Bailbé D, Suzuki K, Goto Y, Giroix MH: Beta-cell insensitivity to
glucose in the GK rat, a spontaneous nonobese model for type II diabetes. Diabetes 40:
486-491, 1991
Portha B: Programmed disorders of beta-cell development and function as one cause for
type 2 diabetes? The GK rat paradigm. Diabetes Metab Res Rev 21: 495-504, 2005
Rees DA, Alcolado JC: Animal models of diabetes mellitus. Diabet Med 22: 359-370,
2005
Reimche L, Forster AJ, van Walraven C: Incidence and contributors to potential drug-
drug interactions in hospitalized patients. J Clin Pharmacol 51: 1043-1050, 2011
Rendell M: The role of sulphonylureas in the management of type 2 diabetes mellitus.
Drugs 64: 1339-1358, 2004
Rerup CC: Drugs producing diabetes through damage of the insulin secreting cells.
Pharmacol Rev 22: 485-518, 1970
Retnakaran R, Cull CA, Thorne KI, Adler AI, Holman RR: Risk factors for renal
dysfunction in type 2 diabetes. Diabetes 55: 1832-1839, 2006
Reunanen A: Diabeteksen esiintyvyys Suomessa. Diabetes ja lääkäri 2: 6–7, 2002
Ruggenenti P, Fassi A, Ilieva AP, Bruno S, Iliev IP, Brusegan V, Rubis N, Gherardi G,
Arnoldi F, Ganeva M, Ene-Iordache B, Gaspari F, Perna A, Bossi A, Trevisan R,
Dodesini AR, Remuzzi G: Preventing microalbuminuria in type 2 diabetes. N Engl J
Med 351: 1941-1951, 2004
Ryan GJ, Hardy Y: Liraglutide: once-daily GLP-1 agonist for the treatment of type 2
diabetes. J Clin Pharm Ther 36: 260-724, 2011
Sadeque AJ, Wandel C, He H, Shah S, Wood AJ: Increased drug delivery to the brain
by P-glycoprotein inhibition. Clin Pharmacol Ther 68: 231-237, 2000
Sato N, Komatsu K, Kurumatani H: Late onset of diabetic nephropathy in
spontaneously diabetic GK rats. Am J Nephrol 23: 334-342, 2003
Scheen AJ: Drug interactions of clinical importance with antihyperglycaemic agents: an
update. Drug Saf 28: 601-631, 2005
Scheen AJ: Pharmacokinetic interactions with thiazolidinediones. Clin Pharmacokinet
46: 1-12, 2007a
Scheen AJ: Drug-drug and food-drug pharmacokinetic interactions with new
insulinotropic agents repaglinide and nateglinide. Clin Pharmacokinet 46: 93-108,
2007b
74
Scheen AJ: Pharmacokinetics of dipeptidylpeptidase-4 inhibitors. Diabetes Obes Metab
12: 648-658, 2010a
Scheen AJ: Dipeptidylpeptidase-4 inhibitors (gliptins): focus on drug-drug interactions.
Clin Pharmacokinet 49: 573-588, 2010b
Schrijvers BF, De Vriese AS, Van de Voorde J, Rasch R, Lameire NH, Flyvbjerg A:
Long-term renal changes in the Goto-Kakizaki rat, a model of lean type 2 diabetes.
Nephrol Dial Transplant 19: 1092-1097, 2004
Schwartz AV, Sellmeyer DE: Effect of thiazolidinediones on skeletal health in women
with Type 2 diabetes. Expert Opin Drug Saf 7: 69-78, 2008
Sena CM, Louro T, Matafome P, Nunes E, Monteiro P, Seiça R: Antioxidant and
vascular effects of gliclazide in type 2 diabetic rats fed high-fat diet. Physiol Res 58:
203-209, 2009
Shaw JE, Sicree RA, Zimmet PZ: Global estimates of the prevalence of diabetes for
2010 and 2030. Diabetes Res Clin Pract 87: 4–14, 2010
Shiba K, Sakai O, Shimada J, Okazaki O, Aoki H, Hakusui H: Effects of antacids,
ferrous sulfate, and ranitidine on absorption of DR-3355 in humans. Antimicrob Agents
Chemother 36: 2270-2274, 1992
Shimoshige Y, Ikuma K, Yamamoto T, Takakura S, Kawamura I, Seki J, Mutoh S,
Goto T: The effects of zenarestat, an aldose reductase inhibitor, on peripheral
neuropathy in Zucker diabetic fatty rats. Metabolism 49: 1395-1399, 2000
Shorr RI, Ray WA, Daugherty JR, Griffin MR: Antihypertensives and the risk of
serious hypoglycemia in older persons using insulin or sulfonylureas. JAMA 278: 40-
43, 1997
Slavkovsky R, Kohlerova R, Tkacova V, Jiroutova A, Tahmazoglu B, Velebny V,
Rezačová M, Sobotka L, Kanta J: Zucker diabetic fatty rat: A new model of impaired
cutaneous wound repair with type II diabetes mellitus and obesity. Wound Repair
Regen 19: 515-525, 2011
Someya Y, Nakano R, Tahara A, Takasu T, Takeuchi A, Nagase I, Matsuyama-Yokono
A, Hayakawa M, Sasamata M, Miyata K, Uchiyama Y: Effects of the dipeptidyl
peptidase-IV inhibitor ASP8497 on glucose tolerance in animal models of secondary
failure. Eur J Pharmacol 622: 71-77, 2009
Somogyi A, Stockley C, Keal J, Rolan P, Bochner F: Reduction of metformin renal
tubular secretion by cimetidine in man. Br J Clin Pharmacol 23: 545-551, 1987

75
Sone H, Kawakami Y, Okuda Y, Sekine Y, Honmura S, Matsuo K, Segawa T, Suzuki
H, Yamashita K: Ocular vascular endothelial growth factor levels in diabetic rats are
elevated before observable retinal proliferative changes. Diabetologia 40: 726-730,
1997
SoRelle R: Withdrawal of Posicor from market. Circulation 98: 831-832, 1998
Srinivasan K, Ramarao P: Animal models in type 2 diabetes research: an overview.
Indian J Med Res 125: 451-472, 2007
Steck AK, Rewers MJ: Genetics of type 1 diabetes. Clin Chem 57: 176-185, 2011
Stetinová V, Kvetina J, Pastera J, Polásková A, Prazáková M: Gliclazide:
pharmacokinetic-pharmacodynamic relationships in rats. Biopharm Drug Dispos 28:
241-248, 2007
Stratton IM, Adler AI, Neil HA, Matthews DR, Manley SE, Cull CA, Hadden D, Turner
RC, Holman RR: Association of glycaemia with macrovascular and microvascular
complications of Type 2 diabetes: prospective observational study. British Medical
Journal 321: 405-412, 2000
Talari R, Varshosaz J, Mostafavi SA, Nokhodchi A: Gliclazide microcrystals prepared
by two methods of in situ micronization: pharmacokinetic studies in diabetic and
normal rats. AAPS PharmSciTech 11: 786-92, 2010
Tashko G, Gabbay RA: Evidence-based approach for managing hypertension in type 2
diabetes. Integr Blood Press Control 3: 31-43, 2010
Tata LJ, Fortun PJ, Hubbard RB, Smeeth L, Hawkey CJ, Smith CJ, Whitaker HJ,
Farrington CP, Card TR, West J: Does concurrent prescription of selective serotonin
reuptake inhibitors and non-steroidal anti-inflammatory drugs substantially increase the
risk of upper gastrointestinal bleeding? Aliment Pharmacol Ther 22: 175-181, 2005
Tattersall R, Fajans S: A difference between the inheritance of classical juvenile-onset
and maturity-onset type of diabetes in young people. Diabetes 24: 44-53, 1975
Thamer M, Ray NF, Taylor T: Association between antihypertensive drug use and
hypoglycemia: a case-control study of diabetic users of insulin or sulfonylureas. Clin
Ther 21: 1387-1400, 1999
Tomilo DL, Smith PF, Ogundele AB, Difrancesco R, Berenson CS, Eberhardt E,
Bednarczyk E, Morse GD: Inhibition of atazanavir oral absorption by lansoprazole
gastric acid suppression in healthy volunteers. Pharmacotherapy 26: 341-346, 2006
Tucker GT, Casey C, Phillips PJ, Connor H, Ward JD, Woods HF: Metformin kinetics
in healthy subjects and in patients with diabetes mellitus. Br J Clin Pharmacol 12: 235-
46, 1981

76
Tuomi T, Carlsson A, Li H, Isomaa B, Miettinen A, ilsson A, issen M, Ehrnstr m
BO, Forsen B, Snickars B, Lahti K, Forsblom C, Saloranta C, Taskinen MR, Groop LC:
Clinical and genetic characteristics of type 2 diabetes with and without GAD antibodies.
Diabetes 48: 150-157, 1999
Tuomilehto J, Lindstrom J, Eriksson JG, Valle TT, Hamalainen H, Ilanne-Parikka P,
Keinanen-Kiukaanniemi S, Laakso M, Louheranta A, Rastas M, Salminen V, Uusitupa
M: Prevention of type 2 diabetes mellitus by changes in lifestyle among subjects with
impaired glucose tolerance. N Engl J Med 344: 1343–1350, 2001
Turner RC, Stratton IM, Horton V, Manley SE, Zimmet P, Mackay IR, Shattock M,
Bottazzo GF, Holman RR: Autoantibodies to islet-cell cytoplasm and glutamic acid
decarboxylase for prediction of insulin requirement in type 2 diabetes. Lancet 350:
1288-1293, 1997
Turner RC, Millns H, Neil HA, Stratton IM, Manley SE, Matthews DR, Holman RR:
Risk factors for coronary artery disease in non-insulin dependent diabetes. British
Medical Journal 316: 823-828, 1998
Turner RC, Cull CA, Frighi V, Holman RR: Glycaemic control with diet,
sulphonylurea, metformin and insulin therapy in patients with type 2 diabetes mellitus:
progressive requirement for multiple therapies. JAMA 281: 2005-2012, 1999
The UK Prospective Diabetes Study (UKPDS) Group: Complications in newly
diagnosed type 2 diabetic patients and their association with different clinical and
biochemical risk factors. Diabetes Research 13: 1-11, 1990a
The UK Prospective Diabetes Study Group: Response of fasting plasma glucose to diet
therapy in newly-presenting Type 2 diabetic patients. Metabolism 39: 905-912, 1990b
The UK Prospective Diabetes Study Group: Intensive blood-glucose control with
sulphonylureas or insulin compared with conventional treatment and risk of
complications in patients with type 2 diabetes. Lancet 352: 837-853, 1998a
The UK Prospective Diabetes Study Group: Tight blood pressure control and risk of
macrovascular and microvascular complications in type 2 diabetes. BMJ 317: 703-713,
1998b
US Department of Health and Human Services. Food and Drug Administration, Center
for Drug Evaluation and Research (CDER): Guidance for Industry, Bioanalytical
Method Validation, 2001
US Department of Health and Human Services. Food and Drug Administration, Center
for Drug Evaluation and Research (CDER): Guidance for Industry, Drug Interaction
Studies — Study Design, Data Analysis, and Implications for Dosing and Labeling,
2006

77
Uusitupa M, Sodervik H, Silvasti M, Karttunen P: Effects of a gel forming dietary fiber,
guar gum, on the absorption of glibenclamide and metabolic control and serum lipids in
patients with non-insulin-dependent (type 2) diabetes. Int J Clin Pharmacol Ther
Toxicol 28: 153-157, 1990
Van Dijk KN, Plat AW, van Dijk AA, Piersma-Wichers M, de Vries-Bots AM, Slomp
J, de Jong-van den Berg LT, Brouwers JR: Potential interaction between acenocoumarol
and diclofenac, naproxen and ibuprofen and role of CYP2C9 genotype. Thromb
Haemost 91: 95-101, 2004
Van Haeften TW: ACE inhibitors and hypoglycaemia. Lancet 346: 125, 1995
Velho G, Froguel P: Genetic, metabolic and clinical characteristics of maturity onset
diabetes of the young. Eur J Endocrinol 138: 233-239, 1998
Verschraagen M, Koks CH, Schellens JH, Beijnen JH: P-glycoprotein system as a
determinant of drug interactions: the case of digoxin-verapamil. Pharmacol Res 40:
301-306, 1999
Vora JP, Zimsen SM, Houghton DC, Anderson S: Evolution of metabolic and renal
changes in the ZDF/Drt-fa rat model of type II diabetes. J Am Soc Nephrol 7: 113-117,
1996
Weideman RA, McKinney WP, Bernstein IH, Predictors of Potential Drug Interactions.
Hospital Pharmacy 33: 835-840, 1998
Williams RH, Palmer JP: Farewell to phenformin for treating diabetes mellitus. Ann
Intern Med 83: 567-568, 1975
World Health Organisation: Definition, Diagnosis and Classification of Diabetes
Mellitus and its Complications. Report of a WHO Consultation. Part 1: Diagnosis and
Classification of Diabetes Mellitus. World Health Organisation Department of
Noncommunicable Disease Surveillance 1-59, 1999
Yagihashi S, Goto Y, Kakizaki M, Kaseda N: Thickening of glomerular basement
membrane in spontaneously diabetic rats. Diabetologia 15: 309-312, 1978
Yagihashi S, Kaseda N, Kakizaki M, Goto Y: Evolution of glomerular lesions in rats
with spontaneous diabetes. Tohoku J Exp Med 127: 359-367, 1979
Yagihashi S, Tonosaki A, Yamada K, Kakizaki M, Goto Y: Peripheral neuropathy in
selectively-inbred spontaneously diabetic rats: electrophysiological, morphometrical
and freeze-replica studies. Tohoku J Exp Med 138: 39-48, 1982
Yaturu S, Bryant B, Jain SK: Thiazolidinedione treatment decreases bone mineral
density in type 2 diabetic men. Diabetes Care 30: 1574-1576, 2007

78
Ziegler D: Treatment of diabetic polyneuropathy: Update 2006. Ann N Y Acad Sci
1084: 250-266, 2006
Zucker LM, Zucker TF: Fatty, a new mutation in the rat. J Hered 52: 275-278, 1961
Östenson CG, Khan A, Abdel-Halim SM, Guenifi A, Suzuki K, Goto Y, Efendic S:
Abnormal insulin secretion and glucose metabolism in pancreatic islets from the
spontaneously diabetic GK rat. Diabetologia 36: 3-8, 1993

APPENDIX 1
The approval of the Animal Care and Use Committee of the State Provincial Office of
Southern Finland for the animal experiment.

ELÄINKOELAUTAKUNTA Etelä-Suomen lääninhallituksen yhteydessä PL 150, Birger Jaarlin katu 15 PÄÄTÖS STH274A 13101 Hämeenlinna [email protected] ELÄINKOELAUTAKUNTA puh.071 873 2181, fax 071 873 2195 17.4.2009 ESLH-2009-02539/Ym-23
Mari Madetoja Toxis Ltd Oy Lemminkäisenkatu 14-18 C 20520 Turku ELÄINKOELUPA Luvan haltija pyytää Etelä-Suomen lääninhallitukseen 16.3.2009 saapu-
neella hakemuksella lupaa eläinkokeen suorittamiseen.
Tutkimuksen nimi: Lääkeaineiden farmakokinetiikan tutkiminen diabetes-tautimallissa
Suorituspaikkana on Turun yliopiston koe-eläinkeskus ja Helsingin yliopis-ton koe-eläinkeskuksen Viikin toimintayksikkö
Tutkimuksen tarkoitus ja tavoite: Yli 150 miljoonaa ihmistä maailmassa sairastaa diabetesta ja heistä noin 80-90 %:lla on tyypin 2 diabetes. Sai- rauteen liittyy vakavia ja invalidisoivia liitännäissairauksia, ja hoitamatto- mana sairaus johtaa kuolemaan. Sairauteen on onnistuttu kehittämään useita tehokkaita lääkeaineita, mutta nykyiset lääkkeet eivät estä vaan ainoastaan hidastavat taudin etenemistä sekä lisäsairauksien puhkeamis-ta. Diabetes yksinään johtaa harvoin ihmisen kuolemaan, mutta siihen liittyvät lisäsairaudet (liitännäissairaudet) kyllä. Tästä syystä diabeetikko joutuu syömään diabeteksen hoitoon tarkoitetun lääkkeen lisäksi paljon muita lääkkeitä. Lääkkeiden kinetiikka saattaa myös muuttua diabeteksen etenemisen myötä liitännäissairauksien vuoksi.
Tyypillisesti uusia lääkeaineita tutkitaan prekliinisissä kinetiikkakokeissa ainoastaan terveillä eläimillä. Patologisessa tautitilassa lääkeaineiden far-makokinetiikka saattaa kuitenkin muuttua ja vaikuttaa esimerkiksi syntyviin metaboliitteihin sekä yhteisvaikutuksiin samanaikaisesti annosteltujen lää-keaineiden välillä. Siksi taudin vaikutusta lääkeaineiden farmakokinetiik-kaan olisi myös tärkeää tutkia. Tässä tutkimuksessa käytettävällä mallilla on mahdollista tutkia lääkeaineen farmakokinetiikkaa, diabeteksen vaiku-tuksia tutkittavan aineen farmakokinetiikkaan sekä samanaikaisesti annos-teltujen lääkeaineiden välisiä interaktioita.
Eläimille tehtävät toimenpiteet: Eläimille kehittyy hoitamattomana diabetes itsekseen. Ensimmäisessä mallissa testiaineen ja diabeteslääkkeen päivit- täiset annostelut ennen taudin puhkeamista enimmillään 60 vrk ajan. An- nostelureitteinä injisointi laskimoon, vatsaonteloon tai nahan alle, tai anto suun kautta. Toisessa mallissa diabeteksen annetaan kehittyä pidemmälle ja hoito aloitetaan 1-2 viikon kuluessa sokeriarvojen noususta.
Verinäytteiden keräys häntälaskimosta eri aikapisteissä tai sydänpunktiolla terminaalianestesiassa. Tutkimukseen voidaan sisällyttää glukoositole- ranssikoe, jossa glukoosin annostelu suun kautta tai injisoimalla vatsaon- teloon. Verinäytteenotot häntälaskimosta. Testiä edeltää paasto: hiiret noin

ELÄINKOELAUTAKUNTA Etelä-Suomen lääninhallituksen yhteydessä PL 150, Birger Jaarlin katu 15 PÄÄTÖS STH274A 13101 Hämeenlinna [email protected] ELÄINKOELAUTAKUNTA puh.071 873 2181, fax 071 873 2195 17.4.2009 ESLH-2009-02539/Ym-23
6 h ja rotat 16 h.
Eläinkoelautakunnan Eläinkoelautakunta myöntää luvan eläinkoesuunnitelman mukaisen eläin- ratkaisu kokeen suorittamiseen. Luvan voimassaoloaika: 20.4.2009 – 19.4.2012 Käytettävät eläinlajit ja määrät: 2000 hiirtä, 1000 rottaa Asian ratkaiseminen ei edellytä uusia periaatteellisia linjauksia. Refinement ja muu vä- Eläinkokeen suorittamisen aikana voidaan toimenpiteisiin liittyviä mene- häinen muutos telmiä muuttaa, mikäli muutos ei merkitse olennaisia muutoksia luvan si- sältöön, muutos ei lisää eläinten kokeman kivun, tuskan, kärsimyksen tai pysyvän haitan määrää, tai muutos vähentää käytettävien eläinten luku- määrää. Perustelut Eläinkokeen tarkoitus on lain sallima ja tavoitellun tuloksen saamiseksi
eläinkokeen tai sen osan sijasta ei ole mahdollista käyttää muuta mene- telmää, joka ei edellytä eläinten käyttöä, tai jossa eläinten kokonaismää-rää, tai eläimille aiheutettavaa kipua, tuskaa, kärsimystä tai pysyvää hait- taa voidaan vähentää. Eläinkokeessa käytettävien eläinten määrä on perusteltu. Eläimille mah- dollisesti aiheutuvan kivun, tuskan, kärsimyksen tai pysyvän haitan määrä pidetään mahdollisimman vähäisenä. Eläinkokeen tekijällä on lain edellyt- tämä kelpoisuus, ja lain vaatimukset eläinkoeluvan antamiselle täyttyvät. Kokeesta odotettavissa olevan hyödyn katsotaan olevan hyväksyttävä suhteessa eläinten käyttämiseen eläinkokeessa.
Sovelletut oikeusohjeet Laki koe-eläintoiminnasta (62/2006), 4, 7, 8, 9, 13, 20, 21, 22, 23 §
Maa- ja metsätalousministeriön asetus koe-eläintoiminnasta (36/2006)18§ Asetus kokeellisiin ja muihin tieteellisiin tarkoituksiin käytettävien selkä- rankaisten eläinten suojelemiseksi tehdyn eurooppalaisen yleissopimuk- sen voimaansaattamisesta (1360/1990).
Muutoksenhaku Tähän päätökseen saa hakea muutosta valittamalla Hämeenlinnan hallin- to-oikeuteen. Valitusosoite on liitteenä. Lisätietoja Esittelijä Seppo Peuranen, puh. 071 873 2182,
Puheenjohtaja Ulla-Marjut Jaakkola Turun jaosto
Esittelijä Seppo Peuranen

ELÄINKOELAUTAKUNTA Etelä-Suomen lääninhallituksen yhteydessä PL 150, Birger Jaarlin katu 15 PÄÄTÖS STH274A 13101 Hämeenlinna [email protected] ELÄINKOELAUTAKUNTA puh.071 873 2181, fax 071 873 2195 17.4.2009 ESLH-2009-02539/Ym-23
Etelä-Suomen lääninhallitus JAKELU Luvan haltija MAKSU 500 € Maksun peruste Suoritemaksun määrääminen perustuu valtion maksuperustelain 6 §:ään sekä
sisäasiainministeriön mainitun lain 8 §:n nojalla antamaan asetukseen (1254/2007) lääninhallituksen suoritteiden maksuista.
Maksun oikaiseminen Maksuvelvollinen, joka katsoo, että julkisoikeudellisesta suoritteesta määrätyn
maksun määräämisessä on tapahtunut virhe, voi vaatia siihen valtion maksupe- rustelain 11 b §:n nojalla oikaisua Etelä-Suomen lääninhallitukselta kuuden kuu- kauden kuluessa maksun määräämisestä.
TIEDOKSI · Laitos, jossa eläinkoe tehdään; Lääninhallitus

APPENDIX 2
Protocol Outline of the animal experiment.

Study number:
TOX00124-09
Final
[1/5]
Brief Study Protocol of Toxis Ltd study Study number: TOX00124-09
Sponsor study number: -
Study sponsor:
Toxis Ltd Oy
Study name:
The hypoglycemic interaction of fosinopril and gliclazide
in control rats and in a rat model of diabetes
Sponsors contact person:
-
Test item:
TI1 gliclazide
TI2 fosinopril sodium
Batch no:
TI1 091K0060
TI2 F4010-08-005
Purpose of the study / problem solving:
To study the effect of fosinopril on pharmacokinetics of gliclazide in control rats and in a rat model of
diabetes. Plasma samples will be collected after single and repeated p.o. and i.v. administration for the
measurement of test item concentrations in plasma. Pharmacokinetic parameters will be determined. Plasma
glucose concentrations will be determined at baseline and approximately once a week. Oral glucose tolerance
test (OGTT) will be performed at baseline and in the end of the study.
Test facility: Toxis Ltd Oy, Lemminkäisenkatu 14-18 C, 20520 Turku, FINLAND
Test site: University of Turku, BioCity animal unit, Tykistökatu 4, 20520 Turku, FINLAND
Animal species
Rat
Strains
Control:
Wistar (Crl:WI)
Diabetes model:
Goto-Kakizaki
(GK/MolTac)
Sex
Male Weight
ca. 340 g
ca. 310 g
Age
Ca. 14 weeks
Number of animals/group 6
In total
36 Number of groups
6 Vehicle
Will be reported
Dose routes
p.o., i.v. Dose volume
Will be
reported
Number of doses
29 Animal License
ESLH-2009-02539/Ym-23
Samples
Plasma
Number of samples
Plasma samples 720
Study design
Pharmacokinetic study on day 1 and 30:
Rat model of diabetes (GK)
G
Test
item
Dose
(mg/kg)
Dose
route n #
Sampling time points
on days 1 and 28
I TI1 10 p.o. 3 1, 5, 9 0 30 min 1 h 4 h 10 h
3 2, 6, 10 15 min 45 min 2 h 6 h 24 h
II TI2 10 p.o. 3 3, 11, 15 0 30 min 1 h 4 h 10 h
3 4, 12, 16 15 min 45 min 2 h 6 h 24 h
III TI1
TI2
10
10 p.o.
3 7, 13, 17 0 30 min 1 h 4 h 10 h
3 8, 14, 18 15 min 45 min 2 h 6 h 24 h

Study number:
TOX00124-09
Final
[2/5]
Control rats (Wistar)
G
Test
item
Dose
(mg/kg)
Dose
route
n # Sampling time points
on days 1 and 28
IV TI1 10 p.o. 3 19, 27, 29 0 30 min 1 h 4 h 10 h
3 20, 28, 30 15 min 45 min 2 h 6 h 24 h
V TI2 10 p.o. 3 23, 31, 33 0 30 min 1 h 4 h 10 h
3 24, 32, 34 15 min 45 min 2 h 6 h 24 h
VI TI1
TI2
10
10 p.o.
3 21, 25, 35 0 30 min 1 h 4 h 10 h
3 22, 26, 36 15 min 45 min 2 h 6 h 24 h
Pharmacokinetic study on day -6 and 23:
Rat model of diabetes (GK)
G
Test
item
Dose
(mg/kg)
Dose
route n #
Sampling time points
on days -7 and 21
I TI1 6 i.v. 3 1, 5, 9 0 10 min 40 min 2 h 6 h
3 2, 6, 10 5 min 20 min 1 h 4 h 10 h
III TI1 6 i.v. 3 7, 13, 17 0 10 min 40 min 2 h 6 h
TI2 10 p.o. 3 8, 14, 18 5 min 20 min 1 h 4 h 10 h
Control rats (Wistar)
G
Test
item
Dose
(mg/kg)
Dose
route n #
Sampling time points
on days -7 and 21
IV TI1 6 i.v. 3 19, 27, 29 0 10 min 40 min 2 h 6 h
3 20, 28, 30 5 min 20 min 1 h 4 h 10 h
VI TI1 6 i.v. 3 21, 25, 35 0 10 min 40 min 2 h 6 h
TI2 10 p.o. 3 22, 26, 36 5 min 20 min 1 h 4 h 10 h
Materials and methods
Animal identification: Animals will be individually identified by tail numbering. Cages will be respectively
marked with cage cards indicating study number, animal numbers, sex, strain, dose and study period.
Randomisation and grouping: Animals will be grouped according to the results of the first OGT test. Diabetic
and control rats will be put in order after the AUC of OGT test, and groups with similar average AUCs will be
formed. No actual randomisation will be done. Animals will be grouped and numbered according to the study
design (groups I-III rat model of diabetes and groups IV-VI control rats).
Number of animals per cage: 2
Bedding: Aspen chips (Tapvei Oy, Kaavi, Finland)
Fodder : RM1 E SQC (SDS England), non-sterilised, ad libitum
Water: Normal tap water, ad libitum
A total of 18 14-week-old male Goto-Kakizaki (GK) rats and 18 10-week-old male Wistar rats weighing ca.
310-340 g will be used. GK male rats develop a condition resembling type 2 diabetes mellitus at
approximately 14-16 weeks of age. The onset of diabetes will be verified by measuring blood glucose levels.

Study number:
TOX00124-09
Final
[3/5]
Diabetes has developed when fasted plasma glucose level exceeds 10 mmol/L (200 mg/dl).
Animals will be subjected to a constant daily cycle of 12 hours of light and 12 hours darkness (06:00-18:00)
and constant temperature (21 ± 3 ºC) and relative humidity (55 ± 15 %). Animals will be weighed once a week
and observed for clinical signs two times a day. During weekends observations will be done once a day.
Groups of control rats and rat model of diabetes will be divided in three groups each (n=6). The first subgroup
(groups: GI and GIV) will be treated daily with 10 mg kg-1
day -1
gliclazide orally (on study days -7 and 21 6
mg kg-1
day -1
gliclazide intravenously), the second subgroup (GII and GV) will be treated daily with 10 mg
kg-1
day -1
fosinopril orally while the third subgroup (GIII and GVI) will receive a combination of gliclazide
and fosinopril using the same routes of administration as in the first and second subgroups.
Animals will dosed dose of 10 ml kg-1
day-1
of test items by gavage for 28 days as follows (except at study
day 21):
GI and IV: Gliclazide (TI1)
GII and V: Fosinopril sodium (TI2)
GIII and VI: Gliclazide (TI1) + Fosinopril sodium (TI2)
Gliclazide will be dosed intravenously for groups I, III, IV and VI dose of 6 mg/kg on study days -6 and 23
(see study design).
Animals will be euthanized on study day 36-38, after the last blood sample.
Test items
Test item Gliclazide Fosinopril sodium
Test item code TI1 TI2
Manufacturer/ Sponsor Sigma Aldrich Euroasian Chemicals
Batch number 091K0060 F4010-08-005
Expiry date N/Av 03/2011
Sampling (nature, number, size/volume, timing, etc)
Blood glucose will be determined from whole blood and body weight will be measured once a week during
experiment period.
Glucose tolerance test
After an overnight fast oral glucose tolerance test (OGTT) will be performed before daily test item dosing at
baseline and in the end of experiment period. Rats will be given 2g/kg glucose by gavage and blood glucose
concentrations will be determined using HemoCUE® Glucose 201+ analyzer at time points 0, 30, 60 and 120
minutes.
Pharmacokinetic experiments
Animals will be held in 38 oC for ca. 10 min before each time point for blood sampling. Total of 0,25 ml
whole blood (for 100 µl of plasma) will be collected at each time point into EDTA-K2 tubes.

Study number:
TOX00124-09
Final
[4/5]
Study days 1 and 30:
For pharmacokinetic evaluation, blood samples will be collected after per oral dosing at baseline and on day
30 from lateral tail vein at time points 0, 15, 30, 45 min and 1, 2, 4, 8, 10, 24 h. The last samples will be
collected by cardiac puncture on study day 29 (24 hrs after dosing).
Study days -6 and 23:
Blood samples will be collected on study days -6 and 23 from lateral tail vein at time points 0, 5, 10, 20, 40
min and 1, 2, 4, 10 h after Gliclazide (TI1) i.v. administration (see study design).
The time points of dosing and blood sampling will be recorded. After sampling the blood will be centrifuged
for plasma separation (2870 g for 10 minutes at 4 °C). After centrifugation plasma samples are transferred to
plastic reaction tubes (Eppendorf). Plasma samples will be frozen and stored at –20 ºC. The frozen samples
will be shipped to analysing laboratory (University of Helsinki, Faculty of Pharmacy, Department of
Pharmaceutical Chemistry). The analysing laboratory is responsible for analysing the plasma samples.
Tissue samples
Liver, kidneys, adrenal glands and brain will be dissected immediately after cardiac puncture, snap-frozen in
liquid nitrogen, and stored at about -80 oC for possible further use. The analysis of tissues is not a
responsibility of Toxis.
Analysis: Test item consentrations will be analyzed from plasma samples using LC/MS/MS- method.
Calculations:
The following parameters will be calculated on the basis of analyzed blood samples using a pharmacokinetic
program Winnonlin: T1/2, AUC, Tmax, Cmax, CL, V, BA, MRT, MAT
Time schedule:
Preliminary dates are:
Glucose Tolerance test week 21/2009
The first dosing day (study day 0) week 22/2009
End of the experiment (study day 29) weeks 27-28/2009
Plasma analysis weeks 28-31/2009
Draft report week 36/2009
Prepared by:
Mari Madetoja
Ilona Sipilä
Date:
22.5.2009
13.05.2009

Study number:
TOX00124-09
Final
[5/5]
Signatures:
Toxis Ltd
University of Helsinki:
Mari Madetoja
Study Director
Ilona Sipilä
Deputy Study Director
I accept this study plan as such and my signature will authorise Toxis
Ltd to conduct the study as described in this study protocol.
Prof. Marjo Yliperttula, Ph.D.
Supervisor
Department of Biopharmacy and Pharmacokinetics, Faculty of
Pharmacy
Raimo Ketola, Ph. D.
Principal investigator (Analysis of plasma samples)

APPENDIX 3
DEVELOPMENT AND VALIDATION OF HPLC-MS/MS METHOD FOR
SIMULTANEOUS DETERMINATION OF GLICLAZIDE AND FOSINOPRILAT IN
RAT PLASMA
Ilona Sipilä
University of Helsinki
Faculty of Pharmacy
Department of Pharmacokinetics
and Biopharmacy
April 2011
TABLE OF CONTENTS
1 INTRODUCTION ...................................................................................................... 1
2 EXPERIMENTAL ..................................................................................................... 3
2.1 Reagents and materials ........................................................................................ 3
2.2 Animal experiments ............................................................................................. 3
2.3 Preparation of standard and quality control samples ........................................... 4
2.4 Sample preparation .............................................................................................. 4
2.5 Instrumentation .................................................................................................... 5
2.5.1 Liquid chromatography ................................................................................. 5
2.5.2 Mass spectrometry......................................................................................... 6
2.6 Method validation ................................................................................................ 7
3 RESULTS AND DISCUSSION................................................................................. 7
3.1 Optimization of chromatographic conditions ...................................................... 7
3.2 Selection of LC-MS/MS conditions .................................................................. 12
3.3 Method validation .............................................................................................. 14
4 CONCLUSIONS ...................................................................................................... 20
5 REFERENCES ......................................................................................................... 22

1
1 INTRODUCTION
Some antihypertensive drugs, especially angiotensin converting enzyme (ACE)
inhibitors, may induce hypoglycemic episodes when coadministered with hypoglycemic
drugs, for example sulphonylureas (McMurray and Fraser 1986). This interaction
causes several hospitalisations every year (Herings et al. 1996). The mechanism of this
interaction is unknown. The hypothesis of this study is that the interaction is
pharmacokinetic. Approximately 700 rat plasma samples were collected in this study
after oral or intravenous administration of gliclazide and/or fosinopril to study the
mechanism of the interaction.
Figure 1. The chemical structures of the analytes.
Gliclazide (MW=323.4 g/mol) is a hypoglycemic drug and it is classified as a
sulphonylurea (Chiasson et al. 1991; Matthews et al. 1991) (Figure 1). It increases the
secretion of insulin from the pancreas and the insulin sensitivity in tissues. ACE
inhibitor fosinoprilat (MW=435.5 g/mol) decreases blood pressure by inhibiting the
vasoconstriction caused by the angiotensin-converting enzyme (Duchin et al. 1984;
Duchin et al. 1985). Because the oral bioavailability of diacidic fosinoprilat is poor, a
better absorpting phosphinic acid ester pro-drug, fosinopril (MW=563.7 g/mol), has

2
been developed. Fosinopril is rapidly hydrolyzed into fosinoprilat in gastro-intestinal
mucosa and liver. Glibenclamide (MW=494.0 g/mol), a sulphonylurea, was used as the
internal standad (ISTD). Deuterated derivates of the test items would serve best but
glibenclamide is also suitable because it behaves similarly as the analytes. Foroutan et
al. (2006) also used glibenclamide as an internal standard in a liquid
chromatography−ultraviolet detection (LC-UV) method when analysing gliclazide.
Several methods have been reported for the analysis of gliclazide, fosinopril and its
active metabolite, fosinoprilat, in plasma/serum or pharmaceutical formulations using
mainly LC-UV (Aburuz et al. 2005; Jancic et al. 2005) or liquid chromatography
tandem mass spectrometry (LC-MS/MS) (Jemal et al. 2000; Wang et al. 2008).
However, LC-UV is not sensitive and selective enough to be used in a pharmacokinetic
study because of the complex matrix and the small concentrations of the test items in
the samples. Jemal and Mulvana (2000) and Cui et al. (2007) studied the simultaneous
analysis of fosinopril and fosinoprilat using LC-MS/MS. The disadvantages of the
earlier mentioned works are for example a long (about 20 min per sample) running time
(Aburuz et al. 2005) and multi-step SPE extractions (Jemal and Mulvana 2000, Aburuz
et al. 2005).
In order to study the pharmacokinetic interaction between gliclazide and fosinopril, a
fast, sensitive and selective bioanalytical method was needed for the quantification of
the test items in the large amount of plasma samples collected in this study. Since there
already was a method for the simultaneous analysis of fosinopril and fosinoprilat in
plasma, the work of Cui et al. (2007) was modified in this study in order to
simultaneously also analyze gliclazide. Fosinopril could not, however, be detected
reliably using the new method. As fosinopril is in vivo almost entirely hydrolyzed into
fosinoprilat, the role of fosinopril in studying the pharmacokinetics is not so significant.

3
2 EXPERIMENTAL
2.1 Reagents and materials
Gliclazide was obtained from Sigma Aldrich, Germany, fosinopril from Eurasias, India
and fosinoprilat from Toronto Research Chemicals, Canada. The internal standard
(ISTD), glibenclamide, was purchased from Orion, Finland.
All of the reagents and other chemicals were of HPLC grade. Acetonitrile was
purchased from Rathburn, Scotland and methanol and diethyl ether from J.T Baker,
Holland. Dichloromethane was purchased from VWR, England and ammonium acetate
from Riedel-deHaën, Germany. Trifluoroacetic acid (TFA) was from Sigma Aldrich,
Germany. Water was purified with a Milli-Q water purification system (Millipore,
France).
2.2 Animal experiments
Plasma samples were collected from 18 male Wistar (WI) rats (Harlan, Netherlands)
and 18 male Goto Kakizaki (GK) rats (Taconic, Denmark) 16-17 weeks old receiving
gliclazide and/or fosinopril orally (10 mg/kg). Animals were subjected to a constant
daily cycle of 12 hours of light and 12 hours of darkness (06:00-18:00), constant
temperature (21 ± 3 ºC) and relative humidity of 55 ± 15%. Two animals were housed
in each cage. Rats had access to commercial pelleted non-sterilized chow and normal
tap water ad libitum except during fasting when access to food was restricted. All
procedures with animals were performed according to European Community Guidelines
for the use of experimental animals (European Communities Council Directive
86/609/EEC) and the experimental setup was reviewed and approved by the Animal
Care and Use Committee of the State Provincial Office of Southern Finland.
Blood samples were collected at the test site from rats’ lateral tail vein. Samples treated
with the anticoagulant K2-EDTA were then centrifuged (2870 g for 10 minutes at 4 °C)

4
to obtain plasma. After centrifugation, plasma samples were transferred into plastic
reaction tubes (Eppendorf) and frozen. Samples were stored at –20 ºC until analysis.
Blank rat plasma (Wistar or Sprague Dawley) for standard and quality control samples
was purchased from Toxis Ltd, Finland.
2.3 Preparation of standard and quality control samples
Stock solutions for the test items and the internal standard were prepared by dissolving
accurately weighed amount of the substance into methanol and by diluting further using
methanol. The final concentrations for the stock solutions were 0.4, 3 and 6 M for
fosinoprilat and 1, 5 and 15 M for gliclazide. The concentration for the ISTD was 5
M.
Calibration curves were prepared approximately once a week by evaporating the
appropriate amount of the test item and 150 l of ISTD into dryness under a gentle
stream of nitrogen (25 oC) before adding 30 ul of blank plasma. Samples were made in
triplicates and concentrations in the plasma were 5, 10, 20, 35, 45 and 60 M for
gliclazide and 0.4, 2, 4, 8, 14, 18 and 24 M for fosinoprilat.
Quality control (QC) samples were prepared as the calibration curve samples but in
triplicates and at three concentrations representing the entire range of the standard
curve. The concentrations were 3, 12 and 20 M for fosinoprilat and 7.5, 30 and 50 M
for gliclazide. QC samples were prepared along with the plasma samples in each
analytical batch and placed evenly into each run. They were used to accept each batch.
2.4 Sample preparation
Sample preparation was mostly done as described in the work of Cui et al. (2007). A
total of 30 µL of defrosted plasma and 6 µL of hydrochloric acid (1.0 M) was added to
the dry residue of 150 µL of internal standard (5 μM glibenclamide in methanol) first
evaporated to dryness at room temperature (circa 25 oC) under a stream of nitrogen. The

5
samples were then briefly mixed and 200 µL of diethyl ether-dichloromethane (3:1, v/v)
was added. Samples were extracted in a shaker for 15 minutes and then centrifuged at
16 100 g for 15 minutes. The clear supernatant was collected and transferred into vial
tubes were it was evaporated to dryness under a stream of nitrogen (25 oC). A mixture
of methanol and aqueous 15 mM ammonium acetate solution (4:6) was then added (500
μl) and samples were mixed to dissolve the residue.
Cui et al. (2007) used a three-minute vortex-extraction to extract the analytes from
plasma into the organic phase. Due to the large amount of samples in this study a shaker
was used to save time. A 15-minute shaker-extraction was shown to be even more
efficient (18% for gliclazide and 9% for fosinoprilat) than the three-minute vortex-
extraction.
Some of the samples needed to be diluted with blank plasma because there was not
enough of the plasma sample left. The results of these samples were integrated normally
and then a coefficient was used to calculate the actual concentration in the plasma
sample.
2.5 Instrumentation
2.5.1 Liquid chromatography
The experiments were performed using an Agilent HP 1100 liquid chromatograph
(Hewlett-Packard GmbH, Germany) consisting of a binary pump, an autosampler and a
column compartment. The column was an AtlantisTM
dC-18 (50 x 2.1 mm, 3 m
particle size, Waters) and the injection wolume was 5, 10, 20 or 40 l. Methanol
(MeOH) and 15 mM aqueous ammonium acetate were used as eluents. The linear
gradient used for the analysis was 40-60% MeOH for 0-0.1 min, 60-90% MeOH for
0.1-3.5 min and 90% MeOH for 3.5-5.5 min. The column was equilibrated for 1.5
minutes before each injection. Two washing runs 90% (0.1 min) and 40% (1.5 min)
MeOH by injecting MeOH:H2O (1:1) were performed after each run. The flow rate was

6
0.45 ml min-1
and the post column split ratio was 1:10. The total running time for each
sample was 8.6 min.
A column wash using 0.1% aqueous trifluoroacetic acid (TFA) and acetonitrile in three
phases was eventually added after every batch. The first and the third phases were
equilibration 100% of 0.1% aqueous TFA for 30 min and then wash 100% of aqueous
TFA for 30 min. The equilibration for the second phase was 0% TFA for 30 min and the
gradient 0-10% TFA for 0-30 min, 10-0% TFA for 30-60 min and 0-10% TFA for 60-
70 min.
2.5.2 Mass spectrometry
A PE Sciex API 3000 triple-quadrupole mass spectrometer (Applied Biosystems/MDS
Sciex, Canada) with a turbo ion spray source was used for detection. Nitrogen served as
nebulising, curtain, turbo and collision gas. The turbo gas flow rate was 6 L min-1
and it
was heated to 300 oC. The mass spectrometer was operated in the positive ion mode
using selected reaction monitoring (SRM). The followed reactions are shown in Table
1. The ion spray and orifice voltages, the collision energy and the collision cell exit
potentials for different SRM transitions were individually optimised for each
compound. The data were collected and processed with MDS Sciex Analyst 1.5
software. Weighting factor 1/y2 was used for the standard curves of fosinoprilat to place
more emphasis on the smaller values of the curve.
Table 1. Mass spectrometric parameters for the analysis of fosinoprilat, gliclazide and
glibenclamide. The qualifier ions are shown in parenthesis.
CAP (V) DP FP EP CE CXP
Gliclazide 324 → 110 (127) 5000 55 350 8 28.6 8.5
Fosinoprilat 436 → 152 (390) 5000 63 350 8 24.9 14.0
Glibenclamide 494 → 369 5500 50 350 8 21.0 13.2
DP=Declustering Potential, FP=Focusing Potential, EP=Entrance Potential, CE=Collision Energy,
CXP=Collision Exit Potential

7
2.6 Method validation
The new method was validated modified according to the Food and drug administration
(FDA) guideline for validation of bioanalytical methods (FDA 2001). Method
validation was carried out in terms of accuracy, precision, linearity, specificity,
reproducibility and stability. Short-term temperature stability, long-term stability,
freeze-and-thaw stability and the stability of the stock solutions were defined. Also the
extraction recoveries and matrix effect was studied. Accuracy and precision were
accepted when the Relative Standard Deviation (RSD%) did not exceed 15% (20% for
low QC) and the accuracy was within 20% of the nominal value.
3 RESULTS AND DISCUSSION
3.1 Optimization of chromatographic conditions
The purpose of this study originally was to develop a method for the simultaneous
quantification of gliclazide, fosinoprilat and fosinopril. The developed method was not,
however, sensitive enough to detect fosinopril reliably. Since fosinopril hydrolyzes
almost entirely into fosinoprilat, the role of fosinopril is not so significant and it was
decided to focus on the accurate and specific detection of fosinoprilat and gliclazide
instead.
The gradient was optimized to achieve good sensitivity, efficiency and resolution and
repeatable retention times. Different eluent compositions with different flow rates (0.3-
0.45 ml/min) were tested. The flow rate 0.45 ml/min and gradient shown in Table 2
were chosen. The separation of fosinoprilat was complicated because it either made
double-peak shape or the peak overlapped with fosinopril. Fosinopril was fragmented
into fosinoprilat in the ion source and therefore they could not be separated using MS.
Therefore the chromatographic separation of fosinopril and fosinoprilat was essential.

8
Table 2. The linear gradient during the analysis and column wash. The other eluent
component was 15 mM aqueous NH4Ac solution.
Time (min) MeOH (%)
Equilibrate 1.5 40
Run 0 40
0.1 60
3.5 90
5.5 90
Wash 1 0 90
0.1 90
Wash 2 0 40
1.5 40
Total 8.6 min
A remarkable challenge in the method development was that the retention times of the
analytes, especially fosinoprilat, were changing and the peaks were widening during the
run. Another issue was the strong absorption of fosinoprilat in the stainless steel
surfaces of the hardware. This contaminated the samples analyzed later in the batch.
In the study of Cui et al. (2007) they discovered that a small amount of ammonium
acetate (10 mM aqueous solution) in the HPLC eluent improved the sensitivity,
optimized the peak shape and also released the fosinoprilat trapped in the system.
However, usually a big concentration of the buffer impairs the ionization of the
analytes. In this work, ammonium acetate concentrations 5-15 mM were studied ending
up using buffer concentration 15 mM (Figure 2). Later it was discovered that since the
change of the buffer concentration from 10 mM to 15 mM did not solve the
contamination problem, it would have been better to change the concentration back to
10 mM to improve the ionization. This was not noticed at the time, however. Methanol
containing 0.1% formic acid was also studied as the organic phase but it was less
sensitive than pure methanol and the peak of fosinoprilat widened and the retention time
changed significantly.

9
Figure 2. The effect of the buffer concentration on the peak shape. The buffer
concentration was first changed from 5 mM (A) to 10 mM (B) to diminish the widening
of the peaks. C) The peak sensitivity of fosinoprilat grew worse during the time due to
the contamination in the system. The change from 10 mM (C) to 15 mM (D) only
decreased the sensitivity and the peak shape of fosinoprilat. The concentration of
gliclazide (G) and fosinoprilat (F:at) is 40 µM in A and B and 45 µM (gliclazide) and
18 µM (fosinoprilat) in C and D. ISTD is the internal standard and F is fosinopril.
The adjustment of pH of the buffer was noticed to be better than the adjustment of the
concentration of the aqueous buffer in improving the peak shape and sensitivity. Three
different pH values were studied (pH 4.53, 4.99, 5.39). When pH 4.53 was used, the
retention time of fosinoprilat was changing during the run (Figure 3). By adjusting the
pH to 5.39, the retention time became repeatable. Also the separation of fosinopril and
fosinoprilat got better. For some reason, however, the sensitivity and peak shape of
fosinoprilat grew worse again over the time (Figure 4). The buffer pH adjustment was
discontinued and the peak got better.

10
Figure 3. The effect of pH on the retention time and peak shape. In the pictures A and B
pH is 4.53. Samples are from the beginning (A) and the end (B) of the same batch. The
retention time of fosinoprilat is changing remarkably. In the pictures C and D pH is
5.39. Samples are from the beginning (C) and the end (D) of the same batch. The
retention time is repeatable but the peaks are widening during the batch.
Figure 4. The effect of the pH on the peak shape. When the adjustment of pH was
discontinued (B), the shape and the intensity of the fosinoprilat peak improved
remarkably. A is before and B is after discontinuing the pH adjustment.
The purpose of the sample pretreatment is to extract the analytes and to remove
compounds that may disturb the analysis. However, some proteins might still have been

11
present in the samples after the extraction in this study and they might have attached to
the surface of the column. This could have affected the retention of the analytes and
could be one reason to the troubles encountered with fosinoprilat. A trifluoroacetic acid
(TFA, 0.1%) column wash in three phases was eventually added after every batch. This
remarkably reduced the relative contamination problem of fosinoprilat and improved
the peak shape of fosinopilat (Figure 5).
Figure 5. The effect of the column wash on the peak shape. When the column washes
using TFA (0.1%) were added after every batch, the contamination of fosinoprilat
diminished remarkably and sensitivity was improved. A is before and B after the
addition of the washes.
The peak area of gliclazide in some of the analyzed plasma samples was bigger than the
peak area of the highest sample (60 M) on the standard curve. Therefore, the
concentration of these samples was outside the given linear concentration range.
Smaller injection volumes were used to decrease the peak area of these samples. If the
response of the smaller injection was smaller than the highest response of the standard
curve, it was accepted. The effect of the decreased injection volume on the peak area
ratio of gliclazide and ISTD was studied by injecting 5, 10 and 20 ul of 50 μM QC
sample (n=5-6). The compared injection volumes were observed to be similar and
accurate enough (Table 3). The average concentration using injection volumes 10 µl
and 5 µl was 4.0% and 3.7% bigger than the concentration using injection volume 20
µl.

12
Table 3. The effect of the injection volume for gliclazide (n=5-6).
Injection
volume (μl)
Concentration
(μM)
Mean
(μM)
RSD
(%)
Accuracy
(%)
20 50 50.4 2.2 100.8
10 50 52.4 2.8 104.8
5 50 52.3 2.2 104.5
3.2 Selection of LC-MS/MS conditions
Negative and positive ionisation mode was tested and positive ionisation mode was
selected for the method because the sensitivity was better. Selected reaction monitoring
(SRM) was used and the reactions giving the most intensive signals, m/z 324 → 110 and
m/z 324 → 127 for gliclazide, m/z 436 → 152 and m/z 436 → 390 for fosinoprilat and
m/z 494 → 369 for the internal standard, were monitored. All the MS parameters were
optimized. The product-ion spectra of the [M+H]+ and [M-H]
- ions of analytes are
shown in Table 4. The main product ion in the positive ionisation mode mass spectrum
was [M+H]+ for all the analytes. Fragmentation was moderate which indicates a good
stability of the protonated molecules in the electrospray ionisation. Some proposed
structures of the fragments seen in the positive ion mode mass spectrum of gliclazide
are shown in Figure 6 (Bansal et al. 2008).

13
Table 4. The main peaks found in the positive and negative ionisation mode MS and
MS/MS spectra of gliclazide, fosinoprilat and ISTD. Collision energy was ramped
between 5 and 70 V in MS/MS analysis.
Compound m/z in the MS spectrum, positive ion mode Fragments
[M+H]+
[M+Na]+
[M+K]+
[M+NH4]+
Gliclazide 324.4 346.4 362.4 - 127.1, 153.1
Fosinoprilat 436.4 458.5 474.5 - 390.4, 418.4
ISTD 494.3 - 533.0 512.0 369.2, 395.3
m/z in the product ion spectrum of [M+H]+
Gliclazide 81.1, 91.3, 110.2, 111.2, 127.2, 153.2, 155.2, 168.2, 324.2
Fosinoprilat 109.2, 152.3, 198.1, 390.3, 418.2, 436.2
ISTD 100.3, 169.1, 198.0, 259.3, 288.2, 304.2, 369.1, 395.1, 494.2
Compound m/z in the MS spectrum, negative ion mode Fragments
[M-H]-
Gliclazide 322.5 -
Fosinoprilat 434.4 -
ISTD 492.2 367.2
m/z in the product ion spectrum of [M-H]-
Gliclazide 62.0, 79.9, 104.1, 106.1, 170.0, 322.1
Fosinoprilat 62.9, 195.0, 213.1, 237.1, 390.3, 434.4
ISTD 169.9, 367.2, 378.3, 460.2, 492.2
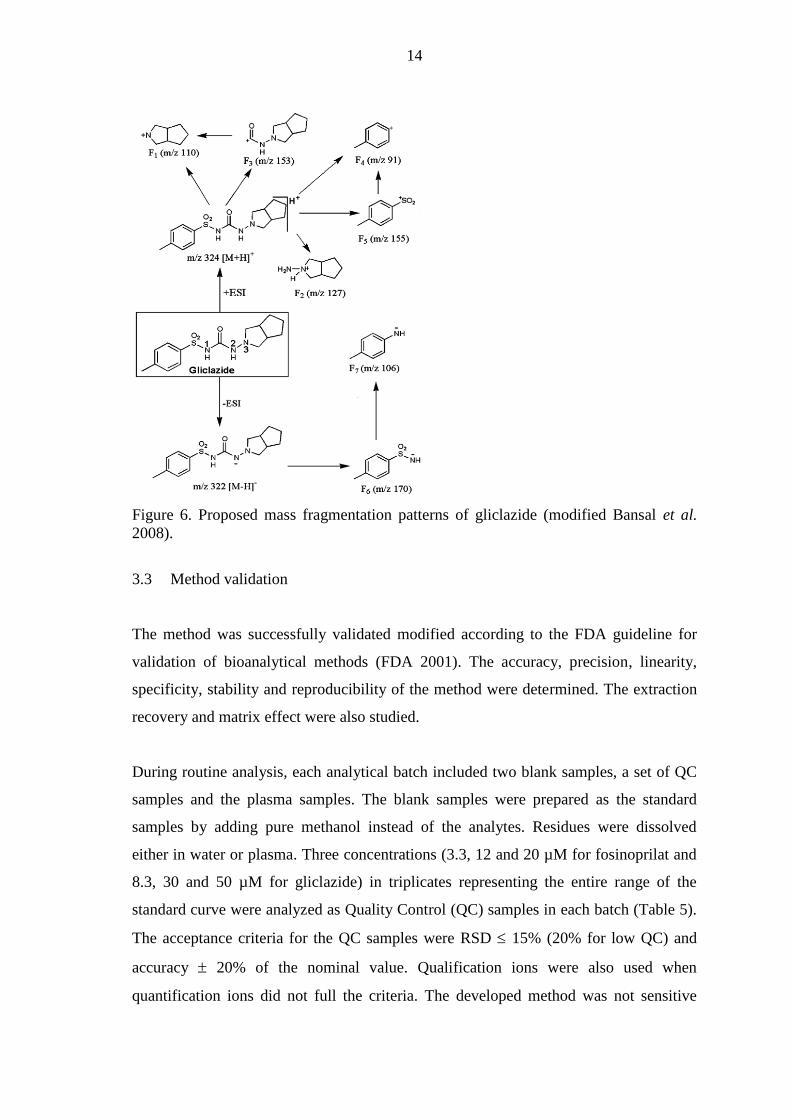
14
Figure 6. Proposed mass fragmentation patterns of gliclazide (modified Bansal et al.
2008).
3.3 Method validation
The method was successfully validated modified according to the FDA guideline for
validation of bioanalytical methods (FDA 2001). The accuracy, precision, linearity,
specificity, stability and reproducibility of the method were determined. The extraction
recovery and matrix effect were also studied.
During routine analysis, each analytical batch included two blank samples, a set of QC
samples and the plasma samples. The blank samples were prepared as the standard
samples by adding pure methanol instead of the analytes. Residues were dissolved
either in water or plasma. Three concentrations (3.3, 12 and 20 µM for fosinoprilat and
8.3, 30 and 50 µM for gliclazide) in triplicates representing the entire range of the
standard curve were analyzed as Quality Control (QC) samples in each batch (Table 5).
The acceptance criteria for the QC samples were RSD 15% (20% for low QC) and
accuracy 20% of the nominal value. Qualification ions were also used when
quantification ions did not full the criteria. The developed method was not sensitive

15
enough to detect fosinopril reliably and therefore only the validation results for
fosinoprilat and gliclazide will be reported.
Table 5. The within- and between-days precision and accuracy (n=5)
Compounds
Concentration
(μM)
Mean
(μM)
Within-day
RSD (%)
Between-days
RSD (%)
Mean
accuracy (%)
8.3 8.6 2.3 5.5 103.9
Gliclazide 30 31.3 5.3 4.2 104.3
50 50.5 5.3 3.9 100.9
3.3 3.3 2.6 6.1 99.9
Fosinoprilat 12 11.9 1.8 8.1 99.3
20 20.9 2.7 3.8 104.3
A standard curve, covering the entire range of expected concentrations in plasma
samples, was prepared in triplicates approximately once a week (Table 6). The slope,
the intercept and the correlation coefficient were determined from every curve. The
mean y intercepts were 0.6057 for gliclazide and -0.2146 for fosinoprilat. The mean
slopes were 0.9856 for gliclazide and 1.0433 for fosinoprilat. On the basis of acceptable
accuracy and good correlation coefficients (≥0.9905), the relationship between area
ratio and concentrations was linear within the studied concentration range. Values for
qualification ions were similar and complied with the requirements.

16
Table 6. The precision, accuracy and linearity of the standard curves (n=10-11)
Gliclazide
Concentration (μM) Mean (μM) RSD (%) Accuracy (%)
5 4.91 8.9 98.2
10 10.75 4.9 107.5
20 21.52 4.5 107.6
35 35.17 4.5 100.5
45 44.90 3.0 99.8
60 59.36 2.4 98.9
r2 0.9905 - 0.9990
Fosinoprilat
Concentration (μM) Mean (μM) RSD (%) Accuracy (%)
0.4 0.41 0.9 101.4
2 2.01 5.2 100.7
4 3.87 4.9 96.8
8 7.97 2.5 99.7
14 14.14 3.5 101.0
18 18.37 4.0 102.1
24 25.17 3.9 104.9
r2 0.9934 - 0.9999
In order to show precision and accuracy, within-day and between-days variations were
determined (Table 5). Quality Control samples at three concentrations with 5 injections
for each concentration were used. Within-day precision ranged from 1.8% to 5.3% and
between-days precision from 3.8% to 8.1%. The mean accuracy ranged from 99.3% to
104.3%. All values were within the recommended limits.

17
Figure 7. Positive ion SRM chromatograms of the analytes. A) A known concentration
of the analytes in plasma (G 30 µM, F 4 µM and ISTD 5 µM), B) an unknown amount
of analytes in plasma samples and C) blank plasma samples.
The SRM chromatograms of the analytes from blank, standard and plasma samples are
shown in Figure 7. The specificity of the method was good for gliclazide. There is no
other substances present having the same retention time. However, Figure 7 shows
significant peaks for fosinoprilat and ISTD in the blank samples. This is due to the
contamination in the system. The contamination for ISTD is moderate (signal-to-noise
ratio, S/N = 11.2) and even higher for fosinoprilat (S/N = 21). S/N for ISTD in the
spiked samples was, however, thousands of times higher than in the blank samples. The
limit of detection (LOD, S/N of at least 3) and the limit of quantification (LOQ, S/N of
at least 10) were determined for all the analytes. In the cases where contamination was
observed in the blank sample, LODs and LOQs were determined with a concentration
that produced a S/N ratio three or ten times higher than the peak of the blank sample.
The LOQ for gliclazide was 1 μM. The LOD for fosinoprilat varied from 0.4 μM to 4
μM and the LOQ from 0.4 μM to 14 μM.

18
Figure 8. The recovery and the matrix effect of the analytes as analyte peak area (n=2-6,
mean ±SD).
The recovery (extraction efficiency) of the analytes from rat plasma and the matrix
effect were determined at one concentration (40 M). To study recovery the ISTD
corrected peak areas of analytes added in plasma before extraction were compared with
those where analytes were added in plasma after extraction (Figure 8). Calculated
concentrations of the same samples are shown and compared in Figure 9. The recovery
was 79.1% for fosinoprilat and 122.4% for gliclazide. The recovery of the extracted
samples was tolerable. Matrix effect was calculated by comparing the concentration of
the analytes added in plasma after extraction with the concentration of analytes added in
eluent (100% recovery). It was discovered that the plasma matrix caused ion
suppression in the ESI of fosinoprilat and glibenclamide but not of gliclazide.
0,0E+00
2,0E+06
4,0E+06
6,0E+06
8,0E+06
1,0E+07
Gliclazide Fosinoprilat ISTD
Pe
ak
are
a
std in eluent
std in extacted plasma
std in plasma

19
Figure 9. The recovery and the matrix effect of the analytes as concentration (n=2-6,
mean ±SD).
The stability of analytes was studied by determining the concentration of six 50 μM QC
samples before and after a 24-hour storage in -20 oC (Figure 10). In addition to this
three 50+20 μM QC samples were exposed to different time and temperature
conditions: a) stability at room temperature for 24 h, b) stability after two freeze–thaw
cycles and c) the long-term stability after storage at -20 ° C for 4 days (Table 7). These
samples were not analyzed before storing, only after. Results showed good stability for
all analytes in different circumstances. The stability of the stock solutions was studied
in -20 oC for 2 weeks and it was shown to comply with the requirements.
0,0
10,0
20,0
30,0
40,0
50,0
60,0
Gliclazide Fosinoprilat
Co
nce
ntr
ati
on
(u
M)
std in eluent
std in extracted plasma
std in plasma

20
Figure 10. The concentration of analytes (QC 50 μM) before and after a 24-hour storage
in -20 oC (n=6, mean ±SD).
Table 7. The stability of the analytes in rat plasma in different conditions (QC sample
50+20 μM, n=3).
- 20 °C / 4 days - 20 °C / 2 freeze-thaw Room
cycles temperature / 12 h
Gliclazide (μM) 49.1 55.1 57.8
RSD (%) 2.8 9.3 4.1
Fosinoprilat (μM) 21.8 19.7 19.4
RSD (%) 5.0 1.5 4.2
4 CONCLUSIONS
In this study a LC-MS/MS method was developed and validated for the simultaneous
analysis of fosinoprilat and gliclazide. The determination of fosinopril failed due to
sensitivity problems. The new method is based on a modified version of the work of Cui
et al. (2007).
Accuracy, precision, linearity, specificity, stability and reproducibility of the method
were shown to be good. The extraction recovery and matrix effect also complied with
the requirements. There were some contamination problems in the analytical system for
fosinoprilat but they diminished when a column wash of 0.1% TFA was added after
0
10
20
30
40
50
60
70
G F
Co
nse
ntr
ati
on
(u
M)
Unfrozen
Frozen

21
every analytical batch. This method was successfully used to analyze approximately
700 plasma samples collected from rats receiving gliclazide and/or fosinopril (10
mg/kg) intravenously and/or orally.

22
5 REFERENCES
Aburuz S, Millership J, McElnay J: The development and validation of liquid
chromatography method for the simultaneous determination of metformin and glipizide,
gliclazide, glibenclamide or glimperide in plasma. J Chromatogr B Analyt Technol
Biomed Life Sci 817: 277-286, 2005
Bansal G, Singh M, Jindal K, Singh S: Characterization of mass ionizable degradation
products of gliclazide by LC/ESI-MS. J Liq Chromatogr Relat Technol 31: 2174–2193,
2008
Chiasson J, Hamet P, Verdy M: The effect of Diamicron on the secretion and action of
insulin. Diabetes Res Clin Pract 14 Suppl 2: S47-51, 1991
Cui S, Feng F, Ma M, Liu H, Chen Y: Development and validation of liquid
chromatography-tandem mass spectrometric method for simultaneous determination of
fosinopril and its active metabolite fosinoprilat in human plasma. J Chromatogr B
Analyt Technol Biomed Life Sci 854: 143-151, 2007
Duchin K, Manning J, McKinstry D, Willard D: Tolerance and pharmacologic effects
of SQ 28, 555, a new angiotensin-converting enzyme (ACE) inhibitor. J Clin Pharmac
24: 422, 1984
Duchin K, Tu J, Frantz M, Willard D: Pharmacodynamics and pharmacokinetics of SQ
28,555, a new angiotensin-converting enzyme (ACE) inhibitor, in healthy subjects. Clin
Pharmac Ther 37: 192, 1985
Foroutan S, Zarghi A, Shafaati A, Khoddam A: Application of monolithic column in
quantification of gliclazide in human plasma by liquid chromatography. J Pharm
Biomed Anal 42: 513-516, 2006
Herings R, de Boer A, Stricker B, Leufkens H, Porsius A: Hypoglycaemia associated
with use of inhibitors of angiotensin converting enzyme. Lancet 345: 1195-1198, 1995
Jancic B, Ivanovic D, Medenica M, Malenovic A, Dimkovic N: Development of liquid
chromatographic method for fosinoprilat determination in human plasma using
microemulsion as eluent. J Chromatogr A 1088: 187-192, 2005
Jemal M, Huang M, Mao Y, Whigan D, Schuster A: Liquid chromatography/
electrospray tandem mass spectrometry method for the quantification of fosinoprilat in
human serum using automated 96-well solid-phase extraction for sample preparation.
Rapid Commun Mass Spectrom 14: 1023-1028, 2000
Jemal M, Mulvana D: Liquid chromatographic-electrospray tandem mass spectrometric
method for the simultaneous quantification of the prodrug fosinopril and the active drug
fosinoprilat in human serum. J Chromatogr B Biomed Sci Appl 739: 255-271, 2000

23
Matthews D, Hosker J, Stratton I: The physiological action of gliclazide: beta-cell
function and insulin resistance. Diabetes Res Clin Pract 14 Suppl 2: S53-59, 1991
McMurray J, Fraser D: Captopril, enalapril, and blood glucose. Lancet 1: 1035, 1986
US Department of Health and Human Services. Food and Drug Administration, Center
for Drug Evaluation and Research (CDER): Guidance for Industry, Bioanalytical
Method Validation, 2001
Wang C, Zhang W, Xiang B, Yu L, Ma P: Liquid chromatography--mass spectrometry
method for the determination of gliclazide in human plasma and application to a
pharmacokinetic study of gliclazide sustained release tablets. Arzneimittelforschung 58:
653-658, 2008

APPENDIX 4
Raw data of the pharmacokinetic studies. The column ”concentration” represents the
concentration of gliclazide in the plasma samples in the beginning and at the end of the
study administered either intravenously (i.v.) or per orally (p.o.).
# of
combined
rats t (h)
Concentration
beginning i.v.
(mg/L)
Concentration
end i.v.
(mg/L) t (h)
Concentration
beginning p.o.
(mg/L)
Concentration
end p.o.
(mg/L)
1,2 0 0 0,301
1,2 0,08 0,25 3,107 3,768
1,2 0,17 61,700 39,781 0,5 4,496 10,527
1,2 0,33 38,810 0,75 7,681 7,148
1,2 0,67 22,106 31,267 1 9,331 15,314
1,2 1 22,251 23,319 2 13,276 17,546
1,2 2 12,201 19,446 4 21,879 11,870
1,2 4 13,099 13,770 6 15,055 18,014
1,2 6 3,539 6,873 10 9,298 5,595
1,2 10 3,946 2,628 24 1,087
1,6 0 0 0,301
1,6 0,08 0,25 0,846 2,992
1,6 0,17 61,700 39,781 0,5 4,496 10,527
1,6 0,33 27,183 0,75 2,450 7,924
1,6 0,67 22,106 31,267 1 9,331 15,314
1,6 1 17,934 2 5,708 16,527
1,6 2 12,201 19,446 4 21,879 11,870
1,6 4 11,166 6 12,508 17,004
1,6 6 3,539 6,873 10 9,298 5,595
1,6 10 2,628 24
1,10 0 0 0,301
1,10 0,08 37,112 42,287 0,25 0,594 4,099
1,10 0,17 61,700 39,781 0,5 4,496 10,527
1,10 0,33 31,566 37,274 0,75 2,406 8,191
1,10 0,67 22,106 31,267 1 9,331 15,314
1,10 1 28,404 29,714 2 6,113 14,942
1,10 2 12,201 19,446 4 21,879 11,870
1,10 4 14,158 14,239 6 10,406 16,179
1,10 6 3,539 6,873 10 9,298 5,595
1,10 10 2,516 3,170 24 0,234
5,2 0 0
5,2 0,08 0,25 3,107 3,768
5,2 0,17 20,214 0,5 3,687
5,2 0,33 38,810 0,75 7,681 7,148

5,2 0,67 18,944 1 7,568
5,2 1 22,251 23,319 2 13,276 17,546
5,2 2 13,228 4 14,974
5,2 4 13,099 13,770 6 15,055 18,014
5,2 6 4,124 10 8,716
5,2 10 3,946 2,628 24 1,087
5,6 0 0
5,6 0,08 0,25 0,846 2,992
5,6 0,17 20,214 0,5 3,687
5,6 0,33 27,183 0,75 2,450 7,924
5,6 0,67 18,944 1 7,568
5,6 1 17,934 2 5,708 16,527
5,6 2 13,228 4 14,974
5,6 4 11,166 6 12,508 17,004
5,6 6 4,124 10 8,716
5,6 10 2,628 24
5,10 0 0
5,10 0,08 37,112 42,287 0,25 0,594 4,099
5,10 0,17 20,214 0,5 3,687
5,10 0,33 31,566 37,274 0,75 2,406 8,191
5,10 0,67 18,944 1 7,568
5,10 1 28,404 29,714 2 6,113 14,942
5,10 2 13,228 4 14,974
5,10 4 14,158 14,239 6 10,406 16,179
5,10 6 4,124 10 8,716
5,10 10 2,516 3,170 24 0,234
9,2 0 0 0,374
9,2 0,08 0,25 3,107 3,768
9,2 0,17 33,215 30,434 0,5 3,784 8,449
9,2 0,33 38,810 0,75 7,681 7,148
9,2 0,67 25,558 27,305 1 6,210 15,767
9,2 1 22,251 23,319 2 13,276 17,546
9,2 2 19,583 21,378 4 11,756 21,855
9,2 4 13,099 13,770 6 15,055 18,014
9,2 6 9,371 9,274 10 5,886 18,589
9,2 10 3,946 2,628 24 1,087
9,6 0 0 0,374
9,6 0,08 0,25 0,846 2,992
9,6 0,17 33,215 30,434 0,5 3,784 8,449
9,6 0,33 27,183 0,75 2,450 7,924
9,6 0,67 25,558 27,305 1 6,210 15,767
9,6 1 17,934 2 5,708 16,527
9,6 2 19,583 21,378 4 11,756 21,855
9,6 4 11,166 6 12,508 17,004

9,6 6 9,371 9,274 10 5,886 18,589
9,6 10 2,628 24
9,10 0 0 0,374
9,10 0,08 37,112 42,287 0,25 0,594 4,099
9,10 0,17 33,215 30,434 0,5 3,784 8,449
9,10 0,33 31,566 37,274 0,75 2,406 8,191
9,10 0,67 25,558 27,305 1 6,210 15,767
9,10 1 28,404 29,714 2 6,113 14,942
9,10 2 19,583 21,378 4 11,756 21,855
9,10 4 14,158 14,239 6 10,406 16,179
9,10 6 9,371 9,274 10 5,886 18,589
9,10 10 2,516 3,170 24 0,234
7,8 0 0 0,513
7,8 0,08 33,401 0,25 5,336 3,112
7,8 0,17 14,699 36,870 0,5 3,687 4,808
7,8 0,33 29,876 0,75 10,519 8,304
7,8 0,67 14,206 33,555 1 7,422 10,034
7,8 1 18,637 2 18,669 18,128
7,8 2 9,460 25,728 4 13,721 17,748
7,8 4 10,042 6 13,899 21,200
7,8 6 9,864 10 6,501 9,533
7,8 10 3,105 24
7,14 0 0 0,513
7,14 0,08 50,939 0,25
7,14 0,17 14,699 36,870 0,5 3,687 4,808
7,14 0,33 38,244 0,75
7,14 0,67 14,206 33,555 1 7,422 10,034
7,14 1 37,759 2 13,082 16,397
7,14 2 9,460 25,728 4 13,721 17,748
7,14 4 6 17,378 21,055
7,14 6 9,864 10 6,501 9,533
7,14 10 24 0,121 0,780
7,18 0 0 0,513
7,18 0,08 27,103 0,25
7,18 0,17 14,699 36,870 0,5 3,687 4,808
7,18 0,33 21,936 0,75
7,18 0,67 14,206 33,555 1 7,422 10,034
7,18 1 10,552 2
7,18 2 9,460 25,728 4 13,721 17,748
7,18 4 6
7,18 6 9,864 10 6,501 9,533
7,18 10 24
13,8 0 0 1,210
13,8 0,08 33,401 0,25 5,336 3,112

13,8 0,17 41,851 0,5 4,364 7,253
13,8 0,33 29,876 0,75 10,519 8,304
13,8 0,67 33,878 1 10,358 9,080
13,8 1 18,637 2 18,669 18,128
13,8 2 25,130 4 15,120
13,8 4 10,042 6 13,899 21,200
13,8 6 11,829 10 10,180 9,064
13,8 10 3,105 24
13,14 0 0 1,210
13,14 0,08 50,939 0,25
13,14 0,17 41,851 0,5 4,364 7,253
13,14 0,33 38,244 0,75
13,14 0,67 33,878 1 10,358 9,080
13,14 1 37,759 2 13,082 16,397
13,14 2 25,130 4 15,120
13,14 4 6 17,378 21,055
13,14 6 11,829 10 10,180 9,064
13,14 10 24 0,121 0,780
13,18 0 0 1,210
13,18 0,08 27,103 0,25
13,18 0,17 41,851 0,5 4,364 7,253
13,18 0,33 21,936 0,75
13,18 0,67 33,878 1 10,358 9,080
13,18 1 10,552 2
13,18 2 25,130 4 15,120
13,18 4 6
13,18 6 11,829 10 10,180 9,064
13,18 10 24
17,8 0 0
17,8 0,08 33,401 0,25 5,336 3,112
17,8 0,17 31,598 33,223 0,5 4,059
17,8 0,33 29,876 0,75 10,519 8,304
17,8 0,67 27,232 28,307 1 0,886 8,199
17,8 1 18,637 2 18,669 18,128
17,8 2 19,491 22,025 4 8,037 13,244
17,8 4 10,042 6 13,899 21,200
17,8 6 6,177 7,107 10 4,075 7,342
17,8 10 3,105 24
17,14 0 0
17,14 0,08 50,939 0,25
17,14 0,17 31,598 33,223 0,5 4,059
17,14 0,33 38,244 0,75
17,14 0,67 27,232 28,307 1 0,886 8,199
17,14 1 37,759 2 13,082 16,397

17,14 2 19,491 22,025 4 8,037 13,244
17,14 4 6 17,378 21,055
17,14 6 6,177 7,107 10 4,075 7,342
17,14 10 24 0,121 0,780
17,18 0 0
17,18 0,08 27,103 0,25
17,18 0,17 31,598 33,223 0,5 4,059
17,18 0,33 21,936 0,75
17,18 0,67 27,232 28,307 1 0,886 8,199
17,18 1 10,552 2
17,18 2 19,491 22,025 4 8,037 13,244
17,18 4 6
17,18 6 6,177 7,107 10 4,075 7,342
17,18 10 24
19,20 0 0
19,20 0,08 31,889 46,977 0,25 4,593 3,541
19,20 0,17 56,599 0,5 4,900 9,339
19,20 0,33 16,373 20,853 0,75 12,064 12,411
19,20 0,67 41,802 1 10,244 21,111
19,20 1 14,627 14,093 2 20,133 22,300
19,20 2 21,847 4 21,516 19,171
19,20 4 3,954 3,315 6 12,775 9,840
19,20 6 5,587 10 6,072 6,606
19,20 10 0,275 24
19,28 0 0
19,28 0,08 49,079 32,415 0,25 1,194 4,439
19,28 0,17 56,599 0,5 4,900 9,339
19,28 0,33 15,605 23,496 0,75 4,107 14,513
19,28 0,67 41,802 1 10,244 21,111
19,28 1 11,926 18,063 2 14,053 18,985
19,28 2 21,847 4 21,516 19,171
19,28 4 3,243 4,924 6 8,821 10,859
19,28 6 5,587 10 6,072 6,606
19,28 10 5,328 0,166 24
19,30 0 0
19,30 0,08 84,089 0,25 3,647 2,942
19,30 0,17 56,599 0,5 4,900 9,339
19,30 0,33 34,929 52,071 0,75 10,296 10,888
19,30 0,67 41,802 1 10,244 21,111
19,30 1 18,006 38,487 2 16,009 16,246
19,30 2 21,847 4 21,516 19,171
19,30 4 6,361 12,085 6 7,557 19,297
19,30 6 5,587 10 6,072 6,606
19,30 10 0,593 1,618 24 0,997

27,20 0 0
27,20 0,08 31,889 46,977 0,25 4,593 3,541
27,20 0,17 33,393 31,331 0,5 5,676 6,719
27,20 0,33 16,373 20,853 0,75 12,064 12,411
27,20 0,67 19,397 26,957 1 10,867 10,180
27,20 1 14,627 14,093 2 20,133 22,300
27,20 2 12,403 16,220 4 14,643 12,710
27,20 4 3,954 3,315 6 12,775 9,840
27,20 6 3,355 3,824 10 2,992 6,509
27,20 10 0,275 24
27,28 0 0
27,28 0,08 49,079 32,415 0,25 1,194 4,439
27,28 0,17 33,393 31,331 0,5 5,676 6,719
27,28 0,33 15,605 23,496 0,75 4,107 14,513
27,28 0,67 19,397 26,957 1 10,867 10,180
27,28 1 11,926 18,063 2 14,053 18,985
27,28 2 12,403 16,220 4 14,643 12,710
27,28 4 3,243 4,924 6 8,821 10,859
27,28 6 3,355 3,824 10 2,992 6,509
27,28 10 5,328 0,166 24
27,30 0 0
27,30 0,08 84,089 0,25 3,647 2,942
27,30 0,17 33,393 31,331 0,5 5,676 6,719
27,30 0,33 34,929 52,071 0,75 10,296 10,888
27,30 0,67 19,397 26,957 1 10,867 10,180
27,30 1 18,006 38,487 2 16,009 16,246
27,30 2 12,403 16,220 4 14,643 12,710
27,30 4 6,361 12,085 6 7,557 19,297
27,30 6 3,355 3,824 10 2,992 6,509
27,30 10 0,593 1,618 24 0,997
29,20 0 0
29,20 0,08 31,889 46,977 0,25 4,593 3,541
29,20 0,17 26,149 0,5 5,150 6,441
29,20 0,33 16,373 20,853 0,75 12,064 12,411
29,20 0,67 16,632 22,300 1 11,077 9,145
29,20 1 14,627 14,093 2 20,133 22,300
29,20 2 12,088 17,311 4 9,120 18,346
29,20 4 3,954 3,315 6 12,775 9,840
29,20 6 4,819 7,115 10 5,062 8,385
29,20 10 0,275 24
29,28 0 0
29,28 0,08 49,079 32,415 0,25 1,194 4,439
29,28 0,17 26,149 0,5 5,150 6,441
29,28 0,33 15,605 23,496 0,75 4,107 14,513

29,28 0,67 16,632 22,300 1 11,077 9,145
29,28 1 11,926 18,063 2 14,053 18,985
29,28 2 12,088 17,311 4 9,120 18,346
29,28 4 3,243 4,924 6 8,821 10,859
29,28 6 4,819 7,115 10 5,062 8,385
29,28 10 5,328 0,166 24
29,30 0 0
29,30 0,08 84,089 0,25 3,647 2,942
29,30 0,17 26,149 0,5 5,150 6,441
29,30 0,33 34,929 52,071 0,75 10,296 10,888
29,30 0,67 16,632 22,300 1 11,077 9,145
29,30 1 18,006 38,487 2 16,009 16,246
29,30 2 12,088 17,311 4 9,120 18,346
29,30 4 6,361 12,085 6 7,557 19,297
29,30 6 4,819 7,115 10 5,062 8,385
29,30 10 0,593 1,618 24 0,997
21,22 0 0
21,22 0,08 70,263 45,360 0,25 2,495 3,128
21,22 0,17 44,147 0,5 9,004 11,740
21,22 0,33 18,079 40,832 0,75 7,835 8,094
21,22 0,67 30,159 1 16,915 19,190
21,22 1 17,117 21,378 2 19,033 23,238
21,22 2 19,648 4 16,131 13,171
21,22 4 5,320 5,854 6 7,471 8,538
21,22 6 5,256 10 3,930 4,601
21,22 10 0,338 0,365 24
21,26 0 0
21,26 0,08 44,228 0,25 1,112 1,797
21,26 0,17 44,147 0,5 9,004 11,740
21,26 0,33 28,712 0,75 6,210 11,498
21,26 0,67 30,159 1 16,915 19,190
21,26 1 19,567 2 15,718 19,615
21,26 2 19,648 4 16,131 13,171
21,26 4 5,943 6 10,333 6,824
21,26 6 5,256 10 3,930 4,601
21,26 10 24
21,36 0 0
21,36 0,08 35,738 0,25 4,447
21,36 0,17 44,147 0,5 9,004 11,740
21,36 0,33 29,051 0,75 12,807
21,36 0,67 30,159 1 16,915 19,190
21,36 1 23,965 2 19,122
21,36 2 19,648 4 16,131 13,171
21,36 4 10,192 6 14,376

21,36 6 5,256 10 3,930 4,601
21,36 10 1,685 24
25,22 0 0
25,22 0,08 70,263 45,360 0,25 2,495 3,128
25,22 0,17 33,878 41,074 0,5 5,498 6,468
25,22 0,33 18,079 40,832 0,75 7,835 8,094
25,22 0,67 27,127 34,384 1 9,573 12,888
25,22 1 17,117 21,378 2 19,033 23,238
25,22 2 18,920 18,969 4 5,142 17,246
25,22 4 5,320 5,854 6 7,471 8,538
25,22 6 4,229 4,371 10 2,090 3,194
25,22 10 0,338 0,365 24
25,26 0 0
25,26 0,08 44,228 0,25 1,112 1,797
25,26 0,17 33,878 41,074 0,5 5,498 6,468
25,26 0,33 28,712 0,75 6,210 11,498
25,26 0,67 27,127 34,384 1 9,573 12,888
25,26 1 19,567 2 15,718 19,615
25,26 2 18,920 18,969 4 5,142 17,246
25,26 4 5,943 6 10,333 6,824
25,26 6 4,229 4,371 10 2,090 3,194
25,26 10 24
25,36 0 0
25,36 0,08 35,738 0,25 4,447
25,36 0,17 33,878 41,074 0,5 5,498 6,468
25,36 0,33 29,051 0,75 12,807
25,36 0,67 27,127 34,384 1 9,573 12,888
25,36 1 23,965 2 19,122
25,36 2 18,920 18,969 4 5,142 17,246
25,36 4 10,192 6 14,376
25,36 6 4,229 4,371 10 2,090 3,194
25,36 10 1,685 24
35,22 0 0
35,22 0,08 70,263 45,360 0,25 2,495 3,128
35,22 0,17 29,933 29,367 0,5 6,210 6,420
35,22 0,33 18,079 40,832 0,75 7,835 8,094
35,22 0,67 21,184 23,108 1 11,118 8,724
35,22 1 17,117 21,378 2 19,033 23,238
35,22 2 14,004 14,691 4 11,255 10,042
35,22 4 5,320 5,854 6 7,471 8,538
35,22 6 2,876 3,580 10 2,194 5,991
35,22 10 0,338 0,365 24
35,26 0 0
35,26 0,08 44,228 0,25 1,112 1,797

35,26 0,17 29,933 29,367 0,5 6,210 6,420
35,26 0,33 28,712 0,75 6,210 11,498
35,26 0,67 21,184 23,108 1 11,118 8,724
35,26 1 19,567 2 15,718 19,615
35,26 2 14,004 14,691 4 11,255 10,042
35,26 4 5,943 6 10,333 6,824
35,26 6 2,876 3,580 10 2,194 5,991
35,26 10 24
35,36 0 0
35,36 0,08 35,738 0,25 4,447
35,36 0,17 29,933 29,367 0,5 6,210 6,420
35,36 0,33 29,051 0,75 12,807
35,36 0,67 21,184 23,108 1 11,118 8,724
35,36 1 23,965 2 19,122
35,36 2 14,004 14,691 4 11,255 10,042
35,36 4 10,192 6 14,376
35,36 6 2,876 3,580 10 2,194 5,991
35,36 10 1,685 24
In the beginning of the study At the end of the study
# of
combined
rats
Time of
Dose
(h)
Dose
i.v.
(mg)
Dose
p.o.
(mg)
# of
combined
rats
Time
of Dose
(h)
Dose
i.v.
(mg)
Dose
p.o.
(mg)
1,10 0 1,83 3,04 1,10 0 2,05 3,42
1,2 0 1,83 3,04 1,2 0 2,05 3,42
1,6 0 1,83 3,04 1,6 0 2,05 3,42
5,10 0 1,83 3,04 5,10 0 2,05 3,42
5,2 0 1,83 3,04 5,2 0 2,05 3,42
5,6 0 1,83 3,04 5,6 0 2,05 3,42
9,10 0 1,83 3,04 9,10 0 2,05 3,42
9,2 0 1,83 3,04 9,2 0 2,05 3,42
9,6 0 1,83 3,04 9,6 0 2,05 3,42
7,14 0 1,87 3,11 7,14 0 2,07 3,45
7,18 0 1,87 3,11 7,18 0 2,07 3,45
7,8 0 1,87 3,11 7,8 0 2,07 3,45
13,14 0 1,87 3,11 13,14 0 2,07 3,45
13,18 0 1,87 3,11 13,18 0 2,07 3,45
13,8 0 1,87 3,11 13,8 0 2,07 3,45
17,14 0 1,87 3,11 17,14 0 2,07 3,45
17,18 0 1,87 3,11 17,18 0 2,07 3,45
17,8 0 1,87 3,11 17,8 0 2,07 3,45
19,20 0 2,00 3,34 19,20 0 2,55 4,26
19,28 0 2,00 3,34 19,28 0 2,55 4,26
19,30 0 2,00 3,34 19,30 0 2,55 4,26
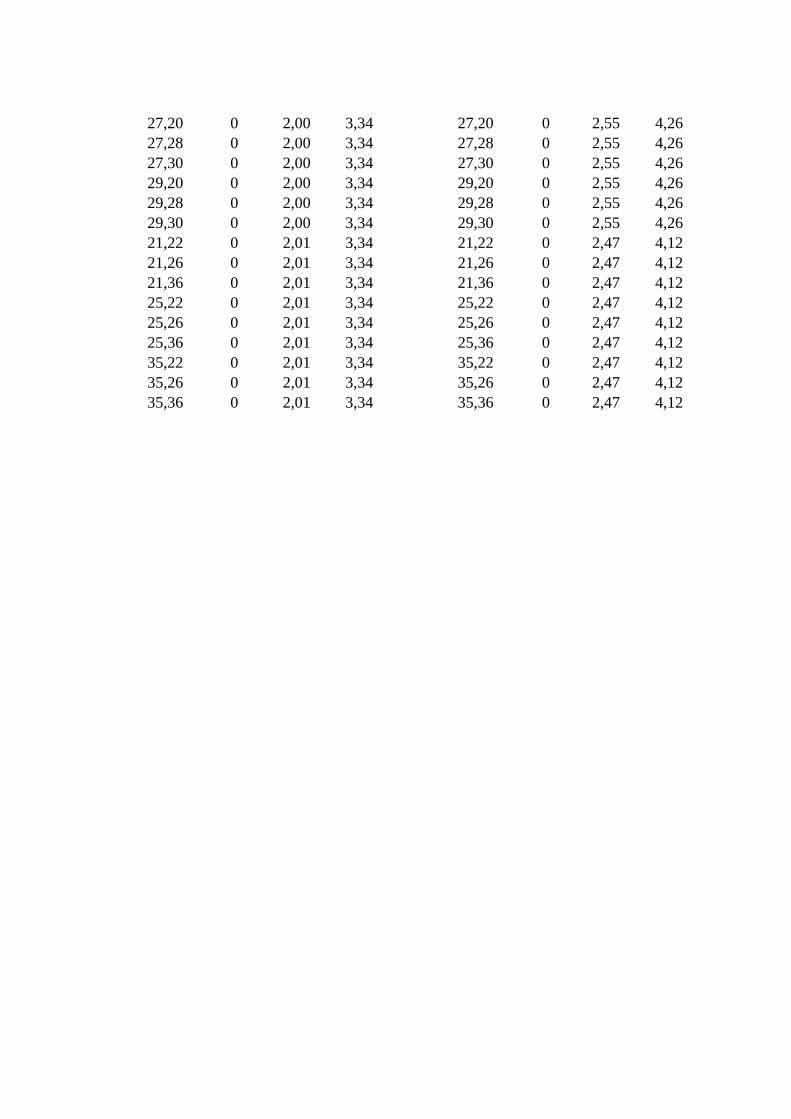
27,20 0 2,00 3,34 27,20 0 2,55 4,26
27,28 0 2,00 3,34 27,28 0 2,55 4,26
27,30 0 2,00 3,34 27,30 0 2,55 4,26
29,20 0 2,00 3,34 29,20 0 2,55 4,26
29,28 0 2,00 3,34 29,28 0 2,55 4,26
29,30 0 2,00 3,34 29,30 0 2,55 4,26
21,22 0 2,01 3,34 21,22 0 2,47 4,12
21,26 0 2,01 3,34 21,26 0 2,47 4,12
21,36 0 2,01 3,34 21,36 0 2,47 4,12
25,22 0 2,01 3,34 25,22 0 2,47 4,12
25,26 0 2,01 3,34 25,26 0 2,47 4,12
25,36 0 2,01 3,34 25,36 0 2,47 4,12
35,22 0 2,01 3,34 35,22 0 2,47 4,12
35,26 0 2,01 3,34 35,26 0 2,47 4,12
35,36 0 2,01 3,34 35,36 0 2,47 4,12


![Computational analysis of interaction between seaweed ...biologicalengineering.in/gallery/18-05-01-03.pdf · hypoglycemic agents an important area of investigation [3,4]. Apart from](https://static.fdocuments.us/doc/165x107/5fd24b3cb193bf7d9924d1f4/computational-analysis-of-interaction-between-seaweed-b-hypoglycemic-agents-an.jpg)