Hyperuricemia and the RAAS in experimental renal insufficiency
67
Hyperuricemia and the renin-angiotensin-aldosterone system in experimental renal insufficiency MASTER’S THESIS Institute of Medical Technology (IMT) University of Tampere April 2008 Arttu Eräranta
Transcript of Hyperuricemia and the RAAS in experimental renal insufficiency

Hyperuricemia and the renin-angiotensin-aldosterone system
in experimental renal insufficiency
MASTER’S THESIS
Institute of Medical Technology (IMT)
University of Tampere
April 2008
Arttu Eräranta

Acknowledgements
This Master’s thesis was done in the Institute of Medical Technology (IMT) at the
University of Tampere. The main work involving the actual rat experiment and
radioimmunoassays was carried out in the Medical School at the University of Tampere,
while additional laboratory analyses were performed in the Minerva Institute for Medical
Research at the University of Helsinki and in the Department of Laboratory Medicine at
the Seinäjoki University Hospital.
First, I wish to thank my supervisor, Professor Ilkka Pörsti, for his excellent guidance,
support, and advice during the work. Acknowledgements are also due to Tuija Vehmas,
Peeter Kööbi, and Terhi Suvanto for their friendship and valuable technical assistance
during the experiment, and to Jukka Mustonen, Ilkka Tikkanen, Päivi Lakkisto, and Onni
Niemelä for providing facilities, expertise and reagents to this study. This work was
supported by the Medical Research Fund of Tampere University Hospital and the Finnish
Foundation for Cardiovascular Research.
Finally, I would like to express my gratitude to my wife Sonja, my two-year-old son Aaro,
and the rest of my family for providing me with the other necessities of life.
April 2008, Tampere
Arttu Eräranta

PRO GRADU –TUTKIELMA
Paikka: TAMPEREEN YLIOPISTO Lääketieteellinen tiedekunta Lääketieteellisen teknologian instituutti (IMT) Tekijä: ERÄRANTA, ARTTU JUHANA Otsikko: Hyperurikemia ja reniini-angiotensiini-aldosteronijärjestelmä
kokeellisessa munuaisten vajaatoiminnassa Sivumäärä: 67 s. Ohjaaja: professori Ilkka Pörsti, sisätautioppi, lääketieteen laitos Tampereen yliopisto Tarkastajat: professorit Tapio Visakorpi ja Ilkka Pörsti Aika: Huhtikuu 2008
TIIVISTELMÄ
Tutkimuksen tausta ja tavoitteet – Veren korkea virtsahappopitoisuus, hyperurikemia, on tyypillistä pitkälle edenneessä munuaisten vajaatoiminnassa, mutta hyperurikemia voi altistaa natriumin erityksen vähentymiselle sekä korkealle verenpaineelle myös normaalin munuaistoiminnan vallitessa. Hyperurikemian merkityksestä sydän- ja verisuonitautien synnyssä kuitenkin kiistellään. Tämän tutkimuksen tavoitteena oli selvittää kokeellisen hyperurikemian vaikutuksia reniini-angiotensiini-aldosteronijärjestelmän komponentteihin munuaisissa ja verenkierrossa.
Tutkimusmenetelmät – 48 Sprague Dawley –rottaa jaettiin kahteen ryhmään, joille suoritettiin 5/6 nefrektomia (NX) tai munuaiskapselin poisto (Sham). Kolme viikkoa leikkausten jälkeen 12 rottaa kummastakin ryhmästä siirrettiin 2.0% oksonihappoa sisältävälle ruokavaliolle (Oxo). Ruokavalioiden kokonaiskesto oli 9 viikkoa. Verenpaine mitattiin epäsuoralla häntämansettimittauksella, minkä lisäksi rotista otettiin veri-, virtsa- ja munuaiskudosnäytteet. Munuaisten angiotensiinikonvertaasientsyymejä (ACE ja ACE2) ja angiotensiini II -reseptoreja (AT1R ja AT2R) tutkittiin kvantitiivisella käänteis-PCR:lla sekä autoradiografialla. Plasman reniiniaktiivisuutta (PRA) ja aldosteronipitoisuutta mitattiin radioimmunoassay-menetelmällä.
Tutkimustulokset – Oksonihappodieetti lisäsi selvästi plasman virtsahappopitoisuutta, mutta verenpaine nousi ainoastaan NX+Oxo –ryhmässä. Kreatiniinipuhdistuma väheni 60% molemmissa vajaatoimintaryhmissä ja 25% Sham+Oxo -ryhmässä. NX-ryhmän PRA oli 90% matalampi kuin Sham-ryhmällä. NX+Oxo ja Sham+Oxo –ryhmien PRA ja aldosteroni olivat selvästi korkeampia kuin vastaavien verrokkiryhmien arvot. Hyperurikemia lisäsi virtsan kalium / natrium -suhdetta yli 60% molemmissa hyperurikemiaryhmissä. Munuaisen reniini-angiotensiinijärjestelmän komponenteista (ACE, ACE2, AT1R ja AT2R) ei löytynyt tälle vaikutukselle selittävää tekijää, joten suolatasapainon muutos selittynee järjestelmän kiertävissä komponenteissa havaituilla muutoksilla.
Johtopäätökset – Tulosten perusteella hyperurikemian haitallisia vaikutuksia verenkiertoelimistöön voidaan selittää PRA:n, aldosteronin ja näistä seuraavan virtsan kalium / natrium -suhteen nousulla.

MASTER’S THESIS
Place: UNIVERSITY OF TAMPERE Faculty of Medicine Institute of Medical Technology (IMT) Author: ERÄRANTA, ARTTU JUHANA Title: Hyperuricemia and the renin-angiotensin-aldosterone system
in experimental renal insufficiency Pages: 67 pp. Supervisor: Professor Ilkka Pörsti, Internal Medicine, Medical School
University of Tampere Reviewers: Professors Tapio Visakorpi and Ilkka Pörsti Date: April 2008
ABSTRACT
Background and Aims – Hyperuricemia is associated with renal insufficiency and may predispose to Na+ retention and hypertension. Whether hyperuricemia plays a causal role in the pathogenesis of cardiovascular disease remains controversial. The aim of the study was to examine the effects of hyperuricemia on circulating and renal components of the renin-angiotensin-aldosterone system in experimental renal insufficiency.
Methods – Three weeks after 5/6 nephrectomy (NX) or sham-operation, rats were put on 2.0% oxonic acid diet (Oxo) for 9 weeks. Blood pressure (BP) was monitored using tail-cuff, and blood, urine, and kidney samples were taken, as appropriate. Kidney angiotensin-converting enzymes (ACE, ACE2), and angiotensin II receptors (AT1R, AT2R) were examined using real-time RT-PCR and autoradiography, while plasma renin activity (PRA) and aldosterone were determined using radioimmunoassay.
Results – Oxo increased plasma uric acid as expected, while BP was elevated only in hyperuricemic NX rats. Creatinine clearance was reduced by 60% in both NX groups, and by 25% in hyperuricemic Sham rats. The NX group showed over 90% suppression of PRA, whereas Sham+Oxo group showed over 1.2-fold and NX+Oxo group over 2.3-fold increases in both PRA and plasma aldosterone. Hyperuricemia increased K+ and decreased Na+ excretion in Sham and NX rats, leading to over 1.6-fold increase in urine K+ to Na+ ratio. No changes in kidney ACE, ACE2, AT1R or AT2R were detected that could explain the hyperuricemia-induced alteration in Na+-K+ balance.
Conclusions – As oxonic acid diet increased PRA, plasma aldosterone, and urine K+ to Na+ ratio, these changes may play a significant role in the harmful cardiovascular actions of hyperuricemia.
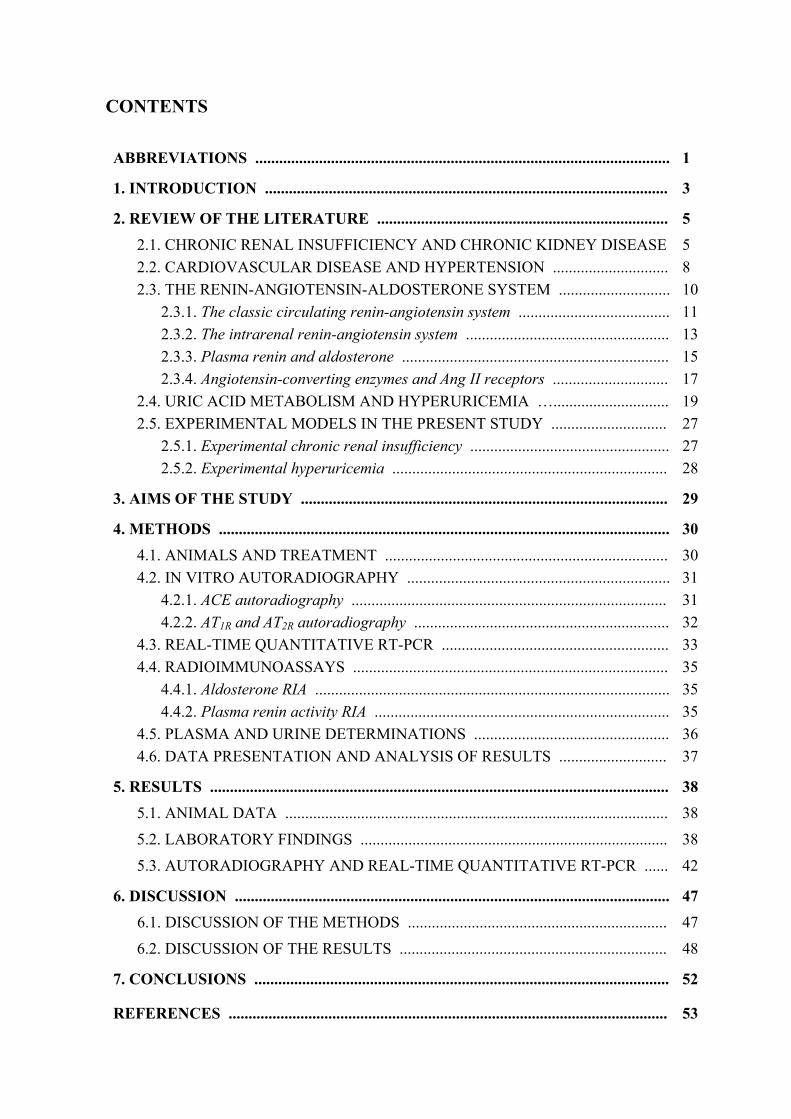
CONTENTS
ABBREVIATIONS ........................................................................................................
1. INTRODUCTION .....................................................................................................
2. REVIEW OF THE LITERATURE ......................................................................... 2.1. CHRONIC RENAL INSUFFICIENCY AND CHRONIC KIDNEY DISEASE 2.2. CARDIOVASCULAR DISEASE AND HYPERTENSION ............................. 2.3. THE RENIN-ANGIOTENSIN-ALDOSTERONE SYSTEM ............................
2.3.1. The classic circulating renin-angiotensin system ...................................... 2.3.2. The intrarenal renin-angiotensin system ................................................... 2.3.3. Plasma renin and aldosterone ................................................................... 2.3.4. Angiotensin-converting enzymes and Ang II receptors .............................
2.4. URIC ACID METABOLISM AND HYPERURICEMIA …............................. 2.5. EXPERIMENTAL MODELS IN THE PRESENT STUDY .............................
2.5.1. Experimental chronic renal insufficiency .................................................. 2.5.2. Experimental hyperuricemia .....................................................................
3. AIMS OF THE STUDY ............................................................................................
4. METHODS ................................................................................................................. 4.1. ANIMALS AND TREATMENT ....................................................................... 4.2. IN VITRO AUTORADIOGRAPHY ..................................................................
4.2.1. ACE autoradiography ............................................................................... 4.2.2. AT1R and AT2R autoradiography ................................................................
4.3. REAL-TIME QUANTITATIVE RT-PCR ......................................................... 4.4. RADIOIMMUNOASSAYS ...............................................................................
4.4.1. Aldosterone RIA ......................................................................................... 4.4.2. Plasma renin activity RIA ..........................................................................
4.5. PLASMA AND URINE DETERMINATIONS ................................................. 4.6. DATA PRESENTATION AND ANALYSIS OF RESULTS ...........................
5. RESULTS ................................................................................................................... 5.1. ANIMAL DATA ................................................................................................
5.2. LABORATORY FINDINGS .............................................................................
5.3. AUTORADIOGRAPHY AND REAL-TIME QUANTITATIVE RT-PCR ......
6. DISCUSSION .............................................................................................................
6.1. DISCUSSION OF THE METHODS .................................................................
6.2. DISCUSSION OF THE RESULTS ...................................................................
7. CONCLUSIONS ........................................................................................................
REFERENCES ..............................................................................................................
1
3
5 5 8 10 11 13 15 17 19 27 27 28
29
30 30 31 31 32 33 35 35 35 36 37
38 38
38
42
47 47
48
52
53
ABBREVIATIONS
ACE angiotensin-converting enzyme
ACE2 angiotensin-converting enzyme 2
ACEI angiotensin-converting enzyme inhibitor
Ang angiotensin
Ang I angiotensin I
Ang II angiotensin II
ANOVA analysis of variance
AT1aR angiotensin II receptor type 1 subtype A
AT1bR angiotensin II receptor type 1 subtype B
AT1R angiotensin II receptor type 1
AT2R angiotensin II receptor type 2
ATR angiotensin II receptors
ATRB angiotensin II receptor type 1 blocker
ATP adenosine triphosphate
BP blood pressure
CKD chronic kidney disease
COX-2 cyclooxygenase-2
CRF chronic renal failure
CRI chronic renal insufficiency
c-Src cellular Src tyrosine kinase
CVD cardiovascular disease
EDTA ethylene diamine tetraacetic acid
ERK1/2 extracellular signal-regulated kinases 1 and 2
ESRD end-stage renal disease
FGF fibroblast growth factor
GFR glomerular filtration rate
K/DOQI Kidney Disease Outcome Quality Initiative
1

2
MAP mitogen-activated protein (kinase)
MDRD Modification of Diet in Renal Disease study
NAD+ nicotinamide adenine dinucleotide
NX 5/6 nephrectomy
NX+Oxo 5/6 nephrectomy with 2.0% oxonic acid diet
PCR polymerase chain reaction
PDGF platelet-derived growth factor
pKa acid dissociation constant
PMSF phenylmethylsulfonyl fluoride
PRA plasma renin activity
RAAS renin-angiotensin-aldosterone system
RAS renin-angiotensin system
RIA radioimmunoassay
RT-PCR reverse transcriptase polymerase chain reaction
SEM standard error of the mean
Sham sham operation
Sham+Oxo sham operation with 2.0% oxonic acid diet
TGF-β transforming growth factor β
UA uric acid, urate
URAT1 uric acid transporter 1
VSMC vascular smooth muscle cell

1. INTRODUCTION
Chronic kidney disease (CKD) and cardiovascular disease (CVD) are becoming
increasingly prevalent in our modern society bringing along a plethora of related
disorders. These disorders include hyperparathyroidism, insulin resistance, glucose
intolerance, metabolic syndrome, and hyperuricemia, while new associations are
discovered constantly (Pörsti et al., 2004; Nakagawa et al., 2008; Rosamond et al., 2008).
Treatment of these diseases is highly expensive and will cause a substantial economic
burden for future populations (Salonen et al., 2007). Therefore focusing research effort on
the causes and disease prevention rather than simple treatment of symptoms is the key step
forward.
The pathological mechanisms behind kidney disease and associated disorders are heavily
tied to changes in kidney morphology and the renin-angiotensin-aldosterone system
(RAAS) (Johnson et al., 2008a). Hypertension – the most common form of CVD – is
present in virtually every CKD patient, while it may both result from, and contribute to
CKD. Progression of CKD is accelerated by hypertension, which makes control of blood
pressure (BP) one of the main elements in CKD treatment (Fogo, 2007). Inhibitors of the
RAAS are the most typically used drugs with hypertensive CKD patients, while additional
renal replacement therapies are given to end-stage renal disease (ESRD) patients with
severely lowered glomerular filtration capacity (Lameire et al., 2005; Khwaja et al., 2007).
Hyperuricemia is a disorder caused by elevated serum uric acid (UA), generated during
purine catabolism by the enzyme xanthine oxidoreductase. It is best known for its
importance in gout, which is a disease recognized for centuries and currently the most
common inflammatory arthritis in the Western world (Terkeltaub, 2006). Gout is caused
by deposition of urate crystals in the joints in which they induce chronic inflammation and
tissue damage. Hyperuricemia is also known to be present without crystal formation in
many CKD and CVD patients, although its putative role as an independent risk factor for
these diseases is still controverial (Johnson et al., 2003). Recent evidence has suggested
that elevated UA concentration can, in fact, cause salt-sensitive hypertension and renal
microvascular disease, thereby contributing to the progression of CKD (Sanchez-Lozada
et al., 2005; Johnson et al., 2008a).
3

The present study is based on previously reported harmful effects of hyperuricemia and
continues the line of experimental work performed at the University of Tampere using the
5/6 nephrectomy (NX) rat model (Jolma et al., 2003; Kööbi et al., 2003; Pörsti et al.,
2004; Kööbi et al., 2006). The NX model has been extensively used to study events
involved in loss of renal function and CKD progression (Fogo, 2007) proving its validity
in these experiments. Hyperuricemia, on the other hand, was produced in this experiment
using 2.0% oxonic acid diet, which inhibits the catabolism of UA in rats (Mazzali et al.,
2001). The oxonic acid model of hyperuricemia has been shown to induce preglomerular
arteriolar disease leading to tubular ischemia, interstitial infiltration of lymphocytes and
macrophages, oxidant generation, and local vasoconstriction. These changes are associated
with decreased sodium filtration and increased sodium reabsorption eventually resulting in
salt sensitivity (Johnson et al., 2002).
The detrimental effects of UA may be mediated via enhanced renin release, and in the
oxonic acid model the renal vasculopathy and hypertension are preventable by the
blockade of the renin-angiotensin system (RAS) (Mazzali et al., 2001; Mazzali et al.,
2002; Nakagawa et al., 2003). However, information about the circulating plasma renin
activity (PRA) and aldosterone concentration in the oxonic acid model is lacking. The
present study was, therefore, undertaken to examine the effects of oxonic acid-induced
hyperuricemia on components of RAAS in circulation and in renal tissue, with a special
interest in putative changes of plasma aldosterone concentration.
Manuscript presenting the results of this study titled “Oxonic acid-induced hyperuricemia
elevates plasma aldosterone in experimental renal insufficiency” has been accepted for
publication in the Journal of Hypertension on the 2nd of April 2008.
4
2. REVIEW OF THE LITERATURE
2.1. CHRONIC RENAL INSUFFICIENCY AND CHRONIC KIDNEY DISEASE
The increasing global prevalence of CKD, chronic renal insufficiency (CRI), and ESRD
with the associated skyrocketing cost has profound public health and economic
implications (Khwaja et al., 2007). This has made slowing the progression of kidney
diseases a major health-care priority. Recent reports suggest that up to 10% of the
population in Europe (Lameire et al., 2005) and almost 17% of the population in the USA
(Rosamond et al., 2008) are affected by CKD, while the global pandemic is further fuelled
by ageing population, as well as the rise in the numbers of those affected by diabetes,
obesity, and hypertension (Khwaja et al., 2007).
In February 2002, the Kidney Disease Outcome Quality Initiative (K/DOQI) of the
National Kidney Foundation published clinical practice guidelines for CKD (2002) that
were based on a systematic literature review (Johnson et al., 2004). According to the
K/DOQI guidelines, CKD is defined as kidney damage or glomerular filtration rate (GFR)
of <60 ml/min/1.73 m2 for 3 months or more, irrespective of cause (Levey et al., 2005).
Kidney damage in many kidney diseases can be ascertained by the presence of
albuminuria, defined as albumin-to-creatinine ratio >30 mg/g in two of three spot urine
specimens. GFR value can be obtained by measuring plasma creatinine or the amount of
creatinine excreted in 24-hour urine sample, and subsequently using estimating equations
such as the Modification of Diet in Renal Disease (MDRD) Study equation (Klahr, 1989)
or the Cockcroft-Gault formula (Cockcroft & Gault, 1976) to determine the correct value.
The severity of kidney disease is classified according to the level of GFR into five stages
in which lower stage number represents a less severe form of the disease (2002; Levey et
al., 2005) (Table 2.1). The first stage exhibits kidney damage with normal GFR of ≥90
ml/min/1.73 m2, while the second stage is defined with a GFR of 89-60 ml/min/1.73 m2.
The related terms used to describe these two stages are albuminuria (excess albumin in
urine), proteinuria (excess protein in urine) or hematuria (blood in urine) depending on the
symptoms and manifestations of the renal disorder. Kidney disease can be termed as early-
CRI when GFR drops under 60 ml/min/1.73 m2 marking the third stage of kidney disease.
The fourth stage is late-CRI or pre-ESRD and features a GFR between 29-15 ml/min/1.73
5

m2, whereas the fifth and the last stage - ESRD or kidney failure - presents itself with GFR
under 15 ml/min/1.73 m2 (Levey et al., 2005).
Table 2.1 Classification of chronic kidney disease
Stage: Description: GFR* (ml/min/1.73 m2)
Related terms:
1 Kidney damage with normal GFR
≥90 Albuminuria, proteinuria, hematuria
2 Kidney damage with mildly lowered GFR
89-60 Albuminuria, proteinuria, hematuria
3 Moderately lowered GFR
59-30 Early chronic renal insufficiency
4 Severely lowered GFR
29-15 Late chronic renal insufficiency
5 Kidney failure <15 Renal failure, uremia, end-state renal disease
* glomerular filtration rate Table adapted from Levey et. al (Levey et al., 2005)
Progressing CKD exhibits a histological appearance of glomerulosclerosis, vascular
sclerosis and tubulointerstitial fibrosis, suggesting a common final pathway of injury
(Fogo, 2007). The response to the initial glomerular and tubulointerstitial cell injury in
kidney disease invariably involves changes in cell number (cell proliferation, apoptosis,
and necrosis) and cell size (hypertrophy) (Khwaja et al., 2007). These events typically
precede the accumulation of extracellular matrix, and therefore the balance between these
differing processes determines whether the response to the kidney damage results in
resolution of glomerular / tubulointerstitial injury and healing, or in progressive fibrosis
and scarring. Numerous growth factors appear to modulate progression of glomerular and
tubulointerstitial scarring (Bohle et al., 1992; Khwaja et al., 2007). These factors and their
roles may differ at the various stages of injury. Previous studies in pathophysiological
settings have implicated changes in PDGF, TGF-β, Ang II, basic FGF, endothelin-1, and
various chemokines among others, in progressive renal scarring (Fogo, 2007). Thus, it
may be possible to slow down the fibrotic process in CKD through pharmacological
manipulation of these factors. The particular importance of tubulointerstitial damage in
6

progressive CKD was highlighted in an extensive systematic morphometric analysis of
over 1700 renal biopsies, which showed that interstitial inflammation and fibrosis were
significantly associated with a more rapid decline of kidney function (Bohle et al., 1992).
So far, however, there are no clinical therapies specifically targeting kidney remodeling
and the ensuing fibrotic process itself (Khwaja et al., 2007).
The RAAS has been the focus of investigation of progression in CKD because of the
efficacy of inhibition of its components in CKD. Angiotensin-converting enzyme (ACE)
inhibitors (ACEIs) decrease glomerular capillary pressure by preferential dilation of the
efferent arteriole (Foreman & Chan, 1988), likely mediated by both inhibition of
angiotensin II (Ang II) and also by the effect of ACEIs in augmenting bradykinin, which
is degraded by ACE (Fogo, 2007). Indeed, angiotensin II type 1 receptor blockers
(ATRBs), which do not have this activity to increase bradykinin, do not preferentially
dilate the efferent arteriole or decrease glomerular pressure to the extent of that seen with
ACEIs in most experimental studies. However, both ACEIs and ATRBs have shown
superior efficacy in slowing progressive CKD in experimental models and in human CKD
when compared with other BP-lowering agents. (MacKinnon et al., 2006; Fogo, 2007).
As CKD progresses, new disorders and symptoms add up. Chronic renal failure (CRF),
the last stage of CKD, is associated with increased cardiovascular morbidity and mortality,
while the underlying causes include anemia, acidosis, hypertension, volume overload, and
accumulation of uremic toxins (Luke, 1998; Rostand & Drueke, 1999; Pörsti et al., 2004).
Changes in calcium-phosphate balance, especially hyperphosphatemia, are also closely
associated with the decline of kidney function, ectopic calcification, and reduced survival
in renal patients. Disturbed calciumphosphorus balance is a major cause for cardiovascular
complications during impaired kidney function (Luke, 1998; Rostand & Drueke, 1999;
Pörsti et al., 2004), while phosphate retention, hypocalcemia, and reduced vitamin D
levels lead to the development of secondary hyperparathyroidism in CRI (Rostand &
Drueke, 1999). Elevated plasma phosphate and parathyroid hormone can be suppressed by
dietary phosphate restriction, but oral phosphate binders, most commonly calcium salts,
are usually required to manage hyperphosphatemia and hyperparathyroidism during CKD
(Rostand & Drueke, 1999; Pörsti et al., 2004).
7

Treatment of CKD is currently divided in therapies that aim to treat the causes of CKD
and therapies to maintain kidney function (dialysis – renal replacement) (Levey et al.,
2007). The main treatment after diagnosis is aggressive control of hypertension with a
particular focus on RAAS inhibitors. Systemic hypertension often accompanies renal
disease and may both result from, and contribute to, CKD. Specifically, progression of
CKD is accelerated by hypertension, and therefore control of BP is the key element in the
treatment of CKD (Fogo, 2007).
2.2. CARDIOVASCULAR DISEASE AND HYPERTENSION
CVD and hypertension are epidemic in the modern society. CVD is the number one cause
of death in the United States, claiming nearly 1 million lives yearly and accounting for
36% of all-cause mortality and more deaths than the next 7 leading causes combined
(Rosamond et al., 2008). Nearly 2400 Americans die of CVD each day - an average of 1
death every 37 seconds. The most common form of CVD is hypertension, which is present
in approximately 70 million people in the United States and the prevalence of which
increases dramatically with age, affecting the majority of the population over the age of 60
(Watanabe et al., 2002; Rosamond et al., 2008). The prevalence of hypertension in the
USA has increased markedly in the past 100 years, from a frequency of 6 to 11% in the
population in the early 1900s to over 30% today. This increase correlates with the
epidemic increase in obesity, metabolic syndrome, type II diabetes, and ESRD, raising the
likelihood that these conditions are pathogenetically related and intricately linked to
environmental and especially dietary changes that have occurred in the world population
during the 100 year span (Johnson et al., 2005c). Hypertension markedly increases the risk
for myocardial infarction, stroke, congestive heart failure, and peripheral vascular disease,
while successful early treatment reduces these complications and can reduce the number
of cardiovascular deaths as well as improve overall quality of life (Watanabe et al., 2002;
Rosamond et al., 2008).
The increased prevalence of hypertension seems to be a recent event in human history, and
there is evidence showing a correlation between hypertension and the changes in diet.
Previous reports have suggested that a key nutritional factor that may account for the
increased prevalence of hypertension in modern societies is the dietary sodium intake
8

(Watanabe et al., 2002). This hypothesis has received credibility from studies showing that
primitive societies, whose populations ingest a very small amount of sodium, have a
complete absence of hypertension (Oliver et al., 1975; Johnson et al., 2008a). The sodium
content of early hunter-gatherers of the Paleolithic Period was also extremely low and has
been estimated to be only 690 mg/d (equivalent to 30 mEq Na+ or 1.9 g NaCl). In contrast,
the sodium intake in the current Western diets average 4000 mg/d (170 mEq Na+ or
approximately 10 g NaCl). Although individuals with normal kidneys might be able to
excrete the increased sodium content without altering systemic BP, there is evidence that
individuals who develop essential hypertension have a relative defect in their ability to
excrete sodium. It has thus been speculated that the sudden increase in sodium content in
the diet of industrialized nations will unearth individuals with this physiological renal
defect and thereby increase the overall prevalence of hypertension (Watanabe et al., 2002).
Hypertension has been defined as systolic BP of >140mmHg or diastolic BP of
>90mmHg, or both, measured in a relaxed, sitting position. For ambulatory BP
monitoring, hypertension is usually defined when BPs are >140/90mmHg for more than
25% of the readings for any given 24 h period (Feig & Johnson, 2003). The cut-off of
140/90mmHg was selected in the early 1900s based on the fact that only 5–10% of the US
population had BPs in that range (Johnson et al., 2008a). In addition, it was recognized
from the start that BPs in the hypertensive range were almost inevitably accompanied with
arteriolosclerosis as well as kidneys that were grossly contracted and granular in
appearance, with glomerular, and more commonly tubular, changes on microscopic
examination. This suggests that hypertension should not simply be defined by an elevation
in BP but rather should be considered a syndrome in which microvascular disease and
renal involvement are key components (Johnson et al., 2008a). Afferent arteriolopathy and
concomitant microvascular disease narrows glomerular afferent arteriolar lumens via
hypercellularity and thickening, thereby inducing glomerular hypertension (Johnson et al.,
2003)
Further support for a key role for the kidney in the pathogenesis of hypertension has come
from transplant studies in experimental models of hypertension (Dahl & Heine, 1975;
Rettig et al., 1990) and in humans (Curtis et al., 1983). Dahl & Heine (Dahl & Heine,
1975) demonstrated that the transplantation of a kidney from a rat with salt-sensitive
hypertension to a normotensive rat will transfer the salt sensitivity. Curtis et al. (Curtis et
9

al., 1983) also showed in humans with hypertension-induced ESRD that the
transplantation of a kidney from a normotensive donor could cure the hypertension. This
latter finding, as well as more recent studies (Kvist & Mulvany, 2003), demonstrated that
systemic vascular disease cannot be the cause of hypertension. The observation of the
primary importance of the kidney in essential hypertension does not negate the role of
non-renal mechanisms in the process. For example, the elevation in peripheral vascular
resistance is mediated by vasoconstriction that is dependent on Ang II receptors and other
mediator systems (Crowley et al., 2005). Persistent activation of the sympathetic nervous
system may also cause chronic hypertension (Johnson et al., 2008a).
It has been observed that salt restriction causes some individuals with essential
hypertension to have a greater fall in BP than others, and this has led to the concept of
further classifying essential hypertension as salt-sensitive or salt-resistant. Intricately
associated with the vascular lesion in the kidney is an infiltration into the interstitium of
inflammatory cells consisting of T-cells and macrophages, many of which are producing
oxidants and Ang II (Johnson et al., 2008a). Because renal microvascular disease is non-
uniform, the rise in systemic BP results in some nephrons being overperfused whereas
others are underperfused. Peritubular capillaries may also be damaged. The net effect is
that ischemia is not completely relieved, and this leads to continued stimulation of sodium
reabsorptive mechanisms by renin-dependent and renin-independent mechanisms (Sealey
et al., 1988). As a consequence, the pressure natriuresis curve is shifted to the right and
flattened, and the hypertension is salt-sensitive (Johnson et al., 2008a).
2.3. THE RENIN-ANGIOTENSIN-ALDOSTERONE SYSTEM
The critical role of the circulating RAAS in the regulation of arterial pressure and sodium
homeostasis has been recognized for many years (Zhuo et al., 1999; Navar & Nishiyama,
2001; Bernstein, 2006; Paul et al., 2006). The RAAS is the best known regulator of BP
and determinant of target-organ damage from hypertension. It also controls fluid and
electrolyte balance through coordinated effects on the heart, blood vessels, and kidneys
(Remuzzi et al., 2005). Ang II is the most powerful biologically active product of the
RAAS, although there are other bioactive Ang peptides, including Ang III, Ang IV, and
Ang 1-7. Ang II directly constricts vascular smooth muscle cells, enhances myocardial
10
contractility, stimulates aldosterone production, stimulates release of catecholamines from
the adrenal medulla and sympathetic nerve endings, increases sympathetic nervous system
activity, and stimulates thirst and salt appetite (Kobori et al., 2007b). Ang II also regulates
sodium transport by epithelial cells in the intestine and kidney. There has also been a
growing appreciation of the organ-specific roles exerted by Ang II acting as a paracrine
factor (Paul et al., 2006). In addition to its physiological roles, locally produced Ang II
induces inflammation, cell growth, mitogenesis, apoptosis, cell migration, and
differentiation, regulates the gene expression of bioactive substances, and activates
multiple intracellular signalling pathways; all of which might contribute to tissue injury
(Navar, 1997; Kobori et al., 2007a).
2.3.1. The classic circulating renin-angiotensin system
Ang II is produced systemically via the classic RAS. An aspartyl protease, renin, in the
plasma is released primarily from the juxtaglomerular cells on the afferent arterioles of the
kidney (Hackenthal et al., 1990). Although circulating active renin and prorenin are
released mainly from the kidney, other tissues also secrete prorenin into the circulation,
and prorenin can be converted to renin by limited proteolysis such as that with trypsin
activation in the circulation (Sealey et al., 1986). Angiotensinogen is primarily formed and
constitutively secreted by hepatic cells into the circulation, thus allowing systemic
formation of Ang II throughout the circulation (Brasier & Li, 1996). On release into the
circulation, renin cleaves angiotensinogen at the N terminus to form the decapeptide Ang I
(Navar, 1997). The circulating concentrations of angiotensinogen are abundant, being
more than 1000 times greater than the plasma Ang I and Ang II concentrations (Navar &
Nishiyama, 2001). Although some species variation exists, changes in renin activity
determine the rate of Ang I formation in the plasma from the huge stores of circulating
angiotensinogen, effectively making it the rate-limiting step of the RAS (Ichihara et al.,
2004; Paul et al., 2006).
Renin is synthesized and stored in substantial quantities in the granules of juxtaglomerular
cells and is released in response to various stimuli (Schweda & Kurtz, 2004; Paul et al.,
2006). Thus, large changes in plasma renin levels can occur rapidly, leading to changes in
Ang I generation. Ang I is easily converted to Ang II, due not only to the circulating ACE,
but also to the widespread presence of ACE on endothelial cells of many vascular beds
11
including the lung (Navar, 1997; Ichihara et al., 2004; Paul et al., 2006). Although other
pathways for Ang II formation have been identified in certain tissues, the circulating
levels of Ang II reflect primarily the consequences of the renin and ACE enzymatic
cascade on angiotensinogen (Johnston, 1994; Kobori et al., 2007a). The resultant increases
in plasma Ang II exert powerful actions throughout the body through activation of Ang II
receptors (ATR) (Paul et al., 2006) (Figure 2.1). Several angiotensinases and peptidases
are then able to metabolize Ang II further (Kobori et al., 2007a). It is recognized that
several of the smaller peptides, including Ang III, Ang IV, and Ang 1-7, have biological
activity, but their plasma levels are much lower than those of Ang II (Kobori et al.,
2007a).
Recent attention has been focused on findings that local Ang II levels are differentially
regulated in the kidney. Because there often is not clear evidence for markedly elevated
circulating renin or Ang II concentrations, identification of local RAS activity is essential
for understanding the mechanisms mediating pathophysiological functions. In particular,
the Ang II contents in renal tissues are much higher than can be explained on the basis of
equilibration with the circulating concentrations (Navar, 1997; Navar & Nishiyama,
2004). Furthermore, the demonstration of much higher concentrations of Ang II in specific
regions and compartments within the kidney indicates selective local regulation of
intrarenal Ang II (Ichihara et al., 2004; Navar & Nishiyama, 2004). Thus, it is now
apparent that intrarenal Ang II levels are regulated in a manner distinct from circulating
Ang II concentrations. It has also been revealed that Ang II produced locally in the kidney
exerts an important regulatory influence on renal hemodynamics and functions as a
paracrine factor (Paul et al., 2006). Further studies have demonstrated that reduced renal
function and its structural changes are associated with inappropriate activation of the
intrarenal Ang II, leading to the development of hypertension and renal injury (Navar,
2005).
12

Figure 2.1 Simplified overview of the renin-angiotensin system: Kidneys respond to a decrease in renal perfusion by increasing renin secretion. This leads to increased formation of angiotensin I from the vast stores of angiotensinogen in plasma. Angiotensin-converting enzyme (ACE) catalyzes the formation of angiotensin II (Ang II), while Ang II acts in cooperation with aldosterone to increase renal perfusion by increasing circulating blood volume. This increase acts as an inhibitor of renin secretion effectively completing the feedback loop. Figure by the author with data by Navar, Paul et al., and Kobori et al. (Navar, 1997; Paul et al., 2006; Kobori et al., 2007a)
2.3.2. The intrarenal renin-angiotensin system
In recent years, the focus of interest on the role of the RAS in the pathophysiology of
hypertension and organ injury has changed to a major emphasis on the role of the local
RAS in specific tissues. In the kidney, all of the RAS components are present and
intrarenal Ang II is formed by independent multiple mechanisms (Navar & Nishiyama,
2001). Proximal tubular angiotensinogen, collecting duct renin, and tubular ATRs are
positively augmented by intrarenal Ang II. In addition to the classic RAS pathways,
prorenin receptors and chymase are also involved in local Ang II formation in the kidney
(Prescott et al., 2002). Moreover, circulating Ang II is actively internalized into proximal
tubular cells by ATR-dependent mechanisms (Higuchi et al., 2007). Consequently, Ang II
is compartmentalized in the renal interstitial fluid and the proximal tubular compartments
with much higher concentrations than those existing in the circulation. Recent evidence
13
has also revealed that inappropriate activation of the intrarenal RAS is an important
contributor to the pathogenesis of hypertension and renal injury (Kobori et al., 2007a).
Thus, it is necessary to understand the mechanisms responsible for independent regulation
of the intrarenal RAS.
The RAS has been acknowledged as an endocrine, paracrine, autocrine, and intracrine
system, and because of that, it has been almost impossible to distinguish the different
contributions of the classic RAS versus the local RAS (Navar et al., 2002; Kobori et al.,
2007a). Emerging evidence suggests that local formation is of major significance in the
regulation of the Ang II levels in many organs and tissues. For example, there is
substantial evidence that the Ang peptide levels in the brain are regulated in an
autonomous manner (Kobori et al., 2007a). Although every organ system in the body has
elements of the RAS, the kidney is unique in having every component of the RAS with
compartmentalization in the tubular and interstitial networks as well as intracellular
accumulation. Recent attention has been focused on the existence of unique RASs in
various organ systems. Various studies have demonstrated the importance of the tissue
RAS in the brain, heart, adrenal glands, and vasculature as well as in the kidney (Navar et
al., 1995). There is substantial evidence that the major fraction of Ang II present in renal
tissues is generated locally from angiotensinogen delivered to the kidney as well as from
angiotensinogen locally produced by proximal tubule cells. Ang I delivered to the kidney
can also be converted to Ang II (Komlosi et al., 2003). Renin secreted by the
juxtaglomerular apparatus cells and delivered to the renal interstitium and vascular
compartment also provides a pathway for the local generation of Ang I (Hackenthal et al.,
1990, Kobori, 2007 #332). ACE is abundant in the rat kidney and has been located in the
proximal and distal tubules, the collecting ducts, and renal endothelial cells. Therefore, all
of the components necessary to generate intrarenal Ang II are present along the nephron
(Paul et al., 2006; Kobori et al., 2007a).
Although most of the circulating angiotensinogen is produced and secreted by the liver,
the kidneys also produce angiotensinogen (Kobori et al., 2007b). Intrarenal
angiotensinogen mRNA and protein have been localized to proximal tubule cells,
indicating that the intratubular Ang II could be derived from locally formed and secreted
angiotensinogen. The angiotensinogen produced in proximal tubule cells seems to be
secreted directly into the tubular lumen in addition to producing its metabolites
14

intracellularly and secreting them into the tubule lumen (Lantelme et al., 2002). Proximal
tubule angiotensinogen concentrations in rats have been reported in the range of 300 to
600 nM, which greatly exceed the free Ang I and Ang II tubular fluid concentrations
(Navar & Nishiyama, 2001). Because of its substantial molecular size, it seems unlikely
that much of the plasma angiotensinogen filters across the glomerular membrane, further
supporting the concept that proximal tubule cells secrete angiotensinogen directly into the
tubule (Kobori et al., 2007a).
2.3.3. Plasma renin and aldosterone
The plasma renin concentration or activity is often used as a measure of the overall
activity of the RAS. In most species, renin synthesized by the juxtaglomerular apparatus
cells is the primary source of both circulating and intrarenal renin levels. The secreted
active form of renin contains 339 to 343 amino acid residues after proteolytic removal of
the 43-amino acid residue at the N terminus of prorenin. Circulating active renin and
prorenin are released mainly from the kidney, but other tissues also secrete prorenin into
the circulation (Sealey et al., 1986). Besides serving as the precursor for active renin, it
has been suggested that circulating prorenin is taken up by some tissues where it may
contribute to the local synthesis of Ang peptides (Prescott et al., 2002). In the heart under
normal conditions, renin is not produced and its transcript is undetectable or extremely
low (Kobori et al., 2007a). Although there have been suggestions that renin or prorenin
may directly induce cellular effects - independent of the generation of Ang II - the well
established role of renin is to act on angiotensinogen, a protein with a glycosylated weight
of 52 to 64 kDa and synthesized primarily by the liver to form Ang I. However, the renin
receptor may also initiate intracellular signaling to activate extracellular signal-regulated
kinases (Nguyen et al., 2002). In the heart and kidney, the renin receptor binds renin and
prorenin, leading to an increase in the catalytic efficiency of Ang I formation from
angiotensinogen (Nguyen et al., 1996). It has also been reported recently that the binding
of prorenin to an intrinsic prorenin-binding receptor plays a pivotal role in the
development of diabetic nephropathy by a mechanism that involves the receptor-
associated prorenin system (Ichihara et al., 2004).
The mineralocorticoid aldosterone is synthesized by a series of enzymatic reactions from
cholesterol in the zona glomerulosa of the adrenal gland. In addition, extra-adrenal
15
synthesis of aldosterone has been reported in different tissues (Takeda et al., 2000;
Cachofeiro et al., 2008). The extra-adrenal production of aldosterone appears to be
regulated by the same stimuli that regulate adrenal synthesis. At the vascular level, its
production has been reported in both endothelial and smooth muscle cells. However, the
physiological relevance of this production is under discussion (Cachofeiro et al., 2008).
High circulating aldosterone concentration is acknowledged as a significant cardiovascular
risk factor (Schmidt & Schmieder, 2003; Schmidt et al., 2006), and independently of
whether the aldosterone origin is circulating or local, it exerts actions in the vascular wall
through genomic and non-genomic effects.
Genomic actions imply the binding of aldosterone to cytoplasmatic mineralocorticoid
receptors – a member of the nuclear receptor superfamily - and involve transcription and
protein synthesis (Fuller & Young, 2005). These receptors have been found in both
endothelial and smooth muscle cells and their expression can be increased in certain
pathological situations such as hypertension (Fuller & Young, 2005); Cachofeiro, 2008
#434}. The direct targets for aldosterone are the late distal convoluted tubules, the
connecting tubules, and the principal cells of the cortical and medullary collecting ducts.
Aldosterone binds to the receptor and translocates into the nucleus. The ligand-receptor
complex then forms a homodimer, binds to the specific DNA sequences and stimulates the
transcription of its target genes (Nagase & Fujita, 2008).
The non-genomic effects of aldosterone are observed quickly after secretion or
administration and are insensitive to transcription inhibitors. To date, two different non-
genomic responses have been reported (Cachofeiro et al., 2008). One appears to involve
mineralocorticoid receptors, whereas the second involves an unidentified membrane
receptor. The signalling pathways include the modulation of intracellular calcium, Na+ /
H+ exchanger activity, and phosphorylation of signalling molecules, including protein
kinase C, epidermal growth factor receptor, mitogen-activated protein (MAP) kinases, and
cellular Src tyrosine kinase (c-Src) (Cachofeiro et al., 2008; Nagase & Fujita, 2008). In
fact, it was reported recently that aldosterone-induced activation of c-Src, extracellular
signal-regulated kinases 1 and 2 (ERK1/2), and p38 MAP kinase is increased in
spontaneously hypertensive rat vascular cells, suggesting that aldosterone plays an
important role through the upregulation of c-Src signalling in vascular alterations observed
in hypertensive rats (Cachofeiro et al., 2008).
16

2.3.4. Angiotensin-converting enzymes and Ang II receptors
Ang I is rapidly converted into the major effector of the RAS, Ang II, by ACE, which is
located on endothelial cells in many vascular beds and on membranes of various other
cells including brush border membranes of proximal tubules (Mezzano et al., 2003). The
localization of ACE within the kidney in various species has been well characterized.
However, there are some important differences between humans and commonly used
experimental animals. Indeed, it has been reported that kidneys from normal human
subjects predominantly expressed ACE in the brush border of proximal tubular segments,
and very little ACE expression was observed on vascular endothelial cells. ACE was not
detectable in the vasculature of the glomerular tuft or even in the basolateral membranes
of epithelial cells. In contrast, there was intense labeling on the endothelial cells of almost
all of the renal microvasculature of rats (Kobori et al., 2007a). It has been reported that
less than 10% of arterially delivered Ang I is converted to Ang II, which along with the
reduced ACE expression on renal vascular endothelial cells in humans implies that the
influence of intrarenal Ang II formed from circulating precursors may not be of major
significance (Paul et al., 2006).
In 2000 the RAS gained a new member as angiotensin-converting enzyme 2 (ACE2) was
discovered and characterized (Tipnis et al., 2000). ACE2 is expressed predominantly in
vascular endothelial cells of the heart and kidney. ACE2 and ACE have different
biochemical activities, and Ang I is converted to Ang 1–9 with nine amino acids by
ACE2, whereas ACE converts it to Ang II with eight amino acids. Ang II is a potent
bloodvessel constrictor. Ang 1–9 has no known effect on blood vessels but can be
converted by ACE to a shorter peptide, Ang 1–7, which is a blood-vessel dilator. Thus, it
has been suggested that ACE2 functions as one of the protective component of the RAS
preventing the formation of the vasopressor Ang II (Boehm & Nabel, 2002).
Most of the actions of Ang II on renal function are the consequence of activation of Ang II
receptors, which are widely distributed in various regions and cell types of the kidney.
Two major categories of Ang II receptors, type 1 (AT1R) and type 2 (AT2R), have been
described, pharmacologically characterized, and cloned (Kobori et al., 2007a).
Additionally, AT1R features two well characterized subtypes: 1a (AT1aR) and 1b (AT1bR),
although recent evidence suggests that humans only express AT1aR (Higuchi et al., 2007).
17

In literature, most of the hypertension-causing actions of Ang II are generally attributed to
the AT1Rs, marking it as the bad receptor (Ito et al., 1995). AT1R transcript has been
localized to proximal tubules, the thick ascending limb of the loop of Henle, glomeruli,
arterial vasculature, vasa recta, arcuate arteries, and juxtaglomerular cells (Tufro-
McReddie & Gomez, 1993). In rodents AT1aR is the predominant subtype in all nephron
segments, whereas AT1bR is more abundant than AT1aR only in the glomerulus. In mature
kidneys, AT1aR have been localized to the luminal and basolateral membranes of several
segments of the nephron, as well as on the renal microvasculature in both cortex and
medulla, smooth muscle cells of afferent and efferent arterioles, epithelial cells of the
thick ascending limb of Henle, proximal tubular apical and basolateral membranes,
mesangial cells, distal tubules, collecting ducts, and macula densa cells (Harrison-Bernard
et al., 1999). This evidence is consistent with the localization of the transcript for the AT1R
subtypes in all of the renal tubular and vascular segments in rats (Miyata et al., 1999).
The AT2R is highly expressed in human and rodent kidney mesenchyme during fetal life
and decreases dramatically after birth (Kobori et al., 2007a). AT2R protein has been
localized to the glomerular epithelial cells, proximal tubules, collecting ducts, and parts of
the renal vasculature of the adult rat (Miyata et al., 1999). Although the role of AT2R in
regulating renal function remains uncertain, it has been suggested that AT2R activation
counteracts AT1R effects by stimulating formation of bradykinin and nitric oxide, leading
to increases in interstitial fluid concentration of cyclic guanosine monophosphate (Siragy
& Carey, 1999). AT2R activation seems to influence proximal tubule sodium reabsorption
either by a cell membrane receptor-mediated mechanism or by an interstitial nitric oxide-
cyclic guanosine monophosphate pathway (Jin et al., 2001). Ang II infusion into AT2R-
knockout mice leads to exaggerated hypertension and reductions in renal function,
probably due to decreased renal interstitial fluid levels of bradykinin and cyclic guanosine
monophosphate available that counteract the direct effect of Ang II (Siragy & Carey,
1999). AT2R can thus be regarded as a protective component of RAS inhibiting
vasoconstriction.
18

2.4. URIC ACID METABOLISM AND HYPERURICEMIA
UA is generated during the catabolism of purines obtained by ingestion or from the
breakdown of DNA, RNA and ATP (Watanabe et al., 2002; Johnson et al., 2008b). UA is
a weak acid (pKa=5.75) distributed throughout the extracellular fluid compartment as
sodium urate and cleared from the plasma mainly by glomerular filtration (Waring et al.,
2000). The immediate precursor enzyme is xanthine oxidoreductase, which promotes the
last metabolic steps by converting hypoxanthine to xanthine and xanthine to UA (Doehner
& Anker, 2005). Substrates used for hypoxanthine formation by the enzyme adenine
deaminase are adenine and adenosine, whereas the enzyme inosine phosphorylase uses
inosine as substrate. Guanine, on the other hand, is metabolised straight to xanthine by the
guanine deaminase (Waring et al., 2000).
Xanthine oxidoreductase is a flavoprotein that contains both iron and molybdenum and
uses NAD+ as an electron acceptor. It exists in two interconvertible forms: xanthine
dehydrogenase and xanthine oxidase (XO). In its XO form, this enzyme can transfer the
decreasing equivalent to molecular oxygen as redox partner generating free oxygen
radicals - superoxide anion and hydrogen peroxide, which can be converted to free
hydroxyl radicals (Doehner & Anker, 2005). In 1968, the cytosolic XO was the first
documented putative biologic generator of oxygen-derived free radicals, and since then, it
has been established that XO is a major source of free oxygen radical production in the
human body (Terada et al., 1992; Harrison, 1997). This metabolic pathway is of particular
significance in conditions of tissue hypoxia and ischemia / reperfusion because the
increased degradation of adenosine triphosphate via adenosine leads to increased substrate
load for XO. Accordingly, an increase in serum UA level has been observed in hypoxic
states such as obstructive pulmonary disease, neonatal hypoxia, cyanotic heart disease,
and acute heart failure (Doehner & Anker, 2005). Simultaneously, in ischemia and
hypoxia, xanthine dehydrogenase is increasingly converted to XO, which further adds to
accelerated radical production (Terada et al., 1992).
In most mammals UA is further degraded to allantoin by the enzyme uricase (urate
oxidase), resulting in serum UA levels in the range of 30-90 μmol/l (Watanabe et al.,
2002; Johnson et al., 2008b). Uricase is localized predominantly in liver and is associated
with the peroxisome as a tetramer with a subunit molecular mass of 32-33 kDa (Wu et al.,
19

1989). Depending on the species, allantoin may be further degraded by allantoinase to
generate ammonia (Johnson et al., 2008b). The serum UA concentration of hominoids -
apes and humans - and some New World monkeys is, however, higher than in other
mammals. This increase is due to distinct mutations in the uricase gene that made it non-
functional during the Miocene era (Wu et al., 1992). Elevated serum UA concentration is
called hyperuricemia when it exceeds 360 μmol/l or 420 μmol/l in women and men,
respectfully (Johnson et al., 2003). Hyperuricemia may be best known for its association
with gout, which is a disease recognized for centuries and currently the most common
inflammatory arthritis in the Western world (Terkeltaub, 2006). Gout is caused by
deposition of urate crystals in the joints in which they induce chronic inflammation and
tissue damage. However, hyperuricemia is also known to be present without crystal
formation in many CKD and CVD patients. Characteristically, patient groups with the
highest cardiovascular risk coincidentally have highest mean serum UA concentrations.
These include heavy alcohol users (increased UA generation and decreased excretion),
diuretic users (decreased UA excretion), and black race (unknown reason – possibly lower
nephron count) (Johnson et al., 2003). Additionally, serum UA is typically higher in men
and postmenopausal women than premenopausal women because of the uricosuric (UA
excretion increasing) actions of estrogen, whereas high insulin concentration has in turn
been reported to decrease UA excretion (Muscelli et al., 1996).
In humans, the chimpanzee, and the gorilla, three uricase mutations have been identified.
These include a nonsense mutation of codon 33, a nonsense mutation of codon 187, and a
splice mutation in exon 3, while the human uricase gene totals 304 codons – 8 exons and 8
introns. The mutation at codon 33 is also found to be present in the orangutan, whereas
none of these mutations are present in the gibbon, in which a separate 13 bp reading-
frame-changing deletion was identified between codons 72 and 76 of exon 2 (Wu et al.,
1992). Based on the phylogeny of hominoid evolution as assessed by DNA-DNA
hybridization, it was proposed that the nonsense mutation affecting the hominoid lineage
at codon 33 occurred between 24 and 13 to 16 million years ago, and the 13 bp deletion in
exon 2 occurred sometime after the split of the gibbon from the other hominoids, which
occurred around 22 to 24 million years ago (Wu et al., 1992; Watanabe et al., 2002). The
current evidence now suggests that the loss of uricase in humans may have been stepwise,
with a progressive loss in activity due to mutations in the promoter region followed by
complete silencing of the gene (Oda et al., 2002; Johnson et al., 2008b).
20

The biological reason for the loss of urate oxidase activity in hominoids is unknown, but
there are a few reasonable hypotheses that are in agreement with the existent UA
evidence. An evolutionary fact is that when a mutation completely silences the function of
an enzyme, it either hampers its carrier, or gives the carrier an advantage over the wild-
type population. When this kind of mutation sweeps all over the population and becomes
the wild-type, we can safely assume that the mutation was highly advantageous in the
contemporary environment. During the Miocene this was the situation that happened with
the uricase gene. Non-functional uricase presented a new kind of survival advantage that
eventually lead to its complete precipitation in later hominoids (Watanabe et al., 2002;
Johnson et al., 2008b).
The most quoted hypothesis explaining the advantage associated with the non-functional
uricase is that originally proposed by Ames et al. (Ames et al., 1981), who suggested that
the uricase mutation may have occurred as a means to replace serum antioxidant activity
after the loss of ascorbate (vitamin C) synthesis. Indeed, UA is a water-soluble antioxidant
that can help maintain ascorbate levels and is also considered to be one of the most
important antioxidants in the plasma (Ames et al., 1981; Johnson et al., 2008b). However,
UA is not solely an antioxidant as it can also function as a pro-oxidant on a variety of cell
types and in vivo (i.e. reactions with peroxynitrite) (Santos et al., 1999). According to the
hypothesis, it was also suggested that the reason humans have longer life expectancy
compared to other mammals may relate to the antioxidant benefits provided by the higher
UA levels. Challenging this hypothesis, however, is the observation that neither ascorbate
nor UA levels correlate with maximum life span in vertebrates (Lopez-Torres et al., 1993;
Johnson et al., 2008b).
Another hypothesis is that the increase in UA resulted in better reaction time and higher
mental performance due to its putative neurostimulant properties based on its similarity in
chemical structure with caffeine (Johnson et al., 2008b). While some epidemiological and
experimental studies have supported this, the evidence has been weak at best. Other
alternative hypotheses have linked the increase in UA with improved innate immune
function and the ability to ward off infections or tumors. Specifically, UA is reported to
aid in the immune recognition of dying cells, help activate the inflammasome critical for
interleukin-1 β release, and participate in the immune rejection of tumor cells (Shi et al.,
2003; Hu et al., 2004; Johnson et al., 2008b).
21

The latest uricase hypothesis was postulated by Watanabe et al. in 2002 (Watanabe et al.,
2002) and it has generated mixed opinions on different medical fields (Ellman & Becker,
2006; Johnson et al., 2008a). According to this hypothesis, elevated UA would have
benefited the hominoids of the Miocene by causing sodium retention, concurrently helping
to maintain BP during the times of low sodium ingestion. Hominoids that could better
conserve sodium and maintain BP might have prevailed during the harsh environment of
the Miocene (Watanabe et al., 2002). In fact, there is evidence that during the early
Miocene there was a marked increase in the number of ape species (Begun, 2003).
However, by the mid Miocene there was global cooling - the Miocene Disruption -
associated with the extinction of numerous species, likely including many species of apes.
During this period, large rain forests dried out leaving only deserts and grasslands,
therefore forcing early hominoids to develop knuckle walking and to modify their diet
(Johnson et al., 2008b). The Paleolithic diet was low in sodium (Eaton & Konner, 1985),
and hence survival would have been better with those species that could maintain BP and
salt sensitivity. The increase in serum UA acutely increases BP and maintains sodium
conservation because of the action of UA to enhance activation of the RAS in response to
a low-salt diet. However, UA can also induce renal microvascular disease by stimulating
smooth muscle cell proliferation with the activation of MAP kinase and stimulation of
platelet-derived growth factor (PDGF), cyclooxygenase-2 (COX-2), and the RAS
(Watanabe et al., 2002). Microvascular disease, preglomerular arteriolar disease, and
interstitial inflammation are associated with narrowing of renal afferent arteriolar lumens,
thereby causing local vasoconstriction, glomerular hypertension, and salt sensitivity with a
chronic increase in BP (Sanchez-Lozada et al., 2002). The activation of these 2 main
pathways – the RAS and microvascular disease – results in a persistent elevation in BP
with concurrent maintenance of sodium balance (Watanabe et al., 2002) (Figure 2.2).
Indeed, there is also clinical evidence that high serum UA levels are associated with
increased proximal tubular sodium reabsorption in men (Cappuccio et al., 1993), while
sodium sensitivity is considered a characteristic feature in hyperuricemia (Ward, 1998).
Extensive studies showing that hyperuricemia independently predicts the development of
hypertension (Johnson et al., 2005a; Sundstrom et al., 2005) have been carried out
recently. Hyperuricemia has been shown to be prevalent in early hypertension, and in one
study it was present in almost 90% of hypertensive adolescents (Feig & Johnson, 2003).
Furthermore, recent clinical trials have found that lowering UA lowers BP in both
22

adolescents and adults with hypertension (Feig et al., 2004; Feig & Johnson, 2007). In
addition to elevating BP, recent studies support UA as having a role in insulin resistance
and obesity (Nakagawa et al., 2006; Sanchez-Lozada et al., 2007). It has been reported
that fructose, which rapidly raises UA, induces metabolic syndrome in animals and this
can be ameliorated by lowering serum UA (Nakagawa et al., 2006). The mechanism by
which UA mediates features of the metabolic syndrome may result from the ability to
block some of insulin’s actions by reducing endothelial nitric oxide synthesis as well as
due to direct effects of UA on the glomerular adipocytes (Sautin et al., 2007; Johnson et
al., 2008b).
How is it possible that a mutation once presenting a crucial advantage now plays a role in
the cardiovascular epidemic? The consequence of the uricase mutation is that humans not
only have higher serum UA levels than most other mammals, but they also can not
regulate UA levels as effectively (Johnson & Rideout, 2004; Johnson et al., 2005d).
Interestingly, because the current Western diet is high in meats and fructose - both of
which generate UA - humans today have higher UA levels (range 240-600 μmol/l)
compared to primates that lack uricase (typically 180-240 μmol/l range) (Johnson et al.,
2005d). However, the most compelling finding is the elevation of mean serum UA levels
in the USA during the last century. In men, mean serum UA levels reportedly increased
from <210 μmol/l in the 1920s to approximately 300 μmol/l in the 50s, and to 350-390
μmol/l in the 70s (Nakagawa et al., 2008). Recent preliminary studies have shown that the
Yanomamo Indians living in their original habitat and with their primitive diet have serum
UA levels in the 120-240 μmol/l range, suggesting that primitive humans had even lower
UA levels than those in the beginning of the twentieth century (Johnson et al., 2008b). In
today’s society we are ingesting significantly more fructose-containing sweeteners and
purine-infested meats than in the past, and those who obtain the highest UA levels could
end up developing hypertension, kidney disease, insulin resistance and obesity (Johnson et
al., 2008b), while hyperuricemia reportedly correlates with increased cardiovascular
mortality (Fang & Alderman, 2000).
23

Figure 2.2 Salt sensitivity hypothesis: Environmental pressures during the Miocene resulted in a survival advantage for hominoids that could better conserve sodium and maintain blood pressure (BP). The increase in uric acid (UA) acutely increases BP and causes sodium retention because elevated UA enhances the activation of the the renin-angiotensin system (RAS) in response to a low-salt diet. UA also induces renal microvascular disease by stimulating vascular smooth muscle cell (VSMC) proliferation with the activation of MAP kinase and stimulation of PDGF, COX-2, and the RAS. The development of renal microvascular disease and interstitial inflammation causes salt sensitivity and a chronic increase in BP. These two main pathways result in a permanent elevation of BP along with sodium retention. Figure adapted from Watanabe et al. (Watanabe et al., 2002).
24

In humans, UA is mainly excreted through glomerular filtration, although bacterial
degradation in the intestine also plays a small role in the elimination. The regulation of
urinary UA excretion is complex. According to the classic notion, UA is freely filtrated at
glomerulus, but almost completely reabsorbed in the proximal tubulus. As a consequence,
only 10% of urate is excreted in urine (Nakagawa et al., 2008) (Figure 2.3). Recent studies
have focused on the specific transporters in the proximal tubules that are involved in
reabsorption, and uric acid transporter 1 (URAT1) seems to be one of the major UA
transporters present in the luminal border of human proximal tubular cells (Anzai et al.,
2007). URAT1 is an organic anion transporter that exchanges organic anions for urate. A
key role for URAT1 in regulation of serum UA levels has been suggested, since mutation
of URAT1 is known to cause hypouricemia in humans (Nakagawa et al., 2008).
Altered serum UA concentrations, both above and below normal levels, have been linked
to a number of other disease states as well. As mentioned above, hyperuricemia has been
correlated with gout, hypertension, cardiovascular disease, and renal disease, whereas
lower than normal UA concentration, hypouricemia, has been linked to Parkinson's
disease, Alzheimer's disease, and optic neuritis (Kutzing & Firestein, 2008). Several recent
studies have also reported lower levels of UA in multiple sclerosis patients, while other
studies found no such correlation (Spitsin & Koprowski, 2008). Historically, elevated UA
has been considered a marker of the above disease states, but recently published studies
have provided evidence that UA may actually play a role in the development or
progression of such diseases (Kutzing & Firestein, 2008). As a result, the manipulation of
UA concentrations is now either included in, or being investigated for, the treatment of a
variety of disease states (Kutzing & Firestein, 2008).
The current treatment of hyperuricemia is mainly aimed at gout patients, as there is no
agreement on whether lowering of UA in CVD is necessary. Several drugs are known to
lower UA. These drugs either increase UA excretion (uricosuric drugs), block the final
step in UA production via XO inhibition, or lead to UA breakdown. The most effective
uricosuric drugs are probenecid and sulfinpyrazone, while fenofibrate and losartan (an
Ang II antagonist) also have uricosuric activity (Dawson & Walters, 2006). Rasburicase,
on the other hand, is a recombinant uricase which converts UA to allantoin. It is used in
association with some anticancer treatments and is unsuitable for repeated dosing. There
are also two commercially available XO inhibitors - allopurinol and oxypurinol - which
25

both are purine analogs. Allopurinol is rapidly metabolized to oxypurinol that binds to XO
thereby inhibiting its activity (Dawson & Walters, 2006). A new non-purine XO inhibitor
called febuxostat is also being developed (Sanchez-Lozada et al., 2008). It differs from
allopurinol because it does not inhibit other enzymes in purine and pyrimidine metabolism
pathways. Moreover, the XO inhibiting effect exerted by febuxostat in vitro and in vivo is
more potent than that of allopurinol (Takano et al., 2005). Studies have shown that
febuxostat inhibited the activity of XO simply by obstructing substrate binding and this
inhibition was not influenced by changes in the redox status of the system (Okamoto et al.,
2003; Sanchez-Lozada et al., 2008).
Figure 2.3 Simplified overview of the uric acid metabolism: In blood, uric acid (UA) is present as urate anion. It is produced by the enzyme Xanthine oxidase (XO) mainly in the liver. Additionally, XO in other organs (lung, intestine etc.) contribute to the urate reservoir in blood. XO uses purines obtained from the diet or from the degradation of nucleic acids and proteins as its substrate. UA is excreted mainly through glomerular filtration, while bacterial degradation in the intestine also plays a role in the elimination. UA is actively reabsorbed from the proximal tubule by uric acid transporter 1 (URAT1), which exchanges organic anions for UA. As a consequence, only 10% of UA is normally excreted. Figure by the author with data by Johnson et al. and Nakagawa et al. (Johnson et al., 2008b; Nakagawa et al., 2008)
26

2.5. EXPERIMENTAL MODELS IN THE PRESENT STUDY
2.5.1. Experimental chronic renal insufficiency
The 5/6 nephrectomized remnant kidney model, NX (Morrison & Howard, 1966), has
been extensively studied to investigate CKD and CRI. In this model, removal of one
kidney and two-thirds of the remaining kidney results in progressive hyperperfusion,
hyperfiltration, and hypertrophy (Morrison & Howard, 1966; Shimamura & Morrison,
1975; Hostetter et al., 1981). Direct micropuncture studies have demonstrated that single
nephron function is increased after subtotal nephrectomy (Olson & Heptinstall, 1988).
When renal mass is reduced, the remaining nephrons undergo functional as well as
structural hypertrophy. Adaptations in the microcirculation of remnant glomeruli result in
an increased mean driving force for filtration and, therefore, a marked increase in filtration
rate (Hostetter et al., 1981). The magnitude of increase in single nephron GFR correlates
closely with the amount of renal mass that has been lost. That is, greater degrees of
removal result in greater increases of single nephron GFR in the residual nephrons. This
functional hypertrophy is generally considered beneficial in the sense that it minimizes the
reduction in total GFR that would otherwise occur. Studies have, however, shown that a
pathological process of sclerosis eventually occurs in the glomeruli of these residual
nephrons (Morrison & Howard, 1966; Shimamura & Morrison, 1975; Purkerson et al.,
1976). These studies showed that after NX, eventual sclerotic destruction of remnant
glomeruli was accompanied by progressive proteinuria and arterial hypertension. With
severe reduction in renal mass, alterations in glomerular structure were detected as early as
2 wk. By 7 wk more than 50% of glomeruli exhibited morphological changes, and all
animals died by 90 days (Purkerson et al., 1976).
The NX model is suitable for studying different stages of CKD, as the duration of disease
progression can easily be adapted to meet the specific needs of the study. Early stages of
CKD are present in NX immediately after recovery from the renal ablation. Subsequent
glomerulosclerosis then causes disease progression and concomitant loss of renal function
with the same mechanisms that come to play in the human CKD (Morrison & Howard,
1966). Even though kidneys have a remarkable degree of functional reserve, a decrease in
number of functioning nephrons beyond a certain limit leads to a an overload on the
27
remaining functioning nephrons, causing disease progression irrespective of the cause of
the renal disease (Shimamura & Morrison, 1975).
2.5.2. Experimental hyperuricemia
Experimental crystal-independent hyperuricemia model based on uricase inhibition was
first developed in 2000 by Mazzali et al. (Mazzali et al., 2001). Since then it has been used
numerous times to model the events associated with non-gouty hyperuricemia.
Experimental studies, where rats were made hyperuricemic by the ingestion of uricase
inhibitor oxonic acid (2.0% in diet for 4-7 weeks) have suggested that high UA may play a
causal role in the development of hypertension (Mazzali et al., 2001; Kang et al., 2002;
Mazzali et al., 2002; Sanchez-Lozada et al., 2002; Nakagawa et al., 2003; Sanchez-Lozada
et al., 2005). The oxonic acid model of hyperuricemia has been shown to induce
preglomerular arteriolar disease leading to tubular ischemia, interstitial infiltration of
lymphocytes and macrophages, oxidant generation, and local vasoconstriction. These
changes are associated with decreased GFR and thus sodium filtration and increased
sodium reabsorption, so resulting in salt sensitivity (Johnson et al., 2002).
The initial increase in BP in hyperuricemic rats is associated with increased number of
renin-positive cells in the juxtaglomerular apparatus (Johnson et al., 2005b), and a direct
correlation of serum UA with the percentage of renin-positive juxtaglomerular cells has
been reported in this model (Mazzali et al., 2001). Treatment of hyperuricemia with XO
inhibitor allopurinol and uricosuric agents such as benziodarone have been repeatedly
shown to prevent the pathological and pathophysiological changes induced by oxonic acid
feeding (Mazzali et al., 2001; Kang et al., 2002; Mazzali et al., 2002; Sanchez-Lozada et
al., 2002; Nakagawa et al., 2003; Sanchez-Lozada et al., 2005). This effectively validates
the model, as any possible harmful changes induced independently by the oxonic acid
feeding would not have been prevented with UA treatment.
28

3. AIMS OF THE STUDY
The present experimental study featured two principal aims:
1. The first aim was to scrutinize the effects of hyperuricemia on the circulating
components of the RAAS and on the K+ / Na+ balance. The main focus was to
gauge potential changes in PRA and aldosterone concentration, as neither of these
have been previously reported in association with the oxonic acid-induced
hyperuricemia model. Hyperuricemia-associated increase in juxtaglomerular renin-
positive cells communicated by Mazzali et al. (Mazzali et al., 2001) suggested that
circulating RAAS could have a role in elevated UA.
2. The second aim was to examine the local RAS components of the kidney. Local
RAS activation is known to play an important role in CKD progression and
hypertension, while data of its importance in experimental hyperuricemia is scarce.
Therefore ACE, ACE2, AT1R, and AT2R were chosen for closer inspection using
autoradiography and real-time quantitative RT-PCR.
29

4. METHODS
4.1. ANIMALS AND TREATMENT
Male Sprague Dawley rats, housed two per cage, were used (n=48) with free access to
water and food pellets (Lactamin R34, AnalyCen, Lindköping, Sweden). The rat chow
contained 0.9% calcium, 0.8% phosphorus, 0.27% sodium, 0.2% magnesium, 0.6%
potassium, 12550 kJ/kg energy, 16.5% protein, 4.0% fat, 58% nitrogen-free extract, 3.5%
fibre, 6.0% ash, and 10% water. Surgery was performed under ketamine / diazepam
anesthesia (75 mg/kg and 2.5 mg/kg, respectively) at 8 weeks of age. NX was carried out
by removal of upper and lower poles of the left kidney, and the whole right kidney (Jolma
et al., 2003; Kööbi et al., 2003), whereas sham-operation was performed by kidney
decapsulation. Antibiotics (metronidazole 60 mg/kg, cefuroxim 225 mg/kg) were given
after surgery, and pain was relieved with buprenorphine (0.2 mg/kg, three times daily for
three days) (Kööbi et al., 2003). Systolic BPs were measured at 28°C with a tail-cuff BP
meter (model 129; IITC; Woodland Hills, California, USA) (Jolma et al., 2003).
Three weeks after NX (rat age 11 weeks), the animals were divided into four groups so
that systolic BPs and body weights in the Sham and Sham+Oxo, and NX and NX+Oxo
groups, respectively, (n=12 in each) were similar. After division, the Sham+Oxo and
NX+Oxo rats were switched to chow containing additional 2.0% oxonic acid. These diets
continued for 9 weeks (Figure 4.1), and 24-hour fluid consumption and urine output were
measured during the last study week. The rats were anesthetized (urethane 1.3 g/kg) and
blood samples from cannulated carotid artery were drawn with ethylene diamine
tetraacetic acid (EDTA) and heparin as anticoagulants, as appropriate. Blood samples
were not obtained from one NX and three Sham rats due to cardiac arrest during
anesthesia. The hearts and the kidneys were removed and weighed. A kidney half from
each rat was snap-frozen in isopentane at -40°C and stored at -80°C. The experimental
design of the study was approved by the Animal Experimentation Committee of the
University of Tampere and the Provincial Government of Western Finland Department of
Social Affairs and Health, Finland. The investigation conforms to the Guiding Principles
for Research Involving Animals.
30

Figure 4.1 Flowchart of the study: Surgery was performed at rat age of 8 weeks. The 2.0% oxonic acid diets started for Sham+Oxo and NX+Oxo groups at week 11 after 3 weeks of disease progression / recovery. The total duration of the diets was 9 weeks. Blood and tissue samples were obtained at the end of the experiment at week 20. Sham=Sham operated, NX=5/6 nephrectomy, Oxo=2.0% oxonic acid diet.
4.2. IN VITRO AUTORADIOGRAPHY
Frozen kidney sections (20 µm thick) were cut on a cryostat at -17°C, thaw mounted onto
Super Frost R Plus slides (Menzel-Gläser, Braunschweig, Germany), dried in a dessicator
under reduced pressure at 4°C overnight, and stored at -80°C with silica gel until further
processing (Bäcklund et al., 2001).
4.2.1. ACE autoradiography
A tyrosyl residue of lisinopril (MK351A, Merck, Sharp & Dohme Research Laboratories,
West Point, Pennsylvania, USA) was iodinated by chloramine T method, purified on SP-
Sephadex C-25 column (Pharmacia, Piscataway, New Jersey, USA), and then a previously
described technique was applied (Kohzuki et al., 1991; Bäcklund et al., 2001). Kidney
sections were pre-incubated for 15 minutes at room temperature in 10 mmol/l sodium
phosphate buffer, pH 7.4, containing 150 mmol/l NaCl and 0.2% bovine serum albumin
(BSA), followed by incubation for 1 hour at room temperature in fresh volume of the
same buffer containing 0.3 µCi/ml of 125I-351A. Non-specific binding was determined in
parallel incubations in the same buffer containing 1 mmol/l Na2-EDTA. After incubation,
31

the sections were washed four times for 1 minute in ice-cold buffer without BSA and 125I-
351A to remove unbound radioligand and dried under a stream of cool air. For
quantification of ACE binding, the sections were placed on a Fuji Imaging Plate BAS-
TP2025 (Tamro, Finland) for three hours. The optical densities were quantified by an
image analysis system (AIDA 2D densitometry) coupled to FUJIFILM BAS-5000
phosphoimager (Tamro, Finland) from four kidney sections per rat, six representative
areas per section, altogether 24 analyses per each kidney. Specific binding was calculated
as total binding minus non-specific binding.
4.2.2. AT1R and AT2R autoradiography
Sar1,Ile8-Ang II (Sigma, St. Louis, Missouri, USA) was iodinated by chloramine T method
and purified on a Sep-Pack C18 cartridge with methanolic gradient elution.
Autoradiographic quantification of angiotensin receptors with [125I]-Sar1,Ile8-Ang II was
performed using a published modification (Stewen et al., 2003) of a previously described
method (Zhuo et al., 1999). Kidney sections were pre-incubated for 15 minutes at room
temperature in 10 mmol/l sodium phosphate buffer, pH 7.4, containing 150 mmol/l NaCl,
5 mmol/l Na2-EDTA, and 0.2 % BSA, followed by a 1 hour incubation at 37°C in fresh
volume of the same buffer containing 0.2 µCi/ml of 125I-[Sar1,Ile8]Ang II. Non-specific
binding was determined in the presence of 1 µmol/l unlabelled Ang II (Sigma). The
density of AT1R was determined in presence of the AT2R antagonist PD 123,313 (10
µmol/l), and the density of AT2R in presence of the AT1R antagonist losartan (10 µmol/l).
After incubation, the sections were washed four times for 1 minute in ice-cold buffer
without BSA and radioligand and dried under stream of cool air. The optical densities of
angiotensin receptor binding from 10 kidney sections per rat were quantified as described
above for ACE from six representative cortical and six medullary areas per each section:
four sections were used for total specific binding, two sections for AT1R binding,
two sections for AT2R binding, and two sections for non-specific binding.
The outcome in each group was related to the mean value of the Sham group, except for
the medullary to cortical AT1R density ratio, in which the respective densities in each rat
kidney were related to each other.
32

4.3. REAL-TIME QUANTITATIVE RT-PCR
For the extraction of RNA, small pieces of tissue were cut from each frozen kidney
sample in a way that equally represented both medulla and cortex. Samples were
homogenized mechanically, and total RNA was isolated from these kidney homogenates
using Trizol reagent (Invitrogen, Carlsbad, California, USA) according to the
manufacturer’s instructions. RNA concentrations were determined spectrophotometrically
at 260nm, whereas the quality of RNA was checked by gel electrophoresis. Reverse
transcription of RNA was performed using M-MLV reverse transcriptase (Invitrogen)
according to the manufacturer’s instructions.
The expressions of ACE, ACE2, AT1aR, and AT2R mRNAs were studied using real-time
quantitative RT-PCR. PCR was performed either with SYBR Green chemistry (ACE and
AT1aR) or TaqMan chemistry (ACE2 and AT2R) using ABI PRISM 7000 sequence
detection system (Applied Biosystems, Foster City, California, USA). PCRs for ACE and
AT1aR were performed in duplicate in a 25 µl final volume containing 1X SYBR Green
Master mix (Applied Biosystems) and 300 nmol/l of primers (Table 4.1). PCRs for ACE2
and AT2R were performed in duplicate in a 25 µl final volume containing 1X TaqMan
Master mix (Applied Biosystems), 300 nmol/l of primers and 100 nmol/l of ACE2, 150
nmol/l of AT2R TaqMan probe (Table 4.1). PCR cycling conditions were 10 min at 95ºC
and 40 cycles of 20 seconds at 95ºC and 1 min at 60ºC. Data were analyzed using the
absolute standard curve method, and the amplification of a housekeeping gene 18S was
used for normalizing the results. The unnormalized expression of 18S mRNA did not
differ between the experimental groups enabling its use as the control housekeeping gene
in the present study. The intra-assay coefficient of variation percentage was determined
from the threshold cycle values of duplicate samples in one PCR run, while the inter-assay
coefficient of variation was determined from the threshold cycle values of duplicate
samples in six replicate PCR analyses. The intra-assay and inter-assay coefficients of
variation for the studied mRNAs were ≤1.2% and ≤2.8% respectively (Table 4.2).
33

Table 4.1 Primers and probes used in real-time RT-PCR amplification
Gene Primer nucleotide sequence
ACE Forward 5'-GGAGACGACTTACAGTGTAGCC-3' (Harada et al., 2001)
Reverse 5'-CACACCCAAAGCAATTCTTC-3' (Harada et al., 2001)
AT1aR Forward 5'-GGCAGCCTCTGACTAAATGGC-3'
Reverse 5'-ACGGCTTTGCTTGGTTACTCC-3'
ACE2 Forward 5'-ACCCTTCTTACATCAGCCCTACTG-3' (Tikellis et al., 2003)
Reverse 5'-TGTCCAAAACCTACCCCACATAT-3' (Tikellis et al., 2003)
AT2R Forward 5'-TGTCTGTCCTCATTGCCAACA-3'
Reverse 5'-TTCATTAAGGCAATCCCAGCA-3'
Gene Probe sequence
ACE2 5'FAM-ATGCCTCCCTGCTCATTTGCTTGGT-TAMRA (Tikellis et al., 2003)
AT2R 5'FAM-TCAGAACCATTGAATACTT-MGB
Table 4.2 Intra-assay and inter-assay coefficients of variation for real-time RT-PCR
Gene Intra-assay CV* of duplicate samples Inter-assay CV* of 6 replicate PCR runs
18S ≤1.1% ≤1.4%
AT1aR ≤1.1% ≤1.8%
AT2R ≤0.8% ≤2.8%
ACE ≤0.8% ≤1.4%
ACE2 ≤1.2% ≤2.5%
* coefficients of variation
34

4.4. RADIOIMMUNOASSAYS
Plasma aldosterone concentration and PRA were determined using radioimmunoassays
(GammaCoat® PRA RIA kit and ALDOCTK-2 RIA kit, Diasorin S.p.A., Saluggia, Italy)
according to the manufacturer’s instructions.
4.4.1. Aldosterone RIA
For the measurement of aldosterone concentration, deep frozen (-80ºC) EDTA plasma
samples were rapidly thawed to room temperature before assaying in duplicate. The assay
is based on competition for a limited number of fixed antibody binding sites between the 125I-labelled aldosterone and the aldosterone contained in calibrators or samples to be
assayed. 200 μl per sample and 500 μl of 125I-labelled aldosterone tracer were dispensed
on the bottom of an anti-aldosterone antibody coated tube, then mixed thoroughly on
vortex, and incubated overnight at room temperature. Zero and control calibrators were
subjected to the same protocol as the measured samples. After the overnight incubation,
all tubes were carefully aspirated so that no liquids were present during the actual
measurement. Radioactivity measurements were performed on a gamma counter (Wallac
Wizard 1470, PerkinElmer, Massachusetts, USA), and the aldosterone concentrations
were calculated using the obtained calibration curve. In this assay, the amount of 125I-
labelled aldosterone bound to the rabbit anti-aldosterone antibody on the tube walls is
inversely related to the concentration of unlabelled aldosterone present in calibrators or
samples, while the use of coated tubes gives the advantage of bound / free separation,
because only the bound aldosterone is present after a complete aspiration of the incubation
mixture.
4.4.2. Plasma renin activity RIA
For the PRA measurement, deep frozen (-80ºC) EDTA plasma samples were rapidly
thawed to room temperature before assaying in duplicate. The principle of this assay is
that PRA is measured via its Ang I producing capability. Therefore an incubation for Ang
I generation was performed before the actual measurement. One ml of plasma per sample
was dispensed in an uncoated plastic tube, marked accordingly, and mixed well with 10
35

μL phenylmethylsulfonyl fluoride (PMSF) solution and 100 μl maleate buffer (pH 6.0).
All samples were then divided in two tubes (500 μl aliquots), after which one tube was
placed in an ice bath (marked 4) and the other in a 37ºC water bath (marked 37) for 90
minutes of Ang I generation. After 90 minutes, the tubes in water bath were transferred to
ice bath in order to stop Ang I generation for the beginning of the actual PRA assay. This
part of the assay is based on competition for a limited number of fixed antibody binding
sites between the 125I-labelled Ang I and the Ang I contained in calibrators or samples.
Rabbit anti-Ang I antibody coated tubes were used in this measurement. 100 μl of each
sample and 1.0 ml of tracer were mixed thoroughly in a coated tube, and incubated for
three hours in room temperature. All controls were subjected to the same protocol as the
measured samples. After incubation, the liquid in all the tubes were aspirated completely,
and the radioactivity in each tube was measured using a gamma counter (PerkinElmer).
PRA values for each sample were obtained by first deducting the measured value of each
4 tube from the corresponding 37 tube, and then calculating correct value using the
calibration curve as reference.
4.5. PLASMA AND URINE DETERMINATIONS
Plasma potassium and sodium concentrations were measured by potentiometric direct dry
chemistry, while urea nitrogen was measured by colorimetric enzymatic dry chemistry
(Vitros 950, Johnson & Johnson Clinical Diagnostics, Rochester, NY). Plasma protein was
determined by colorimetric endpoint measurement according to Biuret (Cobas Integra
analyzer) and plasma creatinine by the kinetic colorimetric assay according to Jaffe (Jaffe
et al., 1987; Jolma et al., 2003). Plasma pH was measured with the use of an ion-selective
electrode (model 634 pH Analyzer, Ciba Corning Diagnostics, Sudbury, UK), and
hemoglobin by photometric analysis with the use of a cyanide-free hemoglobin reagent
(H*2, Technicon Instruments, Tarrytown, NY) (Jolma et al., 2003).
36

4.6. DATA PRESENTATION AND ANALYSIS OF RESULTS
The amounts of ACE and AT1R in renal tissue were depicted in relation to the mean value
of the Sham group. Statistics were by one-way and two-way analyses of variance
(ANOVA), and the least significant difference test was used for post-hoc analyses (SPSS
11.5, SPSS Inc., Chicago, Illinois, USA). If the distribution of the variables was skewed,
the Kruskal-Wallis test was applied, and post-hoc analyses were performed with the
Mann-Whitney U-test, the P-values being corrected with the Bonferroni equation. Results
were expressed as mean ± SEM, and differences were considered significant when
P<0.05.
37

5. RESULTS
5.1. ANIMAL DATA
Systolic BPs at the beginning of the oxonic acid feeding period did not differ between the
groups, although at study week 9 BP in the NX+Oxo group was higher than in the Sham
group (Table 5.1). No significant difference in BP was detected between the other groups.
Final body weight in the NX+Oxo group was slightly lower when compared with the NX
group, and when analyzed using two-way ANOVA a significant lowering influence on
body weight was associated with oxonic acid feeding (P=0.004). The heart to body weight
ratio and 24-hour urine output were higher in both NX groups when compared with Sham
rats (Table 5.1).
5.2. LABORATORY FINDINGS
The oxonic acid feeding elevated plasma UA concentration by 80-90 µmol/l in both Sham
and NX rats, as expected (Table 5.1). Creatinine clearance was similarly reduced by
approximately 60% in both NX groups and also by about 25% in hyperuricemic Sham rats
(Figure 5.1A). Plasma concentration of urea was over two-fold higher in the NX group
when compared with Sham rats, whereas no difference between the NX and NX+Oxo
groups was observed (Table 5.1). Blood pH was slightly lower in the NX group than in
Sham rats, while hemoglobin was decreased in the NX+Oxo group when compared with
Sham rats.
Hyperuricemia had a clear elevating effect on PRA (Figure 5.1B) and plasma aldosterone
concentration (Figure 5.2A). In the Sham+Oxo group PRA increased 1.2-fold and plasma
aldosterone 1.4-fold, whereas in the NX+Oxo group the increases were 2.5-fold and 2.3-
fold, respectively. The plasma aldosterone to renin ratios in the experimental groups were
(mean ± SEM) 12 ± 2, 14 ± 2, 360 ± 208* and 213 ± 110* in the Sham, Sham+Oxo, NX
and NX+Oxo groups, respectively (*P<0.001 both NX groups vs. both Sham groups). A
clear K+ loss / Na+ retention-effect was observed in both hyperuricemic groups
(Table 5.1). Subsequently, urine K+ to Na+ ratio was elevated two-fold in the Sham+Oxo
group and 1.6-fold in the NX+Oxo group (Figure 5.2B). The 24-hour urinary calcium
38

39
excretion was 1.7-fold increased in the Sham+Oxo group, whereas no significant changes
were observed in the NX groups (Table 5.1).
Figure 5.1 Bar graphs show creatinine clearance (panel A, n=9-12 in each group) and plasma renin activity (panel B, n=8-12) in sham-operated (Sham) and 5/6 nephrectomized (NX) rats ingesting either normal or 2.0% oxonic acid diet (Oxo); mean ± SEM; *P<0.05 versus Sham, †P<0.05 versus NX. Exact P-values given after the corresponding symbol.

Table 5.1 Experimental group data and laboratory findings
Sham (n=9-12)
Sham+Oxo (n=12)
NX (n=11-12)
NX+Oxo (n=12)
Systolic BP at week 0 (mmHg) 120 ± 4 121 ± 5 127 ± 5 125 ± 5 Systolic BP at week 9 (mmHg) 134 ± 7 136 ± 5 142 ± 6 152 ± 4*
Body weight at week 0 (g) 339 ± 6 338 ± 7 333 ± 8 332 ± 7
Body weight at week 9 (g) 433 ± 8 412 ± 11 448 ± 10 411 ± 8†
Heart weight / body weight (g/kg) 3.97 ± 0.05 4.12 ± 0.09 4.95 ± 0.27* 5.18 ± 0.33*
Urine volume (ml/24h) 25.2 ± 1.7 25.8 ± 1.8 53.3 ± 3.8* 49.3 ± 3.9*
Blood and plasma determinations
Uric acid (µmol/l) 36 ± 11 117 ± 21* 63 ± 19 152 ± 19*†
Urea (mmol/l) 6.62 ± 0.34 8.33 ± 0.42 13.54 ± 0.87* 14.54 ± 2.00*
pH 7.42 ± 0.028 7.37 ± 0.023 7.34 ± 0.034* 7.37 ± 0.023
Hemoglobin (g/l) 167.5 ± 3.2 168.5 ± 2.7 157.9 ± 4.7 149.8 ± 4.1*
Potassium (mmol/l) 4.12 ± 0.13 3.79 ± 0.08 4.28 ± 0.19 4.42 ± 0.18
Sodium (mmol/l) 136.5 ± 0.5 137.3 ± 0.6 136.7 ± 0.9 137.0 ± 0.5
Urine determinations
Potassium (mmol/24h) 2.84 ± 0.14 4.56 ± 0.20* 2.93 ± 0.09 3.73 ± 0.21*†
Sodium (mmol/24h) 8.47 ± 0.41 6.60 ± 0.25* 7.62 ± 0.25 6.44 ± 0.65*
Calcium (μmol/24h) 28.65 ± 4.47 47.45 ± 5.47* 40.03 ± 6.18 34.79 ± 4.38
Values are mean ± SEM, groups as in figure 5.1, *P<0.05 compared with the Sham group, †P<0.05 compared with the NX group
40

Figure 5.2 Bar graphs show plasma aldosterone (panel A, n=8-12 in each group) and urine K+ to Na+ ratio (panel B, n=12) in sham-operated (Sham) and 5/6 nephrectomized (NX) rats ingesting either normal or 2.0% oxonic acid diet (Oxo); mean ± SEM; *P<0.05 versus Sham, †P<0.05 versus NX. Exact P-values given after the corresponding symbol.
41

5.3. AUTORADIOGRAPHY AND REAL-TIME QUANTITATIVE RT-PCR
When kidney tissue ACE content was analyzed using quantitative in vitro
autoradiography, which measures binding to the active site of ACE protein (Zhuo et al.,
1997), no difference was observed in the NX groups when compared with Sham rats
(Figures 5.3A and 5.3B). Highest ACE signal was detected in a circular fashion in the
inner cortex and outer medulla in the Sham-operated groups, whereas ACE was more
widely distributed in the remnant kidneys of the NX groups (Figure 5.3A). However,
when determined using real-time quantitative RT-PCR, both NX groups showed
significantly lower ACE mRNA levels than the respective Sham rats (Figure 5.4A). In
addition, kidney tissue ACE2 mRNA levels were also lower in both NX groups than in the
Sham rats (Figure 5.4B).
When analyzed using autoradiography, AT1R densities in kidney cortex did not differ from
Sham in the NX groups. However, cortical AT1R density was approximately 25% higher in
NX+Oxo than NX rats (Figure 5.5A). In renal medulla, no difference in AT1R density
between the two NX groups was observed, while the density was about 43% higher in the
NX+Oxo group when compared with Sham rats (Figure 5.5B). The Sham+Oxo rats
featured no changes in renal AT1R density. In all groups, AT1R density in the kidney
medulla was higher than in the cortex (data not shown). In addition, the ratio of medullary
to cortical AT1R density was increased in both NX groups, the ratios being 2.27 ± 0.08,
2.00 ± 0.15, 3.25 ± 0.34*, 3.04 ± 0.24* in the Sham, Sham+Oxo, NX and NX+Oxo
groups, respectively (*P<0.02 both NX groups vs. both Sham groups).
Hyperuricemia had no effect on kidney tissue AT1aR mRNA content, the levels of which
were significantly lower in both NX groups than in Sham rats (Figure 5.6A). AT2R
densities in cortex and medulla were similar in all study groups (not shown), and the AT2R
binding comprised only 1.2-2.1% of all AT receptor binding in the cortex and 0.7-1.2% of
all binding in the medulla. Kidney tissue AT2R mRNA level was also lower in the
NX+Oxo group than in the Sham rats and was not significantly affected by hyperuricemia
(Figure 5.6B).
42

Figure 5.3 Representative original tracings (panel A, intensity of red colouring reflects active binding to ACE) and the bar graph show ACE determined using autoradiography (panel B, values related to the mean value of the Sham group) in sham-operated (Sham) and 5/6 nephrectomized (NX) rats ingesting either normal or 2.0% oxonic acid diet (Oxo), n=11-12, mean ± SEM.
43

Figure 5.4 Bar graphs show ACE mRNA (panel A) and ACE2 mRNA (panel B) determined using PCR; groups as in Figure 5.3, n=11-12, mean ± SEM; *P<0.05 versus Sham. Exact P-values given after the corresponding symbol.
44
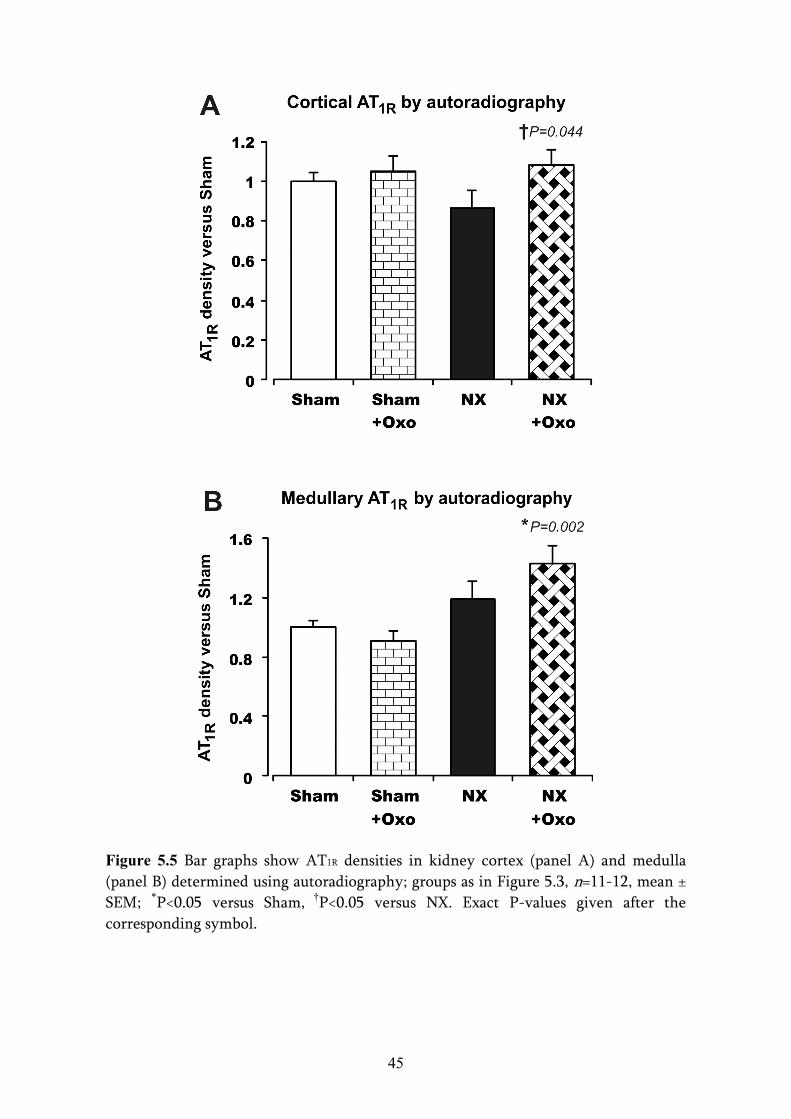
Figure 5.5 Bar graphs show AT1R densities in kidney cortex (panel A) and medulla (panel B) determined using autoradiography; groups as in Figure 5.3, n=11-12, mean ± SEM; *P<0.05 versus Sham, †P<0.05 versus NX. Exact P-values given after the corresponding symbol.
45

Figure 5.6 Bar graphs show AT1aR (panel A) and AT2R (panel B) mRNA determined using PCR; groups as in Figure 5.3, n=11-12, mean ± SEM; *P<0.05 versus Sham. Exact P-values given after the corresponding symbol.
46

6. DISCUSSION
The present study demonstrated that hyperuricemia, induced by 2.0% oxonic acid diet for
9 weeks, was associated with increased PRA and plasma aldosterone concentration.
Hyperuricemia also increased K+ excretion and reduced Na+ excretion, leading to elevated
K+ to Na+ ratio in the urine. This may be largely explained by the elevation in plasma
aldosterone levels and the subsequent increase in Na+ reabsorption in the distal nephron.
6.1. DISCUSSION OF THE METHODS
The methods used in the present study were found to be adequate and suitable for the
testing of the underlying hypotheses, and no significant problems were encountered during
the experiments or laboratory determinations. The surgical procedures, 5/6 nephrectomy
and sham-operation, succeeded in producing viable rats without animal losses, and the
experimental models functioned as expected. The RIA determinations also yielded results
that were in agreement with earlier observations (Ramsay et al., 1975; Mazzali et al.,
2001). Overall, the general reliability of the results appears to be high, although some
differences were observed between the determinations of the RAS components at the
protein level (autoradiography) and at the mRNA level (RT-PCR).
The in vitro autoradiography is a method providing information about the quantity and
localization of the assayed proteins in a histological sample. Its drawback is the same as
with any other histology-based assay, as the fixing of samples may cause artefacts
hindering the reliability of the obtained results. In this study, no artefact-causing fixatives
were used, as the samples were cut frozen, thaw mounted, and then desiccated. It can be
questioned how well the 20 μm thick sections of the kidney tissue represented the whole
kidney. Altogether 24 analyses per each kidney were performed, and this approach can be
argued to have increased the reliability of the autoradiography results.
The real-time quantitative RT-PCR, in turn, is a reliable method of determining gene
expression levels via amplification of the gene transcript. Obviously, the reverse
transcription and amplification procedures can be prone to errors if the conditions are not
optimized properly, or if primer dimers or other inappropriate products are amplified
47

along with the measured transcript. These problems, however, can be overcome by
routinely observing the product length with gel electrophoresis. The RT-PCR
measurements in this study were trustworthy, as the intra-assay and inter-assay
coefficients of variance were under 1.2% and 2.8%, respectively. Still, the reason for the
observed protein / mRNA differences may be found by analysing these RT-PCR results.
The intangible step is the total RNA extraction stage, since the original macroscopic
localization of the extracted RNA is not possible. We can only assume that the result
represents the mean transcriptional level of the whole cell population. However, a
marginal number of cells with thousands of times higher or lower transcription levels may
shift the result, and subsequently the outcome may indicate a higher or lower overall
transcription level in the whole cell population. This makes RT-PCR determinations using
tissue samples difficult, and therefore the method should be used in combination with
another method that provides information about the quantity and macroscopic localization
of the gene product.
6.2. DISCUSSION OF THE RESULTS
As expected, the 2.0% oxonic acid diet was successful in raising plasma UA values in
both oxonic acid-treated groups (Kang et al., 2002; Mazzali et al., 2002; Sanchez-Lozada
et al., 2005). Treatment of hyperuricemia was not included in the present study protocol,
as allopurinol and uricosuric agents have been repeatedly shown to prevent the
pathological and pathophysiological changes induced by oxonic acid feeding (Mazzali et
al., 2001; Kang et al., 2002; Mazzali et al., 2002; Sanchez-Lozada et al., 2002; Nakagawa
et al., 2003; Sanchez-Lozada et al., 2005). Renal insufficiency was induced by surgical 5/6
nephrectomy, and the NX rats showed several characteristic findings of CRI (Table 4.1).
Creatinine clearance was reduced, and blood urea was increased in both NX groups.
Corresponding to previous findings showing preglomerular arterial disease after oxonic
acid diet (Johnson et al., 2002), we found that hyperuricemia decreased creatinine
clearance in Sham rats. It should be noted that hyperuricemia is also associated with
decreased renal blood flow in humans (Messerli et al., 1980). However, the present
hyperuricemia did not reduce creatinine clearance in NX rats. An explanation may be the
higher PRA values in Sham rats resulting in higher Ang II, which is the major modulator
of glomerular blood flow and filtration rate. Both NX groups developed polyuria, and
exhibited two-fold increases in 24-hour urine volume. Increased volume diuresis and the
48

subsequent kaliuresis (Gennari, 1998) is a very likely explanation for the absence of
hyperkalemia in the NX groups.
The 12 weeks of CRI in this study did not unearth a significant BP elevation in the NX
rats on the normal diet. Previous studies have shown that after an additional 8 weeks (total
follow-up of 20 weeks) the NX rats developed clear hypertension, so that systolic BP was
elevated by 30 mmHg (Kööbi et al., 2006). However, the NX+Oxo rats presented with
elevated BP after 9 weeks of diet, which probably resulted from the hyperuricemia-
associated sodium retention. Sodium sensitivity is considered a characteristic feature in
hyperuricemia (Ward, 1998). Both NX and NX+Oxo groups exhibited increased heart to
body weight ratios, an apparent result of the increased volume load in CRI (Kööbi et al.,
2006).
As experimental hyperuricemia has been associated with increased number of renin-
positive cells in the juxtaglomerular apparatus (Mazzali et al., 2001; Johnson et al., 2003),
we scrutinized the circulating and renal components of RAS. Immunohistochemical
staining of renin-positive cells has been used previously as a marker of the tissue-level
renin expression (Mazzali et al., 2001), but knowledge about circulating renin activity in
hyperuricemia is scarce. Experimental models of hyperuricemia are characterized by
preglomerular arteriolar disease, leading to tubular ischemia and local vasoconstriction.
As the severity of the arteriolar disease varies between nephrons, some nephrons will be
underperfused and ischemic, whereas others may be overperfused. This leads to
heterogeneity in renin expression and a failure to suppress renin release for the degree of
sodium intake, resulting in sodium sensitivity (Sealey et al., 1988; Johnson et al., 2005b).
Because of the putative nephron heterogeneity, we chose to measure PRA instead of renin
staining to examine possible changes in the renin status during hyperuricemia.
The 5/6 NX rat is a low renin CRI model (Pörsti et al., 2004), but clear increases in PRA
were observed in both Sham and NX rats after the oxonic acid diet. This corresponds well
with the results of previous clinical studies (Saito et al., 1978; Gruskin, 1985) suggesting a
correlation between hyperuricemia and elevated PRA. Previously, adrenal aldosterone
production has been found to be increased 8 days after 5/6 nephrectomy in rats despite a
decrease in PRA; the putative stimulus for the aldosterone synthesis being up-regulated
adrenal renin synthesis (Endemann et al., 2004). In concert with these findings, subtotal
49

nephrectomy was associated with a marked increase in plasma aldosterone to renin ratio in
the present study. However, this ratio was not affected by oxonic acid feeding, which
suggests that increased PRA was the probable explanation for the observed increase in
plasma aldosterone. High circulating aldosterone concentration is acknowledged as a
significant cardiovascular risk factor (Schmidt & Schmieder, 2003; Schmidt et al., 2006),
but during hyperuricemia, its role has received little attention. It should be noted that the
present rats were not subjected to a metabolic balance study, and claims of a constant Na+
retention and K+ loss cannot be presented from these results. The possibility exists that the
influence of plasma aldosterone on electrolyte balance became more evident in the
unfamiliar environment of a metabolic cage. However, our results imply that increased
plasma aldosterone may mediate the Na+ retention associated with high serum UA.
The knowledge of the possible hyperuricemia-associated changes in renal tissue
components of RAS is limited. Our aim was, therefore, to examine if some of the
detrimental effects of elevated serum UA could be accounted for by alterations in renal
RAS components. Kidney ACE, ACE2, AT1R, and AT2R were measured at protein and
mRNA levels using in vitro autoradiography and real-time quantitative RT-PCR,
respectively. The autoradiography analyses did not unearth any changes that could explain
the hyperuricemia-induced alteration in Na+-K+ balance. There were no differences in
kidney ACE content between the study groups, while changes in cortical and medullary
AT1R densities were only observed in the NX+Oxo group: about 25% higher cortical AT1R
density than in the NX group, and 43% higher medullary AT1R density than in the Sham
group. Thus, hyperuricemia may be associated with increases in renal AT1R density in
CRI, but neither of these changes could explain the altered Na+-K+ balance, as increased
renal K+ wasting was also observed in the Sham+Oxo group in the absence of alterations
in renal AT1R density.
When determined using RT-PCR, both NX groups showed significantly lower ACE and
ACE2 mRNA levels than the respective Sham rats. Kidney AT1aR and AT2R mRNA
contents were also lower in both NX groups than in Sham rats. Importantly, the oxonic
acid diet did not influence ACE, ACE2, AT1aR or AT2R mRNA in kidney tissue of either
Sham or NX rats. As the RT-PCR analyses were performed from kidney extracts, no
macroscopic localization of the mRNA molecules could be obtained. In the case of ATRs,
the in vitro autoradiography provided information about distribution at the tissue level, in
50
effect its localization in the cortex or medulla. Experimental CRI was also associated with
an approximately 40% increase in the medullary to cortical ratio of AT1R density, which
was not influenced by 2.0% oxonic acid feeding. Moreover, highest ACE labelling was
detected in the corticomedullary region in the sham-operated rats, but in the 5/6
nephrectomized rats kidney ACE showed patchy and wider tissue distribution than in
normal kidneys (Pörsti et al., 2004). Altogether, the RAS components investigated showed
no changes at the mRNA level that would explain the influence of hyperuricemia on Na+-
K+ balance. As the mRNA levels, but not the corresponding protein contents, were
reduced in the two NX groups, the above RAS components were probably subject to post-
transcriptional modulation (i.e. more effective translation) or slower protein turnover (i.e
extended half-life) in experimental CRI. This may be related to the lower PRA and
reduced circulating RAS activity in this form of renal insufficiency.
51

7. CONCLUSIONS
In conclusion, hyperuricemia induced by 2.0% oxonic acid diet did not induce changes in
the local components of RAS in renal tissue, but activated the circulating RAS, reflected
as increased PRA and aldosterone in both Sham and NX rats. The functional significance
of these hormonal findings is clearly evidenced by the subsequent increase in K+ excretion
and reduction in Na+ excretion in the hyperuricemic rats, leading to a marked elevation of
the K+ to Na+ ratio in the urine. The present results emphasize the role of aldosterone in
the hyperuricemia-induced sodium retention and BP elevation.
52

REFERENCES
K/DOQI clinical practice guidelines for chronic kidney disease: evaluation, classification, and stratification. Am J Kidney Dis 2002;39:S1-266.
Ames BN, Cathcart R, Schwiers E and Hochstein P. Uric acid provides an antioxidant
defense in humans against oxidant- and radical-caused aging and cancer: a hypothesis. Proc Natl Acad Sci USA 1981;78:6858-62.
Anzai N, Kanai Y and Endou H. New insights into renal transport of urate. Curr Opin
Rheumatol 2007;19:151-7. Begun DR. Planet of the apes. Sci Am 2003;289:74-83. Bernstein KE. Views of the renin-angiotensin system: brilling, mimsy, and slithy tove.
Hypertension 2006;47:509-14. Boehm M and Nabel EG. Angiotensin-converting enzyme 2--a new cardiac regulator. N
Engl J Med 2002;347:1795-7. Bohle A, Wehrmann M, Bogenschutz O, Batz C et al. The long-term prognosis of the
primary glomerulonephritides. A morphological and clinical analysis of 1747 cases. Pathol Res Pract 1992;188:908-24.
Brasier AR and Li J. Mechanisms for inducible control of angiotensinogen gene
transcription. Hypertension 1996;27:465-75. Bäcklund T, Palojoki E, Grönholm T, Eriksson A et al. Dual inhibition of angiotensin
converting enzyme and neutral endopeptidase by omapatrilat in rat in vivo. Pharmacol Res 2001;44:411-8.
Cachofeiro V, Miana M, de Las Heras N, Martin-Fernandez B et al. Aldosterone and the
vascular system. J Steroid Biochem Mol Biol 2008. Cappuccio FP, Strazzullo P, Farinaro E and Trevisan M. Uric acid metabolism and tubular
sodium handling. Results from a population-based study. JAMA 1993;270:354-9. Cockcroft DW and Gault MH. Prediction of creatinine clearance from serum creatinine.
Nephron 1976;16:31-41. Crowley SD, Gurley SB, Oliverio MI, Pazmino AK et al. Distinct roles for the kidney and
systemic tissues in blood pressure regulation by the renin-angiotensin system. J Clin Invest 2005;115:1092-9.
Curtis JJ, Luke RG, Dustan HP, Kashgarian M et al. Remission of essential hypertension
after renal transplantation. N Engl J Med 1983;309:1009-15. Dahl LK and Heine M. Primary role of renal homografts in setting chronic blood pressure
levels in rats. Circ Res 1975;36:692-6.
53

Dawson J and Walters M. Uric acid and xanthine oxidase: future therapeutic targets in the
prevention of cardiovascular disease? Br J Clin Pharmacol 2006. Doehner W and Anker SD. Uric acid in chronic heart failure. Semin Nephrol 2005;25:61-
6. Eaton SB and Konner M. Paleolithic nutrition. A consideration of its nature and current
implications. N Engl J Med 1985;312:283-9. Ellman MH and Becker MA. Crystal-induced arthropathies: recent investigative advances.
Curr Opin Rheumatol 2006;18:249-55. Endemann DH, Wolf K, Boeger CA, Riegger GA et al. Adrenal aldosterone biosynthesis
is elevated in a model of chronic renal failure--role of local adrenal renin-angiotensin system. Nephron Physiol 2004;97:p37-44.
Fang J and Alderman MH. Serum uric acid and cardiovascular mortality the NHANES I
epidemiologic follow-up study, 1971-1992. National Health and Nutrition Examination Survey. JAMA 2000;283:2404-10.
Feig DI and Johnson RJ. Hyperuricemia in childhood primary hypertension. Hypertension
2003;42:247-52. Feig DI and Johnson RJ. The role of uric acid in pediatric hypertension. J Ren Nutr
2007;17:79-83. Feig DI, Nakagawa T, Karumanchi SA, Oliver WJ et al. Hypothesis: Uric acid, nephron
number, and the pathogenesis of essential hypertension. Kidney Int 2004;66:281-7. Fogo AB. Mechanisms of progression of chronic kidney disease. Pediatr Nephrol
2007;22:2011-22. Foreman JW and Chan JC. Chronic renal failure in infants and children. J Pediatr
1988;113:793-800. Fuller PJ and Young MJ. Mechanisms of mineralocorticoid action. Hypertension
2005;46:1227-35. Gennari FJ. Hypokalemia. N Engl J Med 1998;339:451-8. Gruskin AB. The adolescent with essential hypertension. Am J Kidney Dis 1985;6:86-90. Hackenthal E, Paul M, Ganten D and Taugner R. Morphology, physiology, and molecular
biology of renin secretion. Physiol Rev 1990;70:1067-116. Harada E, Yoshimura M, Yasue H, Nakagawa O et al. Aldosterone induces angiotensin-
converting-enzyme gene expression in cultured neonatal rat cardiocytes. Circulation 2001;104:137-9.
54

Harrison-Bernard LM, El-Dahr SS, O'Leary DF and Navar LG. Regulation of angiotensin II type 1 receptor mRNA and protein in angiotensin II-induced hypertension. Hypertension 1999;33:340-6.
Harrison R. Human xanthine oxidoreductase: in search of a function. Biochem Soc Trans
1997;25:786-91. Higuchi S, Ohtsu H, Suzuki H, Shirai H et al. Angiotensin II signal transduction through
the AT1 receptor: novel insights into mechanisms and pathophysiology. Clin Sci (Lond) 2007;112:417-28.
Hostetter TH, Olson JL, Rennke HG, Venkatachalam MA et al. Hyperfiltration in remnant
nephrons: a potentially adverse response to renal ablation. Am J Physiol 1981;241:F85-93.
Hu DE, Moore AM, Thomsen LL and Brindle KM. Uric acid promotes tumor immune
rejection. Cancer Res 2004;64:5059-62. Ichihara A, Kobori H, Nishiyama A and Navar LG. Renal renin-angiotensin system.
Contrib Nephrol 2004;143:117-30. Ito M, Oliverio MI, Mannon PJ, Best CF et al. Regulation of blood pressure by the type
1A angiotensin II receptor gene. Proc Natl Acad Sci U S A 1995;92:3521-5. Jaffe N, Keifer R, 3rd, Robertson R, Cangir A et al. Renal toxicity with cumulative doses
of cis-diamminedichloroplatinum-II in pediatric patients with osteosarcoma. Effect on creatinine clearance and methotrexate excretion. Cancer 1987;59:1577-81.
Jin XH, Siragy HM and Carey RM. Renal interstitial cGMP mediates natriuresis by direct
tubule mechanism. Hypertension 2001;38:309-16. Johnson CA, Levey AS, Coresh J, Levin A et al. Clinical practice guidelines for chronic
kidney disease in adults: Part II. Glomerular filtration rate, proteinuria, and other markers. Am Fam Physician 2004;70:1091-7.
Johnson RJ, Feig DI, Herrera-Acosta J and Kang DH. Resurrection of uric acid as a causal
risk factor in essential hypertension. Hypertension 2005a;45:18-20. Johnson RJ, Feig DI, Nakagawa T, Sanchez-Lozada LG et al. Pathogenesis of essential
hypertension: historical paradigms and modern insights. J Hypertens 2008a;26:381-91.
Johnson RJ, Gaucher EA, Sautin YY, Henderson GN et al. The planetary biology of
ascorbate and uric acid and their relationship with the epidemic of obesity and cardiovascular disease. Med Hypotheses 2008b.
Johnson RJ, Herrera-Acosta J, Schreiner GF and Rodriguez-Iturbe B. Subtle acquired
renal injury as a mechanism of salt-sensitive hypertension. N Engl J Med 2002;346:913-23.
55

Johnson RJ, Kang DH, Feig D, Kivlighn S et al. Is there a pathogenetic role for uric acid in hypertension and cardiovascular and renal disease? Hypertension 2003;41:1183-90.
Johnson RJ and Rideout BA. Uric acid and diet--insights into the epidemic of
cardiovascular disease. N Engl J Med 2004;350:1071-3. Johnson RJ, Rodriguez-Iturbe B, Nakagawa T, Kang DH et al. Subtle renal injury is likely
a common mechanism for salt-sensitive essential hypertension. Hypertension 2005b;45:326-30.
Johnson RJ, Segal MS, Srinivas T, Ejaz A et al. Essential hypertension, progressive renal
disease, and uric acid: a pathogenetic link? J Am Soc Nephrol 2005c;16:1909-19. Johnson RJ, Titte S, Cade JR, Rideout BA et al. Uric acid, evolution and primitive
cultures. Semin Nephrol 2005d;25:3-8. Johnston CI. Tissue angiotensin converting enzyme in cardiac and vascular hypertrophy,
repair, and remodeling. Hypertension 1994;23:258-68. Jolma P, Koobi P, Kalliovalkama J, Saha H et al. Treatment of secondary
hyperparathyroidism by high calcium diet is associated with enhanced resistance artery relaxation in experimental renal failure. Nephrol Dial Transplant 2003;18:2560-9.
Kang DH, Nakagawa T, Feng L, Watanabe S et al. A role for uric acid in the progression
of renal disease. J Am Soc Nephrol 2002;13:2888-97. Khwaja A, El Kossi M, Floege J and El Nahas M. The management of CKD: a look into
the future. Kidney Int 2007;72:1316-23. Klahr S. The modification of diet in renal disease study. N Engl J Med 1989;320:864-6. Kobori H, Nangaku M, Navar LG and Nishiyama A. The intrarenal renin-angiotensin
system: from physiology to the pathobiology of hypertension and kidney disease. Pharmacol Rev 2007a;59:251-87.
Kobori H, Ozawa Y, Satou R, Katsurada A et al. Kidney-specific enhancement of ANG II
stimulates endogenous intrarenal angiotensinogen in gene-targeted mice. Am J Physiol Renal Physiol 2007b;293:F938-45.
Kohzuki M, Johnston CI, Chai SY, Jackson B et al. Measurement of angiotensin
converting enzyme induction and inhibition using quantitative in vitro autoradiography: tissue selective induction after chronic lisinopril treatment. J Hypertens 1991;9:579-87.
Komlosi P, Fuson AL, Fintha A, Peti-Peterdi J et al. Angiotensin I conversion to
angiotensin II stimulates cortical collecting duct sodium transport. Hypertension 2003;42:195-9.
56

Kutzing MK and Firestein BL. Altered uric acid levels and disease states. J Pharmacol Exp Ther 2008;324:1-7.
Kvist S and Mulvany MJ. Contrasting regression of blood pressure and cardiovascular
structure in declipped renovascular hypertensive rats. Hypertension 2003;41:540-5. Kööbi P, Kalliovalkama J, Jolma P, Rysä J et al. AT1 receptor blockade improves
vasorelaxation in experimental renal failure. Hypertension 2003;41:1364-71. Kööbi P, Vehmas TI, Jolma P, Kalliovalkama J et al. High-calcium vs high-phosphate
intake and small artery tone in advanced experimental renal insufficiency. Nephrol Dial Transplant 2006;21:2754-61.
Lameire N, Jager K, Van Biesen W, de Bacquer D et al. Chronic kidney disease: a
European perspective. Kidney Int Suppl 2005;S30-8. Lantelme P, Rohrwasser A, Gociman B, Hillas E et al. Effects of dietary sodium and
genetic background on angiotensinogen and Renin in mouse. Hypertension 2002;39:1007-14.
Levey AS, Andreoli SP, DuBose T, Provenzano R et al. Chronic kidney disease: common,
harmful, and treatable--World Kidney Day 2007. Clin J Am Soc Nephrol 2007;2:401-5.
Levey AS, Eckardt KU, Tsukamoto Y, Levin A et al. Definition and classification of
chronic kidney disease: a position statement from Kidney Disease: Improving Global Outcomes (KDIGO). Kidney Int 2005;67:2089-100.
Lopez-Torres M, Perez-Campo R, Rojas C, Cadenas S et al. Maximum life span in
vertebrates: relationship with liver antioxidant enzymes, glutathione system, ascorbate, urate, sensitivity to peroxidation, true malondialdehyde, in vivo H2O2, and basal and maximum aerobic capacity. Mech Ageing Dev 1993;70:177-99.
Luke RG. Chronic renal failure--a vasculopathic state. N Engl J Med 1998;339:841-3. MacKinnon M, Shurraw S, Akbari A, Knoll GA et al. Combination therapy with an
angiotensin receptor blocker and an ACE inhibitor in proteinuric renal disease: a systematic review of the efficacy and safety data. Am J Kidney Dis 2006;48:8-20.
Mazzali M, Hughes J, Kim YG, Jefferson JA et al. Elevated uric acid increases blood
pressure in the rat by a novel crystal-independent mechanism. Hypertension 2001;38:1101-6.
Mazzali M, Kanellis J, Han L, Feng L et al. Hyperuricemia induces a primary renal
arteriolopathy in rats by a blood pressure-independent mechanism. Am J Physiol Renal Physiol 2002;282:F991-7.
Messerli FH, Frohlich ED, Dreslinski GR, Suarez DH et al. Serum uric acid in essential
hypertension: an indicator of renal vascular involvement. Ann Intern Med 1980;93:817-21.
57

Mezzano S, Droguett A, Burgos ME, Ardiles LG et al. Renin-angiotensin system
activation and interstitial inflammation in human diabetic nephropathy. Kidney Int Suppl 2003;S64-70.
Miyata N, Park F, Li XF and Cowley AW, Jr. Distribution of angiotensin AT1 and AT2
receptor subtypes in the rat kidney. Am J Physiol 1999;277:F437-46. Morrison AB and Howard RM. The functional capacity of hypertrophied nephrons. Effect
of partial nephrectomy on the clearance of inulin and PAH in the rat. J Exp Med 1966;123:829-44.
Muscelli E, Natali A, Bianchi S, Bigazzi R et al. Effect of insulin on renal sodium and uric
acid handling in essential hypertension. Am J Hypertens 1996;9:746-52. Nagase M and Fujita T. Aldosterone and glomerular podocyte injury. Clin Exp Nephrol
2008. Nakagawa T, Cirillo P, Sato W, Gersch M et al. The conundrum of hyperuricemia,
metabolic syndrome, and renal disease. Intern Emerg Med 2008. Nakagawa T, Hu H, Zharikov S, Tuttle KR et al. A causal role for uric acid in fructose-
induced metabolic syndrome. Am J Physiol Renal Physiol 2006;290:F625-31. Nakagawa T, Mazzali M, Kang DH, Kanellis J et al. Hyperuricemia causes glomerular
hypertrophy in the rat. Am J Nephrol 2003;23:2-7. Navar LG. The kidney in blood pressure regulation and development of hypertension.
Med Clin North Am 1997;81:1165-98. Navar LG. The role of the kidneys in hypertension. J Clin Hypertens (Greenwich)
2005;7:542-9. Navar LG, Harrison-Bernard LM, Nishiyama A and Kobori H. Regulation of intrarenal
angiotensin II in hypertension. Hypertension 2002;39:316-22. Navar LG and Nishiyama A. Intrarenal formation of angiotensin II. Contrib Nephrol
2001;1-15. Navar LG and Nishiyama A. Why are angiotensin concentrations so high in the kidney?
Curr Opin Nephrol Hypertens 2004;13:107-15. Navar LG, Von Thun AM, Zou L, el-Dahr SS et al. Enhancement of intrarenal angiotensin
II levels in 2 kidney 1 clip and angiotensin II induced hypertension. Blood Press Suppl 1995;2:88-92.
Nguyen G, Delarue F, Berrou J, Rondeau E et al. Specific receptor binding of renin on
human mesangial cells in culture increases plasminogen activator inhibitor-1 antigen. Kidney Int 1996;50:1897-903.
58

Nguyen G, Delarue F, Burckle C, Bouzhir L et al. Pivotal role of the renin/prorenin receptor in angiotensin II production and cellular responses to renin. J Clin Invest 2002;109:1417-27.
Oda M, Satta Y, Takenaka O and Takahata N. Loss of urate oxidase activity in hominoids
and its evolutionary implications. Mol Biol Evol 2002;19:640-53. Okamoto K, Eger BT, Nishino T, Kondo S et al. An extremely potent inhibitor of xanthine
oxidoreductase. Crystal structure of the enzyme-inhibitor complex and mechanism of inhibition. J Biol Chem 2003;278:1848-55.
Oliver WJ, Cohen EL and Neel JV. Blood pressure, sodium intake, and sodium related
hormones in the Yanomamo Indians, a "no-salt" culture. Circulation 1975;52:146-51.
Olson JL and Heptinstall RH. Nonimmunologic mechanisms of glomerular injury. Lab
Invest 1988;59:564-78. Paul M, Poyan Mehr A and Kreutz R. Physiology of local renin-angiotensin systems.
Physiol Rev 2006;86:747-803. Prescott G, Silversides DW and Reudelhuber TL. Tissue activity of circulating prorenin.
Am J Hypertens 2002;15:280-5. Purkerson ML, Hoffsten PE and Klahr S. Pathogenesis of the glomerulopathy associated
with renal infarction in rats. Kidney Int 1976;9:407-17. Pörsti I, Fan M, Kööbi P, Jolma P et al. High calcium diet down-regulates kidney
angiotensin-converting enzyme in experimental renal failure. Kidney Int 2004;66:2155-66.
Ramsay LE, Auty RM, Horth CE, Levine D et al. Plasma uric acid concentration related to
the urinary excretion of aldosterone and of electrolytes in normal subjects. Clin Sci Mol Med 1975;49:613-6.
Remuzzi G, Perico N, Macia M and Ruggenenti P. The role of renin-angiotensin-
aldosterone system in the progression of chronic kidney disease. Kidney Int Suppl 2005;S57-65.
Rettig R, Folberth C, Kopf D, Stauss H et al. Role of the kidney in the pathogenesis of
primary hypertension. Clin Exp Hypertens A 1990;12:957-1002. Rosamond W, Flegal K, Furie K, Go A et al. Heart disease and stroke statistics--2008
update: a report from the American Heart Association Statistics Committee and Stroke Statistics Subcommittee. Circulation 2008;117:e25-146.
Rostand SG and Drueke TB. Parathyroid hormone, vitamin D, and cardiovascular disease
in chronic renal failure. Kidney Int 1999;56:383-92.
59

Saito I, Saruta T, Kondo K, Nakamura R et al. Serum uric acid and the renin-angiotensin system in hypertension. J Am Geriatr Soc 1978;26:241-7.
Salonen T, Reina T, Oksa H, Rissanen P et al. Alternative strategies to evaluate the cost-
effectiveness of peritoneal dialysis and hemodialysis. Int Urol Nephrol 2007;39:289-98.
Sanchez-Lozada LG, Tapia E, Avila-Casado C, Soto V et al. Mild hyperuricemia induces
glomerular hypertension in normal rats. Am J Physiol Renal Physiol 2002;283:F1105-10.
Sanchez-Lozada LG, Tapia E, Jimenez A, Bautista P et al. Fructose-induced metabolic
syndrome is associated with glomerular hypertension and renal microvascular damage in rats. Am J Physiol Renal Physiol 2007;292:F423-9.
Sanchez-Lozada LG, Tapia E, Santamaria J, Avila-Casado C et al. Mild hyperuricemia
induces vasoconstriction and maintains glomerular hypertension in normal and remnant kidney rats. Kidney Int 2005;67:237-47.
Sanchez-Lozada LG, Tapia E, Soto V, Avila-Casado C et al. Treatment with the xanthine
oxidase inhibitor febuxostat lowers uric acid and alleviates systemic and glomerular hypertension in experimental hyperuricaemia. Nephrol Dial Transplant 2008;23:1179-85.
Santos CX, Anjos EI and Augusto O. Uric acid oxidation by peroxynitrite: multiple
reactions, free radical formation, and amplification of lipid oxidation. Arch Biochem Biophys 1999;372:285-94.
Sautin YY, Nakagawa T, Zharikov S and Johnson RJ. Adverse effects of the classic
antioxidant uric acid in adipocytes: NADPH oxidase-mediated oxidative/nitrosative stress. Am J Physiol Cell Physiol 2007;293:C584-96.
Schmidt BM, Sammer U, Fleischmann I, Schlaich M et al. Rapid nongenomic effects of
aldosterone on the renal vasculature in humans. Hypertension 2006;47:650-5. Schmidt BM and Schmieder RE. Aldosterone-induced cardiac damage: focus on blood
pressure independent effects. Am J Hypertens 2003;16:80-6. Schweda F and Kurtz A. Cellular mechanism of renin release. Acta Physiol Scand
2004;181:383-90. Sealey JE, Blumenfeld JD, Bell GM, Pecker MS et al. On the renal basis for essential
hypertension: nephron heterogeneity with discordant renin secretion and sodium excretion causing a hypertensive vasoconstriction-volume relationship. J Hypertens 1988;6:763-77.
Sealey JE, Glorioso N, Itskovitz J and Laragh JH. Prorenin as a reproductive hormone.
New form of the renin system. Am J Med 1986;81:1041-6.
60

Shi Y, Evans JE and Rock KL. Molecular identification of a danger signal that alerts the immune system to dying cells. Nature 2003;425:516-21.
Shimamura T and Morrison AB. A progressive glomerulosclerosis occurring in partial
five-sixths nephrectomized rats. Am J Pathol 1975;79:95-106. Siragy HM and Carey RM. Protective role of the angiotensin AT2 receptor in a renal wrap
hypertension model. Hypertension 1999;33:1237-42. Spitsin S and Koprowski H. Role of uric acid in multiple sclerosis. Curr Top Microbiol
Immunol 2008;318:325-42. Stewen P, Mervaala E, Karppanen H, Nyman T et al. Sodium load increases renal
angiotensin type 1 receptors and decreases bradykinin type 2 receptors. Hypertens Res 2003;26:583-9.
Sundstrom J, Sullivan L, D'Agostino RB, Levy D et al. Relations of serum uric acid to
longitudinal blood pressure tracking and hypertension incidence. Hypertension 2005;45:28-33.
Takano Y, Hase-Aoki K, Horiuchi H, Zhao L et al. Selectivity of febuxostat, a novel non-
purine inhibitor of xanthine oxidase/xanthine dehydrogenase. Life Sci 2005;76:1835-47.
Takeda Y, Yoneda T, Demura M, Miyamori I et al. Cardiac aldosterone production in
genetically hypertensive rats. Hypertension 2000;36:495-500. Terada LS, Guidot DM, Leff JA, Willingham IR et al. Hypoxia injures endothelial cells by
increasing endogenous xanthine oxidase activity. Proc Natl Acad Sci U S A 1992;89:3362-6.
Terkeltaub R. Gout in 2006: the perfect storm. Bull NYU Hosp Jt Dis 2006;64:82-6. Tikellis C, Johnston CI, Forbes JM, Burns WC et al. Characterization of renal angiotensin-
converting enzyme 2 in diabetic nephropathy. Hypertension 2003;41:392-7. Tipnis SR, Hooper NM, Hyde R, Karran E et al. A human homolog of angiotensin-
converting enzyme. Cloning and functional expression as a captopril-insensitive carboxypeptidase. J Biol Chem 2000;275:33238-43.
Tufro-McReddie A and Gomez RA. Ontogeny of the renin-angiotensin system. Semin
Nephrol 1993;13:519-30. Ward HJ. Uric acid as an independent risk factor in the treatment of hypertension. Lancet
1998;352:670-1. Waring WS, Webb DJ and Maxwell SR. Uric acid as a risk factor for cardiovascular
disease. Qjm 2000;93:707-13.
61

62
Watanabe S, Kang DH, Feng L, Nakagawa T et al. Uric acid, hominoid evolution, and the pathogenesis of salt-sensitivity. Hypertension 2002;40:355-60.
Wu XW, Lee CC, Muzny DM and Caskey CT. Urate oxidase: primary structure and
evolutionary implications. Proc Natl Acad Sci U S A 1989;86:9412-6. Wu XW, Muzny DM, Lee CC and Caskey CT. Two independent mutational events in the
loss of urate oxidase during hominoid evolution. J Mol Evol 1992;34:78-84. Zhuo J, Ohishi M and Mendelsohn FA. Roles of AT1 and AT2 receptors in the
hypertensive Ren-2 gene transgenic rat kidney. Hypertension 1999;33:347-53. Zhuo JL, Froomes P, Casley D, Liu JJ et al. Perindopril chronically inhibits angiotensin-
converting enzyme in both the endothelium and adventitia of the internal mammary artery in patients with ischemic heart disease. Circulation 1997;96:174-82.