Hypertension Management Software (HMS) 5 the application from CD ROM 1. Log on as system...
52
Hypertension Management Software (HMS) 5.0 Directions for Use – PWA-License
-
Upload
nguyenxuyen -
Category
Documents
-
view
215 -
download
0
Transcript of Hypertension Management Software (HMS) 5 the application from CD ROM 1. Log on as system...

Hypertension Management Software (HMS) 5.0
Directions for Use – PWA-License

2
© 2014 Welch Allyn, Inc. To support the intended use of the product described in this publication, the
purchaser of the product is permitted to copy this publication for internal distribution only, from the media
provided by Welch Allyn.
Caution: Federal US law restricts sale of the device identified in this manual to, or on the order of, licensed physicians.
Welch Allyn does not accept liability for injuries or unlawful or improper use of the product which may result from the fact that the product is not used in accordance with the instructions, cautions and warnings, as well as the indications for use published in this manual.
Welch Allyn is a registered trademark of Welch Allyn, Inc., ABPM 7100 is a trademark of Welch Allyn, Inc.
The copyright for the firmware in this product remains with the manufacturer of this device. All rights reserved. The firmware may not be read out, copied, decompiled, redeveloped, disassembled or brought into any human-readable format. This does not pertain to the sales of firmware or a firmware copy. All usage and ownership rights to the Software remain with I.E.M. GmbH.
Welch Allyn Technical Support:
http://www.welchallyn.com/about/company/locations.htm
I.E.M. GmbH
Cockerillstr. 69
52222 Stolberg
Germany
Manufactured for Welch Allyn
Ende der Liste für Textmar ke C opyright ===Pos: 4 /_Steuer ung/Inhaltsverzeichnis @ 0\mod_1402574713889_6.docx @ 5059 @ 1 @ 1

3 - Table of contents
Table of contents
Symbols 5 Introduction 5
Preliminary note 5
About this directions for use 5
Safety-relevant information 5
Intended use 5
Description of the HMS 6
Working with HMS 6 Installing the software 7
Provisions for “Cyber Security” 7
System requirements 7
Installation for Windows® 8
Installing the HMS from CD 8
Installation for Macintosh® OS X 10.7.5 and above 9
Installation for Linux® 10
Installing the Bluetooth® driver 10
Installing the USB driver 10
Starting and exiting the HMS 11 Structure of the HMS application window 11
Menu bar 11
Toolbar 13
Activating Pulse Wave Analysis (PWA) 13
First steps with the sample patient 14
Displaying the patient 14
Displaying the patient’s measurement data 15
Editing patient information 16
Creating new patients 16
Selecting existing patients 17
Modifying patient data 18
Changing the Patient ID 18
Blood pressure limits 18
Deleting a patient 18
Audit Trail 18
Working with the ABPM 7100 19
Pairing via cable 19
Pairing the computer to the ABPM 7100 via the USB interface cable 19
Configuring the interface between the ABPM 7100 and the HMS 19
Preparing the ABPM 7100 for 24-hour measurement 19
Starting 24-hour measurement 20
Connecting the computer to the ABPM 7100 via cable after a 24-hour measurement 21
Transferring 24-hour measurement values out from the ABPM 7100 21
Pairing via Bluetooth® 22
Configuring the interface between ABPM 7100 and HMS 22
Preparing the ABPM 7100 for 24-hour measurement 23
Starting 24-hour measurement 24
Transferring out 24-hour measurement results from the ABPM 7100 via Bluetooth® 25
Preparing the ABPM 7100 for measurement 26
Setting the measurement protocol 27

4 - Table of contents
Setting the ABPM 7100 clock 27
Transmitting the Patient ID 27
Testing the ABPM 7100 27
Deleting old measurements 28
Completing ABPM 7100 preparation 28
Exporting measurement results 28
Analyzing the measurement 29
The Measurements tab 31
The Trends tab 31
The Bar Chart tab 33
The Scatter Points tab 34
The Exceeding norms tab 34
The Frequency Distribution tab 35
The Summary tab 36
The Hourly Intervals tab 37
The Rise and Fall tab 37
The Trends (PWA) tab 39
The Amplification tab 40
The Print tab 40
Comparing several measurement results 41
Monitoring at the doctor’s office 41
Preparing the ABPM 7100 for monitoring at the doctor’s office 41
Assigning received measurement results 42
Pulse Wave Analysis (PWA) 43
Performing PWA at the doctor’s office 43
Performing 24-hour PWA 44
Transferring and analyzing 24-hour PWA measurement results 44
Displaying the PWA 44
Changing the default settings of the HMS 45
Database 45
Changing the language 46
Port settings 46
Blood pressure limits 47
Analysis 49
Specifying colors for curves and diagram backgrounds 49
Format 50
GDT settings 50
=== Ende der Liste für Textmar ke TOC === Pos : 6 /Sammel/01_Einführung @ 0\mod_1398690513744_6.docx @ 4730 @ 122222233 @ 1

5 - Symbols
Symbols
The following signal words, symbols and pictographs are used in this direction for use to indicate important information:
Attention The attention statement marks possible material damage. Non-adherence may lead to damage to the device or its accessories
Note The note statement marks further information on the HMS
Tip The tip statement marks a useful tip for example a short key
Consult Directions for Use, Electronic version available at Welchallyn.com, or Hard copy DFU available from Welch Allyn within 7 days.
INTERNAL REFERENCE Marks references within the document to further information
EXTERNAL REFERENCE Marks references to external documents containing further optional information
Meets essential requirements of European Medical Device Directive 93/42/EEC
Manufacturer
Introduction
Preliminary note
The Hypertension Management Software (HMS) serves to analyze the measurements taken by the blood pressure monitor ABPM 7100 from Welch Allyn.
With the help of the HMS, measurement results can be transferred out for analyzes via a USB interface cable or via Bluetooth®.
Measurement values can be displayed in various diagrams and other display formats, then processed further or printed out.
The upgrade to the PWA License provides you with the additional option of a pulse wave analysis (PWA).
About this directions for use
This direction for use provides you with extensive information on the individual options of analyzing the measurement values from your ABPM 7100.
Safety-relevant information
Safety-relevant information is contained in the directions for use of the ABPM 7100 Ambulatory Blood Pressure Monitor.
Intended use
The Hypertension Management Software is used in combination with the ABPM 7100 for the presentation and analyzes of blood pressure measurements.
The blood pressure curve of the ascending aorta is derived and a series of central arterial parameters are displayed. It is used in those patients where information related to the ascending aortic blood pressure is desired but in the opinion of the physician, the risk of cardiac catheterization procedure or other invasive monitoring may outweigh the benefits.
For further information on your ABPM 7100 please refer to the directions for use of the ABPM 7100.

6 - Working with HMS
Description of the HMS
The ABPM 7100 measures blood pressure and stores the measurement. Upon completion of the measurements, the stored measurements can be transferred to your computer, where measurements can be analyzed with the HMS according to your convenience.
The patient file contains data such as:
Patient ID (mandatory input)
Name (mandatory input)
Contact information (address, telephone number, emergency contacts etc.)
Personal data (age, gender etc.)
Medication, Medical history, Blood pressure limits
The HMS offers you various analysis options. Results can be displayed on the computer screen or printed out:
Display all individual measurements
Statistical analysis with mean blood pressure values for the entire day, daytime and nighttime, first hour upon initial measurement, as well as mean hourly values
Extreme values (maximum, minimum)
Frequency percentage of measurement values above a specified limit value
Calculation of daytime / nocturnal decrease
Deviation from standards (variability)
Graphical analyzes:
Envelope curve of mean hourly values
Correlation
Pie chart of exceeded limits in percent
Bar chart of measurements
Curve of changes in blood pressure
Curve of measurement values
Histogram of blood pressure distribution
Curve comparison for treatment optimization
In this way, the course of and fluctuations in blood pressure over the day and night can be quickly and easily visualized. Medication can then be adjusted base on the account of these changes.
Working with HMS
Note Basic knowledge and experience in the Windows®, Mac OS X® or Linux® Operating System is required to use the HMS.
The HMS is used to administrate and analyze the measured blood pressure measurement data. These measurement values are then assigned to the patient. Each patient is not limited to one measurement series. Each measurement series consists of numerous individual values.
In general the following steps are run through:
Before measurement: Preparing the measurement
1. Start the HMS.
2. Select existing patient or create new patient.
3. Pair the ABPM 7100 to the HMS.
4. Prepare the ABPM 7100 for measurement.
5. Exit the HMS.
7 - Installing the software
After measurement: Process measurement data
1. Start the HMS.
2. Pair the ABPM 7100 to the HMS.
3. Transfer the measurement results from the ABPM 7100.
4. Analyze the measurement results.
5. Exit the HMS.
Installing the software
The HMS is able to communicate with the ABPM 7100 via the following connections:
USB interface cable
Bluetooth® USB adapter
Note Please insert only the Bluetooth® USB adapter or USB interface cable into the computer after the HMS has been installed or when you are prompted to do so.
Provisions for “Cyber Security”
Attention
For provisions of Cyber Security, the following should be observed for the safety of the HMS software
Do not activate a guest account on the computer.
Use the database export function for regular backups. The HMS does not provide automatic backups.
Regularly update your operating system, firewall and antivirus software.
Do not use Operating Systems for which support has been discontinued.
Ensure that only authorized personnel have access to your computer.
System requirements
1. Computer
1 GHz
512 MB RAM
100 MB Hard Disk Storage
1024 x 768 Pixels
Two spare USB Ports
2. Operating System
Windows® Vista, Windows® 7, Windows® 8, Windows® 8.1 (32-bit & 64-bit)
Macintosh® OS X 10.7.5 and above (64-bit)
Linux® Ubuntu 14.04 and above (64-bit)
3. Software
Java-Runtime-Environment (JRE is contained on the installation CD)
4. Bluetooth®
Bluetooth® USB adapter
Bluetooth® 2.0
USB version 1.1 and above
BlueSoleil driver or software must not be installed
8 - Installing the software
Installation for Windows®
The directions for use are located in the docs folder on the installation CD. Available documents are clearly displayed via index.htm.
Procedure:
The individual steps are explained in more detail below:
A. Installing the HMS from CD.
B. If required install drivers from the CD in the following sequence:
1. Bluetooth® driver
2. USB driver
C. Insert the USB interface cable and/or the Bluetooth® adapter into the computer.
Installing the HMS from CD
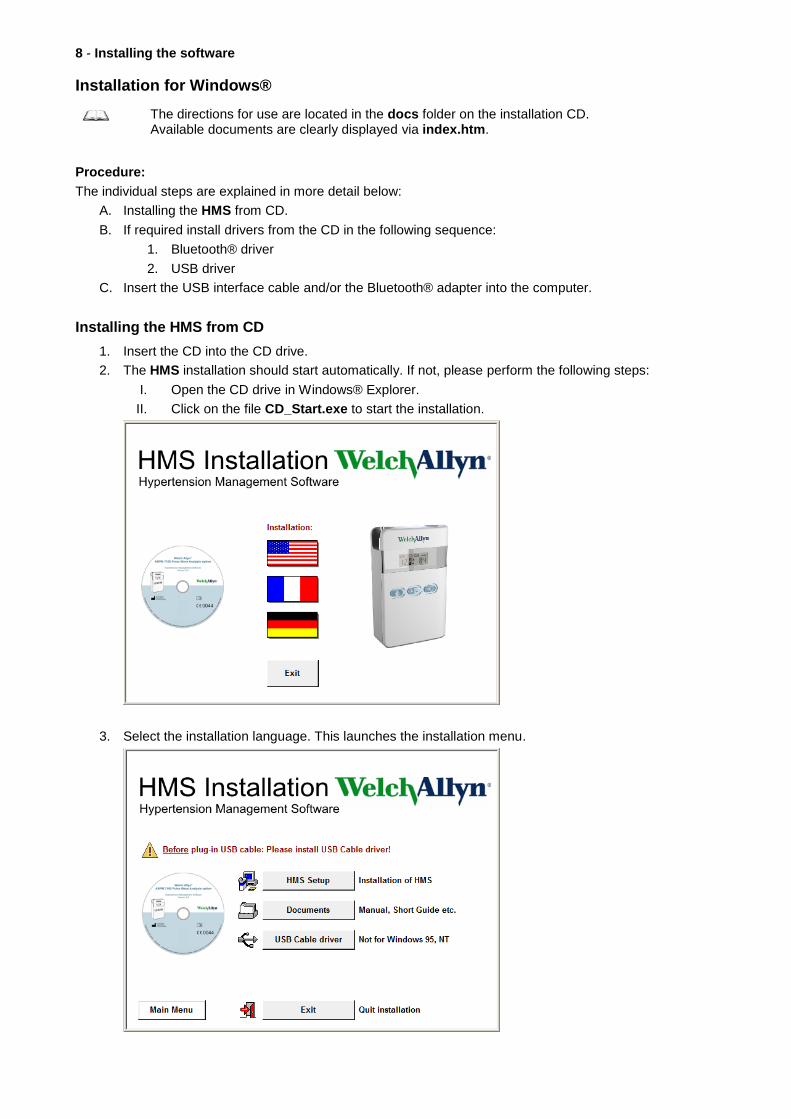
1. Insert the CD into the CD drive.
2. The HMS installation should start automatically. If not, please perform the following steps:
I. Open the CD drive in Windows® Explorer.
II. Click on the file CD_Start.exe to start the installation.
3. Select the installation language. This launches the installation menu.

9 - Installing the software
4. Click on HMS Setup. The installation wizard appears.
5. Select a language and click on OK.
6. Follow the instructions on the screen.
Installation for Macintosh® OS X 10.7.5 and above
Procedure:
A. Installing the application from CD ROM.
B. Insert the USB adapter and/or the Bluetooth® adapter into the computer.
Installing the application from CD ROM
1. Place the provided CD into your CD ROM drive.
The Desktop will display the CD symbol for HMS.
2. Double-click on this CD symbol for HMS. CD-ROM will open.
3. Open the directory Mac_10-7-5.
4. Move the file HMS.app to your program directory.

10 - Installing the software
Installation for Linux®
Procedure:
A. Installing the application from CD ROM.
B. Insert the USB adapter and/or the Bluetooth® adapter into the computer.
Installing the application from CD ROM
1. Log on as system administrator (root).
2. Place the provided CD into your CD ROM drive.
3. Open the directory Linux® on the CD.
4. Copy the folder HMS into the Home Directory.
5. Set the file HMS as executable in the Home Directory.
6. Create a desktop shortcut to the file HMS.
Installing the Bluetooth® driver
No driver is required for the Bluetooth® USB adapter DIGITUS (applicable from Windows® XP SP2 and above).
Installing the USB driver
1. In the installation menu, click USB Cable Driver.
2. Follow the instructions displayed on the screen.

11 - Starting and exiting the HMS
Starting and exiting the HMS
Starting the HMS
Double-click the icon on the computer desktop to start the HMS. Information on the loading progress (e.g. program version, progress bar) is displayed.
Exiting the HMS
Click the icon on the application window top toolbar. If any data have been previously changed, the HMS will prompt the user if those changes should be saved. Information on the quitting progress is displayed.
Structure of the HMS application window
All functions can be accessed from the application window. Depending on function, additional windows may appear.
Functions can be called up from the menu bar at the top of the window. The toolbar below the menu bar contains buttons (icons) for the individual processing steps. The main working area contains three tabs:
1. Patient information
2. Blood Pressure
3. Pulse wave analysis
Menu bar
The menu bar is located at the top of the application window.

12 - Structure of the HMS application window Below shows the functions summary for each item:
File menu
Menu item Function
Patient list Display a list with previously created patients.
New patient Create a new patient.
Import Import patient data.
Back up data Database back-up and recovery. (Attention: During recovery, the current database is replaced by the backed up database - risk of possible data loss)
Audit trail Record all changes to patient data.
Quit program Exits HMS.
Patient menu
Menu item Function
Delete Delete currently processed patients including all measurement data.
Export Manually export a patient’s data.
Change ID Change the patient number of the currently processed patient.
Discard changes Reverse changes made to a currently opened patient file.
Measurement Series menu
Menu item Function
Export (Excel) Save the currently selected measurement series to an Excel file.
Export (XML) Save the currently selected measurement series to an XML file.
Export (GDT) Save the currently selected measurement series to a GDT file.
Delete Delete the currently selected measurement series.
Settings menu
Menu item Function
Database Configure the database.
Language Specify the language for the program.
Port settings Specify the port to the measurement device.
Blood pressure limits Specify limit values for analysis.
Analysis Specify the settings for the analysis.
Colors Specify colors for curves and diagram backgrounds.
Format Specify calculation, display and Bluetooth® procedures.
PWA/CBP Activation Activate PWA Measurement (PWA).
GDT settings Specify file and directory settings for GDT import / export.
About menu
Menu item Function
Display information on the HMS version.

13 - Structure of the HMS application window
Toolbar
The toolbar is located below the menu bar at the top of the application window. It contains buttons (icons) used to call up important functions quickly. The current patient’s name and date of birth are displayed on the right.
Tip If you use the mouse to hover over a symbol, a brief tooltip will appear.
Symbol Meaning Function
New patient Create a new patient.
Patient List Display a list with previously created patients.
Prepare device Prepare the ABPM 7100 for the next measurement.
Upload device Transfer out measurement values from the ABPM 7100.
Bluetooth®
red: Bluetooth® not active.
green: Bluetooth® active.
Quit program Exits HMS.
Note You can also access some of these functions via the menu bar.
Activating Pulse Wave Analysis (PWA)
Apart from the 24-hour blood pressure measurement, the ABPM 7100 also has an integrated pulse wave analysis function (PWA). This function can only be unlocked after a device upgrade with a 16 digit license key that is unique to the ABPM 7100 device serial number. Please consult Welch Allyn on device upgrading.
1. Start the HMS.
2. In the Settings menu, click PWA/CBP Activation.

14 - First steps with the sample patient
3. Click Yes.
4. The HMS will then prompt the user to enter the 16 digit license key. Enter the 16 digit license key and click Send.
5. Click OK to confirm.
First steps with the sample patient
Once you have successfully installed the HMS software, the HMS may be tested with the sample patient John Doe.
Displaying the patient
1. Start the HMS by double-clicking the icon located on the computer desktop. The application window will appear.
2. In the toolbar, click the Patient List icon to display the following window:

15 - First steps with the sample patient
3. Select the John Doe entry and the click Open patient.
Tip Double-click on the patient you selected and the application window will display the patient information.
The patient’s name and date of birth will be displayed on the top right of the application window. The Patient Information tab features several areas: Address, Patient data, Emergency contacts, Medical history, Medication and Blood pressure limits.
Displaying the patient’s measurement data
1. Click the Blood Pressure tab and a list of previous measurements will be shown on the left.

16 - Editing patient information
2. Click to select a measurement. The respective measurement data is then displayed. Highlighted measurement values are values exceeding the specified limit values.
3. For additional analyzes, click the required analysis tab.
Tip If you use the mouse to hover over a symbol, a brief tooltip will appear.
The toolbar with the analysis tabs
Descriptions on the analysis options are detailed in the Analyzing the measurement chapter.
Editing patient information
Patient information is stored in a database. You can
create new patients,
edit patients data by clicking onto the respective field,
import already available patient information from other databases.
Note Patient information can always be edited once it has been created.
Creating new patients
In the toolbar, click the New Patient icon to display the following window:
Patient ID, Last Name and Date of birth are mandatory fields (these information serve as criteria for sorting or searching), all other information are optional.
Tip Use the tab key to jump from one field to the next.

17 - Editing patient information
To save the new patient, click Save.
To discard the new patient, click Cancel. Either option will return back to the application window.
The Patient Information tab displays several areas: Address, Patient data, Emergency contacts, Medical history, Medication and Blood pressure limits.
Selecting existing patients
Select a patient from the patients list previously created in the HMS to
view their previous measurements,
prepare the ABPM 7100 for this patient,
transfer the measurement values from the ABPM 7100 to the HMS.
In the toolbar, click the Patient List icon to display the list of previously created patient entries.
Click to select the appropriate entry and then click Open patient.

18 - Editing patient information To search for a patient follow the steps below:
1. Enter the last name, first name or patient ID in the search field at the top right. The HMS will search the database and display the detected patients.
2. Click to select the appropriate entry and the click Open patient.
3. The HMS returns to the application window.
If the required patient cannot be found, click New patient to create a new patient entry.
Modifying patient data
To modify an address and/or patient data, enter the new information in the respective fields.
1. To add Emergency contacts, Medical history and Medication, click New entry.
2. Enter the new information into the respective popup window.
3. Click Save to save the new data.
4. The window closes.
Changing the Patient ID
1. In the menu bar, click Patient then Change ID to display the following window with the current patient’s ID shown.
2. Change the patient’s ID.
3. Click Save to save the change.
Blood pressure limits
1. In the Patient Information tab, click on the field Blood pressure limits.
2. Specify the blood pressure limits for the current selected patient in the open editing window. If any measurement results exceed the limit values, the respective results will be marked accordingly in the analysis.
Deleting a patient
1. In the menu bar, click Patient then Delete.
2. Click Yes to confirm.
3. The current selected patient’s information is deleted together with all measurement data.
Audit Trail
In the menu bar click File and then Audit trail to display all changes in the patient master data.

19 - Working with the ABPM 7100
Working with the ABPM 7100
Pairing via cable
Before 24-hour measurement:
When using the ABPM 7100 with cable connection, perform the following steps:
Pairing the computer to the ABPM 7100 via the USB interface cable
On the ABPM 7100:
1. Ensure that the ABPM 7100 is powered off.
2. Insert the USB interface cable into the computer’s USB port.
3. Insert the USB interface cable plug into the data port at the bottom of the ABPM 7100.
Note The red dot on the plug must align with the red dot on the data port.
4. Switch on the ABPM 7100. The letters “co” will appear on the display.
Configuring the interface between the ABPM 7100 and the HMS
Setup conditions:
The ABPM 7100 is connected to the computer.
Both the ABPM 7100 and the computer are switched on.
On the computer:
1. Start the HMS. If the HMS is set appropriately, the Patient List window will appear. In this case select a patient.
2. In the menu bar, click Settings and then Port settings.
3. In the Port settings window, click the Serial/USB tab.
Preparing the ABPM 7100 for 24-hour measurement
Setup conditions:
The ABPM 7100 is connected to the computer.
Both the ABPM 7100 and the computer are switched on.

20 - Working with the ABPM 7100
Note Always use fully charged batteries for a new measurement. Ensure the correct polarity when inserting the batteries.
On the computer:
1. Start the HMS.
2. Select a patient.
3. In the toolbar, click the Prepare device icon to display the following window:
4. Specify the protocol for 24-hour measurement.
5. Click Set clock on device.
6. Click Send Patient ID.
7. Click Send and activate.
8. Click Close.
9. In the toolbar, click to quit the HMS.
On the ABPM 7100:
10. Switch off the ABPM 7100.
11. Disconnect the cable by removing the plug from the data port.
Starting 24-hour measurement
On the ABPM 7100:
You need to perform the steps described below to connect the computer to the ABPM 7100. Please read the directions for use for the ABPM 7100 up to the chapter Measurement Process.
After 24-hour measurement
When using the ABPM 7100 with cable connection, perform the following steps:
Note If the battery voltage in the measurement device is insufficient for a 24-hour measurement, the following warning will appear.

21 - Working with the ABPM 7100
Connecting the computer to the ABPM 7100 via cable after a 24-hour measurement
After 24-hour measurement, transfer the data from the ABPM 7100 to the HMS.
1. Ensure the ABPM 7100 is powered off.
2. Remove the ABPM 7100 from the patient (remove the cuff and disconnect the ABPM 7100).
3. Connect the ABPM 7100 to the computer using the USB interface cable:
a. Insert the USB interface cable into the computer’s USB port.
b. Insert the USB interface cable plug into the data port at the bottom of the ABPM 7100.
Note The red dot on the plug must align with the red dot on the data port.
4. Switch on the ABPM 7100.
5. The letters “co” will be displayed on the ABPM 7100 LCD.
For further information on your ABPM 7100 please refer to the directions for use of the ABPM 7100.
Transferring 24-hour measurement values out from the ABPM 7100
Ensure the ABPM 7100 is connected to the computer and both the ABPM 7100 and the computer are switched on.
On the computer:
1. Start the HMS.
2. In the toolbar, click the Patient List icon to display the Patient List window.
3. Select a patient.
4. In the toolbar, click the Upload device icon. The HMS will prompt the user: “Assign measurement results to patient with patient ID XXX?”
5. Click Yes. The HMS will prompt the user: “Delete Patient ID and measurement results from the ABPM 7100?”
Note Normally the measurement results from the ABPM 7100 are deleted once the results are transferred out. When preparing the ABPM 7100 for a “new” patient, the HMS will indicate any existing measurement results remaining in the ABPM 7100 from a previous patient.
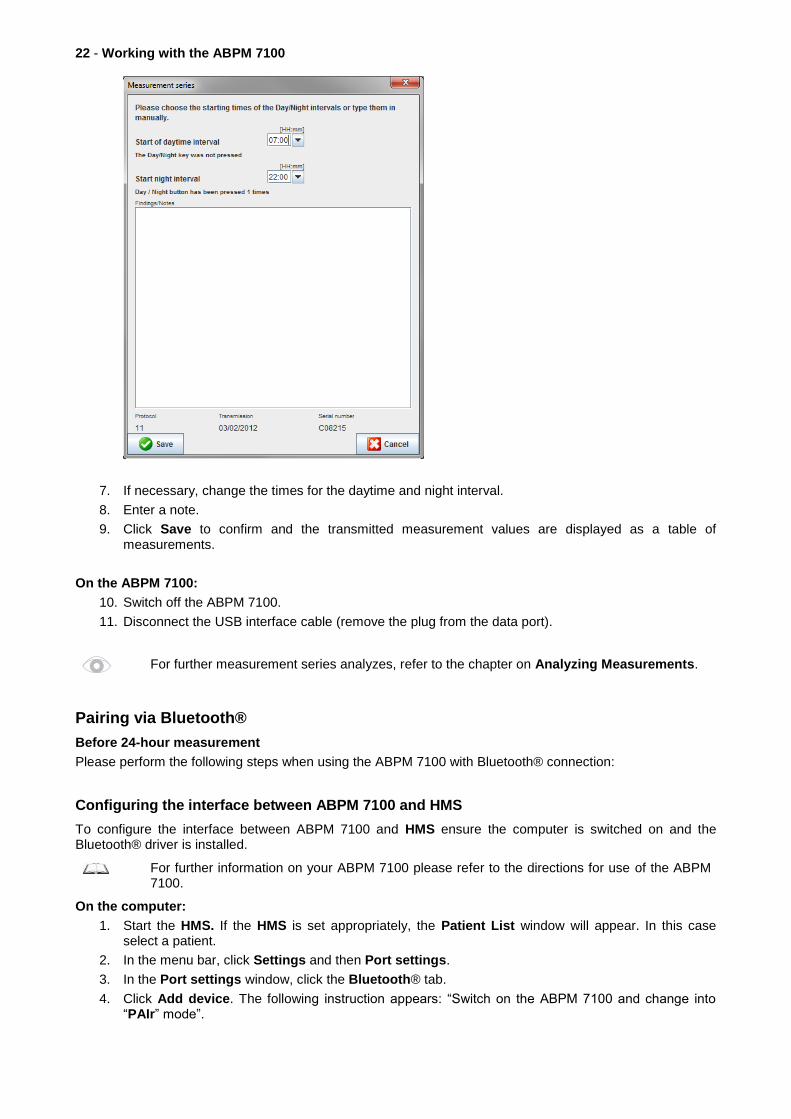
6. Click Yes to delete the measurements results or click No to keep the measurement results on the ABPM 7100. The Measurement series window appears.
22 - Working with the ABPM 7100
7. If necessary, change the times for the daytime and night interval.
8. Enter a note.
9. Click Save to confirm and the transmitted measurement values are displayed as a table of measurements.
On the ABPM 7100:
10. Switch off the ABPM 7100.
11. Disconnect the USB interface cable (remove the plug from the data port).
For further measurement series analyzes, refer to the chapter on Analyzing Measurements.
Pairing via Bluetooth®
Before 24-hour measurement
Please perform the following steps when using the ABPM 7100 with Bluetooth® connection:
Configuring the interface between ABPM 7100 and HMS
To configure the interface between ABPM 7100 and HMS ensure the computer is switched on and the Bluetooth® driver is installed.
For further information on your ABPM 7100 please refer to the directions for use of the ABPM 7100.
On the computer:
1. Start the HMS. If the HMS is set appropriately, the Patient List window will appear. In this case select a patient.
2. In the menu bar, click Settings and then Port settings.
3. In the Port settings window, click the Bluetooth® tab.
4. Click Add device. The following instruction appears: “Switch on the ABPM 7100 and change into “PAIr” mode”.

23 - Working with the ABPM 7100
On the ABPM 7100:
5. Switch on the ABPM 7100.
6. Switch the ABPM 7100 into Pairing mode:
i. Press and hold and then press .
ii. Keep pressed until the letters “PAIr” start flashing on the LCD display.
iii. Press . “PAIr” stops blinking and the buzzer sounds.
On the computer:
7. Click OK. The Bluetooth® device search appears. After a moment the serial number of the ABPM 7100 (e.g. WSTXXX) appears in the application window.
8. Click the serial number.
9. Click Pairing. The following message appears: “Pairing successful”.
10. Click OK to confirm and the Device Connection window appears.
11. Click Save.
On the ABPM 7100:
12. The buzzer sounds.
On the computer:
13. The measurement device appears in the Port settings window on the Bluetooth® tab. Click Save.
On the ABPM 7100:
14. Switch off the ABPM 7100.
The Bluetooth® interface between the ABPM 7100 and the HMS is now configured. From now on, the HMS will recognize the ABPM 7100 as soon as the ABPM 7100 is in communication mode “bt”.
Preparing the ABPM 7100 for 24-hour measurement
Ensure the ABPM 7100 is switched off and the computer is switched on. The interface between ABPM 7100 and the HMS must already be configured.
For further information on your ABPM 7100 please refer to the directions for use of the ABPM 7100.
On the ABPM 7100:
1. Switch on the ABPM 7100.
On the computer:
2. Start the HMS.
3. In the toolbar, a green Bluetooth® icon signals the active Bluetooth® connection.
4. Select a patient.
On the ABPM 7100:
5. Press and hold and then press .
6. Press . The letters “bt” flash on the display.

24 - Working with the ABPM 7100
7. Press . “bt” no longer flashes and the buzzer sounds.
On the computer:
8. The Device Action window appears.
On the ABPM 7100:
9. The buzzer sounds twice.
On the computer:
10. Click Prepare device to display the Prepare device window.
Note If the battery voltage in the measurement device is insufficient for a 24-hour measurement, the following warning will appear.
Note Before use, make sure that any previous measurement results stored in the ABPM 7100 are deleted to avoid incorrect value assignment. You can also delete measurement values manually on the device, please refer to the ABPM 7100 directions for use.
11. Specify the protocol for 24-hour measurement.
12. Click Set clock on device.
13. Click Send Patient ID.
14. Click Send and activate.
15. Click Save.
On the ABPM 7100:
16. The buzzer sounds
17. The letters “bt End” flash in the LCD display, followed by the time.
On the computer:
18. In the toolbar, click to exit the HMS.
Starting 24-hour measurement
Ensure the ABPM 7100 is switched on.
For further information on your ABPM 7100 please refer to the directions for use of the ABPM 7100.
On the ABPM 7100:
1. Set up the ABPM 7100 on the patient (position the cuff and connect it to the ABPM 7100).
2. Press for manual measurement to ensure that the ABPM 7100 is functional.
3. Wait for the first manual measurement to be completed. If the measurement is acceptable, the patient can leave. A successful measurement is required for protocol activation.

25 - Working with the ABPM 7100
After 24-hour measurement
Please perform the following steps when using the ABPM 7100 with Bluetooth® connection:
1. Ensure the ABPM 7100 is powered off.
2. Remove the ABPM 7100 from the patient (remove the cuff and disconnect the ABPM 7100).
Transferring out 24-hour measurement results from the ABPM 7100 via Bluetooth®
Ensure both the ABPM 7100 and the computer are switched on. The interface between ABPM 7100 and the HMS must already be configured.
On the computer:
1. Start the HMS.
2. In the toolbar, a green Bluetooth® icon signals the active Bluetooth® connection.
On the ABPM 7100:
3. Press and hold and then press .
4. Press . The letters “bt” flash on the display.
5. Press . “bt” stops flashing and the buzzer sounds. The Device Action window appears.
On the computer:
6. Click on Read-out of values. The HMS will prompt the user: “Assign measurement data to patient with patient ID XXX?”
7. Click Yes to confirm. After data transmission, the Measurement series window appears.
8. If necessary, change the times for the daytime and nighttime interval.
9. Click Save. The HMS will prompt the user: “Delete Patient ID and measurement data from measurement device?”
Note Normally the measurement results from the ABPM 7100 are deleted once the results are transferred. When preparing the ABPM 7100 for a “new” patient, the HMS will indicate any existing measurement results remaining in the ABPM 7100 from a previous patient.
10. Click Yes to delete the measurements results or click No to keep the measurement results on the ABPM 7100. The Measurement Series window appears.

26 - Preparing the ABPM 7100 for measurement
11. If necessary, change the times for the daytime and night interval.
12. Enter a note.
13. Click Save to confirm and the transmitted measurement values are displayed as a table of measurements.
On the ABPM 7100:
14. The buzzer sounds.
15. The letters “bt End” appear on the display, followed by the time.
16. Switch off the ABPM 7100.
For further measurement series analyzes, refer to the chapter on Analyzing Measurements.
Preparing the ABPM 7100 for measurement
Before performing a measurement on a patient, send via the HMS the information on the planned measurement to the ABPM 7100.
Ensure that the HMS has started and the ABPM 7100 is switched on and connected to the computer. The interface between the ABPM 7100 and the HMS must already be configured.
Please go through the following steps:
Specify the measurement protocol.
Set the ABPM 7100 clock.
Accept the patient ID.
Perform device tests.
Delete existing measurements.
Start 24-hour measurement.
1. Select a patient.
2. In the toolbar, click the Prepare device icon to display the following window.

27 - Preparing the ABPM 7100 for measurement
Setting the measurement protocol
The procedure for 24-hour measurement can be set here. In total 11 different protocols are provided. The protocols 1, 2, 10 and 11 can be adjusted individually.
Additionally, protocol 10 automatically sends measurement values to the doctor’s computer via Bluetooth® after measurement. It is recommended to use protocol 10 for monitoring at the doctor’s office.
Additionally, protocol 11 activates the Pulse Wave Analysis (PWA).
Selecting the protocol
1. In the protocol drop-down menu, click on the required protocol.
2. For protocols 1, 2, 10 and 11 under daytime and nighttime interval, determine the following:
The time frame (start of interval).
The number of measurements within the interval.
Whether the measurement values are displayed on the ABPM 7100 (measurement display value).
Whether an audible signal (buzzer) sounds during measurement.
Sending the protocol
1. Click Send and activate.
2. Click Yes to confirm.
Setting the ABPM 7100 clock
The computer’s time will be adopted by the ABPM 7100.
1. Click Set clock on device.
2. Click Ok to confirm and the ABPM 7100 displays the adopted time.
Transmitting the Patient ID
The patient ID of the selected patient should be saved in the ABPM 7100. When the 24-hour measurement values are transferred, the HMS will automatically recognize the patient.
1. Click Send Patient ID.
2. Click Ok to confirm.
Testing the ABPM 7100
Perform the following steps to ensure that the ABPM 7100 is fully functional.
1. Click Testing Device to display the following window.

28 - Preparing the ABPM 7100 for measurement
2. Click on the appropriate function keys.
3. Click Ok to confirm.
4. Click Close to complete the testing.
Deleting old measurements
The measurement results in the ABPM 7100 are usually deleted once they have been transferred to the computer. When preparing the ABPM 7100 for a “new” patient, the HMS will indicate any existing measurement results remaining in the ABPM 7100 from a previous patient.
To remove existing measurement results in the ABPM 7100:
1. Click Delete measurements.
2. Click Yes to confirm.
Completing ABPM 7100 preparation
1. Click Close and the Prepare device window disappears.
2. Disconnect the ABPM 7100 from the computer.
Exporting measurement results
Measurement results from a 24-hour measurement which has been transferred from the ABPM 7100 to the HMS for analysis can be stored in a file. With the help of this file, there is the option to transfer the measurement results into your patient management system.
1. Select a patient
2. In the application window, click on the Blood Pressure or Pulse wave analysis tab.
3. These tabs contain a list of previous measurements on the left.

29 - Analyzing the measurement
4. Click to select the measurement results to be exported.
5. In the menu bar, click Measurement series and then Export (Excel), (XML) and (GDT). The Export measurement series window appears.
6. Set the directory and name for the file.
7. Click Save.
Analyzing the measurement
Once the measurement values from the ABPM 7100 have been transferred and stored from the ABPM 7100 to the HMS, the following analyzes and functions are available for measurement analysis and are described in this chapter:
Tab Analysis
Measurements
Trends
Bar chart
Scatter Points
Exceeding norms
Frequency distribution
Summary
Hourly Intervals
Rise and Fall
Trends (PWA)
Amplification
1. Select the required patient.
2. In the application window, click on the Blood Pressure tab. The Blood Pressure tab contains a list of previous measurements on the left.

30 - Analyzing the measurement
3. Click on a measurement to display the associated table of measurements.
The highlighted values are measurement values exceeding the specified limit values.
4. To display additional analyzes, click on the required analysis tab.
Enter the results of the measurement series.
1. Double-click on the measurement and the Measurement series window appears.
2. Enter your notes.
3. Click Save to accept the notes and the Measurement series window disappears.

31 - Analyzing the measurement
The Measurements tab
The Measurements tab lists all measurement values of a measurement series in table format.
To display the table of measurements, click on the Measurements tab.
The highlighted values are measurement values exceeding the specified limit values.
To enter measurement notes:
1. Click onto the required line in the Notes column.
2. Enter your note.
3. Press the Enter key.
Excluding measurements:
If any outlier measurement value that would falsify a representative long-term analysis, it can be excluded.
Click onto the number of the respective column. The measurement disappears and the measurement value will be excluded from statistical analysis. To include the measurement values just click on the line again.
Printing the table of measurements:
Click the Print tab.
The Trends tab
These measurement values are graphically displayed in a diagram as a function of time:
Systolic values
Average Values
Diastolic Values
Heart rate

32 - Analyzing the measurement
To display the measurement values, click on the Trends tab.
The left y-axis with the unit mmHg applies to the systolic, diastolic and average values (blood pressure values).
The right y-axis with the unit bpm applies the heart rate.
The x-axis applies to the daytime. The four adjustable daytime intervals for measurements are highlighted. Manual measurements are marked with “M”.
The upper blood pressure limits (systolic, diastolic) are displayed as horizontal set point curves.
Note The blood pressure limits can be specified in the Patient Information tab in the Blood pressure limits section.
Showing and hiding the heart rate
Click the option field Hr.
Showing and hiding average values
Click the option field MAP.
Showing and hiding average values
In the drop-down field Hourly Intervals, click the required number of hours.
Battery Voltage
Select the option field Voltage. The battery voltage is displayed as a 24-hour curve parallel to the blood pressure.
Displaying individual values
1. In the diagram, click to select the desired time. A vertical line appears and the measurement values are displayed in a window. To see adjacent measurement values, move the mouse over the diagram. The vertical line follows the movement of the mouse and the respective values are displayed.
2. Click again to deactivate the display.

33 - Analyzing the measurement
Zooming into (enlarging) the diagram
Click onto the diagram and hold down the left mouse button and drag from the left to right to draw an enlargement section.
Zooming out (restore original size) of the diagram
Click onto the diagram and hold down the left mouse button and drag from the right to left to restore back to
the original size.
The Bar Chart tab
These measurement values are graphically displayed in a diagram as a function of time:
Systolic values
Average Values
Diastolic Values
Heart rate
To display the measurement values, click on the Bar Chart tab.
The left y-axis with the unit mmHg applies to the systolic, diastolic and average values (blood pressure values).
The right y-axis with the unit bpm applies the heart rate.
The x-axis applies to the daytime. The four adjustable daytime intervals for measurements are highlighted. Manual measurements are marked with “M”.
The upper blood pressure limits (systolic, diastolic) are displayed as horizontal set point curves.
Note The blood pressure limits can be specified in the Patient Information tab in the Blood Pressure Limits section.
Zooming into (enlarging) the diagram
Click onto the diagram and hold down the left mouse button and drag from the left to right to draw an enlargement section.

34 - Analyzing the measurement Zooming out (restore original size) of the diagram
Click onto the diagram and hold down the left mouse button and drag from the right to left to restore back to
the original size.
The Scatter Points tab
This diagram shows the correlation between systolic and diastolic blood pressure. Each point corresponds to one measurement.
To display the correlation, click on the Scatter Points tab.
The y-axis applies to diastolic values.
The x-axis applies to systolic values.
Blood pressure limits are displayed as horizontal (systolic) and vertical (diastolic) set point curves.
Note The blood pressure limits can be specified in the Patient Information tab in the Blood Pressure Limits section.
Showing and hiding Total / Day / Night measurements
Use the drop-down field on the bottom left to display the required measurement (total, day, night).
The Exceeding norms tab
The values of a measurement series are analyzed according to specified blood pressure limits. Various pie charts show the percentages of acceptable, exceeded and normal measurement values.
Note The blood pressure limits can be specified in the Patient Information tab in the Blood Pressure Limits section.

35 - Analyzing the measurement
To display the exceeded limit values, click the Exceeding norms tab.
The Frequency Distribution tab
Frequency distributions of systolic and diastolic measurement values, as well as heart rate, are displayed as histograms. Each bar diagram contains the proportional percentages of 10 units, i.e. 80-89, 90-99 etc.
To display the frequency distribution, click on the Frequency distribution tab.
36 - Analyzing the measurement Selecting measurement values for analysis
Use the drop-down field on the bottom left to display the required measurement (total, day, night). In the display for day and night, vertical lines indicate blood pressure limits.
Note The blood pressure limits can be specified in the Patient Information tab in the Blood pressure limits section.
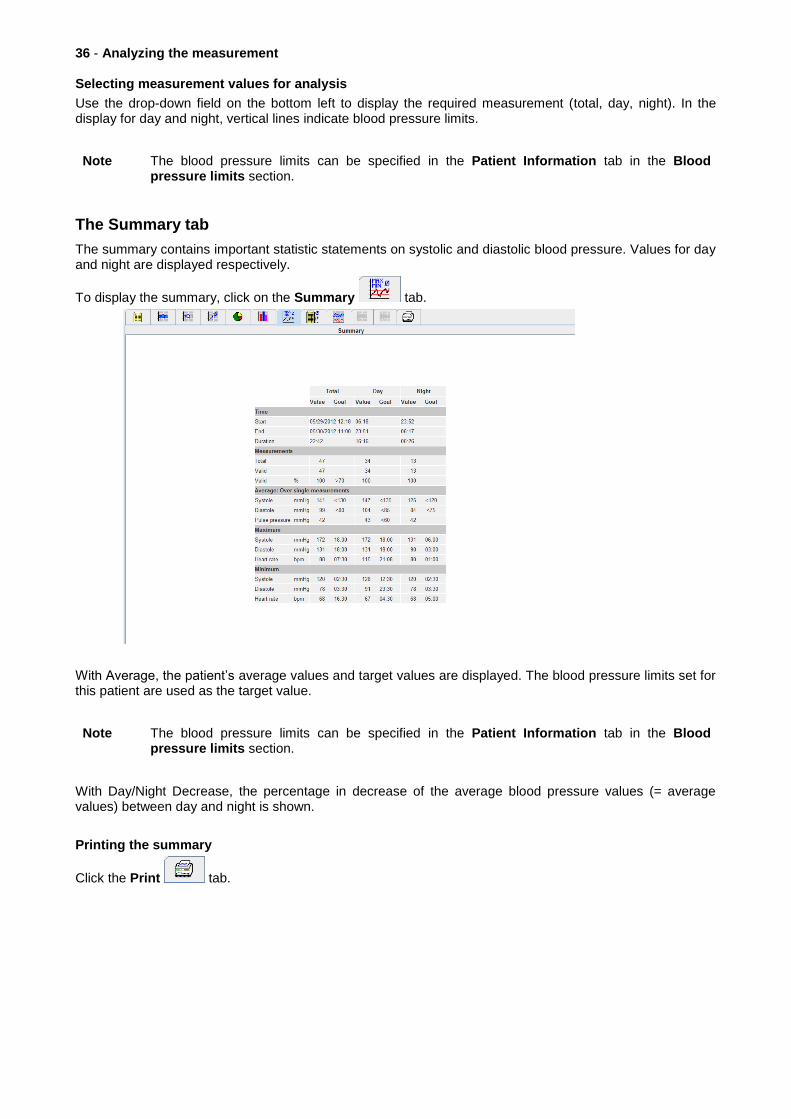
The Summary tab
The summary contains important statistic statements on systolic and diastolic blood pressure. Values for day and night are displayed respectively.
To display the summary, click on the Summary tab.
With Average, the patient’s average values and target values are displayed. The blood pressure limits set for this patient are used as the target value.
Note The blood pressure limits can be specified in the Patient Information tab in the Blood pressure limits section.
With Day/Night Decrease, the percentage in decrease of the average blood pressure values (= average values) between day and night is shown.
Printing the summary
Click the Print tab.

37 - Analyzing the measurement
The Hourly Intervals tab
Displaying hourly average values
This analysis lists all hourly average blood pressure and pulse values in table form.
To display the hourly average values, click on the Hourly Intervals tab.
Editing the calculation basis for hourly intervals
Click the required hours (1, 2, 3, 4, 6, 8) in the drop-down field Base of mean value (h). Time intervals are displayed in the left “Time” column. The average hourly value is recalculated.
Printing hourly intervals
Click the Print tab.
The Rise and Fall tab
This analysis is used to monitor the increase in morning blood pressure. These measurement values are graphically displayed in a diagram as a function of time:
Systolic values
Average values
Diastolic values
Heart rate
To display the rise and fall in blood pressure, click the Rise and Fall tab.

38 - Analyzing the measurement
The left y-axis with the unit mmHg applies to the systolic, diastolic and average values (blood pressure values).
The right y-axis with the unit mmHg/h applies to the change in blood pressure.
The x-axis applies to the time. Intervals for increases in morning blood pressure are highlighted.
The bottom curve displays the smoothened course of blood pressure. Blood pressure data of the average blood pressure are transformed into the frequency range by Fourier analysis.
High frequencies are neglected, resulting in the displayed curve after inverse Fourier transformation. It shows the positive blood pressure change (mmHg/h) for periods of blood pressure increase and the negative change during periods of blood pressure decrease.
The red vertical lines mark the beginning and end (=duration) of the early-morning blood pressure increase and the time and extent of the maximum increase.
The upper blood pressure limits (systolic, diastolic) are displayed as horizontal set point curves.
Note The blood pressure limits can be specified in the Patient Information tab in the Blood pressure limits section.
Displaying individual values
In the diagram, click the desired time. A vertical line appears and the measurement values are displayed in a window. To see adjacent measurement values, move the mouse over the diagram. The vertical line follows the movement of the mouse and the respective values are displayed.
Click again to deactivate the display.
Zooming into (enlarging) the diagram
Click onto the diagram and hold down the left mouse button and drag from the left to right to draw an enlargement section.
Zooming out (restore original size) of the diagram
Click onto the diagram and hold down the left mouse button and drag from the right to left to restore back to the original size.

39 - Analyzing the measurement
The Trends (PWA) tab
This analysis shows you the course of the PWA over 24 hours with a preset protocol 11. These following values are graphically displayed in a diagram as a function of time in the measurement series in addition to the blood pressure values and the pulse: Central blood pressure, Aix@75 [90% CI], Cardiac output [HMV], and Peripheral resistance.
1. To display the course of the above-mentioned values, click on the Trends (PWA) tab.
2. To display an individual PWA, click on the Measurements tab.
3. Click to select a value in the table and the following window will appear displaying further details:
This displays the PWA in the same way as an individual PWA performed at the doctor’s office.

40 - Analyzing the measurement
The Amplification tab
This analysis is used to monitor the variation of the difference between central and peripheral blood pressure values. The blue area indicates the difference between peripheral and central systolic values during the daytime and the grey area indicates the difference between peripheral and central diastolic values during the daytime.
The Print tab
The print function allows you to print out specific analyzes.
To print, click the Print tab.
Click the analyzes to be printed out.
Click . The Print window appears.

41 - Monitoring at the doctor’s office
Comparing several measurement results
If more than one measurement results are saved under one patient, it is possible to compare these results. Depending on the analysis, diagrams of individual measurement results are displayed in a list or the values are accumulated and graphically displayed.
Selecting and comparing several measurement results
1. Click on the first measurement result to highlight the measurement.
2. Hold the “ctrl” (or “command”) key and click on other required measurement results to highlight them.
3. Click on the required analysis tab.
Example: Comparing the bar charts of two measurements
Monitoring at the doctor’s office
The ABPM 7100 can be carried by the patient in the doctor’s office, e.g. in the waiting room, and the measurement series is transferred directly via Bluetooth® to a computer at the doctor’s office. Each measurement can be analyzed by the doctor immediately.
You can use the office monitoring to subject the patient to a narrow short-term control scan.
Attention The system does not claim to have alarm functions.
Preparing the ABPM 7100 for monitoring at the doctor’s office
For office monitoring the Bluetooth® interface of the ABPM 7100 must be used.

42 - Monitoring at the doctor’s office
1. Select “Protocol 10” for office monitoring.
2. Select “Time Interval, 30, 20, 15, 12… measurements per hour”.
Note For further information on the ABPM 7100 please refer to the directions for use of the ABPM 7100.
3. Attach the ABPM 7100 on the patient. Position the cuff and connect it to the ABPM 7100.
4. Tick “Bluetooth active”.
5. To ensure that the ABPM 7100 works as required, press to start a manual measurement. A successful measurement is required for protocol activation.
6. Wait for the first automatic measurement to be completed.
Assigning received measurement results
1. After the first measurement, the icon will appear in the toolbar. Click on this icon.
2. The Office Monitoring window appears.
3. Click on assign. The Selection window appears.
4. Here you can assign the measurement results to either the current open patient or to another patient from the patient list.

43 - Pulse Wave Analysis (PWA)
Pulse Wave Analysis (PWA)
Apart from the 24-hour blood pressure measurement, the HMS in connection with the ABPM 7100 also has an integrated pulse wave analysis system (PWA). This function can be unlocked with a valid PWA license key. Please consult Welch Allyn on device upgrading.
The pulse wave analysis is based on the concept that the arterial blood pressure curve contains haemodynamic information that exceeds peripherally measured blood pressure values. This is used to analyze all information on the central aortic pulse wave. The following values are emitted:
Central blood pressure
Central pulse pressure
Augmentation pressure
Augmentation Index
Aix@75 [90% confidence interval]
Cardiac output [HMV]
Peripheral resistance
Reflection coefficient
Pulse Wave Velocity [PWV]
Performing PWA at the doctor’s office
Pulse wave analysis is performed at the doctor’s office via the Bluetooth® interface of the ABPM 7100.
1. Position the cuff on the patient and connect the cuff to the ABPM 7100.
2. Switch on the ABPM 7100.
3. Select an existing patient or create a new patient in the HMS. By default, the PWA measurement is always assigned to the current patient on the screen.
Note The patient’s age, height and weight must be entered into the HMS prior to perform PWA measurement.
4. Connect the ABPM 7100 to the HMS via Bluetooth®.
5. Then select PWA Measurement to call up the PWA measurement window.
44 - Pulse Wave Analysis (PWA)
6. Click OK to start the measurement.
7. Click Save once all measurement steps associated with PWA have been successfully completed.
Performing 24-hour PWA
In order to perform 24-hour PWA, the ABPM 7100 must be upgraded with a valid PWA license key and the HMS software version must either be 5.0 and above.
When preparing the ABPM 7100 to perform a 24-hour PWA measurement, select protocol 11.
Once the ABPM 7100 is prepared with protocol 11, regular blood pressure measurement is performed at the preset intervals. After which, a PWA is additionally performed with the ABPM 7100 reinflates to record the pulses at diastolic pressure.
Transferring and analyzing 24-hour PWA measurement results
For transferring and analyzing of the 24-hour PWA measurement results perform the same steps as with the regular 24-hour ABPM.
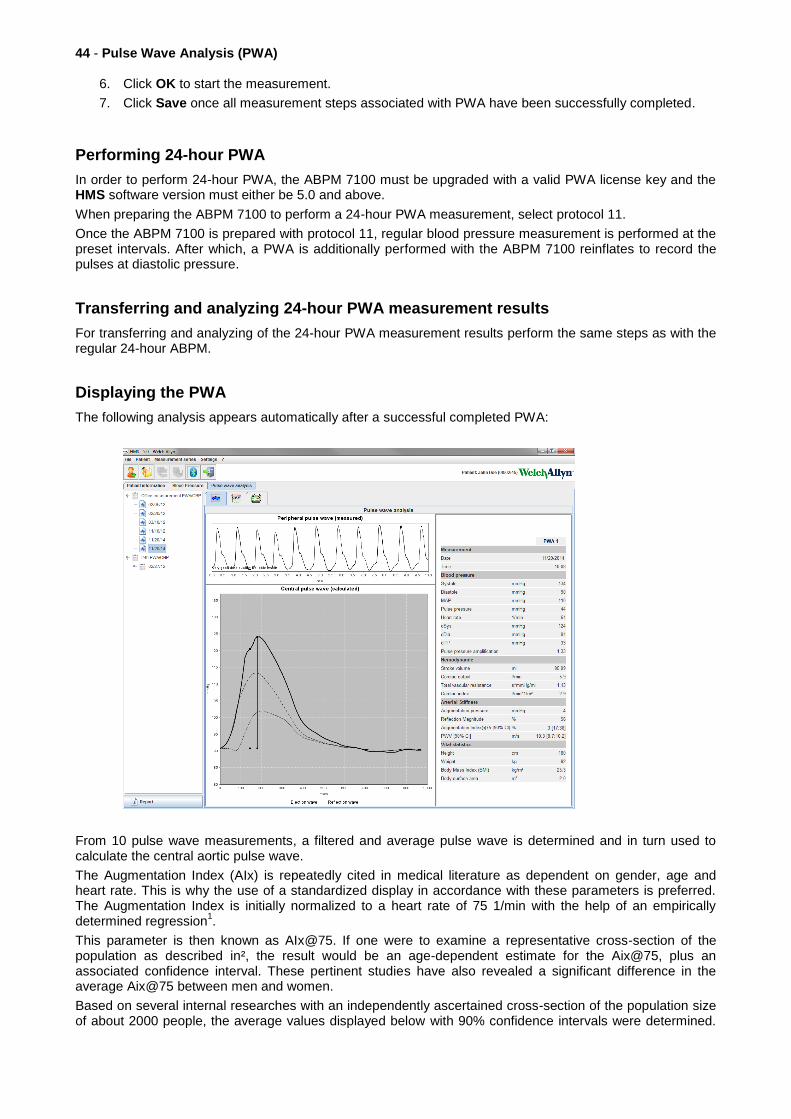
Displaying the PWA
The following analysis appears automatically after a successful completed PWA:
From 10 pulse wave measurements, a filtered and average pulse wave is determined and in turn used to calculate the central aortic pulse wave.
The Augmentation Index (AIx) is repeatedly cited in medical literature as dependent on gender, age and heart rate. This is why the use of a standardized display in accordance with these parameters is preferred. The Augmentation Index is initially normalized to a heart rate of 75 1/min with the help of an empirically determined regression
1.
This parameter is then known as AIx@75. If one were to examine a representative cross-section of the population as described in², the result would be an age-dependent estimate for the Aix@75, plus an associated confidence interval. These pertinent studies have also revealed a significant difference in the average Aix@75 between men and women.
Based on several internal researches with an independently ascertained cross-section of the population size of about 2000 people, the average values displayed below with 90% confidence intervals were determined.

45 - Changing the default settings of the HMS
As with the previously discussed case studies, the independently ascertained measurements revealed an increase in the Aix up to the age of 55 years. Both genders then reached a plateau. The difference in Aix levels between the genders is between 8% to 10%. If measurement values exceed the gender and age-specific interval, further examinations in accordance with the European Treatment Guidelines for Hypertension³ are recommended in order to determine the reasons of the disorder.
[1] Wilkinson I.B. et al. Heart Rate Dependency of Pulse Pressure Amplification and Arterial Stiffness. American Journal of Hypertension 2002;15:24-30.
[2] Fantin F. et al. Is augmentation index a good measure of vascular stiffness in the elderly? Age and Ageing 2007; 36: 43-48.
[3] The Task Force for the Management of Arterial Hypertension of the European Society of Hypertension (ESH) and the European Society of Cardioprotocoly (ESC). 2007 Guidelines for the management of arterial hypertension. European Heart Journal 2007; 28: 1462-1536.
Changing the default settings of the HMS
The following settings for the HMS can be specified:
Analyzes:
– Blood pressure limits
– Basis of calculation
User interface:
– Language
– Colors
– Interfaces
– Database
– Bluetooth®
To change default settings of the HMS, click Settings in the menu bar and select the required function.
Database
Patient data and the associated measurement data are stored in a database. Here you can specify the information for access to the database. You can obtain further information from your Welch Allyn specialist.

46 - Changing the default settings of the HMS
1. In the menu bar, click Settings then Database. The Database window appears.
2. Enter the required information.
3. Click Save.
Changing the language
The user interface is available in various languages.
1. In the menu bar, click Settings then Language to display the Language window.
2. Select the required language from the drop-down field.
3. Once the modifications are completed, click Save to close the window.
Note For the new language to take effect, exit and restart the HMS.
Port settings
The interface to the following connections between the ABPM 7100 to the computer can be specified here:
Cable with USB interface
Bluetooth®
In the menu bar, click Settings then Port settings to display the Port settings window.
Specifying a serial / USB interface for the ABPM 7100
1. Click the Serial / USB tab.
2. Click Add device to display the Connection to the device window.
3. To search for a device, switch on the ABPM 7100.
4. Click Search. Detected devices will be displayed in the drop-down list. If no device is selected, a respective message will appear.
47 - Changing the default settings of the HMS
5. To add the device, click Save. The window disappears and the new device is displayed in the port settings list.
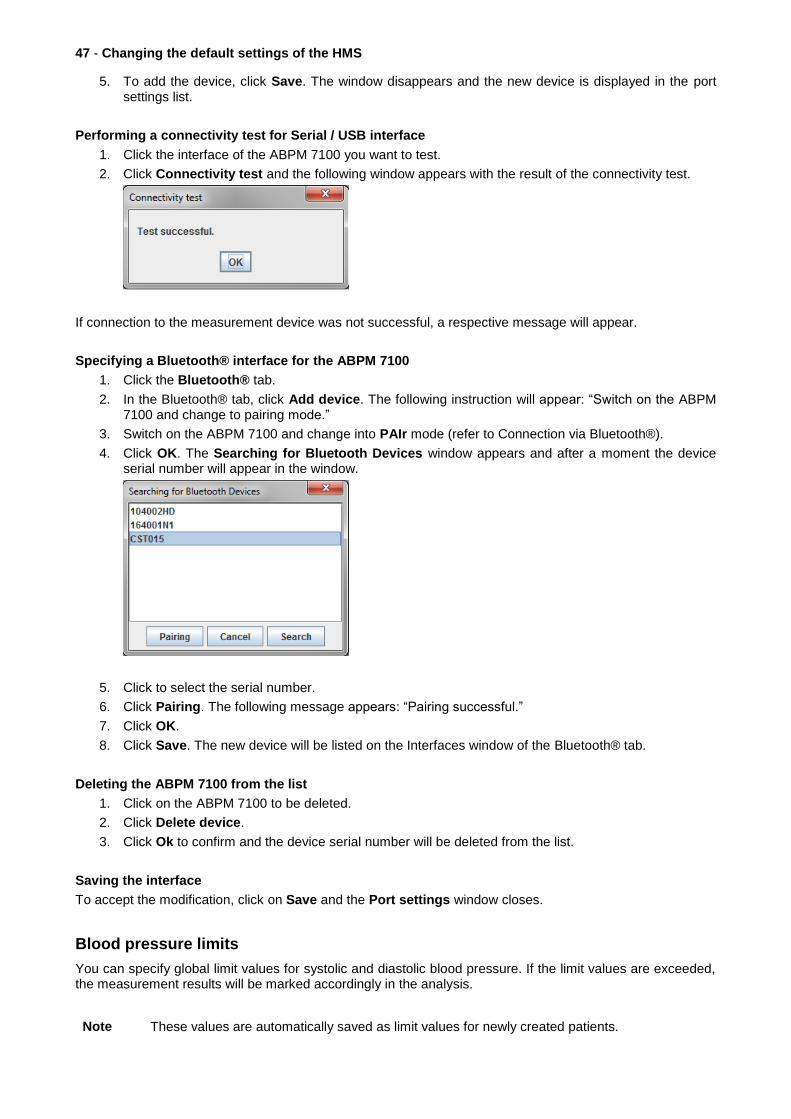
Performing a connectivity test for Serial / USB interface
1. Click the interface of the ABPM 7100 you want to test.
2. Click Connectivity test and the following window appears with the result of the connectivity test.
If connection to the measurement device was not successful, a respective message will appear.
Specifying a Bluetooth® interface for the ABPM 7100
1. Click the Bluetooth® tab.
2. In the Bluetooth® tab, click Add device. The following instruction will appear: “Switch on the ABPM 7100 and change to pairing mode.”
3. Switch on the ABPM 7100 and change into PAIr mode (refer to Connection via Bluetooth®).
4. Click OK. The Searching for Bluetooth Devices window appears and after a moment the device serial number will appear in the window.
5. Click to select the serial number.
6. Click Pairing. The following message appears: “Pairing successful.”
7. Click OK.
8. Click Save. The new device will be listed on the Interfaces window of the Bluetooth® tab.
Deleting the ABPM 7100 from the list
1. Click on the ABPM 7100 to be deleted.
2. Click Delete device.
3. Click Ok to confirm and the device serial number will be deleted from the list.
Saving the interface
To accept the modification, click on Save and the Port settings window closes.
Blood pressure limits
You can specify global limit values for systolic and diastolic blood pressure. If the limit values are exceeded, the measurement results will be marked accordingly in the analysis.
Note These values are automatically saved as limit values for newly created patients.

48 - Changing the default settings of the HMS In general, the blood pressure limit values established by World Health Organization (WHO) do NOT APPLY for children and adolescents between the ages of 3 to 18 years. Current studies (Blood Pressure percentiles by Age and Height from Nonoverweight Children and Adolescents in Germany, Neuhauser et al.: Pediatrics accepted Dec 10 2010) have shown that the limits in children and adolescents are dependent on their age and gender.
In 2010, the European Society for Hypertension (ESH) published extensive tables (Management of high blood pressure in children and adolescents: recommendations of the European Society of Hypertension, Lurbe et al.: Journal of hypertension accepted Jun 9 2009) on which the HMS limit values are based on. The limit values are determined according to the 95% percentile curve.
The threshold is defined by the value which is equivalent or lower than 95% of a collective cohort (statistical evaluation for 15.000 children).
Any value exceeding this limit is indicated as hypertension.
To have the percentile curve displayed for children and adolescents between the ages of 3 to 18 years, the patient’s date of birth must be entered, from which the HMS will calculate the patient’s age.
Note By default, the HMS analysis will always refers to the current age of the patient. In order to maintain a patient history, a printout must be created for each appointment. The blood pressure limits for an individual patient can be specified on the Patient Information tab.
Note The blood pressure limits for an individual patient can be specified on the Patient Information tab.
Specifying blood pressure limit values for analysis
1. In the menu bar, click Settings then Blood Pressure Limits to display the following window:
2. Enter the limiting values.
3. To accept the new limit values, click Save.

49 - Changing the default settings of the HMS
Analysis
In the menu bar, click Settings then Analysis to display the following window.
Various analysis settings can be selected:
Initial: An additional start interval for the four daytime intervals.
Static beginning: Start time of graphic displays.
With or without Day / Night button: Settings for the start times of the four daytime intervals.
Once the modifications are completed, click Save and the window closes.
Specifying colors for curves and diagram backgrounds
1. In the menu bar, click Settings then Colors to display the following window.
2. To change the colors, select the preferred color from the drop-down field.
3. Once the modifications are completed, click Save and the window closes.

50 - Changing the default settings of the HMS
Format
Here you can specify standard procedures for:
Average calculation (for all individual values or the hourly mean values, HM).
Calculation of the mean arterial pressure (measured MAP or calculated MAP).
The measurement value analysis to be displayed after the measurement data has been transmitted from the ABPM 7100 to the HMS (table of measurements or graphics).
Whether the patient list or an “empty” application window is displayed after the program starts.
Whether Bluetooth® is used.
1. In the menu bar, click Settings then Format to display the following window.
2. Specify the required settings.
3. Once the modifications are completed, click Save and the window closes.
GDT settings
Device Data Transfer (Gerätedatentransfer) is a data exchange format used by private-practices in the German healthcare system. The GDT interface serves system-independent data transmission purposes between medical measurement devices and an office IT.
The GDT settings are required for the automatic exchange of patient data between your office IT and HMS. If the settings are correct, the HMS can be started from your office software and patient data can be accepted directly.
In the menu bar, click on Settings then GDT Settings. The GDT Settings window appears.

51 - Changing the default settings of the HMS
Click Selection. Here you can specify the joint directory of the HMS and your office IT. HMS and office IT must have the same directory settings. The HMS program directory should preferably be set first.
In the field PMS -> HMS File, enter the name of the GDT file, which transmits the patient data of your office IT to the HMS. The same name must be set in the HMS and in your office IT.
In the field HMS -> PMS file, enter the name of the GDT file, which transmits the report of the HMS to your office IT. The same name must be set in the HMS and in your office IT.
Enter the start file HMS_GDT.exe into the settings of your office IT.

52 -
Reorder No. 106292
Material No.
722998
DIR 80019795 Ver. A