Hyperspectral Remote Sensing of Invasive Species inside · 2015-08-29 · Hyperspectral remote...
21
Hyperspectral Remote Sensing of Invasive Species Inside Cedar Point National Wildlife Refuge: A Preliminary Report By Benjamin Thomas With contributions from Richard Beck, Chantal Ivenso, & Christopher Carr
Transcript of Hyperspectral Remote Sensing of Invasive Species inside · 2015-08-29 · Hyperspectral remote...

Hyperspectral Remote Sensing of Invasive Species Inside
Cedar Point National Wildlife Refuge:
A Preliminary Report
By
Benjamin Thomas
With contributions from
Richard Beck, Chantal Ivenso, & Christopher Carr

Introduction
The goal of this project was to ascertain whether it was feasible to detect invasive plant species
inside Cedar Point National Wildlife Refuge located in Lucas County, Ohio. (Figure 1)
Figure 1. Cedar Point National Wildlife Refuge. Study area outlined in GPS tracks taken during our
reconnaissance of the study area
Mapping invasive species in a wetland such as Cedar Point National Wildlife Refuge with
traditional field survey methods is very difficult and potentially damaging to the vegetation inside the
refuge. In addition, wetlands are often too wet for walking and too dry for boating. Invasive species are
major concern to government agencies, such as the US Fish and Wildlife Service (FWS) and US
Department of Agriculture (USDA). Both FWS and USDA are tasked with figuring out ways of tracking
the spread of invasive species. To that end, FWS and USDA have created partnerships and grants
programs to assist interested organizations in combating invasive species. (For specifics see
http://www.fws.gov/grants/ and http://www.fws.gov/invasives/partnerships.html) (For a comprehensive

listing of grant programs to combat invasive species see
http://www.invasivespeciesinfo.gov/toolkit/grants.shtml). In this report, we examined the use of remote
sensing to map invasive species because of its non-destructive approach. In this study, we believe we
detected invasive species in Cedar Point National Wildlife Refuge using techniques described below.
Refuge History
Cedar Point National Wildlife Refuge is part of a series of three marshes which collectively form
Ottawa National Wildlife Refuge. The marsh regions around Lake Erie are remnants of the Great Black
Swamp (FWS Ottawa Refuge). Cedar Point consists of three shallow pools and grassy marshland which
cover approximately 2,445 acres (FWS Cedar Point Refuge).
Background
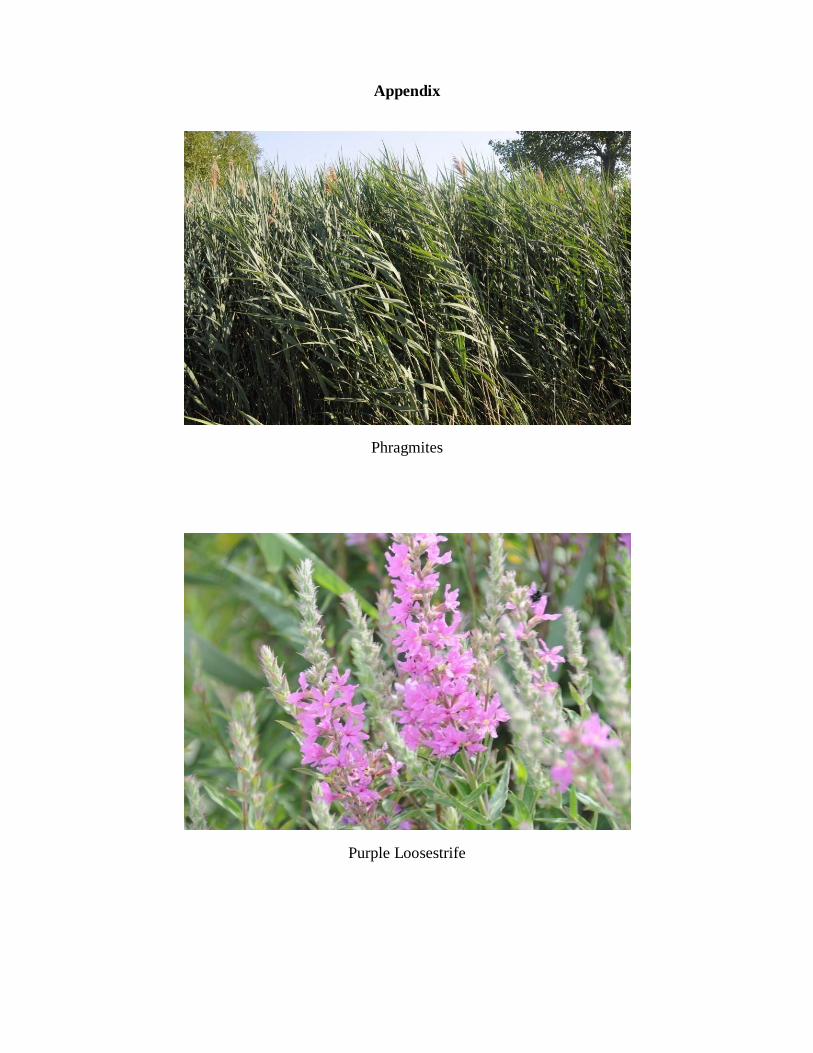
The three target species in question are the invasive plants Phragmites (Phragmites australis),
Purple Loosestrife (Lythrum salicaria), and Flowering Rush (Butomus umbellatus) (see appendix for
pictures). Phragmites is a tall, perennial grass believed to be native of Eurasia. It has the ability to
outcompete native vegetation and induces change in local marsh hydrology (National Park Service PCA).
Purple loosestrife is also a perennial grass and was brought to the United States from Europe for flower
gardens. This plant can crowd out native flowering plants which local wildlife relies on for food and
habitat (Univ of Minn Sea Grant). Purple loosestrife can reproduce very quickly creating a monoculture
environment. This led to FWS declaring purple loosestrife: “Public Enemy #1 on Federal Lands” (Liu et
al. 2006). Flowering rush is another perennial that is native of Eurasia and is thought to have also been
spread through the ballast of ships. It grows vigorously in waterways making it a possible hazard to boat
traffic (Indiana Department of Natural Resources).
Hyperspectral remote sensing is unique because of its ability to identify vegetation based on their
spectra. However, the spectral characteristics (colors) of plant species are often similar. Therefore it may

be difficult to map individual species with spectral methods depending on the species to be mapped and
its background (Bachman et al., 2002; Goodenough et al., 2002; Ustin et al., 2002; Lopez et al., 2004;
Pengra 2005). Success or failure will be based in part on location and ecosystem as well as time of year.
We began a feasibility study during the summer of 2010.
Data Collection and Processing
During the field season of July and August 2010, a group of students from the University of
Cincinnati began collecting reflectance spectra from these three species (Figure 2). Reflectance spectra
were collected for classification and mapping of our target species in conjunction with hyperspectral data
using techniques described below in the analysis section. To ensure an adequate representative sample
size was obtained, we collected 60 reflectance samples of the flowers of these species using the Analytical
Spectral Devices (ASD) field spectrometer which can detect spectra from the visible/near infrared to
shortwave infrared (350 – 2500nm). However, our attempt to collect reflectance spectra from phragmites
was hampered by technical errors and unfavorable atmospheric conditions which resulted in spectra that
were unusable. As a result, an unsupervised classification technique, described in greater detail below,
was used. Once the spectra were obtained, we averaged the middle 50 samples and created a spectral
library file (Figure 3).

Figure 2. Chantal Ivenso and Ben Thomas taking reflectance spectral samples of flowering rush

Figure 3. Reflectance spectral libraries of the three target species
After the field spectra were collected, we began to process the hyperspectral images that were
acquired of the entire refuge throughout the summer of 2010. The hyperspectral imager used was an
AISA Eagle imaging unit built by Specim Ltd., Oulu, Finland (Table 1). The instrument was installed in a
Cessna 172 Skyhawk airplane and flown at an altitude of 5,000 feet above ground level (AGL) which
resulted in an instrument spatial resolution of 1 meter. For our feasibility study, the hyperspectral image
used was taken on 5 August 2010 at approximately 12:00 pm EDT (Figure 4).

Table 1. AISA Eagle Hyperspectral Sensor Characteristics
Sensor type Pushbroom spectrometer
Positioning system Integrated GPS/INS navigation
Optical parameters Spectral range of 430 – 970 nm
128 spectral bands with selectable bandwidth
Ground swath 1024 meters
Figure 4. An unprocessed hyperspectral image displayed in true color of the northernmost point of Cedar
Point. Also visible is the SkySentry aerostat airship moored in the lake near the bottom left portion of the
refuge
We radiometrically and atmospherically corrected the images to filter out atmospheric and
instrumental influences using the Caligeo processing software. This software was developed by Specim
Ltd. for use in processing images taken from their camera products. The software runs a separate module
under ENVI-IDL remote sensing software. The resulting reflectance images were geo-registered to a 1
meter USDA National Agriculture Imagery Program (NAIP) true color image of the marsh taken in June
2010 to ensure their approximate location. After geo-registration, we performed a minimum noise fraction
(MNF) transformation on the hyperspectral images. The purpose of an MNF transformation is to reduce
and segregate noise and to reduce data dimensionality, which decreases processing time (Boardman and
Kruse, 1994).

During the month of October 2010, another group of students from the University of Cincinnati
returned to Cedar Point. One of the goals of this field operation was to ground truth the location of our
target invasive species to aid in accuracy assessment. This involved sampling along vegetation transects
spaced 1000 meters apart along the access road lining the marsh, which was only possible during this time
of the year as the marsh was at its driest point. Based on this spread, we performed 11 transects, which
was sufficient to cover all of Cedar Point. The vegetation transects started perpendicular to the side of the
road and continued until we could not walk any farther into the marsh. During the sampling, Ph.D
candidate Christopher Carr and I recorded the presence/absence of our target invasive species (see
appendix for data collection sheet).Ultimately, tall marsh vegetation stopped us from sampling farther on
some transects (Figure 5). We positively identified patches of phragmites and purple loosestrife on some
of the field sampling transects and marked their location using Garmin GPS units. We converted this data
into GIS files for later analysis (Figure 6).

Figure 5. Ben Thomas was stopped by tall marsh vegetation on transect 5

Figure 6. Because of very dry conditions, the northern section of Cedar Point allowed us to sample farther
than other transects. On GPS points 11, 12, and 14 we identified purple loosestrife. GPS point 15 is the
location of a large patch of phragmites
Analysis
The classification techniques include unsupervised classification and spectral angle mapper
(SAM), which is a form of supervised classification, using ENVI 4.7 image analysis software. The SAM
classification tool attempts to match image spectra to known spectra collected in the field or laboratory. It
does this by treating both the image and collected spectra as vectors and calculating the spectral angle
between the two in image space to determine a match (Dennison et al. 2004). (Figure 7)

Figure 7. The spectral angle is determined by user input (Adapted from ENVI help tutorial)
As a standard practice, I began the remote sensing analysis using an unsupervised classification to
see if it was possible to detect purple loosestrife or phragmites since both of these species are large
enough or occur in large patches to be seen by the hyperspectral imager. Flowering rush, unfortunately,
could not be identified during our field sampling in the marsh and appears to be too small to be detected
by the hyperspectral imager. This type of classification is used when the analyst knows little about the
characteristics of the study area. An unsupervised classification is a type of classification where the
software clusters pixels into similar groups in the dataset based on statistics alone without user knowledge
of the amount of variation within the image. In this case, the “statistics” are the spectral bands in the
image. In this way, one can see, for example, a cluster of trees separated by other trees based on their
spectra.
In my attempt at unsupervised classification, I used the Iterative Self Organizing Data (ISODATA)
unsupervised classification tool. The ISODATA tool calculates the means of each data value and then

iteratively clusters the remaining pixels. Each iteration attempts to classify pixel values with new means.
The iteration stops once the user supplied threshold is reached (Jensen 2005). The first attempt involved
using 10 spectral classes with a target threshold of 3%. Initial results proved favorable; however, it was
soon realized that our target species had spectral characteristics similar to grass and other marsh
vegetation that made it difficult to separate them spectrally. Next, I used 20 spectral classes with a target
threshold of 2% top see if any individual species could be classified in the image. The classification
resulted in better separation of different vegetation characteristics; yet, it also displayed anomalies which
could not be identified through photo interpretation. After this, I used 15 classes with a target threshold of
2%. This resulted in a classification that differentiates broad vegetation/eco zone classes within the marsh
without displaying too many anomalies. However, I was unable to differentiate phragmites or purple
loosestrife. (Figures 8 & 9)
Figure 8. Atmospherically corrected and georegistered hyperspectral true color image of the northern tip
of Cedar Point

Figure 9. Unsupervised ISODATA classification of the hyperspectral image with 15 classes
The SAM tool was subsequently used to see if it could detect purple loosestrife using our collected
ground reflectance spectra. In ENVI 4.7 software, the default radians angle is 0.10, which is a relatively
large angle. It is well documented in remote sensing literature that a lower threshold setting is necessary
for spectra matching as it allows for subtle differences in pixel values to be detected (Cho et al., 2009;
Kutser and Jupp, 2006). Using an iterative process, I changed the detection threshold of the SAM tool to
lower settings until the signature appeared where we found it and did not find it during our field sampling
(Figure 10). We confirmed its existence on one of our vegetation transects (Figure 11).

Figure 10. Spectral signature of pixels presumed to be purple loosestrife based on SAM classification.
Note that reflectance units are from 0 – 4000. Reflectance values are derived by dividing the reflectance
units by 10000

Figure 11. NAIP image with SAM classification of purple loosestrife signatures displayed in red. The
triangles represent our GPS transect points. In the circle above, we located a patch of purple loosestrife
Conclusion
Based on our results presented above, we believe our classification results using the SAM tool are
plausible. However, the SAM tool is based on subjective user input thus we need more ground truth data
to assess our accuracy. We also conclude that we are able to map broad wetland vegetation classes/eco
zones with unsupervised classification techniques. This is important as it allows us to see patterns and
relationships within the marsh.
For the next field season, it is advantageous to continue collecting spectra from our target invasive
species and ground truth data so that we can continue to refine our methods to achieve better accuracy.

References
Banchmann, C.M., T.F. Donato, G.M. Lamela, W.J. Rhea, M.H. Bettenhausen, R.A. Fusina, K.R. Du-
Bois, J.H. Porter, & B.R Truitt. 2002. Automatic classification of land cover on Smith Island, VA,
using HyMAP imagery. IEEE Transactions on Geoscience and Remote Sensing, 40, 2313–2330.
Boardman, J. W., and F. A. Kruse. 1994. Automated spectral analysis: a geological example using
AVIRIS data, north Grapevine Mountains, Nevada: in Proceedings, ERIM Tenth Thematic
Conference on Geologic Remote Sensing, Environmental Research Institute of Michigan, Ann
Arbor, MI, pp. I-407 - I-418
Cho, M.A., P. Debba, R. Mathieu, J. van Aardt, G. Asner, L. Naidoo, R. Main, A. Ramoelo, B. Majeke.
2009. Spectral variability within species and its effects on Savanna tree species discrimination.
Geoscience and Remote Sensing Symposium, 2009 IEEE International, IGARSS 2009, vol.2, no.,
pp.II-190-II-193
Dennison, Phillip E. Kerry Q. Halligan, and Dar A. Roberts. 2004. A comparison of error metrics and
constraints for multiple endmember spectral mixture analysis and spectral angle mapper. Remote
Sensing of Environment 93, no. 3:359.
Goodenough, D.G., A.S. Bhogal, A. Dyk, A. Hollinger, Z. Mah, K.O. Niemann, J. Pearlman, H. Chen, T.
Han, J. Love, and S. McDonald 2002. Monitoring forests with Hyperion and ALI. International
Geoscience and Remote Sensing Symposium, 2, 882−885
Indiana Department of Natural Resources “Flowering Rush”
www.in.gov/dnr/files/FLOWERING_RUSH.pdf
Jensen, John R. 2005. Introductory digital image processing: A remote sensing perspective. Prentice Hall
Series in Geographic Information Science. Upper Saddle River, NJ: Pearson Prentice Hall
Kutser, T. and D. Jupp. 2006. On the possibility of mapping living corals to the species level based on
their optical signatures. Estuarine, Coastal and Shelf Science 69, no. 3-4:607
Liu, Guoxiang., J. Allen, L. Kang, G. Kleppel, J. Parkey. 2006. Hyperspectral signal processing
applications in environmental monitoring identification and mapping of the invasive plant species
Purple Loosestrife. Signal Processing, 2006 8th International Conference vol. 4, no., 16-20
Lopez, R.D., C.M. Edmonds, D.T. Heggem, A.C. Neale, K.B. Jones, E.T. Slonecker, E. Jaworski, D.
Garofalo, and D. Williams. 2004. Accuracy assessments of airborne hyperspectral data for
mapping opportunistic plant species in freshwater coastal wetlands in (R.S. Lunetta and J.G. Lyon,
eds.) Remote Sensing and GIS Accuracy Assessment. (pp. 253 – 267) CRC Press, Boca Raton, FL.
National Park Service “PCA Alien Plant Working Group - Common Reed (Phragmites australis)” Last
modified June 30, 2010. http://www.nps.gov/plants/alien/fact/phau1.htm.
Pengra, Bruce W., Carol A. Johnston, and Thomas R. Loveland. 2007. Mapping an invasive plant,
Phragmites australis, in coastal wetlands using the EO-1 Hyperion hyperspectral sensor. Remote
Sensing of Environment 108, no. 1:74-81.

United States Fish and Wildlife Service “Cedar Point National Wildlife Refuge” Last modified December
22, 2010. http://www.fws.gov/refuges/profiles/index.cfm?id=31541
United States Fish and Wildlife Service “Ottawa National Wildlife Refuge” Last modified December 22,
2010. http://www.fws.gov/midwest/ottawa/Index.htm
University of Minnesota Sea Grant “Purple Loosestrife - Aquatic Invasive Species” Last modified March
6, 2009. http://www.seagrant.umn.edu/ais/purpleloosestrife.
Ustin, S.L., D. DiPietro, K. Olmstead, E. Underwood, and G. Scheer. 2002. Hyperspectral remote sensing
for invasive species detection and mapping, Proceedings of IGARSS 2002: International
Geoscience and Remote Sensing Symposium, 24-28 June, Toronto, Ontario, Canada (IEEE and the
Canadian Society for Remote Sensing), 3:1658–1660
Appendix
Phragmites
Purple Loosestrife

Flowering Rush

Ben Thomas and Chris Carr
Cedar Point Vegetation Sampling
Date__________ Start Time_________ By__________
Transect number__________
GPS data Waypoint # of averages Est. accuracy GPS
owner/model
Start
End
Camera model ______________ Photo number ______________
Photo view direction (°M):__________________
Transect compass direction_______
Distance (m) Species Event
Species: Event:
Phragmites – PH Start
Purple Loosestrife – PLS Stop
Flowering Rush – FLR Overall length

Acknowledgements
Support for this remote sensing project was provided by SkySentry LLC and a grant from the
United States Army. In addition, I would like to recognize the help of Dr. Hongxing Liu, Haibin Su,
Chau-Sang Wu, Kevin Magee, and Andrew Rettig for data collection.