Hyperpycnal Flow
22
Marine hyperpycnal flows: initiation, behavior and related deposits. A review Thierry Mulder a, * , James P.M. Syvitski b , Se ´ bastien Migeon c , Jean-Claude Fauge ` res a , Bruno Savoye d a De ´ partement de Ge ´ ologie et d’Oce ´ anographie, UMR 5805 EPOC, Universite ´ Bordeaux I, Avenue des Faculte ´ s, 33405 Talence cedex, France b Department of Geological Sciences and Institute of Arctic an d Alpine Research, University o f Co lorado, Box 450, Boulder, CO 80309-0450, USA c Geologi cal Survey of Canada Atlanti c, Bedford Institut e of Oceanogr aphy, P.O. Box 1000, Dartmout h, NS, Canada B2Y4A2 d IFREMER, D RO/GM, BP 70 29280 Plouzane ´ , France Received 1 July 2002; accepted 9 January 2003 Abstract Hyper pycna l flows form in the marin e enviro nment when river disch arge enters the ocean with suspende d conce ntrations in exces s of 36 kg m 23 due to buoyancy considerations, or as little as 1–5 kg m 23 when convective instability is considered. They form at a river mouth during floods of small to medium size rivers including extreme events such as jo¨ kulhaups, dam breaking and draining, and lahars. Associated with high-suspended concentration, they can transport considerable volume of sediment to ocean basins. The typical deposit or hyperpycnite sequence is a compound of a basal coarsening-up unit, deposited during the waxing period of discharge, and a top fining-up unit deposited during the waning period of discharge. Hyperpycnites differ from other turbidites because of their well-developed inversely graded facies and intra sequence erosi onal contacts. Thes e obser vatio ns lead to a compl ete redefi niti on and inter preta tion of fine-g raine d turbi dites . Hyperpycnite stacking can locally generate high-sedimentation rates, in the range of 1–2 m per 100 year. Because hyperpycnites are related to climate through flood frequency and magnitude, their record should vary with sea level and climate change. They can also be associated with proximal ice-melting settings. Hyperpycnal flows could also be involved in the formation of meandering canyons and channels. q 2003 Elsevier Ltd. All rights reserved. Keywords: Hyperpycnal flows; River load; Canyon; Turbidite deposit; Floods; Climate 1. Introduction In the past 30 years, offshore mass wasting processes and gravity flows have been widely studied, stimulated by the need s of deep -wat er reservoir char acte riza tion and other of fshore industries needing protection agai nst natural hazards. The importance of gravity processes is associated with new expl orat ion of deep -mar ine envi ronm ents incl udin g ODP drilling on the Amazon Fan (Hiscott, Pirmez, & Flood, 1997; Normark & Damuth, 1997) or industrial–academic surveys of the Zaire turbidite system ( Savoye et al., 2000). Foll owing pion eer work of Kuenenand Migl iorini (1950), ear ly classifications of of fsh ore gra vit y processesaroseinthe 1970s (Lowe, 1982; Middleton, 1976, 1993; Middleton & Hampton, 1973; Nardin, Hein, Gorsline, & Edwards, 1979 ). These classifications underlined the existence of two major pr ocesses in the mari ne environment : mass flows and turbidity currents. Mul der and Cochonat (1996) and Shanmugam (1996) discussed the complexity of a classifi- cation, since one single event may involve several processes from the failure to final deposition. Turbidity flows ( Kneller & Buckee, 2000; Lowe, 1979, 1982; Middleton & Hampton, 197 3, 1976;Nar din et al., 1979; Stow, 1996) res ult from sli de trans formation , conti nuati on of a fluvial flow or concen - trat ion proc esses . Ignit ive tran sformation of a submarine slide into a flow in which turbulent energy substantively increases (Emms, 1999; Fukushima, Parker, & Pantin, 1985; Parker, 1982; Parker, Fukushima, & Pantin, 1986 ) has been described worldwide, including t he 1929 Grand Banks event (Hughe s-Cl arke , 1990; Hughes-Clarke , Shor , Pipe r, & Mayer, 1990; Piper, Cochonat, Ollier Le Drezen, Morrison & Baltzer, 1992), and the 1979 Nice event ( Gennesseaux, Mauffret, & Pautot, 1980; Malinverno, Ryan, Auffret, & Pautot, 1988; Piper & Savoye, 1993 ). 0264-8172/$ - see front matter q 2003 Elsevier Ltd. All rights reserved. doi:10.1016/j.marpetgeo.2003.01.003 Marine and Petroleum Geology 20 (2003) 861–882 www.elsevier.com/locate/marpetgeo * Corresponding author. Tel.: þ 33-556648845. E-mail address: [email protected] (T. Mulder).
-
Upload
anca-seserman -
Category
Documents
-
view
220 -
download
0
Transcript of Hyperpycnal Flow
7/21/2019 Hyperpycnal Flow
http://slidepdf.com/reader/full/hyperpycnal-flow 1/22
Marine hyperpycnal ows: initiation, behaviorand related deposits. A review
Thierry Mulder a, *, James P.M. Syvitski b , Sebastien Migeon c ,Jean-Claude Fauge`resa , Bruno Savoye d
a De partement de Ge ´ ologie et d’Oce ´ anographie, UMR 5805 EPOC, Universite ´ Bordeaux I, Avenue des Faculte ´ s, 33405 Talence cedex, Franceb Department of Geological Sciences and Institute of Arctic and Alpine Research, University o f Colorado, Box 450, Boulder, CO 80309-0450, USA
cGeological Survey of Canada Atlantic, Bedford Institute of Oceanography, P.O. Box 1000, Dartmouth, NS, Canada B2Y4A2d IFREMER, DRO/GM, BP 70 29280 Plouzane ´ , France
Received 1 July 2002; accepted 9 January 2003
Abstract
Hyperpycnal ows form in the marine environment when river discharge enters the ocean with suspended concentrations in excess of 36 kg m
2 3 due to buoyancy considerations, or as little as 1–5 kg m2 3 when convective instability is considered. They form at a river mouth
during oods of small to medium size rivers including extreme events such as jo ¨kulhaups, dam breaking and draining, and lahars. Associatedwith high-suspended concentration, they can transport considerable volume of sediment to ocean basins. The typical deposit or hyperpycnitesequence is a compound of a basal coarsening-up unit, deposited during the waxing period of discharge, and a top ning-up unit deposited
during the waning period of discharge. Hyperpycnites differ from other turbidites because of their well-developed inversely graded facies andintrasequence erosional contacts. These observations lead to a complete redenition and interpretation of ne-grained turbidites.Hyperpycnite stacking can locally generate high-sedimentation rates, in the range of 1–2 m per 100 year. Because hyperpycnites are relatedto climate through ood frequency and magnitude, their record should vary with sea level and climate change. They can also be associatedwith proximal ice-melting settings. Hyperpycnal ows could also be involved in the formation of meandering canyons and channels.q 2003 Elsevier Ltd. All rights reserved.
Keywords: Hyperpycnal ows; River load; Canyon; Turbidite deposit; Floods; Climate
1. Introduction
In the past 30 years, offshore mass wasting processes andgravity ows have been widely studied, stimulated by theneeds of deep-water reservoir characterization and otheroffshore industries needing protection against naturalhazards. The importance of gravity processes is associatedwithnew exploration of deep-marine environments includingODP drilling on the Amazon Fan ( Hiscott, Pirmez, & Flood,1997; Normark & Damuth, 1997 ) or industrial–academicsurveys of the Zaire turbidite system ( Savoye et al., 2000 ).
Followingpioneer workof Kuenenand Migliorini (1950) ,early classicationsof offshore gravity processesarose in the1970s (Lowe, 1982; Middleton, 1976, 1993; Middleton &Hampton, 1973; Nardin, Hein, Gorsline, & Edwards, 1979 ).These classications underlined the existence of two major
processes in the marine environment: mass ows andturbidity currents. Mulder and Cochonat (1996) andShanmugam (1996) discussed the complexity of a classi-cation, since one single event may involve several processesfrom the failure to nal deposition. Turbidity ows ( Kneller& Buckee, 2000; Lowe, 1979, 1982; Middleton & Hampton,1973, 1976; Nardinet al., 1979; Stow, 1996 ) result from slidetransformation, continuation of a uvial ow or concen-tration processes. Ignitive transformation of a submarineslide into a ow in which turbulent energy substantivelyincreases ( Emms, 1999; Fukushima, Parker, & Pantin, 1985;Parker, 1982; Parker, Fukushima, & Pantin, 1986 ) has beendescribed worldwide, including the 1929 Grand Banks event(Hughes-Clarke, 1990; Hughes-Clarke, Shor, Piper, &Mayer, 1990; Piper, Cochonat, Ollier Le Drezen, Morrison& Baltzer, 1992 ), and the 1979 Nice event ( Gennesseaux,
Mauffret, & Pautot, 1980; Malinverno, Ryan, Auffret, &Pautot, 1988; Piper & Savoye, 1993 ).
0264-8172/$ - see front matter q 2003 Elsevier Ltd. All rights reserved.doi:10.1016/j.marpetgeo.2003.01.003
Marine and Petroleum Geology 20 (2003) 861–882www.elsevier.com/locate/marpetgeo
* Corresponding author. Tel.: þ 33-556648845.E-mail address: [email protected] (T. Mulder).

7/21/2019 Hyperpycnal Flow
http://slidepdf.com/reader/full/hyperpycnal-flow 2/22
Turbulent ow can also form by continuation at sea of river discharge ( Normark & Piper, 1991 ), which is theaim of this paper. Advances include recognizing theimportance of hyperpycnal ows from small and mediumsized rivers ( Mulder & Syvitski, 1995 ) and the use of digital X-radiography ( Migeon, 2000; Migeon, Weber,Fauge res, & Saint-Paul, 1999 ) to distinguish structureswithin ne-grained turbidites, particularly bed– intrabedcontacts.
Turbulent ow initiation can also result of the intensi-cation of the nepheloid layer circulation and densitycascading ( Mc Cave, 1986; Wilson & Roberts, 1995 ) or byformation of uid-mud suspensions on continental shelvesunder storm conditions ( Friedrichs, Wright, Hepworth, &Kim, 2000; Ogston, Cacchione, Sternberg, & Kineke, 2000;
Reed, Niedoroda, & Swift, 1999; Traykovski, Geyer, Irish,& Lynch, 2000; Wright, Friedrichs, Kim, & Scully, 2001 ).Bates (1953) dened hypopycnal ows as buoyant
plumes owing at the water surface and producinghemipelagites. They form when the density of particle–water mixture at the river mouth is less than the density of the basin it ows. Bates (1953) dened homopycnal ows asriver efuent with a density in the same range as the densityof the uid in the receiving basin. These ows quicklydecelerate and dump their particles, forming mouth barswith steep foresets between two water masses. Mulder andAlexander (2001) added mesopycnal ows, i.e. with anintermediate density. Such ows are observed in deep
hypersaline basins with strongly stratied waters such as inthe Mediterranean ( Rimoldi, Alexander, & Morris, 1996 )where they ow along a pycnocline.
Hyperpycnal ows were rst reported by Forel (1885,1892) in Lake Le man. They are frequent in Lake Mead(USA; Gould, 1951 ), Lake Baı kal (Russia; Nelson,Karabanov, Colman, & Escutia, 1999 ), and alpine lakes(Anterne, Annecy, le Bourget; Arnaud et al., 2001; Lambert,Kelts, & Marshall, 1976; Linier, 2001; Linier et al., 2001 ;Soper Lake, Bafn Island; Hughen, Overpeck, & Anderson,2000). In lakes, the receiving basin is lled with fresh waterand the density difference between efuent and basin wateris low. In many mountain lakes, the streams result from iceor snow melting, with the temperature of the inowing riverwater lower than the temperature of the ambient lake water.Plunging of the river efuent may form without anysediment in suspension although these rivers ows areusually accompanied by higher sediment concentrations. Inrift lakes, suspended load is provided by the presence of easily erodible volcanic material such as ashes and pumice.Aerial views of Lake Tanganyika (Tanzania; Tiercelin,Cohen, Soreghan, Lezzar, & Bouroullec, 1992; Tiercelinet al., 1987 ) show the area on lake surface where the owdisappears ( Fig. 1).
In the marine environment, river ow contributes to 95%of the global sediment ux delivered to the ocean from landby rivers (Table 1 ). Most of that ux is as suspended load(Syvitski, 2003 ).
Modifying slightly Bates denition, Mulder and Syvitski(1995) dened a hyperpycnal ow as a negatively buoyantow that ows along the basin oor due to density in excessof ambient density of the standing water-body, as the resultof the particle load that it carries. This implies that onlysuspended matter is concerned for a long-distance transporttowards the deep-sea. This means that (1) hyperpycnalcurrents will transport distally only particles ner thanmedium sands and (2) sediment might be transportedthrough a very long distance.
A hyperpycnal process means that riverine material,except what is eroded on the seaoor, is transported directlyto the marine environment, the continental shelf and slopeor to the abyss, by a turbulent ow initially containing freshwater. This denition of hyperpycnal ows excludes
turbidity currents generated by slumps or foresets failuresas those described by Bornhold, Ren, and Prior (1994),Mulder, Savoye, Syvitski, and Cochonat (1997b), Prior,Bornhold, and Johns (1986), Prior, Bornhold, Wisenam andLowe (1987) or Zeng, Lowe, Prior, Wisenam, and Bornhold(1991) despite the correlation between record of turbiditycurrents and high river discharge.
In this paper, we review the conditions that generatehyperpycnal ows in the marine environment. They includeseasonal oods or catastrophic extreme events such as jokulhaups, lahars, dam breaking and draining that canoccur concomitantly with oods. We estimate how frequenthyperpycnal ows may form and how they can maintain
their negative-buoyancy to transport large volume of particles in deep-sea environments. Finally, we describethe deposits that are related to hyperpycnal processes(hyperpycnites) and evaluate their importance in theexplanation of margin morphology and the record of climatic changes in sedimentary series.
2. Hyperpycnal ows in the marine environment
2.1. Suspended sediment concentration at river mouth
Until recently, the existence of hyperpycnal ows in themarine environment has been contested. They have onlybeen observed during unusually extreme conditions (jo ¨kul-haups and erosion of natural dams), and were reputed to besporadic phenomena. Their initiation, i.e. the plunging at ariver mouth necessitates high-suspended particle concen-tration in the fresh river water. The critical concentration forplunging ðC cÞ varies between 36 and 43 kg m
2 3 (Table 2 ),and depends on the temperature and salinity of seawaternear the river mouth. Mulder and Syvitski (1995) providedaverage density threshold values for worldwide riversdepending on the climatic setting, i.e. the latitude of theriver mouth.
In normal discharge conditions, the mean suspendedconcentration in rivers is low. Only nine rivers are ‘dirty’ innatural conditions, i.e. have a mean sediment concentration
T. Mulder et al. / Marine and Petroleum Geology 20 (2003) 861–882862

7/21/2019 Hyperpycnal Flow
http://slidepdf.com/reader/full/hyperpycnal-flow 3/22
to ensure frequent hyperpycnal ow initiation during a year(Table 3 ).
2.2. Flash oods in hot arid environments
Streams located in arid hot climates have an inter-mittent ow regime. The stream bed might stay dryduring months or years. Water supply is sporadic, shortand intense. North African ‘oueds’ are active after heavyrains (Isser and Djer rivers in Table 3 ). Californian andMexican ‘arroyos’ ood after cyclones or hurricanes.Usually, these rivers build fan deltas at their mouth
(Gorsline, de Diego, & Nava-Sanchez, 2000; Nava-San-chez, Gorsline, Cruz-Orozco, & Godinez-Orta, 1999 ) thatdemonstrate the high discharges and ow velocitiesgenerated during ash oods.
A signicant amount of the sediment is transported assuspended load and could generate hyperpycnal currentsupon arrival at the coast. This is attested by the considerableerosion in stream beds on the continents ( Fig. 2).Nava-Sanchez et al. (1999) observed turbidites in smallanoxic basins around in the Gulf of California and suppliedby Baja Californian streams. Some of the turbidites are
Fig. 1. Aerial photograph of hyperpycnal discharge in Lake Tanganyika (Tanzania; Tiercelin et al., 1987, 1992 ). The surface ow disappears at the plungingarea, after which the current ows along the lake oor. The arrow shows ow direction. Photo courtesy of J.-J. Tiercelin.
Table 2Average temperature, salinity (from Kennish, 1989 ) and density of sea-water for different climates, and the corresponding critical particleconcentration ðC cÞ to overcome difference between fresh and salt waterassuming particle density of 2650 kg m
2 3
Temperature(8C)
Salinity(‰)
Density(10
2 3 kg m2 3)
C c(kg m
2 3 )
(1) 27 34.75 1.02257 36.25(2) 24 35.75 1.02424 38.93(3) 13 35.25 1.02661 42.74(4) 1 33.75 1.02708 43.49
(1) Equatorial (Lat.,
108); (2) Tropical and subtropical (Lat. 10–30
8);(3) Temperate (Lat. 30–50 8); (4) Subpolar (Lat. . 508). Modied from
Mulder and Syvitski (1995) .
Table 1Global estimates of the ux of sediment from land to the ocean ( Syvitski,2003 )
Transport mechanism Global uxestimate(1012 kg year
2 1)
Grade
Rivers: suspended load 18 B þ
Bed load 2 B2
Dissolved load 5 B þ
Glaciers, sea ice, icebergs 2 C
Wind 0.7 CCoastal erosion 0.4 D
T. Mulder et al. / Marine and Petroleum Geology 20 (2003) 861–882 863

7/21/2019 Hyperpycnal Flow
http://slidepdf.com/reader/full/hyperpycnal-flow 4/22
related to historical oods and may be deposited byhyperpycnal ows.
2.3. Jo kulhaups in cold arid environments
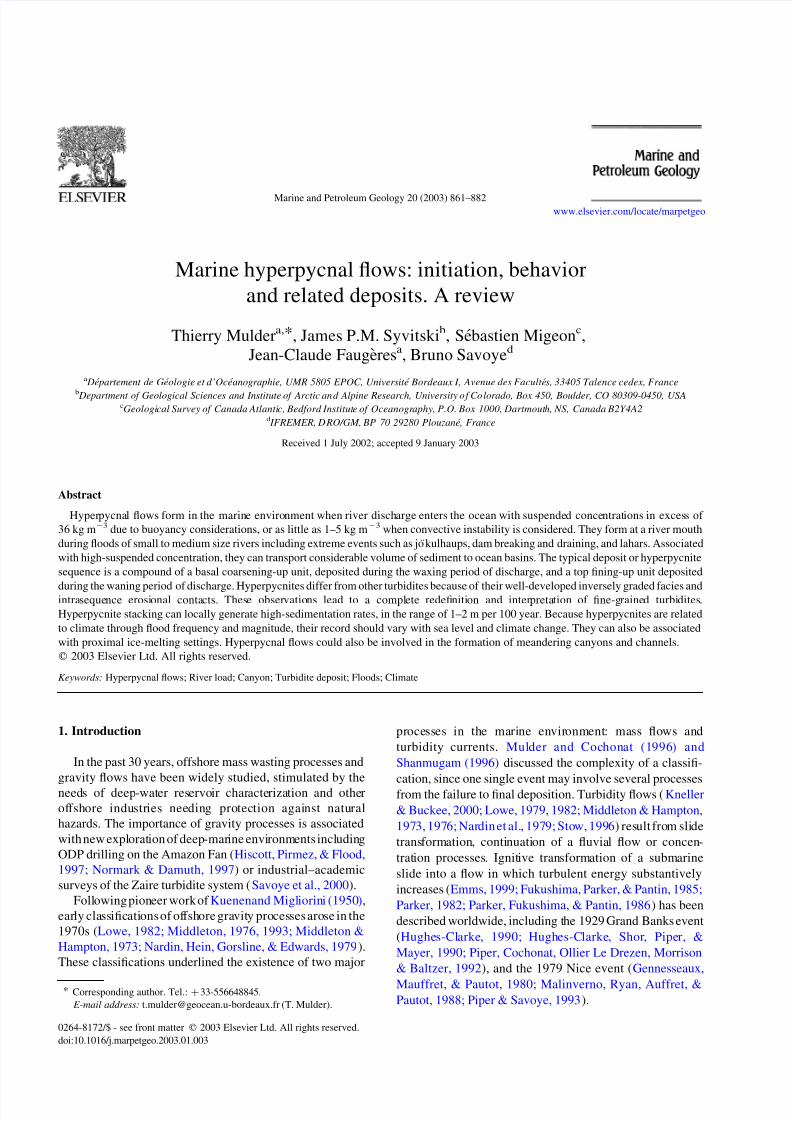
‘Jokulhlaup’ is an Icelandic term meaning ‘glacial ood’.Jokulhaups form under a glacier because of the melting of alarge volume of ice. In Iceland, melting is due to a subglacialvolcanic eruption. A subglacial lake forms. If the lake breaksthrough its connement, millions of cubic meters of freshwater mixed with volcanic and glacial deposits ow to
the ocean ( Fig. 3). Jokulhaups last only a few hours. Such a jokulhlaup formed in November 1996 because of theeruption of the Grimsvo¨ tn volcano below the glacier Vatna- jokull (Einarsson et al., 1997; Gro¨nvold & Jo hannesson,1984;Gudmunsson,Sigmundsson,& Bjo ¨rnsson, 1997 ).Peak discharge reached 50,000 m 3 s
2 1 where the ow crossed theSkeidararsandur and reached the ocean after traveling, 70 km. In two days, a total water volume of 3 km 3
including clay to boulders and ice blocks were transported tothe ocean. During these jo¨kulhaups, particle concentration isvery high. The shortness of the phenomenon induces veryhigh instantaneous discharges and ow velocities capable of transporting medium sand. Jorun Hardardottir (personalcommunication, 1997) reports sediment concentrations fromthis event reached 200 kg m
2 3 . When entering the sea, the
ow plunges quickly ( Fig. 3).In non-volcanic areas covered by ice, jo ¨kulhaups formwhen a moraine dam is breached due to overpressuring,overow or earthquake shaking.
2.4. Natural and articial dam erosion
Natural dam erosion is well illustrated in the SaguenayFjord,a tributaryof theSt Lawrence River ( Fig.4 ).This fjordis 93 km long, 1–6 km wide ( Schafer, Smith, & Coˆte, 1990 )and dissects the Laurentian Highlands of the CanadianShield ( Fig. 4). The Saguenay River drains the 78,000 km 2
Table 3Dirty rivers that may produce one or several hyperpycnal ows each year
River Qav (m3
s2 1
) C sav (kg m2 3
) C c (kg m2 3
)
Choshui (Taiwan) 190 10.5 38.9Djer (Algeria) 2 13.4 42.7Tsengwen (Taiwan) 76 12.9 38.9Isser (Algeria) 12 15.4 42.7Rioni (Russia) 5 20.7 43.5Daling (China) 38 36.0 42.7Haile (China) 63 40.5 42.7Huanghe (China) 1880 18.5 42.7Erhian (Taiwan) 16 25.5 38.9
Average annual suspended particle concentration values ðC sav Þ is closeto the critical threshold in concentration ðC cÞ to generate a hyperpycnalow. Modied from Mulder and Syvitski (1995).
Fig. 2. Erosion (arrow) of a stream bed after the hurricane Juliette in October 2001 (agua amarja, La Paz, Baja California, Mexico). The escarpment isapproximately 3 m-high, located about 2 km from the river mouth.
T. Mulder et al. / Marine and Petroleum Geology 20 (2003) 861–882864
7/21/2019 Hyperpycnal Flow
http://slidepdf.com/reader/full/hyperpycnal-flow 5/22
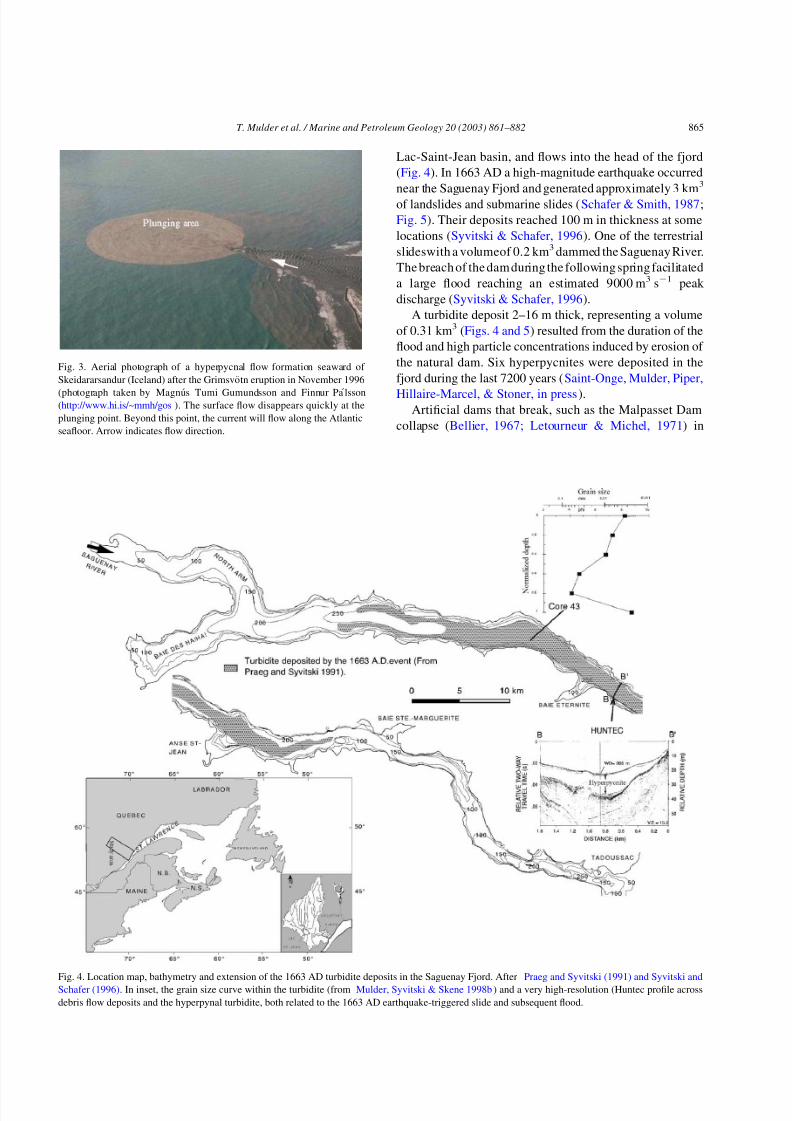
Lac-Saint-Jean basin, and ows into the head of the fjord(Fig. 4). In 1663 AD a high-magnitude earthquake occurrednear the Saguenay Fjord and generated approximately 3 km 3
of landslides and submarine slides ( Schafer & Smith, 1987 ;Fig. 5). Their deposits reached 100 m in thickness at somelocations ( Syvitski & Schafer, 1996 ). One of the terrestrialslideswith a volumeof 0.2 km 3 dammed the Saguenay River.The breach of the damduring the following spring facilitateda large ood reaching an estimated 9000 m 3 s
2 1 peak discharge ( Syvitski & Schafer, 1996 ).
A turbidite deposit 2–16 m thick, representing a volumeof 0.31 km 3 (Figs. 4 and 5 ) resulted from the duration of theood and high particle concentrations induced by erosion of the natural dam. Six hyperpycnites were deposited in thefjord during the last 7200 years ( Saint-Onge, Mulder, Piper,
Hillaire-Marcel, & Stoner, in press ).Articial dams that break, such as the Malpasset Dam
collapse ( Bellier, 1967; Letourneur & Michel, 1971 ) in
Fig. 3. Aerial photograph of a hyperpycnal ow formation seaward of Skeidararsandur (Iceland) after the Grimsvo ¨tn eruption in November 1996
(photograph taken by Magnu´s Tumi Gumundsson and Finnur Pa ´lsson(http://www.hi.is/~mmh/gos ). The surface ow disappears quickly at theplunging point. Beyond this point, the current will ow along the Atlanticseaoor. Arrow indicates ow direction.
Fig. 4. Location map, bathymetry and extension of the 1663 AD turbidite deposits in the Saguenay Fjord. After Praeg and Syvitski (1991) and Syvitski andSchafer (1996) . In inset, the grain size curve within the turbidite (from Mulder, Syvitski & Skene 1998b ) and a very high-resolution (Huntec prole acrossdebris ow deposits and the hyperpynal turbidite, both related to the 1663 AD earthquake-triggered slide and subsequent ood.
T. Mulder et al. / Marine and Petroleum Geology 20 (2003) 861–882 865

7/21/2019 Hyperpycnal Flow
http://slidepdf.com/reader/full/hyperpycnal-flow 6/22
southern France in 1959, see their resulting catastrophicow reach the sea and probably form a hyperpycnal ow.Power companies currently make controlled dam-drainingto remove the ne particles that tend to accumulate at the toeof the dam. These drainings are associated with unusuallyhigh loads and form anthropic-controlled hyperpycnalows. Such drainings are made frequently at the mouth of the Golo river on the eastern side of Corsica (FrenchMediterranean). They provide an excellent analogousexperimental set-up of natural hyperpycnal ows.
2.5. Lahars transformation at sea
Lahars are concentrated or hyperconcentrated ows thatform when heavy rainfall affects soft and underconsolidatedvolcanic pumice, ash or ignimbrites. When reaching the sea,lahars quickly dilute and transform into ows maintainedfor hours, creating a phenomenon similar to hyperpycnalows.
However, these particular conditions do not need tooccur to form a hyperpycnal ows. The most frequent wayto trigger hyperpycnal ows is river ooding. Because ashoods, jo kulhaups and lahars are all related to heavyrainfall, they tend also to be associated with oods. A keyquestion is whether hyperpycnal ows can form withoutassociation with these extreme events?
3. Why do hyperpycnal ows form during a ood?
River particles are transported as bedload and suspendedload (Emmett, 1982 ). Hyperpycnal ows are sediment-laden currents, thus we restrict the discussion to suspendedload. There are two ways to predict suspended particle load
and discharge at a river mouth: (1) by using a relationshipbetween particle load and discharge deduced from measure-ments obtained regularly at the river mouth or (2) by usingrelationships linking particle load with morphologic par-ameters of the drainage basin.
Suspended load can be measured in rivers simul-taneously with discharge. Today, the mean particle load of rivers under temperate climates is known during averagedischarge and ood conditions ( Milliman & Meade, 1983;Milliman & Syvitski, 1992 ). However, intensication of articial damming during recent decades reduced consider-ably the sediment load ( Milliman & Syvitski, 1992 ) andhyperpycnal ow activity.
In addition, during a ood, the particle load alwaysincreases with discharge but this increase might be
complex ( Fig. 4; Syvitski & Alcott, 1993, 1995 ). First,the duration of the ood and the time to reach peak owcan take several hours to weeks (see examples in Mulder &Syvitski, 1995 ). Second, the particle concentration–discharge relationship can vary depending on the durationand intensity of the precipitation event. Particle concen-tration is usually higher during the rising limb of the oodhydrograph ( Fig. 5a; e.g. the 1980 June ood of theStikine River, Mulder & Syvitski, 1995 ). However, theopposite trend, i.e. particle concentration higher duringthe decreasing discharge period is also observed ( Fig. 5b;e.g. the 1988 July ood of the MacKenzie River; Mulder &Syvitski, 1995 ). In some cases, depending on the
availability of easily erodible particles, the concen-tration– discharge curve can show a plateau. The dischargecontinues to increase but the particle concentration remainsconstant ( Fig. 5c ; e.g. the 1980 July ood of the StikineRiver, Mulder & Syvitski, 1995 ). Particle concentrationcan also decrease despite discharge that continues toincrease or stabilize ( Fig. 5d; e.g. the 1979 May ood of the Fraser River, Mulder & Syvitski, 1995 ).
All these complexities are solved by using the relation-ship between particle concentration and discharge (ratingcurve; Fig. 6) obtained from data measured daily or athigher frequency. For such return periods, rating curves arerobust and usually allow valid predictions. Rating curvesshow suspended particle concentration ðC sÞ or load ðQsÞincreases as a power relationship of discharge ðQÞ: It can bewritten as follows:
Qs ¼ aQ b ð1Þ
where a and b are the rating parameters that have to bemeasured in every river. The rating parameters can also beestimated from river basin characteristics (runoff, tempera-ture, relief; Syvitski, Morehead, Bahr, & Mulder, 2000 ).
The shape of the rating curve demonstrates that:
† Hyperpycnal oods form during major oods. Duringmajor or extreme oods, a small increase in dischargeinduces a drastic increase in particle concentration.
Fig. 5. Different shapes of a ood hydrograph. See text for details. Modiedfrom Syvitski and Alcott (1995) .
T. Mulder et al. / Marine and Petroleum Geology 20 (2003) 861–882866

7/21/2019 Hyperpycnal Flow
http://slidepdf.com/reader/full/hyperpycnal-flow 7/22
† Hyperpycnal oods are of major interest because of thetotal volume of sediment they carry. During a majorood lasting days, river can transport as much sedimentto its mouth as during the preceding years to decades.
For example, in November 1994, the Var River in thewestern Mediterranean had a major ood that lasted 3 days.During this bicentennial ood, the peak discharge reachedalmost 4000 m 3 s2 1 (mean annual discharge at the Var rivermouth is 52 m 3 s
2 1). Mulder, Savoye, Piper, and Syvitski(1998a) estimated that the ood generated a 18 h-longhyperpycnal ow. During this period, the hyperpycnal owcarried 11–14 times the mean annual particle load. Thewhole ood probably carried the same amount of material asduring the preceding 20 years.
The importance of hyperpycnal oods as a sedimenttransport process may be underestimated for many rivers.The monitoring of peak ood conditions is important togenerate an accurate rating curve and remains a challenge of future research. With hostile conditions, extreme events are
usually not monitored biasing published data toward non-peak discharge conditions. Empirical relationships existbetween discharge, particle load and morphology of thedrainage basin. For example the mean annual discharge of ariver is related to the surface of the drainage basin or thelength of the river ( Hack, 1957; Mulder & Syvitski, 1996 ).The relationship is better when climatic parametersare included in the relationship. There is good correlationðr 2 ¼ 0:9Þ between the observed discharge of a river and itspotential discharge (precipitation across the slope-adjusteddrainage area). More importantly, the maximum limit of discharge ðQflood Þ a river can experience at its mouth is verywell correlated with the drainage area ( Matthai, 1990 ).
The best general relationship to estimate sediment load isfrom Morehead, Syvitski, Hutton, and Peckham (2003) and
Syvitski (2002) :
Qs ¼ a H 3 = 2 A1 = 2 ek T ð2Þ
where H is river basin relief (m), A is river basin area (km 2),T is mean surface temperature of the drainage basin ( 8C),and a is a dimensionless constant (2 £ 10
2 5) a s i s k (0.1331).
4. Hyperpycnal ow as a common process in the marineenvironment
4.1. Statistical analysis of hyperpycnal ow initiationby rivers
Mulder and Syvitski (1995) published tables for 147rivers, listing the load-averaged mean concentration of suspended sediment, C ¼ Qs = Q; calculated from a globaldatabase of mean annual river discharge Q and sedimentdischarge Q s: The database accounts for 65% of the globalparticle load carried by rivers ( Table 4 ). Because sedimenttransport is a highly nonlinear process ( Garcia & Parker,1993), ood values of C may deviate signicantly from theannualmean.Toaccount forthis, Mulder and Syvitski (1995)use the sediment rating curve Eq. (1). Using rating curves, adrainage-area–maximum-ood relation, and a critical sedi-mentconcentration C c ofapproximately 42 kg m
2 3), Mulderand Syvitski (1995) classied rivers according to theircapacity to generate a hyperpycnal ow. First, rivers withC c # 5C were said to be dirty,and could reasonably producea hyperpycnal ow every year due to seasonal variations(assumed to be a factor ofve) in sediment discharge. Only 9outof the147 riverscouldbe calleddirtyand most were smallrivers draining mountainous terrain. The other rivers werecategorized by calculating a maximum ood dischargeQflood : Taking the ratio of the ood and mean annualsediment rating curves, yields the expression:
C flood ¼ C ðQflood = QÞb ð3Þ
The exponent b was varied until C sflood . C c : Depending
on the b required to produce C sflood . C c ; the return period of hyperpycnal ow formation was inferred. Small, easy-to-attain values of b were related to short return periods, while
Fig. 6. The rating curve: power-law relationship between particleconcentration, C s and discharge, Q: During low-discharge periods, asmall increase in discharge leads to insignicant increase in particle load.During high discharge periods the same increase in discharge induces adrastic increase in particle load.
Table 4Change in the characterization of rivers when the inuence of convectiveinstability is considered
Criterion (1) (2) (3) (4) (5)
C mass ¼ 42 kg m3 9 72 24 13 29C mass ¼ 5 kg m3 61 48 15 8 15
The 147 rivers discussed in Mulder and Syvitski (1995) werereanalyzed using a criterion for hyperpycnal ow generation corresponding
to that for sediment-driven convection. River categorization: (1) dirty; (2)moderately dirty; (3) moderately clean; (4) clean; (5) hyperpycnal activitynot possible.
T. Mulder et al. / Marine and Petroleum Geology 20 (2003) 861–882 867
7/21/2019 Hyperpycnal Flow
http://slidepdf.com/reader/full/hyperpycnal-flow 8/22
large b values were indicative of relatively rare events. Themethod provides a simple, rational way to classify riverswith limited data. The classications were dened asfollows: b # 1; moderately dirty (return periods of lessthan 100 years); 1 , b # 1:5; moderately clean (returnperiods on the order of hundreds of years); 1 :5 , b # 2;clean (a return period on the order of tectonic/climatic timescales); b . 2; unlikely to ever produce a hyperpycnal ow.
Using these denitions, Mulder and Syvitski (1995)demonstrated that 81 rivers (55%) can produce . 1hyperpycnal ood every 100 years, and another 24 riverscan produce hyperpycnal ows every 100–1000 years. Thus71% of the rivers in the database can generate hyperpycnalows in the marine environment with a high to moderatefrequency. Among the remaining rivers, only 29 are
unlikely to ever produce hyperpycnal ows while 13 otherrivers may produce hyperpycnal ows at a frequency of oneevery 1000–10,000 years.
4.2. Specic conditions increasing the frequencyof hyperpycnal ow formation
Discovery of hyperpycnal ow-related sedimentarysequences in the Zaire deep-sea fan ( Migeon, 2000 ) eventhough the Zaire was classied as a clean river ( Table 5 )suggests hyperpycnal ows may be more common than thatsuggested by Mulder and Syvitski (1995) .
The critical concentration for initiation of hyperpycnalows can be considerably reduced by convective instabilityof a hyperpycnal ow ( Hoyal, Bursik, & Atkinson, 1999;Maxworthy, 1999 ). The Chikita (1991) model and Parsons,Bush, and Syvitski (2001) experiments have demonstratedhyperpycnal ows to be generated with sediment concen-trations 40 times less than those required to render theoutowheavyrelativeto theoceanic ambient (i.e. 1 kg m
2 3 ).During the experiments of Parsons et al. (2001) , convectiontook the form of sediment-laden ngers descending from thebase of the surface ow. At 5 kg m
2 3 , nger convection is atleast as vigorous as observed oc settling and can generateconvection for any realistic, stabilizing temperature strati-cation. Lowering the critical threshold C c from 42 to5 kg m
2 3 , and using the same logic as Mulder and Syvitski
(1995) , 61 rivers are likely produce hyperpycnal owsannually ( Table 3 ). Most of the rivers previously character-ized as ‘moderately dirty’ are now characterized as dirty;among these are the Eel River and the larger rivers of NewZealand and Taiwan. The 61 rivers, now characterized asdirty,produce 53%of theworld’s oceanic sediment load, andare therefore responsible for a signicant portion of theglobal sediment record. This new analysis suggests that 84%of the rivers in the database can generate hyperpycnal owsin the marineenvironment with a frequencyof more than oneevent every 100 years.
In addition to convective instability several factors canreduce the density threshold necessary to generate plunging.
† Specic geological setting . There are some areas in theworld covered by extensive soft and easily erodibledeposits, such as the wind-transported loess in China(Daling, Haile or Huanghe, Table 2 ). The loess isintensively eroded during the monsoon rains, generatingunusual suspended particle concentration at rivermouths. These rivers generate several month-longhyperpycnal ows as recorded by Wright et al. (1986,1988, 1990) . In a similar way, easily erodible black shales in Alps may account for hyperpycnal owformation at the Var river mouth.
† Extreme geologic events as jokulhaups, lahars, dambreaking or draining can create unusual ne-particle loadand generate hyperpycnal ows in clean rivers, asillustrated by the Saguenay example.
† Dilution of sea-water by fresh water during long-duration oods can decrease the concentration thresholdto initiate hyperpycnal ows. Examples includerestricted narrow basins such as fjords or canyons ormonsoon-triggered oods of Asian rivers.
† Erosion of mouth bars .
Conversely, natural processes such as coastal upwellingmay locally increase the critical threshold for initiation of hyperpycnal ows. In areas submitted to strong windsmoving from the continent to the ocean, warm surface sea-water is transported seaward and replaced by denser deep
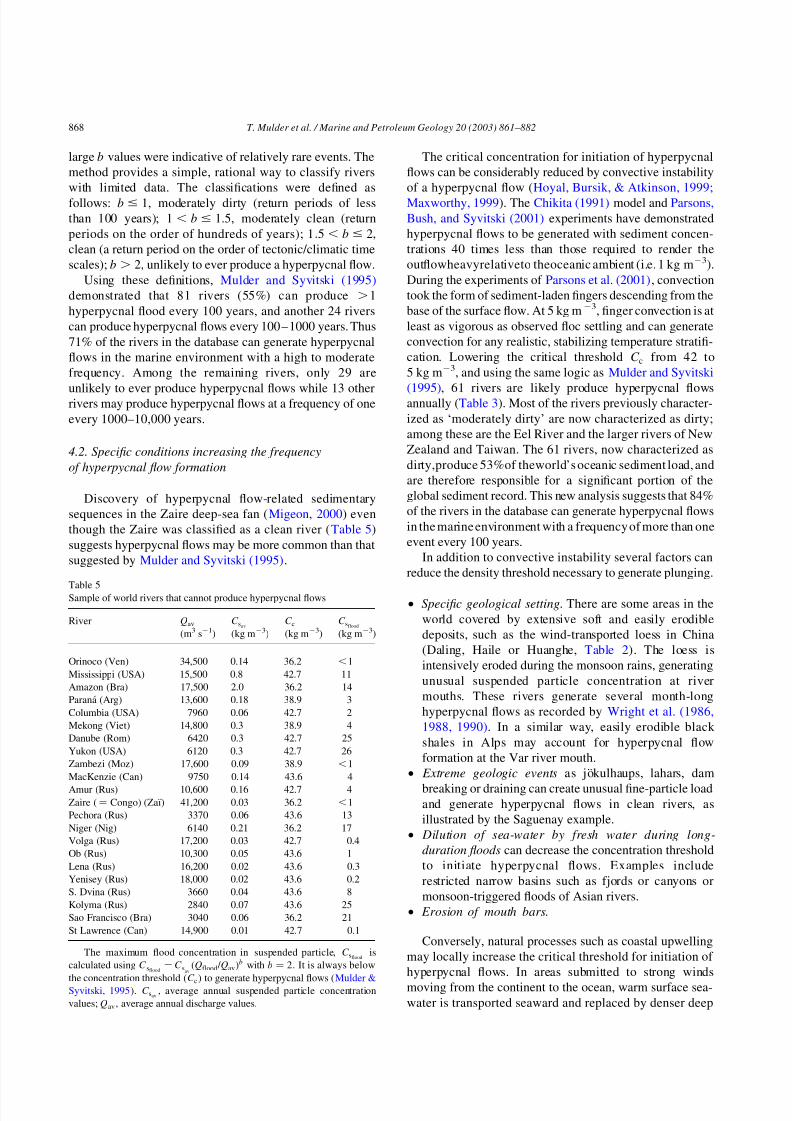
Table 5Sample of world rivers that cannot produce hyperpycnal ows
River Qav
(m3 s2 1)
C sav
(kg m2 3)
C c(kg m
2 3)C sflood
(kg m2 3)
Orinoco (Ven) 34,500 0.14 36.2 , 1Mississippi (USA) 15,500 0.8 42.7 11Amazon (Bra) 17,500 2.0 36.2 14Parana (Arg) 13,600 0.18 38.9 3Columbia (USA) 7960 0.06 42.7 2Mekong (Viet) 14,800 0.3 38.9 4Danube (Rom) 6420 0.3 42.7 25Yukon (USA) 6120 0.3 42.7 26Zambezi (Moz) 17,600 0.09 38.9 , 1MacKenzie (Can) 9750 0.14 43.6 4Amur (Rus) 10,600 0.16 42.7 4Zaire ( ¼ Congo) (Zaı ) 41,200 0.03 36.2 , 1Pechora (Rus) 3370 0.06 43.6 13Niger (Nig) 6140 0.21 36.2 17Volga (Rus) 17,200 0.03 42.7 0.4Ob (Rus) 10,300 0.05 43.6 1Lena (Rus) 16,200 0.02 43.6 0.3Yenisey (Rus) 18,000 0.02 43.6 0.2S. Dvina (Rus) 3660 0.04 43.6 8Kolyma (Rus) 2840 0.07 43.6 25Sao Francisco (Bra) 3040 0.06 36.2 21St Lawrence (Can) 14,900 0.01 42.7 0.1
The maximum ood concentration in suspended particle, C sflood iscalculated using C sflood
¼ C savðQflood = QavÞb with b ¼ 2: It is always below
the concentration threshold ðC c Þ to generate hyperpycnal ows ( Mulder &Syvitski, 1995 ). C sav ; average annual suspended particle concentration
values; Qav ; average annual discharge values.
T. Mulder et al. / Marine and Petroleum Geology 20 (2003) 861–882868

7/21/2019 Hyperpycnal Flow
http://slidepdf.com/reader/full/hyperpycnal-flow 9/22
water. This phenomenon occurs for example in south of France during southward Mistral winds.
4.3. River size versus hyperpycnal ow initiation
Rivers that can generate hyperpycnal ows are smallto medium-size with an average annual discharge, 380–460 m 3 s
2 1 . The ability to produce hyperpycnalows increases with high relief ( Milliman & Syvitski,1992). Steep slopes are observed in tectonically activebasins where ood-related deposits are frequent ( Mutti,Davoli, Tinterri, & Zavala, 1996; Mutti, Ricci Lucchi, &Roveri, 2000 ).
The Var River is a type river that produces hyperpycnalows. It is 120 km-long and connects directly into a sinuous
steep submarine canyon that feeds a 20,000 km2
deep-seafan in the Mediterranean Sea. Flash oods generated byviolent storms during spring or autumn erode black shales,providing ne suspended particles ( Mulder et al., 1998a ).Statistical analysis using river discharge and rating curvesshow that the Var can produce hyperpycnal oods with afrequency of one every 2– 5 years ( Mulder, Savoye,Syvitski, & Parize, 1997c ).
Conversely, ‘Giant’ rivers, i.e. rivers with an averageannual discharge more than 500 m 3 s
2 1 such as the Nile,the Mississippi and all the Siberian rivers have maximumood particle concentrations far below the concentrationthreshold that would generate hyperpycnal ows ( Table 5 ).
Two reasons, in addition to sediment availability, explainthe inability for large rivers to form hyperpycnal ows.First, their particle concentration is diluted by theirconsiderable volume of water. Second, giant rivers trapmuch of their sediment load within their ood plains andsubaerial deltas. In the case of the Amazon, 20% of itsannually delivered load (10 12 kg year
2 1 ) is retained withinits delta; the remaining 80% is deposited on the continentalshelf and coast with none reaching the deep sea. In the caseof the Ganges and Brahmaputra Rivers, 55% of the annualload (1.1 £ 1012 kg year
2 1) is retained within its delta; theremaining 45% is deposited on the continental shelf andcoast (36%) with 9% reaching the deep sea.
In the case of the Huanghe, 82% of the annual load(1.1 £ 1012 kg year
2 1) is retained by its delta; the remaining18% is deposited on the continental shelf and coast (36%)with none reaching the deep sea ( Meade, 1996 ).
5. Hyperpycnal ow motion
5.1. How do hyperpycnal ows plunge?
Turbidity currents generated at the river mouth consistof three distinct parts ( Kassem & Imran, 2001 ): the plungeregion, the main body, and the leading head. Each part of the current has distinct characteristics and plays animportant role in the overall ow and transport processes
(Kassem & Imran, 2001 ). The ambient-water entrainmentduring plunging affects the rest of the current. Verticalstructures of sediment concentration and velocity in themain body of the current are responsible for sustainedscour of and deposition on the basin oor. The mixing atthe leading head determines how far the current maytravel before it loses its identity. Various factors such asow Richardson and Reynold numbers, bottom slope of the basin, and conuence divergence angle inuence theplunging process including the plunge depth and locationand subsequent evolution of the current.
Only few attempts have been made to model theplunging process and subsequent generation of hyperpyc-nal ow in its entirety ( Akiyama & Stefan, 1984, 1988;Bournet, Dartus, Tassin, & Vincon-Leite, 1999; Farrell &
Stefan, 1989 ). The numerical model used by Kassem andImran (2001) successfully predicts the development of theentire process from the free-surface-ow condition at theupstream end to the formation of the turbidity currentincluding the stabilization of the plunge point. As thesediment-laden water ows in with a dominant dynamicforce, the reservoir water is pushed forward and aseparation surface becomes pronounced. When thepressure force at the bottom becomes signicant, itaccelerates the ow at the bottom at a rate higher thanthe movement at the top. As the pressure forces continueto grow, the ow plunges to the bottom and begins tomove as an underow. At this stage, the velocity at the
top surface is still signicant enough to move theplunging point forward. When the equilibrium is reached,the velocity at the top disappears, and a stable plungepoint (plunge line in a 3D ow) forms and the currentmoves forward with a bulge-shaped head and an elongatedbody.
The Eel River (Northern California) is a study areawhere hyperpycnal ow formation has been modeled andconstrained by eld data. The Eel margin extends fromCape Mendocino to Trinidad Head in northern California.It drains a 9400 km 2 basin but has the highest particle yieldfor rivers of similar or larger size in the conterminous USA(Brown & Ritter, 1971; Milliman & Syvitski, 1992 ). Itdischarges on a narrow (10– 20 km-wide) continental shelf and is one of seven rivers located in the United States thatcan produce hyperpycnal ow during a 100-year oodevent. The river experienced such a ood in 1964 andpossibly in 1995 and 1997. Surveys conducted byinvestigators of the ONR STRATAFORM program (Nittrouer,1999) immediately after the 1995 ood revealed that only, 25% of the ood sediment discharged by the Eel Riverremained on the shelf ( Wheatcroft et al., 1996, 1997 ).Storm-induced currents may play a role in resuspendingand transporting some of the ood sediment as uid-mudsuspensions traveling across the shelf as density currents(Mullenbach & Nittrouer, 2000; Scully, Friedrichs, &Wright, 2002; Sommereld & Nittrouer, 1999; Sommer-eld, Nittrouer, & Alexander, 1999; Wheatcroft &
T. Mulder et al. / Marine and Petroleum Geology 20 (2003) 861–882 869

7/21/2019 Hyperpycnal Flow
http://slidepdf.com/reader/full/hyperpycnal-flow 10/22
Borgeld, 2000 ). Hyperpycnal ows may play the dominantrole during the peak ood condition. The ow may travel
towards the adjacent Eel Canyon and deliver sediment tothe base of the continental slope. In the presence of longshelf currents, the head of the turbidity current is turnedaway from the canyon ( Imran, Parker, & Katopodes, 1998;Imran & Syvitski, 2000 ).
5.2. How are hyperpycnal ows maintained on the seaoor?
When hyperpycnal ows form at a river mouth, theyplunge because of high suspended concentrations possiblyaided by convective instability. During transport, suspendedparticles begin to settle and particle concentration willdecrease. If the excess density is not maintained, the
hyperpycnal ow may disconnect from the seaoor, andow as a water mass within the ocean’s general circulation.
Mulder, Syvitski, and Skene (1998b) and Skene, Mulder,and Syvitski (1997) have modeled several eld cases of marine hyperpycnal ow. They showed that a hyperpycnalow is maintained along the seaoor because: (1) entrain-ment of sea-water into the ow progressively increases thedensity of the water phase while dilution of the suspendedparticle concentration decreases the internal friction and (2)erosion of the seaoor increases ow density (drivingforce). Along the travel path of the 1663 AD Saguenayevent, density of the modeled interstitial uid reached1020 kg m
2 3 at 5 km from the river mouth and1027 kg m
23 (i.e. the density of the ambient ocean water)
at 22 km where deposition began ( Fig. 7).
5.3. Differences with slide-induced ows
Hyperpycnal ows have several particularities that maketheir hydrodynamic behavior different than the behavior of turbulent surges ( Ravenne & Beghin, 1983 ) that results of the transformation of slides or debris ows ( Table 6 ).
In hyperpycnal ows, the initial internal uid is freshwater. This necessitates the maintenance of negativebuoyancy by suspended sediment for plunging. Thedriving force responsible for the downward motion islikely smaller for a hyperpycnal ow than for a slide-induced ow. In a hyperpycnal ow, the initial particle
concentration is lower than for a turbulent surge. Asshown in Fig. 7, particle concentration remains above thecritical threshold but is never very high (42–100 kg m
2 3 ).The threshold (42 kg m 2 3 ; Table 1 ) is equivalent to avolume concentration of 1.5%, well within the criteria forautosuspension (volume concentration , 9%; Bagnold,1962). In a slide-triggered ow, the initial ow density iscloser to the density of the in situ sediment at the initialfailure location (1300– 1700 kg m
2 3 ) . After s lideinitiation, the particle concentration rapidly decreasesdue to uid entrainment. The ow transforms into ahyperconcentrated or concentrated ow. In some cases,because the original uid is already dense salt water,surge turbidity currents can maintain a driving force withvery low particle concentration i.e. a few kg m
2 3 . This is
the case for the ows recorded by Gennesseaux, Guibout,and Lacombe (1971) in the Var Canyon ( Mulder et al.,1997b ). Such low concentrations can also be observed inhyperpycnal ows but only in the most distal part of theirtravel, when the interstitial uid density substantiallyincreases because of water entrainment ( Table 6 ).
The initial presence of fresh water in hyperpycnal owswill strongly reduce the density difference between ow andambient water. As demonstrated in laboratory hyperpycnalows (Alexander & Mulder, 2002 ) hyperpycnal ows arelargely slower than turbulent surges moving on the sameslopes. Numerical modeling of the slide-generated turbulentsurge that affected the Var canyon in 1979, and the 1663 AD
hyperpycnal ow in the Saguenay fjord, also highlight thisdifference. The velocity of the 1979 Var surge is estimatedto have reached 30–40 m s
2 1 in the upper part of thecanyon, and 5 –10 m s
2 1 in the middle fan valley ( Mulder,Savoye, & Syvitski, 1997a; Piper & Savoye, 1993 ). TheSaguenay ow reached 2 m s
2 1 but more typically owed at, 1 m s
2 1 over its travel path.Hyperpycnal ows can be described as slow, turbulent,
ows with their density largely remaining low along their
Fig. 7. Synthetic curves showing the modeled evolution with distance of volume concentration, density of interstitial uid and ow density withdistance for the 1663 Saguenay hyperpycnal ow ( Mulder et al., 1998b ).
Table 6Behavior of hyperpycnal and slide-induced ows
Hyperpycnal ows Surge-induced ow
Minimum threshold of particle concentrationfor triggering
No minimum thresholdof particle concentrationfor triggering
Initial concentration:5(?)–200 kg m
2 3Conc: , 1–1500 kg m
2 3
Flow velocity: , 2 m s2 1 Flow velocity: , 4 m s
2 1
. 10 m s2 1 on steep slopes
Thick and long ow.No individual ow head
Thick ow. Well-denedow head, body and tail
Quasi-steady ows Unsteady owsDuration: minutes to weeks Duration: minutes to hours
Synthesis of in situ observations ( Gennesseaux et al., 1971 ), laboratoryexperiments ( Alexander & Morris, 1994; Alexander & Mulder, 2003;
Garcia, 1994; Garcia & Parker, 1984, 1989; Laval et al., 1988; Luthi, 1981;Middleton, 1967; Mulder & Alexander, 2001; Ravenne & Beghin, 1983 ),and numerical modeling ( Mulder et al., 1998b; Skene et al., 1997 ).
T. Mulder et al. / Marine and Petroleum Geology 20 (2003) 861–882870

7/21/2019 Hyperpycnal Flow
http://slidepdf.com/reader/full/hyperpycnal-flow 11/22
travel path. They t the description of the ‘low-densityturbidity currents’ of Lowe (1982), Mulder and Cochonat(1996), and Nardin et al. (1979) . Conversely, slide-inducedsurge turbidity currents represent the transformation of fastmoving ows through ignition ( Emms, 1999; Parker, 1982 ).The high velocity is due to the initial driving force andpossibly the reduction of basal friction through hydroplaning(Mohrig, Whipple, Hondzo, Ellis, & Parker, 1998 ). In thisseries of transformations, ow concentration and densityboth constantly decrease due to water entrainment. Most of the members of this style of ow are regarded as the ‘high-density turbidity currents’ of Lowe (1982), Mulder andCochonat (1996), and Nardin et al. (1979) . This highlightsthe meaning of the term ‘hyperpycnal’. Hyperpycnal means‘above a density threshold’ and not ‘high density’.
† Surge-type turbidity currents have a strong concentrationgradient ( Kneller & Buckee, 2000; Stacey & Bowen,1988). This suggests that base and top of the ow canbehave differently. Hyperpycnal ows have a moregradual vertical gradient in particle concentration(Mulder & Alexander, 2001 ).
† Hyperpycnal ows arequasi-steady ( Mulder& Alexander,2002). That means their velocity increases and decreasesslowlywithtime.This characteristic is relatedto their oodorigin, i.e. an event during which both river discharge andvelocity increase, pass through a peak, and then decrease.As a strong part of the discharge increase includes changes
in river depth and width, river velocity increases moreslowly than river discharge. Quasi-steadiness allows moresimple numerical models to be applied to hyperpycnalows. Turbulent surges which are typical unsteady owsthat accelerate shortly after the triggering and thendecelerate rapidly require more complex models ( Pratson,Imran, Hutton, Parker, & Syvitski, 2001 ).
6. Flood-related deposits
6.1. Hyperpycnal ow deposits: hyperpycnites
The type-hyperpycnal sequence is dened by Mulder,Migeon, Savoye, and Fauge`res (2001a) (Fig. 10a and b ). Toavoid misunderstanding between ow deposits and theirhydrodynamic behavior, Mulder and Alexander (2001)restrain the term ‘turbidite’ to deposits from true turbiditycurrents, i.e. currents in which support of suspendedparticles is mainly due to turbulence. Hyperpycnal sequencebelongs to this category and their related deposits areturbidites. The sedimentary sequences deposited by surgeturbidity currents are signicantly different from turbiditebeds or ‘hyperpycnites’ resulting from hyperpycnal ows(Mulder, Migeon, Savoye, & Fauge `res, 2002 ). Thecomplete sequence is explained by the shape of the oodhydrograph and predicted by the acceleration matrix of Kneller (1995) and Kneller and Branney (1995) (Fig. 8).
During the increasing or waxing discharge period at theriver mouth, the hyperpycnal ow will develop a coarsen-ing-up basal unit, Ha ( Figs. 9 and 10 ; Mulder et al., 2001a ).During the decreasing or waning discharge period at theriver mouth, the hyperpycnal ow will deposit a ning-uptop unit, Hb ( Figs. 9 and 10 ). The complete hyperpycnite isthese two stacked units ( Figs. 8– 10a, b ). The Ha–Hbtransition corresponds to the maximum grain size and marksapproximately the peak of the ood, i.e. the period of maximum energy (discharge) at the river mouth, exceptwhen the ood hydrograph shows a plateau in discharge of particle concentration ( Fig. 5c and d ).
Bourcart (1964) described cores from the Var systemcontaining similar beds with grain size rst increasing fromsilt to sand andthen decreasing to silt. In addition to these twounits, a typical hyperpycnite contains sedimentary structuresthat are attributed to ripple migration ( Fig. 10a and b ). Themost common structures are climbing ripples ( Migeon et al.,2001; Mulderet al., 2002; Mutti et al., 2002 andthis volume ),which suggests particle deposition larger than particletransport. The presence of both sedimentary structures anda clear sorting suggest that the ows are low-concentrated
and that particle settling and traction acts simultaneously.Hyperpycnites show laminae that represent hydrodynamicuctuation in the bottom boundary layer of a single turbulentow(Hesse & Chough, 1980 ). Bourcart (1964) noted that thesand-silt-sand beds in the Var system contained abundantorganic matter with Chara oogoniums and abundant leavesof continental species. These occurrences suggest a con-tinental source for much of these sediments. Linier (2001)and Linier et al. (2001) noted that evolution of grain-sizeparameters (sorting, mode, asymmetry) show a differentvertical evolution in hyperpycnites and in sequencesdeposited from slide-triggered turbulent surges.
Pulses of the hyperpycnal ow due to variations in theood hydrograph could be at the origin of minorintrasequence erosion at the base of coarse ne laminae
Fig. 8. The acceleration matrix from Kneller (1995) and Kneller andBranney (1995) . The predicted Bouma sequence resulting from the
deposition of a waning surge is dashed. Plain lines circle two stackedunits of a hyperpycnite: the basal coarsening-up unit deposited by a waxingow and the top ning-up unit deposited by the waning ow.
T. Mulder et al. / Marine and Petroleum Geology 20 (2003) 861–882 871

7/21/2019 Hyperpycnal Flow
http://slidepdf.com/reader/full/hyperpycnal-flow 12/22
doublets. These intrasequence erosional contacts had beenproduced by laboratory experiments simulating a continu-ous ow (Duringer, Paicheler, & Schneider, 1991 ). Theseauthors show facies in ancient deposits that could beinterpreted as hyperpycnites, with arenite– siltite alterna-tions or lenses, laminated ne-grained sequences andnumerous intrasequence erosional contacts. Similar bedshave been recognized in the Var and Zaire turbidite systems(Fig. 10a and b ) and in ancient environments ( Mavilla,2000; Mutti et al., 1996, 2000, 2002 and this volume ;
Fig. 10c ). In the case of a low-magnitude ood but with asufcient discharge to create a hyperpycnal ow (curve 2 inFig. 9), the transition between Ha and Hb is gradational. Inthis case, the hyperpycnite can be mistaken with contouritebeds dened by Gonthier, Fauge res, and Stow (1984) ,particularly if bioturbation is intense.
If the particle concentration–discharge curve shows noplateau, both ow energy and competency increase slowly,pass through a peak and then decrease slowly. There is nochange in the sedimentary structures deposited before,during and after peak ood conditions. However, as thecomplete Bouma sequence is an exception, the completehyperpycnite sequence also suffers many exceptions andbase truncated hyperpycnite sequences might be morecommon than the complete sequence.
During higher magnitude ood conditions (curve 3 inFig. 9), the discharge and velocity reached during the oodpeak can be high enough to prevent deposition.
Deposition occurs only when the velocities drop duringthe period of fall of discharge, and the change in grain-sizetrend is associated with a sharp contact. During peak conditions of a high-magnitude ood, the Ha unit can becompletely eroded and the contact between Ha and Hb iserosive (curve 4 in Fig. 9). This erosion during peak oodconditions generates an intrasequence erosional contact. In
this case, there is a shape convergence between the base-truncated hyperpycnite and a classical Bouma-like turbiditesequence deposited by a turbulent surge. Examples of hyperpycnal sequences in ancient environments provided byMutti et al. (2002) and Mutti et al. (this volume) suggest thatpreservation of the unit deposited by the waxing ow is rare.A complete discussion of diagnostic features to differentiatehyperpycnite, contourites and classical turbidites is made inMulder at al. (2002) and summarized in Table 7 .
Deposition of hyperpycnites at the mouth of rivers thatgenerate high-frequency turbidity currents can lead to localhigh sedimentation rates. Mulder, Migeon, Savoye, andJouanneau (2001b) showed that a core located on a terraceat the mouth of the Var canyon, at 1970 m water depth hadsedimentation rates of 1.2–1.6 m per century, for the last
Fig. 9. Facies and sequences deposited as a function of the magnitude of the ood at the river mouth. (1) low magnitude ood. The maximum discharge is lessthan the critical discharge to produce hyperpycnal ows. Failure-induced turbidity currents are generated. (2) Low magnitude ood. The maximumdischarge ismore than the critical discharge to produce hyperpycnal ows. Hyperpycnal ow forms. A complete sequence with a transitional boundary between inverselygraded unit Ha and normally graded unit Hb is deposited. (3) Mid-magnitude sequence. Identical to B but grain size can be coarser and sequence thicker. Sharpcontact between Ha and Hb. (4) High-magnitude ood. Same as C but particle deposited are coarser. Erosional surface exists between Ha and Hb. Ha may have
been completely erodedduring peak ood conditions.Cl, clay; fs,ne silt; ms,medium silt, cs, coarsesilt;fsa, nesand;msa, mediumsand (from Mulderet al.,2001a ).
T. Mulder et al. / Marine and Petroleum Geology 20 (2003) 861–882872

7/21/2019 Hyperpycnal Flow
http://slidepdf.com/reader/full/hyperpycnal-flow 13/22
100 and 50 years, respectively. Thirteen to fourteenhyperpycnites were recorded during the last 100 years and9– 10 were recorded during the 50 last years, whichrepresents a frequency of one hyperpycnal ow every5–7.5 years. This is consistent with the statistical prediction(Mulder et al., 1997c, 1998a ). In the northwestern Bay of Biscay, Zaragosi et al. (2001) described laminated clay andsilty clay layers, intensely laminated and containing speciesof an estuarine dinocyst and a fresh water alga ( Fig. 10d ).This occurrence dated 15–14.4 BP indicates an increase inEuropean river discharge probably related to melting of theBritish ice sheet and Alpine glaciers. This suggests thatglobal ice melting could be related to ice-melt intervals. Themelting of the Laurentide ice and European ice sheets at theend of the last ice-age could have produced extended majorhyperpycnal deposits such those observed in the NAMOCarea (North Atlantic; Hesse & Khodabakhsh, 1998; Hesse
et al., 1996 ). These sequences would be associated with theperiod of increased sedimentation of ice-rafted debris(Heirich events).
Hyperpycnites show that:
† turbidites (i.e. deposits resulting from turbidity currents)can generate coarsening-up facies;
† a waxing ow can form sedimentary structures ( Migeonet al., 2001; Mulder et al., 2001a, 2002 ).
† the presence of erosional or sharp contacts cannot beused anymore as a criteria to dene sequence boundariesbecause high-magnitude oods form such contactsduring peak-ood conditions and the bases of laminaemight also show erosion. This can lead to a complete re-interpretation of ne-grained series deposited in a river-fed environment such as the beds described by Piper andDeptuck (1997) in the Amazon fan.
Fig. 10. Complete hyperpycnal turbidite sequence in the Var (A) and Zaire (B) turbidite systems. Note the superposition of the coarsening-up unit, Ha, and thening-up unit, Hb). (C) Ancient hyperpycnite in the Oligocene Tertiary Piemont Basin, Southern Apennines, Italy (Photograph courtesy of Nicola Mavilla).Arrows indicate extension of single hyperpycnite sequences (D). Fine laminated sequence related to ice melting at the end of the last ice age. I.R.D., ice-rafteddetritus.
T. Mulder et al. / Marine and Petroleum Geology 20 (2003) 861–882 873
7/21/2019 Hyperpycnal Flow
http://slidepdf.com/reader/full/hyperpycnal-flow 14/22
These new turbidite beds are of major conceptualimportance because they bring evidence against severaldogmas and paradigms that are related to the initialdiscovery of turbidites ( Bouma, 1962; Kuenen, 1952, 1953 ).
6.2. Particular hyperpycnites
The draining or breaking of natural and articial damsand jokulhaups, also form particular hyperpycnites thatstrongly mimic Bouma-like turbidite sequences.
During these catastrophic extreme events, the riverdischarge does not follow a classical hydrograph with risingand falling limbs. The hydrograph shows an instantaneousincrease in discharge. Discharge values reach quickly a peak and then decrease exponentially. This corresponds tolaboratory simulations of surges ( Alexander & Mulder,2003; Garcia, 1994; Garcia & Parker, 1989; Laval, Cremer,Beghin, & Ravenne, 1988; Ravenne & Beghin, 1983 ). In thiscase, the hydrodynamic behavior of the ow is highly
unsteady, as it is for a slide-induced turbulent surge.However, there are two major differences between thebehavior of ‘dam-break hyperpycnal ow’ and slide-inducedturbulent surges. (1) In a ‘dam-break ow’, the interstitialuid is initially fresh water. At the continent– oceanboundary or at the aerial–lacustrine interface, a concen-tration threshold is necessary to generate plunging. It is ahyperpycnal process. (2) The particle concentration might behigher in dam-break hyperpycnal ow than in ood-relatedhyperpycnal ow, but the ow density never reaches valuesas high as in the case of slide-induced turbidity currents. Forthese reasons, we propose to name as ‘dam-break hyperpyc-nal surges’ theows resultingof breaking of dams, including jokulhaups. In the case in which the failure of the dam is dueto a ood, the ow can be sustained a long time before and
after the passage of the surge. A classical hyperpycnal owwill precede and follow the surge.
Particular hyperpycnites formed by the draining orbreaking of dams or jo kulhaups are hypothesized inFig. 11 . During an articial dam break or a jo¨kulhaup(Fig. 11a ), a mass ow (hyperconcentrated, concentrated ordebris ow) can form simultaneously with an unsteady,turbulent hyperpycnal surge. Deposits will show a ning-upsequence with a basal contact showing intense erosion(Fig. 11a ). As the mass ow moves slower than the turbulentsurge ( Mohrig et al., 1998 ), a mass ow deposit can besuperposed or intercalated with a classical Bouma-likesequence. Both sequences are almost synchronous.
In the case of a natural dam break occurring duringa ood, at least two sequences will be superposed. The basalsequence will be a classical mass ow deposit or a Bouma-like turbidite. This sequence is contemporaneous with theriver damming. It is directly related to the slide event thandammed the river or to one of the multiple earthquake-induced failures if the damming is due to an earthquake. The
top sequence ( Fig. 11b ) is related to the breaking of the dam.It is identical to the sequence formed by a jo ¨kulhaup, i.e. atop cut-out hyperpycnite indicating the beginning of theood capped with either a mass ow or a hyperconcentratedow deposit. The end of the ood can be recorded as a basecut-out hyperpycnite. The whole series is close to bedsdescribed by Mutti et al. (2002 and this volume) in theMarnoso-arenacea Formation.
In the case of dam erosion during a ood, again severalsequences will be superposed ( Fig. 11c ) but they are notdeposited simultaneously. The basal sequence will be amass ow deposit or a Bouma-like sequence related to aslide triggered simultaneously to the damming. The topsequence is the real sequence of dam draining. It will be aclassical hyperpycnite with both the coarsening and
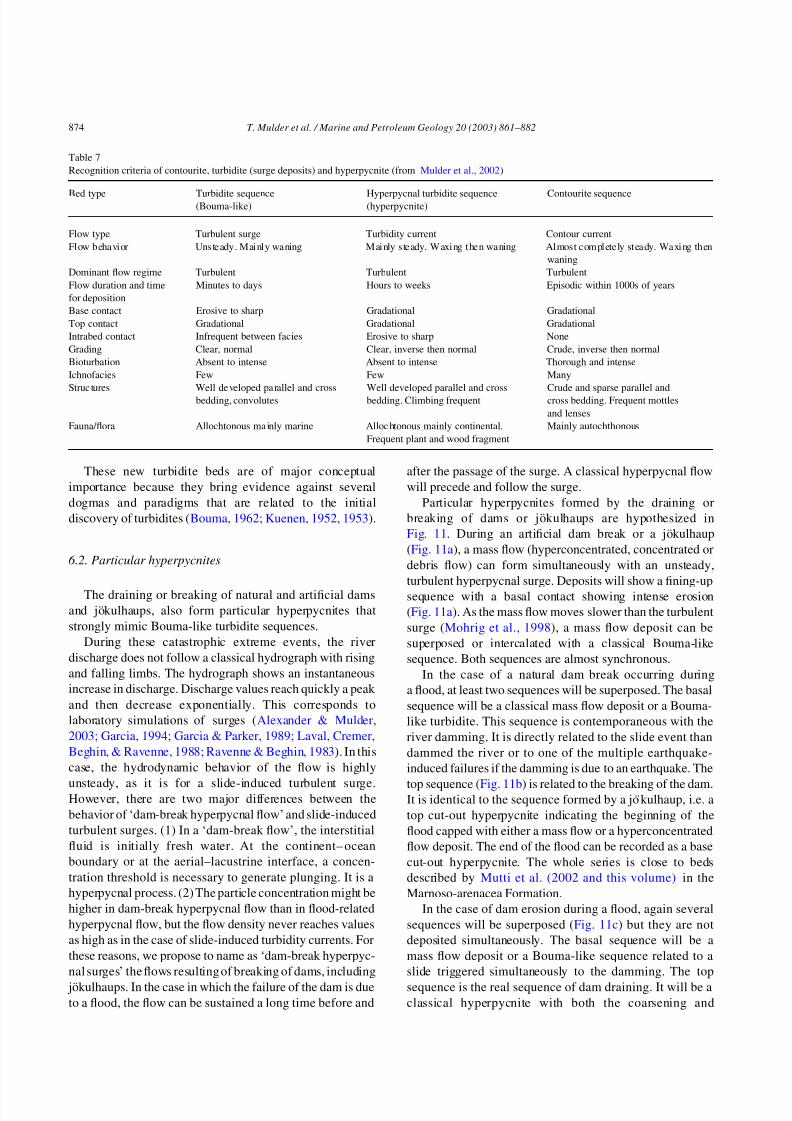
Table 7Recognition criteria of contourite, turbidite (surge deposits) and hyperpycnite (from Mulder et al., 2002 )
Bed type Turbidite sequence(Bouma-like) Hyperpycnal turbidite sequence(hyperpycnite) Contourite sequence
Flow type Turbulent surge Turbidity current Contour currentFlow behavior Unsteady. Mainly waning Mainly steady. Waxing then waning Almost completely steady. Waxing then
waningDominant ow regime Turbulent Turbulent TurbulentFlow duration and timefor deposition
Minutes to days Hours to weeks Episodic within 1000s of years
Base contact Erosive to sharp Gradational GradationalTop contact Gradational Gradational GradationalIntrabed contact Infrequent between facies Erosive to sharp NoneGrading Clear, normal Clear, inverse then normal Crude, inverse then normalBioturbation Absent to intense Absent to intense Thorough and intenseIchnofacies Few Few Many
Structures Well developed parallel and crossbedding, convolutes Well developed parallel and crossbedding. Climbing frequent Crude and sparse parallel andcross bedding. Frequent mottlesand lenses
Fauna/ora Allochtonous mainly marine Allochtonous mainly continental.Frequent plant and wood fragment
Mainly autochthonous
T. Mulder et al. / Marine and Petroleum Geology 20 (2003) 861–882874

7/21/2019 Hyperpycnal Flow
http://slidepdf.com/reader/full/hyperpycnal-flow 15/22
ning-up units. In this case, the top sequence will be welldeveloped because the presence of a large amount of easily-erodible material generates a high particle load as happenedin 1663 AD in the Saguenay.
Lahars are triggered by heavy rainfalls. Lahars-relatedhyperpycnites ( Fig. 11d ) show a lahar deposit intercalatedwith a hyperpycnite. As it is related to sudden erosion of softmaterial, and high energy ow, the base of the hyperpycnitemight be not deposited or eroded.
In these examples of particular hyperpycnites, thesedimentary record show stacked beds indicating severalprocesses that are either simultaneous or separated by ashort period of time. Such associations have been observed
in lakes ( Linier, 2001 ) and in the Saguenay Fjord(Saint-Onge et al., in press ).
6.3. Changes in hyperpycnite deposition with relative sea-level changes
Evolution of activity of hyperpycnal ows with relativesea-level changes and/or climatic changes should beimportant as hyperpycnal ows are mainly related to oodmagnitude and frequency. As discharge and particle loadare controlled by climate (latitude, mean temperature)and drainage basin morphology (surface and altitude), wecan estimate the evolution of hyperpycnal ow activity
Fig. 11. Flood hydrographs and sedimentary sequences for hyperpycnal turbulent surges. (A) Articial dam break or a jo ¨kulhaups: the hydrograph shows aninstantaneous peak and then discharge decreases rapidly. (A) ning-up sequence followed by a mass ow deposit. (B) Natural dam break: the ood hydrographshows a peak intercalated in an increasing discharge period. Two sequences are stacked. The basal sequence (not represented) is a mass ow depositcontemporaneous of the damming. The top sequence is due to the dam breaking and shows the same sequences as in (A). (C) Erosion of a natural dam. Twosequences are stacked. The basal sequence is a mass ow deposit contemporaneous of the damming. The top sequence is a classical hyperpycnite (1663 ADSaguenay example). (D) Hyperpycnal ow resulting from transformation of a lahar. A complete or truncated hyperpycnite caps a lahar deposit.
T. Mulder et al. / Marine and Petroleum Geology 20 (2003) 861–882 875
7/21/2019 Hyperpycnal Flow
http://slidepdf.com/reader/full/hyperpycnal-flow 16/22
as follows: Hyperpycnal activity (frequency and magnitude)will increase if:
† climate becomes more arid (colder or warmer): reductionof vegetal cover and increase of temperature variationswill intensify erosion and so will suspended particleconcentration,
† relative sealevelfalls in an area with a reduced continentalshelf. Rivers discharge directly in canyon heads,
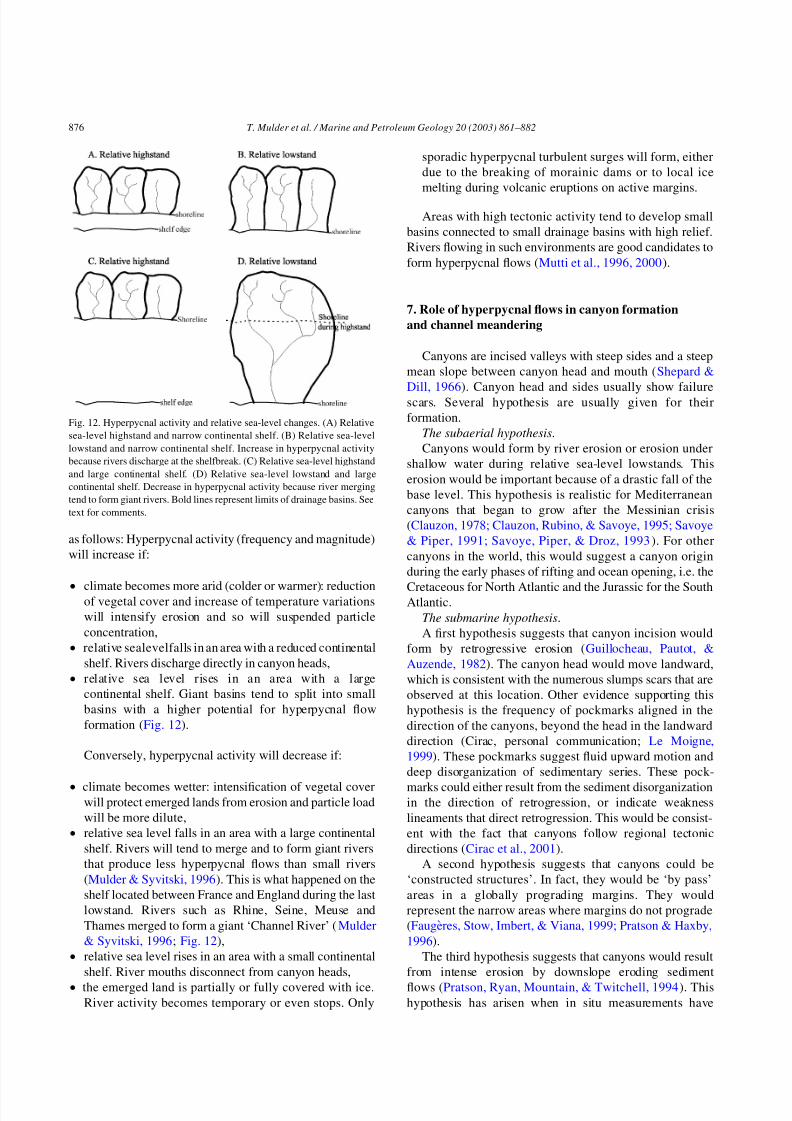
† relative sea level rises in an area with a largecontinental shelf. Giant basins tend to split into smallbasins with a higher potential for hyperpycnal owformation ( Fig. 12).
Conversely, hyperpycnal activity will decrease if:
† climate becomes wetter: intensication of vegetal coverwill protect emerged lands from erosion and particle loadwill be more dilute,
† relative sea level falls in an area with a large continentalshelf. Rivers will tend to merge and to form giant riversthat produce less hyperpycnal ows than small rivers(Mulder & Syvitski, 1996 ). This is what happened on theshelf located between France and England during the lastlowstand. Rivers such as Rhine, Seine, Meuse andThames merged to form a giant ‘Channel River’ ( Mulder& Syvitski, 1996 ; Fig. 12),
† relative sea level rises in an area with a small continentalshelf. River mouths disconnect from canyon heads,
† the emerged land is partially or fully covered with ice.River activity becomes temporary or even stops. Only
sporadic hyperpycnal turbulent surges will form, eitherdue to the breaking of morainic dams or to local icemelting during volcanic eruptions on active margins.
Areas with high tectonic activity tend to develop smallbasins connected to small drainage basins with high relief.Rivers owing in such environments are good candidates toform hyperpycnal ows ( Mutti et al., 1996, 2000 ).
7. Role of hyperpycnal ows in canyon formationand channel meandering
Canyons are incised valleys with steep sides and a steepmean slope between canyon head and mouth ( Shepard &
Dill, 1966 ). Canyon head and sides usually show failurescars. Several hypothesis are usually given for theirformation.
The subaerial hypothesis .Canyons would form by river erosion or erosion under
shallow water during relative sea-level lowstands. Thiserosion would be important because of a drastic fall of thebase level. This hypothesis is realistic for Mediterraneancanyons that began to grow after the Messinian crisis(Clauzon, 1978; Clauzon, Rubino, & Savoye, 1995; Savoye& Piper, 1991; Savoye, Piper, & Droz, 1993 ). For othercanyons in the world, this would suggest a canyon originduring the early phases of rifting and ocean opening, i.e. the
Cretaceous for North Atlantic and the Jurassic for the SouthAtlantic.The submarine hypothesis .A rst hypothesis suggests that canyon incision would
form by retrogressive erosion ( Guillocheau, Pautot, &Auzende, 1982 ). The canyon head would move landward,which is consistent with the numerous slumps scars that areobserved at this location. Other evidence supporting thishypothesis is the frequency of pockmarks aligned in thedirection of the canyons, beyond the head in the landwarddirection (Cirac, personal communication; Le Moigne,1999). These pockmarks suggest uid upward motion anddeep disorganization of sedimentary series. These pock-marks could either result from the sediment disorganizationin the direction of retrogression, or indicate weaknesslineaments that direct retrogression. This would be consist-ent with the fact that canyons follow regional tectonicdirections ( Cirac et al., 2001 ).
A second hypothesis suggests that canyons could be‘constructed structures’. In fact, they would be ‘by pass’areas in a globally prograding margins. They wouldrepresent the narrow areas where margins do not prograde(Fauge res, Stow, Imbert, & Viana, 1999; Pratson & Haxby,1996).
The third hypothesis suggests that canyons would resultfrom intense erosion by downslope eroding sedimentows (Pratson, Ryan, Mountain, & Twitchell, 1994 ). Thishypothesis has arisen when in situ measurements have
Fig. 12. Hyperpycnal activity and relative sea-level changes. (A) Relativesea-level highstand and narrow continental shelf. (B) Relative sea-levellowstand and narrow continental shelf. Increase in hyperpycnal activitybecause rivers discharge at the shelfbreak. (C) Relative sea-level highstandand large continental shelf. (D) Relative sea-level lowstand and largecontinental shelf. Decrease in hyperpycnal activity because river mergingtend to form giant rivers. Bold lines represent limits of drainage basins. Seetext for comments.
T. Mulder et al. / Marine and Petroleum Geology 20 (2003) 861–882876

7/21/2019 Hyperpycnal Flow
http://slidepdf.com/reader/full/hyperpycnal-flow 17/22
revealed a sporadic or continuous activity of particle-laden ows in canyons ( Gennesseaux et al., 1971; Hay,1987; Inman, 1970; Shepard & Dill, 1966; Shepard,Marshall, McLoughlin, & Sullivan, 1979; Shepard,McLoughlin, Marshall, & Sullivan, 1977; Weirich,1984). Because major canyons are usually connected toa river (Amazon; Hiscott et al., 1997 ; Zaire; Droz, Rigaut,Cochonat, & Tofani, 1996; Savoye et al., 2000 ), thecanyon head is located in an area where sedimentaccumulation rates are important. The importance of erosion suggests that canyons are formed by either veryfrequent slide-induced turbulent surges or by long-duration hyperpycnal ows.
The recent discovery of a turbidite deposited in 1999 inthe Capbreton canyon ( Mulder, Weber, Anschutz, Jorissen,
& Jouanneau, 2001c ) or hyperpycnal activity in the Varcanyon tends to support this hypothesis. At least, thisimportant turbidity current activity during the presentrelative highstand of sea-level suggests that the freshnessof the present submarine canyon located seaward of a rivermouth is due to sporadic turbidity current activity, and thathyperpycnal processes represents a substantial part of thisactivity.
Another evidence supporting the role of hyperpycnalowsin construction of deep-sea turbiditesystemsconnectedto a river is the frequent meandering shape of channels inchannel–levee complexes. Channels tend to have highsinuosity dened as the measurement of the trend of a ow
to move in a straightforward direction. Meanders can be dueto the resistance of any ow at its basal interface ( Gorycki,1973). This would explain that meanders are ubiquitousfeatures of channels in various environments. Meanderingdepends on hydrodynamic and morphologic thresholds. Achannel remains straight for low slopes. Above a slopethreshold, meanders form ( Schumm & Khan, 1972 ).
Conversely, an increase in discharge that can be relatedto an increase in slope, tends to increase sinuosity but alsodecreases the slope threshold to generate meander for-mation. As a consequence, meanders will appear for high-discharge ow moving on low slopes or lower dischargeows moving along slightly steeper slopes. These obser-vations suggest that meanders would occur on moderate tolow slopes by high-energy, low-concentrated ows main-tained over long periods ( Leopold & Maddock, 1953;Rigaut, 1997; Schumm, 1981; Schumm & Kahn, 1972 ).Hyperpycnal ows are excellent candidates to explain theorigin of meandering in deep channels and submarinecanyons.
There are many other currents that are not related tosediment transport that could erode canyons. In the polarregions where sea ice forms, associated brine rejectioncause density currents to ow across continental shelves andaccelerate down the slope. These currents ow at velocitiesgreat enough to erode the seaoor. They occur annually andmay last for weeks to months ( O’Grady & Syvitski, 2003 ).Similar lasting currents form during cooling episodes along
many margins. For example density currents that are cooledduring the Mediterranean winter ow at high velocitiesdown the oor of the Adriatic, and also across the Gulf of Lions and down canyons each year (Canals, personalcommunication, 2002).
Finally tidally generated currents and the breaking of internal waves offer still other mechanisms to erode thecontinental slope and contribute to the formation andmaintenance of canyons.
8. Conclusions and perspective
Marine hyperpycnal ows form when fresh waterefuent discharges into the ocean with a suspended
mater content of 36–43 kg m2 3
. These limits can besubstantially decreased by convective instability and localhydrodynamic or climatic conditions. Hyperpycnal turbu-lent surges can also form when an articial or a naturaldam breaks or drains. They may form due to the action of jokulhaups or lahars. This suggests that probably most of the world rivers can generate sporadic to frequenthyperpycnal ows.
Hyperpycnal ows are frequent in lakes where only smallparticle concentrations are necessary for plunging. Theyhave been monitored at sea at the mouth the Huanghe(China), one of world’s dirtiest rivers. They can last hours tomonth. Because they are triggered during large or extreme
oods, they can bring a considerable volume of particlestowards the sea. They might represent a large proportion of ne-grained turbidite deposited in river-fed turbidite sys-tems. A major difference between hyperpycnalprocessesandclassical slide-induced turbidity currents, is that the initialinternal uid of hyperpycnal ows is fresh water. Thisstrongly reduces the difference between ow and ambientwater densities and explains why hyperpycnal ows areslow-moving and turbulent ignitive surges are initially fast-moving ows. In addition, hyperpycnality has to bemaintained despite particle deposition. This is achieved byentrainment and mixing of salt water with the ambient uid.As they are usually long-duration phenomena, hyperpycnalows canaffectthe biology andchemistry of environmentsinwhich they form, particularly when in restricted environ-ments such as fjords, inlets, canyons or pounded basins.
Deposits related to ood-generated turbidity currentshave been discovered in recent deposits of the SaguenayFjord, the Var and Zaire deep-sea fans. High sedimentationrates observed on margins that once received ice-meltduring the last glacial period could be due to numeroushyperpycnite stacking that deposited during periods of icemelting. In the Oligocene series of the Apennines, smallriver-fed basins in tectonically active environments showalso evidence of hyperpycnites. The two-unit sequence thatforms a complete hyperpycnite is related to the evolutionof the ood hydrograph. The basal coarsening-up unitis deposited by the waxing ow generated during
T. Mulder et al. / Marine and Petroleum Geology 20 (2003) 861–882 877

7/21/2019 Hyperpycnal Flow
http://slidepdf.com/reader/full/hyperpycnal-flow 18/22
the increasing discharge period and the top ning-up unit isdeposited by the waning ow generated during thedecreasing discharge period. These sequences can bebase-truncated due to erosion by high-velocity owsdeveloped during peak condition of high-magnitude oods.Intrabed contacts can be frequent. Hyperpycnal surgesdeposit sequence couplets. The mass-ow deposit caps or isintercalated in a ning-up sequence with heavy erosion at isbasal contact. Hyperpycnal deposition can generate sedi-mentation rates that are locally larger than 10 m ky
2 1 .Hyperpycnal processes could also play an important role incanyon formation and in the origin of meanders in deep-seachannels. Because they are related to climate through oodfrequency and magnitude, they are subject to variationsduring climatic and eustatic variations. The way they vary,
increase or decrease in their frequency and magnitude,depends of the climatic changes (wetter or dryer) and themorphology of the continental shelf at a river mouth. Thischaracteristic suggests that hyperpycnites are good tools todecipher climatic archives in sedimentary rocks depositedun a deep marine environment.
Acknowledgements
Jan Alexander, Jasim Imran, Nicola Mavilla, EmilianoMutti, Gary Parker, Jeff Parsons, David Piper, Lincoln
Pratson, Jean-Jacques Tiercelin, Guillaume Saint-Onge,and Sebastien Zaragosi are thanked for their insights andadvances that we have incorporated into our review paper.Brad Prather and Gary Scott Steffens are thanked for thesubstantial review of the paper. UMR CNRS 5805 EPOCContribution number 1461.
References
Akiyama, J., & Stefan, H. G. (1984). Plunging ow into a reservoir—theory. Journal of Hydraulic Engineering , 110 , 484–499.
Akiyama, J., & Stefan, H. G. (1988). Turbidity-current simulation in a
diverging channel. Water Resources Research , 24 , 579–587.Alexander, J., & Morris, S. (1994). Observations on experimental,nonchannelized, high-concentration turbidity currents and variationsin deposits around obstacles. Journal of Sedimentary Research , A64,899–909.
Alexander, J., & Mulder, T. (2002). Experimental quasi-steady densitycurrent.. Marine Geology , 186 , 195–210.
Arnaud, F., Linier, V., Desmet, M., Revel, M., Beck, C., Paterne, M.,Pourchet, M., & Tribovillard, N. (2001). Carottage long d’un lacd’altitude (Lac d’Anterne, Haute Savoie): implications pale ´ oclima-tiques et pale ´ osismiques . 8e me Congress of ASF, Orle ´ ans, France, Book of Abstracts, ASF Publ. 36 , p. 17.
Bagnold, R. A. (1962). Auto-suspension of transported sediment;turbidity currents. Royal Society (London), Proceedings, Series A ,265 , 315–319.
Bates, C. C. (1953). Rational theory of delta formation. Bulletin of American Association of Petroleum Geology , 37 (9), 2119– 2162.Bellier, J. (1967). Le barrage de Malpasset, travaux , 363–383.
Bornhold, B. D., Ren, P., & Prior, D. B. (1994). High-frequency turbiditycurrents in British Columbia fjords. Geo-Marine Letters , 14 , 238–243.
Bouma, A. H. (1962). Sedimentology of some Flysch deposits. A graphic
approach to facies interpretation . Amsterdam: Elsevier, 168p.Bourcart, J. (1964). Les sables profonds de la Me ´diterrane e occidentale. In
A. H. Bouma, & A. Brouwer (Eds.), Developments in sedimentology no.3, turbidites (pp. 148–155). Amsterdam: Elsevier.
Bournet, P. E., Dartus, D., Tassin, B., & Vincon-Leite, B. (1999).Numerical investigation of plunging density current. Journal of Hydraulic Engineering , 125 (6), 584–594.
Brown, W. M., & Ritter, J. M. (1971). Sediment transport and turbidity inthe Eel River Basin, California . US Geological Survey Water-SupplyPaper, 1986 .
Chikita, K. (1991). Dynamic processes of sedimentation by river inducedturbidity currents. II. Application of a two-dimensional, advectivediffusion model. Japan Geomorphological Union, Transactions , 13-1 ,1–18.
Cirac, P., Bourillet, J.-F., Griboulard, R., Normand, A., Mulder, T., & theITSAS shipboard scientic party, (2001). Le canyon de Capbreton:nouvelles approches morphostructurales et morphose ´dimentaires.Premiers re sultats de la campagne Itsas. Comptes Rendus de l’Academiedes Sciences, Paris , 332 , 447–455.
Clauzon, G. (1978). The Messinian Var Canyon (Provence, southernFrance). Paleogeographic implications. Marine Geology , 27 (3/4),231–246.
Clauzon, G., Rubino, J.-L., & Savoye, B. (1995). Marine Pliocene Gilbert-type fan deltas along the French Mediterranean coast . In: IAS-16thregional meeting of sedimentology—5 e me congre s francais de se ´ di-mentologie—ASF. Field-trip guide book, 23 , Paris: Publications ASF,pp. 143–222.
Droz, L., Rigaut, F., Cochonat, P., & Tofani, R. (1996). Morphology andrecent evolution of the Zaire turbidite system (Gulf of Guinea).Geological Society of American Bulletin , 108 , 253–269.
Duringer, P., Paicheler, J.-C., & Schneider, J.-L. (1991). Un courant d’eaupeut-il ge nerer des turbidites? Re´sultats d’expe rimentations analogi-ques. Marine Geology , 99 , 231–246.
Einarsson, P., Brandsdo´ ttir, B., Tumi Gudmunsson, M., Bjo ¨rnsson, H.,Gronvold, K., & Sigmundsson, F. (1997). Center of the Iceland HotspotExperiences Volcanic Unrest. Eos Transactions, American GeophysicalUnion , 78 (35), 369–375.
Emmett, W. W. (1982). Measurements of bedloads in rivers: erosion andparticle transport measurements. International Association for Hydro-logical Science Publication , 122 , 3–13.
Emms, P. W. (1999). On the ignition of geostrophically rotating turbiditycurrents. Sedimentology , 46 , 1049–1063.
Farrell, G., & Stefan, H. G. (1989). Mathematical modeling of plungingreservoir ows. Journal of Hydraulic Research , 26 , 525–537.
Fauge res, J.-C., Stow, D. A. V., Imbert, P., & Viana, A. (1999).Seismic feature diagnostic of contourite drifts. Marine Geology , 162 ,
1–38.Forel, F. A. (1885). Les ravins sous-lacustres des euves glaciaires.
Comptes Rendus de l’Academie des Sciences, Paris , 101 (16), 725 –728.Forel, F. A. (1892). Le Le man: Monographie Limnologique 1 . Lausanne:
F. Rouge, 543p.Friedrichs, C. T., Wright, L. D., Hepworth, D. A., & Kim, S. C. (2000).
Bottom-boundary-layer processes associated with ne sedimentaccumulation in coastal seas and bays. Continental Shelf Research ,20 , 807–841.
Fukushima, Y., Parker, G., & Pantin, H. M. (1985). Prediction of ignitiveturbidity currents in Scripps submarine canyon. Marine Geology , 67 ,55–81.
Garcia, M. H. (1994). Depositional turbidity currents laden with poorlysorted sediment. Journal of Hydraulic Engineering , 120 ,1240–1263.
Garcia, M. H., & Parker, G. (1984). On the numerical prediction of turbidity currents (pp. 1556–1565). Third International Symposium on River Sedimentation , Mississippi: The University of Mississippi.
T. Mulder et al. / Marine and Petroleum Geology 20 (2003) 861–882878

7/21/2019 Hyperpycnal Flow
http://slidepdf.com/reader/full/hyperpycnal-flow 19/22
Garcia, M. H., & Parker, G. (1989). Experiments on hydraulic jumps inturbidity currents near a canyon-fan transition. Science , 245 ,393–396.
Garcia, M. H., & Parker, G. (1993). Experiments on the entrainment of sediment into suspension by a dense bottom current. Journal of Geophysical Research , 98 (3), 4793– 4807.
Gennesseaux, M., Guibout, M., & Lacombe, H. (1971). Enregistrement decourants de turbidite´ dans la vallee sous-marine du Var (Alpes-Maritimes). Comptes Rendus de l’Academie des Sciences, Paris, Se ´ rie D, 273 , 2456–2459.
Gennesseaux, M., Mauffret, A., & Pautot, G. (1980). Les glissements sous-marins de la pente continentale nicoise et la rupture de ca ˆbles en merLigure (Me diterrane e Occidentale). Comptes Rendus de l’Academie desSciences, Paris , 290 , 959–962.
Gonthier, E., Fauge res, J.-C., & Stow, D. A. V. (1984). Contouritefacies of the Faro drift, Gulf of Cadiz. In D. A. V. Stow, & D. J.W. Piper (Eds.), Fine-grained sediments: deep water processes and facies (pp. 245–256). Geological Society of London, SpecialPublication, 15 .
Gorsline, D. S., de Diego, T., & Nava-Sanchez, E. H. (2000). Seismicallytriggered turbidites in small margin basins: Alfonso Basin, WesternGulf of California and Santa Monica Basin, California Borderland.Sedimentary Geology , 135 , 21–35.
Gorycki, M. A. (1973). Hydraulic drag: a meander initiating mechanism.Geological Society of American Bulletin , 84 , 175–186.
Gould, H. R. (1951). Some quantitative aspects of Lake Mead turbiditycurrents . Society of Economic Paleontologists and MineralogistsSpecial Publication, 2 , pp. 34–52.
Gronvold, K., & Jo hannesson, H. (1984). Eruption in Grı ´msvo tn 1983,course of events and chemical studies of the tephra. Jo kul , 34 , 1–11.
Gudmunsson, M. T., Sigmundsson, F., & Bjo ¨ rnsson, H. (1997). Ice–volcano interaction of the 1996 Gja ´lp subglacial eruption, Vatnajo ¨kull,Iceland. Nature , 389 , 954–957.
Guillocheau, F., Pautot, G., & Auzende, J.-M. (1982). Les canyons du Varet duPaillon (marge des Alpes me ´ridionales-Me diterrane e occidentale):une origine quaternaire par glissement. Comptes Rendus de l’Academiedes Sciences, Paris , 296 , 91–96.
Hack, J. T. (1957). Studies of longitudinal stream proles in Virginia and Maryland . US Geological Survey Professional Paper 294-B .
Hay, A. E. (1987). Turbidity currents and submarine channel formation inRupert Inlet, British Columbia. 2. The roles of continuous and surge-type ow. Journal of Geophysical Research , 92 , 2883–2900.
Hesse, R., & Chough, S. K. (1980). The Northwest Atlantic Mid-OceanChannel of the Labrador Sea: II. Deposition of parallel laminated levee-mud from the viscous sublayer of low-density turbidity currents.Sedimentology , 27 , 697–711.
Hesse, R., & Khodabakhsh, S. (1998). Depositional facies of latePleistocene Heinrich events in the Labrador Sea. Geology , 26 (2),103–106.
Hesse, R., Klauke, I., Ryan, W. B. F., Edwards, M. B., Piper, D. J. W., &NAMOC Study Group, (1996). Imaging Laurentide ice sheet drainageinto the deep sea: impact on sediments and bottom water. GeologicalSociety of America Today , 3–9.
Hiscott, R. N., Pirmez, C., & Flood, R. D. (1997). Amazon submarine fandrilling. A big step forward for deep-sea fan models. GeoscienceCanada , 24 , 13–24.
Hoyal, D. C., Bursik, M. I., & Atkinson, J. F. (1999). Settling-drivenconvection: a mechanism of sedimentation from stratied uids. Journal of Geophysical Research , 104 , 7953–7966.
Hughen, K. A., Overpeck, J. T., & Anderson, R. F. (2000). Recent warmingin a 500-year paleotemperature record from varved sediments, UpperSoper Lake, Bafn Island, Canada. The Holocene , 10-1 , 9–19.
Hughes-Clarke, J. E. (1990). Late stage slope failure in the wake of the1929 Grand Banks earthquake. Geo-Marine Letters , 10 , 69–79.
Hughes-Clarke, J. E., Shor, A. N., Piper, D. J. W., & Mayer, L. A. (1990).Large-scale current-induced erosion and deposition in the path of the1929 Grand Banks turbidity current. Sedimentology , 37 , 613–629.
Imran, J., Parker, G., & Katopodes, N. (1998). A numerical model of channel inception on submarine fans. Journal of Geophysical Research ,103 (C1), 1219–1238.
Imran, J., & Syvitski, J. (2000). Impact of extreme river events on coastaloceans. Oceanography , 13 (3), 85–92.
Inman, D. L. (1970). Strong currents in submarine canyons. Abstract of theTransactions, American Geophysical Union , 51 , 319.
Kassem, A., & Imran, J. (2001). Simulation of turbid underow generatedby the plunging of a river. Geology , 29 (7), 655–658.
Kennish, M. J. (1989). Practical handbook of marine science . Boca Raton,FL: CRC Press, 710p.
Kneller, B. (1995). Beyond the turbidite paradigm: physical models fordeposition of turbidites and their implications for reservoir prediction.In A. J. Hartley, & D. J. Prosser (Eds.), Characterization of deep marineclastic systems (pp. 31–49). Geological Society of London, SpecialPublication, 94 .
Kneller, B. C., & Branney, M. J. (1995). Sustained high-density turbiditycurrents and the deposition of thick massive beds. Sedimentology , 42 ,607–616.
Kneller, B. C., & Buckee, M. J. (2000). The structure and uid mechanicsof turbidity currents: a review of some recent studies and theirgeological implications. Sedimentology , 47 , 62–94.
Kuenen, P. H. (1952). Estimated size of the Grand Banks turbidity current. American Journal of Science , 250 , 849–873.
Kuenen, P. H. (1953). Signicant features of graded bedding. American Association of Petroleum Geologists Bulletin , 37 , 1044–1066.
Kuenen, P. H., & Migliorini, C. I. (1950). Turbidity currents as a cause of graded bedding. Journal of Geology , 58 , 91– 127.
Lambert, A. M., Kelts, K. R., & Marshall, N. F. (1976). Measurement of density underows from Walensee, Switzerland. Sedimentology , 23,87–105.
Laval, A., Cremer, M., Beghin, P., & Ravenne, C. (1988). Density surges:two-dimensional experiments. Sedimentology , 35 , 73–84.
Le Moigne, M. (1999). Compre hension des me´ canismes de formation des pockmarks sur la pente du Golfe de Guine ´ e. Lille: DEA, University of Science and Technology, 62p.
Leopold, L. B., & Maddock, T., Jr. (1953). The hydraulic geometry of stream channels and some physiographic implications . US GeologicalSurvey Professional Paper 252 , 53p.
Letourneur, J., & Michel, R. (1971). Ge ologie du ge´ nie civil, Collection U .Paris: Armand Colin, 728p.
Linier, V., (2001). Me canismes et conditions de l’enregistrement de lasismicite dans des se diments lacustres . PhD Thesis, Univ. de Savoie
Linier, V., Arnaud, F., Beck, C., Desmet, M., Trentessaux, A., & Pourchet,M. (2001). Discriminating ood deposits from turbiditic reworking of delta foreset, in a terrigenous-fed lake: a clue to separate run off peaks(climatic events) from in situ destabilization (seismo-tectonic events).Eighth Congress of ASF, Orle ´ ans, France. Book of Abstracts, ASF Publ., 36 , 229.
Lowe, D. R. (1979). Sediment gravity ows: their classication and someproblems of application to natural ows and deposits. In L. J. Doyle, &O. H. Pilkey (Eds.), Geology of Continental Slopes (pp. 75–82). Societyof Economic Paleontologists and Mineralogists Special Publication,27 .
Lowe, D. R. (1982). Sediment gravity ows: II. Depositional models withspecial reference to the deposits of high-density turbidity currents. Journal of Sedimentary Petrology , 52 , 279–297.
Luthi, S. (1981). Experiments on non-channelized turbidity currents andtheir deposits. Marine Geology , 40 , M59– M68.
Malinverno, A., Ryan, W. B. F., Auffret, G. A., & Pautot, G. (1988). Sonarimages of the Path of Recent Failure Events on the Continental Marginoff Nice, France. In H. F. Clifton (Ed.), Sedimentological consequencesof convulsive geologic events (pp. 59–75). Geological Society of America Special Paper, 229 .
Matthai, H. F. (1990). In M. G. Woolman, & H. C. Riggs (Eds.), TheGeology of North America, Vol. O1, Surface Water Hydrology (pp.97–120). Boulder, CO: Geological Society of America.
T. Mulder et al. / Marine and Petroleum Geology 20 (2003) 861–882 879

7/21/2019 Hyperpycnal Flow
http://slidepdf.com/reader/full/hyperpycnal-flow 20/22
Mavilla, N., (2000). Stratigraphie et analyse de facie `s de la successiond’a ge oligo-mioce`ne du bassin tertiaire pie ´ montais (Italie nord occidentale (225p). PhD Thesis, Univ. Bordeaux 1
Maxworthy, T. (1999). The dynamics of sedimenting surface gravitycurrents. Journal of Fluid Mechanics , 392 , 27–44.
Mc Cave, I. N. (1986). Local and global aspects of the bottom nepheloidlayers in the world ocean. Netherland Journal of Deep-Sea Research ,20(2/3), 167–181.
Meade, R. H. (1996). River-sediment inputs to major deltas. In J. D.Milliman, & B. U. Haq (Eds.), Sea-level rise and coastal subsidence(pp. 63–85). Dordrecht: Kluwer.
Middleton, G. V. (1967). Experiments on density and turbidity currents. III.Deposition of sediment. Canadian Journal of Earth Science , 4,475–505.
Middleton,G. V. (1976). Hydraulic interpretation of sand size distributions. Journal of Geology , 84 , 405–426.
Middleton, G. V. (1993). Sediment deposition from turbidity currents. Annual Review of Earth and Planetary Sciences , 21 , 89–114.
Middleton, G. V., & Hampton, M. A. (1973). Sediment gravity ows:mechanics of ow and deposition. In G. V. Middleton, & A. H. Bouma(Eds.), Turbidites and deep-water sedimentation (pp. 1–38). Society of Economic Paleontologists and Mineralogists Special Publication .
Middleton, G. V., & Hampton, M. A. (1976). Subaqueous sedimenttransport and deposition by sediment gravity ows. In D. J. Stanley, &D. J. P. Swift (Eds.), Marine sediment transport and environmentalmanagement (pp. 197–218). New York: Wiley.
Migeon, S., (2000). Dunes ge antes et leve´ es se dimentaires en domainemarin profond: approche morphologique, sismique et se ´ dimentologique(288p). PhD Thesis, Univ. Bordeaux 1
Migeon, S., Savoye, B., Zanella, E., Mulder, T., Fauge `res, J. C., & Weber,O. (2001). Detailed seismic and sedimentary study of turbidite sedimentwaves one the Var sedimentary ridge (SE France): signicance forsediment transport and deposition and for the mechanism of sedimentwave construction. Marine and Petroleum Geology , 18 , 179–208.
Migeon, S., Weber, O., Fauge `res, J.-C., & Saint-Paul, J. (1999). SCOPIX: anew X-ray imaging system for core analysis. Geo-Marine Letters , 18 ,251–255.
Milliman, J. D., & Meade, R. H. (1983). World-wide delivery of riversediment to the oceans. Journal of Geology , 91 , 1–21.
Milliman, J. D., & Syvitski, J. P. M. (1992). Geomorphic/tectonic control of sediment discharge to the ocean: the importance of small mountainousrivers. Journal of Geology , 100 , 525–544.
Mohrig, D., Whipple, K. X., Hondzo, M., Ellis, C., & Parker, G. (1998).Hydroplaning of subaqueous debris ows. Geological Society of American Bulletin , 110 , 387–394.
Morehead, M. D., Syvitski, J. P. M., Hutton, E. W. H., & Peckham, S. D.(2003). Modeling the inter-annual and intra-annual variability in theux of sediment in ungauged river basins. Global and PlanetaryChange , 39 (1/2), 95 –110.
Mulder, T., & Alexander, J. (2001). The physical character of subaqueoussedimentary density currents and their deposits. Sedimentology , 48,269–299.
Mulder, T., & Cochonat, P. (1996). Classication of offshore massmovements. Journal of Sedimentary Research , 66 , 43–57.
Mulder, T., Migeon, S., Savoye, B., & Fauge `res, J.-C. (2001a). Inversely-graded turbidite sequences in the deep Mediterranean. A record of deposits from ood-generated turbidity currents? Geo-Marine Letters ,21 , 86–93.
Mulder, T., Migeon, S., Savoye, B., & Fauge `res, J.-C. (2002). Inversely-graded turbidite sequences in the deep Mediterranean. A record of deposits from ood-generated turbidity currents? A reply. Geo-Marine Letters , 22 (2), 112–120.
Mulder, T., Migeon, S., Savoye, B., & Jouanneau, J.-M. (2001b). Twentiethcentury oods recorded in the deep Mediterranean sediments. Geology ,
(11), 1011–1014.Mulder, T., Savoye, B., Piper, D. J. W., & Syvitski, J. P. M. (1998a). TheVar submarine sedimentary system: understanding Holocene sediment
delivery processes and their importance to the geological record. InM. S. Stocker, D. Evans, & A. Cramp (Eds.), Geological processes oncontinental margins: sedimentation, mass-wasting and stability (pp.
145–166). Geological Society of London, Special Publication 129 .Mulder, T., Savoye, B., & Syvitski, J. P. M. (1997a). Numerical modelling
of a mid-sized gravity ow: the 1979 Nice turbidity current (dynamics,processes, sediment budget and seaoor impact). Sedimentology , 44,305–326.
Mulder, T., Savoye, B., Syvitski, J. P. M., & Cochonat, P. (1997b). Originedes courants de turbidite´ enregistre s a l’embouchure du Var en 1971.Comptes Rendus de l’Academie des Sciences, Paris, Serie IIa , 322 (4),301–307.
Mulder, T., Savoye, B., Syvitski, J. P. M., & Parize, O. (1997c). Descourants de turbidite´ hyperpycnaux dans la teˆte du canyon du Var?Donne es hydrologiques et observations de terrain. Oceanologica Acta ,20 , 607–626.
Mulder, T., & Syvitski, J. P. M. (1995). Turbidity currents generatedat rivermouths during exceptional discharges to the world oceans. Journal of Geology , 103 , 285–299.
Mulder, T., & Syvitski, J. P. M. (1996). Climatic and morphologicrelationships of rivers: implications of sea level uctuations on riverloads. Journal of Geology , 104 , 509–523.
Mulder, T., Syvitski, J. P. M., & Skene, K. I. (1998b). Modelling of erosionand deposition by turbidity currents generated at river mouths. Journalof Sedimentary Research , 68 , 124–137.
Mulder, T., Weber, O., Anschutz, P., Jorissen, F. J., & Jouanneau, J.-M.(2001c). A few months-old storm-generated turbidite deposited in theCapbreton Canyon (Bay of Biscay, S-W France). Geo-Marine Letters ,21 (3), 149–156.
Mullenbach, B. L., & Nittrouer, C. A. (2000). Rapid deposition of uvialsediment in the Eel canyon, northern California. Continental Shelf Research , 20 , 2191–2212.
Mutti, E., Davoli, G., Tinterri, R., & Zavala, C. (1996). The importance of ancient uvio-deltaic systems dominated by catastrophic ooding intectonnically active basins. Memorie di Scienze Geologiche , 48,233–291.
Mutti, E., Ricci Lucchi, F., & Roveri, M. (2002). Revisiting turbidites of the Marnoso-arenacea formation and their basin-margin equivalents: problems with classic models . Excursion guidebook of the turbiditeworkshop, Parma, Italy, 21–22 May 2002 .
Mutti, E., Tinterri, R., Benevelli, G., Angella, S., di Biase, D., Cavanna, G.,(2003). Deltaic, mixed and turbidite sedimentation of ancient forelandbasins, Marine and Petroleum Geology, this issue (doi:10.1016/ j.marpetgeo. 2003.09.001).
Mutti, E., Tinterri, R., di Biase, D., Fava, L., Mavilla, N., Angella, S., &Calabrese, L. (2000). Delta-front facies associations on ancient ood-dominated uvio-deltaic systems. Reviews of the Society of GeologyEspana , 13 (2), 165–190.
Nardin, T. R., Hein, F. J., Gorsline, D. S., & Edwards, B. D. (1979). A
review of mass movement processes and acoustic characteristics, andcontrasts in slope and base-of-slope systems versus canyon-fan-basinoor systems. In L. J. Doyle, & O. H. Pilkey (Eds.), Geology of continental slopes (pp. 61–73). Society of Economic Paleontologistsand Mineralogists Special Publication, 27 .
Nava-Sanchez, E. H., Gorsline, D. S., Cruz-Orozco, R., & Godinez-Orta,L. (1999). The El Coyote fan delta: a wave-dominated example fromthe Gulf of California, Mexico. Quaternary International , 56 ,129–140.
Nelson, C. H., Karabanov, E. B., Colman, S. M., & Escutia, C. (1999).Tectonic and sediment supply control of deep rift lake turbiditesystems: Lake Baikal, Russia. Geology , 27 (2), 163–166.
Nittrouer, C. A. (1999). STRATAFORM : overview of its design and synthesisof its results. Marine Geology , 154 , 3– 12.
Normark, W. R., Damuth, J. E., et al. (1997). In R. D. Flood, D. J. W. Piper,
A. Klaus, & L. C. Peterson (Eds.), Sedimentary facies and associated depositional elements of the Amazon Fan (pp. 611–651). Proceedingsof the ODP, Scientic Research, 155 .
T. Mulder et al. / Marine and Petroleum Geology 20 (2003) 861–882880

7/21/2019 Hyperpycnal Flow
http://slidepdf.com/reader/full/hyperpycnal-flow 21/22
Normark, W. R., & Piper, D. J. W. (1991). Initiation processes and owevolution of turbidity currents: Implications for the depositional record.In R. H. Osborne (Ed.), From Shoreline to Abyss; Contribution in
Marine Geology in Honor of Francis Parker Shepard (pp. 207–230).SEPM (Society for Sedimentary Geology), Special Publication, 46,Tulsa .
O’Grady, D. B., & Syvitski, J. P. M. (2002). Large-scale morphology of Arctic continental slopes: inuence of sediment delivery on slope form.In: Dowdeswell, J. A. and O’ Lofaigh, C. (Eds), Glacier-inuencedsedimentation on high-latitude continental margins. Geological Society ,Special Publication 203, 11-31.
Ogston, A. S., Cacchione, D. A., Sternberg, R. W., & Kineke, G. C. (2000).Observations of storm and river ood-driven sediment transport on thenorthern California continental shelf. Continental Shelf Research ,20(16), 2141–2162.
Parker, G. (1982). Conditions for the ignition of catastrophically erosiveturbidity currents. Marine Geology , 46 , 307–327.
Parker, G., Fukushima, Y., & Pantin, H. M. (1986). Self-acceleratingturbidity currents. Journal of Fluid Mechanics , 171 , 145–181.
Parsons, J. D., Bush, J., & Syvitski, J. P. M. (2001). Hyperpycnal owformation with small sediment concentrations. Sedimentology , 48,465–478.
Piper, D. J. W., Cochonat, P., Ollier, G., Le Drezen, E., Morrison, M., &Baltzer, A. (1992). Evolution progressive d’un glissement rotationnelen un courant de turbidite´: cas du seisme de 1929 des Grands Bancs(Terre Neuve). Comptes Rendus de l’Academie des Sciences, Paris,314, Serie II , 1057–1064.
Piper, D. J. W., & Deptuck, M. (1997). Fine-grained turbidites of theAmazon fan: facies characterization and interpretation. In R. D. Flood,D. J. W. Piper, A. Klaus, & L. C. Peterson (Eds.), Proceedings of theODP, Scientic Research, 155 (pp. 79–108).
Piper, D. J. W., & Savoye, B. (1993). Processes of late Quaternary turbiditycurrent ow and deposition on the Var deep-sea fan, north-westMediterranean Sea. Sedimentology , 40 , 557–582.
Praeg, D. B., & Syvitski, J. P. M. (1991). Marine geology of SaguenayFjord. Geological Survey of Canada, Open File #2395 .
Pratson, L. F., & Haxby, W. F. (1996). What is the slope of the U.S.continental slope? Geology , 24 , 3–6.
Pratson, L., Imran, J., Hutton, E., Parker, G., & Syvitski, J. P. M. (2001).BANG1D: a one-dimensional. Lagrangian model of turbidity currentmechanics. Computers and Geoscience , 27 (6), 701–716.
Pratson, L. F., Ryan, W. B. F., Mountain, G. S., & Twitchell, D. C.(1994). Submarine canyon initiation by downslope-eroding sedimentows: evidence in late Cenozoic strata on the New Jerseycontinental slope. Geological Society of American Bulletin , 106 ,395–412.
Prior, D. B., Bornhold, B. D., & Johns, M. W. (1986). Active sand transportalong a fjord-bottom channel, Bute Inlet, British Columbia. Geology ,14 , 581–584.
Prior, D. B., Bornhold, B. D., Wisenam, W. J., Jr, & Lowe, D. R. (1987).Turbidity current activity in a British Columbia fjord. Science , 237 ,1330–1333.
Ravenne, C., & Beghin, P. (1983). Apport des expe ´riences en canal al’interpre tation se dimentologique des de´pots de cones detritiques sous-marins. Revue de I’ Institut Francaisdu Pe ´ trole , 38 (3), 279–297.
Reed, C. W., Niedoroda, A. W., & Swift, D. J. P. (1999). Modelingsediment entrainment and transport processes limited by bed armoring. Marine Geology , 154 , 143–154.
Rigaut, F., (1997). Analyse et e volution re´ cente d’un syste`me turbiditiqueme andriforme: l’e ´ ventail profond du Zaı ¨ re (209p). PhD Thesis, Univ.Bretagne Occidentale
Rimoldi, B., Alexander, J., & Morris, S. A. (1996). Experimental turbiditycurrents entering density-stratied water: analogues for turbidites inMediterranean hypersaline basins. Sedimentology , 43 , 527–540.
Savoye, B., & Piper, D. J. W. (1991). The Messinian event on the margin of the Mediterranean Sea in the Nice area, southern France. MarineGeology , 97 , 279–304.
Savoye, B., Piper, D. J. W., & Droz, L. (1993). Plio–Pleistocene evolutionof the Var deep-sea fan off the French Riviera. Marine and PetroleumGeology , 10 , 550–571.
Savoye, B., et al. (2000). Structure et e ´volution re cente de l’eventailturbiditique du Zaı¨re: premiers re sultats scientiques des missionsd’exploration ZAI¨ANGO. Comptes Rendus de l’Academie desSciences, Paris , 331 , 211–220.
Saint-Onge, G., Mulder, T., Piper, D. J. W., Hillaire-Marcel, C., Stoner, J. S(in press). Earthquake and ood-induced turbidites in the SaguenayFjord (Que bec): a Holocene paleoseismicity record. QuaternaryScience Reviews .
Schafer, C. T., & Smith, J. N. (1987). Hypothesis for a submarine landslideand cohesionless sediment ows resulting from a 17th centuryearthquake-triggered landslide in Quebec, Canada. Geo-Marine Letters ,7 , 31–37.
Schafer, C. T., Smith, J. N., & Coˆte, R. (1990). The Saguenay Fiord: amajor tributary to the St Lawrence Estuary. In M. I. El-Sabh, & N.Silverberg (Eds.), Coastal and estuarine studies, 39, Oceanography of alarge-scale estuarine system, the St Lawrence (pp. 378–420). NewYork: Springer.
Schumm, S. A. (1981). Evolution and response of the uvial system,sedimentologic implications. In F. G. Ethridge, & R. M. Flores (Eds.), Recent and ancient nonmarine depositional environments (pp. 19–29).Society of Economic Paleontologists and Mineralogists SpecialPublication, 31 .
Schumm, S. A., & Khan, H. R. (1972). Experimental study of channelpatterns. Bulletin of Geological Society of America , 88 , 1755– 1770.
Scully, M. E., Friedrichs, C. T., & Wright, L. D. (2002). Application of ananalytical model of critically stratied gravity-driven sedimenttransport and deposition from the Eel River continental shelf, northernCalifornia. Continental Shelf Research , 22 (14), 1951–1974.
Shanmugam, G. (1996). High-density turbidity currents: are they sandydebris ows? Journal of Sedimentary Research , 66 , 2–10.
Shepard, F. P., & Dill, R. F. (1966). Submarine canyons and other sea-valleys . Chicago: Rand McNally and Co, 381p.
Shepard, F. P., Marshall, N., McLoughlin, P. A., & Sullivan, G. G. (1979).Currents in submarine canyons and other sea valleys. American Association of Petroleum Geologists, S tudies in Geology, no. 8 .
Shepard, F. P., McLoughlin, P. A., Marshall, N. F., & Sullivan, G. G.(1977). Current-meter recordings of low-speed turbidity currents.Geology , 5, 297–301.
Skene, K. I., Mulder, T., & Syvitski, J. P. M. (1997). INFLO1: a modelpredicting the behaviour of turbidity currents generated at river mouths.Computers and Geoscience , 23 (9), 975–991.
Sommereld, C. K., & Nittrouer, C. A. (1999). Modern accumulation rateand sediment budget for the Eel shelf: a ood-dominated depositionalenvironment. Marine Geology , 154 , 227–241.
Sommereld, C. K., Nittrouer, C. A., & Alexander, C. R. (1999). 7 Be as atracer of ood sedimentation on the northern California continental
margin. Continental Shelf Research , 19 , 335–361.Stacey, M. W., & Bowen, A. J. (1988). The vertical structure of density and
turbidity currents: theory and observations. Journal of Geophysical Research , 93 , 3528–3542.
Stow, D. A. V. (1996). Deep seas. In H. G. Reading (Ed.), Sedimentaryenvironments: processes, facies and stratigraphy (pp. 395–453).Oxford: Blackwell Sciences.
Syvitski, J. P. M. (2003). Sediment uxes and rates of sedimentation. InG. V. Middleton (Ed.), Encyclopedia of Sediments and Sedimentary Rocks . Dordrecht, Netherlands: Kluwer, p. 600–606.
Syvitski, J. P. M. (2002). Sediment transport variability in Arctic rivers:Implications for a warmer future. Polar Research , 21 (2), 323–330.
Syvitski, J. P. M., & Alcott, J. M. (1993). GRAIN2: prediction of particle size seaward of river mouths. Computers and Geoscience , 19 ,399–446.
Syvitski, J. P. M., & Alcott, J. M. (1995). RIVER3: simulation of riverdischarge and sediment transport. Computers and Geoscience , 21(1),89–151.
T. Mulder et al. / Marine and Petroleum Geology 20 (2003) 861–882 881
7/21/2019 Hyperpycnal Flow
http://slidepdf.com/reader/full/hyperpycnal-flow 22/22