
Hyperpolarization-activated and cyclic … ARTICLE Hyperpolarization-activated and cyclic...
17
REGULAR ARTICLE Hyperpolarization-activated and cyclic nucleotide-gated channels are differentially expressed in juxtaglomerular cells in the olfactory bulb of mice Hans-Ulrich Fried & U. Benjamin Kaupp & Frank Müller Received: 16 April 2009 / Accepted: 30 October 2009 / Published online: 6 February 2010 # The Author(s) 2010. This article is published with open access at Springerlink.com Abstract In the olfactory bulb, input from olfactory receptor neurons is processed by neuronal networks before it is relayed to higher brain regions. In many neurons, hyperpolarization-activated and cyclic nucleotide-gated (HCN) channels generate and control oscillations of the membrane potential. Oscillations also appear crucial for information processing in the olfactory bulb. Four channel isoforms exist (HCN1–HCN4) that can form homo- or heteromers. Here, we describe the expression pattern of HCN isoforms in the olfactory bulb of mice by using a novel and comprehensive set of antibodies against all four isoforms. HCN isoforms are abundantly expressed in the olfactory bulb. HCN channels can be detected in most cell populations identified by commonly used marker antibodies. The combination of staining with marker and HCN antibodies has revealed at least 17 different staining patterns in juxtaglomerular cells. Furthermore, HCN isoforms give rise to an unexpected wealth of co-expression patterns but are rarely expressed in the same combination and at the same level in two given cell populations. Therefore, heteromeric HCN channels may exist in several cell populations in vivo. Our results suggest that HCN channels play an important role in olfactory information processing. The staining patterns are consistent with the possibility that both homomeric and heteromeric HCN channels are involved in oscillations of the membrane potential of juxtaglomerular cells. Keywords Juxtaglomerular cells . Hyperpolarization- activated and cyclic nucleotide-gated channels . Olfactory bulb . Co-localization . Glomerular layer . Mouse (C57BL/6N@Rj) Introduction The olfactory bulb is the first relay station of the olfactory system in the brain. Here, olfactory receptor neurons (ORN) are synaptically connected to interneurons and to mitral and tufted cells that project to higher cortical areas. The synapses between ORNs, interneurons, and mitral/ tufted cells are localized to spherical neuropil structures - the glomeruli. Glomeruli are surrounded by a heteroge- neous population of neurons that, by morphological criteria, fall into three classes: periglomerular (PG) cells, short axon (SA) cells, and external tufted (ET) cells (Kosaka et al. 1998; Pinching and Powell 1971). Collectively, these cells have been termed juxtaglomerular cells. Immunohisto- chemical studies suggest that juxtaglomerular cells can be grouped into many subpopulations (Kosaka et al. 1998). However, the entire repertoire of juxtaglomerular cells, their specific function, and their electrophysiological properties are largely unknown. Electronic supplementary material The online version of this article (doi:10.1007/s00441-009-0904-9) contains supplementary material, which is available to authorized users. H.-U. Fried (*) : U. B. Kaupp Abteilung Molekulare Neurosensorik, Center of Advanced European Studies and Research, Ludwig-Erhard-Allee 2, 53175 Bonn, Germany e-mail: [email protected] H.-U. Fried : U. B. Kaupp : F. Müller Institut für Strukturbiologie und Biophysik, ISB-1, Forschungszentrum Jülich, 52425 Jülich, Germany Cell Tissue Res (2010) 339:463–479 DOI 10.1007/s00441-009-0904-9
Transcript of Hyperpolarization-activated and cyclic … ARTICLE Hyperpolarization-activated and cyclic...
REGULAR ARTICLE
Hyperpolarization-activated and cyclic nucleotide-gatedchannels are differentially expressed in juxtaglomerularcells in the olfactory bulb of mice
Hans-Ulrich Fried & U. Benjamin Kaupp & Frank Müller
Received: 16 April 2009 /Accepted: 30 October 2009 /Published online: 6 February 2010# The Author(s) 2010. This article is published with open access at Springerlink.com
Abstract In the olfactory bulb, input from olfactory receptorneurons is processed by neuronal networks before it isrelayed to higher brain regions. In many neurons,hyperpolarization-activated and cyclic nucleotide-gated(HCN) channels generate and control oscillations of themembrane potential. Oscillations also appear crucial forinformation processing in the olfactory bulb. Four channelisoforms exist (HCN1–HCN4) that can form homo- orheteromers. Here, we describe the expression pattern ofHCN isoforms in the olfactory bulb of mice by using a noveland comprehensive set of antibodies against all four isoforms.HCN isoforms are abundantly expressed in the olfactorybulb. HCN channels can be detected in most cell populationsidentified by commonly used marker antibodies. Thecombination of staining with marker and HCN antibodieshas revealed at least 17 different staining patterns injuxtaglomerular cells. Furthermore, HCN isoforms give riseto an unexpected wealth of co-expression patterns but arerarely expressed in the same combination and at the same
level in two given cell populations. Therefore, heteromericHCN channels may exist in several cell populations in vivo.Our results suggest that HCN channels play an important rolein olfactory information processing. The staining patterns areconsistent with the possibility that both homomeric andheteromeric HCN channels are involved in oscillations of themembrane potential of juxtaglomerular cells.
Keywords Juxtaglomerular cells . Hyperpolarization-activated and cyclic nucleotide-gated channels . Olfactorybulb . Co-localization . Glomerular layer .
Mouse (C57BL/6N@Rj)
Introduction
The olfactory bulb is the first relay station of the olfactorysystem in the brain. Here, olfactory receptor neurons(ORN) are synaptically connected to interneurons and tomitral and tufted cells that project to higher cortical areas.The synapses between ORNs, interneurons, and mitral/tufted cells are localized to spherical neuropil structures -the glomeruli. Glomeruli are surrounded by a heteroge-neous population of neurons that, by morphological criteria,fall into three classes: periglomerular (PG) cells, short axon(SA) cells, and external tufted (ET) cells (Kosaka et al.1998; Pinching and Powell 1971). Collectively, these cellshave been termed juxtaglomerular cells. Immunohisto-chemical studies suggest that juxtaglomerular cells can begrouped into many subpopulations (Kosaka et al. 1998).However, the entire repertoire of juxtaglomerular cells,their specific function, and their electrophysiologicalproperties are largely unknown.
Electronic supplementary material The online version of this article(doi:10.1007/s00441-009-0904-9) contains supplementary material,which is available to authorized users.
H.-U. Fried (*) :U. B. KauppAbteilung Molekulare Neurosensorik,Center of Advanced European Studies and Research,Ludwig-Erhard-Allee 2,53175 Bonn, Germanye-mail: [email protected]
H.-U. Fried :U. B. Kaupp : F. MüllerInstitut für Strukturbiologie und Biophysik, ISB-1,Forschungszentrum Jülich,52425 Jülich, Germany
Cell Tissue Res (2010) 339:463–479DOI 10.1007/s00441-009-0904-9
Juxtaglomerular cells form connections within andbetween glomeruli, providing the basis for the processingof odor information. Within glomeruli, ORNs provideexcitatory input to PG, ET, and mitral/tufted cells. PG cellsform inhibitory synapses with ORNs, ET, and mitral/tuftedcells, whereas ET cells are excitatory to PG cells (for adetailed review of different circuits within glomeruli, seeWachowiak and Shipley 2006). Connections betweenglomeruli involve ET, PG, and SA cells (Pinching andPowell 1972). A prominent, yet controversial, model of aninterglomerular circuit describes a network for the so-calledcenter-surround inhibition (Aungst et al. 2003; Kosaka etal. 2008). In this model, SA cells receive excitatory inputfrom ET cells and, in turn, excite PG cells that are up to 30glomeruli away. These PG cells inhibit mitral/tufted cells.Thereby, the activity of ORNs through the successiveactivation of ET, SA, and PG cells finally inhibits themitral/tufted cells of neighboring glomeruli.
Rhythmic electrical activity that is either intrinsic orproduced by odors is essential for olfactory informationprocessing (Adrian 1950; Fletcher et al. 2005; Hayar et al.2004a, 2004b; Macrides and Chorover 1972; Margrie andSchaefer 2003; Nusser et al. 2001; Stopfer and Laurent1999; Walsh 1956). In heart and brain, hyperpolarization-activated and cyclic-nucleotide-gated (HCN) ion channelscontrol synchronized network activity (Bender et al. 2005;Luthi and McCormick 1998b; Bal and McCormick 1997),oscillations (Lüthi and McCormick 1998a; Ludwig et al.2003; Stieber et al. 2003), and temporal integration ofsynaptic activity in dendrites (Magee 1998; Magee andCarruth 1999; Angelo et al. 2007). HCN channels may alsosustain rhythmic activity in the olfactory bulb (Liu andShipley 2008). The four HCN channel isoforms (HCN1–HCN4) differ in their activation kinetics and modulation bycAMP (Kaupp and Seifert 2001; Stieber et al. 2005). Thephysiological role of HCN channels depends on theirdensity and subcellular localization (Berger et al. 2001;Day et al. 2005; Magee 1998; Magee and Carruth 1999).Moreover, the heteromerization of HCN channel isoformshas been proposed as a mechanism to enhance functionaldiversity. Although HCN channels, when heterologouslyexpressed, form heteromers (Chen et al. 2001; Much et al.2003; Ulens and Tytgat 2001), little is known about theexistence and functional significance of heteromers innative tissue (Whitaker et al. 2007).
In situ hybridization and initial immunohistochemicalstudies suggest strong expression of all four HCN channelisoforms in the olfactory bulb of mouse and rat (Notomiand Shigemoto 2004; Santoro et al. 2000; Holderith et al.2003). However, neither the expression of HCN isoforms atthe single-cell level, nor any patterns of co-expression havebeen analyzed in depth. We have examined the distributionof all four HCN channel isoforms in the glomerular layer of
mouse by using specific antibodies. We have observedabundant expression of all four HCN isoforms. HCNchannels are present in most populations of juxtaglomerularcells identified by commonly used marker antibodies.Several of these cell populations express two or threeHCN isoforms. Our results support the notion of a largevariety of juxtaglomerular cell populations and provide thebasis for a better understanding of rhythmic electricalactivity in the olfactory bulb.
Materials and methods
Animals
Adult mice (C57BL/6N@Rj; Elevage Janvier France) wereused. All procedures were approved by the local animalcare committee.
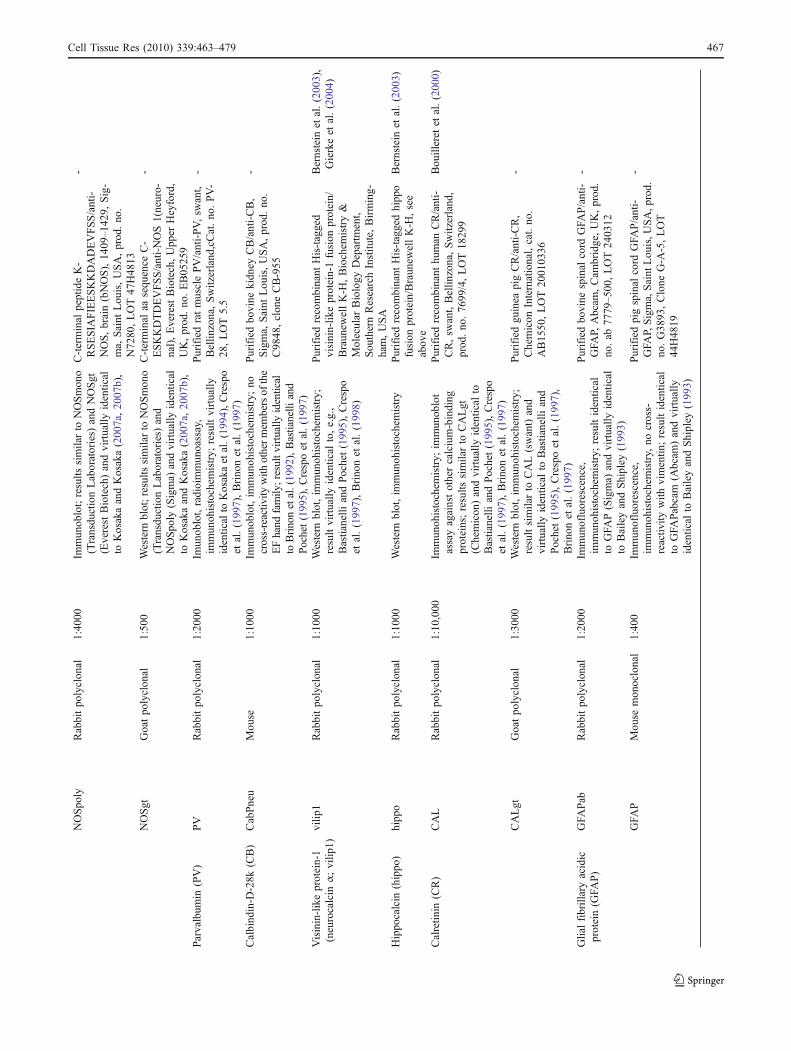
Antibodies against HCN channels
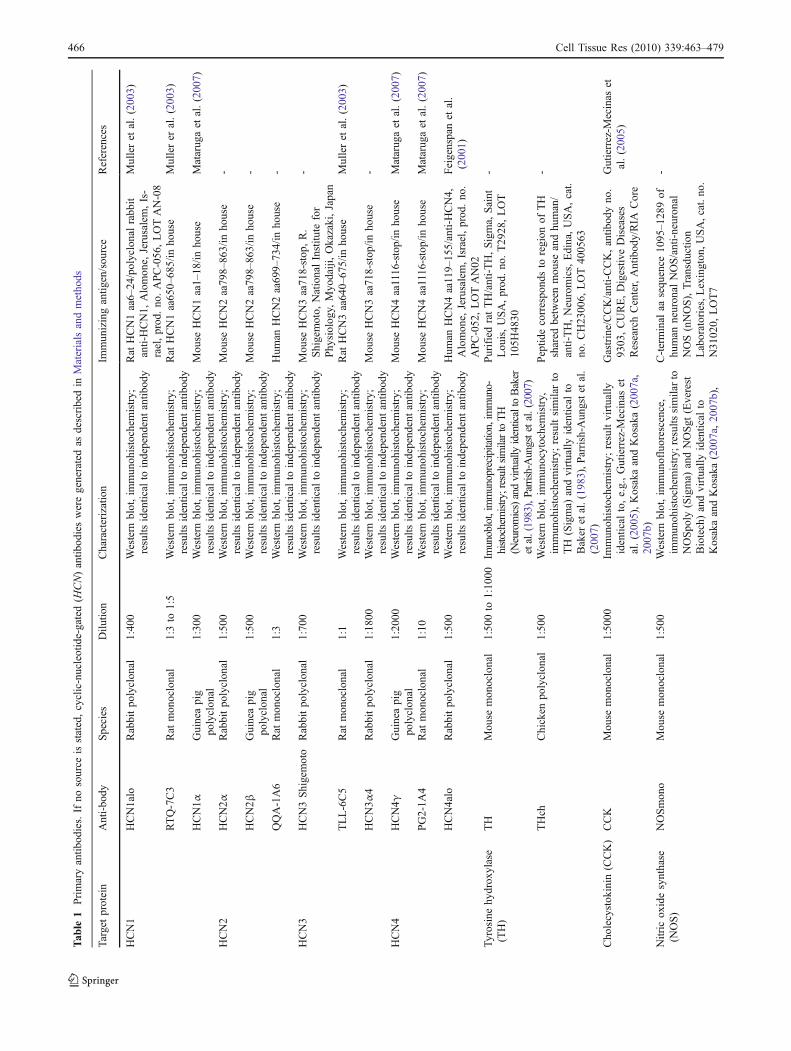
Antibody production has been described elsewhere (Matarugaet al. 2007; Müller et al. 2003). In brief, for the rat monoclonalantibodies RTQ-7C3, QQA-1A6, and TLL-6C5, peptides usedto produce antibodies consisted of seven N-terminal aminoacids (aa; CGSSHHH), followed by 35 aa specific for a givenHCN channel isoform (RTQ-7C3: aa sequence 650–685 of ratHCN1; QQA-1A6: aa sequence 699–734 of human HCN2;TLL-6C5: aa sequence 640–675 of rat HCN3). The guineapig polyclonal antibodies HCN4γ and HCN2β, the ratmonoclonal antibody PG2-1A4 (HCN4), and the rabbitpolyclonal antibodies HCN2α and HCN3α4 were obtainedafter immunization with a glutathione S-transferase fusionprotein: the HCN2 fusion protein contained mouse HCN2 aasequence 798–863, the HCN3 fusion protein contained mouseHCN3 aa sequence 718–779, and the HCN4 fusion proteincontained mouse HCN4 aa sequence 1116–1201. For gener-ation of the guinea pig polyclonal antibody HCN1α, akeyhole limpet hemocyanin fusion protein containing aasequence 1–18 of mouse HCN1 was used. We chose antigenicsequences of mouse HCN channels similar to those usedby Notomi and Shigemoto (2004) for the generation ofHCN2α, HCN2β, HCN3α4,HCN4γ, and PG2-1A4 antibodies.Immunization of rabbits and guinea pigs (Pineda AntibodyService, Berlin, Germany; Peptide Specialty Laboratories,Heidelberg, Germany) and the generation of monoclonal anti-bodies (E. Kremmer, Institute for Molecular Immunology,Helmholtz Zentrum, Munich, Germany) were performedaccording to standard procedures. To minimize cross-reactivity, HCN2α, HCN2β, and HCN3α4 were purifiedby affinity chromatography with a fusion protein of theHCN channel sequences used for immunization and themaltose-binding protein coupled to cyan-bromide-activated
464 Cell Tissue Res (2010) 339:463–479
Sepharose 4B (Amersham Pharmacia Biotech, Freiburg,Germany).
SDS-polyacrylamide gel electrophoresis and Westernblot analysis
Isolation of membranes and cytosolic proteins of theolfactory bulb of mouse, SDS-polyacrylamide gel electro-phoresis (SDS-PAGE), and Western blot analysis wereperformed as described by Müller et al. (2003). Proteins(12 μg per lane) were separated on a 10% SDS-polyacrylamidegel and electrotransferred onto a polyvinylidene difluoridefilter. Primary antibodies were RTQ-7C3 (HCN1), HCN2α,HCN3, and HCN4γ (dilutions: 1:3, 1:1000, 1:6000, and 1:400,respectively). Secondary antibodies conjugated to horseradishperoxidase were: goat anti-rat IgG (for RTQ-7C3; 1:5000;Jackson ImmunoResearch Laboratories, West Grove, USA),goat anti-rabbit IgG (for HCN2α and HCN3; 1:5000;Amersham, Ilford, England), and goat anti-guinea pigIgG (for HCN4γ; 1:5000; Santa Cruz Biotechnology, SantaCruz, USA).
Immunohistochemistry
Mice (n=13; ∼2 months old) were fixed by intracardialperfusion of ice-cooled 0.9% NaCl solution followed by4% paraformaldehyde (PFA) and 15% saturated picric acidin 0.15 M phosphate buffer (PB). Brains were removed,postfixed for 0.5 h, rinsed with PB, and incubated in 10%sucrose in PB with 0.05% NaN3 for 1 h, followed by 30%sucrose in PB with 0.05% NaN3 for 48 h. Olfactory bulbswere embedded and frozen in OCT compound. Coronalsections (20 μm thick) were cut on a cryostat and collectedon Superfrost Plus slides (Menzel, Braunschweig, Germany).Only glomeruli at the medial aspect of sections through themiddle part of the olfactory bulb were analyzed.
Sections were preincubated for 1 h in 5% chemiblocker(Chemicon International, Temecula, USA), 0.5% TritonX-100, and 0.05% NaN3 in PB, followed by incubationovernight with primary antibodies diluted in the samesolution. Sections were washed in PB and incubated insecondary antibodies diluted in 5% chemiblocker with 0.5%Triton X-100 in PB for 1 h, washed in PB, and cover-slippedwith Aqua Polymount (Polysciences Europe, Eppelheim,Germany). Primary antibodies were as described in Table 1.Secondary antibodies were donkey anti-guinea pig Cy2(1:400), donkey anti-guinea pig Cy3 (1:800), donkey anti-guinea pig Cy5 (1:800), goat anti-mouse Alexa488 (1:500),donkey anti-mouse Cy3 (1:100), donkey anti-mouse Cy5(1:100), goat anti-rabbit Alexa488 (1:500), donkey anti-rabbit Cy3 (1:500), donkey anti-rabbit Cy5 (1:100), goatanti-rabbit Alexa488 (1:500), and donkey anti-rat Cy3(1:500). Donkey antibodies were purchased from Dianova
(Hamburg, Germany) and goat antibodies from MolecularProbes (Invitrogen, Karlsruhe, Germany). For double- ortriple-labeling, primary antibodies generated in differentspecies were mixed and applied simultaneously. All second-ary antibodies were highly cross-absorbed and were tested toexclude reactions with the wrong primary antibody.
In some experiments, staining was performed with twoantibodies generated in the same species. This was possibleonly if the two antibodies stained different cell compart-ments, e.g., the soma membrane and the cytosol. Two casescould be distinguished. (1) Antibodies stained differentcompartments in different cells. In this case, the twoantibodies were detected with the same secondary antibody.Staining, whereby each primary antibody was appliedalone, were used as a reference to distinguish betweenthe staining of the two antibodies. (2) Antibodies staineddifferent compartments in the same cell. In this case,staining patterns were distinguished by using a techniquedescribed by Vardi et al. (2000). This technique involvedthe use of Fab fragments to block one of the antibodiesproduced in the same species. Here, we used the techniqueonly for some staining with HCN3 antibodies. In brief,sections were incubated with rabbit anti-HCN3 overnight,washed in PB, incubated with goat anti-rabbit Fab frag-ments conjugated to Cy3 (1:1000; Dianova, Hamburg,Germany) for 1 h, washed in PB, incubated with a rabbitanti-marker antibody (twice as concentrated as given inTable 1) for 1 h, washed in PB, and finally incubated withdonkey anti-rabbit Cy5 or goat anti-rabbit Alexa488 asdescribed above. Control experiments in which anti-markerantibodies were omitted displayed no Cy5 or Alexa488staining. Furthermore, stringent internal controls wereincluded in each staining; the strong staining resulting fromone primary antibody was not detected by the secondaryantibody used for the other primary antibody. In addition,all staining of a primary antibody was similar, irrespectiveof whether it had been used alone or in combination withanother primary antibody raised in the same species.
Sections were examined with a Leica TCS confocal laserscanning microscope (LSM, Leica Microsystems Germany)with 20×/0.7 and 63×/1.32 oil immersion lenses. The contrastand brightness of the images were optimized in AdobePhotoshop. Laser intensity and filter settings were carefullycontrolled, and the sequential scanning mode was employedto rule out cross-talk between the fluorescence detectionchannels completely. Band pass filters of 500–530 nm forgreen fluorescence (Alexa488, Cy2), 580–650 nm for redfluorescence (Cy3), and 680–750 nm for infra-red fluores-cence (Cy5) were used.
Cells were classified as PG-, SA-, or ET-like by severalindependent expert observers. The observers classified largenumbers of cells comprising all 17 different immunohisto-chemical fingerprints (IFs) on z-stacks (examples of recon-
Cell Tissue Res (2010) 339:463–479 465
Tab
le1
Primaryantib
odies.Ifno
source
isstated,cyclic-nucleotide-gated(H
CN)antib
odiesweregeneratedas
describedin
Materialsandmetho
ds
Targetprotein
Anti-bo
dySpecies
Dilu
tion
Characterization
Immun
izingantig
en/sou
rce
References
HCN1
HCN1alo
Rabbitpo
lyclon
al1:40
0Western
blot,im
mun
ohistochem
istry;
results
identical
toindepend
entantib
ody
Rat
HCN1aa6–
24/polyclonalrabb
itanti-HCN1,
Alomon
e,Jerusalem,Is-
rael,prod
.no
.APC-056
,LOTAN-08
Mulleret
al.(200
3)
RTQ-7C3
Rat
mon
oclonal
1:3to
1:5
Western
blot,im
mun
ohistochem
istry;
results
identical
toindepend
entantib
ody
Rat
HCN1aa65
0–68
5/in
house
Mullerer
al.(200
3)
HCN1α
Guineapig
polyclon
al1:30
0Western
blot,im
mun
ohistochem
istry;
results
identical
toindepend
entantib
ody
Mou
seHCN1aa1–
18/in
house
Matarug
aet
al.(200
7)
HCN2
HCN2α
Rabbitpo
lyclon
al1:50
0Western
blot,im
mun
ohistochem
istry;
results
identical
toindepend
entantib
ody
Mou
seHCN2aa79
8–86
3/in
house
-
HCN2β
Guineapig
polyclon
al1:50
0Western
blot,im
mun
ohistochem
istry;
results
identical
toindepend
entantib
ody
Mou
seHCN2aa79
8–86
3/in
house
-
QQA-1A6
Rat
mon
oclonal
1:3
Western
blot,im
mun
ohistochem
istry;
results
identical
toindepend
entantib
ody
Hum
anHCN2aa69
9–73
4/in
house
-
HCN3
HCN3Shigemoto
Rabbitpo
lyclon
al1:70
0Western
blot,im
mun
ohistochem
istry;
results
identical
toindepend
entantib
ody
Mou
seHCN3aa71
8-stop
,R.
Shigemoto,
NationalInstitu
tefor
Phy
siolog
y,Myo
daiji,Okazaki,Japan
-
TLL-6C5
Rat
mon
oclonal
1:1
Western
blot,im
mun
ohistochem
istry;
results
identical
toindepend
entantib
ody
Rat
HCN3aa64
0–67
5/in
house
Mulleret
al.(200
3)
HCN3α
4Rabbitpo
lyclon
al1:18
00Western
blot,im
mun
ohistochem
istry;
results
identical
toindepend
entantib
ody
Mou
seHCN3aa71
8-stop
/inho
use
-
HCN4
HCN4γ
Guineapig
polyclon
al1:20
00Western
blot,im
mun
ohistochem
istry;
results
identical
toindepend
entantib
ody
Mou
seHCN4aa1116
-stop/in
house
Matarug
aet
al.(200
7)
PG2-1A
4Rat
mon
oclonal
1:10
Western
blot,im
mun
ohistochem
istry;
results
identical
toindepend
entantib
ody
Mou
seHCN4aa1116
-stop/in
house
Matarug
aet
al.(200
7)
HCN4alo
Rabbitpo
lyclon
al1:50
0Western
blot,im
mun
ohistochem
istry;
results
identical
toindepend
entantib
ody
Hum
anHCN4aa119–15
5/anti-HCN4,
Alomon
e,Jerusalem,Israel,prod
.no
.APC-052
,LOTAN02
Feigenspanet
al.
(200
1)
Tyrosinehy
drox
ylase
(TH)
TH
Mou
semon
oclonal
1:50
0to
1:10
00Im
unoblot,immunoprecipitation,immuno-
histochemistry;resultsimilartoTH
(Neuromics)andvirtuallyidenticaltoBaker
etal.(1983),Parrish-Aungstetal.(2007)
PurifiedratTH/anti-TH,Sigma,
Saint
Lou
is,USA,prod
.no
.T29
28,LOT
105H
4830
-
THch
Chicken
polyclon
al1:50
0Western
blot,im
mun
ocytochemistry,
immun
ohistochem
istry;
resultsimilarto
TH
(Sigma)
andvirtually
identical
toBaker
etal.(19
83),Parrish-A
ungstetal.
(200
7)
Peptid
ecorrespo
ndsto
region
ofTH
shared
betweenmou
seandhu
man/
anti-TH,Neuromics,Edina,USA,cat.
no.CH23
006,
LOT40
0563
-
Cho
lecystok
inin
(CCK)
CCK
Mou
semon
oclonal
1:50
00Im
mun
ohistochem
istry;
resultvirtually
identical
to,e.g.,Gutierrez-M
ecinas
etal.(200
5),KosakaandKosaka(200
7a,
2007
b)
Gastrine/CCK/anti-CCK,antib
odyno
.93
03,CURE,Digestiv
eDiseases
ResearchCenter,Antibod
y/RIA
Core
Gutierrez-M
ecinas
etal.(200
5)
Nitric
oxidesynthase
(NOS)
NOSmon
oMou
semon
oclonal
1:50
0Western
blot,im
mun
ofluorescence,
immun
ohistochem
istry;
results
similarto
NOSpo
ly(Sigma)
andNOSgt
(Everest
Biotech)andvirtually
identical
toKosakaandKosaka(200
7a,20
07b),
C-terminal
aasequ
ence
1095–1
289of
human
neuron
alNOS/anti-neuron
alNOS(nNOS),Transdu
ction
Laboratories,Lexington
,USA,cat.n
o.N31
020,
LOT7
-
466 Cell Tissue Res (2010) 339:463–479
Tab
le1
(con
tinued)
Targetprotein
Anti-bo
dySpecies
Dilu
tion
Characterization
Immun
izingantig
en/sou
rce
References
NOSpo
lyRabbitpo
lyclon
al1:40
00Im
mun
oblot;results
similarto
NOSmon
o(Transdu
ctionLaboratories)
andNOSgt
(EverestBiotech)andvirtually
identical
toKosakaandKosaka(200
7a,20
07b),
C-terminal
peptideK-
RSESIA
FIEESKKDADEVFSS/anti-
NOS,brain(bNOS),14
09–1
429,
Sig-
ma,
Saint
Lou
is,USA,prod
.no
.N72
80,LOT47
H48
13
-
NOSgt
Goatpo
lyclon
al1:50
0Western
blot;results
similarto
NOSmon
o(Transdu
ctionLaboratories)
and
NOSpo
ly(Sigma)
andvirtually
identical
toKosakaandKosaka(200
7a,20
07b),
C-terminal
aasequ
ence
C-
ESKKDTDEVFSS/anti-NOS1(neuro-
nal),EverestBiotech,Upp
erHeyford,
UK,prod
.no
.EB05
259
-
Parvalbum
in(PV)
PV
Rabbitpo
lyclon
al1:20
00Im
unob
lot,radioimmun
oassay,
immun
ohistochem
istry;
resultvirtually
identical
toKosakaetal.(199
4),Crespo
etal.(199
7),Brino
net
al.(199
7)
PurifiedratmusclePV/anti-PV,sw
ant,
Bellin
zona,Switzerland
,cCat.no
.PV-
28,LOT5.5
-
Calbind
in-D
-28k
(CB)
CabPneu
Mou
se1:10
00Im
mun
oblot,im
mun
ohistochem
istry;
nocross-reactiv
itywith
otherm
embersof
the
EFhand
family
;resultv
irtually
identical
toBrinonetal.(1992),Bastianelli
and
Pochet(1995),Crespoet
al.(1997)
Purifiedbo
vine
kidn
eyCB/anti-CB,
Sigma,
Saint
Lou
is,USA,prod
.no
.C98
48,clon
eCB-955
-
Visinin-likeprotein-1
(neurocalcin
α;vilip
1)vilip
1Rabbitpo
lyclon
al1:10
00Western
blot,im
mun
ohistochem
istry;
resultvirtually
identical
to,e.g.,
Bastianelli
andPochet(199
5),Crespo
etal.(199
7),Brino
net
al.(199
8)
Purifiedrecombinant
His-tagged
visinin-lik
eprotein-1fusion
protein/
Braun
ewellK-H
,Biochem
istry&
Molecular
Biology
Departm
ent,
Sou
thernResearchInstitu
te,Birming-
ham,USA
Bernstein
etal.(200
3),
Gierkeet
al.(200
4)
Hippo
calcin
(hippo
)hipp
oRabbitpo
lyclon
al1:10
00Western
blot,im
mun
ohistochem
istry
Purifiedrecombinant
His-taggedhipp
ofusion
protein/Braun
ewellK-H
,see
abov
e
Bernstein
etal.(200
3)
Calretin
in(CR)
CAL
Rabbitpo
lyclon
al1:10
,000
Immun
ohistochem
istry;
immun
oblot
assayagainstothercalcium-binding
proteins;results
similarto
CALgt
(Chemicon
)andvirtually
identical
toBastianelli
andPochet(199
5),Crespo
etal.(199
7),Brino
net
al.(199
7)
Purifiedrecombinant
human
CR/anti-
CR,sw
ant,Bellin
zona,Switzerland
,prod
.no
.76
99/4,LOT18
299
Bou
illeret
etal.(200
0)
CALgt
Goatpo
lyclon
al1:30
00Western
blot,im
mun
ohistochem
istry;
resultsimilarto
CAL(swant)and
virtually
identical
toBastianelli
and
Pochet(199
5),Crespoet
al.(199
7),
Brino
net
al.(199
7)
Purifiedgu
inea
pigCR/anti-CR,
Chemicon
International,cat.no
.AB15
50,LOT20
0103
36
-
Glialfibrillaryacidic
protein(G
FAP)
GFA
Pab
Rabbitpo
lyclon
al1:20
00Im
mun
ofluorescence,
immun
ohistochem
istry;
resultidentical
toGFA
P(Sigma)
andvirtually
identical
toBaileyandShipley
(199
3)
Purifiedbo
vine
spinal
cord
GFA
P/anti-
GFA
P,Abcam
,Cam
bridge,UK,prod
.no
.ab
7779
–500
,LOT24
0312
-
GFA
PMou
semon
oclonal
1:40
0Im
mun
ofluorescence,
immun
ohistochem
istry,
nocross-
reactiv
itywith
vimentin
;resultidentical
toGFA
Pabcam
(Abcam
)andvirtually
identical
toBaileyandShipley
(199
3)
Purifiedpigspinal
cord
GFA
P/anti-
GFA
P,Sigma,Saint
Lou
is,U
SA,p
rod.
no.G38
93,Clone
G-A
-5,LOT
44H48
19
-
Cell Tissue Res (2010) 339:463–479 467

structed cells are shown below and in the ElectronicSupplementary Material) or by visual inspection of stainingat the microscope. PG-, SA-, and ET-like cells were identifiedon the basis of morphological criteria. PG cells are neuronswith small somata and usually one or two dendrites thatramify extensively in a single (sometimes two) neighboringglomeruli. In contrast, SA cells are larger than most PG cells.Often, SA cells have more than two dendrites that do notramify in glomeruli but rather reach across several adjacentglomeruli to contact other juxtaglomerular cells. ET cellsdisplay large somata and usually possess one thick primarytuft that ramifies within a single glomerulus. Some ETcells additionally possess far-reaching lateral dendrites(Pinching and Powell 1971). Only cells that could clearlybe classified by these criteria are shown in the figuresand have been included in the analyses summarized inTables 2, 3 (excluding frequency of cell types, see below).We did not use criteria other than the presence/absenceof thick primary tufts and presence/absence of HCNand marker stainings to establish IFs (see ElectronicSupplementary Material).
Measurement of somata size and frequency of cell types
To quantify cell size, we measured the circumference ofcells in confocal sections and calculated cell diameters byassuming a circular shape. In confocal sections, almostspherical cells can be cut at levels other than that yieldingthe maximal cell diameter. To avoid an under-estimation ofthe cell size, many somata of identified cells were analyzed,and only the largest third was used for the calculation ofsoma size. For frequent cell populations (cells with IF1,IF2, IF6, IF7, IF8, or IF9), we measured the circumferencesof 40–61 individual cells, and for rare cell types (cellswith IF3, IF4, IF5, IF10, IF11, IF12, IF13, IF14, IF15,IF16, or IF17), we measured the circumferences of 31–45individual cells (n≥three animals each). Numbers are givenas means±SD. This method allows the analysis of largeamounts of data sets, albeit with considerable error. Todemonstrate that, for the present study, the error was withina tolerable range, we reconstructed cells in three dimen-sions (3D; Imaris software, Bitplane, Zürich, Switzerland,see Electronic Supplementary Material) and calculated celldiameters as described above. We reconstructed 10 CB-stained and 10 CR-stained PG-like cells and calculatedmean diameters of 7.9±0.4 μm and 6.7±0.5 μm, respec-tively. Using circumferences of the largest third, wecalculated, for the CB and CR cell population, meandiameters of 7.9±0.8 μm and 6.5±0.8 μm, respectively.We also reconstructed ET-like cells (six NOS-stained andseven vilip1-stained cells) and calculated mean diameters of11.5±0.6 μm and 10.8±0.4 μm, respectively (comparedwith 12.2±2 μm and 11.6±2 μm by using the circum-
ferences of the largest third, respectively). Thus, bothmethods yielded similar results.
To estimate the frequencies at which different popula-tions of juxtaglomerular cells occurred per glomerulus, wecounted cells of a particular population in the neighborhoodof many adjacent glomeruli in several confocal sections(n≥three animals per cell type, see Electronic SupplementaryMaterial, Table 1). Staining used to count the variouspopulations were (for antibodies see Table 1) HCN1/NOS(IF1), HCN1/HCN4/CB (IF1, IF2, IF5, and IF6), PV (IF4),TH/CAL/NOS (IF7, IF8, IF9, IF16, and IF17), NOS (IF10),HCN2 (IF11), HCN1/HCN4/NOS (IF12 and IF13), vilip1(IF14), HCN1/CCK/NOS, and HCN4/NOS/TH (IF15). Toestimate the frequency of cells with IF3, we counted allvilip1-positive PG-like cells and subtracted the number ofPV-positive (IF4) cells.
The counting relied on four assumptions. (1) Somata andglomeruli are spherical. (2) All planes of a glomerulus areequally represented provided a sufficient number ofconfocal sections are analyzed. (3) All cells of a particularpopulation can be readily identified in a confocal section;this assumption is expected not to be met completely,because the diameter of some cells in a confocal sectionwill be too small and, therefore, frequencies will beunderestimated. (4) All glomeruli contain similar propor-tions of cell populations. Ideally, the number of a given celltype per glomerulus, the frequency, can be determined bycounting all cells of this type along an entire glomerulus inan extremely thick section. We derived the frequenciesaccording to:
Frequency ¼ dglomC
dcelltypenglom
Cells of a given type were counted (number of countedcells = C) in confocal sections across many adjacentglomeruli (number of glomeruli = nglom) and expressed ascell numbers per section and glomerulus (C/nglom). Toderive the frequency per whole glomerulus, C/nglom wasmultiplied with the frequency that this cell type can befound along the Z-axis of a glomerulus. This measure canbe expressed as dglom/dcelltype, the ratio of the diameter of astandard glomerulus (dglom=100 μm; see Royet et al. 1988)and the mean diameter of the cell soma (dcelltype). Todemonstrate the general applicability of the method, wedetermined the total cell number surrounding a standardglomerulus with a nuclear stain (TOPRO-3, MolecularProbes) and compared the result with published numbersestablished by the optical dissector method (Parrish-Aungstet al. 2007).
Statistical analysis was performed with Microsoft Exceland Mathlab. Similarity between the soma diameters of thedifferent cell populations was analyzed by using a pair-wiseKruskal-Wallis test with all possible combinations.
468 Cell Tissue Res (2010) 339:463–479
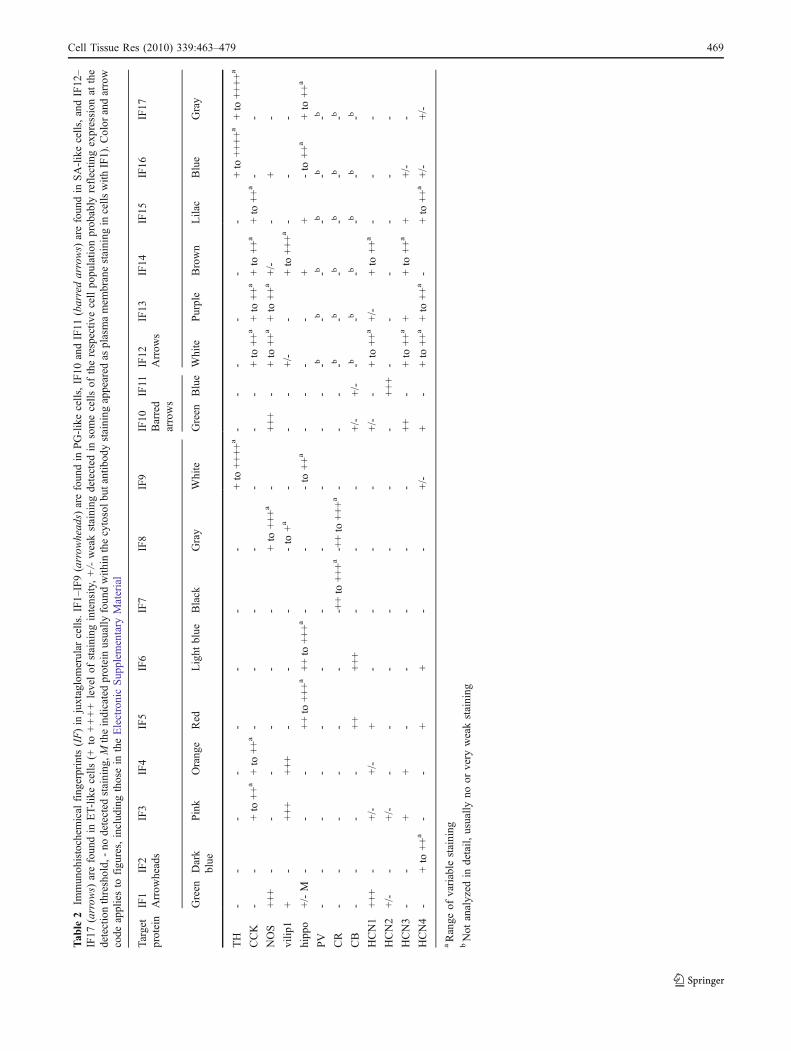
Tab
le2
Immun
ohistochem
ical
fing
erprints(IF)in
juxtaglomerular
cells.IF1–
IF9(arrow
head
s)arefoun
din
PG-likecells,IF10
andIF11
(barredarrows)
arefoun
din
SA-likecells,andIF12
–IF17
(arrow
s)arefoun
din
ET-lik
ecells
(+to
++++
levelof
staining
intensity,+/-weakstaining
detected
insomecells
oftherespectiv
ecellpo
pulatio
nprob
ably
reflectin
gexpression
atthe
detectionthreshold,
-no
detected
staining
,Mtheindicatedproteinusually
foun
dwith
inthecytosolb
utantib
odystaining
appeared
asplasmamem
branestaining
incells
with
IF1).C
olor
andarrow
code
appliesto
figu
res,includ
ingthosein
theElectronicSup
plem
entary
Material
Target
protein
IF1
IF2
IF3
IF4
IF5
IF6
IF7
IF8
IF9
IF10
IF11
IF12
IF13
IF14
IF15
IF16
IF17
Arrow
heads
Barred
arrows
Arrow
s
Green
Dark
blue
Pink
Orang
eRed
Light
blue
Black
Gray
White
Green
Blue
White
Purple
Brown
Lilac
Blue
Gray
TH
--
--
--
--
+to
++++a
--
--
--
+to
++++a
+to
++++a
CCK
--
+to
++a
+to
++a
--
--
--
-+to
++a
+to
++a
+to
++a
+to
++a
--
NOS
+++
--
--
--
+to
+++a
-+++
-+to
++a
+to
++a
+/-
-+
-
vilip
1+
-+++
+++
--
--to
+a
--
-+/-
-+to
+++a
--
-
hipp
o+/-M
--
-++to
+++a
++to
+++a
--
-to
++a
--
--
++
-to
++a
+to
++a
PV
--
--
--
--
--
--b
-b-b
-b-b
-b
CR
--
--
--
-++to
+++a
-++to
+++a
--
--b
-b-b
-b-b
-b
CB
--
--
++
+++
--
-+/-
+/-
-b-b
-b-b
-b-b
HCN1
+++
-+/-
+/-
+-
--
-+/-
-+to
++a
+/-
+to
++a
--
-
HCN2
+/-
-+/-
--
--
--
-+++
--
--
--
HCN3
--
++
--
--
-++
-+to
++a
++to
++a
++/-
-
HCN4
-+to
++a
--
++
--
+/-
+-
+to
++a
+to
++a
-+to
++a
+/-
+/-
aRange
ofvariable
staining
bNot
analyzed
indetail,
usually
noor
very
weakstaining
Cell Tissue Res (2010) 339:463–479 469
Results
Distribution of HCN channel isoforms in the olfactory bulb
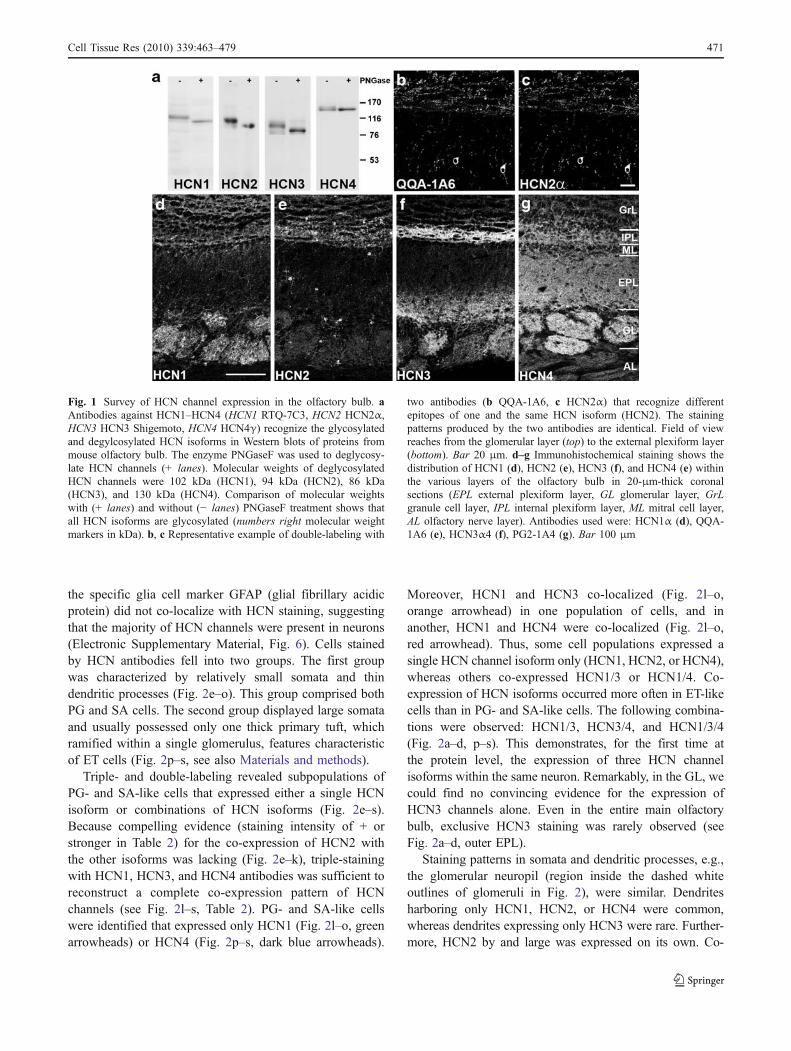
The distribution of HCN channels in the olfactory bulbwas examined with 12 different antibodies against the fourHCN channel isoforms (Table 1). Each HCN isoform wasrecognized by three antibodies generated in differentspecies. In addition, for each HCN isoform, two antibodieswere generated against different epitopes. The specificityand suitability of antibodies was ensured by three criteria.(1) Western blots of proteins from olfactory bulb and fromHEK 293 cells that expressed either one of the four HCNisoforms. After treatment with PNGaseF to remove proteinglycosylation, the antibodies recognized proteins of theexpected molecular weight of 102, 94, 86, and 130 kDa forHCN1, HCN2, HCN3, and HCN4, respectively (Fig. 1a;Müller et al. 2003). (2) Independent antibodies directedagainst the same HCN isoform produced identical stainingpatterns as demonstrated by the superposition of images(Fig. 1b, c, Electronic Supplementary Material, Fig. 1). (3)In HCN1 and HCN3 knockout animals, no staining wasobserved with antibodies against the deleted isoform(Electronic Supplementary Material, Fig. 2; HCN1 knock-out mice: Nolan et al. 2003; HCN3 knockout mice: gift
of Martin Biel, Ludwig-Maximilians Universität, Munich,Germany).
Each HCN isoform showed a characteristic expressionpattern in the various layers of the olfactory bulb (Fig. 1c,e–g). The HCN staining originated from somata andneuronal processes alike. Each HCN isoform was foundonly in subsets of cells. Therefore, staining intensities differedbetween different layers. HCN1 was strongly expressed in theglomerular layer (GL), followed by some weaker expressionin the internal plexiform layer (IPL) and the granule cell layer(GrL). Only weak staining was observed in the externalplexiform layer (EPL). For HCN2, the most intense stainingwas observed in individual cell bodies distributed across allbut the olfactory nerve layer (AL). HCN3 was stronglyexpressed in the IPL and the outer part of the EPL. StrongHCN4 staining was observed in all layers; in the AL, itappeared to be the only HCN isoform. Thus, in the GL,abundant expression of all four HCN isoforms was observed.In the following, we restrict our analysis to the GL.
HCN isoforms are expressed in many differentcombinations
In the GL, antibodies against all HCN isoforms stained thesomatic and dendritic plasma membrane (Fig. 2). Moreover,
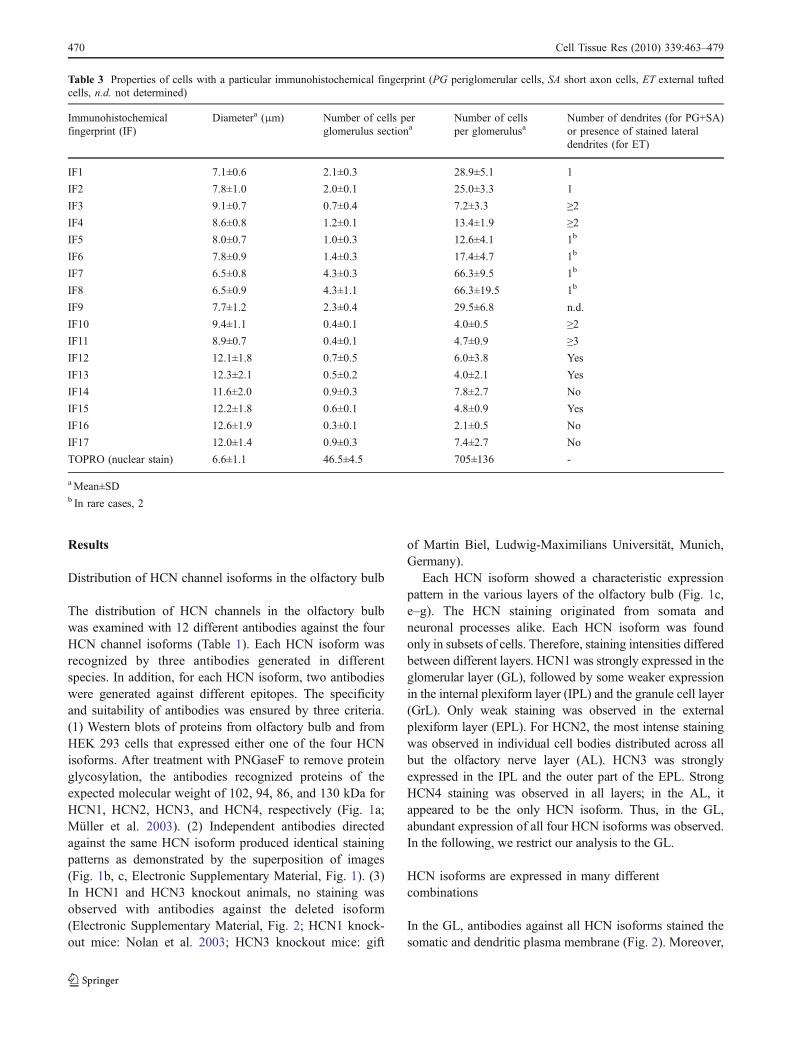
Table 3 Properties of cells with a particular immunohistochemical fingerprint (PG periglomerular cells, SA short axon cells, ET external tuftedcells, n.d. not determined)
Immunohistochemicalfingerprint (IF)
Diametera (μm) Number of cells perglomerulus sectiona
Number of cellsper glomerulusa
Number of dendrites (for PG+SA)or presence of stained lateraldendrites (for ET)
IF1 7.1±0.6 2.1±0.3 28.9±5.1 1
IF2 7.8±1.0 2.0±0.1 25.0±3.3 1
IF3 9.1±0.7 0.7±0.4 7.2±3.3 ≥2IF4 8.6±0.8 1.2±0.1 13.4±1.9 ≥2IF5 8.0±0.7 1.0±0.3 12.6±4.1 1b
IF6 7.8±0.9 1.4±0.3 17.4±4.7 1b
IF7 6.5±0.8 4.3±0.3 66.3±9.5 1b
IF8 6.5±0.9 4.3±1.1 66.3±19.5 1b
IF9 7.7±1.2 2.3±0.4 29.5±6.8 n.d.
IF10 9.4±1.1 0.4±0.1 4.0±0.5 ≥2IF11 8.9±0.7 0.4±0.1 4.7±0.9 ≥3IF12 12.1±1.8 0.7±0.5 6.0±3.8 Yes
IF13 12.3±2.1 0.5±0.2 4.0±2.1 Yes
IF14 11.6±2.0 0.9±0.3 7.8±2.7 No
IF15 12.2±1.8 0.6±0.1 4.8±0.9 Yes
IF16 12.6±1.9 0.3±0.1 2.1±0.5 No
IF17 12.0±1.4 0.9±0.3 7.4±2.7 No
TOPRO (nuclear stain) 6.6±1.1 46.5±4.5 705±136 -
aMean±SDb In rare cases, 2
470 Cell Tissue Res (2010) 339:463–479
the specific glia cell marker GFAP (glial fibrillary acidicprotein) did not co-localize with HCN staining, suggestingthat the majority of HCN channels were present in neurons(Electronic Supplementary Material, Fig. 6). Cells stainedby HCN antibodies fell into two groups. The first groupwas characterized by relatively small somata and thindendritic processes (Fig. 2e–o). This group comprised bothPG and SA cells. The second group displayed large somataand usually possessed only one thick primary tuft, whichramified within a single glomerulus, features characteristicof ET cells (Fig. 2p–s, see also Materials and methods).
Triple- and double-labeling revealed subpopulations ofPG- and SA-like cells that expressed either a single HCNisoform or combinations of HCN isoforms (Fig. 2e–s).Because compelling evidence (staining intensity of + orstronger in Table 2) for the co-expression of HCN2 withthe other isoforms was lacking (Fig. 2e–k), triple-stainingwith HCN1, HCN3, and HCN4 antibodies was sufficient toreconstruct a complete co-expression pattern of HCNchannels (see Fig. 2l–s, Table 2). PG- and SA-like cellswere identified that expressed only HCN1 (Fig. 2l–o, greenarrowheads) or HCN4 (Fig. 2p–s, dark blue arrowheads).
Moreover, HCN1 and HCN3 co-localized (Fig. 2l–o,orange arrowhead) in one population of cells, and inanother, HCN1 and HCN4 were co-localized (Fig. 2l–o,red arrowhead). Thus, some cell populations expressed asingle HCN channel isoform only (HCN1, HCN2, or HCN4),whereas others co-expressed HCN1/3 or HCN1/4. Co-expression of HCN isoforms occurred more often in ET-likecells than in PG- and SA-like cells. The following combina-tions were observed: HCN1/3, HCN3/4, and HCN1/3/4(Fig. 2a–d, p–s). This demonstrates, for the first time atthe protein level, the expression of three HCN channelisoforms within the same neuron. Remarkably, in the GL, wecould find no convincing evidence for the expression ofHCN3 channels alone. Even in the entire main olfactorybulb, exclusive HCN3 staining was rarely observed (seeFig. 2a–d, outer EPL).
Staining patterns in somata and dendritic processes, e.g.,the glomerular neuropil (region inside the dashed whiteoutlines of glomeruli in Fig. 2), were similar. Dendritesharboring only HCN1, HCN2, or HCN4 were common,whereas dendrites expressing only HCN3 were rare. Further-more, HCN2 by and large was expressed on its own. Co-
Fig. 1 Survey of HCN channel expression in the olfactory bulb. aAntibodies against HCN1–HCN4 (HCN1 RTQ-7C3, HCN2 HCN2α,HCN3 HCN3 Shigemoto, HCN4 HCN4γ) recognize the glycosylatedand degylcosylated HCN isoforms in Western blots of proteins frommouse olfactory bulb. The enzyme PNGaseF was used to deglycosy-late HCN channels (+ lanes). Molecular weights of deglycosylatedHCN channels were 102 kDa (HCN1), 94 kDa (HCN2), 86 kDa(HCN3), and 130 kDa (HCN4). Comparison of molecular weightswith (+ lanes) and without (− lanes) PNGaseF treatment shows thatall HCN isoforms are glycosylated (numbers right molecular weightmarkers in kDa). b, c Representative example of double-labeling with
two antibodies (b QQA-1A6, c HCN2α) that recognize differentepitopes of one and the same HCN isoform (HCN2). The stainingpatterns produced by the two antibodies are identical. Field of viewreaches from the glomerular layer (top) to the external plexiform layer(bottom). Bar 20 μm. d–g Immunohistochemical staining shows thedistribution of HCN1 (d), HCN2 (e), HCN3 (f), and HCN4 (e) withinthe various layers of the olfactory bulb in 20-μm-thick coronalsections (EPL external plexiform layer, GL glomerular layer, GrLgranule cell layer, IPL internal plexiform layer, ML mitral cell layer,AL olfactory nerve layer). Antibodies used were: HCN1α (d), QQA-1A6 (e), HCN3α4 (f), PG2-1A4 (g). Bar 100 μm
Cell Tissue Res (2010) 339:463–479 471
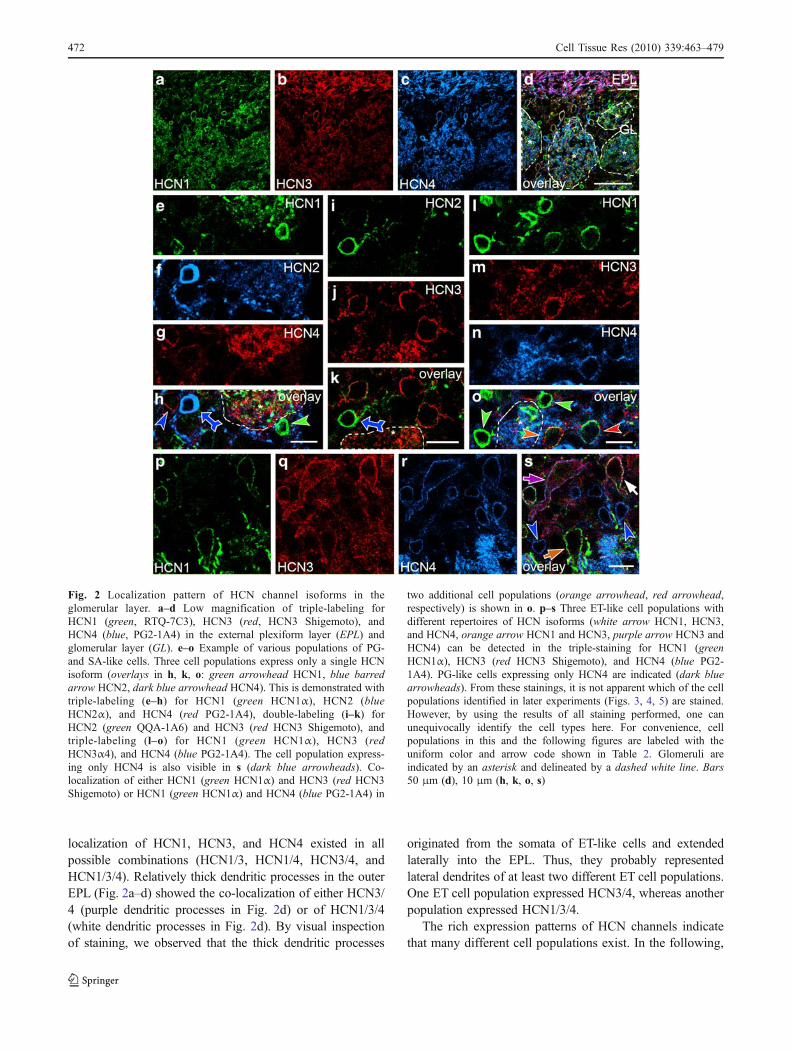
localization of HCN1, HCN3, and HCN4 existed in allpossible combinations (HCN1/3, HCN1/4, HCN3/4, andHCN1/3/4). Relatively thick dendritic processes in the outerEPL (Fig. 2a–d) showed the co-localization of either HCN3/4 (purple dendritic processes in Fig. 2d) or of HCN1/3/4(white dendritic processes in Fig. 2d). By visual inspectionof staining, we observed that the thick dendritic processes
originated from the somata of ET-like cells and extendedlaterally into the EPL. Thus, they probably representedlateral dendrites of at least two different ET cell populations.One ET cell population expressed HCN3/4, whereas anotherpopulation expressed HCN1/3/4.
The rich expression patterns of HCN channels indicatethat many different cell populations exist. In the following,
Fig. 2 Localization pattern of HCN channel isoforms in theglomerular layer. a–d Low magnification of triple-labeling forHCN1 (green, RTQ-7C3), HCN3 (red, HCN3 Shigemoto), andHCN4 (blue, PG2-1A4) in the external plexiform layer (EPL) andglomerular layer (GL). e–o Example of various populations of PG-and SA-like cells. Three cell populations express only a single HCNisoform (overlays in h, k, o: green arrowhead HCN1, blue barredarrow HCN2, dark blue arrowhead HCN4). This is demonstrated withtriple-labeling (e–h) for HCN1 (green HCN1α), HCN2 (blueHCN2α), and HCN4 (red PG2-1A4), double-labeling (i–k) forHCN2 (green QQA-1A6) and HCN3 (red HCN3 Shigemoto), andtriple-labeling (l–o) for HCN1 (green HCN1α), HCN3 (redHCN3α4), and HCN4 (blue PG2-1A4). The cell population express-ing only HCN4 is also visible in s (dark blue arrowheads). Co-localization of either HCN1 (green HCN1α) and HCN3 (red HCN3Shigemoto) or HCN1 (green HCN1α) and HCN4 (blue PG2-1A4) in
two additional cell populations (orange arrowhead, red arrowhead,respectively) is shown in o. p–s Three ET-like cell populations withdifferent repertoires of HCN isoforms (white arrow HCN1, HCN3,and HCN4, orange arrow HCN1 and HCN3, purple arrow HCN3 andHCN4) can be detected in the triple-staining for HCN1 (greenHCN1α), HCN3 (red HCN3 Shigemoto), and HCN4 (blue PG2-1A4). PG-like cells expressing only HCN4 are indicated (dark bluearrowheads). From these stainings, it is not apparent which of the cellpopulations identified in later experiments (Figs. 3, 4, 5) are stained.However, by using the results of all staining performed, one canunequivocally identify the cell types here. For convenience, cellpopulations in this and the following figures are labeled with theuniform color and arrow code shown in Table 2. Glomeruli areindicated by an asterisk and delineated by a dashed white line. Bars50 μm (d), 10 μm (h, k, o, s)
472 Cell Tissue Res (2010) 339:463–479
we relate HCN channel expression patterns to previouslydescribed cell populations by combining immunostainingfor markers and HCN.
Immunohistochemical characterization of juxtaglomerularcells expressing HCN channels
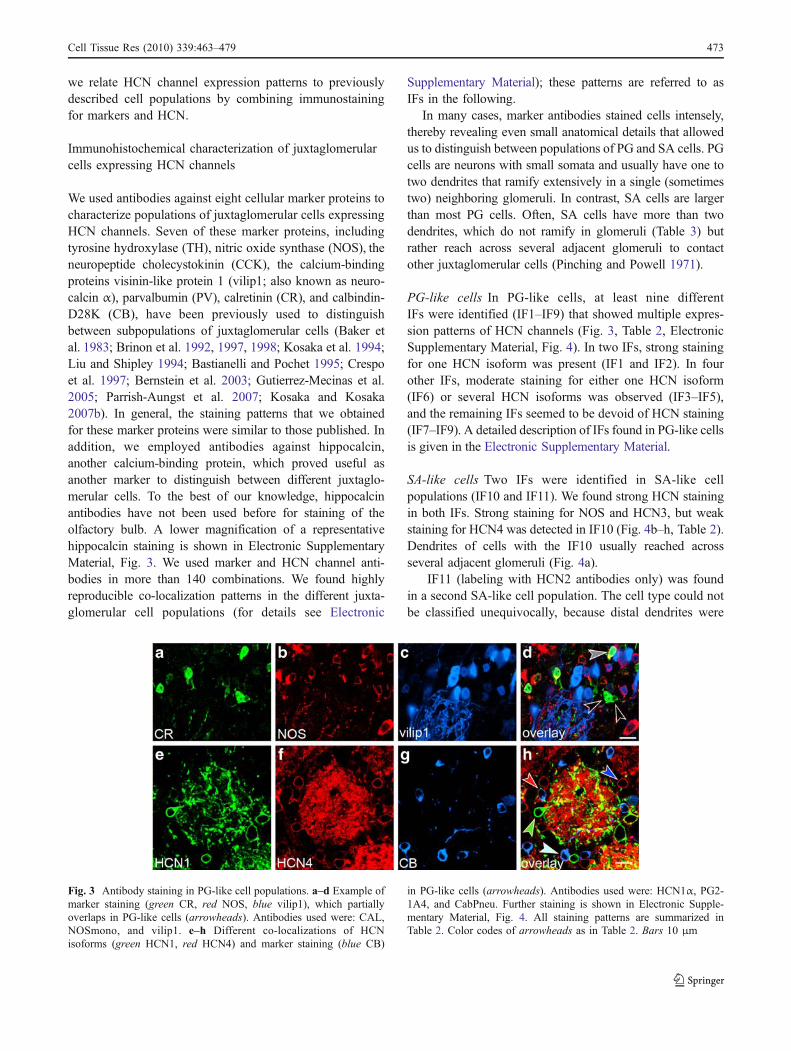
We used antibodies against eight cellular marker proteins tocharacterize populations of juxtaglomerular cells expressingHCN channels. Seven of these marker proteins, includingtyrosine hydroxylase (TH), nitric oxide synthase (NOS), theneuropeptide cholecystokinin (CCK), the calcium-bindingproteins visinin-like protein 1 (vilip1; also known as neuro-calcin α), parvalbumin (PV), calretinin (CR), and calbindin-D28K (CB), have been previously used to distinguishbetween subpopulations of juxtaglomerular cells (Baker etal. 1983; Brinon et al. 1992, 1997, 1998; Kosaka et al. 1994;Liu and Shipley 1994; Bastianelli and Pochet 1995; Crespoet al. 1997; Bernstein et al. 2003; Gutierrez-Mecinas et al.2005; Parrish-Aungst et al. 2007; Kosaka and Kosaka2007b). In general, the staining patterns that we obtainedfor these marker proteins were similar to those published. Inaddition, we employed antibodies against hippocalcin,another calcium-binding protein, which proved useful asanother marker to distinguish between different juxtaglo-merular cells. To the best of our knowledge, hippocalcinantibodies have not been used before for staining of theolfactory bulb. A lower magnification of a representativehippocalcin staining is shown in Electronic SupplementaryMaterial, Fig. 3. We used marker and HCN channel anti-bodies in more than 140 combinations. We found highlyreproducible co-localization patterns in the different juxta-glomerular cell populations (for details see Electronic
Supplementary Material); these patterns are referred to asIFs in the following.
In many cases, marker antibodies stained cells intensely,thereby revealing even small anatomical details that allowedus to distinguish between populations of PG and SA cells. PGcells are neurons with small somata and usually have one totwo dendrites that ramify extensively in a single (sometimestwo) neighboring glomeruli. In contrast, SA cells are largerthan most PG cells. Often, SA cells have more than twodendrites, which do not ramify in glomeruli (Table 3) butrather reach across several adjacent glomeruli to contactother juxtaglomerular cells (Pinching and Powell 1971).
PG-like cells In PG-like cells, at least nine differentIFs were identified (IF1–IF9) that showed multiple expres-sion patterns of HCN channels (Fig. 3, Table 2, ElectronicSupplementary Material, Fig. 4). In two IFs, strong stainingfor one HCN isoform was present (IF1 and IF2). In fourother IFs, moderate staining for either one HCN isoform(IF6) or several HCN isoforms was observed (IF3–IF5),and the remaining IFs seemed to be devoid of HCN staining(IF7–IF9). A detailed description of IFs found in PG-like cellsis given in the Electronic Supplementary Material.
SA-like cells Two IFs were identified in SA-like cellpopulations (IF10 and IF11). We found strong HCN stainingin both IFs. Strong staining for NOS and HCN3, but weakstaining for HCN4 was detected in IF10 (Fig. 4b–h, Table 2).Dendrites of cells with the IF10 usually reached acrossseveral adjacent glomeruli (Fig. 4a).
IF11 (labeling with HCN2 antibodies only) was foundin a second SA-like cell population. The cell type could notbe classified unequivocally, because distal dendrites were
Fig. 3 Antibody staining in PG-like cell populations. a–d Example ofmarker staining (green CR, red NOS, blue vilip1), which partiallyoverlaps in PG-like cells (arrowheads). Antibodies used were: CAL,NOSmono, and vilip1. e–h Different co-localizations of HCNisoforms (green HCN1, red HCN4) and marker staining (blue CB)
in PG-like cells (arrowheads). Antibodies used were: HCN1α, PG2-1A4, and CabPneu. Further staining is shown in Electronic Supple-mentary Material, Fig. 4. All staining patterns are summarized inTable 2. Color codes of arrowheads as in Table 2. Bars 10 μm
Cell Tissue Res (2010) 339:463–479 473
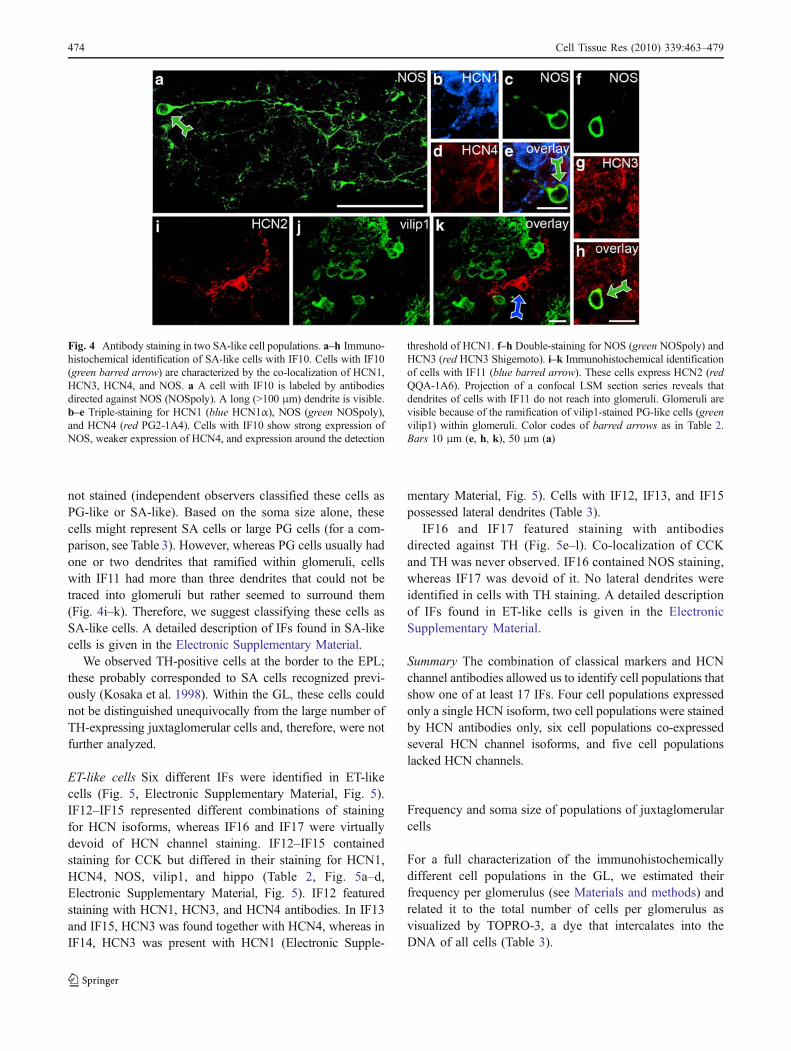
not stained (independent observers classified these cells asPG-like or SA-like). Based on the soma size alone, thesecells might represent SA cells or large PG cells (for a com-parison, see Table 3). However, whereas PG cells usually hadone or two dendrites that ramified within glomeruli, cellswith IF11 had more than three dendrites that could not betraced into glomeruli but rather seemed to surround them(Fig. 4i–k). Therefore, we suggest classifying these cells asSA-like cells. A detailed description of IFs found in SA-likecells is given in the Electronic Supplementary Material.
We observed TH-positive cells at the border to the EPL;these probably corresponded to SA cells recognized previ-ously (Kosaka et al. 1998). Within the GL, these cells couldnot be distinguished unequivocally from the large number ofTH-expressing juxtaglomerular cells and, therefore, were notfurther analyzed.
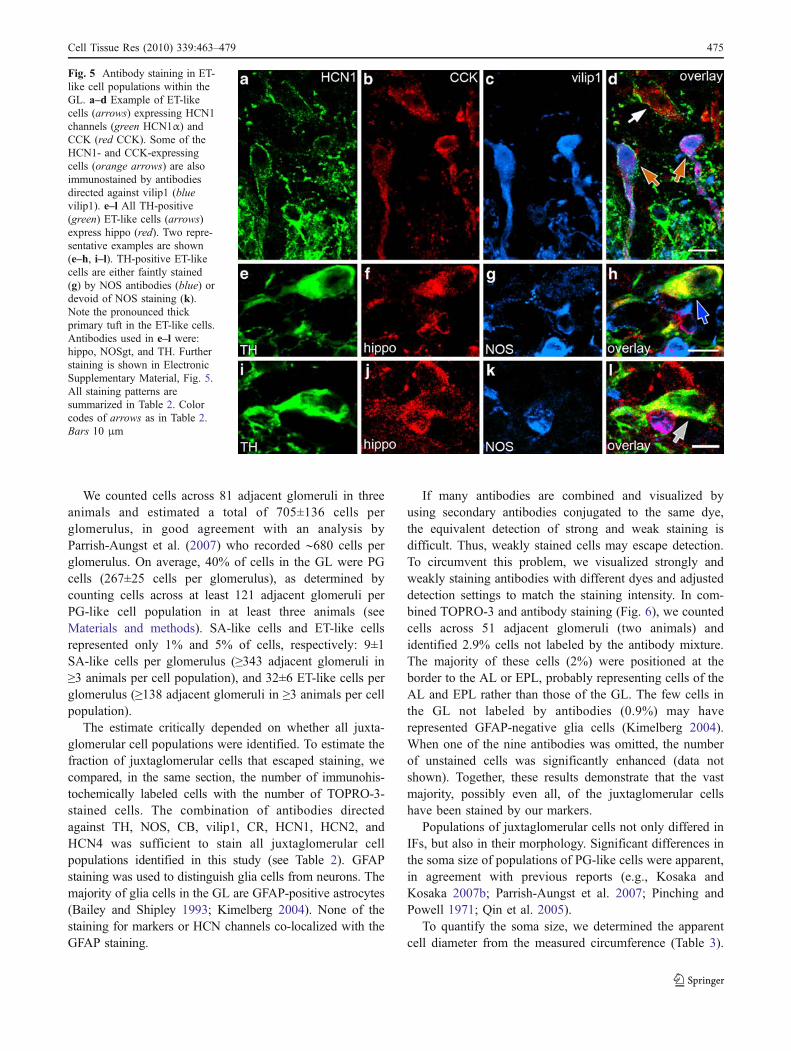
ET-like cells Six different IFs were identified in ET-likecells (Fig. 5, Electronic Supplementary Material, Fig. 5).IF12–IF15 represented different combinations of stainingfor HCN isoforms, whereas IF16 and IF17 were virtuallydevoid of HCN channel staining. IF12–IF15 containedstaining for CCK but differed in their staining for HCN1,HCN4, NOS, vilip1, and hippo (Table 2, Fig. 5a–d,Electronic Supplementary Material, Fig. 5). IF12 featuredstaining with HCN1, HCN3, and HCN4 antibodies. In IF13and IF15, HCN3 was found together with HCN4, whereas inIF14, HCN3 was present with HCN1 (Electronic Supple-
mentary Material, Fig. 5). Cells with IF12, IF13, and IF15possessed lateral dendrites (Table 3).
IF16 and IF17 featured staining with antibodiesdirected against TH (Fig. 5e–l). Co-localization of CCKand TH was never observed. IF16 contained NOS staining,whereas IF17 was devoid of it. No lateral dendrites wereidentified in cells with TH staining. A detailed descriptionof IFs found in ET-like cells is given in the ElectronicSupplementary Material.
Summary The combination of classical markers and HCNchannel antibodies allowed us to identify cell populations thatshow one of at least 17 IFs. Four cell populations expressedonly a single HCN isoform, two cell populations were stainedby HCN antibodies only, six cell populations co-expressedseveral HCN channel isoforms, and five cell populationslacked HCN channels.
Frequency and soma size of populations of juxtaglomerularcells
For a full characterization of the immunohistochemicallydifferent cell populations in the GL, we estimated theirfrequency per glomerulus (see Materials and methods) andrelated it to the total number of cells per glomerulus asvisualized by TOPRO-3, a dye that intercalates into theDNA of all cells (Table 3).
Fig. 4 Antibody staining in two SA-like cell populations. a–h Immuno-histochemical identification of SA-like cells with IF10. Cells with IF10(green barred arrow) are characterized by the co-localization of HCN1,HCN3, HCN4, and NOS. a A cell with IF10 is labeled by antibodiesdirected against NOS (NOSpoly). A long (>100 μm) dendrite is visible.b–e Triple-staining for HCN1 (blue HCN1α), NOS (green NOSpoly),and HCN4 (red PG2-1A4). Cells with IF10 show strong expression ofNOS, weaker expression of HCN4, and expression around the detection
threshold of HCN1. f–h Double-staining for NOS (green NOSpoly) andHCN3 (red HCN3 Shigemoto). i–k Immunohistochemical identificationof cells with IF11 (blue barred arrow). These cells express HCN2 (redQQA-1A6). Projection of a confocal LSM section series reveals thatdendrites of cells with IF11 do not reach into glomeruli. Glomeruli arevisible because of the ramification of vilip1-stained PG-like cells (greenvilip1) within glomeruli. Color codes of barred arrows as in Table 2.Bars 10 μm (e, h, k), 50 μm (a)
474 Cell Tissue Res (2010) 339:463–479
We counted cells across 81 adjacent glomeruli in threeanimals and estimated a total of 705±136 cells perglomerulus, in good agreement with an analysis byParrish-Aungst et al. (2007) who recorded ∼680 cells perglomerulus. On average, 40% of cells in the GL were PGcells (267±25 cells per glomerulus), as determined bycounting cells across at least 121 adjacent glomeruli perPG-like cell population in at least three animals (seeMaterials and methods). SA-like cells and ET-like cellsrepresented only 1% and 5% of cells, respectively: 9±1SA-like cells per glomerulus (≥343 adjacent glomeruli in≥3 animals per cell population), and 32±6 ET-like cells perglomerulus (≥138 adjacent glomeruli in ≥3 animals per cellpopulation).
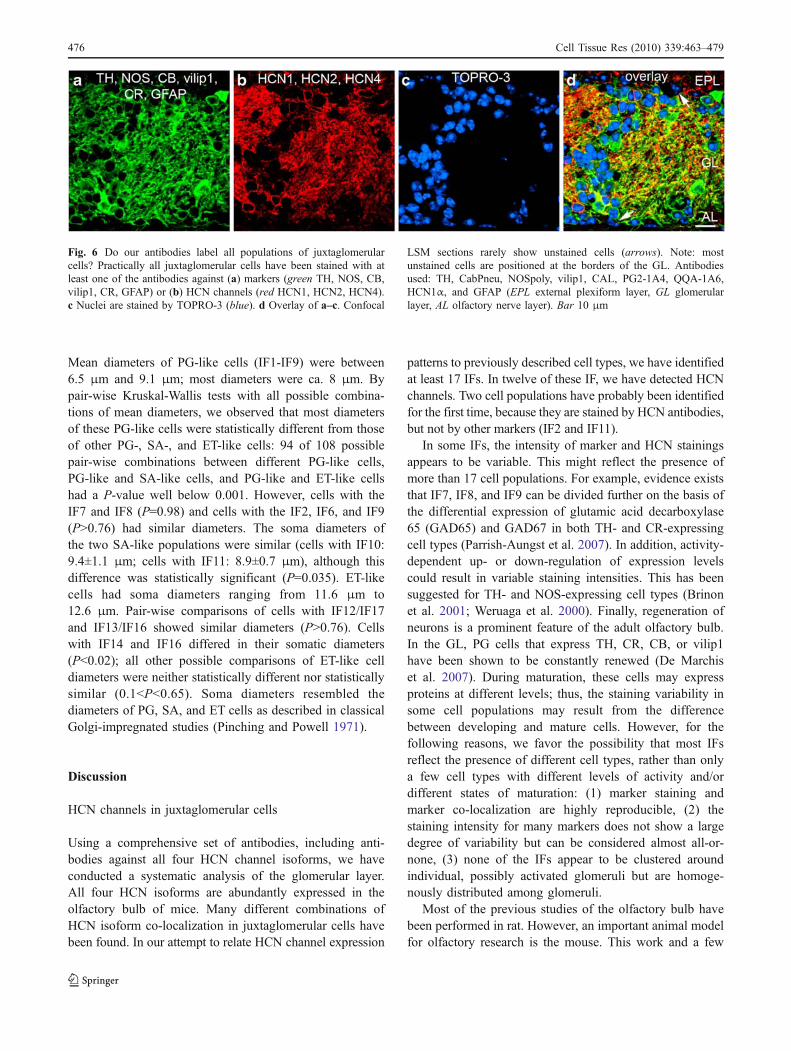
The estimate critically depended on whether all juxta-glomerular cell populations were identified. To estimate thefraction of juxtaglomerular cells that escaped staining, wecompared, in the same section, the number of immunohis-tochemically labeled cells with the number of TOPRO-3-stained cells. The combination of antibodies directedagainst TH, NOS, CB, vilip1, CR, HCN1, HCN2, andHCN4 was sufficient to stain all juxtaglomerular cellpopulations identified in this study (see Table 2). GFAPstaining was used to distinguish glia cells from neurons. Themajority of glia cells in the GL are GFAP-positive astrocytes(Bailey and Shipley 1993; Kimelberg 2004). None of thestaining for markers or HCN channels co-localized with theGFAP staining.
If many antibodies are combined and visualized byusing secondary antibodies conjugated to the same dye,the equivalent detection of strong and weak staining isdifficult. Thus, weakly stained cells may escape detection.To circumvent this problem, we visualized strongly andweakly staining antibodies with different dyes and adjusteddetection settings to match the staining intensity. In com-bined TOPRO-3 and antibody staining (Fig. 6), we countedcells across 51 adjacent glomeruli (two animals) andidentified 2.9% cells not labeled by the antibody mixture.The majority of these cells (2%) were positioned at theborder to the AL or EPL, probably representing cells of theAL and EPL rather than those of the GL. The few cells inthe GL not labeled by antibodies (0.9%) may haverepresented GFAP-negative glia cells (Kimelberg 2004).When one of the nine antibodies was omitted, the numberof unstained cells was significantly enhanced (data notshown). Together, these results demonstrate that the vastmajority, possibly even all, of the juxtaglomerular cellshave been stained by our markers.
Populations of juxtaglomerular cells not only differed inIFs, but also in their morphology. Significant differences inthe soma size of populations of PG-like cells were apparent,in agreement with previous reports (e.g., Kosaka andKosaka 2007b; Parrish-Aungst et al. 2007; Pinching andPowell 1971; Qin et al. 2005).
To quantify the soma size, we determined the apparentcell diameter from the measured circumference (Table 3).
Fig. 5 Antibody staining in ET-like cell populations within theGL. a–d Example of ET-likecells (arrows) expressing HCN1channels (green HCN1α) andCCK (red CCK). Some of theHCN1- and CCK-expressingcells (orange arrows) are alsoimmunostained by antibodiesdirected against vilip1 (bluevilip1). e–l All TH-positive(green) ET-like cells (arrows)express hippo (red). Two repre-sentative examples are shown(e–h, i–l). TH-positive ET-likecells are either faintly stained(g) by NOS antibodies (blue) ordevoid of NOS staining (k).Note the pronounced thickprimary tuft in the ET-like cells.Antibodies used in e–l were:hippo, NOSgt, and TH. Furtherstaining is shown in ElectronicSupplementary Material, Fig. 5.All staining patterns aresummarized in Table 2. Colorcodes of arrows as in Table 2.Bars 10 μm
Cell Tissue Res (2010) 339:463–479 475
Mean diameters of PG-like cells (IF1-IF9) were between6.5 μm and 9.1 μm; most diameters were ca. 8 μm. Bypair-wise Kruskal-Wallis tests with all possible combina-tions of mean diameters, we observed that most diametersof these PG-like cells were statistically different from thoseof other PG-, SA-, and ET-like cells: 94 of 108 possiblepair-wise combinations between different PG-like cells,PG-like and SA-like cells, and PG-like and ET-like cellshad a P-value well below 0.001. However, cells with theIF7 and IF8 (P=0.98) and cells with the IF2, IF6, and IF9(P>0.76) had similar diameters. The soma diameters ofthe two SA-like populations were similar (cells with IF10:9.4±1.1 μm; cells with IF11: 8.9±0.7 μm), although thisdifference was statistically significant (P=0.035). ET-likecells had soma diameters ranging from 11.6 μm to12.6 μm. Pair-wise comparisons of cells with IF12/IF17and IF13/IF16 showed similar diameters (P>0.76). Cellswith IF14 and IF16 differed in their somatic diameters(P<0.02); all other possible comparisons of ET-like celldiameters were neither statistically different nor statisticallysimilar (0.1<P<0.65). Soma diameters resembled thediameters of PG, SA, and ET cells as described in classicalGolgi-impregnated studies (Pinching and Powell 1971).
Discussion
HCN channels in juxtaglomerular cells
Using a comprehensive set of antibodies, including anti-bodies against all four HCN channel isoforms, we haveconducted a systematic analysis of the glomerular layer.All four HCN isoforms are abundantly expressed in theolfactory bulb of mice. Many different combinations ofHCN isoform co-localization in juxtaglomerular cells havebeen found. In our attempt to relate HCN channel expression
patterns to previously described cell types, we have identifiedat least 17 IFs. In twelve of these IF, we have detected HCNchannels. Two cell populations have probably been identifiedfor the first time, because they are stained by HCN antibodies,but not by other markers (IF2 and IF11).
In some IFs, the intensity of marker and HCN stainingsappears to be variable. This might reflect the presence ofmore than 17 cell populations. For example, evidence existsthat IF7, IF8, and IF9 can be divided further on the basis ofthe differential expression of glutamic acid decarboxylase65 (GAD65) and GAD67 in both TH- and CR-expressingcell types (Parrish-Aungst et al. 2007). In addition, activity-dependent up- or down-regulation of expression levelscould result in variable staining intensities. This has beensuggested for TH- and NOS-expressing cell types (Brinonet al. 2001; Weruaga et al. 2000). Finally, regeneration ofneurons is a prominent feature of the adult olfactory bulb.In the GL, PG cells that express TH, CR, CB, or vilip1have been shown to be constantly renewed (De Marchiset al. 2007). During maturation, these cells may expressproteins at different levels; thus, the staining variability insome cell populations may result from the differencebetween developing and mature cells. However, for thefollowing reasons, we favor the possibility that most IFsreflect the presence of different cell types, rather than onlya few cell types with different levels of activity and/ordifferent states of maturation: (1) marker staining andmarker co-localization are highly reproducible, (2) thestaining intensity for many markers does not show a largedegree of variability but can be considered almost all-or-none, (3) none of the IFs appear to be clustered aroundindividual, possibly activated glomeruli but are homoge-nously distributed among glomeruli.
Most of the previous studies of the olfactory bulb havebeen performed in rat. However, an important animal modelfor olfactory research is the mouse. This work and a few
Fig. 6 Do our antibodies label all populations of juxtaglomerularcells? Practically all juxtaglomerular cells have been stained with atleast one of the antibodies against (a) markers (green TH, NOS, CB,vilip1, CR, GFAP) or (b) HCN channels (red HCN1, HCN2, HCN4).c Nuclei are stained by TOPRO-3 (blue). d Overlay of a–c. Confocal
LSM sections rarely show unstained cells (arrows). Note: mostunstained cells are positioned at the borders of the GL. Antibodiesused: TH, CabPneu, NOSpoly, vilip1, CAL, PG2-1A4, QQA-1A6,HCN1α, and GFAP (EPL external plexiform layer, GL glomerularlayer, AL olfactory nerve layer). Bar 10 μm
476 Cell Tissue Res (2010) 339:463–479
other recent studies have shown that the expression patternsof HCN channels and marker proteins are similar in themouse and rat (Kosaka and Kosaka 2007b; Panzanelli et al.2007; Parrish-Aungst et al. 2007; Notomi and Shigemoto2004). For example, in mouse, HCN1 is strongly expressedin PG-like cells with IF1, which are positive for vilip1 andNOS, but negative for CR and TH. In rat, HCN1 is alsofound in PG cells that have not been tested for vilip1 orNOS but that are negative for CR and TH (Holderith et al.2003). On the other hand, our results demonstrate thatHCN4 is strongly and abundantly expressed in the mouse.This has not been described in the rat by Notomi andShigemoto (2004) and may either reflect differences betweenthe mouse and rat, the improvement of HCN4 antibodies, orthe optimized staining procedures used in our analysis.
Based on their synaptic connectivity, PG cells fall intotwo groups. Type I cells, but not type II cells, seem toreceive direct excitatory input from ORNs. The two groupswere originally established by electron microscopy andimmunogold staining with common marker antibodies forPG cells. TH and CCK staining has been found in PG cellsof type I (Gutierrez-Mecinas et al. 2005; Kosaka et al.1998; Kosaka and Kosaka 2007a), and CR, CB, and HCN1have been found in PG cells of type II (Holderith et al.2003; Kosaka et al. 1998; Kosaka and Kosaka 2007a).According to the expression of TH, CCK, CR, CB, andHCN1, we can assign our PG populations to either type I orII. Cells with IF3, IF4, and IF9 belong to type I, whereascells with IF1, IF5, IF6, IF7, and IF8 belong to type II.Because no commonly used marker stains cells with IF2,they have escaped classification so far. IF10–IF17 havebeen found in SA- and ET-like cells and cannot beclassified as type I or II, because this division is exclusivelydefined for PG cells.
Approximately 700 cells surround a standard glomerulus:about 40% are PG cells, 1% are SA cells, and 5% are ETcells.The rest of the cells (54%) represent astrocytes, oligoden-drocytes, microglia, and cells of the vasculature. We have notcounted GFAP-positive astrocytes in the GL directly, becausethis is compromised by the location of GFAP in processesrather than in cell bodies (Bailey and Shipley 1993). Here, wehave stained the vast majority (possibly all) juxtaglomerularcell populations. Thus, the ratio of identified-to-unidentifiedcell types should represent the neuron-to-glia ratio. We havecalculated, on the basis of “numbers of cells per section of aglomerulus” (see Table 3), a ratio of 1.1±0.3 neurons-to-gliacells. Because our frequency estimates of neuron populationsare expected to be lower limits (see Materials and methods),the ratio of 1.1 is also expected to be a lower limit. Theneuron-to-glia ratio in the GL is similar to the ratio in otherlayers of the brain (Roy et al. 2005). A previous estimationof the olfactory bulb has given a ratio of about 1.7 (Parrish-Aungst et al. 2007).
The frequencies of the cell populations reported here aresimilar to those described by other studies. For example,Panzanelli et al. (2007) have calculated that 44%, 16%, and14% of PG cells are CR-, TH-, and CB-positive, respec-tively. We have observed 50%, 11%, and 11% of therespective PG cells. Parrish-Aungst et al. (2007) report that10%, 27%, 10%, 0.4%, and 11% of juxtaglomerular neuronsare stained by antibodies against CB, CR, vilip1, PV, and TH,respectively. We have observed 10%, 43%, 19%, 4%, and13%. Differences between our and published frequencies areprobably attributable to different immunohistochemical pro-cedures. Differences in the immunohistochemical procedurehave been reported to affect the staining intensity of some ofthe antibodies used here and, thereby, influence frequencycalculations (Kosaka and Kosaka 2007a).
Functional implications of HCN channel expression
An intriguing result is the prominent co-localization ofHCN channel isoforms in juxtaglomerular cells. The co-expression of HCN isoforms is apparent in six of 17identified fingerprints. If cases with +/− HCN stainingintensity are included, co-expression is observed in 10 outof 17 identified fingerprints. Whether HCN channels formheteromeric complexes in vivo is still unknown. Althoughdifferent HCN channel isoforms may co-localize withoutforming heteromers (Müller et al. 2003), heteromerizationhas been suggested to give rise to the functional diversityof HCN channels (Chen et al. 2001; Much et al. 2003;Ulens and Tytgat 2001). The composition and stoichiom-etry of HCN channel heteromers in neurons has rarely beenanalyzed (e.g., Whitaker et al. 2007). Likewise, the propertiesor physiological function of heteromeric HCN channels isnot well understood (Chen et al. 2001; Ulens and Tytgat2001; Whitaker et al. 2007). The large variety of expressionpatterns of HCN channels indicates the functional diversityof juxtaglomerular cells. For example, several juxtaglomer-ular cell types display intrinsic oscillatory activities (Antalet al. 2006; Hayar et al. 2004a, 2004b). Interestingly, allHCN-positive ET cell populations express more than oneHCN isoform (IF12–IF15). Because about 60% of ET cellsexhibit rhythmic bursts of action potentials (Antal et al.2006; Hayar et al. 2004a, 2004b), and because cells withIF12–IF15 constitute about 70% of all ET cells, heteromericHCN channels may be important for generating or modulat-ing rhythmic activity. On the other hand, TH-expressing cellsare also capable of generating rhythmic activity (Pignatelli etal. 2005). We have been unable to detect HCN channels inthese cell types (IF9, IF16, and IF17); therefore, HCN channelsare not the only channels involved in the generation of intrinsicrhythmic activity in the GL. Indeed, persistent sodium currentshave been implicated in the generation of oscillations (Hayaret al. 2004a, 2004b; Pignatelli et al. 2005).
Cell Tissue Res (2010) 339:463–479 477
Concluding remarks
Our results suggest that HCN channels play a key role inneuronal activity, e.g., in rhythmical bursts of action potentials.Moreover, the different expression patterns of HCN channelssuggest a strong functional diversity of cell populations. Achallenge for future work will be to define precisely, inquantitative terms, the diverse function of homomeric andheteromeric HCN channels in the nervous system, to identifythe properties and physiological functions of the diverse celltypes, and to establish a model of the sophisticated informationprocessing that occurs in the olfactory bulb by taking itscellular and functional diversity into account.
Acknowledgements The authors are grateful to Dr. A. Matarugaand Dr. E. Kremmer for the generation of antibodies, to Dr. R.Shigemoto, Dr. K.-H. Braunewell, Dr. W.A. Gorczya, and CURE(Digestive Diseases Research Center) for the generous gift ofantibodies, and to Dr. E. Kandel and Dr. M. Biel for the generousgift of HCN1 and HCN3 knockout animals. They also thank Dr. I.Gregor for his assistance with the statistical analysis. This work wassupported by the Helmholtz Society.
Open Access This article is distributed under the terms of theCreative Commons Attribution Noncommercial License which per-mits any noncommercial use, distribution, and reproduction in anymedium, provided the original author(s) and source are credited.
References
Adrian ED (1950) The electrical activity of the mammalian olfactorybulb. Electroencephalogr Clin Neurophysiol 2:377–388
Angelo K, London M, Christensen SR, Häusser M (2007) Local andglobal effects of I(h) distribution in dendrites of mammalianneurons. J Neurosci 27:8643–8653
Antal M, Eyre M, Finklea B, Nusser Z (2006) External tufted cells inthe main olfactory bulb form two distinct subpopulations. Eur JNeurosci 24:1124–1136
Aungst JL, Heyward PM, Puche AC, Karnup SV, Hayar A, Szabo G,Shipley MT (2003) Centre-surround inhibition among olfactorybulb glomeruli. Nature 426:623–629
Bailey MS, Shipley MT (1993) Astrocyte subtypes in the rat olfactorybulb: morphological heterogeneity and differential laminardistribution. J Comp Neurol 328:501–526
Baker H, Kawano T, Margolis FL, Joh TH (1983) Transneuronalregulation of tyrosine hydroxylase expression in olfactory bulb ofmouse and rat. J Neurosci 3:69–78
Bal T, McCormick DA (1997) Synchronized oscillations in theinferior olive are controlled by the hyperpolarization-activatedcation current I(h). J Neurophysiol 77:3145–3156
Bastianelli E, Pochet R (1995) Calmodulin, calbindin-D28k, calretininand neurocalcin in rat olfactory bulb during postnatal develop-ment. Brain Res Dev Brain Res 87:224–227
Bender RA, Galindo R, Mameli M, Gonzalez-Vega R, Valenzuela CF,Baram TZ (2005) Synchronized network activity in developingrat hippocampus involves regional hyperpolarization-activatedcyclic nucleotide-gated (HCN) channel function. Eur J Neurosci22:2669–2674
Berger T, Larkum ME, Luscher HR (2001) High I(h) channeldensity in the distal apical dendrite of layer V pyramidal cells
increases bidirectional attenuation of EPSPs. J Neurophysiol85:855–868
Bernstein HG, Becker A, Keilhoff G, Spilker C, Gorczyca WA,Braunewell KH, Grecksch G (2003) Brain region-specific changesin the expression of calcium sensor proteins after repeatedapplications of ketamine to rats. Neurosci Lett 339:95–98
Bouilleret V, Loup F, Kiener T, Marescaux C, Fritschy JM (2000)Early loss of interneurons and delayed subunit-specific changesin GABA(A)-receptor expression in a mouse model of mesialtemporal lobe epilepsy. Hippocampus 10:305–324
Brinon JG, Alonso JR, Arevalo R, Garcia-Ojeda E, Lara J, Aijon J(1992) Calbindin D-28k-positive neurons in the rat olfactory bulb.An immunohistochemical study. Cell Tissue Res 269:289–297
Brinon JG, Alonso JR, Garcia-Ojeda E, Crespo C, Arevalo R, Aijon J(1997) Calretinin- and parvalbumin-immunoreactive neurons inthe rat main olfactory bulb do not express NADPH-diaphoraseactivity. J Chem Neuroanat 13:253–264
Brinon JG, Arevalo R, Crespo C, Bravo IG, Okazaki K, Hidaka H,Aijon J, Alonso JR (1998) Neurocalcin immunoreactivity in therat main olfactory bulb. Brain Res 795:204–214
Brinon JG, Crespo C, Weruaga E, Martinez-Guijarro FJ, Aijon J,Alonso JR (2001) Bilateral olfactory deprivation reveals aselective noradrenergic regulatory input to the olfactory bulb.Neuroscience 102:1–10
Chen S, Wang J, Siegelbaum SA (2001) Properties of hyperpolarization-activated pacemaker current defined by coassembly of HCN1 andHCN2 subunits and basal modulation by cyclic nucleotide. J GenPhysiol 117:491–504
Crespo C, Alonso JR, Brinon JG, Weruaga E, Porteros A, Arevalo R,Aijon J (1997) Calcium-binding proteins in the periglomerularregion of typical and typical olfactory glomeruli. Brain Res745:293–302
Day M, Carr DB, Ulrich S, Ilijic E, Tkatch T, Surmeier DJ (2005)Dendritic excitability of mouse frontal cortex pyramidal neuronsis shaped by the interaction among HCN, Kir2, and Kleakchannels. J Neurosci 25:8776–8787
De Marchis S, Bovetti S, Carletti B, Hsieh YC, Garzotto D, Peretto P,Fasolo A, Puche AC, Rossi F (2007) Generation of distinct types ofperiglomerular olfactory bulb interneurons during development andin adult mice: implication for intrinsic properties of the subven-tricular zone progenitor population. J Neurosci 27:657–664
Feigenspan A, Teubner B, Willecke K, Weiler R (2001) Expression ofneuronal connexin36 in AII amacrine cells of the mammalianretina. J Neurosci 21:230–239
Fletcher ML, Smith AM, Best AR, Wilson DA (2005) High-frequencyoscillations are not necessary for simple olfactory discriminationsin young rats. J Neurosci 25:792–798
Gierke P, Zhao C, Brackmann M, Linke B, Heinemann U, BraunewellKH (2004) Expression analysis of members of the neuronalcalcium sensor protein family: combining bioinformatics andWestern blot analysis. Biochem Biophys Res Commun 323:38–43
Gutierrez-Mecinas M, Crespo C, Blasco-Ibanez JM, Gracia-Llanes FJ,Marques-Mari AI, Martinez-Guijarro FJ (2005) Characterization ofsomatostatin- and cholecystokinin-immunoreactive periglomerularcells in the rat olfactory bulb. J Comp Neurol 489:467–479
Hayar A, Karnup S, Ennis M, Shipley MT (2004a) External tuftedcells: a major excitatory element that coordinates glomerularactivity. J Neurosci 24:6676–6685
Hayar A, Karnup S, Shipley MT, Ennis M (2004b) Olfactory bulbglomeruli: external tufted cells intrinsically burst at thetafrequency and are entrained by patterned olfactory input. JNeurosci 24:1190–1199
Holderith NB, Shigemoto R, Nusser Z (2003) Cell type-dependentexpression of HCN1 in the main olfactory bulb. Eur J Neurosci18:344–354
478 Cell Tissue Res (2010) 339:463–479
Kaupp UB, Seifert R (2001) Molecular diversity of pacemaker ionchannels. Annu Rev Physiol 63:235–257
Kimelberg HK (2004) The problem of astrocyte identity. NeurochemInt 45:191–202
Kosaka K, Kosaka T (2007a) Chemical properties of type 1 andtype 2 periglomerular cells in the mouse olfactory bulb aredifferent from those in the rat olfactory bulb. Brain Res1167:42–55
Kosaka T, Kosaka K (2007b) Heterogeneity of nitric oxide synthase-containing neurons in the mouse main olfactory bulb. NeurosciRes 57:165–178
Kosaka K, Heizmann CW, Kosaka T (1994) Calcium-binding proteinparvalbumin-immunoreactive neurons in the rat olfactory bulb. 1.Distribution and structural features in adult rat. Exp Brain Res99:191–204
Kosaka K, Toida K, Aika Y, Kosaka T (1998) How simple is theorganization of the olfactory glomerulus? The heterogeneity ofso-called periglomerular cells. Neurosci Res 30:101–110
Kosaka K, Toida K, Aika Y, Kosaka T (2008) Tyrosine hydroxylase-positive GABAergic juxtaglomerular neurons are the main sourceof the interglomerular connections in the mouse main olfactorybulb. Neurosci Res 60:349–354
Liu S, Shipley MT (2008) Multiple conductances cooperativelyregulate spontaneous bursting in mouse olfactory bulb externaltufted cells. J Neurosci 28:1625–1639
Liu WL, Shipley MT (1994) Intrabulbar associational system in the ratolfactory bulb comprises cholecystokinin-containing tufted cellsthat synapse onto the dendrites of GABAergic granule cells.JComp Neurol 346:541–558
Ludwig A, Budde T, Stieber J, Moosmang S, Wahl C, Holthoff K,Langebartels A, Wotjak C, Munsch T, Zong X, Feil S, Feil R,Lancel M, Chien KR, Konnerth A, Pape HC, Biel M, Hofmann F(2003) Absence epilepsy and sinus dysrhythmia in mice lackingthe pacemaker channel HCN2. EMBO J 22:216–224
Lüthi A, McCormick DA (1998a) H-current: properties of a neuronaland network pacemaker. Neuron 21:9–12
Lüthi A, McCormick DA (1998b) Periodicity of thalamic synchro-nized oscillations: the role of Ca2+-mediated upregulation of Ih.Neuron 20:553–563
Macrides F, Chorover SL (1972) Olfactory bulb units: activitycorrelated with inhalation cycles and odor quality. Science175:84–87
Magee JC (1998) Dendritic hyperpolarization-activated currentsmodify the integrative properties of hippocampal CA1 pyramidalneurons. J Neurosci 18:7613–7624
Magee JC, Carruth M (1999) Dendritic voltage-gated ion channelsregulate the action potential firing mode of hippocampal CA1pyramidal neurons. J Neurophysiol 82:1895–1901
Margrie TW, Schaefer AT (2003) Theta oscillation coupled spikelatencies yield computational vigour in a mammalian sensorysystem. J Physiol (Lond) 546:363–374
Mataruga A, Kremmer E, Müller F (2007) Type 3a and type 3b OFFcone bipolar cells provide for the alternative rod pathway in themouse retina. J Comp Neurol 502:1123–1137
Much B, Wahl-Schott C, Zong X, Schneider A, Baumann L,Moosmang S, Ludwig A, Biel M (2003) Role of subunitheteromerization and N-linked glycosylation in the formation offunctional hyperpolarization-activated cyclic nucleotide-gatedchannels. J Biol Chem 278:43781–43786
Müller F, Scholten A, Ivanova E, Haverkamp S, Kremmer E, KauppUB (2003) HCN channels are expressed differentially in retinalbipolar cells and concentrated at synaptic terminals. Eur JNeurosci 17:2084–2096
Nolan MF, Malleret G, Lee KH, Gibbs E, Dudman JT, Santoro B, YinD, Thompson RF, Siegelbaum SA, Kandel ER, Morozov A(2003) The hyperpolarization-activated HCN1 channel is impor-
tant for motor learning and neuronal integration by cerebellarPurkinje cells. Cell 115:551–564
Notomi T, Shigemoto R (2004) Immunohistochemical localization ofIh channel subunits, HCN1-4, in the rat brain. J Comp Neurol471:241–276
Nusser Z, Kay LM, Laurent G, Homanics GE, Mody I (2001)Disruption of GABA(A) receptors on GABAergic interneuronsleads to increased oscillatory power in the olfactory bulbnetwork. J Neurophysiol 86:2823–2833
Panzanelli P, Fritschy JM, Yanagawa Y, Obata K, Sassoe-Pognetto M(2007) GABAergic phenotype of periglomerular cells in therodent olfactory bulb. J Comp Neurol 502:990–1002
Parrish-Aungst S, Shipley MT, Erdelyi F, Szabo G, Puche AC (2007)Quantitative analysis of neuronal diversity in the mouse olfactorybulb. J Comp Neurol 501:825–836
Pignatelli A, Kobayashi K, Okano H, Belluzzi O (2005) Functionalproperties of dopaminergic neurones in the mouse olfactory bulb.J Physiol (Lond) 564:501–514
Pinching AJ, Powell TP (1971) The neuron types of the glomerularlayer of the olfactory bulb. J Cell Sci 9:305–345
Pinching AJ, Powell TP (1972) Experimental studies on the axonsintrinsic to the glomerular layer of the olfactory bulb. J Cell Sci10:637–655
Qin ZP, Ye SM, Du JZ, Shen GY (2005) Postnatal developmentalexpression of calbindin, calretinin and parvalbumin in mouse mainolfactory bulb. Acta Biochim Biophys Sin (Shanghai) 37:276–282
Roy TS, Sharma V, Seidler FJ, Slotkin TA (2005) Quantitativemorphological assessment reveals neuronal and glial deficits inhippocampus after a brief subtoxic exposure to chlorpyrifos inneonatal rats. Brain Res Dev Brain Res 155:71–80
Royet JP, Souchier C, Jourdan F, Ploye H (1988) Morphometric studyof the glomerular population in the mouse olfactory bulb:numerical density and size distribution along the rostrocaudalaxis. J Comp Neurol 270:559–568
Santoro B, Chen S, Luthi A, Pavlidis P, Shumyatsky GP, Tibbs GR,Siegelbaum SA (2000) Molecular and functional heterogeneity ofhyperpolarization-activated pacemaker channels in the mouseCNS. J Neurosci 20:5264–5275
Stieber J, Herrmann S, Feil S, Loster J, Feil R, Biel M, Hofmann F,Ludwig A (2003) The hyperpolarization-activated channelHCN4 is required for the generation of pacemaker actionpotentials in the embryonic heart. Proc Natl Acad Sci USA100:15235–15240
Stieber J, Stockl G, Herrmann S, Hassfurth B, Hofmann F (2005)Functional expression of the human HCN3 channel. J Biol Chem280:34635–34643
Stopfer M, Laurent G (1999) Short-term memory in olfactory networkdynamics. Nature 402:664–668
Ulens C, Tytgat J (2001) Functional heteromerization of HCN1 andHCN2 pacemaker channels. J Biol Chem 276:6069–6072
Vardi N, Zhang LL, Payne JA, Sterling P (2000) Evidence thatdifferent cation chloride cotransporters in retinal neurons allowopposite responses to GABA. J Neurosci 20:7657–7663
Wachowiak M, Shipley MT (2006) Coding and synaptic processing ofsensory information in the glomerular layer of the olfactory bulb.Semin Cell Dev Biol 17:411–423
Walsh RR (1956) Single cell spike activity in the olfactory bulb. Am JPhysiol 186:255–257
Weruaga E, Brinon JG, Porteros A, Arevalo R, Aijon J, Alonso JR(2000) Expression of neuronal nitric oxide synthase/NADPH-diaphorase during olfactory deafferentation and regeneration. EurJ Neurosci 12:1177–1193
Whitaker GM, Angoli D, Nazzari H, Shigemoto R, Accili EA (2007)HCN2 and HCN4 isoforms self-assemble and co-assemble withequal preference to form functional pacemaker channels. J BiolChem 282:22900–22909
Cell Tissue Res (2010) 339:463–479 479


![Rhodium-Catalyzed [3 + 2] Annulation of Cyclic N Acyl ...orgmedichem.skku.edu/erp/erpmenus/professor_thesis/upLoadFiles/... · with Activated Olefins: Anticancer Activity of Spiroisoindolinones](https://static.fdocuments.us/doc/165x107/5aaba9927f8b9a2b4c8c55ba/rhodium-catalyzed-3-2-annulation-of-cyclic-n-acyl-activated-olens-anticancer.jpg)


![Dopamine-induced oscillations of the pyloric pacemaker ...pages.nbb.cornell.edu/neurobio/harris-warrick... · Ca(V)] (Johnson et al. 2003). Additionally, DA enhances the hyperpolarization-activated](https://static.fdocuments.us/doc/165x107/5f534dac52e2797fcb72d141/dopamine-induced-oscillations-of-the-pyloric-pacemaker-pagesnbb-cav-johnson.jpg)