Hyper-Dense Small Cell Deployment in NASCAR Environment
25
Qualcomm Technologies, Inc. Not to be used, copied, reproduced, or modified in whole or in part, nor its contents revealed in any manner to others without the express written permission of Qualcomm Technologies, Inc. Qualcomm and UltraSON are trademarks of QUALCOMM Incorporated, registered in the United States and other countries. All QUALCOMM Incorporated trademarks are used with permission. Other product and brand names may be trademarks or registered trademarks of their respective owners. Qualcomm Technologies, Inc. 5775 Morehouse Drive San Diego, CA 92121 U.S.A. © 2014 Qualcomm Technologies, Inc. All rights reserved. Hyper-Dense Small Cell Deployment Trial in NASCAR Environment April 7, 2014
Transcript of Hyper-Dense Small Cell Deployment in NASCAR Environment

Qualcomm Technologies, Inc.
Not to be used, copied, reproduced, or modified in whole or in part, nor its contents revealed in any manner to others
without the express written permission of Qualcomm Technologies, Inc.
Qualcomm and UltraSON are trademarks of QUALCOMM Incorporated, registered in the United States and other
countries. All QUALCOMM Incorporated trademarks are used with permission. Other product and brand names
may be trademarks or registered trademarks of their respective owners.
Qualcomm Technologies, Inc.
5775 Morehouse Drive
San Diego, CA 92121
U.S.A.
© 2014 Qualcomm Technologies, Inc.
All rights reserved.
Hyper-Dense Small Cell Deployment Trial in NASCAR Environment
April 7, 2014

© 2014 Qualcomm Technologies, Inc 2
Enabling Hyper-Dense Small Cell Deployments with UltraSON Contents
© 2014 Qualcomm Technologies, Inc 3
Contents
1 Introduction ................................................................................................................ 8
2 Network Layout and Capacity improvements .......................................................... 9
2.1 Challenges associated with the venue ........................................................................................ 9 2.2 Small Cell Network Architecture ............................................................................................. 11
2.2.1 Small cell Network ....................................................................................................... 12 2.2.2 Traditional Deployment ................................................................................................ 12
2.3 Capacity Comparison ............................................................................................................... 14 2.4 User experience on Small Cell Network .................................................................................. 16
3 UltraSON feature ...................................................................................................... 18
3.1 Mobility Management .............................................................................................................. 18 3.1.1 Frequent Handover Mitigation (FHM) ......................................................................... 18 3.1.2 Forward Handover ........................................................................................................ 19 3.1.3 Signaling load reduction with mobility management features ...................................... 19
3.2 Dynamic Resource and Tx Power Management ...................................................................... 20 3.2.1 Transmit Power Management ....................................................................................... 20 3.2.2 Resource Management .................................................................................................. 22
4 Conclusions .............................................................................................................. 24
5 References ................................................................................................................ 25

Enabling Hyper-Dense Small Cell Deployments with UltraSON Contents
© 2014 Qualcomm Technologies, Inc 4
Figures
Figure 1: Overview of the garage area, A) before the race and B) during the race weekend ....................... 9
Figure 2: Example of clutter in the garage area where the trial took place . Error! Bookmark not defined.
Figure 4: Due to the lack of infrastructure and high data demand, teams build their own ad-hoc network
for the duration of the race .......................................................................................................................... 10
Figure 3: Changing RF conditions in the NASCAR environment sometime mean truck parking in front of
the installed small cells. .............................................................................................................................. 10
Figure 5: Trial network layout where 31 cells were deployed at site-to-site distance of 22m to reach a
density of over 1000 cells/km2 .................................................................................................................... 11
Figure 6: Airspan Airsynergy 2000 with the front mounted 11 dBi, 65 degrees horizontal beamwidth,
antenna. ....................................................................................................................................................... 12
Figure 7: Due to the small form factor, Small Cells were installed on existing infrastructures; existing
fence in this example .................................................................................................................................. 12
Figure 8: In NASCAR venues, coverage and capacity is typically provided by rolling in Cell-on-Wheel.13
Figure 9: Coverage area of the sector of the COW used for capacity comparison. Single User throughput
measurements were performed in the highlighted area, where the majority of the traffic demand is
expected during the event. .......................................................................................................................... 13
Figure 10: Measured and normalized single user throughput for the COW. It should be noted that the
measurements were done with adjacent sector loaded. Based on the measurements, the capacity of the
COW was estimated at 8.8 Mbps, median normalized value. .................................................................... 14
Figure 11: Network configuration and UE placement, as used during the capacity testing ....................... 15
Figure 12: Measured network throughput over the small cell network, based on full buffer traffic pushed
to 50 users distributed over the coverage area. Median throughput over a 30 minutes period was in excess
of 220 Mbps ................................................................................................................................................ 15
Figure 13: Over the small network high user throughput was observed over multiple location at all times
.................................................................................................................................................................... 16
Figure 14: Comparison of user experience, mapping application, over the small cell network and
traditional deployment ................................................................................................................................ 17
Figure 15: HO rate for all users (stationary and mobility) with UltraSON feature disabled and enabled.
Reduction of HO rate can be estimated to be 60%. .................................................................................... 19
Figure 16: HO rate for mobility user with UltraSON feature disabled and enabled. Reduction of HO rate
can be estimated to be 55%. ........................................................................................................................ 20
Figure 17: Power and Resource Management values used during the trial. Power Management values, are
represented by the cell size and were defined to balance the cell splitting gain and the reduction in
interference (SINR). The coloring scheme was defined to minimize the interference between cells, once
power management settings were accounted for. ....................................................................................... 21
Figure 18: Measured SINR improvement for mobility users. Improvement was observed over the entire
distribution with median improvement of 4 dB. ......................................................................................... 21
Figure 19: Test setup used to measure the impact of Resource Management on a cell edge user. ............. 22
Figure 20: Impact of Resource Management on cell edge user. When RM is activated, CEU experience a
reduction of interference on the PDSCH, as observed by the improvement in MCS. ................................ 23

Enabling Hyper-Dense Small Cell Deployments with UltraSON Contents
© 2014 Qualcomm Technologies, Inc 5
Tables
Table 1: Deployment and spectral efficiency comparison between traditional deployment and Small Cell
network. With small cell deployment a gain of over 40x is estimated (666/15.9). ..................................... 16
Table 2: Overview of UltraSON features ................................................................................................... 18

© 2014 Qualcomm Technologies, Inc 6
Enabling Hyper-Dense Small Cell Deployments with UltraSON Introduction
© 2014 Qualcomm Technologies, Inc 7
ABSTRACT
As mobile data demand continues to increase exponentially due to existing and emerging devices and applications, mobile networks need to prepare for 1000X traffic growth over the next decade. In addition to utilizing more spectrum, the most powerful technique to address this data demand is through network densification, i.e., deploying more small cells to serve a geographical area and thereby achieving cell splitting gains.
In this paper, we present how densification of LTE small cells (about 1000 small cells/km2) in an unplanned manner can effectively increase the network capacity by a factor of over 40 times compared to traditional deployment (normalized with respect to spectrum and service area). This network was deployed in 2013, where initial testing was conducted during one of the NASCAR Sprint Cup race in November 2013. The present document summarized results from the March 2014 race where testing performed in partnership with Sprint, NASCAR, and Airspan, at the Phoenix International Raceway (PIR) to demonstrate the future of wireless networks.
NASCAR PIR garage area was chosen for this trial since it created the most challenging test environment imaginable due to: 1) RF challenges (large trucks and dense user environment with mobility), 2) High data capacity demand, 3) Dynamic environment which makes network planning impossible ahead of the race. Basically if hyper-dense small cell network could work in such a challenging place like NASCAR venue, then such network should be able to work almost any environment.
To achieve such high density deployments in a cost effective manner, small cells need to be deployed in an unplanned manner. Furthermore such deployments cannot compromise from the carrier grade quality of service that cellular users enjoy today. The small cell network at PIR was deployed in an unplanned way (no detailed RF planning etc.) and relied on UltraSON™. UltraSON is a suite of Self Organizing Network (SON) techniques developed by Qualcomm Technologies, Inc. to enable widespread deployment of unplanned small cells, while providing carrier grade performance and operator control. In the context of the trial, a reduced set of features was used, focusing on Mobility Management as well as eNB Transmit Power and Resource Management. Ultimately, for commercial deployment, self-configuration features will be added to the product to ensure that hyper-dense small cell networks are deployed in a cost efficient way.
These trials show that network densification using small cells (together with some increase in available spectrum, e.g., 10x) can lead to 1000x capacity increase compared to traditional deployments with high Quality of Service and user experience.
More information about Qualcomm Technologies, Inc.’s work on small cells can be found at
http://www.qualcomm.com/research/projects/smallcells and
http://www.qualcomm.com/solutions/wireless-networks/technologies/smallcells
© 2014 Qualcomm Technologies, Inc 8
1 Introduction
The advent of smartphones and tablets has served as catalyst for significant increase in mobile broadband data traffic on cellular networks. The mobile data demand continues to grow exponentially, thus that in the not so distant future, there will be a need to support 1000x more mobile data traffic compared to traffic carried by today’s cellular networks due to more smartphone and tablet like devices as well as an increase in data consumed per user. This data demand needs to be met at a low cost to the operator as well as the end user to sustain and further fuel wireless data growth. Addressing this 1000x data demand in a cost-effective manner presents formidable technical challenges and requires innovative solutions. A multi-pronged approach is needed incorporating: 1) Network densification, i.e., deploying more base stations, each with a small coverage footprint, in geographical areas with high data demand, 2) additional spectrum, and 3) significant improvement in system efficiency (e.g., efficient use of existing spectrum, optimal use of multiple technologies concurrently) [1].
As a follow up to [4], in this paper, we focus on a recent network hyper-densification trial. The trial was conducted in collaboration with Sprint, NASCAR, and Airspan at the Phoenix International Raceway which hosted one of the NASCAR Sprint Cup race in March 2014. The trial was aimed at deploying an equivalent density of over 1000 cells/km2 to test and demonstrate benefits of network densification using small cells.
Network densification is expected to boost capacity by providing cell-splitting gains due to increased spectrum re-use. At the same time, network densification leads to increase in interference and increase in handover rate as more and more cell boundaries are present in the network. Effectively, in hyper-dense networks, 3 aspects need to be balanced:
- Increasing the cell-splitting gain, which is inherently achieved when more and more cells are deployed;
- Mitigating the interference, in particular at the many boundaries in the network; - Managing the signaling load indirectly caused by the multiplication of cells boundaries.
In the NASCAR trial, selected UltraSON features were put to the test, to verify how these 3 competing forces interact in a realistic field deployment.

© 2014 Qualcomm Technologies, Inc 9
2 Network Layout and Capacity improvements
2.1 Challenges associated with the venue
The motivations of testing hyper-dense small cell network in a NASCAR Sprint Cup garage area mainly came from the challenges associated with such venues. Effectively, the postulate was that if hyper-dense small cell network could work in such a challenging place, then such network should be able to work anywhere.
The challenges associated with this type of venue can be grouped in 3 main categories, namely:
- RF challenges, due to the nature of the area where the venues are located as well as the activity at the venue. The location itself present challenges due to its isolation, and thus without existing microcell in the immediate vicinity. The activity at the venue present challenges, from an RF perspective as the garage is full of large trucks, cars, tool boxes… causing RF reflection and scattering. In addition to the teams and their movement within the garage, challenges are also coming from the large number of nomadic spectators. Lastly is this environment, and considering the number of cell deployed, in most area a user would have direct view to several cells, leading to high interference.
- Capacity requirements, coming not only from the spectator as in other sports venues, but also from the teams themselves;
- The highly dynamic environment, with RF conditions changing overnight as illustrated in Figure 1, thus limiting the possibility of manual optimization ahead of time, contrary to what is typically done in other venues. A)
B)
Figure 1: Overview of the garage area, A) before the race and B) during the race weekend
A)

Enabling Hyper-Dense Small Cell Deployments with UltraSON Network Layout and Capacity improvements
© 2014 Qualcomm Technologies, Inc 10
On top of these, Qualcomm aimed at deploying the world’s densest outdoor small cells network to establish a baseline for network densification.
As mentioned earlier, one of the challenges at a race track is the fact that the venue hosts large metallic objects such as cars, trucks, tool boxes as illustrated in Error! Reference source not found.. Such objects are the main attraction for the fans, but from an RF point of view, they act as reflectors, bouncing the signal in different
directions. As an extreme example, as shown in Figure 4, a truck parked in front of the antenna causing signal from that
Figure 4: Due to the lack of infrastructure and high data demand, teams build their own ad-hoc network for the duration of the race
Figure 3: Changing RF conditions in the NASCAR environment sometime mean truck parking in front of the installed small cells.
Figure 2: Example of clutter in the garage area where the trial took place

Enabling Hyper-Dense Small Cell Deployments with UltraSON Network Layout and Capacity improvements
© 2014 Qualcomm Technologies, Inc 11
antenna to be detected at the other side of the garage when the Power Management, one of the UltraSON features, was not activated. To add to the challenges, the RF environment changes literally overnight, as the garage is populated on Thursday night while the racing activities start on Friday morning. With such sudden change in RF environment, manual optimization as typically done is not possible, thus the need to rely on automatic, self-organizing methods, as offered by UltraSON.
As for the capacity requirement, the considered venue caters to up to 90 thousand fans distributed over the entire venue: garage, grand stand, concession area. The garage, where the trial was conducted caters to only a subset of the general public, typically a 1500 to 3000, but also hosts over 40 NASCAR race teams, each one with its own telecommunication infrastructure. The individual team telecommunication infrastructure, as illustrated in Figure 3, coupled with their random location in the garage further contributes to the RF challenges: with little coordination between the teams even using WiFi becomes a next to impossible mission. With that in mind, offering a network with almost unlimited capacity would provide a much needed alternative.
2.2 Small Cell Network Architecture
Figure 5: Trial network layout where 31 cells were deployed at site-to-site distance of 22m to reach a density of over 1000 cells/km2

Enabling Hyper-Dense Small Cell Deployments with UltraSON Network Layout and Capacity improvements
© 2014 Qualcomm Technologies, Inc 12
2.2.1 Small cell Network
With the goal of deploying 1000 cells per square kilometers, Qualcomm deployed 31 small cells over the garage area. Considering the actual dimension of the garage, an equivalent density of over 1100 cells/km2 was achieved. The placement of the cells around the garage area is illustrated in Figure 5 for clarity. It should be noted that to achieve such density, the site-to-site distance was ranging from 6m to
75m with an average value of 22m. For reference and comparison, in traditional macro deployment the site to site distance varies from 200m to 1000m in dense urban environment, and 500m to a few kilometers in the suburban environment.
The deployment model used for this trial was akin to a metro/picocell as defined in [4Error! Reference source not found.] using Band 41 (2.6 GHz) spectrum. This band is approved for Time Division Duplex (TDD) and frame configuration 1 was used. As a reminder, in configuration 1, about 60% of the resources (in time) are used for downlink (DL), and about 40% are used for Uplink (UL). For this trial, Airspan Airsynergy 2000 [5] small cells were used
together with an integrated 65 degrees, 11 dBi antenna, as illustrated in Figure 7. It should be noted that even if the product is capable of up to 30 dBm in 20 MHz bandwidth, the power was limited to a maximum of 20 dBm in this trial. The actual transmit power was automatically determined by UltraSON Power Management (PM) feature to values ranging from -10 to + 20 dBm. Such PM feature will be further described in Section 3.2.1 .
To minimize the deployment cost, and prove that unplanned deployment are a viable option, Qualcomm made use of existing infrastructure either existing building, as shown in Figure 7 or existing poles and fence posts, the later illustrated in Figure 6.
2.2.2 Traditional Deployment
Before attempting to compare the performance achieved on the small cell network with traditional deployment, it is
Figure 6: Airspan Airsynergy 2000 with the front mounted 11 dBi, 65 degrees horizontal beamwidth, antenna.
Figure 7: Due to the small form factor, Small Cells were installed on existing infrastructures; existing fence in this example

Enabling Hyper-Dense Small Cell Deployments with UltraSON Network Layout and Capacity improvements
© 2014 Qualcomm Technologies, Inc 13
worth mentioning how the venue is typically covered. For this track, coverage is brought to the venue a few weeks before the event, when cell-on-wheels (COW) are rolled in. The COWs by their dimensions fit in the NASCAR environment as they are based on 18 wheelers trailer trucks each supporting a 6-sectors base station, as illustrated in Figure 8. For this particular venue, due to multiple technologies to cater for, CDMA2000 1x, 1xEv-DO, LTE, and the capacity needs, 2 trucks were rolled in back to back.
One sector of the COW was selected for capacity comparison as it overlaps with the targeted coverage area where the small cell network was deployed, but it should be noted that this this sector was also covering a section of the grand stand, a parking area... as illustrated in Figure 9.
Through measurements over the entire coverage area, the capacity of the COW, or at least a representative sector, was determined through single user measurement, while adjacent sectors were loaded with DL traffic. To ensure that the final number was representative of the entire sector capacity, the measurement was performed over the area where the majority of the users would gather: the grand stand and the garage for this sector, area highlighted in Figure 9.
This process yields a measured median single user data rate of 7.1 Mbps, as shown in Figure 10. During log analysis it was observed that all resources blocks (RB) and frames were not utilized all the time. With that observation, and to ensure a fair comparison with the Small Cell Network, the measured median throughput
was normalized for 100% scheduling rate and 25 RB assignments, leading to a median normalized throughput of 8.8 Mbps, value that will be used for area spectral efficiency comparison.
Figure 8: In NASCAR venues, coverage and capacity is typically provided by rolling in Cell-on-Wheel.
Figure 9: Coverage area of the sector of the COW used for capacity comparison. Single User throughput measurements were performed in the highlighted area, where the majority of the traffic demand is expected during the event.

Enabling Hyper-Dense Small Cell Deployments with UltraSON Network Layout and Capacity improvements
© 2014 Qualcomm Technologies, Inc 14
Figure 10: Measured and normalized single user throughput for the COW. It should be noted that the measurements were done with adjacent sector loaded. Based on the measurements, the capacity of the COW was estimated at 8.8 Mbps, median normalized value.
2.3 Capacity Comparison
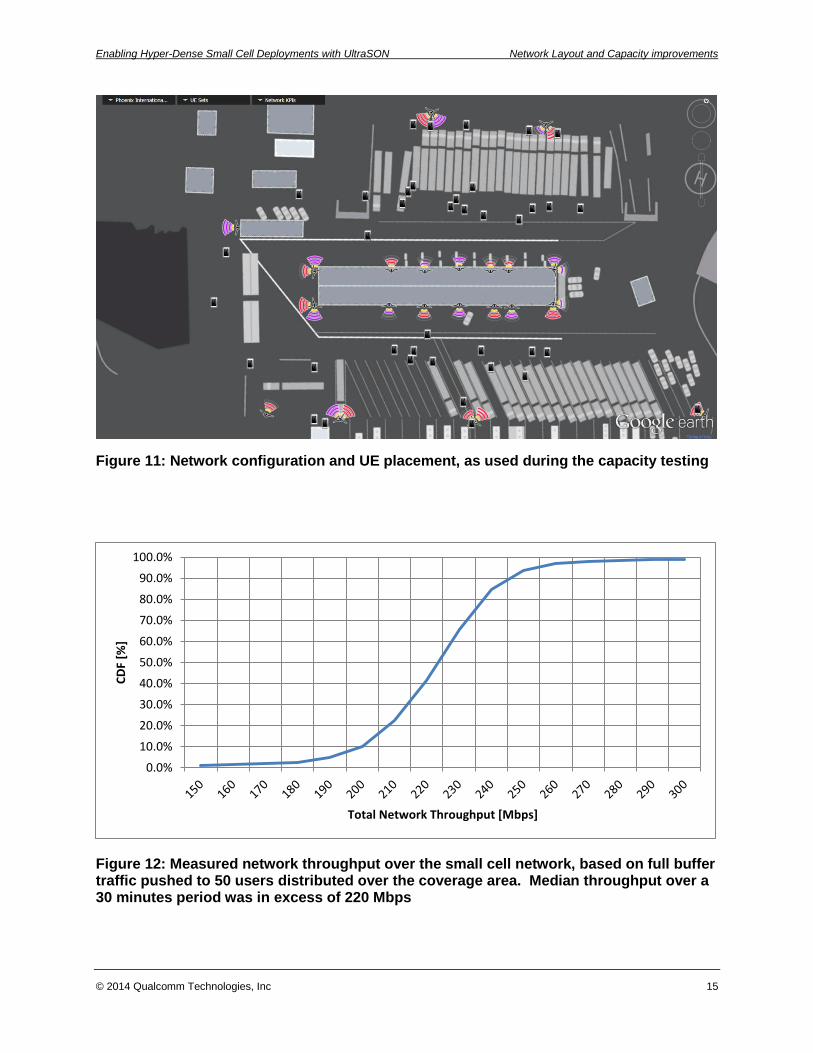
The capacity of the small cell network was estimated empirically by distributing ~ 50 test UEs over the entire garage area as illustrated in Figure 11. It should be noted that the UE distribution was not even, largely impacted by the way the different teams of the NASCAR Sprint Cup park in the garage and to ensure that the UEs were placed in a way that it would not interfere with the racing activities while being accessible to the testers.
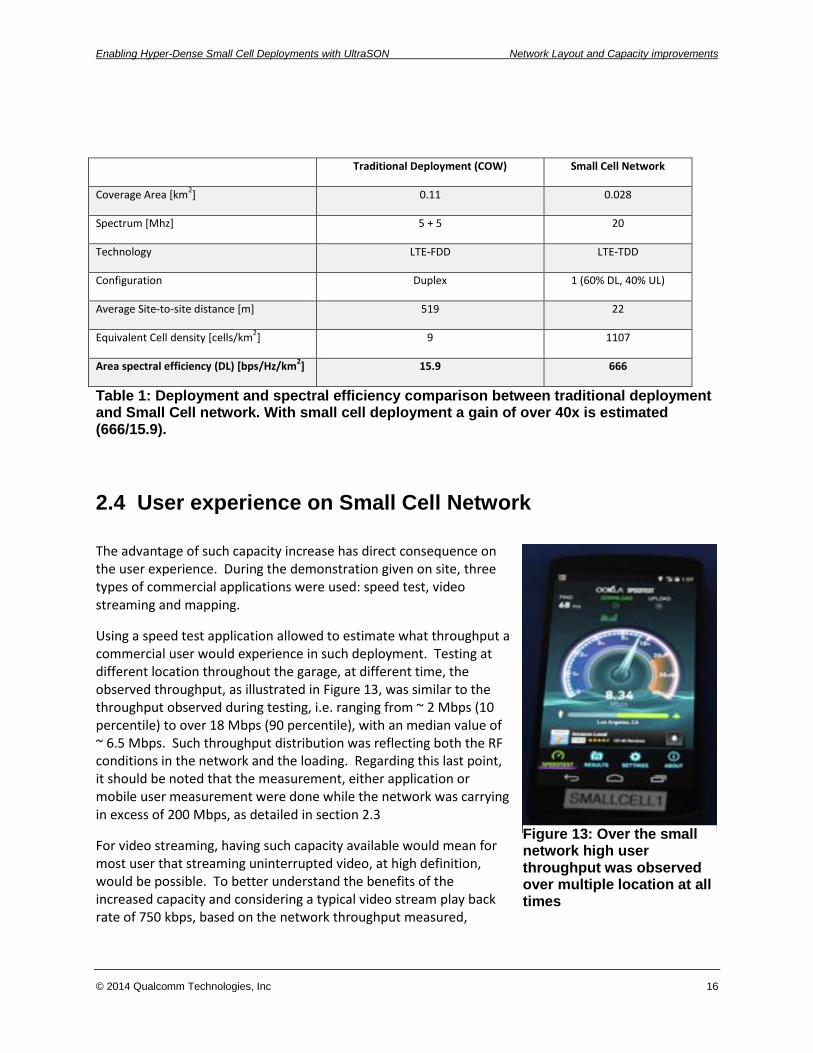
Full buffer data was pushed to each of the test UE and the overall network traffic was recorded over a 30 minutes time window. The resulting network throughput is illustrated in Figure 12 and shows a median throughput of over 220 Mbps.
This served capacity should not be directly compared with the traditional deployment capacity as the technology was different (LTE-FDD for COW vs. LTE-TDD for small cells), the bandwidth was different (5 + 5 MHz for COW vs 20 MHz for small cells), and the coverage area was different. Because of these differences, normalization for bandwidth and area is required. This normalization is done on Table 1 and demonstrates that the network area spectral efficiency increased by a factor of over 40 when using small cells compared to traditional deployment.
0.0%
10.0%
20.0%
30.0%
40.0%
50.0%
60.0%
70.0%
80.0%
90.0%
100.0%
CD
F [%
]
Layer 1 Throughput [kbps]
Normalized Throughput Measured throughput
Enabling Hyper-Dense Small Cell Deployments with UltraSON Network Layout and Capacity improvements
© 2014 Qualcomm Technologies, Inc 15
Figure 11: Network configuration and UE placement, as used during the capacity testing
Figure 12: Measured network throughput over the small cell network, based on full buffer traffic pushed to 50 users distributed over the coverage area. Median throughput over a 30 minutes period was in excess of 220 Mbps
0.0%
10.0%
20.0%
30.0%
40.0%
50.0%
60.0%
70.0%
80.0%
90.0%
100.0%
CD
F [%
]
Total Network Throughput [Mbps]
Enabling Hyper-Dense Small Cell Deployments with UltraSON Network Layout and Capacity improvements
© 2014 Qualcomm Technologies, Inc 16
Traditional Deployment (COW) Small Cell Network
Coverage Area [km2] 0.11 0.028
Spectrum [Mhz] 5 + 5 20
Technology LTE-FDD LTE-TDD
Configuration Duplex 1 (60% DL, 40% UL)
Average Site-to-site distance [m] 519 22
Equivalent Cell density [cells/km2] 9 1107
Area spectral efficiency (DL) [bps/Hz/km2] 15.9 666
Table 1: Deployment and spectral efficiency comparison between traditional deployment and Small Cell network. With small cell deployment a gain of over 40x is estimated (666/15.9).
2.4 User experience on Small Cell Network
The advantage of such capacity increase has direct consequence on the user experience. During the demonstration given on site, three types of commercial applications were used: speed test, video streaming and mapping.
Using a speed test application allowed to estimate what throughput a commercial user would experience in such deployment. Testing at different location throughout the garage, at different time, the observed throughput, as illustrated in Figure 13, was similar to the throughput observed during testing, i.e. ranging from ~ 2 Mbps (10 percentile) to over 18 Mbps (90 percentile), with an median value of ~ 6.5 Mbps. Such throughput distribution was reflecting both the RF conditions in the network and the loading. Regarding this last point, it should be noted that the measurement, either application or mobile user measurement were done while the network was carrying in excess of 200 Mbps, as detailed in section 2.3
For video streaming, having such capacity available would mean for most user that streaming uninterrupted video, at high definition, would be possible. To better understand the benefits of the increased capacity and considering a typical video stream play back rate of 750 kbps, based on the network throughput measured,
Figure 13: Over the small network high user throughput was observed over multiple location at all times

Enabling Hyper-Dense Small Cell Deployments with UltraSON Network Layout and Capacity improvements
© 2014 Qualcomm Technologies, Inc 17
almost 12 users could concurrently watch a video clip over the traditional deployment, while almost 300 users could watch concurrently over the small cell network.
The last of the commercial application used, mapping application, show similar improvements when comparing the user experience over the traditional deployment and over the small cell network. As illustrated in Figure 14, while the map rendering was completed for a user connected to the small cell network, the download was still ongoing over the traditional deployment. Practically, a user served by a small cell network would be on his way to his destination while the user on the traditional deployment, would still be lost.
Traditional Deployment
Small Cell
Figure 14: Comparison of user experience, mapping application, over the small cell network and traditional deployment. While map rendering is completed on the UE connected to the small cell network, image are still being downloaded for the UE connected to the traditional deployment

Enabling Hyper-Dense Small Cell Deployments with UltraSON UltraSON feature
© 2014 Qualcomm Technologies, Inc 18
3 UltraSON feature
UltraSON is a suite of techniques developed by Qualcomm to enable widespread deployment of unplanned small cells while still providing carrier grade performance and operator control. It enables auto-configuration of small cells to reduce the needs of planning and to automate optimization of small cells through mobility management and power and resource management algorithm. UltraSON features can be categorized in 4 main categories, as described in Table 2.
Category UltraSON Feature
Self-Configuration: Automatic cell parameter configuration
• Automatic PCI selection
• Automatic neighbor discovery (ANR)
• Channel Selection
Mobility Management: Optimizes HO performance and reduces signaling load
• Frequent Handover Mitigation
• Forward handover
• Robust mobility (including MRO)
Resource and Tx Power Management: Optimizes capacity and minimizes pilot pollution
• Tx power management
• Resource partitioning and coordination
• Load balancing (including MLB)
Backhaul Aware Operation: Handles backhaul constraints
• Backhaul quality aware load balancing
Table 2: Overview of UltraSON features
In this trial, a limited set of features were demonstrated, mainly in the area of mobility management and resource and transmit power management as these features were considered the most appropriate to respond to the challenges posed by the RF conditions at the venue.
3.1 Mobility Management
Effective mobility management is essential for the viability of a network with hyper-dense small cells solution. Such dense small cell deployment creates more cell boundaries and potentially more handover events. The mobility management problem basically boils down to avoiding excessive handovers while ensuring robustness of necessary handovers for all mobiles, including legacy ones.
3.1.1 Frequent Handover Mitigation (FHM)
With a dense small cell deployment such as the NASCAR environment, an active (connected) UE, even stationary would experience frequent handovers (HO) between small cells. In this environment, such frequent HO is mainly due to the RF conditions constantly changing due to people, cars and other objects constantly moving between the UE and the eNB.

Enabling Hyper-Dense Small Cell Deployments with UltraSON UltraSON feature
© 2014 Qualcomm Technologies, Inc 19
Frequent handovers between small cells are undesirable as they can cause packet losses and/or packet delays leading to poor user experience. They also can lead to large signaling load at the core network. Thus, it is desirable to take appropriate action to avoid such frequent UE handovers in small cell deployment. A three step approach is proposed:
1 Determine if a UE is experiencing frequent handovers.
2 Classify frequent handovers based on cause (high speed UE or ping-ponging UE).
3 Determine actions based on the number of frequent handovers and their classification.
If handovers are ‘frequent handovers’ and are classified as ‘ping-pong handovers’, then the small cell can make it more difficult for this UE to handover to the ping-ponging (or neighboring) cells through the adjustment of UE specific handover parameters. If delaying handovers to the ping-ponging cells does not work (i.e., frequent handovers continue), inter-frequency handover to the macrocell could be initiated by the small cell, as a fallback option.
3.1.2 Forward Handover
Forward handover can be effective in improving the handover performance. Forward handover is applicable to handover scenarios where the target cell is not prepared by the source cell. In such cases, the target cell can fetch the UE context from the source cell to reduce handover interruption and the signaling toward the Core Network (CN). This is particularly relevant in scenarios where the signal of the UE’s serving cell degrades rapidly, for example, when the user moves around a building and suddenly loses line-of-sight path to the cell.
3.1.3 Signaling load reduction with mobility management features
With the FHM and power management features activated in the small cell network, the reduction in signaling load across the network was over 60% for both mobility and stationary UE. The per-UE HO rate is illustrated in Figure 15 for all users and in Figure
16 for the mobility users only. When considering all users (Figure
15), it should be noted that 40% of the users were experiencing HO even if only 15% of them were actually moving within the network. The difference can be attributed to HO caused by variation of the RF conditions. Such HO would be the primary target for the FHM feature. When considering only the mobility users (Figure 16), the reduction of HO can be attributed mainly to the reduction of the number of cells
0 1 2 3 4 5 6 7 8 9 100
0.1
0.2
0.3
0.4
0.5
0.6
0.7
0.8
0.9
1
Per UE Avg. HO/min
CD
F
HO Rate CDF
USON OFF
USON ON
Figure 15: HO rate for all users (stationary and mobility) with UltraSON feature disabled and enabled. Reduction of HO rate can be estimated to be 60%.

Enabling Hyper-Dense Small Cell Deployments with UltraSON UltraSON feature
© 2014 Qualcomm Technologies, Inc 20
boundaries, reduction inherent to the Power Management.
3.2 Dynamic Resource and Tx Power Management
3.2.1 Transmit Power Management
The mobility related challenges inherent to dense deployment can be mitigated, in addition to the schemes in Section 3.1.1 , by correctly calibrating the small cell downlink transmit power level. However detailed RF planning or drive tests are usually not practical or cost effective for dense small cell deployments. UltraSON Transmit Power Management (PM) feature automatically adjusts the transmit power with a goal to optimize the capacity and Signal plus Interference to Noise Ratio (SINR) experienced by users.
As a result of the PM algorithm, as illustrated in Figure 17, the different cells were assigned power ranging from 20 dBm to -10 dBm in a way that was balancing the improvements in SINR and cell splitting gain. With that trade-off, the SINR improvement for mobility UEs was approximately 4 dB, while the number of cell at high power was reduced from 29 to 23. It should be noted that the SINR improvement is observed across the entire distribution, as illustrated in Figure 18:
- For the worst performing users (10 percentile), the SINR improvement is in the region where call reliability is starting to be affected (i.e. - 6 dB and below). With this mind, the improvement in SINR could make the difference between a radio link failure and a successful handover, thus would directly affect the user experience.
- For the best performing users (90 percentile), the SINR improvement would lead to better efficiency, with possible impact on overall network capacity.
1 2 3 4 5 6 7 8 9 100
0.1
0.2
0.3
0.4
0.5
0.6
0.7
0.8
0.9
1
Per UE Avg. HO/min
CD
F
HO Rate CDF
USON OFF
USON ON
Figure 16: HO rate for mobility user with UltraSON feature disabled and enabled. Reduction of HO rate can be estimated to be 55%.

Enabling Hyper-Dense Small Cell Deployments with UltraSON UltraSON feature
© 2014 Qualcomm Technologies, Inc 21
-20 -15 -10 -5 0 5 10 15 20 25 300
0.1
0.2
0.3
0.4
0.5
0.6
0.7
0.8
0.9
1
SINR (dB)
Pr(
SIN
R<
=A
bsic
ssa
)
USON OFF/USON ON SINR Comparison - Mobile UE
USON OFF
USON ON
Figure 18: Power and Resource Management values used during the trial. Power Management values, are represented by the cell size and were defined to balance the cell splitting gain and the reduction in interference (SINR). The coloring scheme was defined to minimize the interference between cells, once power management settings were accounted for.
Figure 17: Measured SINR improvement for mobility users. Improvement was observed over the entire distribution with median improvement of 4 dB.
Enabling Hyper-Dense Small Cell Deployments with UltraSON UltraSON feature
© 2014 Qualcomm Technologies, Inc 22
The performance of the PM feature was further tested to verify how it adapts to the changes in RF conditions. To that purpose, the same type of input was fed to the algorithm based on measurement performed while the garage was empty, then while the garage was populated with trucks. As expected, the changes in RF conditions led to different power settings, but the SINR improvement was comparable in both cases.
3.2.2 Resource Management
In conjunction with power management, radio resource management across small cells is needed to further optimize system capacity and user experience. In particular, users near cell edges are subject to interference by neighboring cell’s transmission. Resource partitioning and coordination, Resource Management (RM) in short, can be used to mitigate the co-channel and adjacent-channel interference between neighboring cells by orthogonalizing their airlink resource usage for their respective cell-edge users. This can leverage the Inter-Cell Interference Coordination (ICIC) framework in 3GPP.
Resource management feature coordinates resources in frequency domain amongst neighboring cells. Specifically, resource blocks (RB) are classified into cell edge and cell center RBs, higher power is transmitted on cell edge RBs relative to cell center RBs. RBs assigned to cell edge users are orthogonalized across neighbor cells to avoid inter-small cell interference to the edge users. This orthogonalization is done automatically by UltraSON, taking UE feedback to determine how the coloring, i.e. the orthogonalization, should be done to minimize the interference. Classification of a user as cell edge or cell center is done dynamically based on RF conditions reported by the UE.
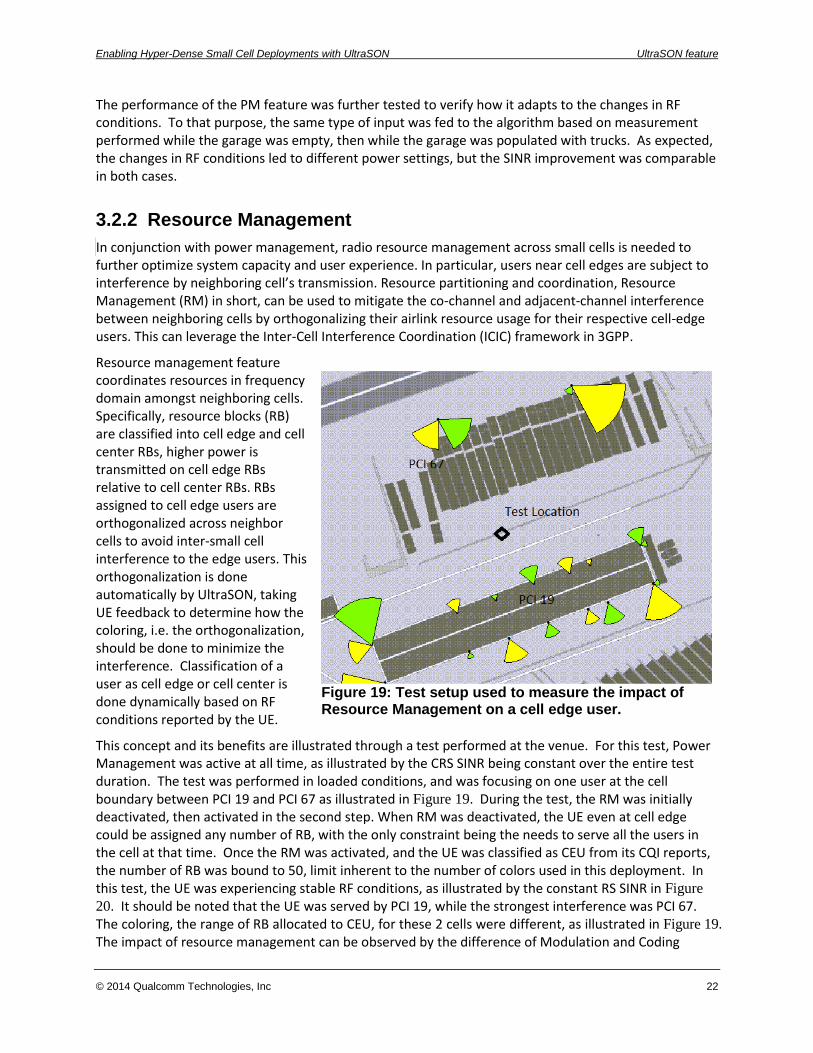
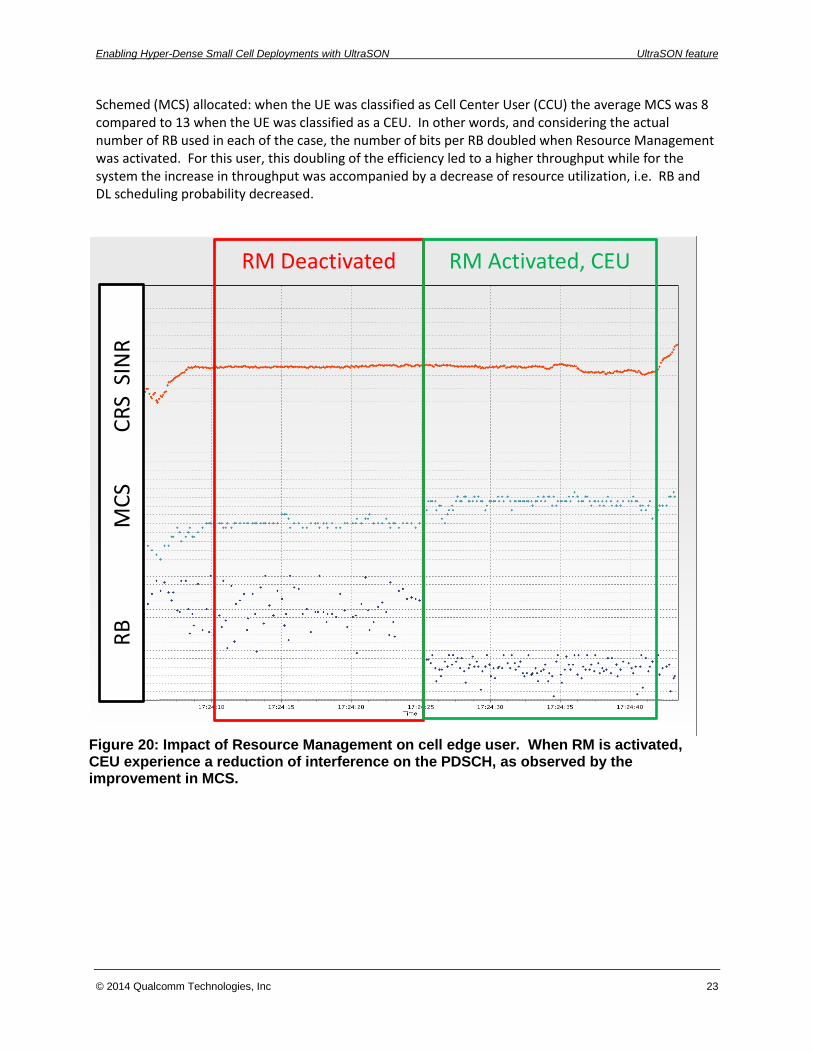
This concept and its benefits are illustrated through a test performed at the venue. For this test, Power Management was active at all time, as illustrated by the CRS SINR being constant over the entire test duration. The test was performed in loaded conditions, and was focusing on one user at the cell boundary between PCI 19 and PCI 67 as illustrated in Figure 19. During the test, the RM was initially deactivated, then activated in the second step. When RM was deactivated, the UE even at cell edge could be assigned any number of RB, with the only constraint being the needs to serve all the users in the cell at that time. Once the RM was activated, and the UE was classified as CEU from its CQI reports, the number of RB was bound to 50, limit inherent to the number of colors used in this deployment. In this test, the UE was experiencing stable RF conditions, as illustrated by the constant RS SINR in Figure
20. It should be noted that the UE was served by PCI 19, while the strongest interference was PCI 67. The coloring, the range of RB allocated to CEU, for these 2 cells were different, as illustrated in Figure 19. The impact of resource management can be observed by the difference of Modulation and Coding
Figure 19: Test setup used to measure the impact of Resource Management on a cell edge user.
Enabling Hyper-Dense Small Cell Deployments with UltraSON UltraSON feature
© 2014 Qualcomm Technologies, Inc 23
Schemed (MCS) allocated: when the UE was classified as Cell Center User (CCU) the average MCS was 8 compared to 13 when the UE was classified as a CEU. In other words, and considering the actual number of RB used in each of the case, the number of bits per RB doubled when Resource Management was activated. For this user, this doubling of the efficiency led to a higher throughput while for the system the increase in throughput was accompanied by a decrease of resource utilization, i.e. RB and DL scheduling probability decreased.
RM Deactivated RM Activated, CEU
RB
M
CS
C
RS
SIN
R
Figure 20: Impact of Resource Management on cell edge user. When RM is activated, CEU experience a reduction of interference on the PDSCH, as observed by the improvement in MCS.

Enabling Hyper-Dense Small Cell Deployments with UltraSON Conclusions
© 2014 Qualcomm Technologies, Inc 24
4 Conclusions
It is expected that mobile traffic will increase by 1000x in the next decade and cellular networks need to prepare for this capacity increase. This paper presents field trial results demonstrating that unplanned small cell densification is an effective way to move towards this goal. NASCAR PIR garage area was chosen in this trial due to extreme RF conditions that are judged as “one of harshest environment”. We were able to demonstrate a capacity increase of over 40x (normalized with respect to spectrum and area) over traditional deployment while providing high level of QoS with UltraSON. Considering the RF challenges in this trial we conclude such capacity gain is expected to be possible in any other dense small cell deployments.
These trials show that network densification using small cells (together with some increase in available spectrum, e.g., 10x) can lead to 1000x capacity increase compared to traditional deployments with high QoS and user experience.

© 2014 Qualcomm Technologies, Inc 25
5 References
1. Qualcomm, “The 1000x Data Challenge,” (http://www.qualcomm.com/solutions/wireless-
networks/technologies/1000x-data).
2. 3GPP, Release 10 (http://www.3gpp.org/Release-10).
3. 3GPP TS 36.413, Evolved Universal Terrestrial Radio Access Network (E-UTRAN); S1 Application Protocol (S1AP).
4. Qualcomm, Enabling Hyper-Dense Small Cell Deployment with UltraSON™,
http://www.qualcomm.com/media/documents/enabling-hyper-dense-small-cell-deployments-ultrason
5. http://www.airspan.com/products/airsynergy/