
HyFlux2: a numerical model for the impact assessment of...
20
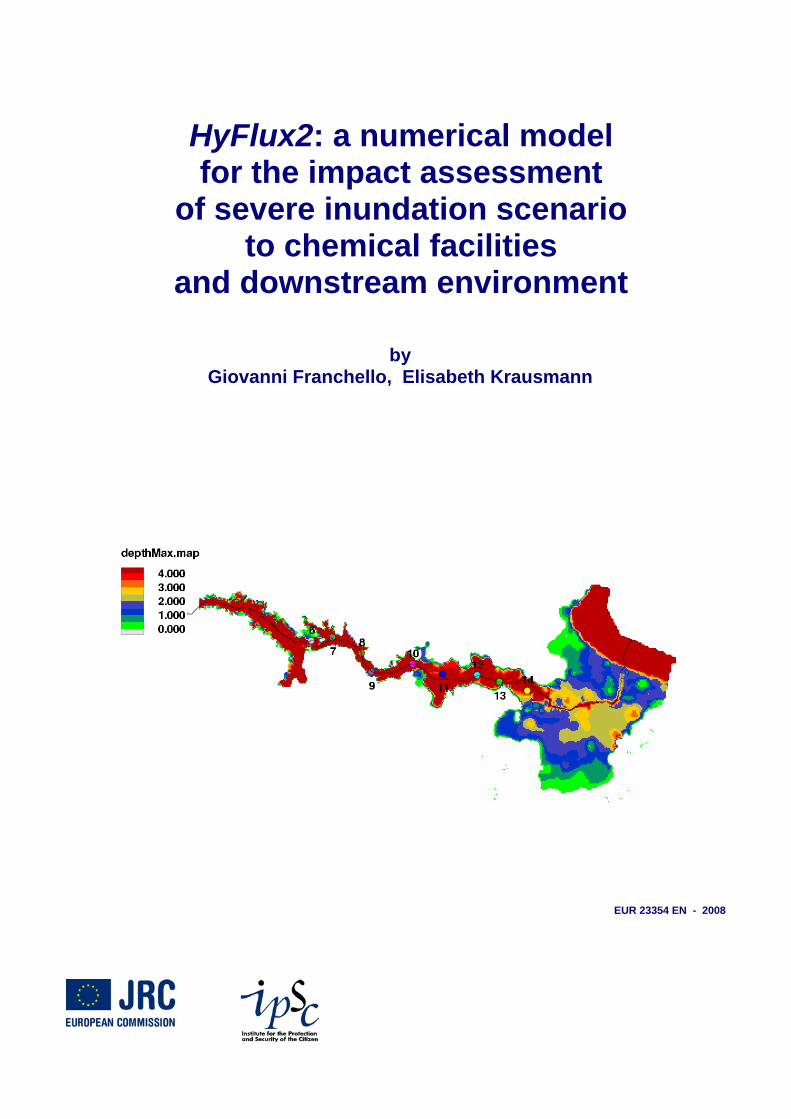
HyFlux2: a numerical model for the impact assessment of severe inundation scenario to chemical facilities and downstream environment by Giovanni Franchello, Elisabeth Krausmann EUR 23354 EN - 2008
Transcript of HyFlux2: a numerical model for the impact assessment of...

HyFlux2 a numerical model for the impact assessment
of severe inundation scenario to chemical facilities
and downstream environment
by
Giovanni Franchello Elisabeth Krausmann
EUR 23354 EN - 2008
HyFlux2 a numerical model for the impact assessment
of severe inundation scenario to chemical facilities
and downstream environment
by Giovanni Franchello Elisabeth Krausmann
EUR 23354 EN - 2008
The Institute for the Protection and Security of the Citizen provides research-based systems-oriented support to EU policies so as to protect the citizen against economic and technological risk The Institute maintains and develops its expertise and networks in information communication space and engineering technologies in support of its mission The strong cross-fertilisation between its nuclear and non-nuclear activities strengthens the expertise it can bring to the benefit of customers in both domains European Commission Joint Research Centre Institute for the Protection and Security of the Citizen Contact information Address Via E Fermi 2749 I-21027 Ispra Italy E-mail giovannifranchellojrcitTel +390332785066 Fax +390332789007 httpipscjrceceuropaeu httpwwwjrceceuropaeu Legal Notice Neither the European Commission nor any person acting on behalf of the Commission is responsible for the use which might be made of this publication
Europe Direct is a service to help you find answers to your questions about the European Union
Freephone number ()
00 800 6 7 8 9 10 11
() Certain mobile telephone operators do not allow access to 00 800 numbers or these calls may be billed
A great deal of additional information on the European Union is available on the Internet It can be accessed through the Europa server httpeuropaeu JRC 36005 EUR 23354 EN ISSN 1018-5593 Luxembourg Office for Official Publications of the European Communities copy European Communities 2008 Reproduction is authorised provided the source is acknowledged Printed in Italy
1 ndash Introduction Failures of dams and water-retaining structures continue to occur After some days of high rainfall the explosive failure of the Malpasset concrete dam in France in 1959 led to 433 casualties and eventually prompted the introduction of dam-safety legislation into France In October 1963 2000 people died in Italy when a landslide fell into the Vajont reservoir creating a flood wave some 250m high that overtopped the dam and flooded the downstream valley In Spain 1998 the Los Frailes tailings dam failure (Aznalcoacutellar Spain) caused immense ecological damage from the release of polluted sediments into the Guadiamar river and Donana National Parc Similarly in Romania 2000 Baia Mare the failure of a mine tailings dam due to heavy precipitation and snowmelt released lethal quantities of cyanide into the river system thereby polluting the environment and a major source of drinking water for both Romania and Hungary [1] After the Indian Ocean Tsunami in 2004 field investigations highlighted that the tsunami consisted of high-velocity surges rushing inland for kilometres followed by a series of incoming bores advancing in the seawater-inundated coastal plains [2] These surges exhibited similar characteristics with dam-break wave events The 2004 tsunami resulted in about 300000 casualties and damage is estimated at over 10 billion $US [3] Of critical importance for engineering design are the flow velocities and flow depths which may reach 10-30 ms and 2-25 metres respectively above the natural bed level The aim of the HyFlux2 model recently developed within the European Commission Joint Research Centrersquos (JRC) MAHB-NEDIES project [4] is to predict tsunami surges on coastal plains as well as dam-break waves in flood plains The model can be used to a) define inundation hazard maps with maximum water depth and wave arrival time for risk management and emergency planning b) quantify the impact forces from the flow on civil-engineering structures providing guidelines for civil-engineering safety design c) test innovative mitigation and protection methods that can shelter evacuation sites and critical infrastructure This supports the JRCrsquos activities on protecting the citizens from technological or natural disasters by trying to prevent them from happening or by mitigating their consequences In particular a recent activity at the JRC aims at understanding the underlying mechanisms of natural-hazard triggered technological accidents (so-called Natech disasters) and the HyFlux2 model will supplement the ongoing assessment of the flooding risk of chemical installations storing andor processing hazardous materials [5] This paper gives a description of the HyFlux2 model and applies it to a selected 2D test example the Malpasset dam-break case study 2 ndash The HyFlux2 Model The basic ingredient of the HyFlux2 model for solving the shallow water equations is a 2D finite volume Approximate Riemann Solver with a high-resolution Flux Vector Splitting technique and implicit treatment of the source terms which makes the model able to capture local discontinuities - like shock waves - and reduces numerical diffusion and unphysical viscosity effects which dominate in all finite-difference methods The numerical model has been validated with respect to different numerical 1D test cases and comparisons with the exact solution of the Riemann problem are presented in paper [6] 21 ndash The Shallow Water Equations The 2D system of the shallow water equation solved by the HyFlux2 model can be conveniently written as follows
CFtU
=sdotΔ+partpart r
(1)
where U is the conservative vector is the flux vector and C the source vector yx FFF =r
⎪⎭
⎪⎬
⎫
⎪⎩
⎪⎨
⎧
=
y
x
hvhvh
U ⎪⎭
⎪⎬
⎫
⎪⎩
⎪⎨
⎧
+=
yx
x
x
x
vhvghhv
hvF 222
⎪⎭
⎪⎬
⎫
⎪⎩
⎪⎨
⎧
+=
222 ghhvvhv
hvF
y
xy
y
y ( )⎪⎪
⎭
⎪⎪
⎬
⎫
⎪⎪
⎩
⎪⎪
⎨
⎧
⎟⎠⎞⎜
⎝⎛ +partpartminusminus
+partpartminus=
fyx
fxy
Syzghfv
Sxzghfv
qC
3
In the above notation h signifies the water depth the horizontal velocity of the fluid z the vertical coordinate of the bottom (or bed)
yx vvv =rarr
η the elevation of the free surface g the gravitational acceleration (opposite
to the z direction) θω sin2=f the Coriolis parameter and fSr
denotes the bottom friction that can be expressed by the well known Manning formula
yxyx
fyfx vvh
vvnSSfS
34
222 +==
rarr
(2)
where n is an empirical roughness coefficient for the water ndash called also Manning coefficient - which is in the order of 001divide01 depending on the surface roughness (see Fig 21) The quantity q is a ldquolateral flowrdquo which could be the rainfall or other external sources
Fig 21 - Schematic of the coordinates and variables of the shallow water model
22 ndash Numerical Method For the numerical solution scheme the governing Eq (1) is transformed into a finite volume and time approximation (Fig 22) In a Cartesian space domain indices ij indicate the control volumes or cells at column i and row j and n the time-step level The conservative vector assigned to the centre of the cell at time level n+1 is given by
jiU
tCFFytFF
xtUU n
ji
n
jiy
n
jiyj
n
jix
n
jixi
nji
nji Δ+⎟⎟
⎠
⎞⎜⎜⎝
⎛minus
ΔΔ
minus⎟⎟⎠
⎞⎜⎜⎝
⎛minus
ΔΔ
minus= +minus+minus+
+ 1
21
21
21
21
1 )()()()( (3)
Note that the source vector is evaluated at the ldquonewrdquo time step 1+n in order to handle the ldquostiffnessrdquo of the source terms The vectors are the interface fluxes calculated at each x- and y-directions
21
21
21
21 )()()()( minus+minus+ jiyjiyjixjix FFFF
Fig 22 ndash Finite volume discretisation of Cartesian domain A typical cell has four interface boundaries For each interface a Left (L) and a Right (R) cell can be identified
The space domain is transformed into so called 1D dam break problems - or Riemann problems - at each cell interface (Fig 23) The conservative equation (3) is the natural extension of the one-dimensional conservative equation and is completely determined once the interface fluxes are calculated [7]
4
Fig 23 ndash Linearized Riemann Solver for each cell interface in xy directions
The solution of the 1D Riemann problem for each cell interface is the numerical flux called also ldquoGodunov ldquo
flux calculated from the corresponding fluxes in the ldquoleftrdquo and ldquorightrdquo cell as
F
RL FF
22 RLRL FFGFFF minus
++
= (4)
with in case of sub-critical flow and in case of super-critical flow subGG = sup GG =
( )⎪⎪⎪
⎭
⎪⎪⎪
⎬
⎫
⎪⎪⎪
⎩
⎪⎪⎪
⎨
⎧
minus
minus
=
3
22
000
01
λ
ηη
η
signc
vc
vccc
v
G sub
( )( )
( )⎪⎭
⎪⎬
⎫
⎪⎩
⎪⎨
⎧=
3
3
3sup
000000
λλ
λ
signsign
signG (5)
More details about the methodologies used to obtain Eq (4) called also Flux Vector Splitting introduced by HSteadtke et al to model two-phase flows implemented by GFranchello for the shallow water flows can be found in [689] The quantities ηηη λλλ vcvcv =+=minus= 321 are the characteristic velocities and
ghc = is the celerity of the gravitational wave The flux in the 1D Riemann problem is defined by
τηηη vhvghhvhvF 2 22 += (6) The velocity ( )τη vv takes the place of ( )yx vv for the x-direction and of ( )xy vv for the y-direction Note that only in the case of super-critical flow - like in the donor cell technique - the flux from the upstream cell
is taken The coefficient of the matrix - the velocity and the celerity c - are computed by an arithmetic average of these quantities at the ldquoleftrdquo and ldquorightrdquo sides of the cell interface
G ( τη vvv =rarr
)
2~ RL VV
vcv
V +=
⎪⎭
⎪⎬
⎫
⎪⎩
⎪⎨
⎧=
τ
η
(7)
Note that the tangential velocity does not appear in the matrix coefficient but only in the definition of the flux vector Such a quantity like pollutant concentrations jumps discontinuously across a share wave according
to the sign of the normal velocity which is the transport velocity in the cell interface
τv G
ηv To avoid wave interference the time step size tΔ is bounded in each cell by the Courant number criteria defined by
5
yky
xkx C
y
tC
xt
ltΔ
Δlt
Δ
Δ λλ
for k=123 (8)
To avoid mass error the time step is also bounded in each cell interface by the following flux number criteria
⎪⎪
⎩
⎪⎪
⎨
⎧
ltltΔ
Δ
gtltΔ
Δ
0
0
1
1
1
1
FifCxh
Ft
FifCxh
Ft
R
L (9)
Note that is the mass flux calculated at each interface cell by the 1D Riemann Solver These criteria ensure that not all the mass in the upstream cell is removed in a time step
1F
The Courant number criterion bounds the time step size in case of tsunami-wave propagation simulations where the characteristic velocities are close to the celerity (ie the flow is sub-critical) while the flux number criterion bounds the time-step size in case of nearly critical or supercritical flow like flood wave nearly dry bed and other inundation processes In case of dam-break simulations both the criteria bound the time-step size Good stability and no mass error are realised for 50lt= yx CC and for 1 ltC In the HyFlux2 model a second-order scheme is also implemented that together with an appropriate limiter function allows a high resolution of the simulations limiting unphysical numerical noise diffusion as well as numerical viscosity and allowing the convergence to a nearly exact solution also in case of a bore critical flow and shoreline formation An additional model was included to handle singularities like the critical flow dry bed bed step and shoreline tracking allowing the simulation of inundation processes for complex bathymetry and topography This is discussed in more detail in [6] 23 ndash Topography Interpolation The data available in a real topography are normally the elevations digitized from maps or raster data in geographical projections ie spherical Mercator etc Because the model needs the elevations and the slopes in the center of the cells in a Cartesian space domain (raster maps) the adopted procedure is the following
1) The elevations in the nodes of the cells (see Fig 24) are first obtained by interpolation of the original data Depending on the origin of the data two different procedures are adopted
a When the distributions of the elevation data are sparse ie they are digitized from maps the inverse-distance interpolation method is adopted
b In case the elevations are in a geographical projection the data values are re-projected into the Lambert-Azimuth Equal Area system and the elevations in the nodes are obtained by bi-linear interpolation The Lambert-Azimuth Equal Area projection is mass conservative so it is necessary when the space domain is in the order of thousands km like in tsunami simulations
2) The elevations and the slopes in the center of the cells are then calculated by bi-linear interpolation of the 4 nodes in the vertices of each cell as follows
( )( )
( )y
zzzzyz
xzzzz
xz
zzzzz
jijijiji
ji
jijijiji
ji
jijijijiji
Δ
minusminus+=⎟⎟
⎠
⎞⎜⎜⎝
⎛partpart
Δ
minus+minus=⎟
⎠⎞
⎜⎝⎛partpart
+++=
minusminusminus++minus++
minusminusminus++minus++
minusminusminus++minus++
2
2
41
2121212121212121
2121212121212121
2121212121212121
(10)
The advantage of such simple equations is that the elevations in the center of cell interfaces (junctions) calculated by the elevations and the slopes in the ldquoleftrdquo and ldquorightrdquo cell centre are exactly the same assuring that no artificial steps exist at the cell interface ie
6
( )ji
jijijiji
jiji xzxzzz
xzxzz
1121212121
21 22
12 +
+minus++++ ⎟⎠⎞
⎜⎝⎛partpartΔ
minus=+=⎟⎠⎞
⎜⎝⎛partpartΔ
+=
Fig 24 ndash Topography interpolation scheme
3 ndash Malpasset Dam-Break Simulation To validate the numerical model the Malpasset dam-break a real-life problem with complicated topography is selected The Malpasset Dam was located in a narrow gorge of the Reyran river valley approximately 12 km upstream of Frejus on the French Riviera The dam was a double curvature arch dam of 665 m maximum height with a crest length of 223 m The maximum reservoir capacity was meant to be 55 million m3 The dam failed explosively at 2114 on 2 December 1959 The flood wave ran along the Reyran valley to Frejus A total of 433 casualties were reported [10] 15 km downstream of the dam a portion of the Esterel freeway and a bridge were destroyed Huge blocks were carried away and deposited downstream Trace marks of the flood wave show that the flood rose to a level as high as 20 m above the original bed level Investigations after the accident showed that key factors in the failure of the dam were the pore water pressure in the rock and the nature of the rock Under the increasing pressure of rising water the arch separated from its foundation and rotated as a whole about its upper right end The whole left side of the dam collapsed followed by the middle part and then the right supports After this accident regulations were laid down in France obliging dam owners to undertake dam-break analyses Because of the dramatic changes in the topography after the accident ancient maps have been used to digitize the bottom elevation of the valley producing a topography file containing 13541 points corresponding to triangular meshes The overall dimensions of the study reach are 18 km x 10 km The elevation of the valley floor (as digitised) ranges from -20 m asl (the sea is included in the computation) to +100 m asl the latter being the estimated initial free surface elevation in the reservoir After the dam failure a field survey was performed by the Police to obtain the maximum water levels along the river valley The propagation time of the flood wave is available for 3 points because 3 electric transformers were destroyed by the wave and the exact times of these shutdowns are known In addition a physical model with a scale of 1400 was built by EDF to study the dam-break flow in 1964 The maximum water level and flood wave arrival time at 9 gauges points along the river valley were measured A view of the river valley and locations of measuring points are shown in Figure 31 Because of its complex topography and availability of measured data the Malpasset dam-break case was selected as a benchmark test example for dam-break models in the CADAM project [10]
7
Fig 31 ndash Topography and locations of measuring points for the Malpasset dam-break case The Reyan river is obtained by DEM processing but not used in the simulations
In the numerical simulations a Cartesian mesh composed of 450times250=112500 cells (Δx =40m) is used The topographic data used in the simulation is obtained by inverse distance interpolation based on the 13541 points of terrain elevation data used in the CADAM project The procedure to calculate the elevations and the slopes is described in Section 23 paragraph 1a and 2 The numbers of cells with real elevation values are 38886 In Figure 31 the DEM raster map obtained by the inverse distance interpolation of the digitized points is shown The Ryan river is obtained from GIS techniques used in hydrological applications The technique consists of first evaluating the flow direction (ldd) and upstream area (ups) in each cell by means of the ldd=lddcreate(dem) and ups=accuflux(lddcell area) functions of the PCRaster software [11] and after this evaluating the river path from the sea to upstream by means of the mapind tool [12] The river network is used for post-processing not for the flood-wave simulation because only the terrain elevation (DEM) and the slopes for each cell are necessary at this stage The initial water level in the reservoir was set to 100 m above sea level The rest of the computational domain was considered as dry bed The initial discharge in the Reyran river is neglected because negligible in respect to the flood-wave discharge A total and instantaneous dam failure is considered The time-step size is controlled by the Courant number criterion and flux number criterion as described in Section 22 Eqs (8) and (9) The output time step is set to 10 seconds this means that the calculated arrival time is underestimated by about 5 seconds In the border of the space domain defined by the terrain elevations a reflective wall boundary condition is specified This is done in order to easily verify that the total amount of water is conserved The initial sea level is set to 0 The simulated rise of the sea level does not affect the simulation results in the flood-plain space domain In the CADAM project a Manning coefficient of 003 over the entire computational domain was suggested Three simulations with Manning coefficients set to 0015 002 003 were performed The Root Mean Square Error (RMSE) and the bias (Dif) are calculated as follows
sum=
minus=nk
mesk
simk ww
nRMSE
1
2)(1 sum=
minus=nk
mesk
simk ww
nDif
1)(1 (11)
where are the simulated water surface level and arrival time values and are the measured values In Table 31 the results for each simulation as function of the Manning Coefficient are presented The water-surface elevation is overestimated by about 05 m The arrival time is underestimated by 05 min for a low Manning Coefficient while it is over-predicted by ~15 min for a high Manning Coefficient
simkw mes
kw
Arrival Time [s] Surface Elevation [m] Manning
Coefficient RMSE Dif RMSE Dif 0015 93 -398 353 017 0020 65 27 351 038 0030 114 794 355 079 Table 31 ndash RMSE and Dif as function of the Manning Coefficient
8
The computed maximum water-surface level map water-depth map arrival-time map and the maximum flux map (flux = velocity water depth) are presented in Figure 32 The Manning coefficient is set to 002 which seems to better fit the measured water-wave arrival time The figures show that the numerical model gives a realistic prediction of the dam-break flow without evident numerical anomalies The Police surface-elevation survey bounds quite well the simulated values It is worthwhile to note that there are 4 Police survey points in the valley (13141617) where the measured water surface level is lower than the terrain elevation This can be the results of the change in the topography after the accident However on these points the simulated water wave does not reach the cells but it is very close as can be seen in ZsurfMaxmap
9
Fig 32 ndash Maximum Water Surface Level (zsurfMaxmap [m]) maximum water depth (depthMaxmap [m]) maximum Water Flux (hvMaxmap [m2s]) and water wave arrival time (tarrmap [s])
Figure 33 presents the comparison between simulated and measured maximum water levels and the arrival time The terrain elevation is the bottom elevation of the Reyan river It is shown that the HyFlux2 model reproduces the water surface elevation and wave arrival time with good accuracy Note that the model is able to simulate critical flow and bore formation The surface elevations of two gauges 7 and 9 have been over-predicted by about 7 and 9 m Such gauges are situated downstream of narrow gorges where the critical flow occurs and the terrain slope is high The difficulty of capturing exactly the local hydrodynamics in such conditions is very high for a 2D shallow water model The same behaviour was seen also in the simulation results of other authors [1314151617] The surface elevations surveyed by the Police agree quite well with the simulation The wave arrival time is well simulated for the gauges but with a delay for the transformers Higher accuracy is realised at the first gauges and transformer immediately downstream of the dam and in the open valley This result indicates that despite the non-accurate prediction into the steep and narrow gorges the total mass and momentum is conserved providing again good accuracy in the valley where inhabitants houses and infrastructures are present
10
Fig 33 ndash Comparison of simulated and measured Maximum Water Surface Level and arrival time
A more accurate comparison of the simulated and measured values is presented in Fig 34 For a Manning coefficient of 002 the computed arrival time at gauge 14 (1240 s) transformer B (1230 s) and C (1230 s) are more or less the same For the measured values the difference from gauge 14 (1139 s) and transformer C (1420 s) which are close to each other is about 45 minutes such an anomaly was pointed out also during the CADAM project [17] and explained by the fact that the arrival time at the transformers was a real measured value while the arrival time at the gauges were measured in a scaled physical model It seems that a Manning coefficient of 003 is too high for the physical model while a Manning coefficient of 002 is too low for capturing the arrival time at the transformers accurately With a Manning coefficient of 003 the arrival time at the transformers is well predicted while the arrival time at the gauges is delayed confirming the doubt about the scaling of the roughness in the physical model It has to be noted that by changing the Manning coefficient the maximum water surface level prediction does not change very much but appreciable differences are noted in the arrival time (see Fig 35)
Fig 34 ndash Comparison of simulated and measured Maximum Water Surface Level and arrival time Top Manning coefficient = 002 - Bottom Manning coefficient = 003
11
Fig 35 ndash Arrival time in the valley 4 ndash Computational Remarks The simulation is performed for 3600 s problem time The numbers of cells covered by the DEM are 38886 while the entire Cartesian grid consists of 450times250=112500 cells The time-step size is controlled by a maximum Courant number set to 05 and a maximum flux number set to 1 The resulting number of time steps is 10690 The time-step size is bounded by the Courant number criterion in 3874 time steps while it is controlled by the flux number criterion in 3016 time steps In Table 41 some statistics values regarding the time step size and its controller are presented The range of the oscillation around the average values (standard deviation) is higher for the flux number controller than the Courant number criterion The total water volume error produced during the simulation is of 4300 m3 which is negligible when compared with the total volume of water of 118 million m3 In the artificial lake the initial volume of water is 525 million m3 The relative volume error is thus 36x which is considered negligible 510minus
Average Standard deviation Min max
tΔ 033 015 002 085 Courant number 045 006 020 050 Flux number 087 016 006 10 Table 41 ndash Statistical values of the time-step size and its controllers
The CPU time necessary in a simulation is 35 minutes in a CELSIUS R630 computer single precision floating point operator Linux OS
12
Conclusions The objective of this paper was to describe the method used to model the shallow water flow in a 2D topography and validate the HyFlux2 model for a real dam-break problem The proposed model was validated in the past [6] with respect to several numerical 1D test cases for which an exact solution exists proving the robustness and the reliability of the numerical schemes adopted In this paper the propsed model is validated with respect to a real dam-break case the 1959 Malpasset (Frejus France) complete dam failure The simulation results have been compared with the available measured data and it is shown that the model gives a satisfactory prediction of the major flow characteristics such as water depth flood extent and flood-wave arrival time In particular we have shown that the finite volume scheme is able to simulate a real life flood wave propagation handling ldquosingularitiesrdquo like critical flow flooding and drying processes It is also demonstrated that the model is robust computationally efficient and fully mass and momentum conservative The comparison of the measured data with the different simulations shows the effect of the flood-plain roughness with respect to the maximum water depth and water-wave arrival time giving indications on the accuracy of the simulated results The model can be used with a high degree of confidence for the impact assessment of severe inundation scenarios on chemical facilities civil infrastructures urban areas and finally to the downstream environment Test cases on other real dam-break problems tsunami propagation and long wave run-up problems will be presented in a future paper ACKNOWLEDGMENTS The authors wish to thank Dr Pilar Brufau (University Zaragoza) for providing valuable data and useful information on the Malpasset dam-break case
13
References 1 M W Morris CADAM Concerted Action on Dambreak Modelling Final Report Report SR 571 January 2000 2 Hubert Chanson ldquoTsunami surges on dry coastal plains application of dam break wave equationsrdquo Coastal
Engineering Journal Vol 48 No 4 (2006) 355-370 3 The NGDC Tsunami Event Database httpwwwngdcnoaagovseghazardtsevsrch_idbshtml 4 European Commission Joint Research Centre Major Accident Hazards Bureau (MAHB)
httpmahbsrvjrcit Natural and Environmental Disaster Information Exchange System (NEDIES) httpnediesjrcit 2007
5 E Krausmann and F Mushtaq ldquoA qualitative Natech damage scale for the impact of floods on selected industrial facilitiesrdquo Nat Haz 462 (2008) 179-197
6 GFranchello Modelling shallow water flows by a High Resolution Riemann Solver EUR 23307 EN - 2008 ISSN 1018-5593
7 E F Toro Shock-Capturing Methods for Free-Surface Shallow Flows John Wiley and Sons Chichester 2001 ISBN 0-471-98766-2
7 H Staumldtke G Franchello and B Worth Numerical Simulation of Multi-Dimensional Two-Phase Flow Using Second Order Flux Splitting Techniques 7th Intern Meeting on Nuclear Thermal Hydraulics NURETH-7 Saratoga Springs NY USA September 10-15 1995
8 H Staumldtke Gasdynamic aspects of Two-Phase Flow Hyperbolicity Wave Propagation Phenomena and Related Numerical Methods WILEY-VCH Verlag GmbH amp Co KGaA 2006
9 Goutal N ldquoThe Malpasset Dam Failure ndash An Overview and Test Case Definitionrdquo Proceedings of the 4th CADAM meeting Nov 18-19 1999 Zaragoza Spain
10 PCRaster Environmental Software httppcrastergeouunlindexhtml 11 GFranchello ldquoMeteosoft packagerdquo JRC Internal Report 23112005 12 Goutal N ldquoPresentation of 1D and 2D simulations of Malpasset dam break wave propagationrdquo Proceeding
of the 4th CADAM meeting Nov 18-19 1999 Zaragoza Spain 13 I Villanueva and P Garcia-Navarro ldquoA one dimensional study of the Malpasset dam break (proposed by
EDF) Proceedings of the 4th CADAM meeting Nov 18-19 1999 Zaragoza Spain 14 Brufau P Vaacutezquez-Cendoacuten ME and Garciacutea Navarro PrdquoZero mass error using unsteady wetting drying
conditions in shallow flows over dry irregular topographyrdquo Int J for Num Meth in Fluids 2004 15 Xinya Ying and Sam S Y Wang Modeling flood inundation due to dam and levee breach US-China
Workshop on advanced computational modeling in hydroscience and engineering September 19-21 Oxford Mississippi USA
16 S Soares Frazatildeo F Alcrudo and N Goutal ldquoDam-break test cases summaryrdquo 4th CADAM meeting - Zaragoza Spain (November 1999)
14
European Commission JRC 36005 EUR 23354 EN ISSN 1018-5593 EUR 23354 EN ndash Joint Research Centre ndash Institute for the Protection and Security of the Citizen Title HyFlux2 a numerical model for the impact assessment of severe inundation scenario to chemical facilities and downstream environment Authors GFranchello EKrausmann Luxembourg Office for Official Publications of the European Communities 2008 ndash 15 pp ndash 297 x 21 cm EUR ndash Scientific and Technical Research series ndash ISSN 1018-5593 Abstract Following a number of catastrophic dam-failure accidents and the accompanying environmental disasters (eg Baia Mare Romania 2000) the tailings ponds of mining activities entered in the scope of the Seveso Directive This Directive which deals with the control of major accident hazards requires the assessment of consequences for all relevant accident scenarios including those referring to dam rupture The HyFlux2 model has been developed to simulate flood inundation due to dam break However it is able to simulate other severe inundation scenarios such as tsunami-wave run-up and flash flood The model solves the conservative form of the two-dimensional shallow water equations using the finite volume method The interface flux is computed by a Flux Vector Splitting method based on a Godunov-type approach A second-order scheme is applied to the water surface level and velocity assuring the balance between fluxes and sources also for complex bathymetry and topography ie also in presence of bottom steps and shorelines The second-order scheme provides results with high accuracy also in the presence of drywet fronts The model adopts the raster grid so that a GIS Digital Elevation Model can be directly imported into the model The developed model is validated in this paper with a dam-break case study It is shown that the HyFlux2 model can correctly account for complex real dam-break flows giving a satisfactory prediction of the major characteristics such as water depth water velocity flood extent and flood-wave arrival time It is also demonstrated that the model is robust computationally efficient and fully mass conservative The results provided by the model are of great importance for the assessment and management of risk in a number of Seveso establishments with certain characteristics In case of tailings ponds this information is necessary for modelling the dispersion of pollutants to the downstream environment Similarly in the case of downstream chemical facilities where a dam-break can provoke chemical releases the model provides the necessary information to assess the impact and the risk of such a scenario Keywords 2D shallow water flow Flux Vector Splitting Riemann Solver complex topography dam-break tsunami run-up inundation scenario Seveso installations impact assessment
15
How to obtain EU publications Our priced publications are available from EU Bookshop (httpbookshopeuropaeu) where you can place an order with the sales agent of your choice The Publications Office has a worldwide network of sales agents You can obtain their contact details by sending a fax to (352) 29 29-42758
The mission of the JRC is to provide customer-driven scientific and technical supportfor the conception development implementation and monitoring of EU policies As a service of the European Commission the JRC functions as a reference centre of science and technology for the Union Close to the policy-making process it serves the common interest of the Member States while being independent of special interests whether private or national
- 22 ndash Numerical Method
- 23 ndash Topography Interpolation
- Title HyFlux2 a numerical model for the impact assessment of severe inundation scenario to chemical facilities and downstream environment
-
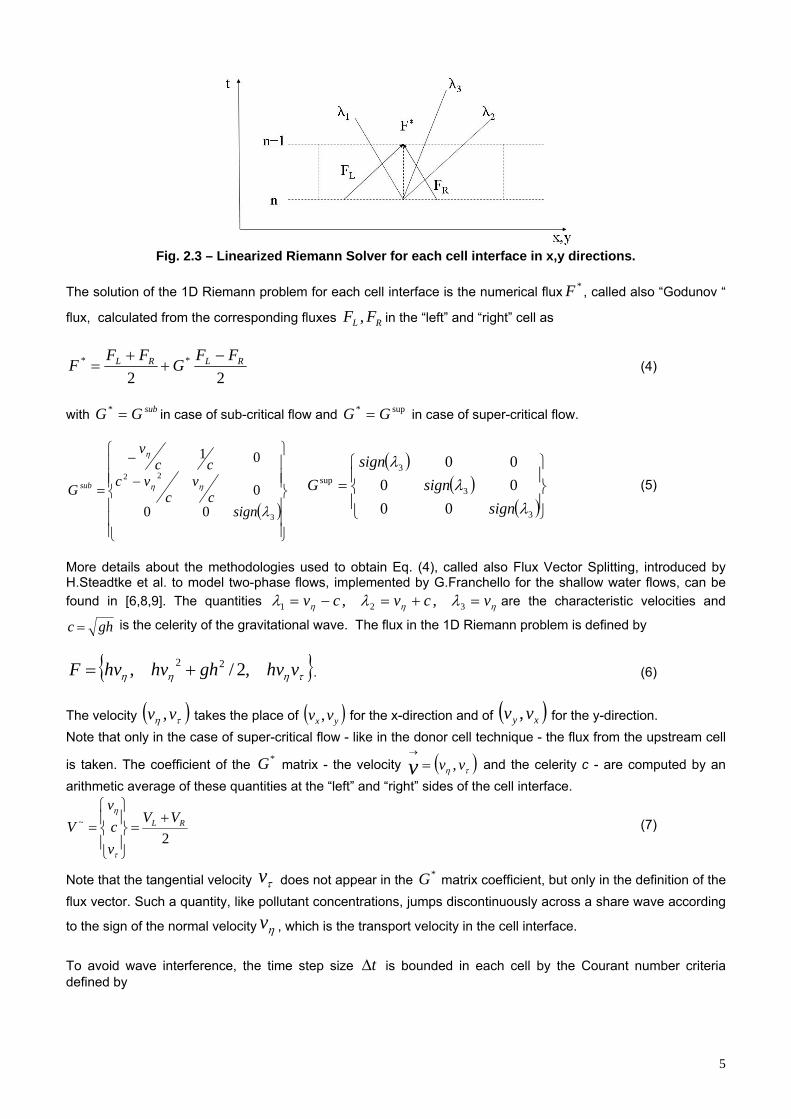
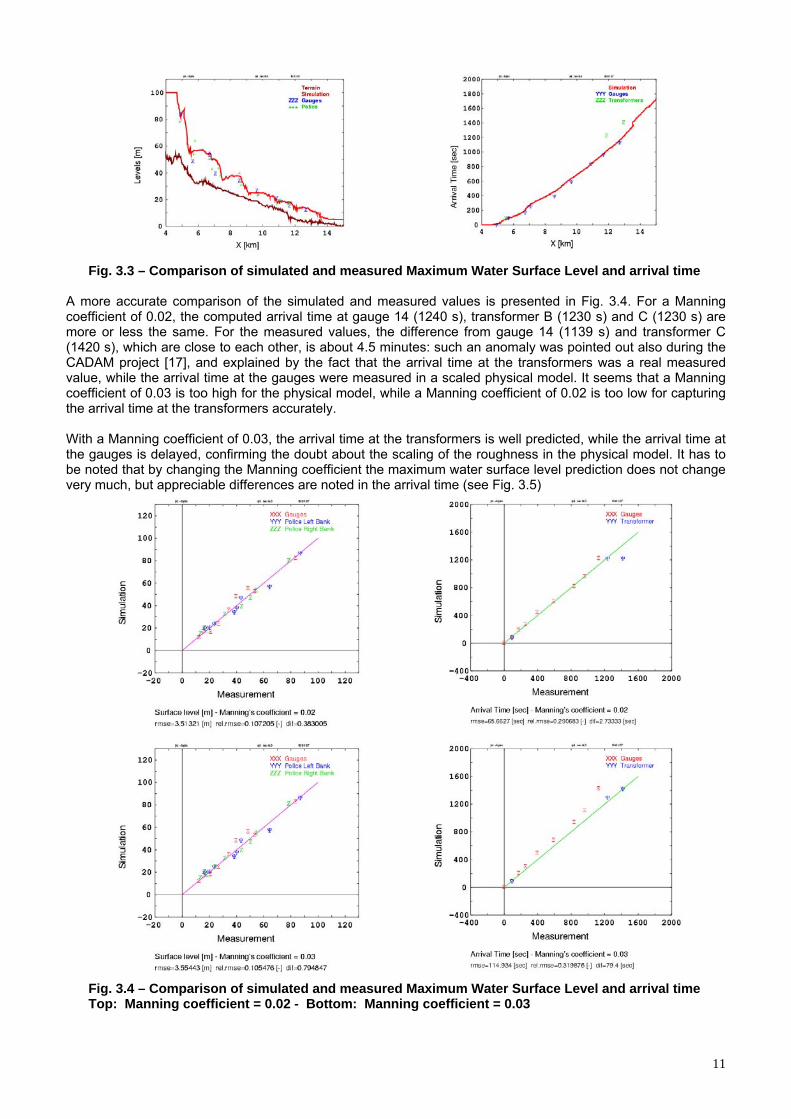


![Risk Assessment Methodology for Critical Infrastructure ...publications.jrc.ec.europa.eu/repository/bitstream/... · critical infrastructures ([12]). Researchers have pursued two](https://static.fdocuments.us/doc/165x107/5f22d1ca111a033be662b992/risk-assessment-methodology-for-critical-infrastructure-critical-infrastructures.jpg)

