Hydroxyl maser disc and outflow in the Orion-BN/KL region - MNRAS
12
Mon. Not. R. Astron. Soc. 367, 541–552 (2006) doi:10.1111/j.1365-2966.2006.10021.x Hydroxyl maser disc and outflow in the Orion-BN/KL region R. J. Cohen, 1 N. Gasiprong, 1,2 J. Meaburn 1,3 and M. F. Graham 1 1 Jodrell Bank Observatory, University of Manchester, Macclesfield, Cheshire SK11 9DL 2 Department of Physics, University of Ubon Ratchithani, Ubon Ratchithani, Thailand 3 Instituto de Astronomia, UNAM, Apdo, Postal 877, Ensenada, BC 22800, Mexico Accepted 2005 December 16. Received 2005 December 08; in original form 2005 August 31 ABSTRACT Multi Element Radio Linked Interferometer Network (MERLIN) measurements of 1.6-GHz hydroxyl (OH) masers associated with Orion-Becklin–Neugebauer/Kleinmann–Low (Orion-BN/KL) are presented, and the data are compared with data on other masers, molecular lines, compact radio continuum sources and infrared sources in the region. OH masers are detected over an area of 30 arcsec in diameter, with the majority lying along an approximately E–W structure that extends for ∼18 arcsec, encompassing the infrared sources IRc2, IRc6 and IRc7. Radial velocities range from −13 to +42 km s −1 . The system of OH masers shows a velocity gradient together with non-circular motions. The kinematics are modelled in terms of an expanding and rotating disc or torus. The rotation axis is found to be in the same direction as the molecular outflow. There is an inner cavity of radius ∼1300 au with no OH masers. The inner cavity, like the H 2 O ‘shell’ masers and SiO masers, is centred on radio source I. Some of the OH masers occur in velocity-coherent strings or arcs that are longer than 5 arcsec (2250 au). One such feature, Stream A, is a linear structure at position angle ∼45 ◦ , lying between IRc2 and BN. We suggest that these masers trace shock fronts, and have appeared, like a vapour trail, 200 yr after the passage of the runaway star BN. The radio proper motions of BN, source I and source n project back to a region near the base of Stream A that is largely devoid of OH masers. The 1612-MHz masers are kinematically distinct from the other OH masers. They are also more widely distributed and appear to be associated with the outflow as traced by H 2 O masers and by the 2.12-μm emission from shocked H 2 . The magnetic field traced by the OH masers ranges from 1.8 to 16.3 mG, with a possible reversal. No OH masers were found associated with even the most prominent proplyds within 10 arcsec of θ 1 Ori C. Key words: magnetic fields – masers – polarization – stars: formation – ISM: individual: Orion-BN/KL – ISM: jets and outflows. 1 INTRODUCTION The Orion A molecular cloud (L1641) is the nearest giant molecular cloud (GMC) containing the nearest regions of massive star forma- tion. Because of its proximity, it suffers little galactic extinction, and has been studied in far greater detail than other comparable re- gions in the Galaxy. The most recent formation of high-mass stars in the Orion GMC is within the Becklin–Neugebauer/Kleinmann–Low (BN/KL) region, about 1 arcmin north-west from the Trapezium star θ 1 Ori C. The explosive nature of this event is demonstrated dra- matically by the infrared H 2 and [Fe II] images of Allen & Burton (1993) and more recently by Kaifu et al. (2000). ‘Bullets’ of mat- ter are being ejected at hundreds of km s −1 to form a bipolar cone of molecular ‘fingers’ whose axis is perpendicular to the hot core E-mail: [email protected] traced by NH 3 emission (Wilson et al. 2000). These ‘fingers’ are tipped by Herbig–Haro (HH) objects whose shocked gas is visible at optical wavelengths [see Graham, Meaburn & Redman (2003) for a recent association of these phenomena]. At radio and millimetre wavelengths, there are at least two molec- ular outflows, one associated with the optical and near-infrared (NIR) features just described, and a second low-velocity outflow first detected through proper motions of H 2 O masers (Genzel et al. 1981). The powerful infrared source IRc2 was originally thought to be the source of the outflow, but more recent observations, in par- ticular of SiO masers (e.g. Greenhill et al. 1998), suggest that radio continuum source I of Menten & Reid (1995) is the more likely outflow source. Source I is significantly offset (by ∼0.5 arcsec) to the south of IRc2. Source I and the radio counterpart to BN have proper motions away from each other, corresponding to transverse speeds of 12 and 27 km s −1 , respectively (Plambeck et al. 1995; Rodr´ ıguez et al. C 2006 The Authors. Journal compilation C 2006 RAS Downloaded from https://academic.oup.com/mnras/article/367/2/541/1011855 by guest on 08 January 2022
Transcript of Hydroxyl maser disc and outflow in the Orion-BN/KL region - MNRAS
Mon. Not. R. Astron. Soc. 367, 541–552 (2006) doi:10.1111/j.1365-2966.2006.10021.x
Hydroxyl maser disc and outflow in the Orion-BN/KL region
R. J. Cohen,1� N. Gasiprong,1,2 J. Meaburn1,3 and M. F. Graham1
1Jodrell Bank Observatory, University of Manchester, Macclesfield, Cheshire SK11 9DL2Department of Physics, University of Ubon Ratchithani, Ubon Ratchithani, Thailand3Instituto de Astronomia, UNAM, Apdo, Postal 877, Ensenada, BC 22800, Mexico
Accepted 2005 December 16. Received 2005 December 08; in original form 2005 August 31
ABSTRACT
Multi Element Radio Linked Interferometer Network (MERLIN) measurements of1.6-GHz hydroxyl (OH) masers associated with Orion-Becklin–Neugebauer/Kleinmann–Low(Orion-BN/KL) are presented, and the data are compared with data on other masers, molecularlines, compact radio continuum sources and infrared sources in the region. OH masers aredetected over an area of 30 arcsec in diameter, with the majority lying along an approximatelyE–W structure that extends for ∼18 arcsec, encompassing the infrared sources IRc2, IRc6 andIRc7. Radial velocities range from −13 to +42 km s−1. The system of OH masers shows avelocity gradient together with non-circular motions. The kinematics are modelled in terms ofan expanding and rotating disc or torus. The rotation axis is found to be in the same directionas the molecular outflow. There is an inner cavity of radius ∼1300 au with no OH masers.The inner cavity, like the H2O ‘shell’ masers and SiO masers, is centred on radio source I.Some of the OH masers occur in velocity-coherent strings or arcs that are longer than 5 arcsec(2250 au). One such feature, Stream A, is a linear structure at position angle ∼45◦, lyingbetween IRc2 and BN. We suggest that these masers trace shock fronts, and have appeared,like a vapour trail, 200 yr after the passage of the runaway star BN. The radio proper motionsof BN, source I and source n project back to a region near the base of Stream A that is largelydevoid of OH masers. The 1612-MHz masers are kinematically distinct from the other OHmasers. They are also more widely distributed and appear to be associated with the outflowas traced by H2O masers and by the 2.12-μm emission from shocked H2. The magnetic fieldtraced by the OH masers ranges from 1.8 to 16.3 mG, with a possible reversal. No OH maserswere found associated with even the most prominent proplyds within 10 arcsec of θ1 Ori C.
Key words: magnetic fields – masers – polarization – stars: formation – ISM: individual:Orion-BN/KL – ISM: jets and outflows.
1 I N T RO D U C T I O N
The Orion A molecular cloud (L1641) is the nearest giant molecularcloud (GMC) containing the nearest regions of massive star forma-tion. Because of its proximity, it suffers little galactic extinction,and has been studied in far greater detail than other comparable re-gions in the Galaxy. The most recent formation of high-mass stars inthe Orion GMC is within the Becklin–Neugebauer/Kleinmann–Low(BN/KL) region, about 1 arcmin north-west from the Trapezium starθ1 Ori C. The explosive nature of this event is demonstrated dra-matically by the infrared H2 and [Fe II] images of Allen & Burton(1993) and more recently by Kaifu et al. (2000). ‘Bullets’ of mat-ter are being ejected at hundreds of km s−1 to form a bipolar coneof molecular ‘fingers’ whose axis is perpendicular to the hot core
�E-mail: [email protected]
traced by NH3 emission (Wilson et al. 2000). These ‘fingers’ aretipped by Herbig–Haro (HH) objects whose shocked gas is visibleat optical wavelengths [see Graham, Meaburn & Redman (2003) fora recent association of these phenomena].
At radio and millimetre wavelengths, there are at least two molec-ular outflows, one associated with the optical and near-infrared(NIR) features just described, and a second low-velocity outflowfirst detected through proper motions of H2O masers (Genzel et al.1981). The powerful infrared source IRc2 was originally thought tobe the source of the outflow, but more recent observations, in par-ticular of SiO masers (e.g. Greenhill et al. 1998), suggest that radiocontinuum source I of Menten & Reid (1995) is the more likelyoutflow source. Source I is significantly offset (by ∼0.5 arcsec) tothe south of IRc2.
Source I and the radio counterpart to BN have proper motionsaway from each other, corresponding to transverse speeds of 12and 27 km s−1, respectively (Plambeck et al. 1995; Rodrıguez et al.
C© 2006 The Authors. Journal compilation C© 2006 RAS
Dow
nloaded from https://academ
ic.oup.com/m
nras/article/367/2/541/1011855 by guest on 08 January 2022

542 R. J. Cohen et al.
2005). Here and elsewhere we assume a distance of 450 pc. Theradio proper motions indicate that BN and source I were within225 au of each other 525 ± 30 yr ago. Tan (2004) has suggestedthat the large proper motion of BN is due to its ejection from the θ1
Ori C system ∼4000 yr ago. On the other hand, Bally & Zinnecker(2005) proposed that the motions of BN and I are the results ofa stellar merger ∼500 yr ago, which ejected BN and produced theenergy powering the molecular outflow. Further analysis of the radioproper motion data by Gomez et al. (2005) shows that a third sourcen also has proper motions that project back to the position on thesky where BN and source I were close, ∼500 yr ago. This raises thepossibility that n is the third star dynamically necessary to eject BNfrom the multiple system. Distinguishing between these differentpossibilities is crucial to understanding the history of recent starformation in the region.
We have observed hydroxyl (OH) masers in the Orion-BN/KLregion as part of an ongoing study of masers associated with molec-ular outflows from massive young stars (Hutawarkorn & Cohen2005, and references therein). OH masers have the potential to tracephysical conditions, including magnetic fields which are detectedand measured through Zeeman splitting and OH maser polariza-tion. The previous Multi Element Radio Linked Interferometer Net-work (MERLIN) OH observations by Norris (1984) detected 801665-MHz masers distributed over a region of 10 arcsec, which wereinterpreted in terms of a rotating torus surrounding IRc2. Johnston,Migenes & Norris (1989) detected 175 masers spread over a regionof 20 arcsec, with the majority in an E–W structure 14 arcsec in ex-tent. The masers were found in clusters or ‘clumps’ that correlatedwith NH3 emission. The present MERLIN observations more thandouble the number of OH masers known, and show that the distri-bution is even more extensive in position and velocity (Section 3.1).The association of the masers with radio continuum sources is de-scribed in Sections 3.1 and 4.2, while the association with NIR andmid-infrared (MIR) sources is described in Section 3.3.
Secondary targets in the same MERLIN observations were the‘proplyds’ (O’Dell, Wen & Hu 1993) in the vicinity of θ 1 Ori C.These are the Solar system-sized circumstellar envelopes discov-ered by Laques & Vidal (1979) which surround low-mass youngstellar objects (YSOs) (Churchwell et al. 1987; Meaburn 1988; Mc-Caughrean & Stauffer 1994; O’Dell & Wong 1996; Bally et al.1998a). These stellar cocoons have dusty molecular discs with dense(�106 cm−3) surfaces ionized by the intense flux of Lyman radia-tion from θ1 Ori C (see Graham et al. 2002). In these circumstances,maser emission could be anticipated from the molecular discs which,if detectable, could be an important tool for investigating protoplan-etary environments. Upper limits for such an emission are reportedin Section 3.5.
2 O B S E RVAT I O N S
The OH observations were performed on 1998 April 27 and 28using seven telescopes of MERLIN: the 76-m Lovell Telescopeand the Mk2 telescope at Jodrell Bank, and outstation telescopesat Pickmere, Darnhall, Knockin, Defford and Cambridge. Thelongest baseline was 218 km, giving a minimum fringe spacing of0.16 arcsec. Observations covered all four ground-state OH transi-tions, namely, 1612, 1665, 1667 and 1720 MHz. A spectral band-width of 500 kHz was used, corresponding to a velocity range of90 km s−1. The spectral band was divided into 256 frequency chan-nels, giving a velocity spacing of 0.35 km s−1. The radial velocityat the centre of the 500-kHz band was +28 km s−1 with respect tothe local standard of rest (lsr). Left–left and right–right circularly
polarized signals from each pair of telescopes were simultaneouslycorrelated to give LL and RR.
The OH lines were observed in pairs, 1612 and 1667 MHzfor 6.5 hr on 1998 April 27 and 1665 and 1720 MHz for 8 hron 1998 April 28. Observations consisted of 5-min scans track-ing the field centre right ascension (RA) (B1950) 05h32m49.s043,declination (Dec.) (B1950) −05◦25′16.′′003 at each OH line fre-quency interleaved with 4-min scans on the nearby unresolvedphase-calibrator source IC0539−057. Because of the faintness ofthe phase-calibrator source, it was necessary to observe it in 16-MHzbandwidth. Short ∼30-min scans of the point-source amplitude andbandpass calibrator 2134+004 were also made. 2134+004 was alsoused to provide the flux scale (based on comparisons with 3C 286).
The data-processing and data-analysis procedures were carriedout in B1950 coordinates, as described by Gasiprong, Cohen &Hutawarkorn (2002). Data were first edited, calibrated and correctedfor gain-elevation effects using the Jodrell Bank d-programs, andthen passed into the AIPS software package. Within the AIPS pack-age, the data were further calibrated for all remaining instrumen-tal and atmospheric effects including the instrumental polarization.Self-calibration imaging of a bright point-like reference channelwas employed to derive the final gain solutions for the 1665-MHzdata. These gain solutions were then applied to the other channels.The 1612- and 1667-MHz data sets had poorer signal-to-noise ratio(S/N) and could not be self-calibrated, while at 1720 MHz no emis-sion was detected at all. Finally, maps in right- and left-hand circularpolarization (RHC and LHC) were produced using CLEAN algorithmsin AIPS, with a restoring beam of 150 × 150 mas2. For each data cube,the pixel size was 45×45 mas2 and the total area mapped was 1024 ×1024 pixel2 (46 × 46 arcsec2), centred on the position of IRc2. Asecond field of 512 × 512 pixel2 (23 × 23 arcsec2) centred on the po-sition of θ 1 Ori C was also searched for possible emission associatedwith the proplyds.
The rms noise in the final maps was 30–50 mJy beam−1, so onlymasers brighter than ∼0.1 Jy could be detected. The masers wereall unresolved at 150-mas resolution. Positions of maser featureswere determined by fitting two-dimensional Gaussian componentsto the brightest peaks in each channel map and taking flux-weightedmeans across the channels showing emission from each particularfeature. Final B1950 coordinates of the masers were then convertedto J2000 using the software package COCO. The errors in the relativepositions are typically 10 mas, while the absolute positions have apossible systematic error of 20 mas due to phase transfer from thereference source.
3 R E S U LT S
3.1 Maser distribution in Orion-BN/KL
We detected 11 masers at 1612 MHz, 430 masers at 1665 MHz, threemasers at 1667 MHz (LHC only) and no masers at 1720 MHz. Thepositions and velocities are given in Table 1. To facilitate comparisonwith other data, we give both the B1950 coordinates and the J2000coordinates. The maser distribution is shown in Fig. 1 in J2000coordinates. The OH masers are spread over a region 30 arcsec inextent, corresponding to ∼13 500 au. The radial velocities rangefrom −13 to +42 km s−1. The distribution is more extensive inboth angular scale and velocity range than found in previous work.However, most of the emission comes from the dominant E–Wstructure noted by Norris (1984) and Johnston et al. (1989).
One striking aspect of the new maps is that many of the OHmasers lie in semi-continuous streams or arcs, of which the most
C© 2006 The Authors. Journal compilation C© 2006 RAS, MNRAS 367, 541–552
Dow
nloaded from https://academ
ic.oup.com/m
nras/article/367/2/541/1011855 by guest on 08 January 2022
OH maser disc and outflow in Orion-BN/KL 543
Table 1. Sample of OH 1.6-GHz masers in Orion-BN/KL. The full version of this table is available online as supplementary material.
Transition Feature Velocity RA(1950) Dec.(1950) RA(2000) Dec.(2000) IntensityNo. (km s−1) 05h32m s −5◦ :24′ : ′′ 05hh35m s −5◦ :22′ : ′′ (Jy beam−1)
1612L 1 −13.41 45.8137 13.153 13.2911 19.624 0.202 −12.68 46.2592 27.890 13.7318 34.393 0.113 −3.97 46.7062 24.344 14.1800 30.880 0.204 3.66 47.4242 08.524 14.9030 15.112 0.115 7.64 46.8839 41.471 14.3521 48.019 0.09
6 7.64 47.1993 40.678 14.6677 47.249 0.127 7.64 47.2210 36.224 14.6908 42.797 0.128 7.64 47.2417 36.726 14.7114 43.300 0.179 18.93 47.0810 39.263 14.5499 45.826 0.08
10 18.93 47.1858 43.452 14.6533 50.022 0.13
1612R 1 41.80 46.7773 24.354 14.2510 30.895 0.12
1665L 1 −10.70 46.6328 22.505 14.1072 29.035 0.142 −10.42 46.7912 22.176 14.2656 28.718 0.243 −9.64 46.8095 22.013 14.2840 28.557 0.144 −9.64 47.0398 22.993 14.5139 29.553 0.345 −9.32 46.4472 22.867 13.9214 29.384 0.17
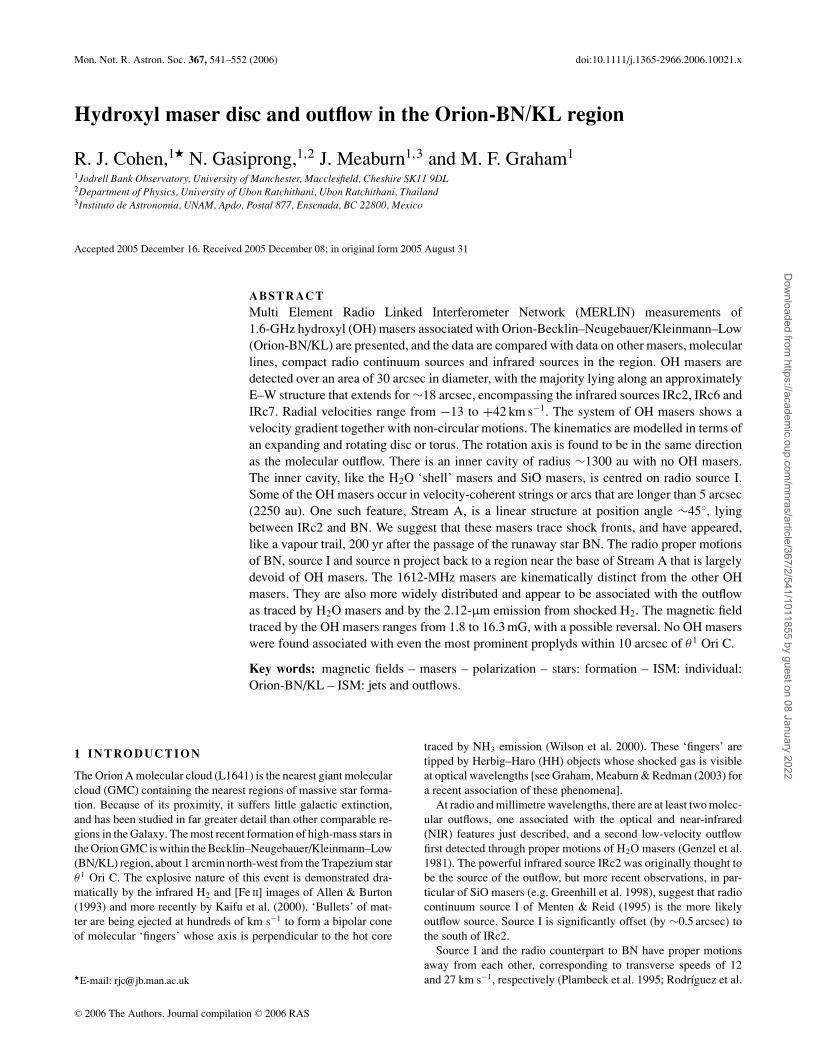
prominent are labelled Stream A and Arc B in Fig. 1. Stream Astretches from RA (2000) 05h35m14.s2, Dec. (2000) −05◦22′25′′ to05h35m14.s5, −05◦22′28′′, and includes the maser ‘clump’ NW1identified by Johnston et al. (1989). The radial velocities are ap-proximately constant, around +21 ± 2 km s−1. Arc B stretchesfrom 05h35m14.s1, −05◦22′28′′ to 05h35m14.s3, −05◦22′28′′, andincludes the maser clumps NW2 and NW3 of Johnston et al. (1989).The radial velocities cover a wide range, from ∼−7 km s−1 in theeast to ∼+10 km s−1 in the west. These streams or arcs are large-scale features, with angular sizes of ∼5 arcsec that correspond to∼2250 au. We argue that they trace large-scale shocks or ionizationfronts (Section 4.2).
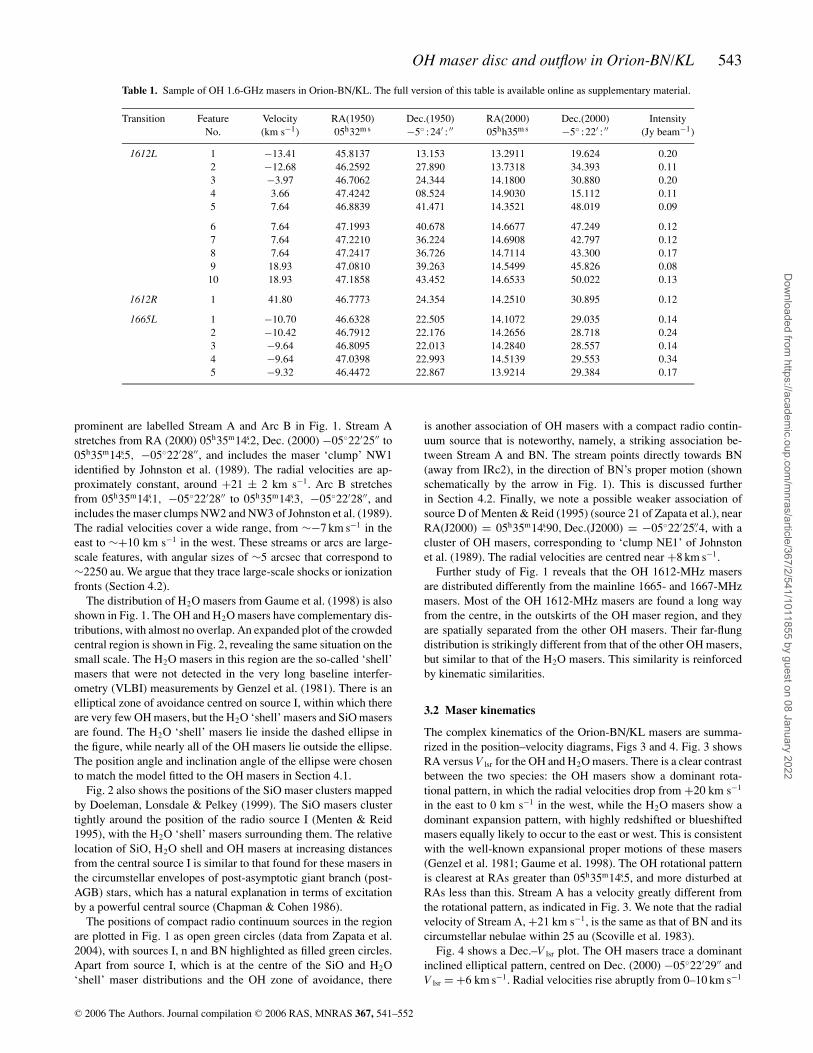
The distribution of H2O masers from Gaume et al. (1998) is alsoshown in Fig. 1. The OH and H2O masers have complementary dis-tributions, with almost no overlap. An expanded plot of the crowdedcentral region is shown in Fig. 2, revealing the same situation on thesmall scale. The H2O masers in this region are the so-called ‘shell’masers that were not detected in the very long baseline interfer-ometry (VLBI) measurements by Genzel et al. (1981). There is anelliptical zone of avoidance centred on source I, within which thereare very few OH masers, but the H2O ‘shell’ masers and SiO masersare found. The H2O ‘shell’ masers lie inside the dashed ellipse inthe figure, while nearly all of the OH masers lie outside the ellipse.The position angle and inclination angle of the ellipse were chosento match the model fitted to the OH masers in Section 4.1.
Fig. 2 also shows the positions of the SiO maser clusters mappedby Doeleman, Lonsdale & Pelkey (1999). The SiO masers clustertightly around the position of the radio source I (Menten & Reid1995), with the H2O ‘shell’ masers surrounding them. The relativelocation of SiO, H2O shell and OH masers at increasing distancesfrom the central source I is similar to that found for these masers inthe circumstellar envelopes of post-asymptotic giant branch (post-AGB) stars, which has a natural explanation in terms of excitationby a powerful central source (Chapman & Cohen 1986).
The positions of compact radio continuum sources in the regionare plotted in Fig. 1 as open green circles (data from Zapata et al.2004), with sources I, n and BN highlighted as filled green circles.Apart from source I, which is at the centre of the SiO and H2O‘shell’ maser distributions and the OH zone of avoidance, there
is another association of OH masers with a compact radio contin-uum source that is noteworthy, namely, a striking association be-tween Stream A and BN. The stream points directly towards BN(away from IRc2), in the direction of BN’s proper motion (shownschematically by the arrow in Fig. 1). This is discussed furtherin Section 4.2. Finally, we note a possible weaker association ofsource D of Menten & Reid (1995) (source 21 of Zapata et al.), nearRA(J2000) = 05h35m14.s90, Dec.(J2000) = −05◦22′25.′′4, with acluster of OH masers, corresponding to ‘clump NE1’ of Johnstonet al. (1989). The radial velocities are centred near +8 km s−1.
Further study of Fig. 1 reveals that the OH 1612-MHz masersare distributed differently from the mainline 1665- and 1667-MHzmasers. Most of the OH 1612-MHz masers are found a long wayfrom the centre, in the outskirts of the OH maser region, and theyare spatially separated from the other OH masers. Their far-flungdistribution is strikingly different from that of the other OH masers,but similar to that of the H2O masers. This similarity is reinforcedby kinematic similarities.
3.2 Maser kinematics
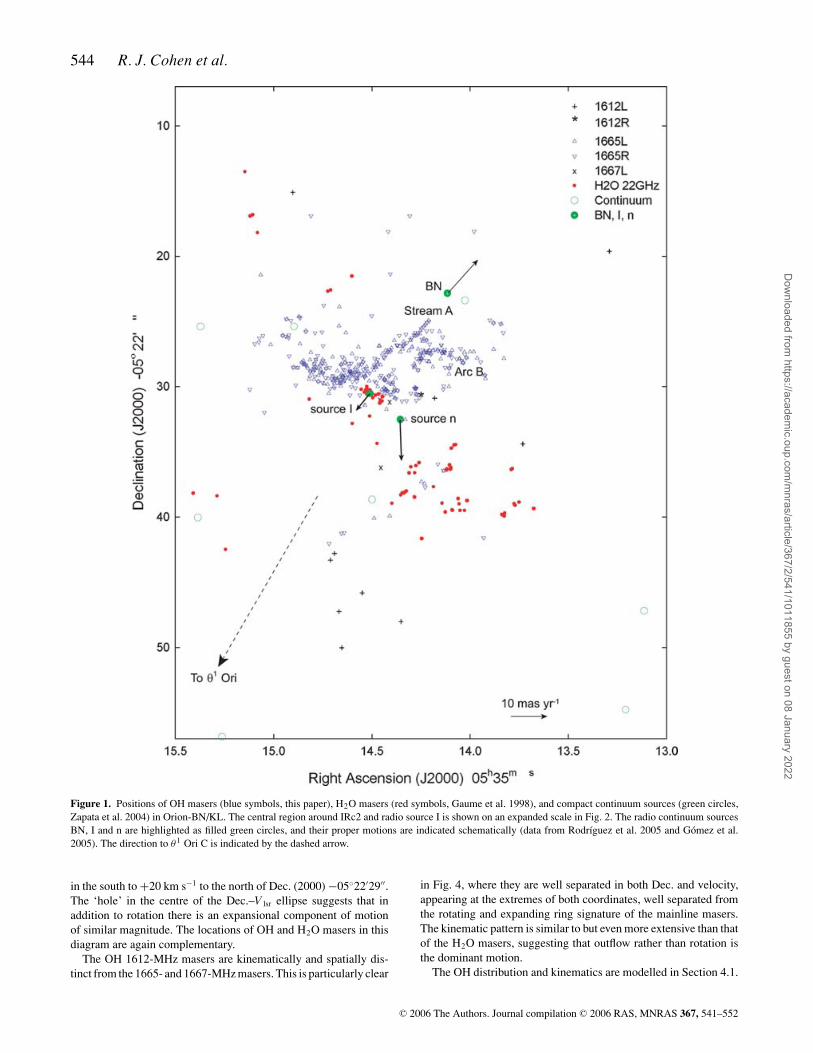
The complex kinematics of the Orion-BN/KL masers are summa-rized in the position–velocity diagrams, Figs 3 and 4. Fig. 3 showsRA versus V lsr for the OH and H2O masers. There is a clear contrastbetween the two species: the OH masers show a dominant rota-tional pattern, in which the radial velocities drop from +20 km s−1
in the east to 0 km s−1 in the west, while the H2O masers show adominant expansion pattern, with highly redshifted or blueshiftedmasers equally likely to occur to the east or west. This is consistentwith the well-known expansional proper motions of these masers(Genzel et al. 1981; Gaume et al. 1998). The OH rotational patternis clearest at RAs greater than 05h35m14.s5, and more disturbed atRAs less than this. Stream A has a velocity greatly different fromthe rotational pattern, as indicated in Fig. 3. We note that the radialvelocity of Stream A, +21 km s−1, is the same as that of BN and itscircumstellar nebulae within 25 au (Scoville et al. 1983).
Fig. 4 shows a Dec.–V lsr plot. The OH masers trace a dominantinclined elliptical pattern, centred on Dec. (2000) −05◦22′29′′ andV lsr = +6 km s−1. Radial velocities rise abruptly from 0–10 km s−1
C© 2006 The Authors. Journal compilation C© 2006 RAS, MNRAS 367, 541–552
Dow
nloaded from https://academ
ic.oup.com/m
nras/article/367/2/541/1011855 by guest on 08 January 2022
544 R. J. Cohen et al.
Figure 1. Positions of OH masers (blue symbols, this paper), H2O masers (red symbols, Gaume et al. 1998), and compact continuum sources (green circles,Zapata et al. 2004) in Orion-BN/KL. The central region around IRc2 and radio source I is shown on an expanded scale in Fig. 2. The radio continuum sourcesBN, I and n are highlighted as filled green circles, and their proper motions are indicated schematically (data from Rodrıguez et al. 2005 and Gomez et al.2005). The direction to θ1 Ori C is indicated by the dashed arrow.
in the south to +20 km s−1 to the north of Dec. (2000) −05◦22′29′′.The ‘hole’ in the centre of the Dec.–V lsr ellipse suggests that inaddition to rotation there is an expansional component of motionof similar magnitude. The locations of OH and H2O masers in thisdiagram are again complementary.
The OH 1612-MHz masers are kinematically and spatially dis-tinct from the 1665- and 1667-MHz masers. This is particularly clear
in Fig. 4, where they are well separated in both Dec. and velocity,appearing at the extremes of both coordinates, well separated fromthe rotating and expanding ring signature of the mainline masers.The kinematic pattern is similar to but even more extensive than thatof the H2O masers, suggesting that outflow rather than rotation isthe dominant motion.
The OH distribution and kinematics are modelled in Section 4.1.
C© 2006 The Authors. Journal compilation C© 2006 RAS, MNRAS 367, 541–552
Dow
nloaded from https://academ
ic.oup.com/m
nras/article/367/2/541/1011855 by guest on 08 January 2022
OH maser disc and outflow in Orion-BN/KL 545
Figure 2. Positions of OH masers (blue symbols, this paper), H2O masers(red symbols, Gaume et al. 1998) and SiO maser clusters (yellow symbols,Doleman et al. 1999) in the central region of Orion-BN/KL, near radiosource I (Menten & Reid 1995). The position for source I corresponds toepoch 2000 (Rodrıguez et al. 2005). The dashed ellipse corresponds to aring with rotation axis at position angle −35◦ and inclination angle 58◦ tothe line of sight, centred on radio source I (see Section 4.1).
Figure 3. Position–velocity plot showing RA (J2000) and radial velocity for the OH masers (blue symbols, this paper) and the H2O masers (red symbols,Gaume et al. 1998) in Orion-BN/KL. Stream A has a radial velocity of +21 km s−1 that is distinct from the general rotational pattern of the other OH masers.
3.3 Comparison with infrared data
The distribution and kinematics of the dominant OH emission showa degree of symmetry about the position of IRc2 and radio sourceI, and a radial velocity of ∼8 km s−1, as noted by previous authorscited in the Introduction. The OH masers encompass IRc2, 3, 6and 7. The availability of high-resolution infrared data allows us toexamine in more detail the correspondences of the OH masers withthe powerful MIR sources and with NIR bullets in the molecularoutflow.
3.3.1 Comparison with 12.5-μm Keck and 11.7-μm Gemini data
Shuping, Morris & Bally (2004) have published a high-resolution(0.38 arcsec) MIR image of the Orion-BN/KL region obtained withthe Keck I telescope at 12.5 μm. Fig. 5 is a composite plot show-ing the OH masers (this paper) superimposed on fig. 5 of Shupinget al. (2004). This shows several surprising results. First, OH maserscluster around IRc2, but they avoid the actual source position [rela-tive coordinates (+5 arcsec, −7 arcsec) in this diagram], which liesin the zone of avoidance noted in Section 3.1. Secondly, Stream Apoints directly away from IRc2 towards the dominant MIR sourceBN (at the origin), at position angle ∼45◦. Stream A runs through aregion devoid of MIR emission. The direction from IRc2 to BN isparallel to the proper motions recently measured for BN and radiosource I by Rodrıguez et al. (2005). It is also the projected directionof the large-scale molecular outflow. Thirdly, Arc B curves parabol-ically around the extended source IRc6 [near (+1 arcsec, −4 arcsec)in this figure], in a manner that suggests a close physical association.This confirms and extends the result of Johnston et al. (1989).
Smith et al. (2005) have published a high-resolution 11.7-μm mo-saic image of the inner Orion nebula obtained with the Gemini Southtelescope. The only close correlation (better than 2 arcsec) of anyof the OH 1.6-GHz masers listed in Table 1 with the 11.7-μm pointsources listed by Smith et al. (2005) is the 1612L maser number 10,at RA(J2000) = 05h35m14.s6533, Dec.(J2000) = −05◦22′50.′′022,which has a radial velocity of +18.9 km s−1. The correspondinginfrared (IR) source is at 05h35m14.s67, −05◦22′49.′′5. Smith et al.(2005) described the latter as ‘an embedded IR source with no optical
C© 2006 The Authors. Journal compilation C© 2006 RAS, MNRAS 367, 541–552
Dow
nloaded from https://academ
ic.oup.com/m
nras/article/367/2/541/1011855 by guest on 08 January 2022

546 R. J. Cohen et al.
Figure 4. Position–velocity plot showing Dec. (J2000) and radial velocity for the OH masers (blue symbols, this paper) and the H2O masers (red symbols,Gaume et al. 1998) in Orion-BN/KL.
Figure 5. Positions of OH masers (black symbols as in Fig. 1) overlaid on the 12.5-μm image (grey-scale) taken with the Keck Telescope by Shuping et al.(2004), adapted from their fig. 5. The open circles show the positions of OH maser clumps identified by Johnston et al. (1989). Red and blue dots indicate H2Omasers from Gaume et al. (1998) and Genzel et al. (1981), with red indicating radial velocity greater than +5 km s−1 and blue indicating radial velocity less than+5 km s−1. The green contours show NH3 (J, K) = (4,4) emission associated with the ‘hot core’, from Wilson et al. (2000). Offsets are relative to the positionof the BN object: RA(J2000) = 05h35m14.s117, Dec.(J2000) = −05◦22′22.′′9. IRc2 is near (+5 arcsec, −7 arcsec) and IRc6 is near (+1 arcsec,−4 arcsec).
C© 2006 The Authors. Journal compilation C© 2006 RAS, MNRAS 367, 541–552
Dow
nloaded from https://academ
ic.oup.com/m
nras/article/367/2/541/1011855 by guest on 08 January 2022
OH maser disc and outflow in Orion-BN/KL 547
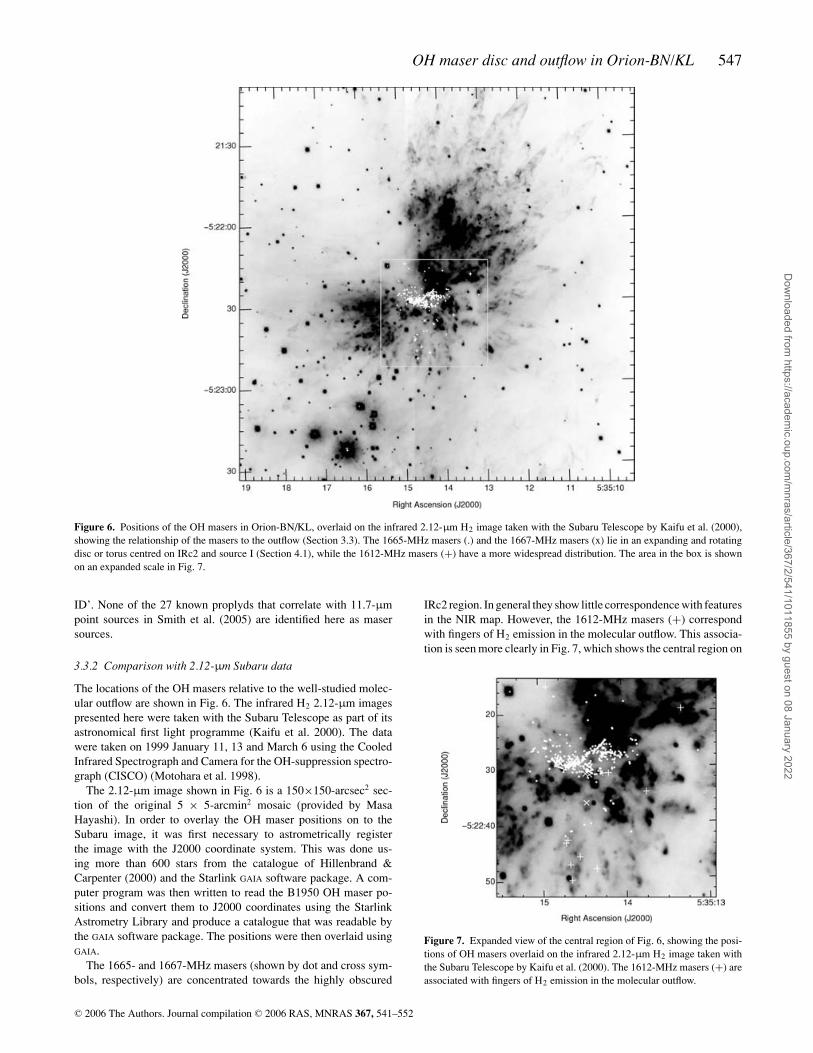
Figure 6. Positions of the OH masers in Orion-BN/KL, overlaid on the infrared 2.12-μm H2 image taken with the Subaru Telescope by Kaifu et al. (2000),showing the relationship of the masers to the outflow (Section 3.3). The 1665-MHz masers (.) and the 1667-MHz masers (x) lie in an expanding and rotatingdisc or torus centred on IRc2 and source I (Section 4.1), while the 1612-MHz masers (+) have a more widespread distribution. The area in the box is shownon an expanded scale in Fig. 7.
ID’. None of the 27 known proplyds that correlate with 11.7-μmpoint sources in Smith et al. (2005) are identified here as masersources.
3.3.2 Comparison with 2.12-μm Subaru data
The locations of the OH masers relative to the well-studied molec-ular outflow are shown in Fig. 6. The infrared H2 2.12-μm imagespresented here were taken with the Subaru Telescope as part of itsastronomical first light programme (Kaifu et al. 2000). The datawere taken on 1999 January 11, 13 and March 6 using the CooledInfrared Spectrograph and Camera for the OH-suppression spectro-graph (CISCO) (Motohara et al. 1998).
The 2.12-μm image shown in Fig. 6 is a 150×150-arcsec2 sec-tion of the original 5 × 5-arcmin2 mosaic (provided by MasaHayashi). In order to overlay the OH maser positions on to theSubaru image, it was first necessary to astrometrically registerthe image with the J2000 coordinate system. This was done us-ing more than 600 stars from the catalogue of Hillenbrand &Carpenter (2000) and the Starlink GAIA software package. A com-puter program was then written to read the B1950 OH maser po-sitions and convert them to J2000 coordinates using the StarlinkAstrometry Library and produce a catalogue that was readable bythe GAIA software package. The positions were then overlaid usingGAIA.
The 1665- and 1667-MHz masers (shown by dot and cross sym-bols, respectively) are concentrated towards the highly obscured
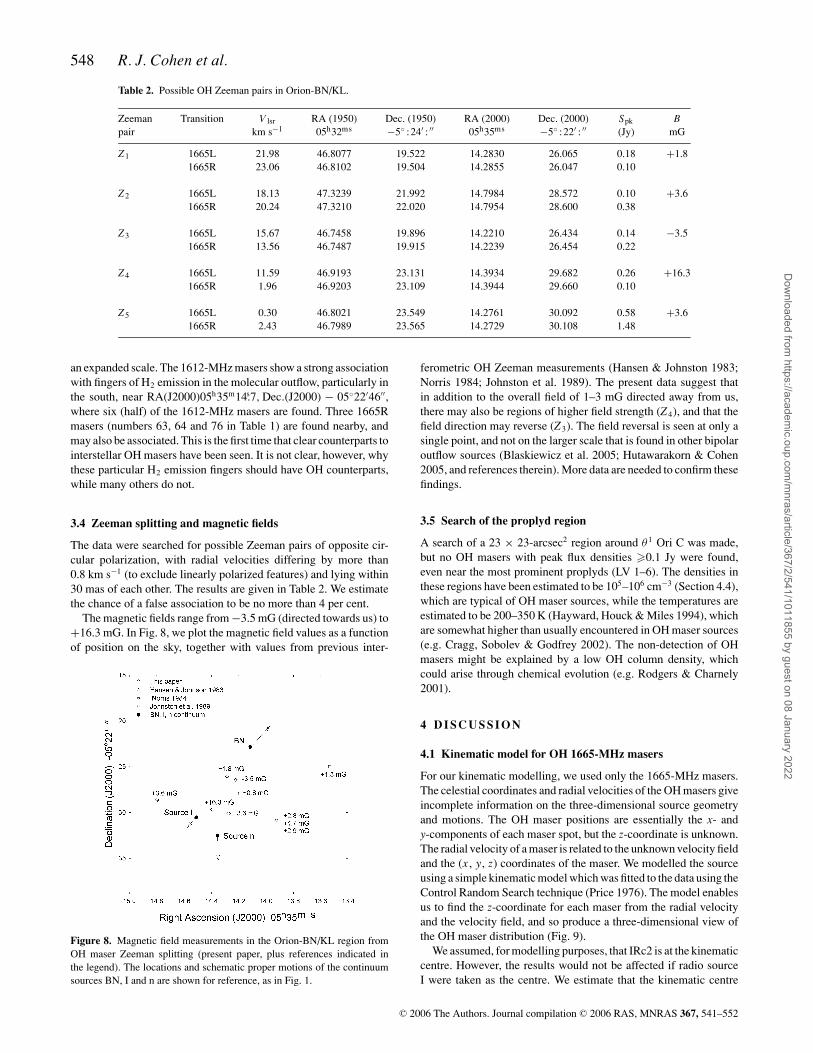
IRc2 region. In general they show little correspondence with featuresin the NIR map. However, the 1612-MHz masers (+) correspondwith fingers of H2 emission in the molecular outflow. This associa-tion is seen more clearly in Fig. 7, which shows the central region on
Figure 7. Expanded view of the central region of Fig. 6, showing the posi-tions of OH masers overlaid on the infrared 2.12-μm H2 image taken withthe Subaru Telescope by Kaifu et al. (2000). The 1612-MHz masers (+) areassociated with fingers of H2 emission in the molecular outflow.
C© 2006 The Authors. Journal compilation C© 2006 RAS, MNRAS 367, 541–552
Dow
nloaded from https://academ
ic.oup.com/m
nras/article/367/2/541/1011855 by guest on 08 January 2022
548 R. J. Cohen et al.
Table 2. Possible OH Zeeman pairs in Orion-BN/KL.
Zeeman Transition V lsr RA (1950) Dec. (1950) RA (2000) Dec. (2000) Spk Bpair km s−1 05h32ms −5◦ :24′ : ′′ 05h35ms −5◦ :22′ : ′′ (Jy) mG
Z1 1665L 21.98 46.8077 19.522 14.2830 26.065 0.18 +1.81665R 23.06 46.8102 19.504 14.2855 26.047 0.10
Z2 1665L 18.13 47.3239 21.992 14.7984 28.572 0.10 +3.61665R 20.24 47.3210 22.020 14.7954 28.600 0.38
Z3 1665L 15.67 46.7458 19.896 14.2210 26.434 0.14 −3.51665R 13.56 46.7487 19.915 14.2239 26.454 0.22
Z4 1665L 11.59 46.9193 23.131 14.3934 29.682 0.26 +16.31665R 1.96 46.9203 23.109 14.3944 29.660 0.10
Z5 1665L 0.30 46.8021 23.549 14.2761 30.092 0.58 +3.61665R 2.43 46.7989 23.565 14.2729 30.108 1.48
an expanded scale. The 1612-MHz masers show a strong associationwith fingers of H2 emission in the molecular outflow, particularly inthe south, near RA(J2000)05h35m14.s7, Dec.(J2000) − 05◦22′46′′,where six (half) of the 1612-MHz masers are found. Three 1665Rmasers (numbers 63, 64 and 76 in Table 1) are found nearby, andmay also be associated. This is the first time that clear counterparts tointerstellar OH masers have been seen. It is not clear, however, whythese particular H2 emission fingers should have OH counterparts,while many others do not.
3.4 Zeeman splitting and magnetic fields
The data were searched for possible Zeeman pairs of opposite cir-cular polarization, with radial velocities differing by more than0.8 km s−1 (to exclude linearly polarized features) and lying within30 mas of each other. The results are given in Table 2. We estimatethe chance of a false association to be no more than 4 per cent.
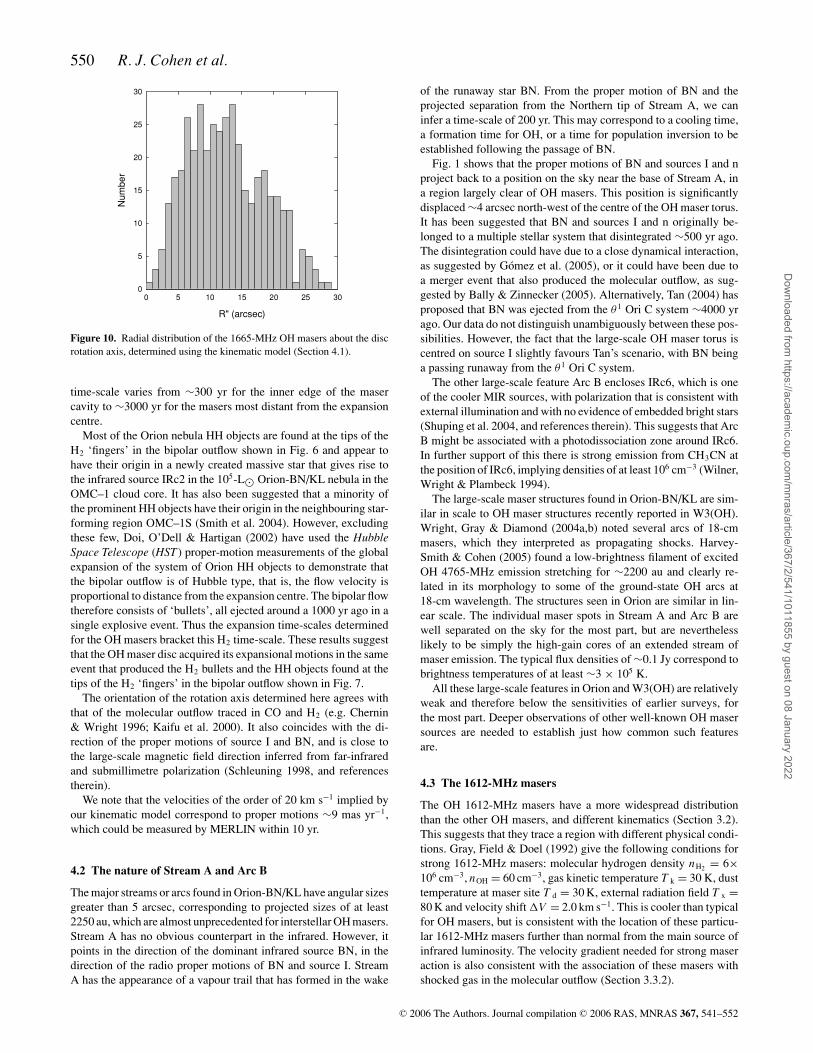
The magnetic fields range from −3.5 mG (directed towards us) to+16.3 mG. In Fig. 8, we plot the magnetic field values as a functionof position on the sky, together with values from previous inter-
Figure 8. Magnetic field measurements in the Orion-BN/KL region fromOH maser Zeeman splitting (present paper, plus references indicated inthe legend). The locations and schematic proper motions of the continuumsources BN, I and n are shown for reference, as in Fig. 1.
ferometric OH Zeeman measurements (Hansen & Johnston 1983;Norris 1984; Johnston et al. 1989). The present data suggest thatin addition to the overall field of 1–3 mG directed away from us,there may also be regions of higher field strength (Z4), and that thefield direction may reverse (Z3). The field reversal is seen at only asingle point, and not on the larger scale that is found in other bipolaroutflow sources (Blaskiewicz et al. 2005; Hutawarakorn & Cohen2005, and references therein). More data are needed to confirm thesefindings.
3.5 Search of the proplyd region
A search of a 23 × 23-arcsec2 region around θ 1 Ori C was made,but no OH masers with peak flux densities �0.1 Jy were found,even near the most prominent proplyds (LV 1–6). The densities inthese regions have been estimated to be 105–106 cm−3 (Section 4.4),which are typical of OH maser sources, while the temperatures areestimated to be 200–350 K (Hayward, Houck & Miles 1994), whichare somewhat higher than usually encountered in OH maser sources(e.g. Cragg, Sobolev & Godfrey 2002). The non-detection of OHmasers might be explained by a low OH column density, whichcould arise through chemical evolution (e.g. Rodgers & Charnely2001).
4 D I S C U S S I O N
4.1 Kinematic model for OH 1665-MHz masers
For our kinematic modelling, we used only the 1665-MHz masers.The celestial coordinates and radial velocities of the OH masers giveincomplete information on the three-dimensional source geometryand motions. The OH maser positions are essentially the x- andy-components of each maser spot, but the z-coordinate is unknown.The radial velocity of a maser is related to the unknown velocity fieldand the (x , y, z) coordinates of the maser. We modelled the sourceusing a simple kinematic model which was fitted to the data using theControl Random Search technique (Price 1976). The model enablesus to find the z-coordinate for each maser from the radial velocityand the velocity field, and so produce a three-dimensional view ofthe OH maser distribution (Fig. 9).
We assumed, for modelling purposes, that IRc2 is at the kinematiccentre. However, the results would not be affected if radio sourceI were taken as the centre. We estimate that the kinematic centre
C© 2006 The Authors. Journal compilation C© 2006 RAS, MNRAS 367, 541–552
Dow
nloaded from https://academ
ic.oup.com/m
nras/article/367/2/541/1011855 by guest on 08 January 2022

OH maser disc and outflow in Orion-BN/KL 549
X Z
Y
X
Z
Y
X
Z
Y
X
Z
Y
A
C
B
D
Figure 9. Three-dimensional view of the 1665-MHz OH masers in Orion-BN/KL, according to the kinematic model that was fitted (Section 4.1). The x-and y-axes correspond to RA and Dec., while the z-axis is in the line-of-sight direction. Box A shows the view in the x–y (RA–Dec.) plane looking in the+z-direction, box B shows the view looking in the +x-direction (increasing RA), box C shows the view looking along the rotational axis of the best-fittingmodel, and box D shows the view looking down the y-axis (decreasing Dec.).
of the OH masers is uncertain to ∼1 arcsec. The masers were as-sumed to have a uniform expansion velocity V exp away from IRc2,centred on an unknown radial velocity Vz0, plus solid body rotationcorresponding to Vrot at 1-arcsec separation from IRc2. The rotationaxis is tilted by an angle α about the y-axis and an angle β aboutthe x-axis from the x–z plane (following Reid et al. 1988). The pa-rameters Vexp, Vz0, Vrot, α and β were the five unknowns. For eachmaser and each position in the five-dimensional parameter space, wecompared the observed and calculated radial velocity V lsr and foundthe z-position where the absolute value of the residual was mini-mized (allowing the maser to lie anywhere along the z-axis, with adistance corresponding to 30 arcsec of IRc2). The five-dimensionalparameter space was searched, within a reasonable domain, using arandom number generator to sample the parameters. The position infive-parameter space where the sum of the (absolute) velocity resid-uals is minimized was thereby located. The best-fitting model hasthe parameter values given in Table 3. The angles correspond to arotation axis inclined at 58◦ to the line of sight with a position angleon the sky of −35◦. A disc at this orientation is plotted in Fig. 2,where it fits neatly inside the ‘hole’ in the OH maser distributionthat is centred on source I.
Using the kinematic model, we constructed views of the three-dimensional distribution of OH 1665-MHz masers, which are shownin Fig. 9. The masers lie in an irregularly filled torus, at radialdistances ranging from 430 to 13 200 au, with a mean radius of6200 au. There is a well defined inner cavity, of radius ∼1300 au.
Table 3. Parameters of kinematic model.
Parameter Search range Best fit
V exp 15–32 km s−1 21.0 ± 3.5 km s−1
V z0 8–10 km s−1 9.0 ± 0.5 km s−1
V rot 1–5 km s−1 2.9 ± 0.9 km s−1
α 0–180◦ 46◦ ± 22◦β 0–90◦ 48◦ ± 19◦
This cavity corresponds spatially with the SiO flared disc regionmapped by Wright et al. (1995) and Wright, Plambeck & Wilner(1996), which has a radial velocity range of −10 to +20 km s−1 thatis roughly consistent with the range of −12 to +30 km s−1 givenby our kinematic model. The distribution in the radial distance R′′
from the rotation axis is plotted in Fig. 10. The distribution in thez′′-direction, parallel to the rotation axis, has a full width at half-maximum of 6000 au, and a total extent of 12 000 au.
The best-fitting expansion velocity is similar to that of the ‘low-velocity outflow’ seen in H2O masers (Genzel et al. 1981). Solidbody rotation becomes the dominant motion beyond a distance of3240 au from the centre (a distance corresponding to 7.2 arcsec).Rotation is therefore the dominant motion for most of the system ofOH masers, with, however, a significant component of expansion.The rotational period in our model is 760 yr, while the expansion
C© 2006 The Authors. Journal compilation C© 2006 RAS, MNRAS 367, 541–552
Dow
nloaded from https://academ
ic.oup.com/m
nras/article/367/2/541/1011855 by guest on 08 January 2022
550 R. J. Cohen et al.
R" (arcsec)
0 5 10 15 20 25 30
Nu
mb
er
0
5
10
15
20
25
30
Figure 10. Radial distribution of the 1665-MHz OH masers about the discrotation axis, determined using the kinematic model (Section 4.1).
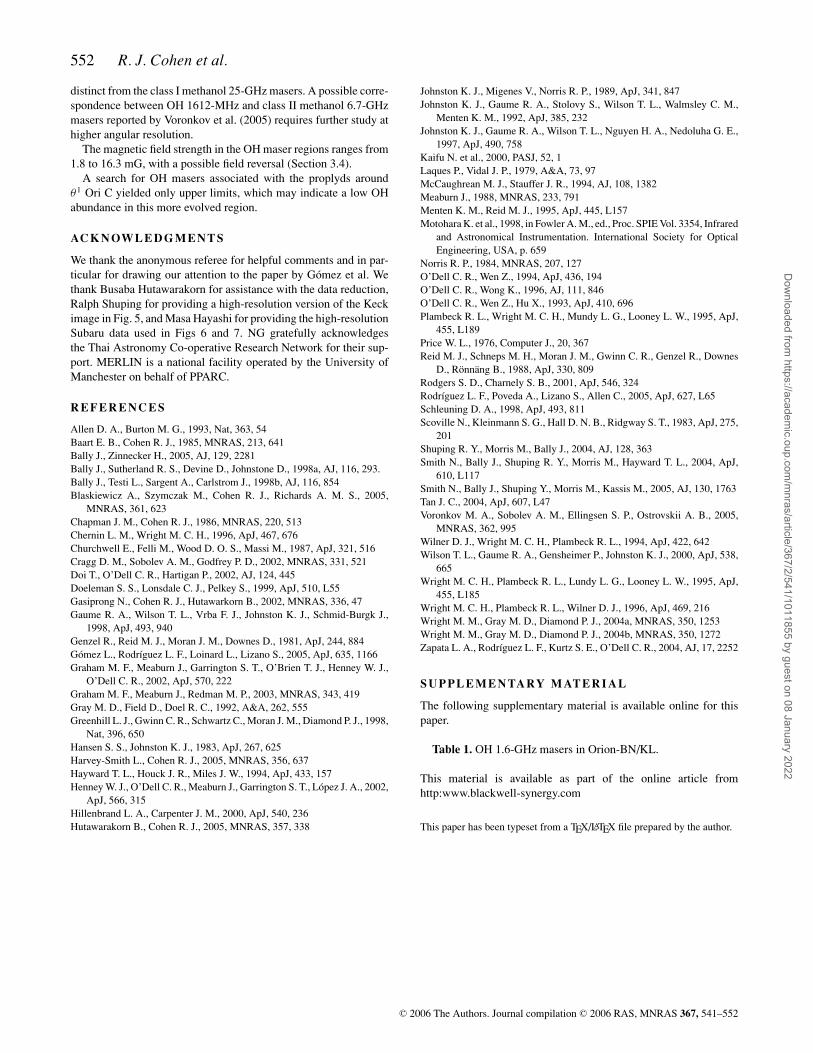
time-scale varies from ∼300 yr for the inner edge of the masercavity to ∼3000 yr for the masers most distant from the expansioncentre.
Most of the Orion nebula HH objects are found at the tips of theH2 ‘fingers’ in the bipolar outflow shown in Fig. 6 and appear tohave their origin in a newly created massive star that gives rise tothe infrared source IRc2 in the 105-L� Orion-BN/KL nebula in theOMC–1 cloud core. It has also been suggested that a minority ofthe prominent HH objects have their origin in the neighbouring star-forming region OMC–1S (Smith et al. 2004). However, excludingthese few, Doi, O’Dell & Hartigan (2002) have used the HubbleSpace Telescope (HST) proper-motion measurements of the globalexpansion of the system of Orion HH objects to demonstrate thatthe bipolar outflow is of Hubble type, that is, the flow velocity isproportional to distance from the expansion centre. The bipolar flowtherefore consists of ‘bullets’, all ejected around a 1000 yr ago in asingle explosive event. Thus the expansion time-scales determinedfor the OH masers bracket this H2 time-scale. These results suggestthat the OH maser disc acquired its expansional motions in the sameevent that produced the H2 bullets and the HH objects found at thetips of the H2 ‘fingers’ in the bipolar outflow shown in Fig. 7.
The orientation of the rotation axis determined here agrees withthat of the molecular outflow traced in CO and H2 (e.g. Chernin& Wright 1996; Kaifu et al. 2000). It also coincides with the di-rection of the proper motions of source I and BN, and is close tothe large-scale magnetic field direction inferred from far-infraredand submillimetre polarization (Schleuning 1998, and referencestherein).
We note that the velocities of the order of 20 km s−1 implied byour kinematic model correspond to proper motions ∼9 mas yr−1,which could be measured by MERLIN within 10 yr.
4.2 The nature of Stream A and Arc B
The major streams or arcs found in Orion-BN/KL have angular sizesgreater than 5 arcsec, corresponding to projected sizes of at least2250 au, which are almost unprecedented for interstellar OH masers.Stream A has no obvious counterpart in the infrared. However, itpoints in the direction of the dominant infrared source BN, in thedirection of the radio proper motions of BN and source I. StreamA has the appearance of a vapour trail that has formed in the wake
of the runaway star BN. From the proper motion of BN and theprojected separation from the Northern tip of Stream A, we caninfer a time-scale of 200 yr. This may correspond to a cooling time,a formation time for OH, or a time for population inversion to beestablished following the passage of BN.
Fig. 1 shows that the proper motions of BN and sources I and nproject back to a position on the sky near the base of Stream A, ina region largely clear of OH masers. This position is significantlydisplaced ∼4 arcsec north-west of the centre of the OH maser torus.It has been suggested that BN and sources I and n originally be-longed to a multiple stellar system that disintegrated ∼500 yr ago.The disintegration could have due to a close dynamical interaction,as suggested by Gomez et al. (2005), or it could have been due toa merger event that also produced the molecular outflow, as sug-gested by Bally & Zinnecker (2005). Alternatively, Tan (2004) hasproposed that BN was ejected from the θ 1 Ori C system ∼4000 yrago. Our data do not distinguish unambiguously between these pos-sibilities. However, the fact that the large-scale OH maser torus iscentred on source I slightly favours Tan’s scenario, with BN beinga passing runaway from the θ 1 Ori C system.
The other large-scale feature Arc B encloses IRc6, which is oneof the cooler MIR sources, with polarization that is consistent withexternal illumination and with no evidence of embedded bright stars(Shuping et al. 2004, and references therein). This suggests that ArcB might be associated with a photodissociation zone around IRc6.In further support of this there is strong emission from CH3CN atthe position of IRc6, implying densities of at least 106 cm−3 (Wilner,Wright & Plambeck 1994).
The large-scale maser structures found in Orion-BN/KL are sim-ilar in scale to OH maser structures recently reported in W3(OH).Wright, Gray & Diamond (2004a,b) noted several arcs of 18-cmmasers, which they interpreted as propagating shocks. Harvey-Smith & Cohen (2005) found a low-brightness filament of excitedOH 4765-MHz emission stretching for ∼2200 au and clearly re-lated in its morphology to some of the ground-state OH arcs at18-cm wavelength. The structures seen in Orion are similar in lin-ear scale. The individual maser spots in Stream A and Arc B arewell separated on the sky for the most part, but are neverthelesslikely to be simply the high-gain cores of an extended stream ofmaser emission. The typical flux densities of ∼0.1 Jy correspond tobrightness temperatures of at least ∼3 × 10⁵ K.
All these large-scale features in Orion and W3(OH) are relativelyweak and therefore below the sensitivities of earlier surveys, forthe most part. Deeper observations of other well-known OH masersources are needed to establish just how common such featuresare.
4.3 The 1612-MHz masers
The OH 1612-MHz masers have a more widespread distributionthan the other OH masers, and different kinematics (Section 3.2).This suggests that they trace a region with different physical condi-tions. Gray, Field & Doel (1992) give the following conditions forstrong 1612-MHz masers: molecular hydrogen density nH2 = 6×106 cm−3, nOH = 60 cm−3, gas kinetic temperature T k = 30 K, dusttemperature at maser site T d = 30 K, external radiation field T x =80 K and velocity shift �V = 2.0 km s−1. This is cooler than typicalfor OH masers, but is consistent with the location of these particu-lar 1612-MHz masers further than normal from the main source ofinfrared luminosity. The velocity gradient needed for strong maseraction is also consistent with the association of these masers withshocked gas in the molecular outflow (Section 3.3.2).
C© 2006 The Authors. Journal compilation C© 2006 RAS, MNRAS 367, 541–552
Dow
nloaded from https://academ
ic.oup.com/m
nras/article/367/2/541/1011855 by guest on 08 January 2022

OH maser disc and outflow in Orion-BN/KL 551
R A (2000) 05h35m s
13.013.514.014.515.015.516.0
Dec
(20
00)
-05
o2
2' ''
10
20
30
40
50
*
Meth 25 GHz
Meth 6.7 GHz
OH 1612L
OH 1612R*
7.3
7.5
7.9
7.2
18.9
7.67.6
18.9
7.67.6
-12.7
-4.0
-13.4
3.7
41.8
Figure 11. Positions and velocities of OH 1612-MHz masers (this paper)compared with those of the newly discovered methanol 6.7-GHz masers(Voronkov et al. 2005). Positions of 25-GHz methanol masers from Johnstonet al. (1997) and Johnston et al. (1992) are also shown. The radial velocitiesat 25 GHz are confined to a narrow range of 7–10 km s−1.
We note a further possible positional association between the1612-MHz masers and the methanol 6.7-GHz masers recently dis-covered by Voronkov et al. (2005). In Fig. 11, we show the posi-tions and velocities of the two species. There is a clear region ofoverlap centred around RA(J2000) = 05h35m14.s5, Dec.(J2000) =−05◦22′45.′′9 and V lsr = +7.5 km s−1. The 6.7-GHz positions haveerrors of ∼2 arcsec. It will be important to make 6.7-GHz mea-surements of higher precision to examine this correspondence moreclosely. The positions of 25-GHz masers from Johnston et al. (1992,1997) are also shown in the figure for completeness. Only one ofthese falls in the region of interest. We note that there is no asso-ciation with the OH mainline masers. This is consistent with the25-GHz masers being class I masers, which are thought to be colli-sionally pumped (cf. Cragg et al. 2002).
The 6.7-GHz maser transition is the prototype class II maser,usually thought to be radiatively pumped. The 6.7-GHz masers inOrion are, therefore, of interest because of their apparent associationwith 25-GHz masers. Voronkov et al. have considered the pumpingrequirements for the coexistence of both types of methanol maserand find that both types can occur simultaneously at low temper-ature (∼60 K) and low molecular hydrogen density (∼105 cm−3).These conditions are not too dissimilar to those needed for strong1612-MHz masers, as given earlier. In summary, it appears that inOrion we may have the first examples of both methanol class II andOH ground state masers located far from the main source of infraredluminosity, and associated instead with the interaction between themolecular outflow and the surrounding gas.
4.4 Proplyd region
The proplyds originally designated LV 1–6 within the Orion Trapez-ium cluster are those most likely to exhibit maser emission for theyare irradiated by the intense field of the O6.5 star θ 1 Ori C. Of these,LV 1, now resolved as a binary proplyd (168–326 north-west andsouth-east) by O’Dell & Wen (1994), and LV 2 (proplyd 167–317
of O’Dell & Wen 1994) have been most intensively observed byGraham et al. (2002) and Henney et al. (2002), respectively.
The 8 × 1014 cm radius LV 2 was shown by Henney et al. (2002)to be irradiated by a flux of 3 × 104 cm−2 s−1 Lyman photons. Theseproduce an ionized skin with a measured electron density n e = 2.6 ×106 cm−3 on the surface of a neutral disc or cocoon which envelopesthe low-mass YSO (Meaburn 1988). From 1.3-mm interferometricobservations, Bally et al. (1998b) deduced an upper limit to the massof molecular hydrogen in this neutral component of ∼0.015 M� togive an H2 density of no � 4.2 × 109 cm−3. On the other hand,simple pressure balance between the ionised and neutral gas withtemperatures of Te = 104 K and To = 103 K would give no ≈5.2 × 109 cm−3.
OH masers have yet to be found in regions of purely low-massstar formation. However, it is this dense, circumstellar moleculargas around proplyds, stimulated by photons from θ1 Ori C, that isthe potential source of any maser emission. We would expect tofind OH masers at a distance of ∼7 × 1017 cm from an O6.5 star(cf. Baart & Cohen 1985). However, if Keplerian motion aroundthe YSO occurs in this neutral cocoon, it will have a rotational ve-locity of 4 km s−1 at its outer edge with higher velocities towardsthe centre (proportional to radius−1/2). In these circumstances, thevelocity coherence required for strong maser amplification will oc-cur over a path length that is much smaller than the overall radiusof the proplyd. This, together with possible chemical effects (Sec-tion 3.5), could explain our non-detection of OH masers in thisregion.
5 C O N C L U S I O N S
The distribution of OH masers in the Orion-BN/KL region isfar more extensive than previously realized, covering a region of30-arcsec extent and a radial velocity range from −13 to +42 kms−1. The bulk of the emission can be modelled in terms of a rotat-ing and expanding torus, centred on IRc2 or radio source I, withan inner cavity of ∼1300 au radius. The rotation axis has the sameposition angle and inclination to the line of sight as the molecu-lar outflow and the large-scale magnetic field inferred from mil-limetre and submillimetre polarization (Section 4.1). The dynam-ical time-scale is similar to that of the explosive event that pro-duced the widespread shocked H2 emission. It is likely that theOH masers trace the interaction between the low-velocity molec-ular outflow and the molecular hot core, and that they acquiredtheir expansional motions in the same event that produced theoutflow.
Of particular interest is a string of masers, Stream A, at∼21 km s−1, that extends at position angle ∼ 45◦ between IRc2and BN, in the direction of the radio proper motions of these twodominant sources. We suggest that Stream A may have appeared,like a vapour trail, in the wake of the runaway star BN. The propermotions of BN and sources I and n project back to the base of StreamA (Fig. 1), ∼4 arcsec north-west of the centre of the OH maser torus,a position that is largely devoid of masers.
The 1612-MHz masers have a more widespread distribution thanthe other OH masers, with kinematics that are more like those of theH2O masers associated with the outflow. Many of these 1612-MHzmasers are spatially associated with fingers of shocked H2 emis-sion (Fig. 7). These OH masers are thought to require relatively lowgas and dust temperatures for their inversion (Section 4.3). Apartfrom the OH 1612-MHz masers, the other OH masers have comple-mentary distributions and kinematics to the H2O masers (Figs 1–4),with essentially no overlap. OH is also spatially and kinematically
C© 2006 The Authors. Journal compilation C© 2006 RAS, MNRAS 367, 541–552
Dow
nloaded from https://academ
ic.oup.com/m
nras/article/367/2/541/1011855 by guest on 08 January 2022
552 R. J. Cohen et al.
distinct from the class I methanol 25-GHz masers. A possible corre-spondence between OH 1612-MHz and class II methanol 6.7-GHzmasers reported by Voronkov et al. (2005) requires further study athigher angular resolution.
The magnetic field strength in the OH maser regions ranges from1.8 to 16.3 mG, with a possible field reversal (Section 3.4).
A search for OH masers associated with the proplyds aroundθ1 Ori C yielded only upper limits, which may indicate a low OHabundance in this more evolved region.
AC K N OW L E D G M E N T S
We thank the anonymous referee for helpful comments and in par-ticular for drawing our attention to the paper by Gomez et al. Wethank Busaba Hutawarakorn for assistance with the data reduction,Ralph Shuping for providing a high-resolution version of the Keckimage in Fig. 5, and Masa Hayashi for providing the high-resolutionSubaru data used in Figs 6 and 7. NG gratefully acknowledgesthe Thai Astronomy Co-operative Research Network for their sup-port. MERLIN is a national facility operated by the University ofManchester on behalf of PPARC.
R E F E R E N C E S
Allen D. A., Burton M. G., 1993, Nat, 363, 54Baart E. B., Cohen R. J., 1985, MNRAS, 213, 641Bally J., Zinnecker H., 2005, AJ, 129, 2281Bally J., Sutherland R. S., Devine D., Johnstone D., 1998a, AJ, 116, 293.Bally J., Testi L., Sargent A., Carlstrom J., 1998b, AJ, 116, 854Blaskiewicz A., Szymczak M., Cohen R. J., Richards A. M. S., 2005,
MNRAS, 361, 623Chapman J. M., Cohen R. J., 1986, MNRAS, 220, 513Chernin L. M., Wright M. C. H., 1996, ApJ, 467, 676Churchwell E., Felli M., Wood D. O. S., Massi M., 1987, ApJ, 321, 516Cragg D. M., Sobolev A. M., Godfrey P. D., 2002, MNRAS, 331, 521Doi T., O’Dell C. R., Hartigan P., 2002, AJ, 124, 445Doeleman S. S., Lonsdale C. J., Pelkey S., 1999, ApJ, 510, L55Gasiprong N., Cohen R. J., Hutawarkorn B., 2002, MNRAS, 336, 47Gaume R. A., Wilson T. L., Vrba F. J., Johnston K. J., Schmid-Burgk J.,
1998, ApJ, 493, 940Genzel R., Reid M. J., Moran J. M., Downes D., 1981, ApJ, 244, 884Gomez L., Rodrıguez L. F., Loinard L., Lizano S., 2005, ApJ, 635, 1166Graham M. F., Meaburn J., Garrington S. T., O’Brien T. J., Henney W. J.,
O’Dell C. R., 2002, ApJ, 570, 222Graham M. F., Meaburn J., Redman M. P., 2003, MNRAS, 343, 419Gray M. D., Field D., Doel R. C., 1992, A&A, 262, 555Greenhill L. J., Gwinn C. R., Schwartz C., Moran J. M., Diamond P. J., 1998,
Nat, 396, 650Hansen S. S., Johnston K. J., 1983, ApJ, 267, 625Harvey-Smith L., Cohen R. J., 2005, MNRAS, 356, 637Hayward T. L., Houck J. R., Miles J. W., 1994, ApJ, 433, 157Henney W. J., O’Dell C. R., Meaburn J., Garrington S. T., Lopez J. A., 2002,
ApJ, 566, 315Hillenbrand L. A., Carpenter J. M., 2000, ApJ, 540, 236Hutawarakorn B., Cohen R. J., 2005, MNRAS, 357, 338
Johnston K. J., Migenes V., Norris R. P., 1989, ApJ, 341, 847Johnston K. J., Gaume R. A., Stolovy S., Wilson T. L., Walmsley C. M.,
Menten K. M., 1992, ApJ, 385, 232Johnston K. J., Gaume R. A., Wilson T. L., Nguyen H. A., Nedoluha G. E.,
1997, ApJ, 490, 758Kaifu N. et al., 2000, PASJ, 52, 1Laques P., Vidal J. P., 1979, A&A, 73, 97McCaughrean M. J., Stauffer J. R., 1994, AJ, 108, 1382Meaburn J., 1988, MNRAS, 233, 791Menten K. M., Reid M. J., 1995, ApJ, 445, L157Motohara K. et al., 1998, in Fowler A. M., ed., Proc. SPIE Vol. 3354, Infrared
and Astronomical Instrumentation. International Society for OpticalEngineering, USA, p. 659
Norris R. P., 1984, MNRAS, 207, 127O’Dell C. R., Wen Z., 1994, ApJ, 436, 194O’Dell C. R., Wong K., 1996, AJ, 111, 846O’Dell C. R., Wen Z., Hu X., 1993, ApJ, 410, 696Plambeck R. L., Wright M. C. H., Mundy L. G., Looney L. W., 1995, ApJ,
455, L189Price W. L., 1976, Computer J., 20, 367Reid M. J., Schneps M. H., Moran J. M., Gwinn C. R., Genzel R., Downes
D., Ronnang B., 1988, ApJ, 330, 809Rodgers S. D., Charnely S. B., 2001, ApJ, 546, 324Rodrıguez L. F., Poveda A., Lizano S., Allen C., 2005, ApJ, 627, L65Schleuning D. A., 1998, ApJ, 493, 811Scoville N., Kleinmann S. G., Hall D. N. B., Ridgway S. T., 1983, ApJ, 275,
201Shuping R. Y., Morris M., Bally J., 2004, AJ, 128, 363Smith N., Bally J., Shuping R. Y., Morris M., Hayward T. L., 2004, ApJ,
610, L117Smith N., Bally J., Shuping Y., Morris M., Kassis M., 2005, AJ, 130, 1763Tan J. C., 2004, ApJ, 607, L47Voronkov M. A., Sobolev A. M., Ellingsen S. P., Ostrovskii A. B., 2005,
MNRAS, 362, 995Wilner D. J., Wright M. C. H., Plambeck R. L., 1994, ApJ, 422, 642Wilson T. L., Gaume R. A., Gensheimer P., Johnston K. J., 2000, ApJ, 538,
665Wright M. C. H., Plambeck R. L., Lundy L. G., Looney L. W., 1995, ApJ,
455, L185Wright M. C. H., Plambeck R. L., Wilner D. J., 1996, ApJ, 469, 216Wright M. M., Gray M. D., Diamond P. J., 2004a, MNRAS, 350, 1253Wright M. M., Gray M. D., Diamond P. J., 2004b, MNRAS, 350, 1272Zapata L. A., Rodrıguez L. F., Kurtz S. E., O’Dell C. R., 2004, AJ, 17, 2252
S U P P L E M E N TA RY M AT E R I A L
The following supplementary material is available online for thispaper.
Table 1. OH 1.6-GHz masers in Orion-BN/KL.
This material is available as part of the online article fromhttp:www.blackwell-synergy.com
This paper has been typeset from a TEX/LATEX file prepared by the author.
C© 2006 The Authors. Journal compilation C© 2006 RAS, MNRAS 367, 541–552
Dow
nloaded from https://academ
ic.oup.com/m
nras/article/367/2/541/1011855 by guest on 08 January 2022

![MNRAS ATEX style file v3arXiv:2003.12757v2 [astro-ph.GA] 7 Aug 2020 MNRAS 000, 1–20 (2020) Preprint 10 August 2020 Compiled using MNRAS LATEX style file v3.0 The influence of](https://static.fdocuments.us/doc/165x107/5fcb816909eeeb64ec544122/mnras-atex-style-ile-v3-arxiv200312757v2-astro-phga-7-aug-2020-mnras-000.jpg)


![IPD/Bim Thesis Proposal - engr.psu.edu · [IPD/BIM THESIS PROPOSAL] Jason Brognano, Michael Gilroy, Stephen Kijak, David Maser December 6, 2010 KGB Maser KGB Maser| BIM/IPD Thesis](https://static.fdocuments.us/doc/165x107/605d339025f9181d960e06e8/ipdbim-thesis-proposal-engrpsuedu-ipdbim-thesis-proposal-jason-brognano.jpg)