HYDROLOGY PROJECT (SW)€¦ · water resources department hydrology project (sw) status report on...
136
GOVERNMENT OF MAHARASHTRA WATER RESOURCES DEPARTMENT HYDROLOGY PROJECT (SW) STATUS REPORT ON WATER QUALITY OF WATER BODIES AND GROUND WATER IN MAHARASHTRA FOR THE YEAR 2004-2005 JANUARY 2007 Chief Engineer Hydrology Project, Nashik
Transcript of HYDROLOGY PROJECT (SW)€¦ · water resources department hydrology project (sw) status report on...
GOVERNMENT OF MAHARASHTRA WATER RESOURCES DEPARTMENT
HYDROLOGY PROJECT (SW)
STATUS REPORT
ON WATER QUALITY OF WATER BODIES AND
GROUND WATER IN MAHARASHTRA FOR THE YEAR 2004-2005
JANUARY 2007
Chief Engineer
Hydrology Project, Nashik

2
Status Report
On Water Quality Of Water Bodies And Ground Water In Maharashtra For The Year 2004-2005
I N D E X
Chapter Particulars Pages
I Executive Summary 4-8
II Introduction 9-11
III Water Bodies and Water Pollution 12-17
IV Integrated approach for water quality
monitoring
18-26
V Legal Facets 27-37
VI Water Quality Monitoring in Maharashtra 38-52
VII Results and conclusions 53-87
VIII Recommendations / Remedial Measures 88-89
IX Annexure 90-136

3
Preface "Water" is a prime natural resource and is considered as a precious national asset. It is a
major constituent of all living beings. Water is available in two basic forms i.e. Surface water
and Ground water. Water is used for various purposes ranging from domestic, agricultural,
industrial & allied purposes. The water quality criteria have been prepared by taking into
consideration various designated uses. In order to assess the quality of water, various
government agencies are working at National and State levels.
This report includes water quality data analysed in Maharashtra State by various National
and State level agencies appointed by the committee under "Water Quality Assessment
Authority". The data has been interpreted to know the affected locations. The report also
includes details of water bodies, agencies analyzing water quality, legal aspects in terms of
various Central and State government acts and standards specified for water quality
assessment along with recommendations for maintaining the wholesomeness of surface as
well as ground water. The list of references is attached at the end of report.
This Status Report is an outcome of keen interest shown by Er.V.V.Gaikwad, Secretary
(WR) and Er.E.B.Patil, Secretary (CAD),Water Resources Department, Government of
Maharashtra in the preparation of such document, which promoted the inspiration and
enthusiasm needed for its preparation.
My sincere thanks to various State and Central level water quality assessing agencies and
concerned authorities for getting analyzed and submitting necessary data from time to time.
My special thanks to Water Quality Review Committee of State for inspiring me to have in
the present form. I express my thanks to the officers of Hydrology Project (SW), Nashik
compiling this report from various National & State level agencies.
I hope this report will play a vital role in creating awareness regarding water quality through-
out the State and become important reference material for administrative and educational
institutions.
This Status Report is submitted to the Chairman of Water Quality Review Committee,
Government of Maharashtra for further needful. Suggestions thereof, if any, can be taken in
to consideration while preparing next Status Report.
(H.T.Mendhegiri)
Chief Engineer
Hydrology Project,
Nashik (Maharashtra)

4
CHAPTER – I
EEXXEECCUUTTIIVVEE SSUUMMMMAARRYY
Status Report on Water Quality of Water Bodies and ground
water in Maharashtra
for the year 2004-2005
1.1 Preamble:
In exercise of powers conferred by sub sections (1) and (3) of section 3 of the Environment
(Protection) Act, 1986 (29 of 1986), the central government constituted an authority to be
known as “Water Quality Assessment Authority”. This authority is empowered to draw
action plans for quality improvement in water bodies and monitor and review/assess
implementation of the schemes launched or to be launched, to review the status of quality of
national water resources (both surface and ground water) and identify “Hot spots” for taking
necessary action for improvement in water quality, to constitute/set up state level Water
Quality Review Committee (WQRC) to coordinate the work to be assigned to such
committees. The Water Quality Review Committee for Maharashtra was constituted on
01/01/2003 under the chairmanship of Secretary Water Resources Department In order to
perform aforesaid task, a uniform protocol was formulated called as ‘Uniform Protocol on
Water Quality Monitoring Order, 2005’ vide gazette notification dated 17th
June 2005. The
4th
meeting of State Level Water Quality Review Committee of Maharashtra State was held
on 17/10/2005 at Mantralaya, Mumbai. During this meeting, it was suggested that data from
all the participating agencies in Water Quality Review Committee may be analysed for the
designated use of water prescribed in relevant BIS code, by the Chief Engineer Hydrology
Project, Nashik and status report (titled as Status Report on Water Quality of Water Bodies in
Maharashtra State) on analysis may be prepared for the year. Subsequently the historical data
on water quality can also be analysed to observe trend of changes in water quality that has
occurred to time to time. It was accordingly decided that water quality data of the year 2004-
2005 will be sent by all participating agencies to the Chief Engineer (Hydrology Project) for
preparation of status report.

5
1.2 Water:
An odourless, tasteless, colourless liquid formed by a combination of hydrogen and oxygen;
forms streams, lakes, and seas, and is a major constituent of all living matter.
1.3 Water bodies:
The part of the earth's surface covered with water such as rivers, lakes, ponds, reservoirs and
oceans etc. are described as water bodies.
1.4 Water is ‘life’. It is one of the fundamental needs on the globe. Water is probably the
only natural resource to touch all aspects of human civilization from agricultural and
industrial development to cultural and religious values embedded in society.
1.5 The total water amount on the earth is about 1.35 billion cubic kilometers. About 97.1 %
has been locked into oceans as saltwater. Ice sheets and glaciers have arrested 2.1 %. Only
0.2 % is the fresh water present on the earth, which can be used by human for variety of
purposes. Remaining 0.6 % is in underground form. But unfortunately it has been getting
polluted day by day due to different anthropogenic activities. So it is burning need, to
conserve the water and prevent it from every type of pollution. There should be proper water
quality investigation and management. This could be possible by continuous Water Quality
Monitoring.
1.6 Ground water has been the primary source of water supply for domestic, agricultural and
industrial uses in Maharashtra. It is the single largest and most readily available source of
irrigation and more than 55% of the total area under irrigation depends on ground water
sources. Nearly 70% of rural water supplies are based on ground water. Thus ground water
plays a very important role in the state’s economy and therefore needs to be monitored
scientifically both in terms of quality and quantity, for sustainable development and
management.
The entire geographical area of Maharashtra is occupied by 5 major river basins namely,
Godavari, Krishna, Tapi, Narmada and West flowing rivers in Konkan coastal strip. About
75% area of Maharashtra is drained towards Eastern side, further joining with Bay of Bengal.
The West flowing coastal rivers join the Arabian Sea.
The total surface water available for utilisation is 1,25,936 MCM

6
1.7 Water Quality Monitoring Agencies:
The Water Quality Monitoring is carried out by various agencies viz. Central Water
Commission, Central Pollution Control Board, Maharashtra Jeevan Pradhikaran,
Groundwater Surveys & Development Agency, Hydrology Project, Maharashtra Pollution
Control Board, Central Ground Water Board, Directorate of Irrigation Research and
Development (DIRD).
1.7.1 In Maharashtra, Hydrology Project of Water Resources Department, Government of
Maharashtra is monitoring 127 stations for surface water (Baseline -50, Trend -65 and Flux -
12 nos.). Groundwater Surveys and Development Agency has monitored 1871 ground water
stations. Central Ground Water Board has monitored 803 stations. Maharashtra Pollution
Control Board is monitoring 73 stations for water (River - 45, Creek- 3 and 25 well water
stations.). Central Water Commission has monitored river water quality at 12 stations. Total
number of surface water monitoring stations is 187, whereas total number of ground water
monitoring stations is 2699.
1.8 Water Quality Analysis for SW
The critical locations among the rivers Godavari, Tapi, Bhima, Krishna, Wardha, Wainganga
and Ulhas are Takli (Nashik), on Godawari, Sukvad & Sarangkheda on Tapi Bundgarden
(Pune), on Mula-Mutha, Pandharpur on Bhima ,Sangli on Krishna, Dhabha & Kamthikhairi
on Wainganga and Manda Ulhas respectively considering the parameters namely pH, DO,
BOD and Hardness. The maximum pH has been noted at Sarangkheda as 8.6. Dissolved
Oxygen has noted minimum at Bundgarden as 1.2 mg/L. BOD and Hardness are found to be
maximum at Manda as 71.7 mg/L and 1138 mg/L respectively.
Water Quality monitored during period January 2005 to September 2005, shows that pH is
maximum (8.6) at village Ajanad on Tapi River. Average BOD is maximum (22.9 mg/L) at
Mahim Creek on Mahim Bay. Average DO is least (3 mg/L) at Mahim Creek. Average
Coliform density is maximum (2878 MPN/100 ml) at Nanded on Godavari River.
1.9 Water Quality Analysis for GW
Ground water samples were collected from 1871 wells during January – December 2004. After
analysis, the following conclusions are drawn:
The maximum pH has been noted at village Ajnale (taluka Sangola, dist Solapur), Yellur

7
(taluka Walva, dist Sangli), Palaspur (taluka Himayatnagar, dist Nanded) as 10.2. The
maximum TDS is 6528 mg/L at village Hirapur, taluka Georai from Beed district. Total
Hardness is found to be maximum as 2720 mg/L at village Pujarwadi, taluka Atpadi from
Sangli district. The maximum alkalinity is noted at village Pangaon, taluka Barshi from
Solapur district as 1000 mg/L. Calcium has been found to be maximum at village Pujarwadi,
taluka Atpadi from Sangli district as 944 mg/L. The maximum Sodium is 1530 mg/L at
village Shinganapur, taluka Daryapur from Amravati district. The iron concentration is noted
maximum at village Sonawade, taluka Kudal from Sindhudurga district as 6.1 mg/L. Total 54
well water samples have iron concentration more than 1.0 mg/L. Chloride is noted maximum
at village Shinganapur, taluka Daryapur from Amravati district as 2673 mg/L. The maximum
Sulphate is noted at village Kalkhed, taluka Shegaon from Buldhana district as 1848 mg/L.
The nitrate is maximum at village Muthad, taluka Bhokardan from Jalna district 239 mg/L,
which is 9 times greater than BIS standards. Total 319 well water sources have exceeded the
BIS prescribed limit. Fluoride is found to be maximum at village Mop, taluka Risod from
Washim district as 6.0 mg/L. Total 56 well water samples have fluoride concentration more
than 1.5 mg/L
Ground water quality monitoring was carried at 1005 stations spread all over Maharashtra.
From the data it is concluded that:
The electrical conductivity is found to maximum at village Akola from Akola district as 6200
µmhos/cm. The maximum TDS has been noted at village Manjur from Ahmednagar district as
3920 mg/L. Total Hardness is maximum at village Shegaon from Buldhana district as 2305
mg/L. Calcium is found to be maximum at village Jafrabad from Jalna district as 680 mg/L.
The maximum Magnesium is noted at village Sadawan Bk. from Jalgaon district as 333 mg/L.
The maximum Sodium is noted at village Bhatkulijain from Amravati district as 1052 mg/L.
Potassium has been found to be maximum at village Kukadgaon from Osmanabad district as
323 mg/L. The maximum Chloride is noted as 1911 mg/L at village Dapoli from Raigad
district. Sulphate is found to be maximum at village Manjur from Ahmednagar district as 1771
mg/L. The maximum Nitrate is found at village Sadawan Bk from Jalgaon district as 899
mg/L. Fluoride concentration has found to be maximum at village Daodipar Khapa from
Bhandara district as 4.2 mg/L.
8
1.10 Recommendations/Remedial Measures:
1.10.1 Qualitative/Technical: � Domestic effluents may be treated and disinfected before discharging.
� Effluents from the non-point sources may be identified. These are required to be
collected and treated.
� The artificial recharge of ground water through integrated watershed management
programme and rainwater harvesting will help to improve the ground water quality in
the area where the problem exists.
1.10.2 Administrative: � Non-industrial activities such as Effluent Treatment Plants, Composting,
Vermiculture, Animal stalls, Cattle and Goat pens, Animal husbandry, Fish farming,
Dumping of ash, Solid waste may not be allowed in ‘No Development Zone’ (3 km
on either side of river) of A-I stretch of river. (source to first dam)
� No industries may be allowed in ‘No Development Zone’. Industries are to be set up
at distances specified by Pollution Control Board. River policy criteria (MPCB) may
to be fulfilled.
� Measures for sustainable use of water resource are necessary.
� Farmers in the catchment area shall be educated against use of extensive amount of
pesticides and chemical fertilizers. They shall be encouraged to use organic manure.
� Besides the regular ground water quality monitoring, special studies shall be
undertaken on micro-level basis where ground water quality has undergone
deterioration to ascertain the reasons, extent and remedial measures thereafter.
� The lack of facilities and awareness for proper disposal of waste and wastewater is
mainly causing the ground water quality deterioration in the state. Hence, it is
suggested that people in the rural and urban parts of the state should be made aware
about the pollution of the ground water and its impacts. Strict regulations must be
observed to stop pollution of ground water.
� Farmers may be encouraged to use advanced irrigation system like drip irrigation in
order to conserve water and prevent erosion of top soil.
1.10.3 Legal:
� Environmental Impact Assessment studies shall be carry out for of all developmental
projects right from planning stage and integrate it with their cost benefit
considerations.
� Legislative measures are must to check over exploitation of ground water for various
uses.
1.11 Suggestions: � Create mass awareness in general public regarding surface and ground water quality
aspects.
� Water quality status report shall be publicly published every year.

9
CHAPTER – II
IINNTTRROODDUUCCTTIIOONN
2.00 General In exercise of powers conferred by sub sections (1) and (3) of section 3 of the Environment
(Protection) Act, 1986 (29 of 1986), the central government constituted an authority to be
known as “Water Quality Assessment Authority”. This authority is empowered to draw
action plans for quality improvement in water bodies and monitor and review/assess
implementation of the schemes launched or to be launched, to review the status of quality of
national water resources (both surface and ground water) and identify “Hot spots” for taking
necessary action for improvement in water quality, to constitute/set up state level Water
Quality Review Committee (WQRC) to coordinate the work to be assigned to such
committees. The Water Quality Review Committee for Maharashtra was constituted on
01/01/2003 under the chairmanship of Secretary Water Resources Department In order to
perform aforesaid task, a uniform protocol was formulated called as ‘Uniform Protocol on
Water Quality Monitoring Order, 2005’ vide gazette notification dated 17th
June 2005. The
4th
meeting of State Level Water Quality Review Committee of Maharashtra State was held
on 17/10/2005 at Mantralaya, Mumbai. During this meeting, it was suggested that data from
all the participating agencies in Water Quality Review Committee may be analysed for the
designated use of water prescribed in relevant BIS code, by the Chief Engineer Hydrology
Project, Nashik and status report (titled as Status Report on Water Quality of Water Bodies in
Maharashtra State) on analysis may be prepared for the year 2004-2005. Subsequently the
historical data on water quality can also be analysed to observe trend of changes in water
quality that has occurred to time to time. It was accordingly decided that water quality data of
the year 2004-2005 would be sent by all participating agencies to the Chief Engineer
(Hydrology Project) for preparation of status report.
Water is ‘life’. It is one of the fundamental needs on the globe. Water is essential for variety
of purposes to human beings as well as to plants and animals. Its many uses include drinking
and other domestic uses, irrigation, power generation, transportation, industrial cooling,
fishing, mining and fire fighting etc.
Water is probably the only natural resource to touch all aspects of human civilization from
agricultural and industrial development to cultural and religious values embedded in society.
‘Water Quality’ term is generally used to express the physical, chemical or biological state of
water. This in turn, may be related to the suitability of water for a particular use or purpose.

10
The quality of water is characterized by a range of physical, chemical and biological
parameters, which arise from a variety of natural and human influences. Normally field or
laboratory analysis of water is carried out for determination of its quality.
Normally water is never pure in a chemical sense. It always contains impurities of various
kinds dissolved as well as suspended. These include dissolved gases like CO2, H2S, NH3 and
N2, dissolved minerals Ca, Mg and Na salts, suspended matter, clay, silt, sand and even
microbes. The natural impurities in water are in very low concentration, which are derived
from atmosphere and soil. These impurities do not pollute water and the same is potable.
Contamination of water is certainly one of the key issues, as it can prevent water from being
used for its intended purpose. Contamination can enter the water bodies through one or more
of the following ways:
• Direct point sources: Transfer of pollutants from municipal, industrial liquid waste
disposal sites, from municipal and household hazardous waste and refuses disposal
sites.
• Diffuse agricultural sources: Wash off and soil erosion from agricultural lands carrying
materials applied during agricultural use, mainly fertilizers, herbicides and pesticides.
• Diffuse urban sources: Runoff from city streets, from horticultural, gardening and
commercial activities in the urban environment and from industrial sites.
2.1 Necessity of Water Quality Monitoring
Earth is also called as ‘blue planet’ because 70 % area of it has been covered by water
resource. The total water amount on the earth is about 1.35 billion cubic kilometers. About
97.1 % has been locked into oceans as saltwater. Ice sheets and glaciers have arrested 2.1 %.
Only 0.2 % is the fresh water present on the earth, which can be used by human for variety of
purposes. Remaining 0.6 % is in underground form.
But unfortunately it has been getting polluted day by day due to different anthropogenic
activities. So it is burning need, to conserve the water and prevent it from every type of
pollution. There should be proper water investigation and management. This could be
possible by continuous Water Quality Monitoring.
Ground water use has grown spirally with population growth and agro industrial
development during last two decades. More than 70% of the rural water supply schemes in

11
the state are based on ground water. Similarly, out of total irrigated area in the state, more
than 55% area is irrigated by ground water. Thus ground water plays a very important role in
the state’s economy and therefore needs to be monitored scientifically both in terms of
quality and quantity, for sustainable development and management.
In order to manage water as prime natural resource, a basic human need and a precious
national asset and to maintain its wholesomeness by way of planning, development &
pollution control, Govt. of India passed National Water Policy under the auspices of Ministry
of Water Resources, Govt. of India New Delhi in April 2002.The policy included various
facets viz. Need for a National Water Policy, Information system, Water resources planning,
Institutional Mechanism, Water allocation priorities, Project planning, Ground water
development, Drinking water, Irrigation, Resettlement & Rehabilitation, Financial &
Physical sustainability, Participatory approach to Water Resources Management, Private
sector participation, Water quality, Water zoning, Conservation of water, Flood control and
Management, Land erosion by sea or river, Drought prone area development, Monitoring of
projects, Water sharing / distribution amongst the states, Performance improvement,
Maintenance and Modernisation, Safety of structures, Science & technology, Training &so
on.
In pursuance of a directive contained in the National Water Policy 2002 and
recommendations of the Maharashtra Water and Irrigation Commission, the Government
announced the Maharashtra State Water Policy in July 2003. This path breaking policy will
determine the manner in which the planning, development and management of water
resources are going to be carried out during the coming 20 years. The state water policy
provides for regularly monitoring of surfaces and ground water quality .
2.2 Legal status of water quality monitoring in Maharashtra
State
In Maharashtra, water quality is monitored by various agencies namely Hydrology Project
(SW), Groundwater Surveys & Development Agency (GSDA), Central Pollution Control
Board (CPCB) through Maharashtra Pollution Control Board (MPCB), Central Water
Commission (CWC), Central Ground Water Board (CGWB, NHNS) as per provisions made
by “Water Quality Assessment Authority” constituted under sub sections (1) and (3) of
section 3 of the Environment (Protection) Act, 1986 (29 of 1986).

12
CHAPTER – III
WWAATTEERR BBOODDIIEESS AANNDD WWAATTEERR PPOOLLLLUUTTIIOONN
3.1 Introduction
Water: An odourless, tasteless, colourless liquid formed by a combination of hydrogen and
oxygen; forms streams, lakes, and seas, and is a major constituent of all living matter.
Water bodies: The part of the earth's surface covered with water such as rivers, lakes, ponds,
reservoirs and oceans etc. are described as water bodies.
There are several transitional forms of water bodies. The most important transitional water
bodies are:
• Flood plains: intermediate between lakes and rivers with seasonal variability.
• Reservoirs: intermediate between rivers and lakes depending upon seasonal pattern of
operation in relation to the river discharges.
• Marshes: intermediate between lakes and phreatic aquifers.
• Alluvial and karstic aquifers: intermediate between rivers and ground water.
The hydrodynamic characteristics of each type of water body are highly dependent on the
size of the water body and on the climatic conditions in the drainage basin.
Water Pollution: The addition of any substance to water, changes its physical, chemical and
biological characteristics, which may produce harmful effect on human beings, animals and
plants.
Water pollution has many sources, which are illustrated as follows:
� Domestic sewage: It refers to the waste water that is discarded from households.
Also referred to as sanitary sewage, this is one of the major constituent of water
pollution. Sewage contains a wide variety of dissolved and suspended impurities. The
main organic materials are food and vegetable waste; plant nutrients come from
chemical soaps, washing powders, etc. Domestic sewage is also very likely to contain
disease-causing microbes.

13
� Industrial effluents: Wastewater from manufacturing or chemical processes in
industries contributes to water pollution. Industrial waste water contains thousands of
chemical compounds, which are very toxic; like heavy metals, producing very
deleterious effect on aquatic life. It also affects humans, animals, plants and microbes.
During the last fifty years, the number of industries in India has grown rapidly.
� Agricultural runoff: The use of land for agriculture and the practices followed in
cultivation greatly affect the quality of groundwater. Intensive cultivation of crops
causes chemicals from fertilizers (e.g. nitrate) and pesticides to seep into the
groundwater, a process commonly known as leaching. Routine applications of
fertilizers and pesticides for agriculture and indiscriminate disposal of industrial and
domestic wastes are increasingly being recognized as significant sources of water
pollution.
Effects of water pollution
The effects of water pollution are not only devastating to people but also to animals, fish, and
birds. Polluted water is unsuitable for drinking, recreation, agriculture and industrial
purposes. It diminishes the aesthetic quality of lakes and rivers. More seriously,
contaminated water destroys aquatic life and reduces its reproductive ability. Eventually, it is
a hazard to human health. Nobody can escape the effects of water pollution.
3.2 Water Pollution Related Phenomenon
Eutrophication: When fresh water is artificially supplemented with nutrients, it results in an
abnormal increase in the growth of water plants. This is known as eutrophication. The
discharge of waste from industries, agriculture and urban communities into water bodies
generally stretches the biological capacities of aquatic systems. Chemical run-off from fields
also adds nutrients to water. Excess nutrients cause the water body to become choked with
organic substances and organisms. When organic matter exceeds the capacity of the micro-
organisms in water that break down and recycle the organic matter, it encourages rapid
growth, or blooms, of algae. When they die, the remains of the algae add to the organic
wastes already in the water; eventually, the water becomes deficient in oxygen. Anaerobic
organisms (those that do not require oxygen to live) then attack the organic wastes, releasing
gases such as methane and hydrogen sulphide, which are harmful to the oxygen requiring
(aerobic) forms of life. The result is a foul-smelling, waste-filled body of water.

14
Bioaccumulation and Biomagnification: The process of biomagnification and
bioaccumulation are extremely important in the distribution of toxic substance in the fresh
water ecosystem. The concentration of pollutants within the organism due to
bioaccumulation and biomagnification depends on the duration of exposure of the organism
to the contaminated environment and its tropic level in the food chain. Several fold increases
in trace contaminant concentrations have been commonly observed in lakes and estuarine
environments.
Acidification: One of the major issues related to freshwaters is acidification. This is
associated with the deposition of rainwater and particulates enriched in mineral acids. Acidic
water causes unpleasant effect on phytoplankton, zooplankton as well as on the whole
aquatic life.
3.3 Surface Water
3.3.1 Rivers
Water is life and rivers are lifelines. Fortunately almost the entire country is criss-crossed by
rivers. There are thirteen major river basins in the country, which occupy 83 % of total
drainage basins, contribute 85 % of total surface flow and house 80% of the country’s
population. They are Bramhaputra, Ganga, Indus, Godavari, Krishna, Narmada , Cauvery,
Tapi, Pennar, Mahanadi, Brahmini & Baitarni, Sabarmati and Mahi. There are also eight
other basins formed by grouping together a number of medium and minor basins. All the
major river basins are not perennial. Only 4 of the 13 major basins possess areas of high
rainfall i.e. Brahmaputra, Ganga, Mahanadi and Brahmini having annual average discharge
of a minimum of 0.47 million cubic meter per km2
and they are perennial. There are a few
desert rivers, which flow for some distance and are lost in the desert.
3.3.2 River Basins in Maharashtra
Geographical area of the state is divided in five river basins viz. Godavari. Tapi, Narmada,
Krishna and west flowing rivers in Konkan region.
15
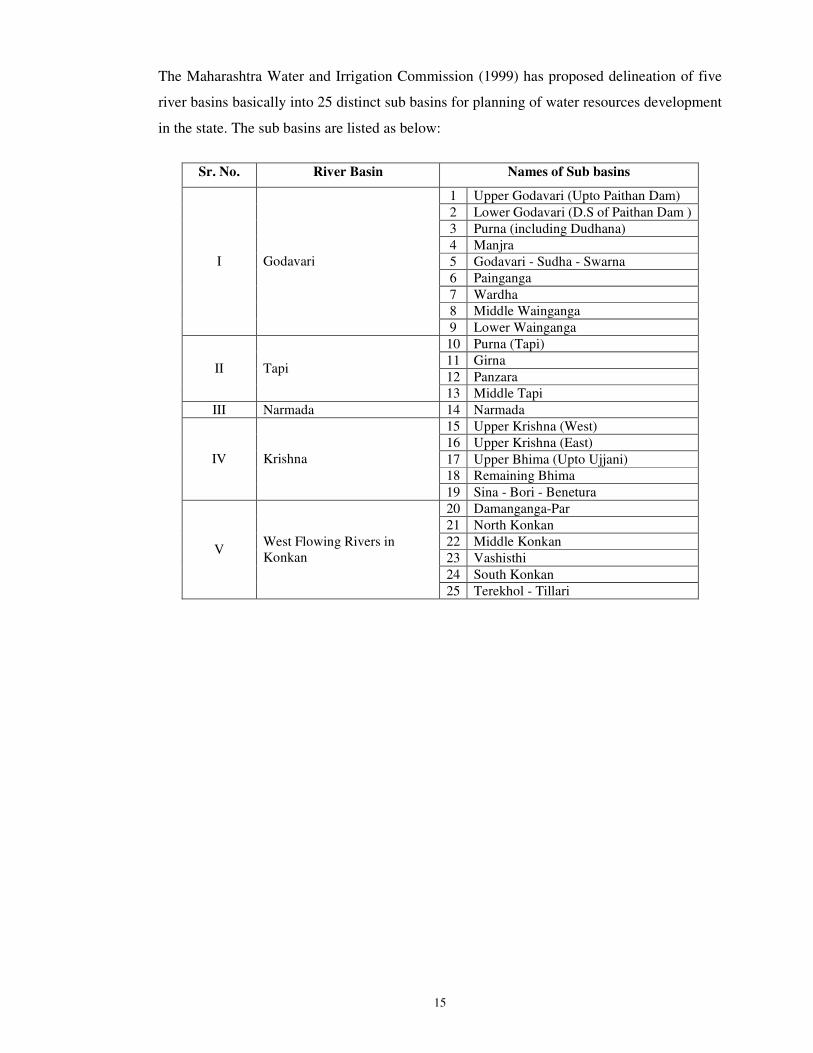
The Maharashtra Water and Irrigation Commission (1999) has proposed delineation of five
river basins basically into 25 distinct sub basins for planning of water resources development
in the state. The sub basins are listed as below:
Sr. No. River Basin Names of Sub basins
1 Upper Godavari (Upto Paithan Dam)
2 Lower Godavari (D.S of Paithan Dam )
3 Purna (including Dudhana)
4 Manjra
5 Godavari - Sudha - Swarna
6 Painganga
7 Wardha
8 Middle Wainganga
I Godavari
9 Lower Wainganga
10 Purna (Tapi)
11 Girna
12 Panzara II Tapi
13 Middle Tapi
III Narmada 14 Narmada
15 Upper Krishna (West)
16 Upper Krishna (East)
17 Upper Bhima (Upto Ujjani)
18 Remaining Bhima
IV Krishna
19 Sina - Bori - Benetura
20 Damanganga-Par
21 North Konkan
22 Middle Konkan
23 Vashisthi
24 South Konkan
V West Flowing Rivers in
Konkan
25 Terekhol - Tillari

16

17
3.3.3 River Action Plans:
The CPCB has been coming out with treatise in the Assessment and Development of river
basins series (ADSORBS) where upon attempts were made to collate and interpret basin –
wise polytonal status of major river basins of the country and prepare action plan both for
immediate and long term. The on going Ganga Action Plan (GAP) and the recent Yamuna
Action plan have emanated from the ADSORBS series of CPCB under the titles ‘The Ganga
Basin’ Part I (for river Yamuna) and part II (for river Ganga). The GAP was launched in
1986 with the principal objective to improve the water quality of the river Ganga to desirable
standards. The Yamuna Action Plan was launched on June 5, 1993 and the pollution
abatement schemes are on similar lines as those of GAP.
3.3.4 Dams in Maharashtra
Dams are also called as artificial lakes. In order to fulfill the various needs of man, dams
have been constructed across the river so as to form a pool of water on the upstream side of
the barrier. These artificial lakes are called water storage reservoirs. The quality of this
reservoir water is not much different from that of a natural lake. The water stored in the
reservoir can be used easily not only for water supplies but also for irrigation, hydroelectric
power generation and aquaculture. It also enhances the aesthetic as well as ecological value
of the area.
3.4 Ground Water
Out of total water present on the earth i.e.1.35 billion cubic kilometers, only 0.6 % of water is
in underground form. Total replenishable ground water potential of the state has been
estimated as 37.82 BCM. The groundwater is characterized by a rather steady flow pattern in
terms of direction and velocity. The average flow velocities commonly found in aquifers
range from 10 –10
to 10 –3
m/s and largely governed by the porosity and the permeability of
the geological material.

18
CHAPTER – IV
INTEGRATED APPROACH FOR WATER QUALITY
MONITORING 4.0 Water Authorities
In India, Water Quality Monitoring has been carried out historically for a number of reasons.
Different organizations are operating networks to satisfy their objective such as:
4.1 Hydrology Project
National Hydrology Project was started in 1995 under the Ministry of Water Resources Govt.
of India. The project was implemented in 9 Southern States with 6 central agencies.
♦♦♦♦Objectives of the Project ( HP-I )
The aim of the Hydrology Project was to develop comprehensive, easily accessible and user
friendly databases covering all aspects of Hydrological Cycle, including surface water and
ground water in terms of quantity and quality and climatic measurements, particularly of
rainfall involving complex web of inter-state and intra-governmental relationship. This will
assist in development of more reliable spatially intensive data on water resources. The project
further also aims at making the hydrological information available for planning and
management of water resources and other legitimate uses and promoting its utilization.
Achievement of these goals involved improvement of institutional and organizational
arrangements, technical capabilities, and physical facilities available for collection,
processing and dissemination of hydrological and hydro-meteorological information. The
ultimate aim of the project was to deliver a functional Hydrological Information System
(HIS) and improved institutional capacity to build, operate and utilize HIS to the benefit of
the different user groups and to encourage cooperation among the different participating
agencies through data exchange. The development of the databases would support major
aspects of India's Water Policy, particularly with regards to water allocation and planning
and management of water resources development at the National, State, Basin and Project
level.

19
♦♦♦♦ Hydrology Project ( HP- II )
The Project Development Objective (PDO) is to extend and promote the sustained and
effective use of the HIS by all potential users concerned with water resources planning and
management, both public and private, thereby contributing to improved productivity and
cost-effectiveness of water-related investments in the 13 states and eight Central agencies.
The coverage of existing states under the project is to help these agencies from moving over
from development of HIS (as in HP-I) towards use of HIS in water resources planning and
management. The PDO will be achieved by: (a) strengthening the capacity of hydrology
departments (surface and groundwater) to develop and sustain the use of the HIS for
hydrological designs and decision tools thus creating enabling environment for improved
integrated water resources planning and management; (b) improving the capabilities of
implementing agencies at state/central level in using HIS for efficient water resource
planning and management, reducing vulnerability to floods and droughts and thereby
meeting the country’s poverty reduction objectives; (c) establishing and enhancing user-
friendly, demand responsive and easily accessible HIS to improve shared vision and
transparency of HIS between all users; and (d) improving access to the HIS by public
agencies, civil society organizations and the private sector through awareness building
supporting outreach services. Greater use of an improved HIS is expected to have a broad but
definite impact on the planning and design of water resources schemes, from which the rural
and urban poor will have secure and sustainable access to water for multi-purpose livelihood
uses.
The Ministry of Water Resources (MoWR) Govt. of India is to implement, with assistance
from the World Bank, the Hydrology Phase II Project, which will be a six-year project
started from 05/04/2006. The project will involve: (i) the state surface water (SW) and
groundwater (GW) agencies in the nine states covered by the recently-concluded first-phase
project (HP-I) - Andhra Pradesh, Chhattisgarh, Gujarat, Kerala, Karnataka, Madhya Pradesh,
Maharashtra, Orissa and Tamil Nadu; (ii) four new states Himachal Pradesh, Goa,
Pondicherry and Punjab and Central agencies including MoWR, Central Water Commission
(CWC), Central Groundwater Board (CGWB), National Institute of Hydrology (NIH),
Central Water and Power Research Station (CWPRS), India Meteorological Department
(IMD), Central Pollution Control Board (CPCB) and Bhakra- Beas Management Board
(BBMB).

20
The project objective is to extend and promote the sustained and effective use of the
Hydrological Information System (HIS) developed under HP I by all potential users
concerned with water resources planning and management, both public and private.
This will be achieved by: (a) strengthening the capacity of hydrology departments (surface ad
groundwater) to develop and sustain the use of the HIS for hydrological designs and decision
tools; (b) improving the capabilities of implementing agencies at state/central level in using
HIS for efficient water resource planning and management to meet the country’s poverty
reduction objectives; (c) establishing and enhancing user-friendly, demand-responsive and
easily-accessible HIS; and (d) improving access to the HIS by public agencies, civil society
organizations and the private sector through supporting outreach services.
The project would consist of three main components: (i) Institutional strengthening, covering
all 13 states and 8 central agencies; (ii) Vertical Extension, covering the existing nine states
and six central agencies; and (iii) Horizontal Expansion, covering the four new states and two
new -central agencies (CPCB and BBMB).
The first component, Institutional Strengthening, would comprise three sub-components:
(i) consolidation of HP-I activities in the existing states; (ii) institutional support for
awareness raising and knowledge dissemination; and (iii) implementation support. Under
consolidation of HP-I activities, the project would support the existing Implementing
Agencies (IAs) with continued/extended training in HIS data processing and new software as
well as training in the use of specialized water quality (WQ) equipment. The project would
also finance improved data processing, spatial analysis and dissemination of standard and
user-specified maps, together with related capacity building. The awareness, dissemination
and knowledge sharing sub-component would provide for management consultancy services
to assist the HIS Coordination Secretariat (HISCS) with the formulation of a strategy and
detailed operational proposals and implementation support for spreading awareness,
dissemination and knowledge sharing among IAs and HIS users, and to train-IA personnel in
these areas. Implementation support subcomponent would include consultancies to assist the
HISCS and State-level IAs, and logistical support and incremental recurrent costs that
include incremental staff and O&M cost. The Vertical extension component would include
all those activities, which increase and enhance the use of HIS data, including: (i)
development of hydrological design aids; (ii) decision support systems; and (iii) purpose-
driven studies. The development of hydrological design aids would use HIS for the

21
creation/development of standardized hydrological design aids using well-established,
internationally- acceptable methodologies.
These design aids would not only facilitate and expedite hydrologic designs but could also,
for example, assist in the hydrological assessment of un-gauged catchments. Decision
support systems (DSS), consisting of information systems linked to appropriate models,
would also aim to promote the use of the data generated under HIS and would include:
(i) water resources planning and base operational DSS for all existing states and central
agencies; (ii) a real-time flood management an advanced operational DSS for BBMB; and he
project would also enable IAs to undertake purpose- driven studies covering such topics as
SW or GW assessment, artificial recharge and specific WQ problems. All sub-components
would be supported by the provision of spatial data and inputs and data visualization.
The Horizontal expansion component would broadly extend HP I activities to the four new
states through: (i) upgrading/establishment of state data collection networks; (ii)
establishment of data processing and management systems; (iii) implementation of purpose-
driven studies; and (iv) staff and HIS user training.
The institutional and implementation arrangements for HP-Il would be mostly similar to HP-I
and it is not foreseen that major changes in organizational structure will be required. Thus,
overall responsibility for the project would rest with MoWR and, at central level, the existing
National Level Steering Committee (NLSC) would continue as the apex body responsible for
overall administrative and management coordination. This would be chaired by the
Secretary, MoWR, and members would include senior representatives of all participating
central agencies, chair-persons of the participating States Levels Steering Committee
(SLSC). NLSC would meet twice a year, would monitor HP-Il at the national level and
would provide strategic and policy direction.
The NLSC would be supported by three HIS Management Groups (HISMGs), comprising
representatives of the IAs and focusing, respectively, on data use and dissemination
(HISMGDD), institutional strengthening and training (HISMG-IS) and technical (HISMG-
Tech.) aspects. Each HISMG would be empowered to constitute special Task Forces to
address specific problem areas, as they arise, and would review project progress and

22
monitoring results for reporting to the NLSC. The HISCS would be the central nodal
management structure responsible for overall project monitoring and coordination, and for
collating the IAs’ annual work and training programs for agreement with the Bank at annual
reviews. It would be under the administrative control of MoWR, headed by a Commissioner,
supported by a team of duly- strengthened, full-time, staff from MoWR or drawn from the
participating central agencies of MoWR (to start with) and adequate administrative and
infrastructure facilities. The team would include three Director-level staff, who would also
serve as Member-Secretaries of the HISMGs, as well as a finance/budget officer. The HISCS
would function as the secretariat for the NLSC and the HISMGs and would be assisted, on a
fulltime basis, by a TA team for both technical and management aspects, as well as short-
term TA for assisting financial management and procurement.
In the nine existing states, arrangements already in place for HP-I would continue, while in
the four new states similar structures would be developed. The current IAs would continue to
be responsible for -implementing the project with state-level coordination undertaken
through a State Level Steering Committee (SLSC) chaired by the Secretary, and State HIS
Coordination Committee (SHISCC) chaired by the Engineer-in-Chief/Director of the
concerned Irrigation or Water Resources Department. In the case of state IAs reporting to
more than one Secretary, the Chair of HISCC will rotate annually. The SLSC would meet at
least twice a year. Members of the SLSC and SHISCC would be drawn from the project IAs
within the state, including a high-level representative of the Finance Department. Each state
would nominate a state project coordinator, a training coordinator, and procurement officer
for day-to-day liaison with the central agencies, facilitated by suitably strengthened
electronic information exchange, a fully connected network and a computerized MIS. The
longer-term aim is to lead to a situation whereby HIS-related activities are the responsibility
of a single, consolidated SW and GW data center, under a Chief Engineer, thereby
strengthening conjunctive water resources planning and management at the state/basin levels.
4.2 Groundwater Surveys & Development Agency (GSDA)
The Project agreement between World Bank, I.D.A. and Government of Maharashtra,
required that the State should establish the Groundwater Agency, especially for the
development of minor irrigation schemes based on groundwater. As per the agreement , the
State Government has established the Groundwater Surveys & Development Agency
(G.S.D.A.) during the year 1972.

23
The G.S.D.A. is engaged, since last 33 years, in the exploration, development and
augmentation of groundwater resources in the State through various schemes. This mainly
includes, drilling of bore wells/tube wells under Rural Water Supply Programme, rendering
technical guidance under minor irrigation programme by locating suitable dug well sites,
strengthening of groundwater sources by water conservation measures, artificial recharge
projects for induced groundwater, specific studies related to the periodic status of
groundwater availability, protecting the existing groundwater resources through technical
assistance under Groundwater Act etc.
4.3 Central Pollution Control Board (CPCB) (SW + GW)
The Central Pollution Control Board (CPCB), statutory organization, was constituted in
September 1974 under the Water (Prevention and Control of Pollution) Act, 1974. Further,
CPCB was entrusted with the powers and functions under the Air (Prevention and Control of
Pollution) Act, 1981.
It serves as a field formation and also provides technical services to the Ministry of
Environment and Forests of the provisions of the Environment (Protection) Act, 1986.
Principal functions of the CPCB, as spelt out in the Water (Prevention and Control of
Pollution) Act, 1974, and the Air (Prevention and Control of Pollution) Act, 1981, (i) to
promote cleanliness of streams and wells in different areas of the States by prevention,
control and abatement of water pollution. (ii) to improve the quality of air and to prevent,
control or abate air pollution in the country.
The parliament of India in its wisdom enacted the Water (Prevention and Control of
Pollution) Act, 1974 with a view to maintaining and restoring wholesomeness of our water
bodies. One of the mandates of CPCB is to collect, collate and disseminate technical and
statistical data relating to water pollution. Hence Water Quality Monitoring ( WQM ) and
Surveillance are of utmost importance.
4.4 Maharashtra Pollution Control Board (MPCB) (SW + GW)
For the rational planning of a water pollution control program, it is imperative to understand
the nature and extent of pollution control required. To achieve this, GEMS/ MINARS
program was initiated by MPCB.MPCB is executing GEMS/MINARS projects under
National Water Quality Monitoring Program (NWMP) funded by CPCB. These projects were
initiated in 1978 with 3 stations and increased to 38 stations by 1992. In 2004, 10 surface

24
water stations and in 2006, 25 Ground Water stations were added to the project. At present
MPCB monitors 48 Surface water and 25 Ground Water locations – Total 73 Stations. The
Monitoring network covers 45 Rivers, 3 Creeks and 25 ground water locations. Monitoring at
these stations is done as per the Uniform Protocol for water quality monitoring prescribed by
MoEF and CPCB.
Water samples are being analyzed for parameters consisting of 9 core parameters, 19 other
physcio-chemical and bacteriological parameters apart from field observations. Besides this 9
trace metals and 15 pesticides are also analyzed for selected samples once in a year to assess
the water quality.
4.5 Central Water Commission (CWC) (SW)
Central Water Commission is the premier technical organization in India in the field of Water
Resources since 1945 and is presently functioning as an attached office of the Ministry of
Water Resources. The Commission is charged with the general responsibilities of initiating,
coordinating and furthering in consultation with the State Governments concerned, schemes
for control, conservation and utilization of water resources throughout the country, for the
purpose of Flood Control, Irrigation, Navigation, Drinking Water Supply and Water Power
Development. CWC also undertakes the investigations, construction and execution of any
such schemes as required.
Major Activities of CWC
Central Water Commission is involved in the following important activities in the Water
Resources Sector:
-Preparation of national Perspective Plan& Basin wise master plan
- Surveys, investigations and designs of schemes for development of river valleys.
- Matters relating to inter-state water sharing/disputes.
- Application of Remote Sensing techniques in Water Resources Sector.
- Project Monitoring to ensure speedy implementation and timely completion.
- Detailed Hydrological Studies of Projects.
- Collection, Collation & Publishing of Hydrological, Hydro-meteorological, Sediment
& Water Quality data.
- Flood Management & Development & Operation of Flood Forecasting System.
- Studies for safety aspects of existing dams, issuing related procedures.
- Coordination in Research and Development activities.

25
4.6 Central Ground Water Board (CGWB) (GW)
Under Ministry of Water Resources, Govt. of India, ground water investigation, exploration,
development and management are being dealt by Central Ground Water Board. Regulation
and control of ground water management is being done by Central Ground Water Authority.
The results obtained from the investigation carried out by the Scientists of Central Ground
Water Board are taken into consideration for ground water regulation and control.
First level (Systematic) surveys on 1:50,000 scales has been completed for the entire country
by March, 1991.This has generated basic information on various hydrogeological parameters.
Ground water being replenishable and dynamic in nature, it becomes essential to conduct
periodic hydro geological studies (Reappraisal hydrogeological surveys) to assess the
qualitative and quantitative changes in the ground water regime in time and space.
Approximately 2-lakh sq. km. area in different parts of the country is covered under periodic
studies every year. These studies help in reassessing changes in ground water scenario
consequent to various development activities.
Photogeological and remote sensing data is extensively used for hydrogeological purpose viz.
source finding to demarcate the area and sites suitable for ground water development. Areas
remaining hitherto inaccessible have also been surveyed and these techniques have proved
very useful in understanding ground water scenario on regional scale. Advanced surface
geophysical methods are used as source finding techniques. In hard rock terrains, this
technique has proved indispensable to decipher sub-surface saturated fractures or situations
suitable for ground water occurrence. CGWB renders assistance to various urban, defense
and public sector establishments to solve their immediate water supply problems by selecting
suitable sites for construction of ground water abstraction structures. The Board has carried
out detailed surveys in Lakshwadeep and Andaman and Nicobar Islands to delineate shallow
fresh ground water lenses and deep ground water zones in an otherwise saline water
environment. Central Ground Water Board has also helped the Rajiv Gandhi National
Drinking Water Mission in identifying suitable ground water sources for drinking water
supply.
4.7 Central Ground Water Authority (CGWA) (GW)
Central Ground Water Authority has been constituted under Section 3 (3) of the Environment
(Protection) Act, 1986 to regulate and control development and management of ground water
resources in the country.

26
Powers & Functions: The Authority has been conferred with the following powers:
� Exercise of powers under section 5 of the Environment (Protection) Act, 1986 for
issuing directions and taking such measures in respect of all the matters referred to in
sub-section (2) of section 3 of the said Act.
� To resort to penal provisions contained in sections 15 to 21 of the said Act.
� To regulate and control, management and development of ground water in the
country and to issue necessary regulatory directions for the purpose.
� Exercise of powers under section 4 of the Environment (Protection) Act, 1986 for the
appointment of officers.
4.8 Maharashtra Jeevan Pradhikaran (MJP) (SW + GW)
Maharashtra Jeevan Pradhikaran (MJP) is responsible for constructing water supply schemes
costing more than Rs. 7.5 million. Funds for construction of these schemes are made
available by GOM mainly as grants in aid. Over its evolution and more particularly in the last
25 years, the MJP has essentially grown as a design and construction organisation. The
objectives of MJP do not encompass financial sustenance or operations and maintenance,
despite their having to operate and maintain schemes that are not taken over by local bodies
(Municipalities, Zilla Parishads or Village Panchayats). This organisation was the lead
agency in the programme for making Maharashtra “tanker-free” by the year 2000, thus
strengthening its momentum to seek more resources for construction of schemes. For
administrative simplicity, schemes are designed using cost and population norms devised by
the government. The MJP has a large staff, organised into six divisions across the state.
Reorganisation in 1997 provided for the creation of new sub-divisions across the state.

27
CHAPTER - V
LLEEGGAALL FFAACCEETTSS
5.0 Control of Water Pollution:
In India, various legislations have been formulated by Ministry of Environment and Forest
such as Water Act. 1974. (Control / & Prevention), The water Cess Act, 1977, The
Environment (Protection) Act, 1986 and various acts related to water use described details as
below.
5.1 Water (Prevention and Control of Pollution) Act, 1974
The basic objective of the Act is to maintain and restore the wholesomeness of our national
aquatic resources by prevention and control of pollution. The Water Act, 1974 represented
one of India’s first attempts to deal comprehensively with environmental issue. Parliament
adopted minor amendments to the Act in 1978 and revised the Act in 1988 to more closely
conform to the provisions of the Environment (Protection) Act, 1986. Water is a State subject
under the constitution. Consequently, the Water Act, a central law, was enacted under Article
252 (1) of the constitution, which empowers the Union Government to legislate in a field
reserved for the states. All the states have approved implementation of the Water Act. The
Water Act is comprehensive in its coverage, applying to streams, inland waters, subterranean
waters and sea or tidal waters. Standards for the discharge of effluent or the quality of the
receiving waters are not specified in the Act, but it enables state boards and Central Board to
prescribe these standards.
The Act provides for a permit system or “Consent” procedure to prevent and control water
pollution. The Act generally prohibits disposal of polluting matter in streams, wells and
sewers or on land in excess of the standards established by the state boards. A person must
obtain consent from the state pollution control board before establishing any industry,
operation or process, any treatment and disposal system or any extension or addition to such
a system which might result in the discharge of sewage or trade effluent into a stream well or
sewer or onto land. The state pollution control board may cancel its consent by orders that
specify the location, constructions and use of the outlet as well as the nature and composition
of new discharges. The Act empowers a state pollution control board, upon thirty days notice
to a polluter, to execute any work required under consent order, which has not been executed.

28
The board may recover the expenses for such work from the polluter. The Act gives the state
pollution control boards the power of entry and inspection to carry out their functions.
Moreover, a state board may take certain emergency measures if it determines that an
accident or other unforeseen event has polluted a stream or well. These measures include
removing the pollutants, mitigating the damage and assuming orders to the polluter
prohibiting effluent discharges.
5.1.1 Pollution Control Boards
The Water Act establishes a Central and State Pollution Control Boards. The Central Board
may advise the Central Government on water pollution issues; coordinate the activities of
state pollution control boards, sponsor research relating to water pollution, and develop a
comprehensive plan for the prevention and Control of Water Pollution. The Central Board
was also performing functions of a state board for the Union territories till 1991. During 1991
these functions were transferred to the local administration of respective Union Territories. In
conflicts between a state board and the Central Board, the Central Board prevails. Since 1982
the Central Board has been attached to the Department of Environment, Government of
India.
The State Boards were established by the State Government under the provision of the Act to
perform functions specified in the Act. The State Boards may plan comprehensive pollution
abatement programmes and advise the State Government on water pollution issues. They also
collaborate with Central Board, inspect sewage or trade effluent, grant consent for the
discharge of the effluent, lay down and modify the standards, evolve economic methods of
treatment and disposal of sewage and trade effluent, advise the State Government on location
of industries, collect and disseminate the data in relation to pollution status in the State and
prosecute the offenders under the provision of the Act.
5.1.2 Penal Provisions
The Act mainly employs a system of criminal sanction to discourage the polluters from
polluting the watercourses. The penal provisions can be categorized into four classes:
� Penal provision for not providing information as required under the provision of the
Act, is punishable with imprisonment upto three months or a fine upto ten thousand
rupees or both.

29
� Penal provision for disposal of polluting matters in water bodies more than the
prescribed limit in the consent order or providing new outlets without
obtaining consent of the State Pollution Control Board is punishable with minimum
imprisonment of one and a half year which may be extended up
to six years. For repeating the above offence the penalties are enhanced.
� Penalty for continuing contravention of provisions of the Act is punishable with fine
of rupees 5000 every day till compliance with the provisions of the Act.
� There is a provision of publishing name of the offender in the newspaper at the
offenders cost.
The 1988 Amendment Act introduced a new section 33A which empowers State Boards to
issue directions to any person, officer or authority, including orders to close, prohibit or
regulate any industry, operation or process and to stop or regulate the supply of water,
electricity or any other service. The State Boards can also apply to courts for prevention
water pollution under section 33 of the Act. Under Section 41, the penalty for failure to
comply with a court order under Section 33 or a direction from the board under section 33A
is punishable by fines and imprisonment. The Amendment also increased the power of the
Central Board relative to the State Boards. Under section 18 of the Act, the Central
Government may determine that a state board has failed to comply with Central Board
directions and that because of this failure an emergency has risen. The Central Government
may then direct the Central Board to perform the function of the State Board.
5.2. The Water Cess Act, 1977
To strengthen the pollution control boards by providing money for equipment and technical
personnel and to promote water conservation by recycling, Parliament adopted the Water
Cess (Prevention and Control of Pollution) Act, 1977. The Act empowers the Central
Government to impose a cess on water consumed by industries listed in schedule I of the Act.
Specified industries and local authorities are subject to the cess if they use water for purposes
listed in schedule II of the Act. The amendment bill to enhance the rate of cess charges, and
to change the charges from water consumption to waste water discharges, was introduced in
the Parliament recently.
5.3. Laying Down of Standards for Environmental Pollutants
The simplest administrative approach to regulate industrial pollution would be to promulgate
30
permissible limits for various pollution parameters on a general basis, make them binding on
all discharges and prosecute and punish any offenders. Control of pollution at sources is the
immediate short-term objective adopted by all the State Pollution Control Boards.
To control pollution at source the industries must know the extent up to which their effluent
or emission must be treated/controlled so that they can discharge the treated effluent to
receiving environment without significant effect. The cost of treatment should be such that
the industry is able to take the burden. The Central Pollution Control Board has initiated
evolving industry specific Minimum National Standards (MINAS) as early as in 1977-78. At
present it has evolved effluent standards for 23 categories and emission standards for 21
categories of industries. The State Boards use these guidelines for necessary follow - up
action. No State Board is permitted to relax the MINAS, if situation so demands; the State
Boards may make them more stringent. These standards have been notified under
Environmental (Protection) Act, 1986, by the Government of India.
5.4. The Environment (Protection) Act, 1986
In the wake of Bhopal gas tragedy, the Government of India enacted Environment
(Protection) Act, 1986 under Article 253 of the constitution. The purpose of the Act is to
implement the decisions of the United Nations Conference on the Human Environment of
1972, in so far as they relate to the protection and improvement of the human environment
and the prevention of hazards to human beings, other living creatures, plants and property.
The Act is an ‘Umbrella’ legislation designed to provide a framework for Central
Government coordination of the activities of various central and state authorities established
under previous laws such as Water Act and Air Act. The potential scope of the Act is broad
with ‘environment’ which includes water, air and land and interrelationship, which exists
among water, air, land, human beings, other creatures, plants, micro organisms and property.
Section 3(1) of the Act empowers the Center to take all such measures as it deems necessary
or expedient for the purpose of protecting and improving the quality of the environment and
preventing, controlling and abating environmental pollution. Central Government is
authorized to set New National Standards for ambient quality of the environment and
standards for controlling emissions and effluent discharges; to regulate industrial locations;
to prescribe procedures for managing hazardous substances; to establish safeguard for
preventing accidents; and to collect and disseminate information regarding environmental

31
pollution. The Environment (Protection) Act (EPA) was the first environmental statute to
give the Central Government authority to issue direct written orders including orders to close,
prohibit or regulate any industry, operation or process or to stop or regulate the supply of
electricity, water or any other services (Section 5).
Other powers granted to the Central Government to ensure compliance with the Act include
the power of entry for examination, testing of equipment and other purpose (Section 10) and
power to take samples of air, water, soil or any other substance from any place for analysis
(Section 11). The Act explicitly prohibits discharge of pollutants in excess of prescribed
standards (Section 7). Persons responsible for discharges of pollutants in excess of prescribed
standards must prevent or mitigate the pollution and must report the discharge to government
authorities (Section 9, 1).
Penal Provisions: The Act provides for severe penalties.
� Any person who fails to comply with or contravenes any of the provisions of the Act,
or the rules or directions issued under the Act shall be punished for each failure or
contravention, with a prison term of upto 5 years or a fine upto Rs. 1 lakh or both.
� The Act imposes an additional fine upto Rs.5000 for every day of continuing
violation (Section 15 (1). If a failure or contravention occurs for more than one year
after the date of conviction an offender may be punished with a prison term, which
may extend to seven years (Section 15 (2)).
The Act empowers the Central government to establish standards for the quality of the
environment in its various aspects, including maximum allowable concentration of various
environmental pollutants (including noise) for different areas. These standards could be
based on ambient levels of pollutants sufficiently low to protect the public health and
welfare. Emission or discharge standards for particular industries could be adjusted to ensure
that such ambient levels are achieved. The Environment (Protection) Rules, 1986 allow the
State or Central authorities to establish more stringent standards based on recipient system.
5.5. Maharashtra Water Supply and Sewerage Board Act, 1976
The Act establishes the constitution on the Maharashtra Water Supply and Sewerage Board
(subsequently renamed the Maharashtra Jeevan Pradhikaran, MJP). The Act requires the
Board to provide water and sewerage services to the State Government, local bodies and
private institutions and individuals. The supply of water for domestic purposes is defined

32
broadly to include trade, manufacture or business, gardens, irrigation, building and road
construction, animals, fountains, swimming baths, washing vehicles and watering streets.
The Act requires the Board to fix the cost of water (in respect of either a volumetric charge or
a fixed charge per connection) and the cost of disposal of wastewater. It also gives powers to
the Board to disconnect services for, amongst other things, non-payment of charges. The Act
provides powers to the State Government to transfer or depute government employees to the
Board. It also defines the Board’s accounting, financing and contracting arrangements.
5.6. Maharashtra Groundwater (Regulation for Drinking Water Purpose) Act, 1993
First published, after having received the assent of the Governor, in the “Maharashtra
Government Gazette” on 16th
August 1993.
An Act is to regulate the exploitation of ground water for the protection of public drinking
water and sources and matter connected therewith and incidental thereto.
“Drinking water purposes” in relation to the use of water, means consumption or use of water
by human population for drinking and for other domestic purposes and includes consumption
of water for similar such relevant purposes for cattle;
“Domestic purposes” shall include consumption of use of water for cooking, bathing,
washing, cleansing and other day-to-day activities.
“Groundwater” means water existing in an aquifer below the surface of the ground at any
particular location regardless of the geological structure in which it is stationary or moving
and includes all groundwater reservoirs;
“Over-exploited watershed” means a watershed where the estimated annual groundwater
extraction is more than 85 per cent of the estimated average annual groundwater recharge,
calculated in the prescribed manner, and declared as such under section 6;
“Public water-supply system” means the structures relating to a public drinking water source,
including conveying pipelines, storage reservoir, stand-posts, cisterns, hand pump, power
pump and all other materials connected thereto, through which water is supplied for drinking
water purpose.
33
5.7. Constitution of Environmental Monitoring Committee
With a view to integrate the environmental concerns into water resources development, the
Environmental Management Directorate was carved out in Central Water Commission during
1987. It is envisaged to be a link between the State authorities who are executing water
resources projects and the Ministry of Environment & Forests who are vested with the
powers of clearing the projects from environmental angle. A multidisciplinary Environmental
Monitoring Committee (EMC) was constituted by the Ministry of Water Resources during
February, 1990 for overseeing the implementation of environmental safeguards stipulated by
the Ministry of Environment & Forests while clearing the Water Resources Projects. The
Committee is headed by the Member (WP&P), CWC with Director (Environmental
Management) as its Member Secretary. It comprises members from Ministries of
Environment & Forests, Agriculture & Cooperation, Welfare and Water Resources besides
Planning Commission. The Committee is entrusted with the work of review of the
mechanism established by the project authorities to monitor the ecology of the project areas
and to suggest additional compensatory measures/facilities wherever necessary. It is also
required to bring to the notice of the Government important cases of default, which may lead
to the review of project's clearance for the funding arrangement. The EMC initially selected
78 Water Resources Development Projects, cleared by the Ministry of Environment &
Forests, for monitoring. These Projects are geographically well distributed over the country.
However, due to the limited resources available with the Committee, it identified 10 projects
for close monitoring, while the remaining 68 projects would be monitored by State Level
Environmental Monitoring Committee and Project Level Environmental Management
Committee of respective State/Project.
5.8. Indian National Committee on Hydraulic Research (INCH)
INCH is one of the five Indian National Committees (INCs) constituted by the Ministry of
Water Resources to promote research work in the field of hydraulic structure and river
hydraulics, environmental hydraulics, drainage and reclamation, coastal and estuarine
hydraulics and hydraulic machinery, city water supply, ports and harbours. INCH is entrusted
with the promotion and funding of research work in the above fields. Member (D&R) is the
Chairman of this committee.

34
5.9. Indian National Committee on Hydrology (INCOH)
The Indian National Committee on Hydrology (INCOH) was constituted by the Ministry of
Water Resources in the year 1982. It is an apex body with the responsibility of coordinating
the various activities concerning hydrology in the country. The Chairman, Central Water
Commission is the Chairman of the Committee with the members drawn from Central and
State Governments as well as experts from the academic and research organizations besides a
few members drawn from non-Governmental professional organisations. The committee gets
a feed back from States and coordinates activities at State level through State co-ordinators.
INCOH plays an active role for implementation of UNESCO sponsored International
Hydrological Programme (IHP).
5.10. Indian National Committee on Irrigation and Drainage (INCID)
Indian National Committee on Irrigation and Drainage (INCID) was constituted in 1990 by
Ministry of Water Resources. The Chairman, CWC is the Chairman of INCID and Member
(WP&P) is one of its members. The secretariat of INCID is located at New Delhi. The
INCID pursues the mission and activities of ICID in India. It also looks into the R&D
activities in irrigation and drainage sectors.
5.11 Water Quality Assessment Authority: - Task Force
The Water Quality Assessment Authority (WQAA) has constituted a Task Force in exercise
of powers conferred by sub-section (1) and (3) of Section 3 of the Environment (Protection)
Act,1986 to recommend measures for optimum Water Quality Observation Network and
coordinated data collection and dissemination system to assist the Water Quality Assessment
Authority. The Task Force is constituted with the following members.
Chairman, Central Pollution Control Board Chairman
Advisor, Ministry of Environment and Forests Member
Sr. Joint Commissioner (GW&MI), Ministry of Water Resources Member
Member (SA&M), Central Ground Water Board Member
Chief Engineer(P&D),Central Water Commission Member
Water Quality Expert Member
Additional Director, Central Pollution Control Board Member-Secretary
The terms of reference (TOR) of the Task Force are as follows:

35
Development of Water Quality data information system and recommend the steps for Co-
ordination in collection, use and dissemination of data. Review of Water Quality Monitoring
network and recommend optimum network for the country. Recommend system for
Accreditation of Water Quality laboratories in the country.
5.11.1 First Meeting of Task Force
The first meeting of the task force constituted by Water Quality Assessment Authority under
the Chairmanship of Dr. V. Rajagopalan, Chairman, Central Pollution Control Board, Delhi
(CPCB) held on 28/11/2003.
5.11.2 Second Meeting of Task Force
The second meeting of the task force held on 31.03.2004 to discuss the draft report. The issue
of water quality parameters and frequency to be adopted was deliberated in detail and it was
decided to modify the parameters and frequency for optimum generation of data/information
with available resources. The need of monitoring of micro-pollutants was suggested for
States having high pesticides consumption and other States consuming relatively less
pesticides in quantitative terms per hectare unit area under agriculture, based on criteria
defined in the succeeding paras in the report. The rationalization and optimization of
monitoring network being maintained by various agencies will be taken up under Hydrology
Project Phase-II of the World Bank, however, the criteria for optimization and rationalization
of monitoring networks is being incorporated in this report of the task force. The
accreditation of laboratories of various agencies involved in water quality monitoring shall be
done based on the guidelines prepared by CPCB for parameters incorporated for Surface
Water and Ground Water Monitoring Programme. CPCB agreed to extend training to Central
Ground Water Board (CGWB), Central Water Commission (CWC) and State Government
Agencies (SGA) involved in Water Quality Monitoring Programme for surface water and
ground water agencies for entry of water quality data on the Webpage of CPCB. It was also
decided that in the Hydrological information system CPCB shall be nodal agency for
maintaining the water quality data as per the mandate of WQAA.
The Water Quality Assessment Authority has so far performed the following tasks:
• Constituted the Expert Group for review of the present Water Quality Monitoring
programme for formulating a monitoring protocol. The protocol has been finalized.
36
• Constituted the State Level Water Quality Review Committees to review the
monitoring practices at the state level and to highlight the important state issues for
consideration by the Authority. So far 33 States Level Committees have been
constituted out of 35 States / UTs in the country .
• Co-ordination cell in MoWR has been created for servicing the Authority.
5.11.3 Expert Group:
An Expert Group on Water Quality Monitoring System was constituted under Water Quality
Assessment Authority with a view to unifying and streamlining the widely varying Water
Quality Monitoring Systems being followed at present by various Central and State agencies.
Some of the important recommendations of Expert Group for its uniform implementation are:
i. The recommended protocol identifies different types of stations both under surface and
Ground water category viz. Baseline, Trend and Trend cum-Surveillance/impact for
implementation. This categorization is based on the extent to which the water at site is
polluted, the Baseline station being the least polluted by the human activity. Number of
parameters and its frequency for monitoring differs at each type of stations.
ii. There is an urgent need for developing two referral laboratories, one with Central Water
Commission and the other with Central Ground Board.
iii. Quality assurance test viz. analytical quality control test ‘within laboratory’ and ‘inter-
laboratory’ must be performed by all laboratories for ensuring reliability in data generation.
5.11.4 Co-ordination Cell in MoWR
The co-ordination cell performs the following functions:
• To work as Secretariat for WQAA meetings.
• To work as Secretariat for WQ Monitoring Committee.
In the second meeting held on 14th May 2003 the Authority generally accepted and approved
the report of the Expert Group, which is being subjected to scrutiny from technical and
operational angle before Notification under Environment (Protection) Act, 1986.
Under the Water Quality Assessment Authority various Task Force/Groups have been
constituted. These are:
1. A Water Quality Monitoring Committee has been constituted under the Chairmanship of
Additional Secretary and Project Director, Ministry of Environment and Forests. This
Committee assists the WQAA in its functions.

37
2. A Task Force chaired by the Chairman, CPCB has been constituted to deal with matter
relating to coordination, use and dissemination of data, review of water quality monitoring
network, accreditation of water quality laboratories. The Task Force has submitted its report.
3. A Working Group has been constituted with Member, Central Water Commission (CWC)
as a Chairman. This group deals with issues relating to minimum flows in rivers.

38
CHAPTER – VI
WWAATTEERR QQUUAALLIITTYY MMOONNIITTOORRIINNGG IINN MMAAHHAARRAASSHHTTRRAA
6.1 Introduction
The Water Quality Monitoring is carried out by various agencies viz. Central Water
Commission (SW), Central Pollution Control Board (GW), Groundwater Surveys &
Development Agency (GW), Hydrology Project (SW), Maharashtra Pollution Control Board,
Central Ground Water Board & Directorate of Irrigation Research and Development(DIRD).
Hydrology Project takes care of surface water quality through sampling points spread over
the State throughout the year; DIRD monitors dug wells in the command area of major and
medium Irrigation Projects. Ground Water Surveys and Development Agency also monitors
the dug wells as well as ground water levels of the State intermittently.
Agency wise Water Quality Monitoring details:
Sr.
no.
Name of the Water Quality monitoring agency No. of Water Quality
monitoring sites
State Surface water monitoring Agencies
1. Water Resources Department, Hydrology Project (SW) 127
State Ground water monitoring Agencies
2. Groundwater Surveys & Development Agency (GSDA) 1871
Central Surface water monitoring Agencies
3. Central Pollution Control Board (CPCB) (SW) through
Maharashtra Pollution Control Board (MPCB)
48
4. Central Water Commission (SW) 12
Central Ground water monitoring Agencies
5. Central Pollution Control Board (CPCB) (GW) through
Maharashtra Pollution Control Board (MPCB)
25
6. Central Ground Water Board (CGWB, NHNS) (GW) 803
Total no. of stations for surface water 187
Total no. of stations for ground water 2699

39
6.2 Water Quality Monitoring (SW) in Hydrology Project:
6.2.1 The Hydrology Project and HIS
Hydrology Project aims at establishing a Hydrological Information System (HIS) in the state
and the HIS includes Water Quality Monitoring of Surface Water. The basic objectives for
WQ Monitoring are:
a) Monitoring for establishing baseline water quality.
b) Observing trend in water quality changes.
c) Calculating of flux of water constituents of interest.
d) Control and management of water pollution.
Monitoring for establishing baseline water quality :
Water Quality Monitoring System (WQMS) is developed as per WQ network as below;
6.2.2 Distribution of 127 WQ sampling locations is done amongst 5 Level-Il laboratories
located at different places i.e. Pune-25, Nashik-25, Nagpur-25, Aurangabad-20, and
Kohapur-32.
The WQ sampling frequencies considered for initially three year based on type of station
classification.
Sr.No. Category Frequency
1 Baseline 50 No. Monthly one sample
2 Trend - 65 No. Fortnightly one sample
3 Flux - 09 No. Fortnightly one sample
4 Trend/Flux - 03 No. Fortnightly one sample
Total - 127 No
6.2.3 The Water Quality monitoring is being carried out under Hydrology Project. Hydrology
Project (SW), Maharashtra takes care of surface water quality monitoring through 127
sampling locations spread over the state throughout the year (last 3 to 4 years). In accordance
with decision taken in 1st meeting of Water Quality Review Committee of State of
Maharashtra, ‘The Uniform Protocol’ for Water ‘Monitoring finalized by the Water Quality
Assessment Authority formulated by the Ministry of Water Resources is made available to
H.P( SW), Maharashtra.Hydrology Project (SW), Maharashtra has gone through the

40
recommendation given in protocol and considering needs of HP, (SW), Maharashtra some
guidelines are designed and circulated to field offices. On the basis of this Protocol, it is
suggested to finalize the criteria for classification of location as ‘BASELINE’, ‘TREND’,‘
FLUX’etc.after collection of data for three years so that further Water Quality Monitoring
also be uniform all over and classification of location should be finalized on the basis of
Uniform methods.
The WQ sampling location category & frequency of sampling designed for SW,
Maharashtra.
WQ Sampling
Location category
Sampling frequency up to
first 3 years
After 3 years monitoring
Baseline 50 No. Monthly one sample Break for 3 years
Trend - 65 No. Fortnightly one sample After classification as ‘Trend’
monthly one sample
Flux - 09 No. Fortnightly one sample After classification as ‘Flux’
fortnightly one sample
Trend/Flux -03 No. Fortnightly one sample After classification as Trend/Flux
fortnightly one sample.
Statement showing Frequency of Sampling & Parameters to be analyzed
Station Sampling
Frequency Test Parameters Remark
Baseline Once in a month
first 3 years
30 parameters for 1st
sample 20 Parameters
for remaining Sample
After 3 years
monitoring break for
3 years
Baseline after 3 years
break and classification
as baseline stations
Once in 2
months
30 parameters for 1st
sample 20 Parameters
for remaining Sample
One year monitoring
again break for 3
years.
Trend Twice a month --do-- Initially 3 year
monitoring
Trend (after
classification as trend) Once in a month -- do --
Continuous
monitoring
Flux Twice a month -- do -- Initially 3 year
monitoring
Flux (after
classification as Flux) Twice a month -- do --
Continuous
monitoring with
flow measurements
Reservoir and lakes
(treated as Trend) Twice a month
32 parameters for 1st
samples.
22 parameters for
remaining sample
Continuous
monitoring
Note: - The parameters to be analyzed as mentioned above are minimal requirement. This is not however
restricted. Additional parameters are to be analyzed if desired or on the basis of geographical stations of
locations or certain circumstances.

41
List of Parameters
Sr No.
Parameter 32
Parameter 30
Parameter 22
Parameter 20
1 Colour Colour Colour Colour
2 Odour Odour Odour Odour
3 Temperature Temperature Temperature Temperature
4 pH pH pH pH
5
Electric Conductivity
Electric Conductivity
Electric Conductivity Electric Conductivity
6 Dissolved Oxygen
Dissolved Oxygen
Dissolved Oxygen Dissolved Oxygen
7 Turbidity Turbidity Total Solids Total Solids
8 Total Solids Total Solids Dissolved Solids Dissolved Solids
9 Dissolved Solids Dissolved Solids NO2 NO2
10 Suspended Solids Suspended Solids NO3 NO3
11 NH3-N NH3-N B.O.D. B.O.D.
12 NO2 NO2 C.O.D. C.O.D.
13 NO3 NO3 Total Coliforms Total Coliforms
14 Total Phosphorous
Total Phosphorous
Faecal Coliforms Faecal Coliforms
15 B.O.D. B.O.D. Turbidity Turbidity
16 C.O.D. C.O.D. NH3-N NH3-N
17 Potassium K+ Potassium K
+ Total Phosphorous Total Phosphorous
18
Sodium (Na) Sodium (Na) Chloride (Cl) Chloride (Cl)
19 Calcium (Ca ) Calcium (Ca ) Alkalinity Alkalinity
20 Magnesium Magnesium Sodium
Sodium
21 Carbonate (CO3) Carbonate (CO3) Total KjeldhalNitrogen
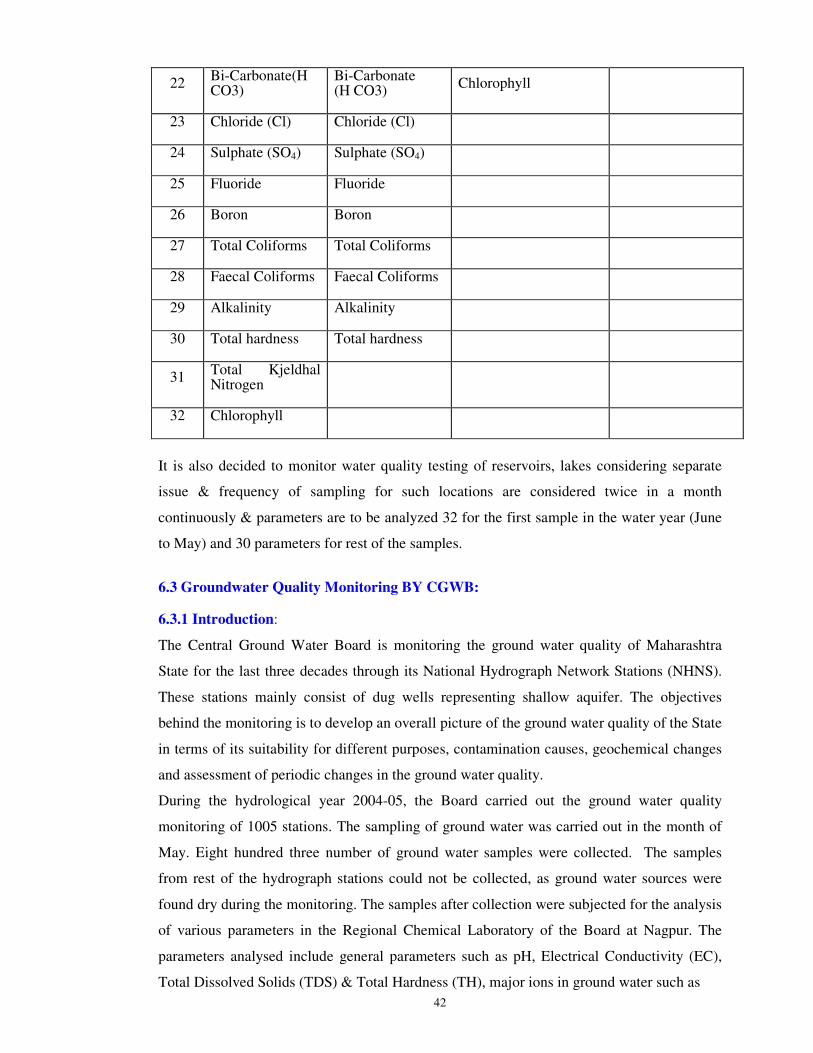
42
22 Bi-Carbonate(H CO3)
Bi-Carbonate (H CO3)
Chlorophyll
23 Chloride (Cl) Chloride (Cl)
24 Sulphate (SO4) Sulphate (SO4)
25 Fluoride Fluoride
26 Boron Boron
27 Total Coliforms Total Coliforms
28 Faecal Coliforms Faecal Coliforms
29 Alkalinity Alkalinity
30 Total hardness Total hardness
31 Total Kjeldhal Nitrogen
32 Chlorophyll
It is also decided to monitor water quality testing of reservoirs, lakes considering separate
issue & frequency of sampling for such locations are considered twice in a month
continuously & parameters are to be analyzed 32 for the first sample in the water year (June
to May) and 30 parameters for rest of the samples.
6.3 Groundwater Quality Monitoring BY CGWB:
6.3.1 Introduction:
The Central Ground Water Board is monitoring the ground water quality of Maharashtra
State for the last three decades through its National Hydrograph Network Stations (NHNS).
These stations mainly consist of dug wells representing shallow aquifer. The objectives
behind the monitoring is to develop an overall picture of the ground water quality of the State
in terms of its suitability for different purposes, contamination causes, geochemical changes
and assessment of periodic changes in the ground water quality.
During the hydrological year 2004-05, the Board carried out the ground water quality
monitoring of 1005 stations. The sampling of ground water was carried out in the month of
May. Eight hundred three number of ground water samples were collected. The samples
from rest of the hydrograph stations could not be collected, as ground water sources were
found dry during the monitoring. The samples after collection were subjected for the analysis
of various parameters in the Regional Chemical Laboratory of the Board at Nagpur. The
parameters analysed include general parameters such as pH, Electrical Conductivity (EC),
Total Dissolved Solids (TDS) & Total Hardness (TH), major ions in ground water such as

43
Calcium (Ca), Magnesium (Mg), Sodium (Na), Potassium (K), Carbonate (CO3), Bicarbonate
(HCO3), Chloride (Cl), and Sulphate (SO4), and parameters of health significance such as
Nitrate (NO3) and Fluoride (F). The methods of sample collection, preservation, storage,
transportation and analysis given in Manual of American Public Health Association (APHA)
for the examination of Water and Wastewater (1985) were followed. The compilation,
validation, computerization and interpretation of ground water quality data thus generated
were carried out to develop the overall picture of ground water quality in the state.
District wise Collection of Ground Water Samples:
District No. of
Sample District
No. of
Sample District
No. of
Sample
Ahmednagar 16 Hingoli 06 Parbhani 08
Akola 19 Jalgaon 29 Pune 34
Aurangabad 08 Jalna 13 Raigad 26
Amravati 41 Kolhapur 34 Ratnagiri 38
Beed 19 Latur 22 Sangli 04
Bhandara 22 Mumbai 06 Satara 22
Buldhana 20 Nagpur 32 Sindhudurg 32
Chandrapur 40 Nanded 23 Sholapur 07
Dhule 22 Nandurbar 09 Thane 38
Gadchiroli 51 Nashik 27 Wardha 39
Gondia 23 Osmanabad 13 Washim 17
Yavatmal 43
TOTAL (MAHARASHTRA): 803 SAMPLES
6.3.2 Physico-chemical characteristics of Ground water in monitored stations of
Maharashtra state: The pH of the ground water samples is indicating that the ground water in Maharashtra State
is mainly alkaline in nature. The ground water in almost all the districts of Maharashtra State
are having pH more than 7.0 except few samples of Ratnagiri and Sindhudurg districts which
were weakly acidic in nature. The over all range of the pH of ground water in Maharashtra is
6.1 to 8.7. The pH of ground water also indicates that the CO2 dissolved in water exists
mainly in the form of bicarbonate while it also appears as a carbonate ion in those samples
where pH is more than 8.3. In natural conditions, the pH of ground water is usually found in

44
the range of 6.5 to 8.5. However, it may be low or high depending on the environment in
which the ground water exists. The percolation of strongly acidic or alkaline
effluent/wastewater from anthropogenic sources to ground water may alter the pH of ground
water.
The measurement of electrical conductivity of water provides an indication of ion
concentration in water. As the concentration of ions increases, the electrical conductivity and
total dissolved solids (TDS) also increases. Both are interrelated as mostly inorganic
substances are dissolved in ground water. The TDS is computed as sum of ion
concentrations. It is also an important parameter to assess the quality of water as solids
dissolved in the water may affect the quality of water adversely. The western portion of
Maharashtra especially in western coastal tracts, the solids dissolved in the ground water is
less than 500 mg/L except three samples of Raigad district. This is due to the
physiographical, climatic and hydrogeological conditions existing in the area. The ground
water gets minimum residence time in this area. The flushing of aquifer is regularly going on
due to the heavy rainfall and steep gradient in the area. It is also seen from the figure that in
the plain area of Maharashtra specially plain areas of western Maharashtra, Marathwada and
parts of Vidarbha, the TDS of ground water lies mainly in the range of 500 – 2000 mg/L with
some pockets having TDS more than 2000 mg/L. The high TDS in ground water of Madhya
Maharashtra may be due to impact of several factors such as industrialisation, urbanization
and irrigation in canal command areas on ground water. The increase in TDS in Marathwada
region of Maharashtra may be due to high rate of evapotranspiration in the area as it falls
under the rain scarcity zone. The high TDS was also found in parts of Vidarbha under Purna
basin where inland salinity problem exists.
The total hardness (TH) is the sum of calcium and magnesium concentration expressed in
terms of CaCO3 in mg/L. The carbonate and bicarbonate salts of calcium and magnesium
give temporary hardness to ground water while chloride and sulphate salts give permanent
hardness. The dissolution of calcium and magnesium to such a high extent from geological
sources is ruled out as basalts mainly cover this area. It may be coming into ground water
from anthropogenic sources. However, the high TH in ground water of Purna basin area of
Vidarbha may be due to the inland salinity problems.
As the major part of Maharashtra is covered by basalts, the possibility of chloride and
sulphate in ground water from aquifer material is very low. The potability of ground water is
less affected as far as chloride in ground water is concerned. The same is the case with
sulphate.
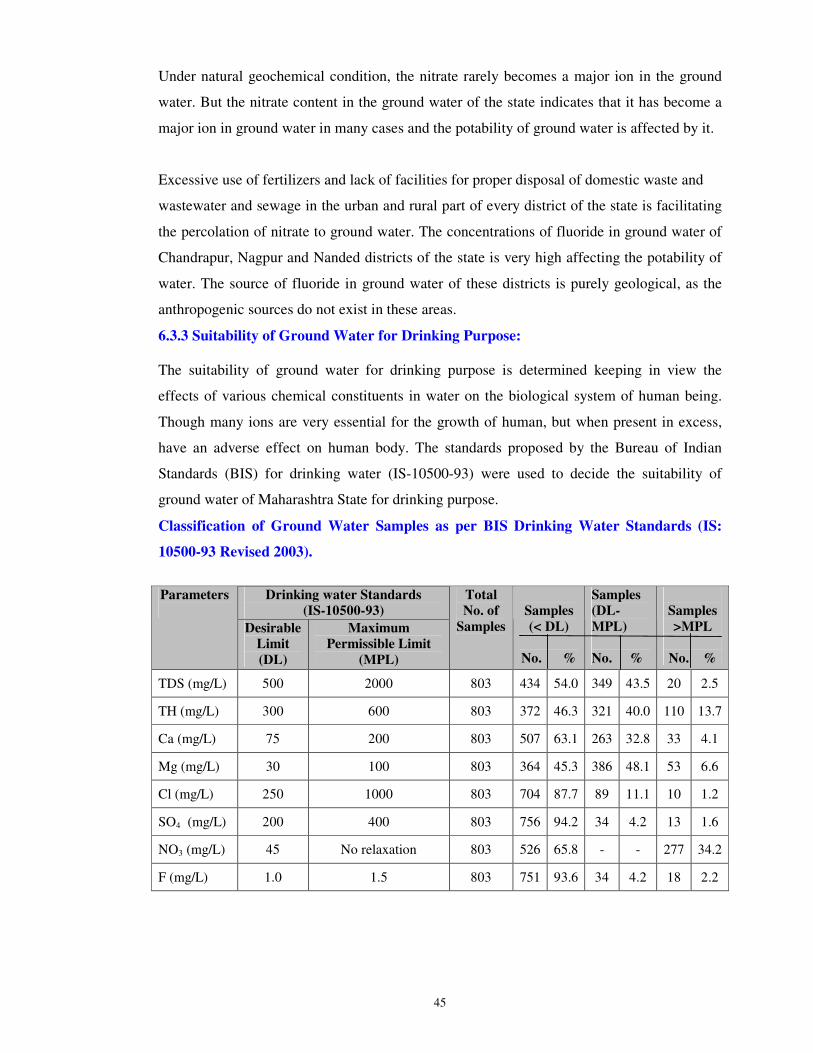
45
Under natural geochemical condition, the nitrate rarely becomes a major ion in the ground
water. But the nitrate content in the ground water of the state indicates that it has become a
major ion in ground water in many cases and the potability of ground water is affected by it.
Excessive use of fertilizers and lack of facilities for proper disposal of domestic waste and
wastewater and sewage in the urban and rural part of every district of the state is facilitating
the percolation of nitrate to ground water. The concentrations of fluoride in ground water of
Chandrapur, Nagpur and Nanded districts of the state is very high affecting the potability of
water. The source of fluoride in ground water of these districts is purely geological, as the
anthropogenic sources do not exist in these areas.
6.3.3 Suitability of Ground Water for Drinking Purpose:
The suitability of ground water for drinking purpose is determined keeping in view the
effects of various chemical constituents in water on the biological system of human being.
Though many ions are very essential for the growth of human, but when present in excess,
have an adverse effect on human body. The standards proposed by the Bureau of Indian
Standards (BIS) for drinking water (IS-10500-93) were used to decide the suitability of
ground water of Maharashtra State for drinking purpose.
Classification of Ground Water Samples as per BIS Drinking Water Standards (IS:
10500-93 Revised 2003).
Drinking water Standards
(IS-10500-93)
Parameters
Desirable
Limit
(DL)
Maximum
Permissible Limit
(MPL)
Total
No. of
Samples
Samples
(< DL)
No. %
Samples
(DL-
MPL)
No. %
Samples
>MPL
No. %
TDS (mg/L) 500 2000 803 434 54.0 349 43.5 20 2.5
TH (mg/L) 300 600 803 372 46.3 321 40.0 110 13.7
Ca (mg/L) 75 200 803 507 63.1 263 32.8 33 4.1
Mg (mg/L) 30 100 803 364 45.3 386 48.1 53 6.6
Cl (mg/L) 250 1000 803 704 87.7 89 11.1 10 1.2
SO4 (mg/L) 200 400 803 756 94.2 34 4.2 13 1.6
NO3 (mg/L) 45 No relaxation 803 526 65.8 - - 277 34.2
F (mg/L) 1.0 1.5 803 751 93.6 34 4.2 18 2.2

46
6.3.4 Classification of Ground Water for Irrigation Purpose:
The classification of ground water for irrigation purpose was carried out based on the U.S. Salinity
diagram, which uses Electrical Conductivity (EC) and Sodium Absorption Ratio (SAR) of the water
to decide the sodium and salinity hazard on soil if the water is used for irrigation.
6.3.5 Classification of Ground water for Irrigation based on SAR values
SAR Value
No. of Samples EC in µµµµS/cm
(Salinity
Hazard)
No. of
Samples
(%) <10
(Low)
10-18
(Medium)
18-26
(High)
>26
(Very
High)
<250
(Low)
80
(9.96 %) 80 - - -
250-750
(Medium)
240
(29.89 %) 240 - - -
750-2250
(High)
426
(53.05 %) 425 1 - -
>2250
(Very High)
57
(7.10 %) 48 7 1 1
Total (%) 803 793 (98.75 %) 8 (0.99 %) 1 (0.12 %) 1 (0.12 %)
Based on above classification, it is observed that 98.75% of samples fall under the category of low
sodium hazard while 29.89% and 53.05% of samples fall under the category of medium and high
salinity hazard respectively. This shows that if this water is used for irrigation on soil, there is little
danger of development of sodium exchangeable problem but the salts dissolved in the water may
cause problems. Under such circumstances, proper irrigation, soil and crop management practices
are required to use the water for irrigation purpose.
6.3.6 Classification of Ground Water Samples as per BIS Drinking Water Standards
Drinking water Standards
(IS-10500-93)
Parameters Desirable
Limit
(DL)
Maximum
Permissible
Limit (MPL)
Total
No. of
Sample
s
Samples
(< DL)
No. %
Samples
(DL-MPL)
No. %
Samples
>MPL
No. %
TDS (mg/L) 500 2000 811 440 54.3 351 43.3 20 2.4
TH (mg/L) 300 600 811 378 46.6 323 39.8 11
0 13.6
Ca (mg/L) 75 200 811 515 63.5 263 32.4 33 4.1
Mg (mg/L) 30 100 811 370 45.6 388 47.8 53 6.6
Cl (mg/L) 250 1000 811 712 87.8 89 11.0 10 1.2
SO4 (mg/L) 200 400 811 764 94.2 34 4.2 13 1.6
NO3 (mg/L) 45 No relaxation 811 534 65.8 - - 27
7 34.2
F (mg/L) 1.0 1.5 811 759 93.6 34 4.2 18 2.2

47
6.3.7 Geochemical Classification of Ground Water:
In Maharashtra, 80% of the area is covered with basaltic formation. In basaltic formation, the
ground water is typically of Ca-HCO3 type. The nine types of water proposed by Piper was found
out from the chemical analysis of ground water samples collected from Maharashtra and U/T of
Dadra & Nagar Haveli by calculating the combination of percentage of epm values of alkaline
earth's (Ca+ Mg), alkali metals (Na
+ K), weak acids (CO3
+HCO3) and strong acids (Cl
+SO4) of each
sample separately. These nine types of water under different aquifer formations is presented in table
- and the distribution of 'Type of Water' in the ground water is shown in figure-
Aquifer wise type of water in Maharashtra and Dadra and Nagar Haveli
Aquifer
Type of
water BA
S ALV GRT GNS LTR SST QTZ SCH SHL
LS
T
LA
M
Tota
l %
Ca-Cl 39 2 10 6 4 1 - - - 1 - 63 7.77
Ca- HCO3 282 8 26 27 19 14 2 - - - - 378 46.61
Ca-
HCO3-Cl 3 - - 1 1 - - - - - - 5 0.62
Ca-Mg-
HCO3 3 1 - 1 - - - - - - - 5 0.62
Ca-Na-
HCO3 1 - - - - - - - - - - 1 0.12
Ca-SO4 1 - - - - - - - - - - 1 0.12
Mg-Cl 19 2 4 - 2 1 - - - - - 28 3.45
Mg- HCO3 153 14 17 14 5 5 - 1 - - - 209 25.77
Mg-
HCO3-Cl - - 1 - - - - - - - - 1 0.12
Na-Ca-
HCO3 1 - - - - - - - - - - 1 0.12
Na-Cl 15 3 2 - - - - - - - - 20 2.47
Na-HCO3 63 10 8 5 1 5 - 1 1 - 1 95 11.71
Na-SO4 3 - 1 - - - - - - - - 4 0.49
Total 583 40 69 54 32 26 2 2 1 1 1 811 100
%
Abbreviations: BAS – Basalt; ALV – Alluvium; GRI – Granire; GNS – Gneiss; LTR – Laterite;
SST – Sandstone; QTZ – Quartzite; SCH – Schist; SHL – Shale; LST – Limestone; LAM – Lameta

48
The perusal of above table and figure indicates that ground water is mostly dominated by the
alkaline earth-weak acid i.e. Ca-HCO3 in most of the part of the state and union territory. 46.61 %
of ground water samples are Ca-HCO3 type followed by Mg-HCO3 and Na-HCO3. As discussed
above, the Ca-HCO3 type of water is a peculiar characteristic of basaltic formation. However, the
chloride type of water either mixed with alkaline earth's (Ca/Mg) or alkali metal (Na) cations,
though its percentage is low, is really of high concern. It means that process of transformation in
ground water is taking place bringing strongly acidic anions (Cl+SO4) into the ground water, thus
changing the type of water as well as deteriorating the ground water quality. These transformations
may be because of industrial activities in some urban and industrial belts of Maharashtra. The most
dangerous type of water i.e. Ca-Cl (7.77%), Ca-SO4, Mg-Cl, Na-Cl and Na- SO4 accounts only 14.4
% in the entire state.
The dominance of Ca-HCO3 type of water is observed in different formations like basalt, alluvial,
granite, gneiss, laterite and schist's. Besides this, other following observations could be made:
1. Alkaline earth's (Ca+Mg) and weak acids (CO3+HCO3) both exceeds alkali metals (Na+K) and
strong acids (Cl+SO4) in most of the samples and is dominated in the entire state irrespective of
different geological formations.
2. Alkaline earth's exceeds alkali metals in and strong acids exceeds weak acids (Ca/Mg-Cl type of
water) in 22 % of samples:
3. Alkali metal exceeds alkaline earth's & weak acids exceeds strong acids (Na-HCO3 type of
water) in 4 % of samples;
4. Alkali metal exceeds alkaline earth's & strong acids exceeds weak acids (Na-Cl type of water)
in only 2 % of samples.
The physico-chemical characteristic of ground water is due to the dissolved gases/ions in it from the
atmosphere, soil strata and minerals and rocks with which it comes in contact. The concentration of
CO3--, HCO3
-, OH
- and H
+ ions and dissolved CO2 gases decide the acidic or basic nature of water
while the salts of ions like Ca++
and Mg++
in water makes it soft and hard. Water with high Na+ and
Cl- concentration can make the water saline. Nitrate ions percolated from anthropogenic sources can
become predominant major anion in groundwater. The dissolution of fluoride ions in groundwater
from its minerals or rocks reaches its concentration in significant amount.

49
6.4 Groundwater Quality Monitoring by GSDA
6.4.1 Introduction
Groundwater is exploited in the State for domestic, livestock and irrigation purposes since earliest
times. Its use has grown spirally with population growth and agro industrial development during the
last two decades. More than 70% of the rural water supply schemes in the state are based on
groundwater. Similarly, out of total irrigated area in the state, more than 55% area is irrigated by
groundwater. Thus, groundwater plays a very important role in the State’s economy & therefore
needs to be monitored scientifically both in terms of quantity & quality, for its sustainable
development & management. The National water policy also envisages creation of standardized,
comprehensive, reliable & comprehendible national information system on water resources
covering both surface & groundwater by establishing a network of purpose built groundwater
quantity & quality monitoring stations.
6.4.2 Background
Groundwater Surveys & Development Agency was established as an independent organization in
the year 1972, for planning, programming, exploration, assessment, development & management of
Ground water resources of the state. The important aspect of assessment of Groundwater quality for
various uses like drinking, irrigation & industry was felt to be a necessity & a State level water
quality analytical laboratory was established at Pune in the year 1978. As the exploitation of
groundwater grew consistently with the increase population & development of agro industrial
sector, a need was felt to decentralize the water quality analytical laboratory. Accordingly, six
regional water quality analytical laboratories were established at Pune, Nagpur, Amrawati, Nashik,
Aurangabad & Kokan, and New Mumbai in the year 1987-1988. It has faciliated in the quick
transport of the water samples & it’s timely analysis & faster communication of results to district’s
Senior Geologist for appropriate action.
6.4.3 Groundwater Quality Monitoring
Under hydrology project, Groundwater quality monitoring network has been established. The
following objectives were decided for groundwater Quality monitoring in the State.
• Identification of baseline conditions. This will provide background information on
groundwater quality for studying natural process.
• To observe long term trends in groundwater quality. This will show trends of
groundwater quality changes derived from natural causes and human (anthropogenic)
activities.
• To find the suitability of groundwater for drinking & irrigation purposes.
50
• To observe and study the reasons of salinity in coastal area.
• To study the groundwater quality in irrigation command area and observe the extent of
groundwater pollution due to agricultural activities.
• To identify and monitor the locations of major pollutant sources e.g. landfill sites,
domestic sewage, industrial waste disposal and mining activities.
• Monitoring of nitrate, fluoride and iron concentration in groundwater and to identify
fluoride, nitrate and iron vulnerable areas (Zones).
• To calibrate and validate groundwater quality models which may have been developed
for pollution control, seawater intrusion, contaminant migration, prediction of nitrate
trends.
After the due consideration of objectives the monitoring network for Maharashtra was designed and
this is based on Hydrogeology, hydromorphology, water use & water quality issues. Groundwater
quality monitoring network consist of three types of stations namely Baseline, Trend and Trend cum
surveillance. In the state 3370 key wells were identified as baseline stations with density of
approximately one station per 100km. These wells give comprehensive picture of the quality of the
groundwater in the state. Out of these key wells, 975 i.e. 30% baseline stations were classified as
Trend and Trend cum Surveillance stations. Presently only baseline monitoring work is carried out.
Samples from 1871 observations wells were collected and analyzed during the year January-
December 2004.
6.5 Water Quality Monitoring by CPCB
CPCB in collaboration with concerned SPCBs / PCCs established a nationwide network of water
quality monitoring comprising 1019 stations in 27 States and 6 Union Territories. Out of 1019
stations, 73 stations are from Maharashtra covering 45 river stations, 3 from creeks and 25 well
water samples. The monitoring is done on monthly or quarterly basis in surface waters and on half
yearly basis in case of ground water.

51
Monitoring Stations under MINARS Projects- Ground Water
Sr.No Station
code Type Location Latitude Longitude
Water
quality
program
Monito
ring
frequen
cy
1 1984 Bore
well
Bore well at M/s Tata
Iron &Steel Co.Ltd,
S-76,
(Indl.Estate,Tarapur),
Village-MIDC,
Tarapur
Taluka- Palghar,
District-Thane.
19° 47.233’ 72° 43.851’ MINAR
S
H
2 1985 Dug well Dug well at 5 -Star
Industrial estate,
Village-Kashimira
Taluka-Mira-
Bhayander
District-Thane
19° 6.422’ 72° 52.310’ MINAR
S
H
3 1986 Bore
well
Bore well at Village-
Motapada
Taluka- Dahanu
District- Thane
19° 41.185’ 72° 45.887’ MINAR
S
H
4 1987 Bore
well
Bore well Village-
Gokhiware
Taluka- Vasai
District- Thane
19° 4.783’ 72° 51.380’ MINAR
S
H
5 1988 Bore
well
Bore well at
Gharatwadi,
Village- Aliyali
Taluka- Palghar
District- Thane
19° 41.183’ 72° 45.924’ MINAR
S
H
6 1989 Bore
well
Bore well at MWML
site,Village-
Karawla,Taloja
Taluka- Panvel
District- Raigad
19° 05.871’ 73° 06.903’ MINAR
S
H
7 1990 Well BMW
Site,Burudgaon,
Ahmednagar, Nashik
MINAR
S
H
8 1991 Well MSW Site, Pathardi,
Nashik
MINAR
S
H

52
Sr.No Station
code Type Location Latitude Longitude
Water
quality
program
Monito
ring
frequen
cy
10 1993 Well Phandarpur,
Gangapur,
Aurangabad
MINARS H
11 1994 Well TPS-Durgapur,
Chandrapur
MINARS H
12 1995 Well Khaperkheda, Nagpur MINARS H
13 1996 Well Koradi, Nagpur MINARS H
14 1997 Well Raipur, Nagpur MINARS H
15 1998 Well Bhahmni,Kalmeshwar
, Nagpur
MINARS H
16 1999 Well Sangera, Gondia,
Nagpur
MINARS H
17 2000 Well Bhandewari, Nagpur MINARS H
18 2001 Well Sukali, Amravati MINARS H
19 2002 Well Akot, Akola,
Amravati
MINARS H
20 2003 Well Sawargaon,Yavatmal,
Amravati
MINARS H
21 2004 Well Parvati Industrial
Estate, Yadrav, Shirol,
Kolhapur.
MINARS H
22 2005 Well Khanjirenagar,
Ichalkaranji, Kolhapur
MINARS H
23 2006 Well MIDC, Shinoli,
Chendgad, Kolhapur
MINARS H
24 2007 Well Savali, Sangli,
Kolhapur
MINARS H
25 2008 Well Rasulwadi-
Sambarwadi, Sangli,
Kolhapur Chinchwad,
Pune
MINARS H

53
CHAPTER – VII
RREESSUULLTTSS AANNDD CCOONNCCLLUUSSIIOONNSS
7.1 Surface Water - Hydrology Project:
The following parameters are found to be maximum affected at the following locations:
pH: Tapi River - Sarangkheda - 8.6
DO: Bhima River - Bundgarden – 1.2 mg/L
BOD : Ulhas River - Manda – 71.7 mg/L
Hardness: Ulhas River - Manda – 1138 mg/L
7.1.1. Hot Spot River Godavari – Takli (Nashik)
Sr.
No Parameter Tolerance Limit Summer Monsoon Winter Remarks
1 pH 6.50 to 8.50 7.50 7.6 7.50 OK
2 DO > 6 mg/L 3.40 3.90 3.30 Worst
3 BOD < 2 mg/L 39.3 34.0 25.80 Worst
4 Hardness up to 300 mg/L 219 194 221 OK
The water quality at Takli (Nashik) is found to be worst with reference to DO and BOD whereas pH
and Hardness are found within limit.
7.1.2. Hot Spot River Tapi – Sukvad and Sarangkheda
Sr.
No Parameter
Tolerance
Limit Location Summer Monsoon Winter Remarks
Sarangkheda 8.60 8.20 8.10 Worst in
summer 1 pH 6.50 to 8.50
Sukwad 8.4 8.20 8.0 Ok
Sarangkheda 7.20 5.20 6.10 Worst in
Monsoon
2 DO >6 mg/L
Sukwad 8.10 5.30 5.90
Worst in
Monsoon and
marginally
bad in winter
Sarangkheda 21.1 49.8 24.0 Worst 3 BOD < 2 mg/L
Sukwad 17.4 29.10 22.8 Worst
Sarangkheda 140 149 160 OK 4 Hardness
Up to 300
mg/L Sukwad 161 169 147 OK
The water quality at Sarangkheda and Sukwad is worst affected with reference to BOD. The DO at
Sukwad is less than stipulated limit during monsoon and winter. pH at Sarangkheda is exceeding
the limit. Hardness at both locations is within limit.

54
7.1.3. Hot Spot -River Mula-Mutha & Bhima – Bundgarden and Pandharpur respectively
Sr
No Parameter
Tolerance
Limit Location Summer Monsoon Winter Remarks
Bundgarden 7.4 7.6 7.3 OK 1 pH 6.50 to 8.50
Pandharpur 8.10 8.00 7.9 OK
Bundgarden 1.3 2.3 1.2 Worst 2 DO >6 mg/L
Pandharpur 5.50 5.30 5.50 Worst
Bundgarden 22 11.3 23.3 Worst 3 BOD < 2 mg/L
Pandharpur 5.0 3.7 5.50 Worst
Bundgarden 147 143 152 OK
4 Hardness Up to 300
mg/L Pandharpur 268 284 582 Worst in
winter.
The water quality at Bundgarden and Pandharpur is worst affected w.r.t. DO and BOD. Hardness at
Pandharpur is worst in winter.
7.1.4. Hot Spot River Krishna - Sangli
Sr. No Parameter Tolerance Limit Summer Monsoon Winter Remarks
1 pH 6.50 to 8.50 8.20 7.80 8.00 OK
2 DO > 6 mg/L 5.0 5.40 5.60 Worst
3 BOD < 2 mg/L 1.50 1.80 3.10 Worst in
winter
4 Hardness up to 300 mg/L 249 150 245 OK
The water quality at Sangli is worst affected w.r.t. DO. In winter BOD is exceeding the limit.
Hardness and pH are found in limit.
7.1.5. Hot Spot River Wardha – Dhabha
Sr.
No Parameter Tolerance Limit Summer Monsoon Winter Remarks
1 pH 6.50 to 8.50 8.6 8.1 8.3 Worst in
summer
2 DO > 6 mg/L 5.7 6.1 7.0 Worst in
summer
3 BOD < 2 mg/L 3.0 3.0 2.7 Worst
4 Hardness up to 300 mg/L 208 176 188 OK
The water quality at Dhabha is worst affected in summer w.r.t. pH & DO. BOD is exceeding the
limit whereas, Hardness is found within limit.
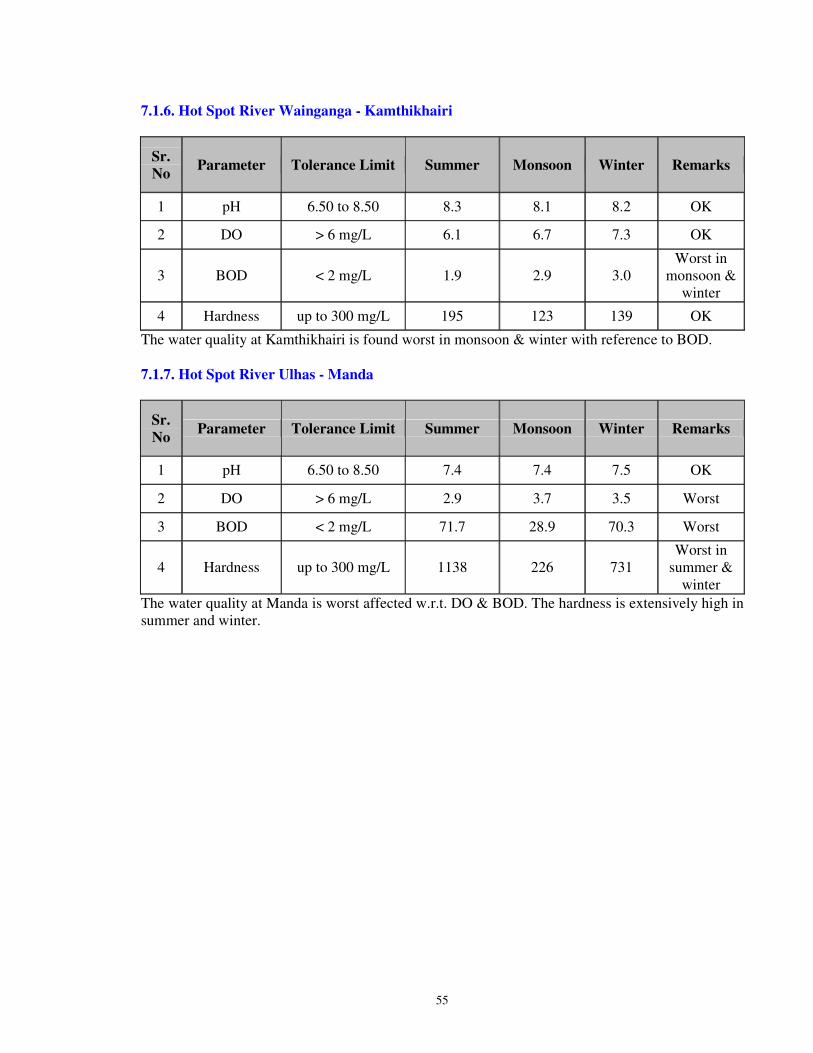
55
7.1.6. Hot Spot River Wainganga - Kamthikhairi
Sr.
No Parameter Tolerance Limit Summer Monsoon Winter Remarks
1 pH 6.50 to 8.50 8.3 8.1 8.2 OK
2 DO > 6 mg/L 6.1 6.7 7.3 OK
3 BOD < 2 mg/L 1.9 2.9 3.0
Worst in
monsoon &
winter
4 Hardness up to 300 mg/L 195 123 139 OK
The water quality at Kamthikhairi is found worst in monsoon & winter with reference to BOD.
7.1.7. Hot Spot River Ulhas - Manda
Sr.
No Parameter Tolerance Limit Summer Monsoon Winter Remarks
1 pH 6.50 to 8.50 7.4 7.4 7.5 OK
2 DO > 6 mg/L 2.9 3.7 3.5 Worst
3 BOD < 2 mg/L 71.7 28.9 70.3 Worst
4 Hardness up to 300 mg/L 1138 226 731
Worst in
summer &
winter
The water quality at Manda is worst affected w.r.t. DO & BOD. The hardness is extensively high in
summer and winter.

56

57

58

59
7.2 Ground Water - Groundwater Surveys & Development Agency:
The following parameters are found to be maximum affected at the following locations:
pH: village Ajnale- taluka Sangola- dist Solapur- 10.2
village Yellur – taluka Walva – dist Sangli – 10.2
village Palaspur – taluka Himayatnagar- dist Nanded- 10.2
TDS: village Hirapur- taluka Georai – dist Beed – 6528 mg/L
Hardness: village Pujarwadi – taluka Atpadi – dist Sangli – 2720 mg/L
Alkalinity: village Pangaon- taluka Barshi – dist Solapur – 1000mg/L
Calcium: village Pujarwadi – taluka Atpadi- dist Sangli -944 mg/L
Sodium: village Shinganapur – taluka Daryapur – dist Amravati - 1530 mg/L
Iron: village Sonawade – taluka Kudal – dist Sindhudurga - 6.1 mg/L
Chloride: village Shinganapur – taluka Daryapur – dist Amravati - 2673 mg/L
60
Sulphate: village Kalkhed - taluka Shegaon - dist Buldhana - 1848 mg/L
Nitrate: village Muthad - taluka Bhokardan – dist Jalna - 239 mg/L
Fluoride: village Mop - taluka Risod –dist Washim - 6.0 mg/L
1. pH :
It is observed that the groundwater quality in the state is of alkaline nature. The maximum pH value
observed is 10.2 for the following sources:
Nanded Himayatnagar Palaspur Sangli
Naned Kinwat Apporopeth Walwa
Solapur Sangola Ajnale Yellur
Solapur Sangola Hangirge
Comparison with BIS standard shows that total 137 sources have pH value more than 8.5, which are
unacceptable for drinking purpose.
2. TDS:
An examination of TDS data shows that the highest value observed is 6528 mg/L at village Hirapur,
taluka Gewara from Beed district, Total 61 sources have shown TDS value more than permissible
limit that is 2000 mg/L.
3. Hardness:
The well water at village Pujarwadi, taluka Atpadi from Sangali district is having hardness value
2720 mg/L which is 2.5 times more than prescribed limit. In the Maharashtra state, 203 well waters
have shown hardness value more than 600 mg/L. Pune and Aurangabad region is having more
hardness problem as compared to other regions.
4. Alkalinity:
The maximum value of alkalinity observed is 1000 mg/L from village Pangaon, taluka Barshi from
Solapur district. Total 21 well waters have exceeded the permissible limit of alkalinity and
unsuitable for drinking purposes.
5. Calcium:
The well water at Pujarwadi village, Atpadi taluka, Sangli district is having Calcium value 944
mg/L. Total 56 well waters have exceeded the potable limit that is 200 mg/L.
6. Sodium:
The highest concentration of sodium observed is 1530 mg/L at village Shinganapur, taluka
Daryapur from Amravati district which is 7.6 times more than the WHO guideline value. In the
State 119 well waters have shown sodium concentration more than 200 mg/L. Higher concentration
of sodium is observed in Amrawati region in the saline tract of Tapi-Purna alluvium.

61
7. Iron:
The maximum iron concentration observed is 6.1 mg/L at Sonawade village, taluka Kudal from
Sindhudurga district. In the State 54 well waters have iron concentration more than 1.0 mg/l
8. Chloride:
Highest concentration of chloride is 2673 mg/L from Shinganapur village, Daryapur taluka, and
Amravati district. Total 13 well waters have exceeded the maximum permissible value of chloride
that is 1000 mg/L.
9. Sulphate:
The highest sulphate concentration observed is 1848 mg/L at Kalkhed village, taluka Shegaon from
Buldhana district and is 4.6 times more than the prescribed BIS limit. Total 30 well waters have
sulphate cocentration more than 400 mg/L.
10. Nitrate:
The maximum value of Nitrate observed is 239 mg/L at Muthad village, taluka Bhokardan from
Jalna district and is 9 times more than the BIS permissible limit. It is also observed that 319 well
waters have exceeded the BIS permissible limit.
11. Fluoride:
The highest value of fluoride observed is 6.0 mg/l from Mop village, Risod taluka, and Washim
district. Total 56 well waters have fluoride concentration more than 1.5 mg/l; hence these sources
are unacceptable for the community for drinking purposes.

62
Water Quality Monitored By GSDA
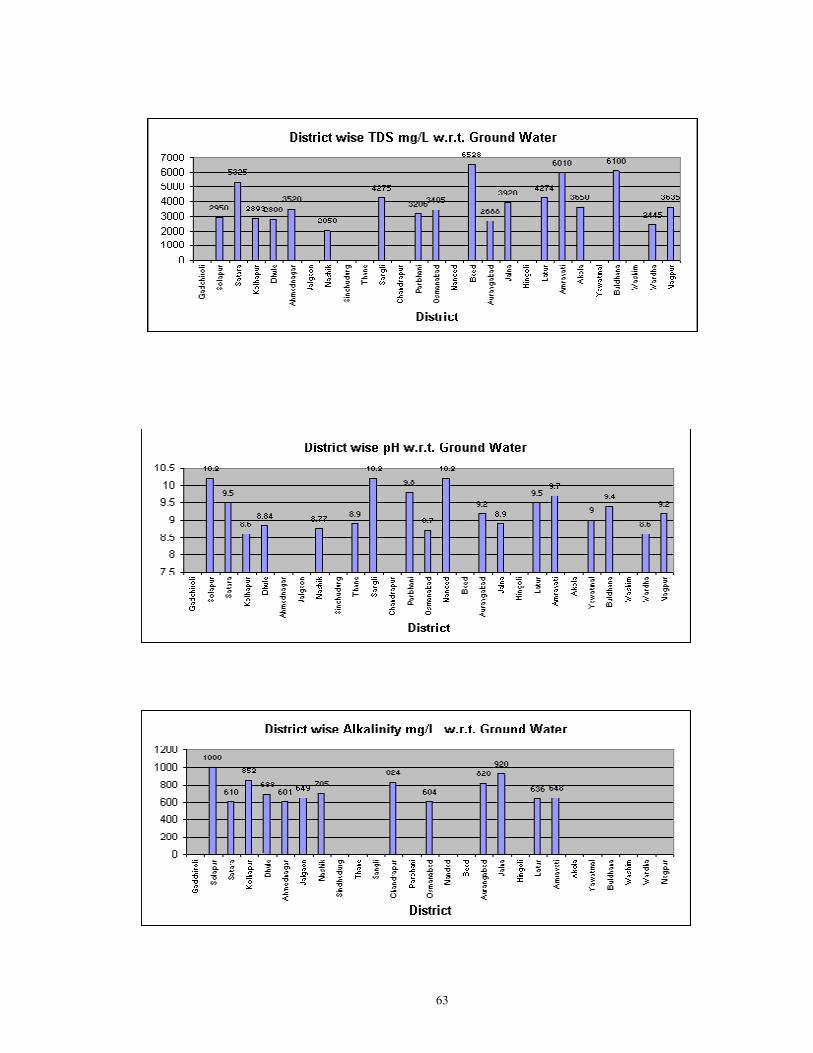
63

64

65

66
Water Quality Monitored By GSDA

67

68
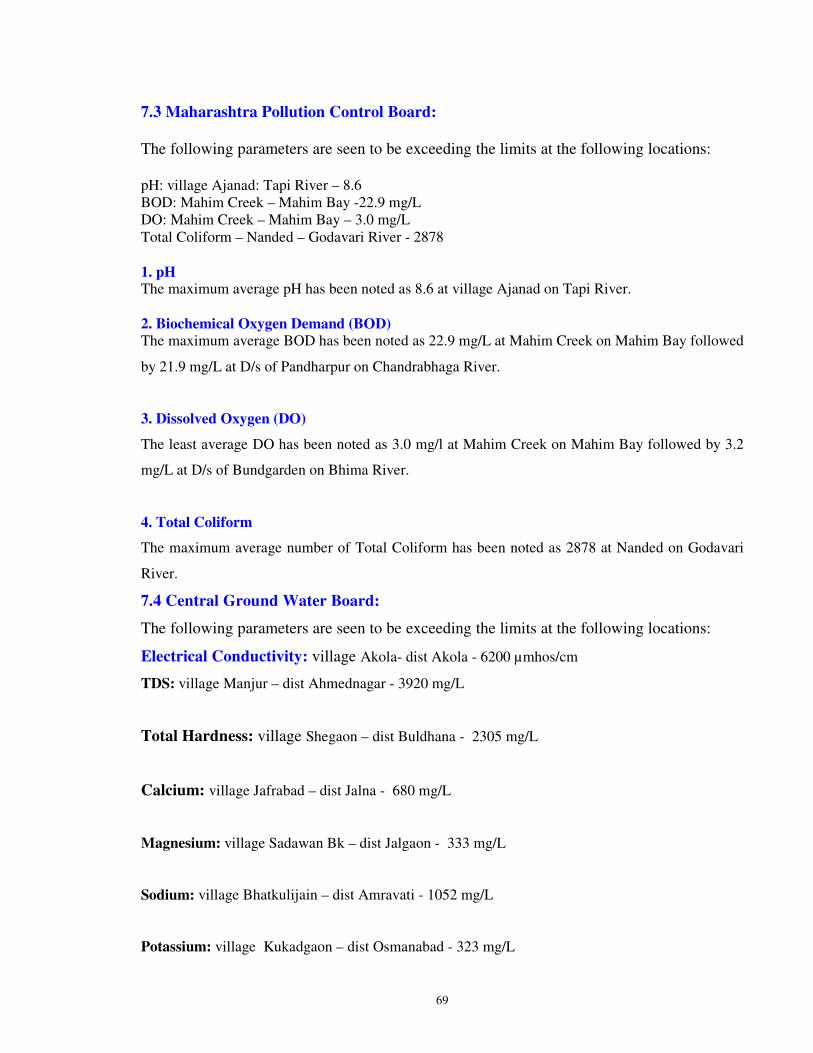
69
7.3 Maharashtra Pollution Control Board:
The following parameters are seen to be exceeding the limits at the following locations:
pH: village Ajanad: Tapi River – 8.6
BOD: Mahim Creek – Mahim Bay -22.9 mg/L
DO: Mahim Creek – Mahim Bay – 3.0 mg/L
Total Coliform – Nanded – Godavari River - 2878
1. pH The maximum average pH has been noted as 8.6 at village Ajanad on Tapi River.
2. Biochemical Oxygen Demand (BOD)
The maximum average BOD has been noted as 22.9 mg/L at Mahim Creek on Mahim Bay followed
by 21.9 mg/L at D/s of Pandharpur on Chandrabhaga River.
3. Dissolved Oxygen (DO)
The least average DO has been noted as 3.0 mg/l at Mahim Creek on Mahim Bay followed by 3.2
mg/L at D/s of Bundgarden on Bhima River.
4. Total Coliform
The maximum average number of Total Coliform has been noted as 2878 at Nanded on Godavari
River.
7.4 Central Ground Water Board:
The following parameters are seen to be exceeding the limits at the following locations:
Electrical Conductivity: village Akola- dist Akola - 6200 µmhos/cm
TDS: village Manjur – dist Ahmednagar - 3920 mg/L
Total Hardness: village Shegaon – dist Buldhana - 2305 mg/L
Calcium: village Jafrabad – dist Jalna - 680 mg/L
Magnesium: village Sadawan Bk – dist Jalgaon - 333 mg/L
Sodium: village Bhatkulijain – dist Amravati - 1052 mg/L
Potassium: village Kukadgaon – dist Osmanabad - 323 mg/L

70
Chloride: village Dapoli – dist Raigad - 1911 mg/L
Sulphate: village Manjur – dist Ahmednagar - 1771 mg/L
Nitrate: village Sadawan Bk – dist Jalgaon - 899 mg/L
Fluoride: village Daodipar Khapa - dist Bhandara. - 4.2 mg/L
1. Electrical Conductivity
The maximum Electrical Conductivity has been noted as 6200 µmhos/cm at village
Akola from Akola district and Manjur from Ahmednagar district.
2. Total Dissolved Solids
The maximum Total Dissolved Solids has been noted as 3920 mg/L at village \
Manjur from Ahmednagar district.
3. Total Hardness
The maximum Total Hardness has been noted as 2305 mg/L at village Shegaon from Buldhana
district.
4. Calcium
The maximum Calcium has been noted as 680 mg/L at village Jafrabad from Jalna district.
5. Magnesium
The maximum Magnesium has been noted as 333 mg/L at Sadawan Bk. from Jalgaon district.
6. Sodium
The maximum Sodium has been noted as 1052 mg/L at Bhatkulijain from Amravati district.
7. Potassium
The maximum Potassium has been noted as 323 mg/L at village Kukadgaon from Osmanabad
district.
8. Chloride
The maximum Chloride has been noted as 1911 mg/L at Dapoli from Raigad district.
9. Sulphate
The maximum Sulphate has been noted as 1771 mg/L at Manjur from Ahmednagar district.
10. Nitrate
The maximum Nitrate has been noted as 899 mg/L at Sadawan Bk from Jalgaon district.
11. Fluoride
The maximum Fluoride has been noted as 4.2 mg/L at Daodipar Khapa from Bhandara district.

71
7.5 Central Water Commission: Since stations are few and data is inadequate, not considered for interpretation.
Water Quality data monitored by M.P.C.B. under MINARS Project during the period January-2005 - September - 2005

72

73

74

75

76

77

78

79
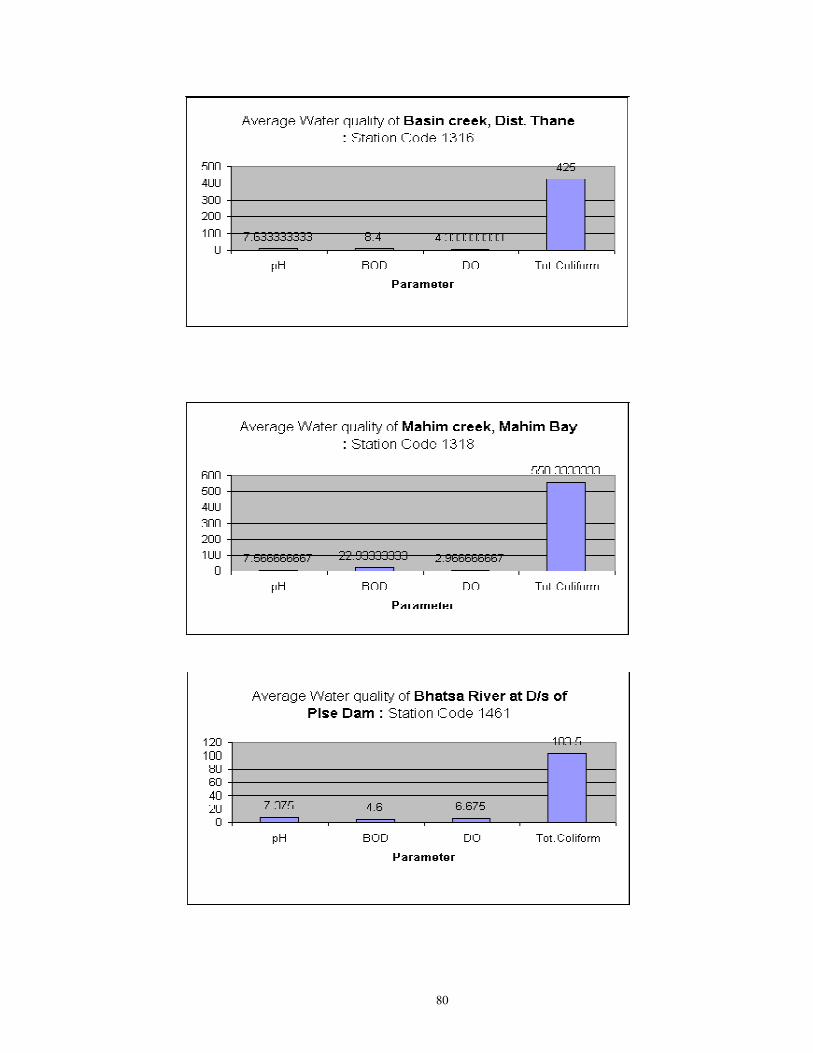
80

81

82

83

84

85
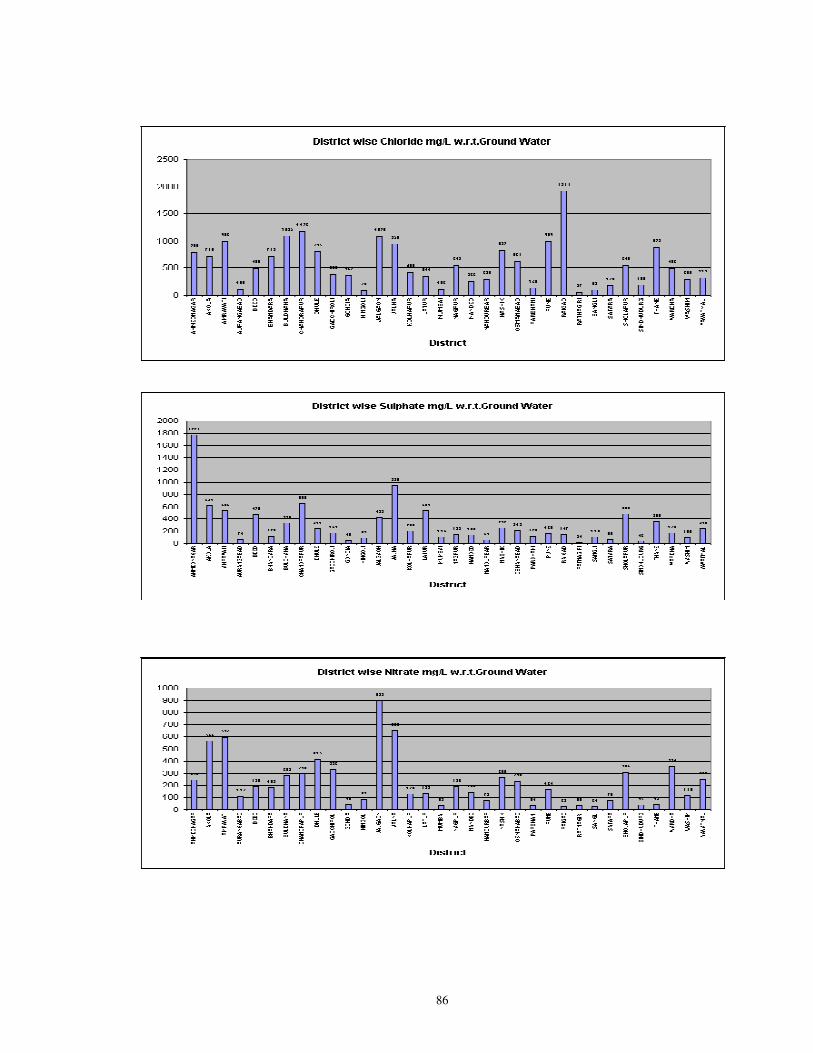
86

87

88
CHAPTER – VIII
RREECCOOMMMMEENNDDAATTIIOONNSS // RREEMMEEDDIIAALL MMEEAASSUURREESS
In order to prevent water pollution and for conservation of water and create mass awareness
in general public regarding surface and ground water quality aspects, recommendation /remedial
measures are described as below.
8.1 Qualitative/Technical:
1) Domestic effluents may be treated and disinfected before discharging.
2) Effluents from the non-point sources may be identified. These are required to be collected
and treated.
3) Tree plantation may be done on banks of rivers to minimize soil erosion and to improve the
area aesthetically.
4) The artificial recharge of ground water through integrated watershed management
programme and rainwater harvesting will help to improve the ground water quality in the
area where the problem exists.
8.2 Administrative:
1) Non-industrial activities such as Effluent Treatment Plants, Composting,Vermiculture,
Animal stalls, Cattle and Goat pens, Animal husbandry, Fish farming, Dumping of ash, Solid
waste may not be allowed in ‘No Development Zone’ (3 km on either side of river) of A-I
stretch of river. (Source to first dam)
2) No industries may be allowed in ‘No Development Zone’. Industries are to be set up at
distances specified by Pollution Control Board. River policy criteria (MPCB) may to be
fulfilled.
3) Classification, zoning of land for designated uses such as agriculture, forestry, green areas,
industrial activities, watersheds and human settlements based on assessment of environmental
considerations is necessary
4) Countrywide campaign to minimize soil and runoff losses by carrying out extensive works
like contour trenching, contour bunding, terracing and watersheds needs strengthening.
5) Measures for water conservation, recycling and optimal conjunctive use of surface and
ground water for specific uses are necessary.

89
6) Classification, zoning and regulations for monitoring the quality of the water bodies to
protect and enhance their capabilities to support the various designated
uses may be implemented
7) Measures for sustainable use of water resources are necessary
8) Farmers may be encouraged to use advanced irrigation system like drip irrigation in order to
conserve water and prevent erosion of the top soil.
9) Farmers in the catchment area should be educated against use of extensive amount of
pesticides and chemical fertilizers. They should be encouraged to use organic manures.
10 To create Environmental consciousness through education and mass awareness
programmes may be planned.
11) Besides the regular ground water quality monitoring, special studies should be
undertaken on micro-level basis where ground water quality has undergone deterioration to
ascertain the reasons, extent and remedial measures thereafter.
12) The lack of facilities and awareness for proper disposal of waste and wastewater is mainly
causing the ground water quality deterioration in the state. Hence, it is suggested that people in
the rural and urban parts of the State should be made aware about the pollution of the ground
water and its impacts. Strict regulations must be observed to stop pollution of ground water.
8.3 Legal:
1) Environmental Impact Assessment studies shall be carried out for all Developmental projects
right from planning stage and integrate it with their cost benefit considerations.
2) Legislative measures are must to check over exploitation of ground water for various uses as
per Maharashtra Groundwater (Regulation for Drinking Water Purpose) Act, 1993

90
Status Report on Water Quality of Water Bodies and ground water in
Maharashtra
for the year 2004-2005
ANNEXURES
Annex
No. Particulars
Page
No.
1 Significance Of Water Quality Parameters 91-93
2 Drinking Water Specifications (IS 10500) 94-94
3 Water Quality Criteria (C.P.C.B.) 95-95
4 Water Quality Standards For Best Designated Usages (M.P.C.B.) 96-97
5 Drinking Water Guidelines As Per WHO (Bacteriological Quality of
Drinking Water) 98-98
6 Drinking Water Guidelines As Per WHO (Chemicals of Health
Significance in Drinking Water) 99-99
7 Classification Of Fresh Water On Best Designated Uses 100-101
7-B Classification Of River Zone 102-104
7-C List Of Activities Allowed / Disallowed In ‘No Development Zone’ 105-105
8 The Gazette Of India (Constitution of Water Quality Assessment
Authority) 106-109
9 Uniform Protocol On Water Quality Monitoring-Notification 110-122
10 National Water Policy (April 2002) 123-136

91
ANNEXURE-1
SIGNIFICANCE OF WATER QUALITY PARAMETERS
1.
Temperature
It affects both chemical & biological reactions in the water. High temperature
reduces solubility of gases & amplifies taste & odour. At high temp. , metabolic
activity of organisms increases requiring more oxygen but at the same time the
solubility of oxygen decreases, thus increasing the stress. Change in temp occurs
due to sunlight intensity, climate, industrial, domestic & irrigation waste.
2. Colour Highly coloured waters are objected on aesthetic grounds. Colour is imparted
due to humic / fulvic acids, metallic ions such as iron & manganese, suspended
matter, phytoplankton, industrial wastes etc.
3. Odour It is due to dissolved organic impurities caused by living & decaying organisms
& accumulation of gases like ammonia & hydrogen sulfide. Algae also impart
odours. Chemicals added to water such as chlorine also add to the odour.
4. Turbidity It is caused by day, silt, organic matter & microorganisms Determination of
turbidity is important for its removal due to coagulation, filtration in water
treatment plants.
5.
Conductivity
It is a rapid measure of the total dissolved solids. It is an important parameter
for determining suitability of water & wastewater for irrigation.
5. Dissolved
Solids
They denote various kinds of minerals present in the water & also organic
substances in case of polluted waters. Dissolved solids in higher concentration
reduce its palatability. Plants are also adversely affected.
7. pH pH of water gets drastically changed due to disposal of waste, exposure to air,
biological activity & temperature changes. A lower value below 4 produces
sour taste & higher value above 8.5 an alkaline taste.
Extreme pH can result in rapid fish kills & alteration in flora and fauna.
8. Alkalinity It is caused due to carbonates & bicarbonates. In polluted waters, silicates,
phosphates, borates, humates also contribute to Alkalinity of water. Alkalinity
value is important for calculating alum dosage.
9.Dissolved
Oxygen
It is the most important parameter in water quality assessment. It is essential to
maintain presence of higher forms of biological life in the water. Low oxygen
in water can kill fish. Fish require oxygen concentration of 2 to 5 mg/L
depending on species. In waters heavily contaminated with organic matter,

92
dissolved oxygen disappears. Oxygen saturated waters have a pleasant taste.
10. B.O.D. It is the measure of biodegradable organic matter. If BOD is high, there is
depletion of DO.
11. C.O.D. It is the measure of chemically oxidizable organic matter.
12. Ammonia Occurrence of ammonia in the waters can be accepted as the chemical evidence
of organic pollution. Sewage has large quantities of nitrogenous matter, thus its
disposal increases the ammonia content of water. If only ammonia is present,
pollution by sewage is very recent. The occurrence of Nitrite with ammonia
indicates that some time has elapsed since pollution occurred. If only nitrate is
present, a long time has passed after sewage pollution has taken place. High
conc. of ammonia is toxic to man. Toxicity of ammonia increases with high pH.
13. Nitrite It indicates recent faecal pollution. It gets converted either into ammonia or
nitrate. High concentration of nitrite may cause 'Blue baby ' disease in infants.
14. Nitrate
It is the highest oxidized form of nitrogen. Domestic sewage & industrial waste
contribute to nitrates. Run-off from agricultural fields also contribute nitrate.
Ground waters can get contaminated by sewage rich in nitrates. Nitrates can
cause blue baby disease if above 40 mg/l .High concentration is useful in
agriculture but their entry into the water increases algal growth &
eutrophication.
15.
Phosphorus
The major sources of phosphorous are domestic sewage, detergents, fertilizers
& industrial effluents. Thus a high concentration is indicative of pollution. It
increases the growth of algae & thus eutrophication.
16. Sulfate
Discharge of domestic & industrial waste increases its concentration. It also
occurs naturally in water. Rainwater has high conc. of Sulphate in areas of high
air pollution. Sulphate produces objectionable taste above 300 mg/l.
17. Sulphide
Contributed due to organic pollution. It has objectionable odour and hence
decreases aesthetic value. Hydrogen Sulfide has toxic effects on aquatic
organisms. It is corrosive. It also promotes certain bacteria responsible for
clogging of pipes.
18. Chlorides
They occur naturally in waters. Discharge of sewage contributes to chloride.

93
Therefore chlorides serve as an indicator of pollution by sewage. It produces
salty taste.
19. Calcium
It is found naturally in waters. Disposal of sewage & industrial wastes are
important sources of calcium. It has no hazardous effects on human health.
High concentration is not desirable for washing & bathing due to suppression of
lather formation.
20.
Magnesium
It occurs naturally. Sewage & industrial waste also contribute to it. High
concentration renders water unpalatable & increases hardness of water.
21. Sodium
It occurs naturally. Industrial & Domestic Waste contributes to it. High
concentration can be related to cardiovascular diseases. High concentration
affects soil permeability & texture.
22.Heavy
Metals
Such as chromium cadmium, lead, copper, mercury, arsenic in high conc. have
toxic effects on human body.
23.Biological
parameters
In water receiving sewage, pathogenic organisms may be present. The bacteria
causing cholera, typhoid & dysentery may be present in sewage polluted water.
Polluted water also contains several pathogenic viruses like that of jaundice &
poliomyelitis. Protozoan diseases like amoebic dysentery are caused by
ingesting polluting water. Besides pathogens, unwanted biological growth of
algae & fungi are of importance. They lead to eutrophication & hence hinder
recreation & spoil aesthetic value.

94
ANNEXURE-2
Drinking Water Specifications (IS 10500 )
Sr.No. Substances or Characteristic Requirement
(Desirable Limits)
Permissible Limits in the
Absence of Alternate Source
Units
1 Colour, Max 5 25 Hazen
2 Odour Unobjectionable - -
3 Taste Agreeable - -
4 Turbidity, Max. 5 10 NTU
5 pH Value 6.5-8.5 6.5 to 8.5 -
6 Total hardness (as CaCO3), Max 300 600 mg/l
7 Iron (as Fe), Max 0.3 1 mg/l
8 Chlorides (as Cl), Max 250 1000 mg/l
9 Residual, free chlorine, Min 0.2 - mg/l
10 Dissolved solids, Max 500 2000 mg/l
11 Calcium (as Ca), Max 75 200 mg/l
12 Copper (as Cu), Max 0.05 1.5 mg/l
13 Manganese (as Mn), Max 0.1 0.3 mg/l
14 Sulphate (as SO4), Max 200 400 mg/l
15 Nitrate (as NO3), Max 45 100 mg/l
16 Fluoride (as F), Max 1 1.5 mg/l
17 Phenolic compounds (as C6H5OH), Max 0.001 0.002 mg/l
18 Mercury (as Hg), Max 0.001 0.001 mg/l
19 Cadmium (as Cd), Max 0.01 0.01 mg/l
20 Selenium (as Se), Max 0.01 0.01 mg/l
21 Arsenic (as As), Max 0.05 0.05 mg/l
22 Cyanide (as CN), Max 0.05 0.05 mg/l
23 Lead (asPb), Max 0.05 0.05 mg/l
24 Zinc (as Zn), Max 5 5 mg/l
25 Anionic detergents (as MBAS), Max 0.2 0.2 mg/l
26 Chromium (as Cr+6), Max 0.05 0.05 mg/l
27 Poly-nuclear aromatic hydrocarbon (PAH), - - g/l
28 Mineral oil, Max 0.01 0.03 mg/l
29 Pesticides, Max Absent 0.001 mg/l
30 Radioactive materials -
a) Alpha emitters,Max - 0.1 Bq/l
b) Beta emitters,Max. - 1 pci/l
31 Alkalinity, Max 200 600 mg/l
32 Aluminium (as Al), Max 0.03 0.2 mg/l
33 Boron, Max 1 5 mg/l
34 Magnesium ,Max 30 100 mg/l
35 Total Coliforms Absent 10 per 100 ml
36 E.coli Absent Absent per 100 ml
Standards for Bacteriological Examination as per IS 10500 : 1991 a) Throughout any year, 95 percent of samples should not contain any coliform organisms in 100ml;
b) No sample should contain E. coli in 100 ml;
c) No sample should contain more than 10 coliform organisms per 100ml; and
d) Coliform organisms should not be detectable in 100 ml of any two consecutive samples.

95
ANNEXURE-3
Water Quality Criteria (C. P. C. B.)
Designated-Best-Use Class of
water Criteria
Drinking Water Source
without conventional
treatment but after
disinfections
A 1. Total Coliforms OrganismMPN/100ml shall
be 50 or less
2. pH between 6.5 and 8.5
3. Dissolved Oxygen 6mg/l or more
4. Biochemical Oxygen Demand 5 days 20oC
2mg/l or less
Outdoor bathing (Organised) B 1. Total Coliforms Organism MPN/100ml shall
be 500 or less
2. pH between 6.5 and 8.5
3. Dissolved Oxygen 5mg/l or more
4. Biochemical Oxygen Demand 5 days 20oC
3mg/l or less
Drinking water source after
conventional treatment and
disinfection
C 1. Total Coliforms Organism MPN/100ml shall
be 5000 or less
2. pH between 6 to 9
3. Dissolved Oxygen 4mg/l or more
4. Biochemical Oxygen Demand 5 days 20oC
3mg/l or less
Propagation of Wild life and
Fisheries
D 1. pH between 6.5 to 8.5
2. Dissolved Oxygen 4mg/l or more
3. Free Ammonia (as N) 1.2 mg/l or less
Irrigation, Industrial Cooling,
Controlled Waste disposal
E 1. pH between 6.0 to 8.5
2. Electrical Conductivity at 25oC micro
mhos/cm Max.2250
3. Sodium absorption Ratio Max. 26
4. Boron Max. 2mg/l
Below-E Not Meeting A, B, C, D & E Criteria

96
ANNEXURE-4
Water Quality Standards for Best Designated Usages (MPCB)
Category of Fresh Water A - I A-II A-III A-IV
Best Usage Unfiltered Public
water
supply after
approved
disinfection
Public water
supply with
approved
treatment equal
to coagulation,
sedimentation &
disinfection.
Not fit for
human
consumption,
Fish &
Wildlife
Propagation.
Fit for
Agriculture,
Industrial
cooling &
process water.
Chemical Qualities: Maximum allowable concentration
1. Toxic Substances
Arsenic (As) 0.3 mg/l 0.3 mg/l 1.0 mg/l 0.1 mg/l
Cadmium (Cd) 0.01 mg/l 0.01 mg/l - -
Chromium ( Cr) 0.05 mg/l 0.05 mg/l 0.05 mg/l 0.2 mg/l
Cyanide (CN) 0.05 mg/l 0.1 mg/l 0.05 mg/l 0.2 mg/l
Lead (Pb) 0.1 mg/l 0.1 mg/l - 0.1 mg/l
Boron (B) - - - 0.2 mg/l
Mercury (Hg) 0.001 mg/l 0.001 mg/l 0.001 mg/l 2.0 mg/l
Gross alpha activity 3 PCI/l 10-9 uc/ml 3 PCI/l 3 PCI/l
Gross Beta activity 30 PCI/l 10-8 uc/m 30 PCI/l 30 PCI/l
2. Substances affecting health
Fluoride (F) 1.5 mg/l 1.5 mg/l - 1.0 mg/l
Nitrates (NO3) 45 mg/l 45 mg/l - -
3. Substances affecting the portability of water
pH 6.5 to 8.5 6.0 to 8.5 6.5 to 9.0 6.5 to 9.0
T.D.S. - T.D.S. T.D.S. -.
Total Solids 1500 mg/l. 1500 mg/l. -. -
Total Suspended Solids 25 mg/l - - -
Total Hardness (Caco3) 50 mg/l - - -
Total Residual Chlorine - - - -
Electrical conduct at 250.
C - -
1000 x 10-6
mhos
3000 x 10-6
mhos
Free Carbon Di Oxide - - 12 mg/l -
Free Ammonical Nitrogen - - 1.2 mg/l -
Oil & Grease - - 0.1 mg/l -
Pesticides
- - 0.02 mg/l -

97
Biotic Index - - 6.0 mg/l -
Total Ammonical
Nitrogen 1.5 mg/l 1.5 mg/l - 50 mg/l
Chlorides (Cl) 600 mg/l 600 mg/l - 600 mg/l
Sulphates 400 mg/l 400 mg/l - 1000 mg/l
Copper (Cu) 1.5 mg/l 1.5 mg/l - -
Manganese (Mn) 0.5 mg/l 3.0 mg/l - -
Iron (Fe) 1.0 mg/l 5.0 mg/l - -
Sodium - - - -
Zinc (Zn) 15.0 mg/l 1.5 mg/l 5.0 mg/l 5.0 mg/l
Phenolic Compounds 0.002 mg/l 0.002 mg/l 0.05 mg/l -
Alkyl Benzene sulphates 1.0 mg/l 1.0 mg/l - -
Mineral Oil 0.3 mg/l 0.3 mg/l - -
Ammonia 1.5 mg/l 1.5 mg/l - -
B.O.D. (5 days 20 . C)
2.0 mg/l
(Monthly
average of
at least 10
samples)
5.0
mg/l(Monthly
average of
at least 10
samples)
10 mg/l 30 mg/l
C.O.D. - - - 150 mg/l
D.O.
Not less than 5
mg/l(Monthly
average of 100
samples)
4.0 mg/l Not less than 3
mg/l
Not less than 2
mg/l
Bacteriological Standards
:
Coliform Bact.
250
Not greater
than 5000
(MPN/100)

98
ANNEXURE-5
Drinking Water Guidelines as per WHO
Bacteriological Quality of Dringking Water a
Organisms Guidelines
All water intended for
drinking E.coli or thermotolerant
coliform bacteria b,c
Must not be detectable in any 100-ml
sample
Treated water entering the
distribution system E coli or thermotolerant
coliform Bacteria b
Total coliform bacteria
Must not be detectable in any 100-ml
sample
Must not be detectable in any 100-ml
sample
Treated water in the
distribution system
E.coli or thermotolerant
coliform Bacteria
Total coliform bacteria
Must not be detectable in any 100-ml
sample
Must not be detectable in any 100-ml
sample. In the case of large supplies,
where sufficient samples are
examined, must not be present in 95%
of samples taken throughout any 12-
month period.
Immediate investigative action must be taken if either E.coli or total coliform bacteria are detected.
The minimum action in the case of total coliform bacteria is repeat sampling; if these bacteria are
detected in the repeat sample, the cause must be determined by immediate further investigation.
Although E.coli is the more precise indicator of faecal pollution, the count of thermo tolerant
coliform bacteria is an acceptable alternative. If necessary, proper confirmatory tests must be
carried out. Total coliform bacteria are not acceptable indicators of the sanitary quality of rural
water supplies, particularly in tropical areas where many bacteria of no sanitary significance occur
in almost all untreated supplies.
It is recognised that, in the great majority of rural water supplies in developing countries, faecal
contamination is widespread. Under these conditions, the national surveillance agency should set
medium-term targets for progressive improvement of water supplies, as recommended in Volume 3
of Guidelines for drinking water quality.

99
ANNEXURE-6
Drinking Water Guidelines as per WHO
Chemicals of health significance in drinking water
Inorganic Constituents
Guideline Value (mg/L) Remarks
Antimony 0.05(P)a
Arsenic 0.01b(P) For excess skin cancer risk of
6x10⁻⁴
Barium 07
Berylium NADc
Boron 0.5(P)a
Cadmium 0.003
Chromium 0.05(P)
Copper 2(P) Based on acute gastrointestinal
effects.
Cyanide 0.07
Fluoride 1.5 Climatic conditions, volume of
water consumed, and intake
from other sources should be
considered when setting
national standards
Lead 0.01 It is recognized that not all
water will meet the guideline
value immediately; meanwhile,
all other recommended
measures to reduce the total
exposure to lead should be
implemented
Manganese 0.5(P) ATO
Mercury(total) 0.001
Molybdenum 0.07
Nickel 0.02
Nitrate (as NO3-) 50(acute) The sum of the ratio of the
Nitrite (as NO2-) 3(acute) Concentration of each to its
respective(acute) guideline
value should not exceed 1
Selenium 0.01
Uranium 0.002(P)

100
ANNEXURE-7
CLASSIFICATIONS OF
FRESH WATER ON
BEST DESIGNATED
USES

101
ANNEXURE-7-A
CLASSIFICATION OF FRESH WATER ON DESIGNATED USES
Sr.No. Classification Designated Best Uses
Fresh Waters-
1 A-I Drinking water source without conventional
treatment but after disinfection. Point from
where the river originates up to first
Designated / notified Dam / Weir.
2 A-II Drinking water source with conventional
treatment followed by disinfection. River
stretch below first designated / notified Dam /
Weir up to A-Ill / A-IV Class of waters
3 A-III Fish & Wild Life Propagation
4 A-IV Agriculture, Industrial cooling & Process

102
CRITERIA FOR SITING OF
INDUSTRIES WITH
REFERENCE TO
CLASSIFICATION OF
RIVER ZONES

103
ANNEXURE 7-B
CRITERIA FOR SITING OF INDUSTRIES WITH REFERENCE TO CLASSIFICATION
OF RIVER ZONES
Sr.No. Classification Criteria
Fresh Water
(a) 3 Kms. on the either
side of river.
No Development zone for
any type of Industries.
Only specified Non-
Industrial listed activities
are allowed.
(b) From 3 Kms. to 8 Kms
from river (H.F.L.) on
either side.
Classified Green and
Orange
category of Industries
irrespective of Investment,
with requisite pollution
control devices.
1 A-I
(c) Beyond 8 Kms. from
river (H.F.L.) on either
side
Any type of industry with
requisite pollution control
devices
(a) 1 Km. on either side of
river (H.F.L.)
No development zone.
Only specified Non-
Industrial Listed activities
are allowed.
(b) 1 km. to 2 Kms on
either side.
Classified Green & Orange
category of industries
irrespective of investment
with requisite pollution
control devices.
2 A-II
(c ) Beyond 2 Kms Any type of industry with
requisite pollution control
devices.

104
3 A-III (a) - Up to ½ Km. on
either side.
No development zones for
any type of industries.
Only specified Non -
Industrial Listed activities
are allowed.
(a) Between ½ to 1 km on
either side of river.
Classified Green & orange
category of industries
irrespective of investment,
with requisite pollution
control devices.
4 A-IV
(b ) Beyond 1 Km Any type of industry with
requisite pollution control
devices.
Note:-
i) Distances mentioned in the policy note above are shortest distances measured as the
crow flies.
ii) High Flood Level (H.F.L.) of river will be considered as bank of the river for measuring
the distances.
iii) If the ridge line is nearer than prescribed zone boundary, restriction apply up to the ridge
line.
iv) Arrangement for pollution control shall be full proof irrespective of the location.
v) In ‘No Development Zone’, the permissible activities and non-permissible activities are
separately prescribed.
vi) Categorisation of industries is suggestive in nature & may be reviewed and modified by
the Board, from time to time.
vii) Existing industries in ‘Non-Confirming Zone’ will be allowed to continue with adequate
pollution control arrangements. Expansion, diversification, modernization, substitution
shall be allowed subject, to reduction in pollution load at source.
viii) This does not absolve the Project Proponent from observing any other Rules /
Regulations applicable in specified areas like Coastal Regulation Zone / Bhatsa River
Basin Etc.
ix) Cases in pipe line would be dealt on merits of each case and would be considered
beyond a distance of 500 mtrs. from H.F.L. as per the prevailing policy.
x) The above classification also covers Lakes and other water bodies, excluding
underground water sources.
xi) Development activities in costal areas will continue to be regulated by Ministry of
Environment & forest’s notification ( CRZ Notification ) dated 19.02.1991.

105
ANNEXURE 7-C
LIST OF ACTIVITIES ALLOWED / DISALLOWED IN ‘NO DEVELOPMENT ZONE’
Suggestive list of Non- Industrial Activities which can be allowed in ‘No Development Zone’.
1) Fuel Wood Growing 6) Orchards Development
2) Furniture & Structural Wood Growing 7) Fruits & Berries Growing
3) Bamboo Growing 8) Nurseries Development
4) Grass & Fodder Growing 9) Medicinal Plants and Aromatic
Plants Growing
5) Sericulture without Processing 10) Water Abstraction works
Suggestive list of Non-Industrial Activities, which will not be allowed in ‘No Development
zone’.
1) Effluent Treatment Plant
2) Composting
3) Vermiculture
4) Animal stalls
5) Cattle & Goat Pens
6) Animal Husbandry
7) Fish Farming
8) Warehousing
9) Dumping of Ash, Waste, Solid Waste from City & Town

106
ANNEXURE-8 PTZ-330044/99 REGD. NO. D.L -33004/99
The Gazette of India
EXTRAORDINARY
¦ÉÉMÉ -2 JÉÆb÷-3 ={É JÉÆb÷(2)
PART II – Section 3 - Sub-section (ii)
|ÉÉÊvÉEòÉ®ú ºÉä |ÉEòÉʶÉiÉ
PUBLISHED BY AUTHORITY
xÉ<Ç Ênù±±ÉÒ, ¶ÉÖGòò´ÉÉ®ú VÉÚxÉ 22 2001/+ɹÉÉfø1, 1923
No. 41S1 NEW DELHI, FRIDAY JUNE 22, 2OO1/ASADHA 1, 1923
------------------------------------------------------------------------------------------------------------------------
{ɪÉÉÇ É®úhÉ B´ÉÆ ´ÉxÉ ¨ÉÆjÉÉ±ÉªÉ +Énäù¶É
xÉ<Ç Ênù±±ÉÒ 29 ¨É<Ç 2001 EòÉ.+É. 583 (+) {ɪÉÉÇ É®úhÉ(ºÉÖ®úIÉÉ +ÊvÉÊxÉªÉ¨É 1986(1986 EòÉ 29) <ºÉEäò ¤ÉÉnù =DiÉ +ÊvÉÊxÉªÉ¨É Eäò ¯û{É ¨Éä =α±ÉÊJÉiÉ) EòÒ vÉÉ®úÉ 3 EòÒ ={ÉvÉÉ®úÉ (1) +Éè®ú(3) ´nùÉ®úÉ |ÉnùkÉ ¶ÉÊDiɪÉÉä EòÉ |ɪÉÉäMÉ Eò®úiÉä ½ÚþB EåòÆùpù ºÉ®úEòÉ®ú BiÉ´nùÉ®úÉ
BEò |ÉÉÊvÉEò®úhÉ EòÉ MÉ`öxÉ Eò®úiÉÒ ½èþ ÊVɺÉä ‘VÉ±É MÉÖhÉ´ÉkÉÉ ¨ÉÚ±ªÉÉÆEòxÉ |ÉÉÊvÉEò®úhÉ’ Eäò xÉÉ¨É ºÉä VÉÉxÉÉ VÉÉBMÉÉ ÊVɺɨÉä <ºÉ +ÊvɺÉÚSÉxÉÉ Eäò ºÉ®úEòÉ®úÒ ®úÉVÉ{ÉjÉ Eäò iÉÉ®úÒJÉ iÉä iÉÒxÉ ´É¹ÉÉæ EòÒ +´ÉÊvÉ Eäò ʱÉB ÊxɨxÉʱÉÊJÉiÉ ºÉnùºªÉ ½þÉåÆMÉä 1 ºÉÊSÉ´É {ɪÉÉÇ É®úhÉ B´ÉÆ ´ÉxɨÉÆjÉÉ±ÉªÉ +vªÉIÉ 2 +{É®ú ºÉÊSÉ´É B´ÉÆ {ÉÊ®úªÉÉäVÉxÉÉ ÊxÉnäù¶ÉEò ®úɹ]ÅõÒªÉ xÉnùÒ ºÉÆ®úIÉEò ÊxÉnäù¶ÉÉ±ÉªÉ ºÉnùºªÉ {ɪÉÉÇ É®úhÉ B´ÉÆ ´ÉxÉ ¨ÉÆjÉÉ±ÉªÉ 3 +vªÉIÉ EäòÊpÆùùªÉ VÉ±É +ɪÉÉäMÉ ºÉnùºªÉ 4 +{É®ú ºÉÊSÉ´É ºÉnùºªÉ 5 ºÉ±ÉɽþEòÉ®ú ®úɹ]ÅõÒªÉ xÉnùÒ ºÉÆ®úIÉEò ÊxÉnäù¶ÉÉ±ÉªÉ {ɪÉÉÇ É®úhÉ B´ÉÆ ´ÉxÉ ¨ÉÆjÉÉ±ÉªÉ ºÉnùºªÉ 6 ºÉƪÉÖHò ºÉÊSÉ´É EÞòÊ¹É B´ÉÆ ºÉ½þªÉÉäMÉ ¨ÉÆjÉÉ±ÉªÉ ºÉnùºªÉ 7 ºÉƪÉÖHò ºÉÊSÉ´É ¶É½þ®úÒ ¨ÉɨɱÉä B´É MÉ®úÒ¤ÉÒ =x¨ÉÖ±ÉxÉ ¨ÉÆjÉÉ±ÉªÉ ºÉnùºªÉ 8 +vªÉIÉ, ¦ÉÚVÉ±É |ÉÉÊvÉEò®úhÉ ºÉnùºªÉ 9 +vªÉIÉ, EåòÊpùªÉ |ÉnÖù¹ÉhÉ ÊxɪÉÆjÉhÉ ¤ÉÉäbÇ÷ ºÉnùºªÉ 10 ÊxÉnäù¶ÉEò ¦ÉÉ®úiÉÒªÉ EÞò¹ÉÒ +xÉÖºÉÆvÉÉxÉ ºÉƺlÉÉxÉ, xÉ<Ç Ênù±±ÉÒ ºÉnùºªÉ 11) ÊxÉnäù¶ÉEò ®úɹ]ÅõÒªÉ {ɪÉÉÇ É®úhÉÒªÉ +ʦɪÉÉÆÊjÉEòÒ +xÉÖºÉÆvÉÉxÉ ºÉƺlÉÉxÉ xÉÉMÉ{ÉÚ®ú ºÉnùºªÉ 12 +ɪÉÖHò (VÉ±É |ɤÉÆvÉxÉ) VÉ±É ºÉƺÉÉvÉxÉ ¨ÉÆjÉÉ±ÉªÉ ºÉnùºªÉ

107
2.|ÉÉÊvÉEò®úhÉ EòÒ ÊxɨxÉʱÉÊJÉiÉ ¶ÉÊC÷÷iɪÉÉä iÉlÉÉ EòɪÉÇ ½þÉåÆMÉä I +ÊvÉÊxÉªÉ¨É EòÒ vÉÉ®úÉ 3 EòÒ ={ÉvÉÉ®úÉ 2 Eää JÉÆb÷(10) (11)(12)+Éè®ú (13) Eäò =±±ÉäÊJÉiÉ ¨ÉɨɱÉÉä Eäò ºÉƤÉÆvÉ ¨Éä Ênù¶ÉÉÊxÉnä¶É VÉÉ®úÒ Eò®úxÉä iÉlÉÉ ={ÉÉªÉ Eò®úxÉä Eäò ʱÉB =Hò +ÊvÉÊxÉªÉ¨É EòÒ vÉÉ®úÉ 5 Eäò iɽþiÉ ¶ÉÊDiɪÉÉä EòÉ |ɪÉÉäMÉ I I ÊxɨxÉʱÉÊJÉiÉ Eäò ºÉƤÉÆvÉ ¨Éä BVÉÆʺɪÉÉä(ºÉ®úEòÉ®úÒ/ºlÉlÉÉÊxÉªÉ ÊxÉEòɪÉÉä/MÉè®ú ºÉ®úEòÉ®úÒ) EòÉä Ênù¶ÉÉÊxÉnä¶É näùxÉÉ (Eò) VɱÉMÉÖhÉ´ÉkÉÉ ¨ÉÉìÊxÉ]õÊ®úMÉ ºÉƤÉÆvÉÒ Ê´ÉÊvɪÉÉä EòÉ ¨ÉÉxÉEòÒEò®úhÉ +Éè®ú <ºÉEäò {ɶSÉÉiÉ <ºÉEäò ={ɪÉÉäMÉ ½äþiÉÚ +ÉÆEòb÷É =i{ÉÊkÉ EòÒ MÉÖhÉ´ÉkÉÉ ºÉÊxÉζSÉiÉ Eò®úxÉÉ (JÉ) ºÉ´ÉÉækÉ¨É |ɪÉÉäMÉ {É®ú JÉ®úÉ =iÉ®úhÉä Eäò ʱÉB xÉnùÒ/VÉ±É ÊxÉEòɪÉÉä EòÒ VÉ±É MÉÖhÉ´ÉkÉÉ EòÒ ¤É½þɱÉÒ Eäò =nÂùnää¶É ºÉä +{Éʶɹ]õõ VÉ±É =ÊSÉiÉ ¶ÉÉävÉxÉ ºÉÖÊxÉζSÉiÉ Eò®úxÉä ºÉƤÉÆvÉÒ ={ÉÉªÉ Eò®úxÉÉ (MÉ) VɱÉMÉÖhÉ´ÉkÉÉ |É®ú¤ÉÆvÉxÉ IÉäjÉ ¨Éä ÂxÉÖºÉÆvÉÉxÉ +Éè®ú Ê´ÉEòɺÉÉi¨ÉEò MÉÊiÉÊ´ÉÊvɪÉÉ SɱÉÉxÉÉ (PÉ) EÞòÊ¹É Eäò Ê´ÉEòÉºÉ ½äiÉÖiÉ ÊºÉSÉÉ<Ç Eäò ʱÉB ¶ÉÉäÊvÉiÉ ¨É±ÉVɱÉ/]äb÷ ¤ÉʽþºjÉÉ´ÉÉä Eäò {ÉÖxÉSÉEÂò®úhÉ/{ÉÖxÉ|ÉúªÉÉäMÉ EòÉä ¤ÉføÉ´ÉÉ näùxÉÉ (b÷) VɱÉÊxÉEòɪÉÉåÆ EòÒ MÉÖhÉ´ÉkÉÉ ¨Éä ºÉÖvÉÉ®ú Eäò ʱÉB EòɪÉÃÇ ªÉÉäVÉxÉÉÆB iÉèªÉÉ®ú Eò®úxÉÉ iÉlÉÉ <ºÉ ºÉƤÉÆvÉ ¨Éä ¶ÉÖ û EòÒ MÉ<Ç ÎºEò¨ÉÉä/¶ÉÖ û EòÒ VÉÉxÉä ÉɱÉÒ ÎºEò¨ÉÉä Eäò EÂòÊ®úªÉÉx´ÉªÉxÉ EòÉä ¨ÉÉìÊxÉ]õ®ú Eò®úxÉÉ iÉlÉÉ {ÉÖxɺ´É±ÉÉäEòxÉ ¨ÉÖ±ªÉxÉÉÆEòxÉ Eò®úxÉÉ (SÉ) VɱÉMÉÖhÉ´ÉkÉÉ ºÉƤÉÆvÉÒ ºÉÆEòxÉ Eäò =ªÉÃ{ɶɨÉxÉ Eäò =nÂùnäù¶É ºÉä VÉ±É ÊxÉEòɱÉä VÉÉxÉä iÉlÉÉ ¶ÉÉäÊvÉ ¨É±ÉVɱÉ/]Âäb÷¤ÉʽþºjÉÉ´É ½þÉä vÉ®úiÉÒ {ÉiÉ xÉÊnùªÉÉä iÉlÉÉ +xªÉ VÉ±É ÊxÉEòɪÉÉä ¨Éä ¤É½þÉB VÉÉxÉä {É®ú |ÉÊiɤÉÆvÉ ±ÉMÉÉxÉä Eäò ʱÉB κEò¨Éä iÉèªÉÉ®ú Eò®úxÉÉ (Uô) xÉnùÒ |ÉhÉÉʱɪÉÉä ¨Éä VɱÉÒªÉ VÉÒ´ÉxÉ Eäò ÊxÉ´ÉÉǽþ ½ääiÉÖ xªÉÖxÉiÉ¨É ¤É½þÉ´É ¤ÉxÉÉB ®úJÉxÉÉ ´É¹ÉÉÇ VÉ±É Eäò BEòÊjÉEò®úhÉ EòÉä ¤ÉføÉ´ÉÉ näùxÉÉ (ZÉ) ¤ÉʽþºjÉÉ´É ¶ÉÉävÉEò EòÒ ±ÉÉMÉiÉ EòÉä Eò¨É Eò®úxÉä Eää ʱÉB ¨É½þi´É{ÉÚhÉÇ xÉnùÒ ¡èò±ÉÉ´ÉÉä {É®ú º´Éº´ÉÉÆMÉÒEò®úhÉ IɨÉiÉÉ+Éä EòÒ ={ɪÉÉäMÉ Eò®úxÉÃÉ (jÉ) +{Éʶɹ]õ ¦ÉÉ®ú +ɤÉÆ]õxÉ ºÉÖÊ´ÉvÉÉ Eäò ʱÉB |ÉúnÖ¹ÉhÉ ÊxɪÉÆjÉÃhÉ |ÉÉÊvÉEòÉÊ®úªÉÉä EòÉä ºÉÖSÉxÉÉ ={ɱɤvÉ Eò®úxÉÉ (]õ) ®úɹ]õÒªÉ VÉ±É ºÉƺÉÉvÉxÉ(¦ÉÖiÉ±É VÉ±É +Éè®ú ¦ÉÚVÉ±É nùÉäxÉÉä) EòÒ MÉÖhÉiÉÉ Ê÷÷ºlÉiÉÒ EòÒ ºÉ¨ÉÒIÉÉ Eò®úxÉÉ +Éè®ú VÉ±É MÉÖhÉiÉÉ Eäò ºÉÖvÉÉ®ú Eää ʱÉB +ɴɶªÉEò EòɪÉÇÇú´ÉÉ<Ç Eò®úxÉä ½äþiÉÚ |ÉúnÖùʹÉiÉ ºlɱÉÉä(½þÉì]õ º{ÉÉì]õºÉ) EòÉ {ÉiÉÉ ±ÉMÉÉxÉÉ (`ö) VÉ±É ºÉƺÉÉvÉxÉÉä Eäò |ɺÉƦÉxÉ ºÉä ºÉƤÉÆvnù ¨ÉÉxɱÉÉä Eäò ʱÉB =Hò +ÊvÉÊxÉªÉ¨É Eäò +ÆiÉMÉÇiÉ MÉÊ`öiÉ +lÉ´ÉÉ MÉÊ`öiÉ EòÒ VÉÉxÉä ´ÉɱÉä |ÉÉÊvÉEò®úhÉÉä/ºÉʨÉÊiɪÉÉä ºÉä +xªÉªÉÉäxªÉÊGòªÉÉ (b÷) <ºÉ |ÉEòÉ®ú EòÒ ºÉʨÉÊiɪÉÉä EòÉä ºÉÉè{Éä MÉB EòɪÉÇ EòÉä ºÉ¨ÉÊx´ÉiÉ Eò®úxÉä Eäò ʱÉB ®úÉVªÉ ºiÉÊ®úªÉ VÉ±É MÉÖhÉiÉÉ ºÉ¨ÉÒIÉÉ ºÉʨÉiÉÒªÉÃÉä (b÷¤±ªÉÖ CªÉÖ +É®ú ºÉÒ) EòÉ MÉ`öxÉ ºlÉÉ{ÉxÉÉ (fø) ÊxÉVÉÒ IÉäjÉÉä ºÉä ºÉƤÉÆÊvÉiÉ EäòÆpùù ºÉ®úEòÉ®ú +lÉ´ÉÉ ®úÉVªÉ +lÉ´ÉÉ ®úÉVªÉ ºÉ®úEòÉ®ú nÂù´ÉÉ®úÉ =x½þä (ºÉʨÉÊiɪÉÉä EòÉä ) ¦ÉäVÉä VÉÉxÉä ÉɱÉä ¦ÉÚiÉ±É +Éè®ú ¦ÉÚVÉ±É MÉÖhÉiÉÉ ºÉä ºÉƤÉÆvÉ ÊEòºÉÒ ¦ÉÒ {ɪÉÉÇ É®úhÉÒªÉ ¨ÉÖnÂùnäù {É®ú EòÉ®Çú´ÉɽþÒ Eò®úxÉÉ iÉÉÊEò ÊxÉÊnÇù¹]õõ =kÉ¨É ={ɪÉÉäMÉÉä EòÒ {ÉÖ¹]õ]õÒ Eäò ʱÉB MÉÖhÉiÉÉ EòÉä ¤ÉxÉÉB ®úJÉÉ VÉÉ ºÉEäò 3 |ÉÉÊvÉEò®úhÉ ´nùÉ®úÉ =Hò +ÊvÉÊxÉªÉ¨É EòÒ vÉÉ®úÉ 19 Eäò +ÆiÉMÉÇiÉ ¶ÉÊHòªÉÉä EòÉ ={ɪÉÉäMÉ ÊEòªÉÉ VÉÉBMÉÉ 4 |ÉÉÊvÉEò®úhÉ EòÉä ºÉÉè{Éä MÉB EòɪÉÉæ EòÉä +ɺÉÉxÉÒ Eäò Eò®úxÉä Eäò ʱÉB =ºÉEäò (|ÉÉÊvÉEò®úhÉ) ´nùÉ®úÉ IÉäjÉ Ê´É¶Éä¹ÉYÉ (b÷Éä ÉäxÉ BC÷÷ºÉ{É]Çõ) EòÒ ÊxɪÉÖÊHò EòÒ VÉÉ ºÉEòiÉÒ ½èþ. 5 |ÉÉÊvÉEò®úhÉ EòÉè ºÉÉè{Éä MÉB EòɪÉÉæ ¨Éä ºÉ½þɪªÉiÉÉ |ÉnùÉxÉ Eò®úxÉä Eäò ʱÉB VÉ±É ºÉƺÉÉvÉxÉ ¨ÉÆjÉÉ±ÉªÉ ´nùÉ®úÉ BEò |ÉEòÉä¹]õ EòÉ MÉ`öxÉ ÊEòªÉÉ VÉÉBMÉÉ 6 |ÉÉÊvÉEò®úhÉ ´nùÉ®úÉ ÊEòB MɪÉä EòɪÉÉæ ºÉä ºÉƤÉÆÊvÉiÉ Ê®ú{ÉÉä]Çõ iÉÒxÉ ¨ÉʽþxÉä ¨Éä Eò¨É Eäò Eò¨É BEò ¤ÉÉ®ú {ɪÉÉÇ É®úhÉ =Hò +ÊvÉÊxÉªÉ¨É EòÒ vÉÉ®úÉ 19 Eäò +ÆiÉMÉÇiÉ ¶ÉÊHòªÉÉä EòÉ ={ɪÉÉäMÉ ÊEòªÉÉ VÉÉBMÉÒ
({ÉÉ ºÉÆ VÉÉä 15011/8/2000 BxÉ +É®ú ºÉÒ b÷Ò) B.B¨É.MÉÉäJɱÉä +{É®ú ºÉÊSÉ´É

108
MINISTRY OF ENVIRONMENT AND FORESTS
ORDER
New Delhi, the 29th May, 2001
S.O. 583 (E).- In exercise of the powers conferred by sub-sections (1) and (3) of section 3 of
the Environment (Protection) Act, 1986 ( 29 of 1986) (hereinafter reference as the said Act), the
Central Government hereby constitutes an authority to be known as “Water Quality Assessment
Authority” consisting of the following members for a period of this years with effect from the date
of publication of this notification is the Official Gazette, namely
1. Secretary, Ministry of Environment and Forests -Chairperson
2. Additional Secretary and Project Director, National River
Conservation Directorate, Ministry of Environment and forests -Member
3. Chairman, Central Water Commission -Member
4. Additional Secretary, Ministry of Water Resources -Member
5. Adviser, National River Conservation Directorate, Ministry of
Environment and Forests -Member
6. Joint Secretary, Ministry of Agriculture and Cooperation -Member
7. Joust Secretary, Ministry of Urban Affairs and Poverty
Alleviation -Member
8. Chairman, Central Ground Water Authority -Member
9. Chairman, Central Pollution Control Board -Member
10. Director, Indian Agricultural Research Institute, New Delhi -Member
11. Director, National Environmental Engineering Research
Institute. Nagpur -Member
12. Commissioner (Water Management). Ministry of Water
Resources -Member
Secretary
2. The Authority shall exercise the powers and functions:-
I. to exercise powers under section 5 of the said Act for issuing directions and for taking measures
with respect to matters referred to in clauses (ix), (xi), (xii) and (xiii) of sub-section 2 of section 3 of
the Act:
II. to direct the agencies (government/local bodies/non-governmental) for the following:
(a) to standardize method(s) for water quality monitoring and to ensure quality of data
generation for utilization thereof;
(b) to take measures so as to ensure proper treatment of wastewater with a view to restoring the
water quality of the river/water bodies to meet the designated-best-uses;
(c) to take up research and development activities in the area of water quality management;
(d) to promote recycling/re-use of treated sewage/trade effluent for irrigation in development of
agriculture;
(e) to draw action plans for quality improvement in water bodies, and monitor and
review/assess implementation of the schemes launched/to be launched to that effect;

109
THE GAZETTE OF INDIA : EXTRAORDINARY [Part II- Sec 3(ii)]
(f) to draw scheme(s) for imposition of restriction in water abstraction and discharge of treated
Sewage/trade effluent on land, rivers and other water bodies with a view to mitigating crisis of
water quality
(g) to maintain minimum discharge for sustenance of aquatic life forms in river system;
(h) to promote rain water harvesting;
(i) to utilize self-assimilation capacities at the critical river stretches to minimize cost of effluent
treatment;
(j) to provide information to pollution control authorities to facilitate allocation of waste load;
(k) to review the status of quality of national water resources (both surface water & groundwater)
and identify ‘Hot Spots” for taking necessary actions for improvement in water quality;
(l) to interact with the authorities/committees constituted or to be constituted under the provisions
of the said Act for matters relating to management of water resources;
(m) to constitute/set-up State-level Water Quality Review Committees (WQRC) to coordinate the
work to be assigned to such committees; and
(n) to deal with any environmental issue concerning surface and groundwater quality which may be
referred to it by the Central Government or the State Government relating to the respective
areas, for maintenance and/or restoration of quality to sustain designated-best-use
3. The Authority shall exercise the powers under section 19 of the said Act.
4. This Author may appoint domain experts for facilitating the work assigned to it.
5. The Ministry of Water Resources shall create a cell to assist the Authority to carry out the
assigned functions.
6. The Authority shall furnish report about its activity at least once in three months to the Ministry
of Environment and Forests.
[F. No. J-15011/8/2000-NRCD]
M. GOKHALE, Addl Secy.

110
ANNEXURE-9
MINISTRY OF ENVIRONMENT AND FORESTS
NOTLFICATION
New Delhi, the 17 June, 2005
S. 0. 2l51.-WHEREAS the Water Quality Assessment Authority (WQAA) was constituted by the
Central Government vide Order No. S.O. 583 (E) dated the 29th May. 2001 and No. S.O. 635(E)
dated the 27 October, 2004 to exercise powers under section 5 of the Environment (Protection) Act,
1986 (29 of 1986) for issuing directions and for taking measures with respect to matters referred to
in clauses (ix),(xi), (xii) and (xiii) of sub-section(2) of section 3 of the said Act and to standardise
method(s) for water quality monitoring and to ensure quality of data generation for utilization
thereof and certain other purposes;
AND WHEREAS it is necessary and expedient to evolve water quality assessment and
monitoring protocol as directed by the Water Quality Assessment Authority in order to maintain
uniformity in the procedure for water quality monitoring mechanism by all monitoring agencies,
departments, Pollution Control Boards and such other agencies so that water related action plans
may be drawn up on the basis of reliable data;
AND WHEREAS the uniform process on water quality monitoring shall provide frequency
of monitoring, procedure for sampling, parameters for analysis, analytical techniques, quality
assurance and quality control system, infrastructure requirement for laboratories, procedure for data
processing, reporting and dissemination and such other matters as the Central Government deems
necessary for the said purpose, both for surface and ground water;
AND WHEREAS due to the deterioration of the river water quality, health and livelihood
of the downstream people are being severely affected and concerns are raised time and again;
AND WHEREAS the immediate maintenance and restoration of wholesomeness’ of the
river water quality is the mandate under the Water (Prevention and Control of Pollution) Act 974 (6
of 1974) and that of maintenance of the ground water quality by the Central Ground Water
Authority constituted under the provisions of the Environment (Protection) Act, 1986;
AND WHEREAS sub-rule(4) of rule 5 of the Environment (Protection) Rules, 1986,
provides that whenever it appears to the Central Government that it is in public interest to do so, it.
nay dispense with the requirement of notice under clause(a) of sub-rule(3) of the said rules”;

111
AND WHEREAS the Central Government is of the opinion that it is in public interest to
dispense with the requirement of notice under clause (a) of sub-rule(3) of rule 5 of the said rules to
issue the Order.
NOW, THEREFORE. in exercise of the powers conferred by section 3 of the Environment
(Protection) Act. 1986, the Central Government hereby makes the following order namely:-
1. Short title and commencement.
(a) This order may be called the Uniform Protocol on Water Quality Monitoring
Order, 2005.
(b) It shall come into force on the date of its publication in the Official Gazette.
2. Application- It shall apply to all organizations, agencies and any other body monitoring
surface and ground water quality for observance of uniform protocol on water quality monitoring.
3. Definitions-
In this Order, unless the context otherwise requires,-
(1) “agencies” means water quality monitoring agencies(government or non-government, local
bodies) and other organizations including research and academic institutions involved in water
quality monitoring of surface and ground waters;
(2) ‘Authority” means the Water Quality Assessment Authority (WQAA) constituted under sub-
sections (1) and (2) of section 3 of the Environment (Protection) Act) 1986;
(3) “Baseline stations” means the monitoring location where there is no influence of human
activities on water quality;
(4) “Flux stations or Impact stations” means the location for measuring the mass of particular
pollutant on main river stem for measuring the extent of pollution due to human interference or
geological feature at any point of time and is necessary for measuring impact of pollution control
measures adopted;
(5) “monitoring” means standardised measurement of identified parameters in order to define
status and trends of water quality;
(6) ”protocol” means a system of uniform water quality monitoring mechanism developed by the
Water Quality Assessment Authority constituted under sub-sections (1) and (3) of section 3 of the
Environment (Protection) Act, 1986;
(7)“Quality Assurance Programme” means a programme described in paragraph 12 of this
Order.
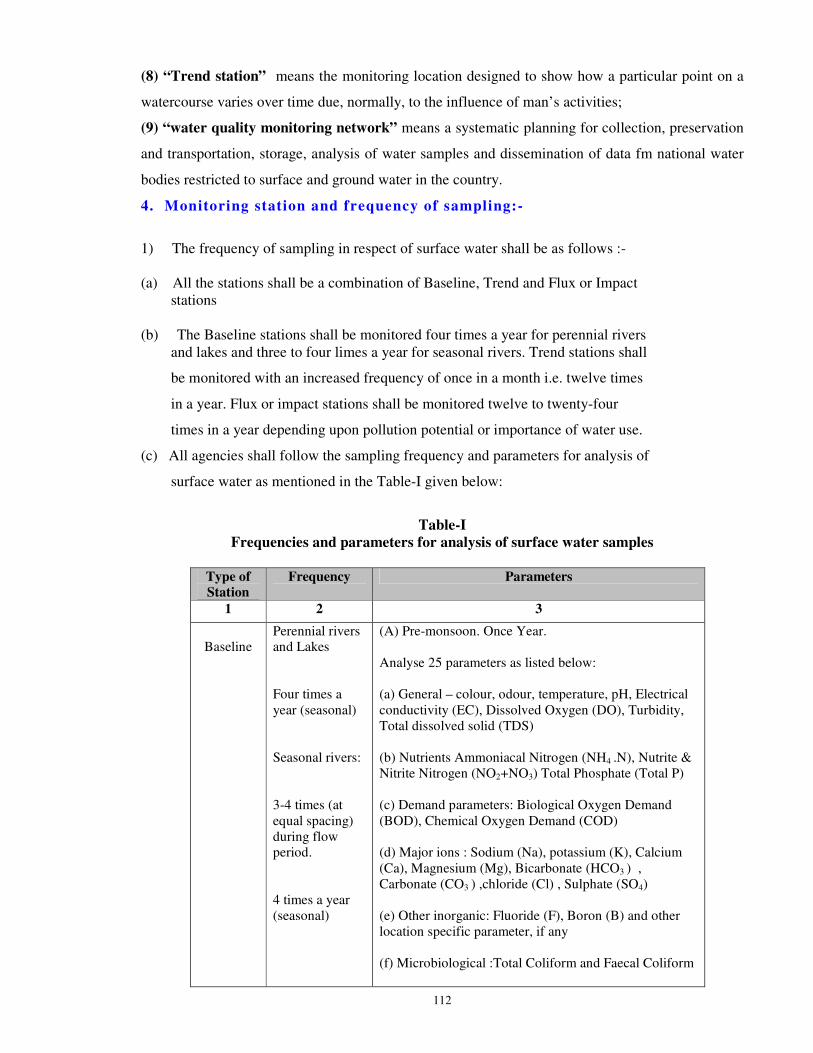
112
(8) “Trend station” means the monitoring location designed to show how a particular point on a
watercourse varies over time due, normally, to the influence of man’s activities;
(9) “water quality monitoring network” means a systematic planning for collection, preservation
and transportation, storage, analysis of water samples and dissemination of data fm national water
bodies restricted to surface and ground water in the country.
4. Monitoring station and frequency of sampling:-
1) The frequency of sampling in respect of surface water shall be as follows :-
(a) All the stations shall be a combination of Baseline, Trend and Flux or Impact
stations
(b) The Baseline stations shall be monitored four times a year for perennial rivers
and lakes and three to four limes a year for seasonal rivers. Trend stations shall
be monitored with an increased frequency of once in a month i.e. twelve times
in a year. Flux or impact stations shall be monitored twelve to twenty-four
times in a year depending upon pollution potential or importance of water use.
(c) All agencies shall follow the sampling frequency and parameters for analysis of
surface water as mentioned in the Table-I given below:
Table-I
Frequencies and parameters for analysis of surface water samples
Type of
Station
Frequency Parameters
1 2 3
Baseline
Perennial rivers
and Lakes
Four times a
year (seasonal)
Seasonal rivers:
3-4 times (at
equal spacing)
during flow
period.
4 times a year
(seasonal)
(A) Pre-monsoon. Once Year.
Analyse 25 parameters as listed below:
(a) General – colour, odour, temperature, pH, Electrical
conductivity (EC), Dissolved Oxygen (DO), Turbidity,
Total dissolved solid (TDS)
(b) Nutrients Ammoniacal Nitrogen (NH4 .N), Nutrite &
Nitrite Nitrogen (NO2+NO3) Total Phosphate (Total P)
(c) Demand parameters: Biological Oxygen Demand
(BOD), Chemical Oxygen Demand (COD)
(d) Major ions : Sodium (Na), potassium (K), Calcium
(Ca), Magnesium (Mg), Bicarbonate (HCO3 ) ,
Carbonate (CO3 ) ,chloride (Cl) , Sulphate (SO4)
(e) Other inorganic: Fluoride (F), Boron (B) and other
location specific parameter, if any
(f) Microbiological :Total Coliform and Faecal Coliform
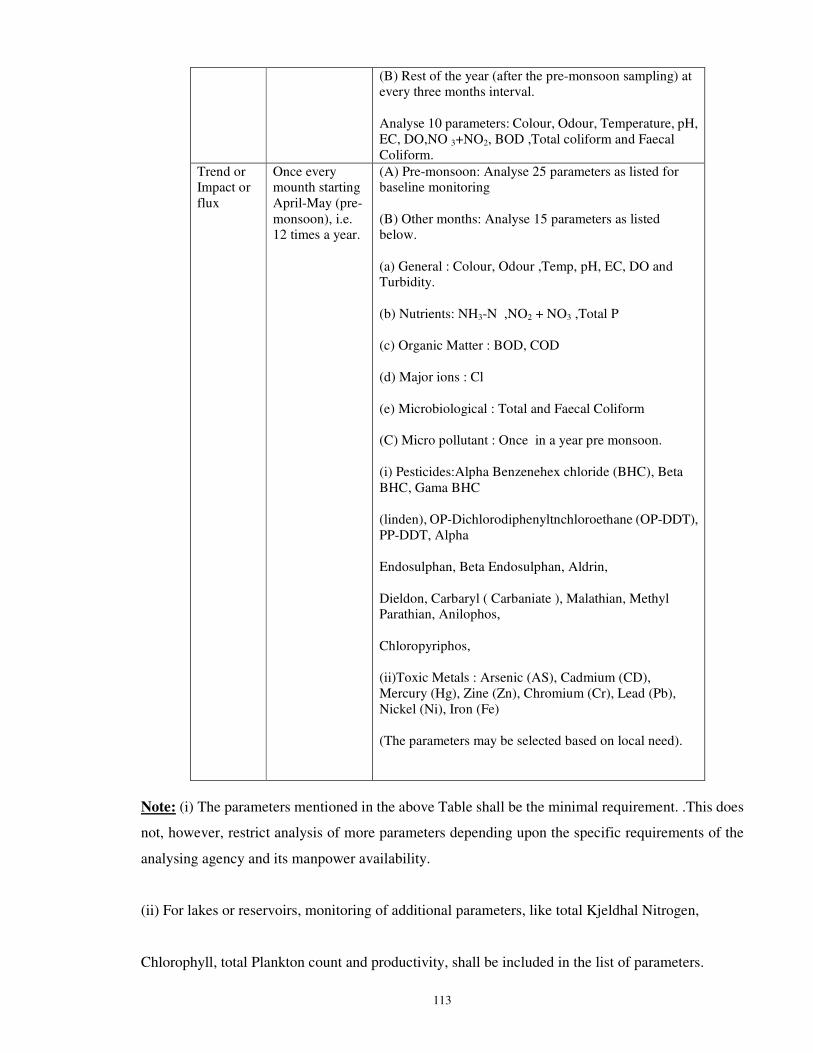
113
(B) Rest of the year (after the pre-monsoon sampling) at
every three months interval.
Analyse 10 parameters: Colour, Odour, Temperature, pH,
EC, DO,NO 3+NO2, BOD ,Total coliform and Faecal
Coliform.
Trend or
Impact or
flux
Once every
mounth starting
April-May (pre-
monsoon), i.e.
12 times a year.
(A) Pre-monsoon: Analyse 25 parameters as listed for
baseline monitoring
(B) Other months: Analyse 15 parameters as listed
below.
(a) General : Colour, Odour ,Temp, pH, EC, DO and
Turbidity.
(b) Nutrients: NH3-N ,NO2 + NO3 ,Total P
(c) Organic Matter : BOD, COD
(d) Major ions : Cl
(e) Microbiological : Total and Faecal Coliform
(C) Micro pollutant : Once in a year pre monsoon.
(i) Pesticides:Alpha Benzenehex chloride (BHC), Beta
BHC, Gama BHC
(linden), OP-Dichlorodiphenyltnchloroethane (OP-DDT),
PP-DDT, Alpha
Endosulphan, Beta Endosulphan, Aldrin,
Dieldon, Carbaryl ( Carbaniate ), Malathian, Methyl
Parathian, Anilophos,
Chloropyriphos,
(ii)Toxic Metals : Arsenic (AS), Cadmium (CD),
Mercury (Hg), Zine (Zn), Chromium (Cr), Lead (Pb),
Nickel (Ni), Iron (Fe)
(The parameters may be selected based on local need).
Note: (i) The parameters mentioned in the above Table shall be the minimal requirement. .This does
not, however, restrict analysis of more parameters depending upon the specific requirements of the
analysing agency and its manpower availability.
(ii) For lakes or reservoirs, monitoring of additional parameters, like total Kjeldhal Nitrogen,
Chlorophyll, total Plankton count and productivity, shall be included in the list of parameters.

114
(iii) If biomonitoring is done in river or lakes or reservoirs additional specific parameters are to be
considered.
(2) Ground Water
The frequency of sampling in respect of ground water shall be as follows:
(a) all stations shall he classified as Baseline stations.
(b) 20-25%of Baseline stations shall be classified as Trend stations where there is a perceived
problem
(c) all agencies shall following the sampling frequency and parameters for analysis of ground water
as mentioned in the Table-2 given below:-
Table -2
Frequencies and parameters for analysis of Ground Water samples
Type of Station Frequency Parameters
1 2 3
Baseline Twice a year
(Pre and Post
Monsoon
season)
(A) Pre and Post Monsoon Season Analyse 20
parameters as listed below.
(a) General : Colour, odour, temperature, pH.
EC, TDS
(b) Nutrients: NO2 + NO3, orthophosphate
(c) Demand Parameter: COD
(d) Major Ions :Na2 +, K+, Ca++,Mg++, CO3,
HCO3, CT, SO4 %Na & SAR
(e) Other inorganics: F, B and other location
specific parameter if any.
Trend Twice a year
(pre and post
monsoon)
(A) April – May: Analyse 20 parameters as
listed for Baseline monitoring.
(B) Other times: Analyse 14 parameters as listed
below
(1) General Colour, odour, temp, EC, pH, TDS, %
Na & SAR
(a) Nutrients: NO2-NO3, Orthophosphate
(b) Demand parameter :COD
(c) Major ions: Cl
(d) Other inorganics: F,B
(e) Microbiological: Total conform and faecal
coliform
(C) Micro pollutant: (parameters may be selected
based on local need)
(2) Pesticides - Alpha BHC, Beta, BHC, Gama,
BHC (Lindane), OP-DDT, PP-DDT, Alpha
Endosulphan, Beta Edosulpham, Aldrin, Dieldrin,.
2, 4-D, Carbaryl (Carbamate), Malathian,

115
Methyl, Parathian, Anilphos, Choropyriphos
(3) Toxic Metals-As, Cd, Hg. Zn. Cr. Pb, Ni, Fe
(Pesticides and Toxic metals may be analaysed
once a year in pre monsoon on selected locations).
Note:- (i) The parameters mentioned in the above Table shall be the minimal requirement. This
does not, however, restrict analysis of more parameters depending upon the specific requirements of
the analysing agency and its manpower availability.
(ii) If Chemical Oxygen Demand (COD) value exceeds 20 mg/l, the sample shall be analysed For
Biochemical Oxygen Demand (BOD) also.
5. Sample Collection.
(1) The procedure for sample collection in respect of surface water shall be as under:
(a) Samples For Baseline and Trend stations shall be collected from well-mixed section of the river
or main stern 30 cm below the water surface using a Dissolved Oxygen (DO) sampler or weighted
bottle.
(b) Samples for Impact stations shall be collected from the point of interest, such as bathing ghat,
down stream of point discharge, water supply intakes and other sources.
(c) The Dissolved Oxygen (DO) in the sample shall be fixed immediately after collection and
Dissolved Oxygen (DO) analysis shall be done either in the field or in laboratory.
(2) The procedure for sample collection in respect of ground water shall be as under:
(a) Open dug wells, which are not in use or have been abandoned, shall not be considered as water
quality monitoring station. However, such well could be considered for water level monitoring.
(b) Weighted sample bottle to collect sample from an open well about 30 cm below the surface of
water may be used. The plastic bucket, which is likely to skim the surface layer only, shall not be
used.
(c) Sample from the production tube well shall be collected alter running the well about five minute.
(d) Non-production piezometers shall be purged using a submersible pump. The purged water
volume shall equal 4 to 5 times the standing water volume, before sample is collected.
(e) For bacteriological samples, when collected from tube wells or hand pump, the spout or outlet of
the pump shall be sterilized under flame by spirit lamp before collection of sample in container.

116
6. Sample preservation and transportation.
(1) The type of containers and sample preservation to be adopted shall be as mentioned in the
Table-3 below:
Table-3
1 2 3
Analysis Container Preservation
General Glass, PE 4°C, dark
BOD Glass, PE 4°C, dark
COD,NI-{3N02,N03 Glass,PE H2S04,PH<2
Coliform Glass, PE, Sterilised 4°C, dark
DO BOO bottle DO fixing chemicals
Fluoride PE None
P Glass None
Pesticides Glass. Teflon 4°C, dark
Toxic metals Glass, PE HNO3, PH<2
(2) Samples shall be transported to concerned laboratory as soon as possible, preferably within
forty-eight hours of collection.
(3) Analysis for coliform shall be started within twenty-four hours of collection of sample. If time is
exceeded, it should be recorded with the result.
(4) Samples containing microgram/ I metal should be stored at 4°C aid analyzed as soon as
possible. If the concentration is of mg/I level, it can be stored for up to 6 months, except mercury,
for which the limit is 5 weeks.
(5) Sample Identification for the water sample analysis for surface and ground water samples shall
be as mentioned in the Form-I and Form-Il.
7. Sample records.
(1) Each laboratory shall have a bound register, which shall be used for registering samples as they
are received. A format for sample receipt register is annexed as Form III.
(2) The Laboratory incharge shall maintain a register for assignment of work to specific analyst.
8. Analytical techniques.
Each agency shall follow the analytical techniques prescribed in the Standard methods for Analysis
of Water and Waste water published by American Public Health Association (Latest Edition) or
Bureau of Indian Standards (BJS) Methods for Testing
Water and Wastewater-rnethods of sampling and testing (physical and chemical)
(IS:3025)
117
9. Analysis records and data validation.
A recommended format for recording data including all parameters except toxic metals and trace
organics is enclosed as Form - IV. Report of heavy metals and trace organics as per Table 2 may be
recorded separately. Validation checks should be performed in the laboratory on completion of the
analysis. The results of laboratory analyses shall be entered in the format provided in Form II for
validation.
10. Manpower requirements in laboratories.
The manpower requirements shall be optimised by the concerned monitoring agencies m order to
get the maximum utilization of mandays, for timely completion analysis.
11. Data Processing, Reporting and Dissemination.
Each monitoring agency shall process the analytical data and report the data after validation to the
Data Centre at the Central Pollution Control Board. The Central Pollution Control Board shall store
the data and disseminate through website or electronic mail to various users on demand.
12. Quality Assurance and Accreditation of Laboratories.
The Quality Assurance Programme for the laboratories of various agencies shall contain a set of
operating principles, written down and agreed upon by the organization, delineating specific
functions and responsibilities of each person involved. Each laboratory of water quality monitoring
agencies shall follow the guidelines or Quality Assurance Programme prescribed by their respective
Central Laboratory or Headquarters and shall participate in Inter Laboratory Quality Assurance
Programme like Proficiency Testing (PT) organized by them or any other agency on regular basis.
The Water Quality Laboratories shall seek recognition from the Ministry of Environment and
Forests, Government of India or accreditation from National Accreditation Board for Testing and
Calibration Laboratories (NABL) under the Ministry of Science and Technology, Government of
India.
[F.No. 15011/B/2004-NRCD]
M. SENGUPTA, Adviser

118
FORM-I Sample identification for surface water samples analysis and record.
Sample code
Observer Agency Project
Date Time Station code Parameter
Code Container Preservation Treatment
GLA
SS
PVC PE TEFL
ON
NONE COOL ACID OTH
ER
NONE DECAN
T
FI
L
T
E
R
1)General 2)
Bacteriology
3)BOD 4) COD,
NH, N03
5) Toxic
Metals
6) Trace
Organics
Source of Sample
Water Point Appr
oach
Medium Matrix
River Main current Brid
ge
Water Fresh
Drain Right Bank Boat Suspend
ed
matter
Brackish
Reservoir (lakes/tank/pond) Left Bank Wad
ing
Biota Salt
Sedimen
t
Effluent
Sample Type Grab Time-comp Flow-comp Depth integ Width integ
Sample Device Weighted bottle pump Depth sampler
Field Determinations
Temp 0C PH EC Micromhos/cm DO Mg/1
Odour Code 1) Odour Free
2) Rotten Eggs
3) Burnt Sugar
4) Soapy
5) Fishy
6) Septic
7) Aromatic
8) Chlorinous
9) Alcoholic
10) Unpleasant
Colour Code 1) light Brown
2)Brown
3) Dark Brown
4) Light Green
5) Green
6) Dark Green
7) Clear
8) Other (Specify)
Remarks
Weather Sunny, Cloudy, Rainy, Windy
Water Vel. M/s High(,0.5) Medium (0.1-0.5) Low(,0.1) Standing
Water use None, Cultivation Bathing, Washing, Cattle Washing Melon/vegetable
farming in riverbed, Organised Water Supply

119
FORM-Il
Sample Identification for ground water samples.
Sample code
Observer Agency Project
Date Time Station code
Source of sample Open dug well, Hand pump, Tube well, Prezometer
Parameter Code Container Preservation Treatment
Glass PVC PE Teflon None Cool Aci
d
Other None Decanl Fil
ter
1)General
2) Bacteriology
3)BOD
4) COD,NH,N03
5) Toxic Metals
6) Trace Organics
Field Determinations
Temp 0c PH EC
micromho
/cm
DO Mg/1
Odour Code (1) Odour tree (6) Septic
(2) Rotten eggs (7) Aromatic
(3) Burnt sugar (8) Chlormous
(4) Soapy (9) Alcoholic
(5) Fishy (10) Unpleasant
Colour Code (1) Light brown (2) Dark green
(2) Brown (4) Clear
(3) Dark brown (5) Green
(4) Light green (7) Other(specify)
(5) Green
IF WELL IS PURGED, COMPLETE BELOW
Office well Data
Diameter Q Cm
Depth D M
Static Water level (Avg) SWL M
Water Column(D-SWL) H M
Initial Volume Well V L
Projected Pump Discharge PQ L/s
Projected time of Purging
(WPO)
PT Min
Field Flow Measurement
Static Water level on
arrival
SWL M
Actual Pump Setting M
Purging duration Min
Pump Discharge before
sampling
Q L/min
Pump Discharge after
sampling
Q L/min
Volume purged V L
Dynamic Water level DWL M
Field Chemical Measurement
Time at start of sampling
Started
T(0c) EC (Micromho/cm) Ph
+ 10 mm
+ 20 mm
+ 30 mm
+ 40 mm

120
FORM III Sample Record for Analysis
Date time
received
at lab
Date time
Collected
Station
Code
Project Collecting
agency/
Collector
Preservation Paramet
er code
Lab
sample
No.
1 2 3 4 5 6 7 8
Sample receipt register
Note:-
Column 3 gives the station code conventionally followed by the monitoring agency.
Column (4) gives the project under which the sample is collected.
Column (7) corresponds to the parameter(s) code given in the sample identification form.
Column (8) gives the laboratory sample assigned to the sample as it is received in the laboratory.
Note that the numbering has two parts separated by a hyphen. The first part is assigned in a
sequential manner as samples are received from various stations. If two samples are collected at the
same time from a station for different sets of analysis, the first part of the number is the same. The
second part corresponds to the parameter code as given in the sample.
The results of the analyses of all the samples having the same first part of the code would be
entered in the data entry system as one sample having the same station code and same station code
and time of sample collection

121
FORM –IV
Data Record Laboratory/organization Laboratory code
Date of
collection
Field determination
pH EC
micromotis/cm
DO
mg/1
Temp.0C Colour
code
Odour code
1. 2. 3. 4. 5. 6. 7. 8. 9.
General Nutrients Org Matter
pH EC
umho/cm
TDS,
mg/1
TSS/mg/1 NH2 mg NO2
NO3
mg N/1
Total
mg/1
BOD,
mg/1
COD
mg/1
10. 11. 12. 13. 14. 15. 16. 17. 18.
Alkalinity Hardness Major Icons
Phen
mg C
co2/1
Total
mg C
co2/1
Total
mg C
co2/1
C++
mg C
Co2/1
Ca
mg/1
Mg,
mg/1
Na
mg/l
K
mg/1
Cr
mg/1
So 4
mg/l
CO3
mg/1
HC
O3
mg/
1
19. 20. 21. 22. 23. 24. 25. 26. 27. 28. 29. 30.
Other inorganics Coliforms Bio
Sir mg/1 F mg/1 B mg/1 Total
MPN/100 ml
Faecal
MPN/100ml
Chlorophyli A
mg/1
31. 32. 33. 34. 35. 36.

122
Data Validation
Lab
sam
ple
Sta
tio
n
co
de
Cations Anions
Ca
meq/
1
Mg
meq/
1
Na
me
q/1
K
meq/
1
Meq/
total
cations
C1
me
q/1
So3
meq/
1
Co
2
me
q/1
HCO
meq/1
No2
NO3
meq/1
Total
anion
s
meq/1
37. 38. 39. 40. 41. 42. 43. 44. 45. 46. 47. 48. 49.
.
Ion Balance TDS/E
C
Ratio
BOD/
COD
Ratio
PH2 Vs
Alkanity
Ratio
CO3
bal
Verificat
ion
Criteria
Checked
by
Remark
(41)-
(47)(41)+
(47)
(39)/
(42)
(12/
(11)
(17/(1
8)
If(10)<8.3,
is (19)=o?
50. 51. 52. 53. 54. 55. 56. 57. 58.

123
Ministry of Water Resources April 1, 2002
Government of India
Ministry of Water Resources
NATIONAL WATER POLICY
New Delhi
April, 2002
Ministry of Water Resources 1 April 1, 2002

124
NATIONAL WATER POLICY- 2002
Need for a National Water Policy
1.1 Water is a prime natural resource, a basic human need and a precious national asset. Planning,
development and management of water resources need to be governed by national perspectives.
1.2 As per the latest assessment (1993), out of the total precipitation, including snowfall, of around4000
billion cubic meter in the country, the availability from surface water and replenishable ground water is
put at 1869 billion cubic meter. Because of topographical and other constraints, about 60% of this i.e.
690 billion cubic meter from surface water and 432 billion cubic meter from ground water, can be put to
beneficial use. Availability of water is highly uneven in both space and time. Precipitation is confined to
only about three or four months in a year and varies from 100 mm in the western parts of Rajasthan to
over 10000 mm at Cherrapunji in Meghalaya. Rivers and under ground aquifers often cut across state
boundaries. Water, as a resource is one and indivisible: rainfall, river waters, surface ponds and lakes
and ground water are all part of one system.
1.3 Water is part of a larger ecological system. Realising the importance and scarcity attached to the
fresh water, it has to be treated as an essential environment for sustaining all life forms.
1.4 Water is a scarce and precious national resource to be planned, developed, conserved and managedas
such, and on an integrated and environmentally sound basis, keeping in view the socio-economic aspects
and needs of the States. It is one of the most crucial elements in developmental planning. As the country
has entered the 21st century, efforts to develop, conserve, utilise and manage this important resource in a
sustainable manner, have to be guided by the national perspective.
1.5 Floods and droughts affect vast areas of the country, transcending state boundaries. One-sixth area
of the country is drought-prone. Out of 40 million hectare of the flood prone area in the country, on an
average, floods affect an area of around 7.5 million hectare per year. Approach to management of
droughts and flood has to be co-ordinated and guided at the national level.
1.6 Planning and implementation of water resources projects involve a number of socio-economic
aspects and issues such as environmental sustainability, appropriate resettlement and rehabilitation of
project-affected people and livestock, public health concerns of water impoundment, dam safety etc.
Common approaches and guidelines are necessary on these matters. Moreover, certain problems and
weaknesses have affected a large number of water resources projects all over the country. There have
been substantial time and cost overruns on projects. Problems of water logging and soil salinity have

125
emerged in some irrigation commands, leading to the degradation of agricultural land. Complex issues
of equity and social justice in regard to water distribution are required to be addressed. The
development, and overexploitation of groundwater resources in certain parts of the country have raised
the concern and need for judicious and scientific resource management and conservation. All these
concerns need to be addressed on the basis of common policies and strategies.
1.7 Growth process and the expansion of economic activities inevitably lead to increasing demands for
water for diverse purposes: domestic, industrial, agricultural, hydro-power, thermal-power, navigation,
recreation, etc. So far, the major consumptive use of water has been for irrigation. While the gross
irrigation potential is estimated to have increased from 19.5 million hectare at the time of independence
to about 95 million hectare by the end of the Year 1999-2000, further development of a substantial order
is necessary if the food and fiber needs of our growing population are to be met with. The country’s
population which is over 1027 million (2001 AD) at present is expected to reach a level of around 1390
million by 2025 AD.
1.8 Production of food grains has increased from around 50 million tones in the fifties to about 208
million tones in the Year 1999-2000. This will have to be raised to around 350 million tones by the year
2025 AD. The drinking water needs of people and livestock have also to be met. Domestic and
industrial water needs have largely been concentrated in or near major cities. However, the demand in
rural areas is expected to increase sharply as the development programmes improve economic
conditions of the rural masses. Demand for water for hydro and thermal power generation and for other
industrial uses is also increasing substantially. As a result, water, which is already a scarce resource, will
become even scarcer in future. This underscores the need for the utmost efficiency in water utilisation
and a public awareness of the importance of its conservation.
1.9 Another important aspect is water quality. Improvements in existing strategies, innovation of new
techniques resting on a strong science and technology base are needed to eliminate the pollution of
surface and ground water resources, to improve water quality. Science and technology and training have
to play important roles in water resources development and management in general.
1.10 National Water Policy was adopted in September, 1987. Since then, a number of issues and
challenges have emerged in the development and management of the water resources. Therefore, the
National Water Policy (1987) has been reviewed and updated.

126
Information System
2.1 A well developed information system, for water related data in its entirety, at the national / state
level, is a prime requisite for resource planning. A standardised national information system should be
stablished with a network of data banks and data bases, integrating and strengthening the existing
Central and State level agencies and improving the quality of data and the processing capabilities.
2.2 Standards for coding, classification, processing of data and methods / procedures for its collection
should be adopted. Advances in information technology must be introduced to create a modern
information system promoting free exchange of data among various agencies. Special efforts should be
made to develop and continuously upgrade technological capability to collect, process and disseminate
reliable data in the desired time frame.
2.3 Apart from the data regarding water availability and actual water use, the system should also include
comprehensive and reliable projections of future demands of water for diverse purposes.
Water Resources Planning
3.1 Water resources available to the country should be brought within the category of utilizable
resources to the maximum possible extent.
3.2 Non-conventional methods for utilisation of water such as through inter-basin transfers, artificial
recharge of ground water and desalination of brackish or sea water as well as traditional water
conservation practices like rainwater harvesting, including roof-top rainwater harvesting, need to be
practiced to further increase the utilisable water resources. Promotion of frontier research and
development, in a focused manner, for these techniques is necessary.
3.3 Water resources development and management will have to be planned for a hydrological unit such
as drainage basin as a whole or for a sub-basin, multi-sectorally, taking into account surface and ground
water for sustainable use incorporating quantity and quality aspects as well as environmental
considerations. All individual developmental projects and proposals should be formulated and
considered within the framework of such an overall plan keeping in view the existing agreements /
awards for a basin or a sub basin so that the best possible combination of options can be selected and
sustained.
3.4 Watershed management through extensive soil conservation, catchment-area treatment, preservation
of forests and increasing the forest cover and the construction of check-dams should be promoted.
Efforts shall be to conserve the water in the catchment.

127
3.5 Water should be made available to water short areas by transfer from other areas including transfers
from one river basin to another, based on a national perspective, after taking into account the
requirements of the areas / basins.
Institutional Mechanism
4.1 With a view to give effect to the planning, development and management of the water resources on a
hydrological unit basis, along with a multi-sectoral, multi-disciplinary and participatory approach as
well as integrating quality, quantity and the environmental aspects, the existing institutions at various
levels under the water resources sector will have to be appropriately reoriented / reorganised and even
created, wherever necessary. As maintenance of water resource schemes is under non-plan budget, it is
generally being neglected. The institutional arrangements should be such that this vital aspect is given
importance equal or even more than that of new constructions.
4.2 Appropriate river basin organisations should be established for the planned development and
management of a river basin as a whole or sub-basins, wherever necessary. Special multi-disciplinary
units should be set up to prepare comprehensive plans taking into account not only the needs of
irrigation but also harmonising various other water uses, so that the available water resources are
determined and put to optimum use having regard to existing agreements or awards of Tribunals under
the relevant laws. The scope and powers of the river basin organisations shall be decided by the basin
states themselves.
Water Allocation Priorities
5. In the planning and operation of systems, water allocation priorities should be broadly as follows:
• Drinking water
• Irrigation
• Hydro-power
• Ecology
• Agro-industries and non-agricultural industries
• Navigation and other uses.
However, the priorities could be modified or added if warranted by the area / region specific
considerations.
Project Planning
6.1 Water resource development projects should as far as possible be planned and developed as
multipurpose projects. Provision for drinking water should be a primary consideration.
6.2 The study of the likely impact of a project during construction and later on human lives, settlements,

128
occupations, socio-economic, environment and other aspects shall form an essential component of
project planning.
6.3 In the planning, implementation and operation of a project, the preservation of the quality of
environment and the ecological balance should be a primary consideration. The adverse impact on the
environment, if any, should be minimised and should be offset by adequate compensatory measures.
The project should, nevertheless, be sustainable.
6.4 There should be an integrated and multi-disciplinary approach to the planning, formulation,
clearance and implementation of projects, including catchment area treatment and management,
environmental and ecological aspects, the rehabilitation of affected people and command area
development. The planning of projects in hilly areas should take into account the need to provide
assured drinking water, possibilities of hydro-power development and the proper approach to irrigation
in such areas, in the context of physical features and constraints of the basin such as steep slopes, rapid
run-off and the incidence of soil erosion. The economic evaluation of projects in such areas should also
take these factors into account.
6.5 Special efforts should be made to investigate and formulate projects either in, or for the benefit of,
areas inhabited by tribal or other specially disadvantaged groups such as socially weak, scheduled castes
and scheduled tribes. In other areas also, project planning should pay special attention to the needs of
scheduled castes and scheduled tribes and other weaker sections of the society. The economic evaluation
of projects benefiting such disadvantaged sections should also take these factors into account.
6.6 The drainage system should form an integral part of any irrigation project right from the planning
stage.
6.7 Time and cost overruns and deficient realisation of benefits characterising most water related
projects should be overcome by upgrading the quality of project preparation and management. The
inadequate funding of projects should be obviated by an optimal allocation of resources on the basis of
prioritisation, having regard to the early completion of on-going projects as well as the need to reduce
regional imbalances.
6.8 The involvement and participation of beneficiaries and other stakeholders should be encouraged
right from the project planning stage itself.
Ground Water Development
7.1 There should be a periodical reassessment of the ground water potential on a scientific basis, taking
into consideration the qualit y of the water available and economic viability of its extraction.

129
7.2 Exploitation of ground water resources should be so regulated as not to exceed the recharging
possibilities, as also to ensure social equity. The detrimental environmental consequences of
overexploitation of ground water need to be effectively prevented by the Central and State
Governments. Ground water recharge projects should be developed and implemented for improving
both the quality and availability of ground water resource.
7.3 Integrated and coordinated development of surface water and ground water resources and their
conjunctive use, should be envisaged right from the project planning stage and should form an integral
part of the project implementation.
7.4 Over exploitation of ground water should be avoided especially near the coast to prevent ingress of
seawater into sweet water aquifers.
Drinking Water
8. Adequate safe drinking water facilities should be provided to the entire population both in urban and
in rural areas. Irrigation and multipurpose projects should invariably include a drinking water
component, wherever there is no alternative source of drinking water. Drinking water needs of human
beings and animals should be the first charge on any available water.
Irrigation
9.1 Irrigation planning either in an individual project or in a basin as a whole should take into account
the irrigability of land, cost-effective irrigation options possible from all available sources of water and
appropriate irrigation techniques for optimising water use efficiency. Irrigation intensity should be such
as to extend the benefits of irrigation to as large a number of farm families as possible, keeping in view
the need to maximise production.
9.2 There should be a close integration of water-use and land-use policies.
9.3 Water allocation in an irrigation system should be done with due regard to equity and social justice.
Disparities in the availability of water between head-reach and tail-end farms and between large and
small farms should be obviated by adoption of a rotational water distribution system and supply of water
on a volumetric basis subject to certain ceilings and rational pricing.
9.4 Concerted efforts should be made to ensure that the irrigation potential created is fully utilised. For
this purpose, the command area development approach should be adopted in all irrigation projects.

130
9.5 Irrigation being the largest consumer of fresh water, the aim should be to get optimal productivity
per unit of water. Scientific water management, farm practices and sprinkler and drip system of
irrigation should be adopted wherever feasible.
9.6 Reclamation of water logged / saline affected land by scientific and cost-effective methods should
form a part of command area development programme.
Resettlement and Rehabilitation
10. Optimal use of water resources necessitates construction of storages and the consequent resettlement
and rehabilitation of population. A skeletal national policy in this regard needs to be formulated so that
the project affected persons share the benefits through proper rehabilitation. States should accordingly
evolve their own detailed resettlement and rehabilitation policies for the sector, taking into account the
local conditions. Careful planning is necessary to ensure that the construction and rehabilitation
activities proceed simultaneously and smoothly.
Financial and Physical Sustainability
11. Besides creating additional water resources facilities for various uses, adequate emphasis needs to be
given to the physical and financial sustainability of existing facilities. There is, therefore, a need to
ensure that the water charges for various uses should be fixed in such a way that they cover at least the
operation and maintenance charges of providing the service initially and a part of the capital costs
subsequently. These rates should be linked directly to the quality of service provided. The subsidy on
water rates to the disadvantaged and poorer sections of the society should be well targeted and
transparent.
Participatory Approach to Water Resources Management
12. Management of the water resources for diverse uses should incorporate a participatory approach; by
involving not only the various governmental agencies but also the users and other stakeholders, in an
effective and decisive manner, in various aspects of planning, design, development and management of
the water resources schemes. Necessary legal and institutional changes should be made at various levels
for the purpose, duly ensuring appropriate role for women. Water Users’ Associations and the local
bodies such as municipalities and gram panchayats should particularly be involved in the operation,
maintenance and management of water infrastructures / facilities at appropriate levels progressively,
with a view to eventually transfer the management of such facilities to the user groups / local bodies.

131
Private Sector Participation
13. Private sector participation should be encouraged in planning, development and management of
water resources projects for diverse uses, wherever feasible. Private sector participation may help in
introducing innovative ideas, generating financial resources and introducing corporate management and
improving service efficiency and accountability to users. Depending upon the specific situations, various
combinations of private sector participation, in building, owning, operating, leasing and transferring of
water resources facilities, may be considered.
Water Quality
14.1 Both surface water and ground water should be regularly monitored for quality. A phased
programme should be undertaken for improvements in water quality.
14.2 Effluents should be treated to acceptable levels & standards before discharging them into natural
streams.
14.3 Minimum flow should be ensured in the perennial streams for maintaining ecology and social
considerations.
14.4 Principle of ‘polluter pays’ should be followed in management of polluted water.
14.5 Necessary legislation is to be made for preservation of existing water bodies by preventing
encroachment and deterioration of water quality.
Water Zoning
15. Economic development and activities including agricultural, industrial and urban development,
should be planned with due regard to the constraints imposed by the configuration of water availability.
There should be a water zoning of the country and the economic activities should be guided and
regulated in accordance with such zoning.
Conservation of Water
16.1 Efficiency of utilisation in all the diverse uses of water should be optimised and an awareness of
water as a scarce resource should be fostered. Conservation consciousness should be promoted through
education, regulation, incentives and disincentives.
16.2 The resources should be conserved and the availability augmented by maximising retention,
eliminating pollution and minimising losses. For this, measures like selective linings in the conveyance
132
system, modernisation and rehabilitation of existing systems including tanks, recycling and re-use of
treated effluents and adoption of traditional techniques like mulching or pitcher irrigation and new
techniques like drip and sprinkler may be promoted, wherever feasible.
Flood Control and Management
17.1 There should be a master plan for flood control and management for each flood prone basin.
17.2 Adequate flood-cushion should be provided in water storage projects, wherever feasible, to
facilitate better flood management. In highly flood prone areas, flood control should be given overriding
consideration in reservoir regulation policy even at the cost of sacrificing some irrigation or power
benefits.
17.3 While physical flood protection works like embankments and dykes will continue to be necessary,
increased emphasis should be laid on non-structural measures such as flood forecasting and warning,
flood plain zoning and flood proofing for the minimisation of losses and to reduce the recurring
expenditure on flood relief.
17.4 There should be strict regulation of settlements and economic activity in the flood plain zones
along with flood proofing, to minimise the loss of life and property on account of floods.
17.5 The flood forecasting activities should be modernised, value added and extended to other
uncovered areas. Inflow forecasting to reservoirs should be instituted for their effective regulation.
Land Erosion by Sea or River
18.1 The erosion of land, whether by the sea in coastal areas or by river waters inland, should be
minimised by suitable cost-effective measures. The States and Union Territories should also undertake
all requisite steps to ensure that indiscriminate occupation and exploitation of coastal strips of land are
discouraged and that the location of economic activities in areas adjacent to the sea is regulated.
18.2 Each coastal State should prepare a comprehensive coastal land management plan, keeping in view
the environmental and ecological impacts, and regulate the developmental activities accordingly.
Drought-prone Area Development
19.1 Drought-prone areas should be made less vulnerable to drought-associated problems through soil
133
moisture conservation measures, water harvesting practices, minimisation of evaporation losses,
development of the ground water potential including recharging and the transfer of surface water from
surplus areas where feasible and appropriate. Pastures, forestry or other modes of development which
are relatively less water demanding should be encouraged. In planning water resource development
projects, the needs of drought-prone areas should be given priority.
19.2 Relief works undertaken for providing employment to drought-stricken population should
preferably be for drought proofing.
Monitoring of Projects
20.1 A close monitoring of projects to identify bottlenecks and to adopt timely measures to obviate time
and cost overrun should form part of project planning and execution.
20.2 There should be a system to monitor and evaluate the performance and socio-economic impact of
the project.
Water Sharing / Distribution amongst the States
21.1 The water sharing / distribution amongst the states should be guided by a national perspective with
due regard to water resources availability and needs within the river basin. Necessary guidelines,
including for water short states even outside the basin, need to be evolved for facilitating future
agreements amongst the basin states.
21.2 The Inter-State Water Disputes Act of 1956 may be suitably reviewed and amended for timely
adjudication of water disputes referred to the Tribunal.
Performance Improvement
22. There is an urgent need of paradigm shift in the emphasis in the management of water resources
sector. From the present emphasis on the creation and expansion of water resources infrastructures for
diverse uses, there is now a need to give greater emphasis on the improvement of the performance of the
existing water resources facilities. Therefore, allocation of funds under the water resources sector should
be re-prioritised to ensure that the needs for development as well as operation and maintenance of the
facilities are met.
Maintenance and Modernisation 23.1 Structures and systems created through massive investments should be properly maintained in good
health. Appropriate annual provisions should be made for this purpose in the budgets.

134
23.2 There should be a regular monitoring of structures and systems and necessary rehabilitation and
modernisation programmes should be undertaken.
23.3 Formation of Water Users' Association with authority and responsibility should be encouraged to
facilitate the management including maintenance of irrigation system in a time bound manner.
Safety of Structures
24. There should be proper organisational arrangements at the national and state levels for ensuring the
safety of storage dams and other water-related structures consisting of specialists in investigation,
design, construction, hydrology, geology, etc. A dam safety legislation may be enacted to ensure proper
inspection, maintenance and surveillance of existing dams and also to ensure proper planning,
investigation, design and construction for safety of new dams. The Guidelines on the subject should be
periodically updated and reformulated. There should be a system of continuous surveillance and regular
visits by experts.
Science and Technology
25. For effective and economical management of our water resources, the frontiers of knowledge need
to be pushed forward in several directions by intensifying research efforts in various areas, including the
following:
• hydrometeorology;
• snow and lake hydrology;
• surface and ground water hydrology;
• river morphology and hydraulics;
• assessment of water resources;
• water harvesting and ground water recharge;
• water quality;
• water conservation;
• evaporation and seepage losses;
• recycling and re-use;
• better water management practices and improvements in operational technology;
• crops and cropping systems;
• soils and material research;
135
Ministry of Water Resources 9 April 1, 2002
• new construction materials and technology (with particular reference to roller compacted
concrete, fiber reinforced concrete, new methodologies in tunneling technologies,
instrumentation, advanced numerical analysis in structures and back analysis);
• seismology and seismic design of structures;
• the safety and longevity of water-related structures;
• economical designs for water resource projects;
• risk analysis and disaster management;
• use of remote sensing techniques in development and management;
• use of static ground water resource as a crisis management measure;
• sedimentation of reservoirs;
• use of sea water resources;
• prevention of salinity ingress;
• prevention of water logging and soil salinity;
• reclamation of water logged and saline lands;
• environmental impact;
• regional equity.
Training
26. A perspective plan for standardised training should be an integral part of water resource
development. It should cover training in information systems, sectoral planning, project planning and
formulation, project management, operation of projects and their physical structures and systems and the
management of the water distribution systems. The training should extend to all the categories of
personnel involved in these activities as also the farmers.
Conclusion
27. In view of the vital importance of water for human and animal life, for maintaining ecological
balance and for economic and developmental activities of all kinds, and considering its increasing
scarcity, the planning and management of this resource and its optimal, economical and equitable
use has become a matter of the utmost urgency. Concerns of the community need to be taken into
account for water resources development and management. The success of the National Water
Policy will depend entirely on evolving and maintaining a national consensus and commitment to
its underlying principles and objectives. To achieve the desired objectives, State Water Policy
backed with an operational action plan shall be formulated in a time bound manner say in two years.
National Water Policy may be revised periodically as and when need arises.
136
Status Report On Water Quality Of Water Bodies And Ground Water In
Maharashtra For The Year 2004-2005
References: -
1) C.P.C.B
2) M.P.C.B
3) GSDA
4) CWC
5) CGWB
6) Text book on Environment Science
7) Maharashtra Water & Irrigation commission, Abad
8) Report on Project Implementation Plan -HP-II, May 2004
9) National Water Policy. Govt of India, April-2004
10) Maharashtra State Water Policy 2003
Web Site
1) WWW.ec.gc.ca
2) cpcb.nic.in
3) mpcb.mah.nic.in
4) cwc.nic.in
5) www.mahagsda.org
6) cgwb.in
7) envfor.nic.in