
Hydrological modelling of the Diamantina-Warburton · PDF fileHydrological modelling of the...
34
Hydrological modelling of the Diamantina- Warburton River System DEWNR Technical note 2014/15
Transcript of Hydrological modelling of the Diamantina-Warburton · PDF fileHydrological modelling of the...
Hydrological modelling of the Diamantina-Warburton River System
DEWNR Technical note 2014/15
Hydrological modelling of the Diamantina-
Warburton River System
Alex Osti
Department of Environment, Water and Natural Resources
September, 2014
DEWNR Technical note 2014/15

DEWNR Technical note 2014/15 i
Department of Environment, Water and Natural Resources
GPO Box 1047, Adelaide SA 5001
Telephone National (08) 8463 6946
International +61 8 8463 6946
Fax National (08) 8463 6999
International +61 8 8463 6999
Website www.environment.sa.gov.au
Disclaimer
The Department of Environment, Water and Natural Resources and its employees do not warrant or make any representation
regarding the use, or results of the use, of the information contained herein as regards to its correctness, accuracy, reliability,
currency or otherwise. The Department of Environment, Water and Natural Resources and its employees expressly disclaims all
liability or responsibility to any person using the information or advice. Information contained in this document is correct at the
time of writing.
This work is licensed under the Creative Commons Attribution 4.0 International License.
To view a copy of this license, visit http://creativecommons.org/licenses/by/4.0/.
© Crown in right of the State of South Australia, through the Department of Environment, Water and Natural Resources 2014
ISBN 978-1-922255-11-2
Preferred way to cite this publication
Osti A, 2014, Hydrological modelling of the Diamantina-Warburton River System, DEWNR Technical note 2014/15, Government
of South Australia, through the Department of Environment, Water and Natural Resources, Adelaide
DEWNR Technical note 2014/15 ii
Acknowledgements
The author would like to acknowledge all who have helped with this project.
The author thanks Justin Costelloe from the University of Melbourne for his guidance and assistance through all stages of this
work. His depth of knowledge of the hydrology of the Lake Eyre Basin (LEB), shared with the author through time spent in the
field, as a sounding board for ideas during model development and provided through review of this report have made this
work possible.
The author also thanks Henry Mancini (DEWNR) for the opportunity to be involved in a truly exceptional project in the
Diamantina and his ongoing support and friendship. The author would also like to thank Julian Reid and Jake Gillen (ANU),
Dave Schmarr and Dave Cheshire (SARDI), Narissa Haby (DEWNR), Joc Schmiechen and Graeme Tomlinson. The group of
people working in the LEB space are some of the most passionate and knowledgeable people this author has met and their
enthusiasm about all things LEB is contagious and has made a life-long convert of this author. Discussions regarding the fish,
birds, botany, ecology and culture of the region have hopefully brought a more well-rounded approach to the hydrological
analysis undertaken in this report and campfire discussions with this group of people ought to be mandatory for work
undertaken in this space.
The author also thanks Mark Alcorn and Matt Gibbs (both of DEWNR) for their guidance and advice in model development and
Kumar Savadamuthu (DEWNR) for his ongoing assistance and review of this report.
Funding for these projects has been provided by the Australian Government through the Department of the Environment,
Office of Water Science. See www.bioregionalassessments.gov.au for further information.

DEWNR Technical note 2014/15 iii
Contents
Acknowledgements ii
Contents iii
Summary 1
1 Introduction 2
1.1 Purpose and scope of the study 2
1.2 Project background 2
2 Catchment description 4
3 Catchment hydrology 6
3.1 Rainfall and potential evapotranspiration 6
3.2 Streamflow 6
3.3 Remotely sensed data 9
3.3.1 Overview 9
3.3.1 Identification of flood information 11
4 Surface water modelling 13
4.1 Overview 13
4.2 Modelling objective 13
4.3 Methodology 13
4.4 Model construction 14
4.4.1 Model overview 14
4.4.2 Model nodes 14
4.4.2.1 Splitters 14
4.4.2.2 Storages 16
4.4.2.3 Inflow nodes 16
4.4.3 Routing 16
4.5 Model calibration and validation 19
4.5.1 Calibration data 19
4.5.2 Calibration methodology 19
4.5.3 Calibration results 19
4.5.3.1 Parameter values 19
4.5.3.2 Fit to observed data 20
4.5.4 Limitations 23
5 Summary and recommendations for future work 25
6 References 26
Appendix A. Schematic of Diamantina-Warburton Source model 27
DEWNR Technical note 2014/15 iv
List of figures
Figure 1 Diamantina-Warburton River System with major rivers and creeklines 5
Figure 2 Daily hydrograph for Birdsville 7
Figure 3 Stage data for Koonchera Waterhole 8
Figure 4 Stage data for Warburton Channel near Goodiepoodinna Waterhole 8
Figure 5 Diamantina-Warburton Catchment with Landsat scenes overlayed (Scenes have a 6 km overlap) 10
Figure 6 Frequency of inundation map for Diamantina-Warburton River System 12
Figure 7 Diamantina-Warburton River System link-node network 15
Figure 8 Lake Uloowaranie and Lake Etamunbanie DEM 17
Figure 9 Lake Etamunbanie bathymetry 18
Figure 10 Lake Uloowaranie bathymetry 18
Figure 11 Observed stage versus modelled flow for Koonchera Waterhole (Modelled flow is logarithmically scaled)21
Figure 12 Observed stage versus modelled flow for Warburton main channel near Goodiepoodinna Waterhole 21
Figure 13 Ranked modelled peak magnitudes versus ranked observed peak stages for Koonchera Waterhole 22
Figure 14 Ranked modelled peak magnitudes versus ranked observed peak stages for the Warburton main channel
near Goodiepoodinna Waterhole 22
Figure 15 Flow at Birdsville versus flow at Poothapootha Waterhole 23
Figure 16 Flow at Birdsville versus Lake Eyre inflow 23
Figure 17 Schematic of Source model for Diamantina-Warburton River System 27
List of tables
Table 1 Annual rainfall summary for Birdsville 6
Table 2 Annual flow statistics for Birdsville 7
Table 3 Flood information from satellite data 11
Table 4 Splitter parameters 20
Table 5 Routing and transmission loss parameters 20
DEWNR Technical note 2014/15 1
Summary
This technical report describes the methodology and outcomes of a hydrological study undertaken for the Diamantina-
Warburton River System. The main purpose of this study was to establish a hydrological model for the system to (i) aid in
assessing the impacts on the flow regime if mining operations were to occur upstream of the study area and (ii) provide a tool
that will aid in eco-hydrological assessment of the region.
This study was undertaken by South Australian Department of Environment, Water and Natural Resources’ (DEWNR) Science
Monitoring and Knowledge (SMK) branch as part of the broader Lake Eyre Basin River Monitoring (LEBRM) project, which was
formed to address knowledge gaps pertaining to the potential impacts of coal seam gas and large coal mining projects on the
surface water resources of the Lake Eyre Basin (LEB). The Lake Eyre Basin has been identified as one of the six priority bioregions
where coal seam gas and/or large mining developments are either planned or underway. Along with other partners, DEWNR has
been contracted to address relevant hydro-ecological knowledge gaps within the LEB. The hydrological assessment and analysis
of the Diamantina-Warburton River System forms part of this work.
The Diamantina-Warburton River System covered by the hydrological model domain has an area of 31 268 km2 and spans two
states, running from Birdsville, 16 km above the South Australian border, to Lake Eyre North in the Far North of South Australia.
This area is the most downstream expression of the greater Georgina-Diamantina river system, which encompasses much of
Central and South-West Queensland. The geomorphology of the Diamantina-Warburton River System varies between
channelised sections downstream of Birdsville and Warburton Creek and the broad floodplain of Goyder Lagoon separating the
river reaches. Small flows in the system tend to terminate within Goyder Lagoon, whereas large flows continue into the Warburton
and typically reach Lake Eyre. Very large flows also reach Lake Eyre via Kallakoopah Creek, an anabranch of the Warburton.
The hydrological model used is a link-node flow routing model set up in the eWater Source IMS (integrated modelling system)
that routes flow from Birdsville, through channelized sections of the Diamantina River at the top of the reach, and the Warburton
River at the bottom of the reach, and also through multiple flow pathways through Goyder Lagoon in the centre of the reach.
The model accounts for inflows from Eyre Creek into Goyder Lagoon, as well as overflow from Eyre Creek reaching downstream
of the lagoon. Two sets of flow routing and transmission loss parameters were calibrated to better describe the channelized and
lagoon sections. The model also accounts for interactions between the river system and the two large lakes in the catchment.
The model was calibrated according to two sets of observed stage data, and information determined from Landsat satellite
imagery. Model output was able to closely reproduce the timing of all flow events at a location within the lagoon and all major
events at the location downstream of the lagoon. Smaller, local events at the downstream location were not captured as no flow
inputs (i.e. rainfall runoff) aside from Birdsville and Eyre Creek streamflow were incorporated in the model.
Observations from satellite imagery were used to identify the downstream extent of 17 flood events between 1991 and 2013.
Four of these events terminated within Goyder Lagoon and a further two terminated downstream of the lagoon, but upstream
of Lake Eyre. The model was able to replicate these observations. When comparing the modelled hydrograph at Lake Eyre North
from 1989–2013 with observed flow at Birdsville, it was seen that approximately 80% of flow by volume was lost through the
river system.
While the model is able to reproduce the timing of most observed events in the system, the model should be considered limited
in its ability to estimate flow volumes. The lack of flow data to calibrate the model means that it is not possible to estimate
confidence surrounding simulated discharge volumes. However, the model’s ability to simulate the downstream extent of flood
events suggests that volumetric estimates should be acceptably robust.
Recommendations for future work fall into two complementary categories, data collection and model refinement. By conducting
flow gaugings at strategic locations, such as at the DEWNR monitoring station near Poothapootha Waterhole, in the system a
measure of confidence in simulated flow volumes could be gained. In terms of refining the model, inclusion of a rainfall/runoff
inflow node for runoff generating areas in the south-east of the study area would ensure that the local flows missed by the model
are picked up and finally, routing and transmission loss parameters could be further examined to account for overbank flows in
channelized country and outer floodplain flows in the lagoon.
DEWNR Technical note 2014/15 2
1 Introduction
1.1 Purpose and scope of the study
This technical report describes the methodology and outcomes of a hydrological study undertaken for the Diamantina-
Warburton River System, with the main purpose of this study being to:
Establish a hydrological model for the Diamantina-Warburton River System to (i) aid in assessing the impacts on the
flow regime if mining operations were to occur upstream of the study area and (ii) provide a tool that will aid in eco-
hydrological assessment of the region.
This study was undertaken by DEWNR’s SMK branch as part of the broader Lake Eyre Basin Rivers Monitoring (LEBRM) project,
which was formed to address knowledge gaps pertaining to the potential impacts of coal seam gas and large coal mining projects
on the surface water resources of the Lake Eyre Basin (LEB), informing the Bioregional Assessment Programme.
The broad scope of the study is encompassed by five key objectives:
1. Develop a link-node model that represents key hydrological pathways through the study area
2. Identify critical surface water sites represented by the nodes and define their characteristics (e.g. branches, lakes,
surface/area relationship, etc.) within the study area
3. Identify and define specific floods from satellite data, their downstream extent, floodplain coverage and transmission
times
4. Select and calibrate appropriate stream transmission loss function(s)
5. Validate model against observed understanding of system.
1.2 Project background
In responding to perceived uncertainties surrounding the potential water-related impacts associated with the increasing
development in the unconventional petroleum sector in Australia, the Australian Government established the Independent Expert
Scientific Committee (IESC) on Coal Seam Gas and Coal Mining Development. The Independent Expert Scientific Committee on
Coal Seam Gas and Large Coal Mining Development (the IESC) is a statutory body under the Environment Protection and
Biodiversity Conservation Act 1999 (EPBC Act) which provides scientific advice to Australian governments on the water-related
impacts of coal seam gas and large coal mining development proposals.
Under the EPBC Act, the IESC has several legislative functions to:
Provide scientific advice to the Commonwealth Environment Minister and relevant state ministers on the water-
related impacts of proposed coal seam gas or large coal mining developments.
Provide scientific advice to the Commonwealth Environment Minister on:
1. bioregional assessments being undertaken by the Australian Government, and
2. research priorities and projects commissioned by the Commonwealth Environment Minister.
Publish and disseminate scientific information about the impacts of coal seam gas and large coal mining activities on
water resources.

DEWNR Technical note 2014/15 3
The Lake Eyre Basin has been identified by the IESC as one of the six priority bioregions where coal seam gas and/or large mining
developments are either planned or underway. The Bioregional Assessment Programme is a transparent and accessible
programme of baseline assessments that increase the available science for decision making associated on potential water-related
impacts of coal seam gas and large coal mining developments. A bioregional assessment is a scientific analysis of the ecology,
hydrology, geology and hydrogeology of a bioregion with explicit assessment of the potential direct, indirect and cumulative
impacts of coal seam gas and large coal mining development on water resources. This Programme draws on the best available
scientific information and knowledge from many sources, including government, industry and regional communities, to produce
bioregional assessments that are independent, scientifically robust, and relevant and meaningful at a regional scale.
This report is part of a series of studies forming part of the Lake Eyre Basin Rivers Monitoring (LEBRM) Project. LEBRM is one of
three water knowledge projects undertaken by the South Australian Department of Water, Environment and Natural Resources
(DEWNR) to inform the Bioregional Assessment Programme in the Lake Eyre Basin. The three projects are:
Lake Eyre Basin Rivers Monitoring,
Arckaringa and Pedirka Groundwater Assessment and
Lake Eyre Basin Springs Assessment.
The hydrological assessment and analysis of the Diamantina-Warburton River System forms part of DEWNR’s Lake Eyre Basin
River Monitoring (LEBRM) project. LEBRM is driven by five key aims, namely to:
1. Collate and interrogate baseline knowledge regarding the surface waters and water dependent ecosystems of the
Lake Eyre Basin
2. Identify the locations and attributes of surface water assets, including ecological and cultural values and the
attributes critical for maintaining those values
3. Collect new hydrological, geomorphic, ecological and cultural knowledge to better inform our understanding of
LEB surface water systems, and to fill gaps in current knowledge
4. Identify and collate processes and mechanisms through which mining developments may impact upon surface
water resources, assets, attributes and values
5. Identify surface water assets, attributes and values that are especially vulnerable to the potential impacts of mining
developments.
Achievement of the objectives set out in Section 1.1 furthers key aims 1, 2, 3 and 5.

DEWNR Technical note 2014/15 4
2 Catchment description
The Diamantina-Warburton River System covered by the hydrological model domain covers an area of 31 268 km2 and spans
two states, running from Birdsville, 16 km above the South Australian border, to Lake Eyre North in the Far North of South
Australia (Figure 1). The area is the most downstream expression of the greater Georgina-Diamantina river system, which
encompasses much of central and south-west regions of Queensland.
Running approximately 1000 km from central Queensland to Lake Eyre North, the Diamantina River is the major contributor of
floodwaters to Lake Eyre (Kotwicki, 1986). The headwaters of the Diamantina occur at elevations of 250-300 m in central
Queensland (Costelloe et al., 2003) within the zone of influence of the North Australian Monsoon (Allan, 1985). As such, rainfall
tends to be strongly summer dominant, with median annual rainfall ranging from 150-425 mm with a decreasing North-South
precipitation gradient (Costelloe et al., 2006). Large flood events are typically associated with monsoonal troughs pushing deeper
south into the Diamantina catchment and so tend to be associated with heavy rainfall in the lower reaches; whereas rainfall is
more commonly confined to the upper catchment during moderate flood events (Costelloe et al., 2003).
The 1160 km Georgina River is also a major contributor to Lake Eyre inflow (Kotwicki, 1986). Its headwaters occur in the Barkly
Tablelands, straddling the border of Queensland and the Northern Territory at roughly twice the elevation of the Diamantina
headwaters. Also strongly influenced by the summer monsoon, large floods in the Georgina connect to the Diamantina-
Warburton River System via Eyre Creek and enter at Goyder Lagoon. Floodwaters from Eyre Creek have likely connected with the
Diamantina-Warburton River System seven times in the previous 25 years (1991, 1995, 1997, 2001, 2007, 2009 and 2011).
The geomorphology of the Diamantina-Warburton River System varies between channelised sections downstream of Birdsville
and Warburton Creek, separated by the broad floodplain of Goyder Lagoon. Only two waterbodies in the Diamantina-Warburton
River System are deep enough to persist longer than two years (Andrewilla and Yamakira Waterholes), but the Birdsville gauging
station has recorded flows every year since 1950, so even one flood year without flow into these waterholes is rare (Costelloe et
al., 2004). Small flows tend to terminate within Goyder Lagoon, whereas large flows continue into the Warburton and typically
reach Lake Eyre. Very large flows also reach Lake Eyre via Kallakoopah Creek, an anabranch of the Warburton.
Downstream of Birdsville the system runs through working cattle stations until just downstream of Derwent Creek, where it
reaches Kalamurina Station, a former cattle station that reverted to a nature reserve in 2007 (AWC, 2014). The system is
unregulated and although riparian and other vegetation has been impacted, the watercourses remain relatively unchanged from
European settlement.

DEWNR Technical note 2014/15 5
Figure 1 Diamantina-Warburton River System with major rivers and creeklines
DEWNR Technical note 2014/15 6
3 Catchment hydrology
3.1 Rainfall and potential evapotranspiration
The variability of rainfall over the catchment is, both spatially and temporally, among the highest in Australia (Allan, 1985). Large
flood events are typically associated with monsoonal troughs pushing deeper south into the Diamantina catchment and so tend
to be associated with heavy rainfall in the lower reaches; whereas rainfall is more commonly confined to the upper catchment
during moderate flood events (Costelloe et al., 2003).
Although large flood events tend to coincide with rainfall over a significant portion of the catchment, the desertic and self-
draining nature of the surrounding country means that very little of the rainfall reaches the system as runoff. The only area in the
catchment that noticeably contributes runoff via organised drainage is the Sturt Stony Desert, with runoff flowing into Goyder
Lagoon via small incised flood channels. Derwent Creek also contributes a small amount of flow into the Warburton, connecting
perhaps once every ten years (JF Costelloe (University of Melbourne) 2010 pers. comm.).
Rainfall data coverage over the Diamantina-Warburton River System is poorly distributed and available from three different
sources:
SILO patched point data (one site at Birdsville)
Gauged rainfall data (two sites proximate to the Diamantina-Warburton River System)
Community collected rainfall data (unknown number).
SILO is an enhanced climate database providing data for over 4500 Bureau of Meteorology, BOM, stations around Australia from
1889 to present (Jeffrey et al., 2001). It is hosted by the Queensland Government Department of Science, Information Technology,
Innovation and the Arts. SILO patched point data are original historical climate data for a particular BOM station where missing
data or aggregated data have been in-filled (or “patched”) using interpolated values. SILO data are available for Birdsville and
this is the preferred source of data for this project because it is a consistent and continuous long term rainfall record which is
independently verifiable and defensible. Its use is in line with increasing use of SILO data internally and externally to DEWNR (e.g.
Jones-Gill and Savadamuthu, 2014). Annual rainfall data for Birdsville are summarised in Table 1.
Table 1 Annual rainfall summary for Birdsville
Site no. Site name Site
established Site closed
Mean
annual
(mm)
Median
annual
(mm)
Max
annual
(mm)
Min
annual
(mm)
38002 Birdsville Police
Station 1957 177 162 537 33
SILO data are also available for a variety of potential evapotranspiration (PET) measures, including FAO56 and Morton’s open
body (lake) PET. Morton’s lake PET data were used to characterise waterbodies in development of the Diamantina-Warburton
hydrological model.
3.2 Streamflow
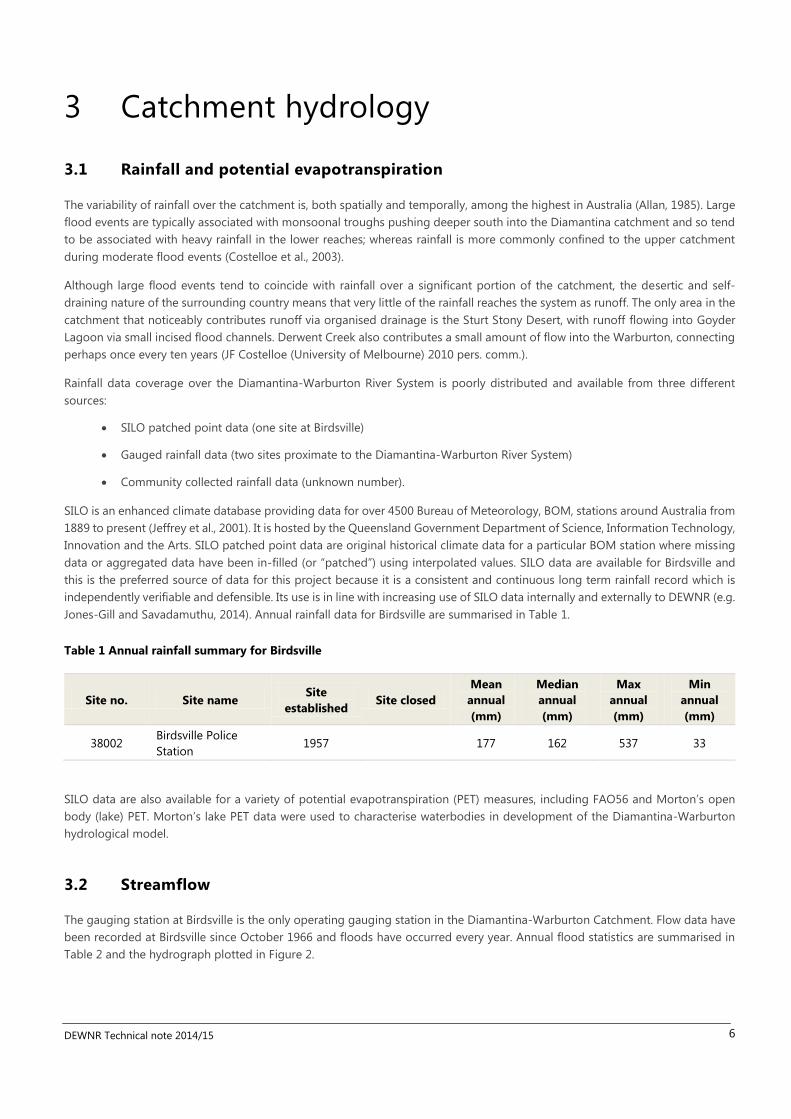
The gauging station at Birdsville is the only operating gauging station in the Diamantina-Warburton Catchment. Flow data have
been recorded at Birdsville since October 1966 and floods have occurred every year. Annual flood statistics are summarised in
Table 2 and the hydrograph plotted in Figure 2.
DEWNR Technical note 2014/15 7
Table 2 Annual flow statistics for Birdsville
Site name Site
established Site closed
Mean
annual (GL)
Median
annual (GL)
Max annual
(GL)
Min annual
(GL)
Max daily
(GL)
Birdsville 1966 1475 366 11454 30.8 415
Figure 2 Daily hydrograph for Birdsville
The flow data from the gauging station were used as the primary input into the hydrological model for the Diamantina-
Warburton River System. As the main input (streamflow) was reasonably accurate, the main challenge for the Diamantina-
Warburton model was to accurately route this flow through the complex flow paths of this reach. A stage monitoring station at
Poothapootha Waterhole, located downstream Goyder Lagoon and maintained by DEWNR, was installed in October 2011. This
station has not been collecting data long enough to be of much use in calibrating the model, but will prove an important source
of information in future analysis.
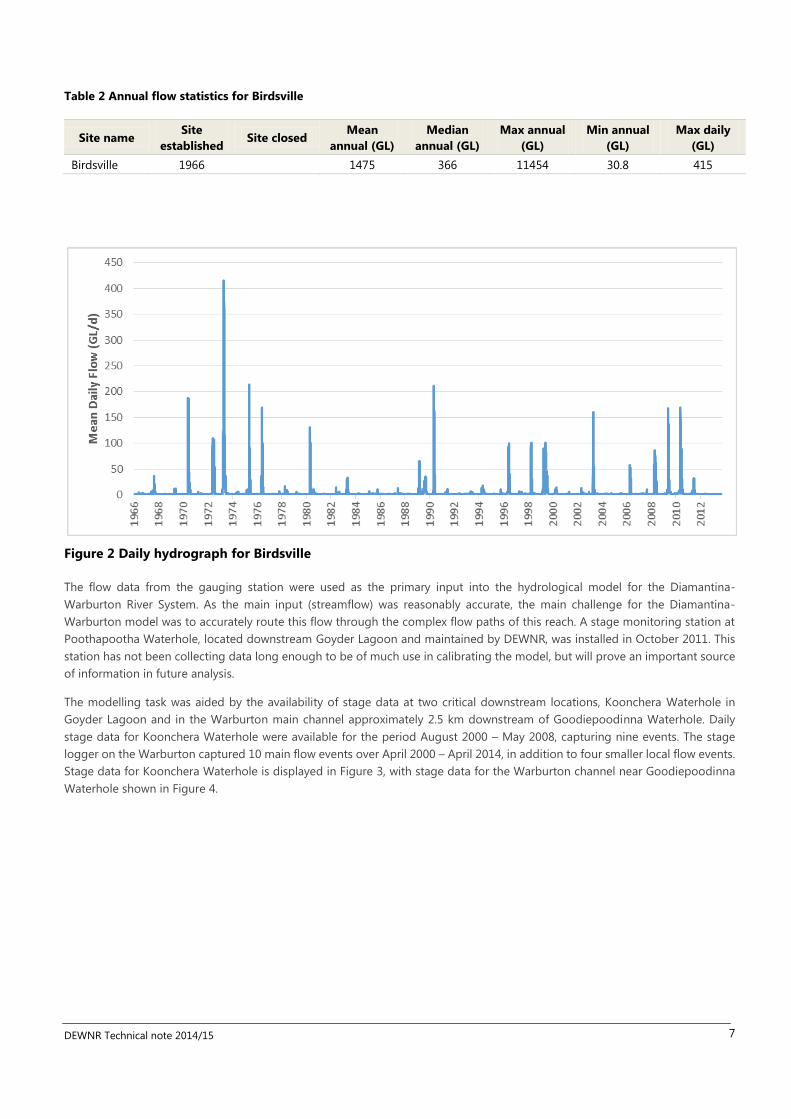
The modelling task was aided by the availability of stage data at two critical downstream locations, Koonchera Waterhole in
Goyder Lagoon and in the Warburton main channel approximately 2.5 km downstream of Goodiepoodinna Waterhole. Daily
stage data for Koonchera Waterhole were available for the period August 2000 – May 2008, capturing nine events. The stage
logger on the Warburton captured 10 main flow events over April 2000 – April 2014, in addition to four smaller local flow events.
Stage data for Koonchera Waterhole is displayed in Figure 3, with stage data for the Warburton channel near Goodiepoodinna
Waterhole shown in Figure 4.

DEWNR Technical note 2014/15 8
Figure 3 Stage data for Koonchera Waterhole
Figure 4 Stage data for Warburton Channel near Goodiepoodinna Waterhole

DEWNR Technical note 2014/15 9
3.3 Remotely sensed data
3.3.1 Overview
The limited nature of observed hydrological data in the Diamantina-Warburton River System is typical of ephemeral to
intermittent arid zone river systems (Costelloe et al., 2005). However, the lack of on-ground data can be addressed through use
of remotely sensed data. One satellite product that offers good coverage of the study area is the United States Geological
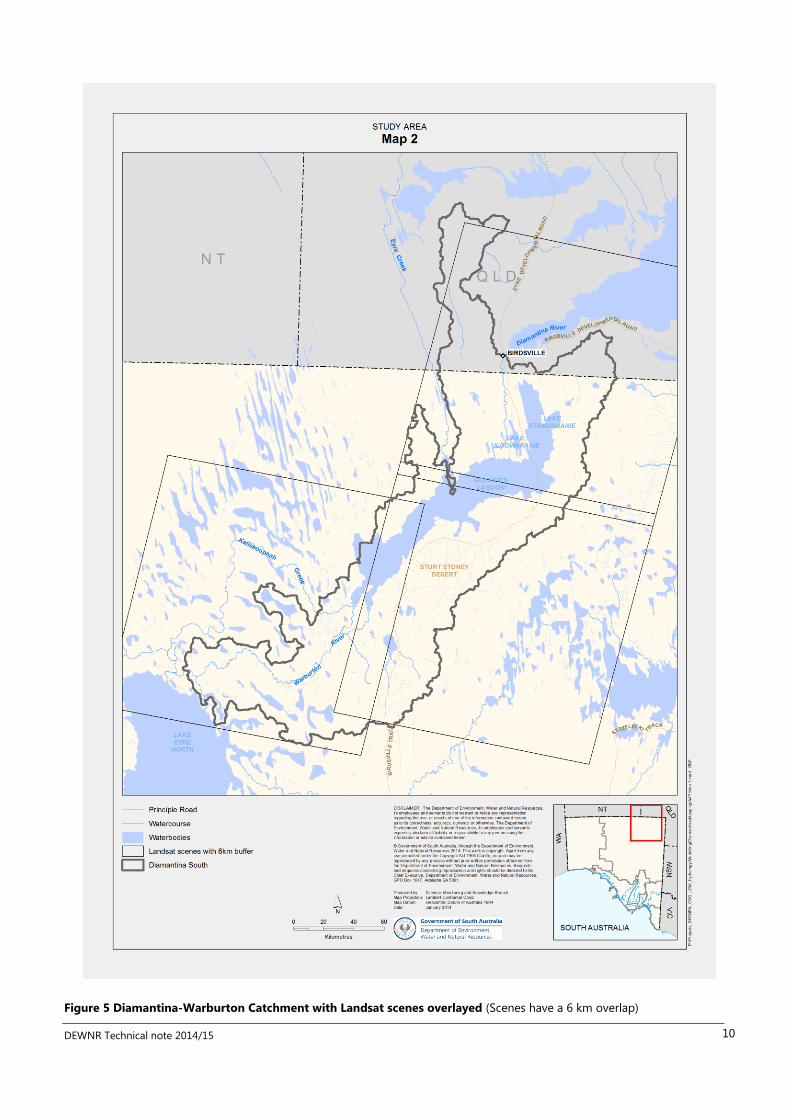
Survey’s (USGS) Landsat data. Landsat data are available in a mosaic format, with each image referred to as a “scene”. Three
Landsat scenes cover the study area, scene 98/78 at the top of the catchment, scene 98/79 in the middle, with scene 99/79
covering the lower part of the system (Figure 5).
In May 2013 the USGS and NASA released a new Landsat at-surface reflectance product. This product is generated via a
computational framework that uses the Landsat Ecosystem Disturbance Adaptive Processing System (LEDAPS) to calculate at-
surface reflectance. LEDAPS was developed by NASA Goddard Space Flight Center (GSFC) and the University of Maryland (Masek
et al. 2006). The software applies Moderate Resolution Imaging Spectroradiometer (MODIS) atmospheric correction routines to
Level-1 Landsat Thematic Mapper (TM) and Landsat Enhanced TM (ETM+) data. Water vapour, ozone, geo–potential height,
aerosol optical thickness and digital elevation are input with Landsat data to the Second Simulation of a Satellite Signal in the
Solar Spectrum (6S) radiative transfer models to generate top of atmosphere (TOA) reflectance, surface reflectance, brightness
temperature, and masks for clouds, cloud shadows, adjacent clouds, land, and water. The result is delivered as the Landsat Climate
Data Record (CDR) product.
There are 587 CDR Landsat images that capture floods in the Diamantina-Warburton River System between July 1987 and
July 2014; 198 of which cover the top of the catchment (scene 98/78), 237 in the mid-section (scene 98/79) and 152 images that
cover the terminal end at Lake Eyre (scene 99/79). The most intense sampling period (over 250 images) covers the period Jan
2007 to July 2014. By selecting an appropriate band combination (i.e. RGB = Band 7, 5 and 3) it is possible to visually identify (at
a 30 x 30 m pixel resolution) the distribution and extent of surface water for every image in time. The cascade of images at
different temporal resolutions makes it possible to determine how far down the system each flood travels and how long it takes
to reach that point.
DEWNR Technical note 2014/15 10
Figure 5 Diamantina-Warburton Catchment with Landsat scenes overlayed (Scenes have a 6 km overlap)
DEWNR Technical note 2014/15 11
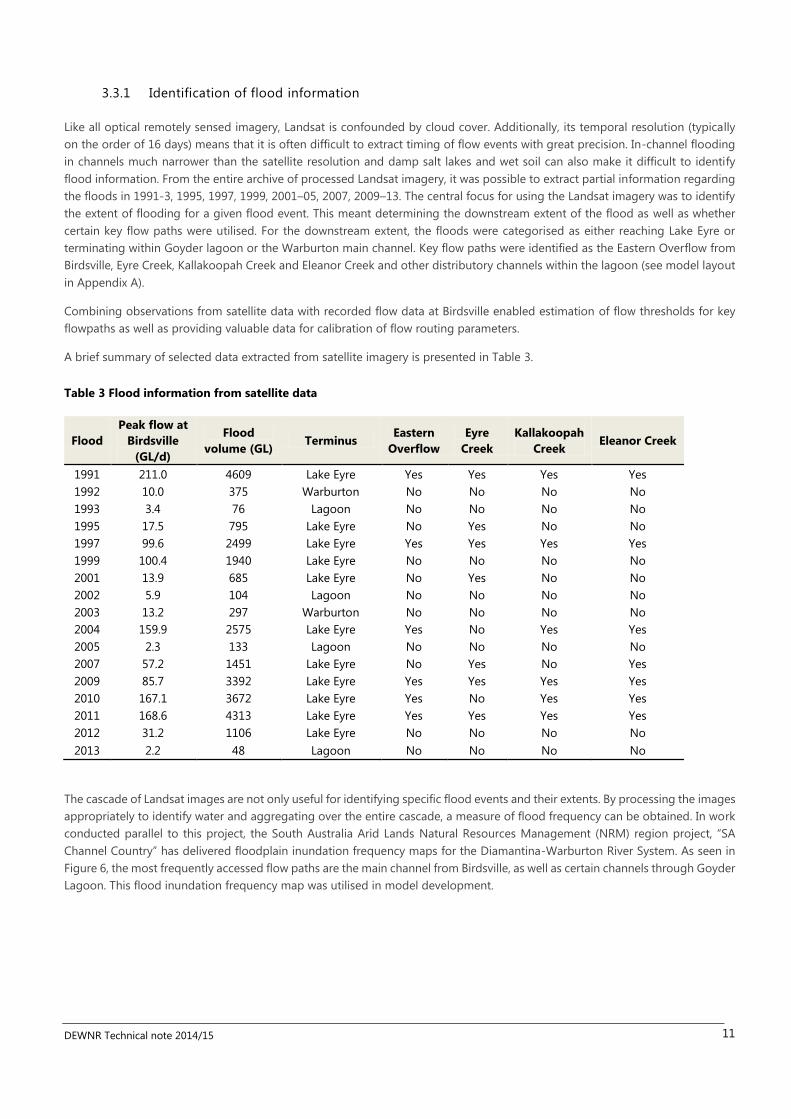
3.3.1 Identification of flood information
Like all optical remotely sensed imagery, Landsat is confounded by cloud cover. Additionally, its temporal resolution (typically
on the order of 16 days) means that it is often difficult to extract timing of flow events with great precision. In-channel flooding
in channels much narrower than the satellite resolution and damp salt lakes and wet soil can also make it difficult to identify
flood information. From the entire archive of processed Landsat imagery, it was possible to extract partial information regarding
the floods in 1991-3, 1995, 1997, 1999, 2001–05, 2007, 2009–13. The central focus for using the Landsat imagery was to identify
the extent of flooding for a given flood event. This meant determining the downstream extent of the flood as well as whether
certain key flow paths were utilised. For the downstream extent, the floods were categorised as either reaching Lake Eyre or
terminating within Goyder lagoon or the Warburton main channel. Key flow paths were identified as the Eastern Overflow from
Birdsville, Eyre Creek, Kallakoopah Creek and Eleanor Creek and other distributory channels within the lagoon (see model layout
in Appendix A).
Combining observations from satellite data with recorded flow data at Birdsville enabled estimation of flow thresholds for key
flowpaths as well as providing valuable data for calibration of flow routing parameters.
A brief summary of selected data extracted from satellite imagery is presented in Table 3.
Table 3 Flood information from satellite data
Flood
Peak flow at
Birdsville
(GL/d)
Flood
volume (GL) Terminus
Eastern
Overflow
Eyre
Creek
Kallakoopah
Creek Eleanor Creek
1991 211.0 4609 Lake Eyre Yes Yes Yes Yes
1992 10.0 375 Warburton No No No No
1993 3.4 76 Lagoon No No No No
1995 17.5 795 Lake Eyre No Yes No No
1997 99.6 2499 Lake Eyre Yes Yes Yes Yes
1999 100.4 1940 Lake Eyre No No No No
2001 13.9 685 Lake Eyre No Yes No No
2002 5.9 104 Lagoon No No No No
2003 13.2 297 Warburton No No No No
2004 159.9 2575 Lake Eyre Yes No Yes Yes
2005 2.3 133 Lagoon No No No No
2007 57.2 1451 Lake Eyre No Yes No Yes
2009 85.7 3392 Lake Eyre Yes Yes Yes Yes
2010 167.1 3672 Lake Eyre Yes No Yes Yes
2011 168.6 4313 Lake Eyre Yes Yes Yes Yes
2012 31.2 1106 Lake Eyre No No No No
2013 2.2 48 Lagoon No No No No
The cascade of Landsat images are not only useful for identifying specific flood events and their extents. By processing the images
appropriately to identify water and aggregating over the entire cascade, a measure of flood frequency can be obtained. In work
conducted parallel to this project, the South Australia Arid Lands Natural Resources Management (NRM) region project, “SA
Channel Country” has delivered floodplain inundation frequency maps for the Diamantina-Warburton River System. As seen in
Figure 6, the most frequently accessed flow paths are the main channel from Birdsville, as well as certain channels through Goyder
Lagoon. This flood inundation frequency map was utilised in model development.

DEWNR Technical note 2014/15 12
Figure 6 Frequency of inundation map for Diamantina-Warburton River System
DEWNR Technical note 2014/15 13
4 Surface water modelling
4.1 Overview
Reliable estimates of flow are required to inform and support policy and decision makers in water planning and management. A
variety of methods are available to determine or estimate routed streamflow through catchments. Observed data are best
wherever possible, but alternatively, estimates can be provided by using empirical and statistical techniques, and more commonly
using hydrological models (Vaze, et al., 2012, p. 5).
Hydrological modelling can be undertaken using a range of approaches, such as, simple empirical methods, large scale energy-
water balance equations, conceptual hydrological models, landscape hydrological models and fully distributed physically based
hydrological models (Jones-Gill and Savadamuthu, 2014). The choice of modelling approach is driven by various factors, with
problem definition (purpose of the modelling exercise) and data availability being two key factors. Conceptual hydrological
modelling is the commonly used category for investigations of this type. Description of other hydrological modelling categories
and their applications are provided in ‘Guidelines for rainfall-runoff modelling: Towards best practice model application’ (Vaze,
et al., 2012).
Conceptual hydrological models are simplified conceptual representations of different components of the hydrological cycle and
the interactions between them (e.g. rainfall, evaporation, interception, storage, infiltration, surface runoff, groundwater recharge
and base flow) (Jones-Gill and Savadamuthu, 2014). These components and their interactions are described mathematically by
equations that form the basis of the model.
4.2 Modelling objective
The objective of this modelling was twofold, namely to deliver a tool that will (i) aid in assessing the impacts on the flow regime
if mining operations were to occur upstream of the study area and (ii) provide a tool that will aid in eco-hydrological assessment
of the region. To address this objective a hydrological model was built for the Diamantina-Warburton River System and calibrated
to observed stage data in the system in addition to observations from remotely sensed data. The model constructed was a link-
node flow routing model that routed observed flows down the Diamantina River from Birdsville, through Goyder Lagoon and
down the Warburton to terminate in Lake Eyre North.
4.3 Methodology
The hydrological modelling platform used for this study was Source IMS (eWater Ltd., 2013). This modelling platform is a
nationally-recognised hydrological modelling platform that has been developed as part of an Australia-wide collaboration,
endorsed by the Australian Government. Source is a PC-based rainfall-runoff and flow routing water balance modelling platform.
Within Source, a model is constructed as a series of nodes and links which are connected based on the drainage direction of the
catchment being modelled. Each node/link can represent different components of the water balance, such as:
Confluences (the meeting of two or more streamlines)
Splitters (locations where the channel branches into two or more drainage lines)
Storages (lakes, waterholes, etc.)
Inflow nodes (locations where flow is added to the system).
A hydrological model has been constructed and calibrated in Source for the Diamantina-Warburton River System using observed
daily rainfall, evaporation and streamflow records, lake properties (e.g. volume and surface area), and estimated catchment
parameters.
DEWNR Technical note 2014/15 14
4.4 Model construction
Model construction is the process of:
Identifying key locations throughout the system (such as inflow locations, stream branches and lakes) and ensuring
that the system is adequately represented spatially
Creating and parameterising nodes and links to represent the hydrological components, behaviour and characteristics
of the catchment
Defining the interactions between the various processes of the hydrological cycle included in the model.
4.4.1 Model overview
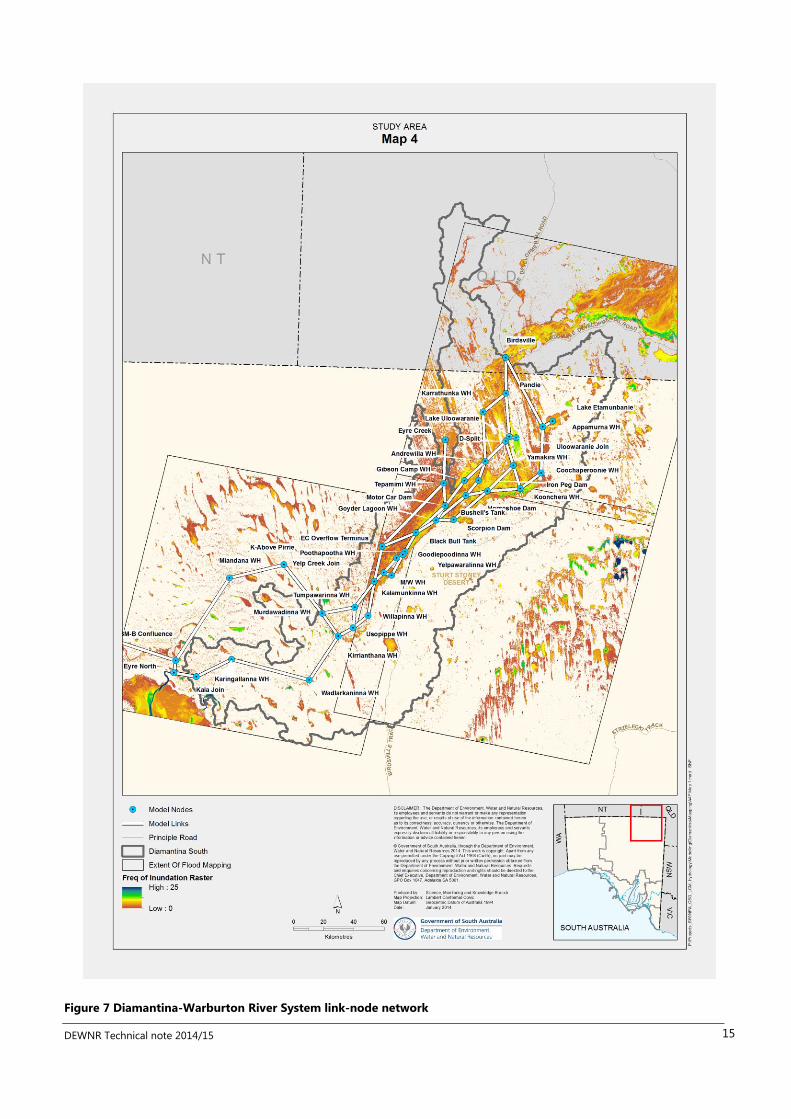
Through examination of flood inundation frequency maps of the study area, and in consultation with topographic maps and
expert advice (JF Costelloe (University of Melbourne) 2010 pers. comm.), a series of nodes have been identified for the
Diamantina-Warburton Catchment (Figure 7). Wherever possible, the nodes represent a distinctive geographic feature, such as
a waterhole or lake. These nodes have been selected to ensure adequate representation of the spatial distribution of flow
pathways through Goyder Lagoon, and to pick up flow paths utilized only during high flow events (termed overflow channels in
this report), such as the Eastern Overflow and Eleanor Creek. The Warburton main channel and Kallakoopah Creek have been
identified in addition to demarking where floodwaters from Eyre Creek reach the Diamantina-Warburton River System.
4.4.2 Model nodes
A full schematic of the model is shown in Appendix A. Nodes have been modelled as confluences unless they (i) represent a point
where flow branches, (ii) are lakes or (iii) are locations where flow is added to the system. From Figure 7, it can be seen that many
of the confluences in the model are waterholes. Typically, waterholes are hydrologically modelled as storages requiring a fixed
relationship between the depth, area and volume of the specific waterhole. Very limited information regarding the bathymetry
of the waterholes of the Diamantina-Warburton exists, though field trips have determined that the maximum capacity of the
waterholes is orders of magnitude less than the floodwaters. Additionally, floodwaters in the Diamantina-Warburton River System
tend to utilise much of the floodplain where losses are likely to be much more significant than the capacity of the waterholes. In
this model, transmission losses and routing parameters have been adjusted accordingly to account for the water lost to waterhole
storage.
4.4.2.1 Splitters
A splitter node has been placed at locations where the flowpath branches. These nodes distribute flow down a main and an
effluent branch, according to a fixed percentage that can be a function of flow. For example, analysis of satellite data around the
Eastern Overflow from Birdsville has shown that gauged flow in excess of 55 000 ML/d is required before floodwaters enter the
Eastern Overflow. The splitter node at Birdsville can therefore be set to require a threshold flow of 55 000 ML/d before diverting
a fixed percentage (e.g. 25%) of flow down the effluent line. There are 14 splitter nodes in the Diamantina-Warburton model,
describing activation of high flow pathways, like the Eastern Overflow and Eleanor Creek, as well as branching within Goyder
Lagoon (Table 4).
DEWNR Technical note 2014/15 15
Figure 7 Diamantina-Warburton River System link-node network

DEWNR Technical note 2014/15 16
4.4.2.2 Storages
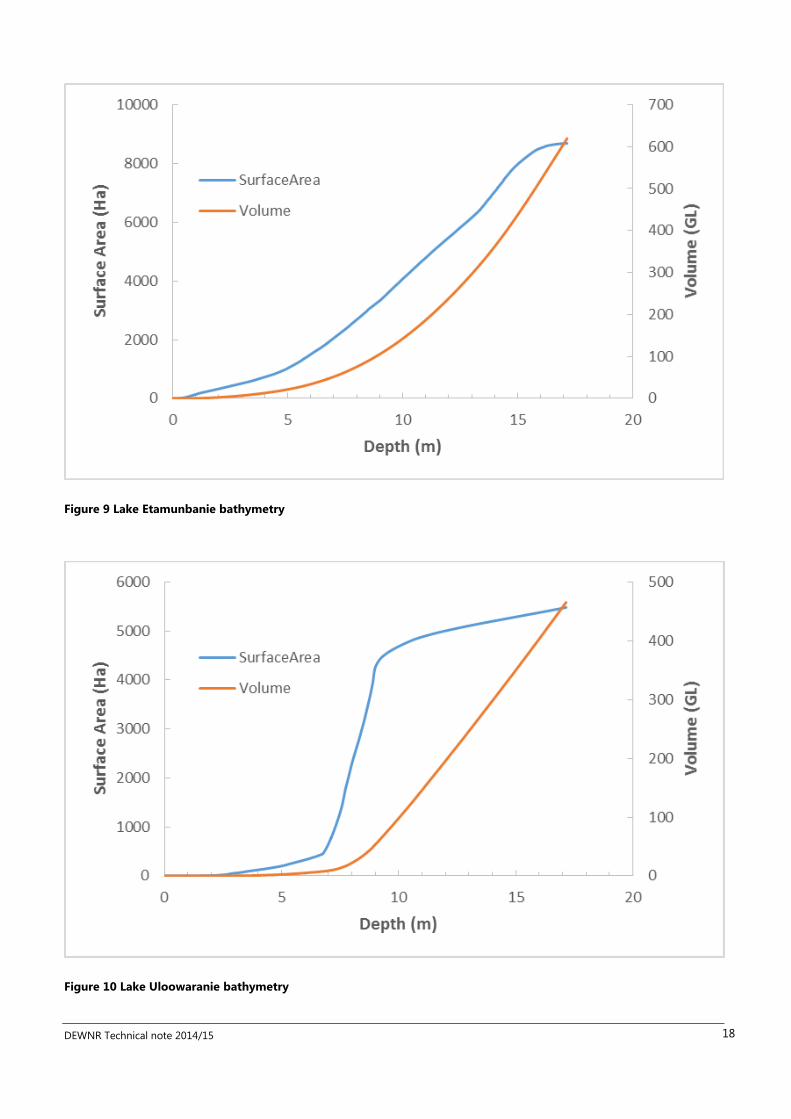
The two lakes in the Diamantina-Warburton river system, Lake Uloowaranie and Lake Etamunbanie, were modelled as storages.
As mentioned previously, Source requires detailed bathymetry of storages to model them effectively, however no bathymetry
data have been measured for these lakes. In order to model these lakes, a series of depth-area-volume relationships for each
lake was determined by examining the digital elevation model (DEM) for each lake. Firstly, the maximum extent of the lake was
determined by examining Landsat imagery for the 2011 flood. Then, the profile of the lake was clipped out of the DEM for South
Australia (see Figure 8). By using the spatial analyst tool in ESRI ArcGIS (SurfaceVolume_3d) on the clipped DEM it was possible
to determine the necessary depth-area-volume relationships for the lakes. These are shown in Figures 9 and 10. SILO Rainfall
and evapotranspiration data for Birdsville as described in Section 3.1 were used to characterise the lakes. It must be noted that
the depths and volumes of both lakes appear to be overestimated. This is likely owing to the poor quality of DEM for Central
Australia. Field observations of elevations would assist in refining the bathymetry of the lakes.
4.4.2.3 Inflow nodes
As the Diamantina-Warburton model is a flow routing model, inflow nodes are crucial as they define the volume and timing of
flow throughout the model. In addition to the gauged flow at Birdsville, it was necessary to include an inflow node for Eyre Creek.
As there is no information regarding flows down the Georgina River or Eyre Creek it was necessary to assume a model
hydrograph. This was assumed to be 10% of the flow at Birdsville, during the years that Eyre Creek was observed to flow.
Refinement of this figure would require a major hydrological exercise that is beyond the scope of this work. It is known that
runoff is generated off the Sturt Stony Desert and this should be accounted for via an input node. However, the volume of runoff
generated is very small in comparison to the main channel flows and was not considered in this work. This means that the model
is unlikely to pick up smaller flows downstream of Goyder Lagoon.
4.4.3 Routing
Since the Diamantina-Warburton model functions on a daily time-step, it is necessary to parametrically route flows through the
system to account for travel times and transmission losses (Welsh and Podger, 2008). Transmission losses in arid zone rivers are
mostly due to evapotranspiration, infiltration and ponding in ephemeral pools. Parameters such as width and length of the
channel, soil type and stream gradient have relative importance in estimating the losses. However, given the large range of
uncertainties in estimating any of these parameters, a simpler approach was incorporated that defines a set of parameters defined
per unit length for two land types through the study area. The distinction was made between the channelized sections of the
Diamantina and Warburton, upstream and downstream of Goyder Lagoon, and the lagoon itself, including overflow paths like
the Eastern Overflow, Eleanor Creek and Yelpawaralinna Creek. The routing formula incorporated in each link in Source is:
𝑆 = 𝑙𝑟𝐾𝑐,𝑙𝑄𝑚 + 𝐿𝑇𝑐,𝑙 , where Eq. 1
𝐿𝑇𝑐,𝑙= 𝑙𝑟 ∙ 𝑎𝑐,𝑙 ∙ 𝑄𝑈𝑃𝑆𝑇𝑅𝐸𝐴𝑀 + 𝑙𝑟 ∙ 𝑏𝑐,𝑙 Eq. 2
Where: 𝑆 is the storage volume in the reach (GL)
𝐾𝑐,𝑙 is the per-metre storage constant for either channelized section or lagoon (s/m)
𝑙𝑟 is the length of the reach (m)
𝑄 is the discharge or outflow rate (ML/s)
𝑚 is a dimensional empirical exponent, a measure of the non-linearity of the model
𝑎𝑐,𝑙 is the per-metre percentage loss in a reach for either channelized section or lagoon (%/m)
𝑏𝑐,𝑙 is a per-metre initial loss in the reach for either channelized section or lagoon (ML/m)
The value of m was set to m = 0.8, which is the recommended starting value for non-linear routing (eWater, 2013). The remaining
parameters, K, a and b were derived through calibrating the model against observed stage levels and observations from satellite
data.

DEWNR Technical note 2014/15 17
Figure 8 Lake Uloowaranie and Lake Etamunbanie DEM
DEWNR Technical note 2014/15 18
Figure 9 Lake Etamunbanie bathymetry
Figure 10 Lake Uloowaranie bathymetry

DEWNR Technical note 2014/15 19
4.5 Model calibration and validation
Model calibration is a process of optimising or systematically adjusting model parameter values to get a set of parameters which
provides the best estimate of the observed streamflow (Vaze et al., 2012, p. 27). By comparing model-generated streamflow
data against observed data, a measure of goodness of fit can be determined. The iterative process of varying catchment input
parameters is undertaken until a ‘good agreement’ is achieved between the simulated and observed data. The purpose of
calibration is to ensure the model is able to adequately represent the hydrological behaviour of the catchment.
Model validation is a process of using the calibrated model parameters to simulate runoff over an independent period outside
the calibration period (Vaze et al., 2012, p. 27). This is undertaken to evaluate the suitability of the calibrated model for predicting
runoff over a period outside the calibration period. Validation is considered an important step in the modelling process as it
increases the confidence in the ability of the model to undertake prediction.
The input parameters that were varied during calibration were the routing and transmission loss parameters in addition to split
percentages and thresholds.
For the purposes of this study, ‘good agreement’ involved visual and graphical comparison of recorded and simulated data at
strategic locations throughout the model.
4.5.1 Calibration data
As described in Sections 3.2 and 3.3, hydrological data available for calibration consists of measured stage heights at two
locations, in addition to information determined from analysis of satellite imagery. Daily stage data for Koonchera Waterhole
were available for the period August, 2000 – May, 2008, capturing nine events. The stage logger on the Warburton captured 10
main flow events over April 2000 – April 2014, in addition to four smaller local flow events. Information regarding downstream
extent of flooding determined from satellite data is summarised in Table 3.
4.5.2 Calibration methodology
The division of the Diamantina-Warburton River System into two land types (channel and lagoon), necessitated an iterative
calibration process. Firstly, transmission time values (Ks) were calibrated until the timing of flows at Koonchera and Warburton
Channel were proximate. Then losses within the lagoon, in addition to split percentages, were varied until identified flows that
did not emerge from the lagoon were modelled to terminate within the lagoon. Once this was achieved, losses were updated so
as to ensure that modelled flows agreed with observed stage data at the Warburton site. Finally, loss parameters and K values
were re-assessed jointly to ensure that timing of events was still consistent. To assist in evaluating these parameters, it was
determined whether known flows that reached Lake Eyre were modelled to do so.
4.5.3 Calibration results
4.5.3.1 Parameter values
A summary of splitter parameters is given in Table 4. It can be seen that most splitters have even split-percentages. This is as
many of these divergences occur within the lagoon and there was no evidence from the floodplain inundation frequency map to
suggest that one flowpath was preferred over another.
Routing and transmission loss parameters are summarised in Table 5. It is noticeable that losses are significantly higher within
the lagoon than in the channelized sections. This is consistent with hydrological understanding of the country. This can be
explained by larger flows utilising more of the floodplain and recording much higher losses.

DEWNR Technical note 2014/15 20
Table 4 Splitter parameters
Split Main link Effluent link Threshold (GL/d) Main link (%)
Birdsville Pandie Pandie Eastern Overflow 60 90
Pandie Pandie Diamantina Eleanor Creek 40 75
Diamantina Split Andrewilla WH Yamakira WH 0 50
Andrewilla WH Gibsons Camp WH Iron Peg Dam 0 50
Yamakira WH Horseshoe Dam Koonchera WH 0 50
Horseshoe Dam Scorpion Dam Bushells Tank 0 50
Motor Car Dam Black Bull Tank Goyders Lagoon WH 0 50
Black Bull Tank Poothapootha WH EC Overflow Terminus 0 80
Goodiepoodinna WH M/W WHs Yelpawaralinna Creek 0 90
Kalamunkinna WH Tumpawarinna WH Willapinna WH 0 50
Tepamimi WH EC to lagoon Eyre Creek Overflow 0 80
Tumpawarinna WH Kallakoopah Creek Warburton 0 70
Lake Uloowaranie Inflow Lake Uloowaranie Diamantina 0 15
Appamurna WH Lake Etamunbanie Eastern Overflow 0 25
Table 5 Routing and transmission loss parameters
Parameter Value
K(channel) 60 s/m
K(lagoon) 100 s/m
Percentage loss (channel) 0.0001 %/m
Percentage loss (lagoon) 0.0005 %/m
Initial loss (channel) 0.002 ML/m
Initial loss (lagoon) 0.006 ML/m
4.5.3.2 Fit to observed data
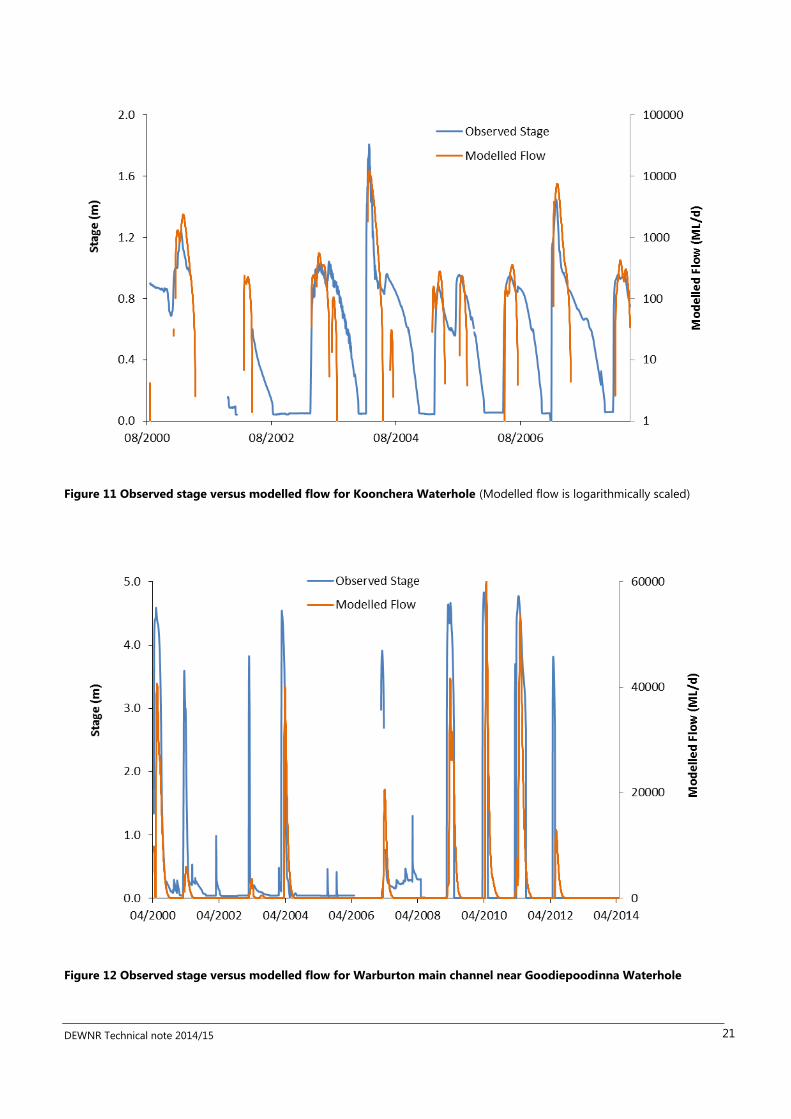
Modelled flow is plotted against observed stage for Koonchera Waterhole in Figure 11 and for the Warburton main channel near
Goodiepoodinna in Figure 12. The flow at Koonchera is affected by the storage relationships for Lake Uloowaranie and Lake
Etamunbanie, the Eastern overflow and the splits at the Diamantina split and downstream of Yamakira Waterhole. It also takes
into account both sets of routing and transmission losses. As can be seen from Figure 11, the timing of commencement of flow
is exceptional, with no more than two days difference between observed and modelled flow. The agreement between relative
magnitudes of peak flows is also very good. Every event observed at Koonchera Waterhole is picked up by the model.
The timing of modelled events at the Warburton main channel near Goodiepoodinna Waterhole seen in Figure 12 is also excellent
for the 10 main channel flows. It is noticeable that the smaller flows, likely caused by local runoff from the Sturt Stony Desert,
have not been picked up by the model. This is understandable as the model does not account for any additional runoff input.
The flow at the Warburton main channel is influenced by multiple storages, splits and the complexities of the entire lagoon in
addition to the flow from Eyre Creek. The fact that the model does such a good job of picking up the timing of events is proof
of its efficacy.
DEWNR Technical note 2014/15 21
Figure 11 Observed stage versus modelled flow for Koonchera Waterhole (Modelled flow is logarithmically scaled)
Figure 12 Observed stage versus modelled flow for Warburton main channel near Goodiepoodinna Waterhole
DEWNR Technical note 2014/15 22
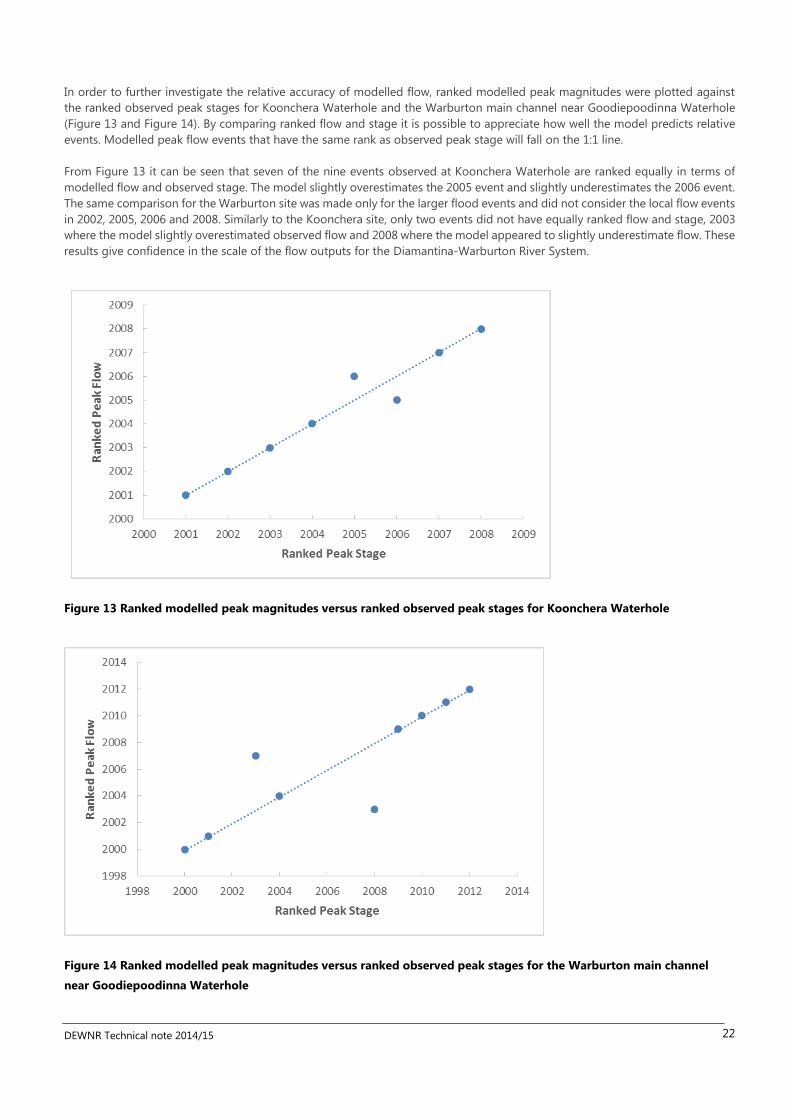
In order to further investigate the relative accuracy of modelled flow, ranked modelled peak magnitudes were plotted against
the ranked observed peak stages for Koonchera Waterhole and the Warburton main channel near Goodiepoodinna Waterhole
(Figure 13 and Figure 14). By comparing ranked flow and stage it is possible to appreciate how well the model predicts relative
events. Modelled peak flow events that have the same rank as observed peak stage will fall on the 1:1 line.
From Figure 13 it can be seen that seven of the nine events observed at Koonchera Waterhole are ranked equally in terms of
modelled flow and observed stage. The model slightly overestimates the 2005 event and slightly underestimates the 2006 event.
The same comparison for the Warburton site was made only for the larger flood events and did not consider the local flow events
in 2002, 2005, 2006 and 2008. Similarly to the Koonchera site, only two events did not have equally ranked flow and stage, 2003
where the model slightly overestimated observed flow and 2008 where the model appeared to slightly underestimate flow. These
results give confidence in the scale of the flow outputs for the Diamantina-Warburton River System.
Figure 13 Ranked modelled peak magnitudes versus ranked observed peak stages for Koonchera Waterhole
Figure 14 Ranked modelled peak magnitudes versus ranked observed peak stages for the Warburton main channel
near Goodiepoodinna Waterhole

DEWNR Technical note 2014/15 23
Analysis of the satellite data in Table 3 demonstrated that annual flow events in 1993, 2002, 2005 and 2013 did not pass through
Goyder Lagoon. Modelled flow at Poothapootha waterhole, the model node immediately downstream of the lagoon is consistent
with these observations (Figure 15). Additionally, the annual floods of 1991, 1995, 1997, 1999, 2001, 2004, 2007, 2009–12 were
observed to reach Lake Eyre North. This is consistent with model output (Figure 16). Comparison of the Birdsville and Lake Eyre
North inflow node hydrographs shows that approximately 80% of flow by volume is lost through the model. This figure is
consistent with hydrological experience in the area (JF Costelloe (University of Melbourne) 2010 pers. comm.).
Figure 15 Flow at Birdsville versus flow at Poothapootha Waterhole
Figure 16 Flow at Birdsville versus Lake Eyre inflow
4.5.4 Limitations
Although the model effectively reproduces the timing of observed events in the system, the model should be considered limited
in its ability to estimate the magnitude of the events. The lack of volumetric information to calibrate the model means that it is
not possible to estimate confidence surrounding simulated discharge volumes. However, the fact that the model captures
whether a flood peak at Birdsville reaches Lake Eyre North or terminates within Goyder’s Lagoon in addition to showing good
agreement between ranked discharge and stage at Koonchera Waterhole and the Warburton main channel near Goodiepoodina
Waterhole suggests that volumetric estimates should be acceptably robust.
DEWNR Technical note 2014/15 24
The most obvious area for improvement of the model is to include a measure of the runoff generated from the Sturt Stony
Desert. This could be done by delineating a catchment area based on topography and applying a rainfall/runoff model, the
parameters of which would be calibrated by examining the residual effect on the output at the Warburton channel near
Goodiepoodinna Waterhole.
Additional improvement could be made to the model via a more thorough investigation of flow from Eyre Creek as this is a major
contributor to Lake Eyre inflows via Goyder’s Lagoon. A detailed analysis of enhanced satellite imagery could lead to a better
understanding of the hydrograph and a more complete hydrological understanding of the complex system.
Collection of more hydrologic data would also assist to refine the model. Bathymetric data of the waterholes in the system would
enable them to be modelled as storages instead of confluences and provide more information for hydroecological investigations.
Flow gauging data at locations within the Diamantina-Warburton River System, particularly the DEWNR monitoring site at
Poothapootha Waterhole, would enable refinement of parameters and increase confidence in volumetric model outputs.
Finally, the use of only two classes of routing and transmission loss parameters should be revisited. Although modelling the
system in all its complexity is beyond the scope of this current work, additional hydrologic data such as longer records, flow data
or stage data captured at additional sites throughout the system would enable construction of a slightly more complex routing
model. Through cross-comparison with satellite imagery it would be possible to determine at what volume floodwaters overtop
channels in the channelized country and access portions of the outer floodplain in the lagoon. These flood events would register
higher losses in both cases, and analysis of such events would enable calculation of two sets of parameters for each section that
could be incorporated into a switching model with identified flow thresholds triggering the switch in parameter sets.
DEWNR Technical note 2014/15 25
5 Summary and recommendations for future
work
This report details the construction of a flow routing model for the Diamantina-Warburton River System in Source. The model
routes flow from Birdsville, through channelized sections of the Diamantina River at the top of the reach and the Warburton River
at the bottom of the reach and also through multiple flow pathways through Goyder Lagoon in the centre of the reach. The
model accounts for inflow from Eyre Creek into Goyder Lagoon, as well as overflow from Eyre Creek reaching downstream of the
lagoon. Two sets of flow routing and transmission loss parameters were calibrated to better describe the channelized and lagoon
sections. The model also accounts for interactions between the river system and the two large lakes in the catchment.
The model was calibrated according to two sets of observed stage data and information determined from satellite imagery.
Model output was able to reproduce the timing of all flow events at a location within the lagoon and all major events at the
location in the Warburton main channel, downstream of the lagoon. Small events, likely caused by runoff generated off the Sturt
Stony Desert were not captured by the model at the Warburton main channel site as the model does not include any flow inputs
aside from Birdsville and Eyre Creek.
Observations from satellite imagery identified the downstream extent of 17 flood events between 1991 and 2013. Four of these
events terminated within Goyder Lagoon and a further two terminated downstream of the lagoon, but upstream of Lake Eyre.
The model replicated these observations. When comparing the modelled hydrograph at Lake Eyre North from 1989–2013 with
observed flow at Birdsville, it was seen that approximately 80% of flow was lost through the river system.
Although the model is able to reproduce the timing of observed events in the system very well, the model should be considered
limited in its ability to estimate the magnitude of the events. The lack of volumetric information to calibrate the model means
that it is not possible to estimate confidence surrounding simulated discharge volumes. However, the fact that the model
accurately simulates the downstream extent of flood events suggests that volumetric estimates should be acceptably robust.
Recommendations for future work fall into two complementary categories, data collection and model refinement. By conducting
flow gaugings at strategic locations throughout the system a measure of confidence in simulated flow volumes could be gained.
Further, collection of bathymetric data of key waterholes would enable modelling them as storages instead of confluences. In
terms of refining the model, a rainfall/runoff inflow node should be included for the Sturt Stony Desert to ensure that the local
flows missed by the model are picked up and finally, routing and transmission loss parameters could be examined to account
for overbank flows in channelized country and outer floodplain flows in the lagoon.
DEWNR Technical note 2014/15 26
6 References
Allan RJ (1985) The Australian summer monsoon, teleconnections, and flooding in the Lake Eyre Basin. In South Australian
Geographic Papers, Vol. 2. Royal Geographical Society of Australasia, South Australian Branch: Adelaide; 477pp.
Australian Wildlife Conservancy (AWC), Kalamurina Sanctuary
[http://www.australianwildlife.org/sanctuaries/kalamurina-wildlife-sanctuary.aspx] Accessed: 27/8/2014
Costelloe JF, Grayson RB, McMahon TA and Argent RM (2003) Modelling the flow regime of an arid zone, floodplain river,
Diamantina River, Australia. Environ. Mod. Soft. 18, 693-703.
Costelloe JF, Hudson PJ, Pritchard JC, Puckridge JT and Reid JRW (2004) ARIDFLO Scientific Report: Environmental Flow
Requirements of Arid Zone Rivers with Particular Reference to the Lake Eyre Drainage Basin.Final Report to South Australian
Department of Water, Land and Biodiversity Conservation and Commonwealth Department of Environment and Heritage.
School of Earth and Environmental Sciences, University of Adelaide, Adelaide.
Costelloe JF, Grayson RB and McMahon TA (2005) Modelling streamflow in a large ungauged arid zone river, central
Australia, for use in ecological studies. Hydrological Processes 19: 1165-1183.
Costelloe, J.F., Grayson, R.B. and McMahon, T.A., (2006), Modelling streamflow in a large anastomosing river of the arid
zone, Diamantina River, Australia. Journal of Hydrology 323: 138-153.
eWater Ltd (2013). Source User Guide (v3.5.0).
[https://ewater.atlassian.net/wiki/display/SD35/Source+User+Guide] Accessed: 11/10/2013
Jeffrey, S.J., Carter, J.O., Moodie, K.B. and Beswick, A.R. (2001). Using spatial interpolation to construct a comprehensive
archive of Australian climate data External link icon, Environmental Modelling and Software, Vol 16/4, pp 309-330.
Jones-Gill A and Savadamuthu K (2014) Hydro-ecological investigations to inform the Barossa PWRA WAP review –
Hydrology Report, DEWNR Technical Report 2014/14, Government of South Australia, through Department of Environment,
Water and Natural Resources, Adelaide
Kotwicki, V (1986) Floods of Lake Eyre. Engineering and Water Supply Department, Adelaide, 99 pp.
Masek, J. G., E. F. Vermote, N. E. Saleous, R. Wolfe, F. G. Hall, and K. F. Huemmrich (2006) A Landsat surface reflectance
dataset for North America, 1990-2000. Geoscience and Remote Sensing Letters, IEEE 3:68-72.
Vaze, J., Jordan, P., Beecham, R., Frost, A., Summerell, G. (2012) Guidelines for rainfall-runoff modelling: Towards best
practise model application’. eWater Ltd
Welsh W.D. and Podger G.M. (2008) Australian Hydrological Modelling Initiative: River System Management Tool (AHMI:
RSMT) functionality specifications. eWater Technical Report. eWater Cooperative Research Centre, Canberra.

DEWNR Technical note 2014/15 27
Appendix A. Schematic of Diamantina-Warburton Source model
Figure 17 Schematic of Source model for Diamantina-Warburton River System