Hydrological Heritage Overview: Johannesburg
64
GOLD IN THE RAND, WATER FROM THE LAND Hydrological Heritage Overview: Johannesburg
Transcript of Hydrological Heritage Overview: Johannesburg
Gold in the Rand, WateR fRom the land
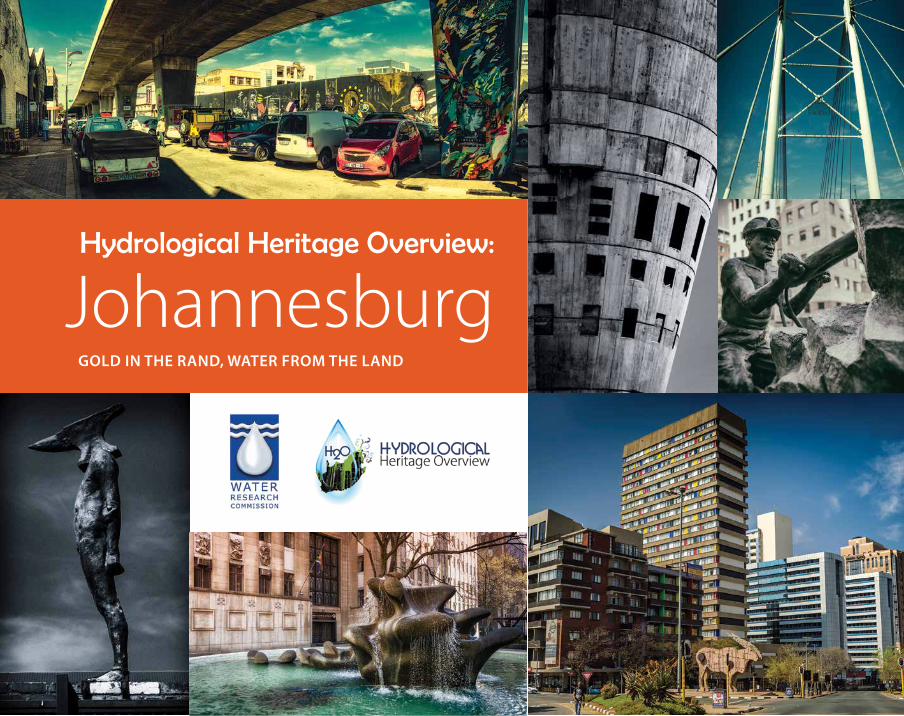
Hydrological Heritage Overview:
Johannesburg

Obtainable from:Water Research CommissionPrivate Bag X03Gezina0031
DisclaimerThe Water Research Commission (WRC) has approved this book for publication. Approval does not signify that the contents necessarily reflect the views and policies of the WRC, nor does mention of trade names or commercial products constitute endorsement or recommendation for use.
Design and layout: Dreamwave Design Solutions
ISBN 978-1-4312-0710-7Printed in the Republic of South Africa
© Water Research Commission
© Gerrit Burger
Hydrological Heritage Overview:Johannesburg
Gold in the Rand, Water from the Land
Matthys A. Dippenaar (with photographic contribution by Gerrit Burger)
A publication of the Water Research Commission of South AfricaOctober 2015
SP91/15

2 | Hydrological Heritage Overview: Johannesburg
Preface 4Acknowledgements 5
CHAPTER 1: 7INTRODUCTION
Johannesburg: City of Gold 7The Hydrological Heritage Overview Project 9Urban Landscape 10Water Demands of the City of Johannesburg 11
CHAPTER 2: 13A GLIMPSE THROUGH TIME: ANCIENT HISTORY
The Origin of Water on Earth 14A Long and Intricate Geological History 15Greenstone 22Johannesburg Dome 22Witwatersrand Supergroup 23Ventersdorp Supergroup 25Transvaal Supergroup and Black Reef Formation 25Diabase and Syenite 26Karoo Supergroup 26Landscape Development and Surface Drainage 26The Rise of Man 29
CHAPTER 3: 30A GLIMPSE THROUGH TIME: RECENT HISTORY
Discovery of Gold 32The Gold Rush and the Founding of Johannesburg 33After the war 37
Contents
Hydrological Heritage Overview: Johannesburg | 3
CHAPTER 4: 38A MATTER OF DEMAND VERSUS SUPPLY
Johannesburg’s Initial Water Supply 42Establishment of the Rand Water Board 43Damming the Vaal River 43Water for the Coalfields 44Water from the Tugela River 45Water from the Senqu River in Lesotho 47Establishment of Johannesburg Water 49Development of Johannesburg’s Sanitation System 49
CHAPTER 5: 50WATER SUPPLY AND WATER RESOURCE
Water Quality and Supply 50Rural and Peri-urban Impacts on the Water Cycle and Water Quality 54Urban Impacts on the Water Cycle and Water Quality 54Mining Impacts on the Water Cycle and Water Quality 55Water Treatment and Discharge to other Catchments 57
CHAPTER 6: 58THE ROAD AHEAD
Selected Bibliography 60

4 | Hydrological Heritage Overview: Johannesburg
Johannesburg – more than a century of water supply innovation
The world is experiencing an unprecedented rate of urbanisation. According to the United Nations, half of humanity now lives in cities, and within two decades, nearly 60% of the world’s people will be urban dwellers.
Urban growth is most rapid in the developing world where cities gain an average 5 million residents every month. The exploding urban population growth creates unprecedented challenges, among which provision for water and sanitation have been the most pressing and painfully felt when lacking.
For Johannesburg, the constantly increasing demand for water has been a potential impediment to socio-economic growth from its conception over a century ago. As one of the few major cities in the world not located on or near a significant water resource, Johannesburg has had to increasingly find new, innovative ways to supply its residents with water, while stemming the pollution
from its industrial and mining activities. From initial efforts to obtain water from meagre streams and groundwater sources water is now imported from as far as the Tugela River in KwaZulu-Natal and the Senqu River in Lesotho through some of the most sophisticated bulk water infrastructure in the world.
It is in celebration of these scientific and engineering efforts that Johannesburg was selected as the topic of choice in this the second of the Hydrological Heritage Overview series. The aim of this publication is to increase understanding and appreciation for the sustained effort required to keep South Africa’s economic powerhouse running.
It is the hope of the Water Research Commission that this publication will serve as more than a glimpse into the water management challenges of South Africa’s largest city, but that it will be a useful tool to garner awareness of the important role that each citizen has to play in ensuring a water secure future for Johannesburg.
Preface
Dhesigen Naidoo

Hydrological Heritage Overview: Johannesburg | 5
Water is pivotal in development, and similarly, the work published here is a collation of numerous persons’ efforts, willingness, time and information. It is always hard to write acknowledgements, fearing omission of someone critical. Nonetheless, this work would not have been possible with some very important contributions.
First and foremost, sincere gratitude is expressed to the South African Water Research Commission (WRC). Their dedication to the promotion of water awareness and research is world class. Thanks for funding this project and for continuing the Hydrological Heritage Overview (H2O) campaign as established in the preceding Pretoria projects.
In particular, thanks goes to Dr Shafick Adams of the WRC, research manager for this project, for his enthusiasm, guidance and input. Also from the WRC, thanks to Mrs Lani van Vuuren for sharing all her experience in science writing
and journalism and for making this project much easier, having written the book on South Africa’s large dams.
The reference group of this project guided the research and contents throughout the project. What I envisaged initially differed from what is published here, and it is their guidance that redirected me to the critical aspects covered in this book. Thanks to Prof Kevin Wall (University of Pretoria), Prof Johann Tempelhoff (North West University), Mr Jude Cobbing (Independent Hydrogeologist), Mrs Lani van Vuuren (Water Research Commission), Mrs Elanda Schaeffer (SEFSA), Mr James Boale (City of Tshwane), Mr Arne Singels (City of Cape Town) and Mrs Nomvula Mofokane (City of Johannesburg) for your input, comments, edits and peer review of this publication.
I want to express a special word of thanks to Mrs Nomvula Mofokane for all her contributions in the form of data, information
and access. It is not always easy to be the mediator between the public and the municipality and I believe you’ve done an exceptional job in supplying me with valuable information.
To Mr Joe Moreira, owner of the valuable Facebook groups Lost Johannesburg and Lost Pretoria – thank you for advocating our projects so openly on your sites and for granting permission to use graphics from the sites. It is not
Acknowledgements
Matthys Dippenaar
6 | Hydrological Heritage Overview: Johannesburg
Acknowledgements
always easy finding archive footage; your input is highly appreciated.
To my colleague and friend, Gerrit Burger of Rockhouse Productions: thank you very much for the amazing photographic and video footage. We spent many days on the road, driving on dirt roads, running around in the rain, and walking up mountains and down rivers. I could not possibly ask for a better filmmaker or photographer to convey the message in such a visually appealing manner.
To Lizelle Olivier from Clear-creative, thank you as well for the motion graphics used in the film and for the bulk of the still graphics used in the book. Your capability of making history modern and making science interesting is a significant contribution in itself.
To Ingrid Booysens and the GIS team at the University of Pretoria, who compiled the bulk of the maps used: my sincere gratitude for your assistance in this regard. A picture does indeed say a thousand words and without all the maps, context would have been lost.
To Nthabiseng Nooe, doing her masters dissertation on this project, thank you for your accompaniment, as well as your assistance with research and management of the project administration.
Thank you to Drinie van Rensburg who first did the layout of the Pretoria book, which served as inspiration for this one. Your work is exceptional and I thank you for conveying the message so perfectly. To Elke Momberg, for doing the layout of this book, it is
truly remarkable to see the story come to life so beautifuly.
Finally, to the people who had to bear with me through this project – notably my colleagues Louis van Rooy and Brendon Jones, and my family Tharina and Femke – I cannot thank you enough. Your support and help in this regard are greatly appreciated!
Although this product supplies a glimpse into a much longer story, it is difficult to mention every aspect of Johannesburg’s water heritage. The purpose of this booklet is to become aware of water supply, and therefore a lot of content is omitted or toned down. I nonetheless trust that an understanding of the water supply of Johannesburg throughout the past will be insightful to some but hopefully motivational for most.

Hydrological Heritage Overview: Johannesburg | 7
If a dedication as prequel ever had ground, this is it: to the people of Johannesburg, who are worth more than gold; and to the precious water required for humanity’s survival and prosperity, also worth more than gold. The story of Johannesburg is not about gold. It is a narrative of humanity’s growth and the quest for clean water.
Johannesburg: City of Gold
Throughout history people have been clustering together, building communities progressively increasing in size. We are herd animals, easing our lives into a collective effort for sustenance, security and recreation until we eventually become co-dependent on each other.
These nodes around which we cluster are generally governed initially by security in times of conflict, accessibility to transport routes, or by the availability of natural resources such as food, water, minerals with economical
value or agricultural soil. But as the population increases, the pressures on these natural resources also increase.
People so easily complain about issues related to the supply of energy, water, fresh produce and other consumables. Yet we easily forget that, in mega-cities and metropolises, the local supplies are significantly outweighed by the need of an overindulgent society. Energy is no longer a privilege but a comfort that we are willing to pay dearly for while complaining about it on social media (and we miss the irony of the energy requirements for the manufacturing and maintenance of electronic devices). Water is no longer for sustenance, but an apparently abundant resource available for private swimming pools and excessive landscaping.
As we improve our living standards to that of a booming city, we use, abuse and misuse more of Nature. It is very interesting then,
too, that our mineral dependence is hosted in the same Rand that christened our currency and gave birth to our heritage of pollution.
In the case of large cities, such as Johannesburg, a remarkable story awaits telling on how water is imported from different catchments for supply to South Africa’s economic powerhouse. In many instances, this water is stored in a variety of dams and pumped for treatment and reticulation from other provinces and even other countries, such as Lesotho. Albeit the significant minority, these water supply systems often act as pumped storage schemes where, in times of peak electricity usage, they supply energy to the national grid, which includes the province of Gauteng.
Urbanisation is not intrinsically bad. Nor is industrialisation. Despite significant pressure on the natural environment, urbanisation and industrialisation generate economy and currency, and are required for growth and a progressive society.
Chapter 1: Introduction
“’But what’s worth more than gold?’ ‘Practically everything. You, for example. Your weight in gold is not very much gold at all. Aren’t you worth more than that?’ ” – Terry Pratchett, Making Money.
8 | Hydrological Heritage Overview: Johannesburg
Chapter 1
Rapid urbanisation in the Gauteng area established South Africa as a major roleplayer in the African economy, resulted in the measure of foreign currency in a universal gold standard, and made South Africa a leader in the exploitation of precious and rare metals.
We have all heard that South Africa is water-scarce and mineral-rich. This is somewhat paradoxical given that extraction of our vast geological riches is dependent on water and can also easily affect both the availability and quality of water adversely. Mining with limited water while considering the protection of scarce water resources have, in South Africa, almost become an art in combining
sustainable use, mitigation against pollution, and remediation following mine closure.
Johannesburg wasn’t initially selected to become South Africa’s biggest city. Pretoria was established a few decades before and the discovery of gold in such close proximity to Pretoria’s vast freshwater supply from springs was almost serendipity. With the discovery of gold in the Witwatersrand, South Africa’s powerhouse was born and has since grown to a world-class metropolis with more than ten million inhabitants.
We so easily obscure the rich history of and the need for mining, water transfer schemes and power
generation by their respective adverse effects, but sadly no progressive society or development exists without some compromise to the environment. As a species, our strength lies in our ability to scientifically mitigate adverse effects and to engineer solutions. The evolution of mankind, Homo sapiens, taught us that thought and reason are our strengths. But it is also our weakness as compromise becomes inevitable.
Yet, in these possible strengths of thought and reason, lies our ability to live in harmony with Nature and to appreciate our most fundamental need: water.
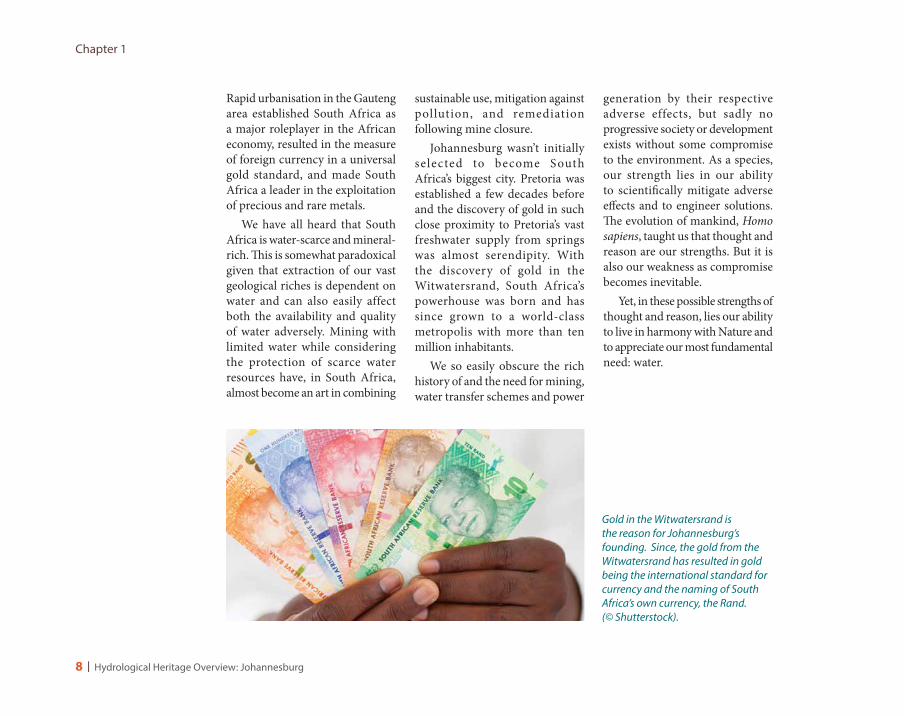
Gold in the Witwatersrand is the reason for Johannesburg’s founding. Since, the gold from the Witwatersrand has resulted in gold being the international standard for currency and the naming of South Africa’s own currency, the Rand.(© Shutterstock).

Hydrological Heritage Overview: Johannesburg | 9
the hydrological heritage overview Project
How does one communicate science without compromising popular thought? We are so often faced with scientific and industrial horror stories in the mass and social media that we often think of science as the intrinsic evil. What pollutes our water? What compromises the integrity of our environment? Mining and industry, everybody shouts in unison. But these also govern our financial prosperity and have an important role to play in South Africa’s economy.
So how does one communicate this f ine balance between socioeconomic development and environmental protection? The term sustainability aims to integrate these into a cohesive management policy, but is it truly enforceable without proper knowledge at all spheres of involvement?
C ommunicat ing sc ience neutrally and informally is becoming increasingly important as the mass media and social media make every citizen (rightfully so!) a sceptic or a critic. But, through this, the language of communication requires standardisation.
The Hydrological Heritage Overview series of projects aims to improve citizen science and the public’s appreciation of water in South Africa. Initiated through the case of South Africa’s capital, Pretoria in the City of Tshwane Municipality (Dippenaar 2013), the project continues with the metros of Johannesburg and Cape Town.
The selection of Johannesburg specifically addresses issues related to water supply in densely populated areas where commercial and industrial needs significantly increase the water demand. Coupled with the location at the upper reaches of the Vaal River catchment, supply to Johannesburg is dependent on water imports from other downstream catchments, as well as the treatment of this water to potable standards.
The broad theme for the Johannesburg product is The Quest for Clean Water. Given the history of Johannesburg with the frequently publicised issues related to acid mine drainage (AMD), the Johannesburg project supplies a perfect platform to address matters related to contamination of water.Furthermore, being situated at the upper reaches of the Vaal
Catchment, surface water is limited, and the need for water transfer schemes and water boards in supplying adequate water for the large population becomes clear.
Urbanisation, incorporating industry, commerce and dense development, influence both the quantity and quality of water in these areas. Land use planning or zoning therefore requires pre-emptive solutions to anticipated adverse outcomes. The vast array of these in urban areas include mining, agriculture, fuel storage, sanitation and sewage, burial practices and waste disposal, to name a few. Coupled with this is the obvious increase in per capita water use, treatment to drinking water standards and protection of the remaining biodiversity.
The H2O logo depicts a green urban setting encapsulated in water: urbanisation with a water-sensitive outlook, urban development and water supply, and sensitivity towards the environment (© Clearcreative).

10 | Hydrological Heritage Overview: Johannesburg
Chapter 1
Urban landscape
The City of Johannesburg Municipality houses more than four million people. Now including all those municipalities developed historically as part of the gold rush (such as Ekurhuleni and the West Rand), it is South Africa’s densest populated city, with a population of more than 12 million people. The skyline is characteristic with its skyscrapers where the money machine of South Africa is situated. Trees in the city were mostly planted during its development and now flourish in residential suburbs. Recent efforts to revitalise the central business district (CBD) through, for instance, the Maboneng Precinct housing, restaurants and shops, aim to make the inner city accessible as a tourist attraction once more.
© Gerrit Burger © Gerrit Burger

Hydrological Heritage Overview: Johannesburg | 11
Water demands of the City of Johannesburg
The water demand for the City of Johannesburg (with roughly 4.5 million people and excluding other municipalities such as Ekurhuleni), amount to 580 billion (580 000 million) litres per year (± 1 600 million litres per day). At present, the City of Johannesburg is actively pursuing alternative water supply options. Three main options are under consideration, namely rainwater harvesting (collection of rainwater), effluent reuse following treatment of wastewater, and groundwater for certain uses.
Shown in million litres per day, the average daily water supply for the City of Johannesburg for 2014 amounted to roughly 1 600 million litres
per day. Six regions are supplied by the City of Johannesburg, namely Johannesburg Central, Soweto, Sandton, Roodepoort/Diepsloot, Midrand,
and Deep South. The pie chart shows the approximate 2014 supplies to each of these regions, making up the total daily supply. Water is sourced
from various supplies and excludes other municipalities. (Data courtesy of the City of Johannesburg)
million litres per day by region
Joburg Central
Soweto
Sandton
Roodepoort/Diepsloot
Midrand
Deep South
518
357272
196
100154
The actual annual (yearly) water demand for each of the six regions for the past 25 years show a distinct increase in local and combined water demands. Note how some regions’ supply remained fairly constant (e.g. Soweto and Sandton), whereas others increased significantly (e.g. Roodepoort/ Diepsloot and Deep South). All volumes are in million kilolitres (billion litres) per year. The bottom axis shows 25 years, starting at 1990 on the left until present (2015) on the right. Note how overall water usage has almost doubled in the past 25 years. (Data courtesy of the City of Johannesburg)
Supply data 1991–2015 in billion litres per year
Cum
ulat
ive
supp
ly p
er re
gion
(m
illio
n ki
lolit
res
per y
ear)
600
500
400
300
200
100
0 1 2 3 4 5 6 7 8 9 10 11 12 13 14 15 16 17 18 19 20 21 22 23 24 25
Joburg Central Soweto Sandton
Roodepoort/Diepsloot Midrand Deep South
12 | Hydrological Heritage Overview: Johannesburg
Chapter 1
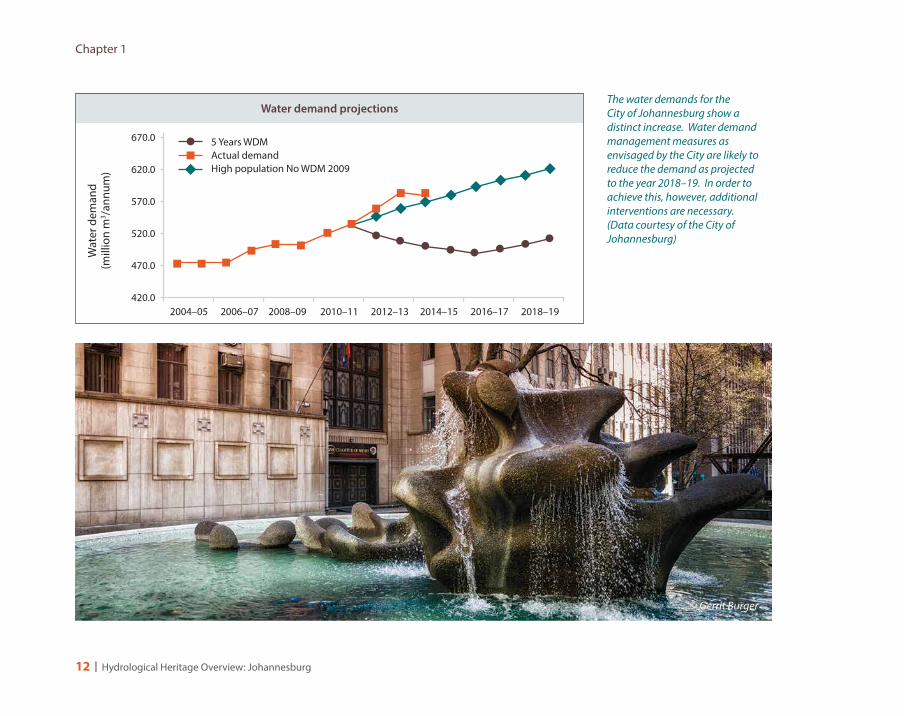
The water demands for the City of Johannesburg show a distinct increase. Water demand management measures as envisaged by the City are likely to reduce the demand as projected to the year 2018–19. In order to achieve this, however, additional interventions are necessary. (Data courtesy of the City of Johannesburg)
Water demand projectionsW
ater
dem
and
(mill
ion
m3 /a
nnum
)
670.0
620.0
570.0
520.0
470.0
420.0 2004–05 2006–07 2008–09 2010–11 2012–13 2014–15 2016–17 2018–19
5 Years WDMActual demandHigh population No WDM 2009
© Gerrit Burger

Hydrological Heritage Overview: Johannesburg | 13
Everything around us started in a single moment of time. The Big Bang signalled the start of the formation of the Universe, granting opportunity for the development of space, the Earth, its resources, water, and the diversification of life.
Geology governs our daily life. We build structures on rock and soil, and use both of these as construction materials. We are subjected to geological hazards in the form of earthquakes, volcanoes, slope failures and subsidence. Mineral and energy resources dictate our economic prosperity. Soil that forms from weathered rock gives us fertile soils and groundwater is stored in void spaces and fissures in soil and rock below the land surface. The role of geology, often neglected, is vital in our daily lives.
Hydrogeologists study the occurrence and movement of water in the subsurface. Boreholes tap water from rock or soil well below the land surface, supplying this precious resource to numerous communities, towns and cities worldwide. The thorough understanding of how the Earth’s crust behaves is therefore very important in understanding how much water is available at a given location, as well as to ensure its good quality.
“Alice: How long is forever? White Rabbit: Sometimes, just one second.”– Lewis Carroll, Alice in Wonderland
Chapter 2: A glimpse through time: Ancient history
15 000 000 000 Universe Formed
13 700 000 000 BIG BANG
10 000 000 000 Hydrogen diversifying to other elements and initial compounds
4 670 000 000 Earth Formed
3 500 000 000 Free Water on Earth
3 340 000 000 Johannesburg Dome Granite
2 900 000 000 Witwatersrand Supergroup
2 600 000 000 Black Reef Formation: Chuniespoort Group
2 224 000 000 Pretoria Group
2 020 000 000 Vredefort Meteorite Impact
2 000 000 000 Diabase Dykes
1 310 000 000 Syenite Dykes
245 000 000 Karoo Supergroup
140 000 000 Gondwanaland Break-up
3 300 000 Sterkfontein Caves Drain
3 000 000 A. Africanus to H. Habilus
1 000 000 H. Erectus to H. Sapiens
250 000 H. Sapiens Sapiens
today Present Day
Timeline, shown in years before the present day, depicting ancient events which shaped the planet in the vicinity of Johannesburg, from the formation of the Universe to the present (© Clearcreative).

14 | Hydrological Heritage Overview: Johannesburg
the origin of Water on earth
The origin of water, as that of the liveable planet Earth and life itself, is so fascinating scientifically that it is often inexplicable and results – to this day – in disagreement. However, science is the how-to manual of Nature, and its methods are not always understood. Much like a recipe, scientists eventually unravel the story through trial and error, glimpsing into all the intricacies, and eventually mastering the knowledge of a certain unknown concept.
The Universe, according to science, likely started as a compact volume around 15 billion years ago. Although not addressing the origin of this compact state, the expanding Universe is often used as motivation for this theory as this is measurable in present days.
At some stage, this matter of the initial Universe exploded in what is now referred to as the Big Bang, followed by, in less than a second, the formation of a Universe of radiation, matter and antimatter. Very rapid cooling to tens of millions degrees Kelvin followed (where one degree Kelvin equals
298 degrees Celsius and is known as absolute zero). This was coupled with rapid expansion of this fiery initial Universe.
As the temperature continued to drop, it is believed that all matter and antimatter particles were annihi lated, forming electromagnetic radiation in the form of energetic gamma-ray photons. Somehow, during all of this, protons and electrons managed to survive.
Roughly one hundred thousand years passed during which the temperature dropped yet further and single protons and electrons combined to form hydrogen (in what is termed the Recombination Period). Hydrogen, containing one each proton and electron, is therefore the first element on the periodic table and the first to have formed following the Big Bang.
Over time, some of these hydrogen nuclei fused (through nuclear fusion) into rare heavy isotopes of deuterium (one proton and one neutron) and tritium (one proton and two neutrons), both of which are still detected today. Eventually helium (two protons and two neutrons) formed.
The Universe was still young as expansion and cooling slowed down. Hydrogen and some helium collected in denser clusters to form initial galaxies. Gravitational attraction between and within these galaxies, coupled with centrifugal rotation and magnetic fields, eventually resulted in the formation of the first stars, of which the Sun is likely one of the smaller and younger.
Deep within such massive stars, hydrogen is eventually depleted due to the nuclear reactions (contrary to popular belief, the Sun, for instance, does not burn under chemical oxidation reactions, but shines due to nuclear fusion reactions). Eventually with hydrogen depleted, helium nuclei (called alpha-particles) become abundant and fuse through triple-action reactions to form carbon (with six protons and six neutrons). Further reactions add another alpha-particle at each stage to form oxygen (eight each protons and neutrons) and so forth.
Over time, more elements were formed, and elements combined into compounds, most of which still exist today. Some of the most common initial compounds
Chapter 2
Hydrological Heritage Overview: Johannesburg | 15
included, for instance, hydrogen (H2), water (H2O), methane (CH4), ammonia (NH3) and more complex organic alcohols and ethers. Many scientists also describe these very early organic molecules as being the first potential building blocks for later life, as all life on Earth is essentially carbon-based.
As molecules coalesced, planets eventually formed, one of which is home to mankind: Earth. To this day, Earth is seen as a fertile woman or mother, with the name of the Greek goddess Gaia echoed as the prefix geo in geology and geography, and the name of the planet used colloquially to refer to fertile soil. In this context, Earth is the name of our planet, like the others in the Universe, and deserves capitalisation.
Formed roughly 4.6 billion years ago, Earth was initially still very hot and any hope of an atmosphere was burnt away by solar radiation. As with other planets, Earth was still heavily bombarded by meteorites, many possibly containing water. Comets also, for instance, are often dust covered by ice or water, these forming the characteristic comas or tails. But, according to scientific agreement, it seems unlikely that
meteorites and comets alone could supply Earth’s 1.35 billion billion tons of water.
Initial minerals forming the proto-Earth (early-Earth) may also have contained frozen water or hydrated minerals. Whatever the source or reason for its enrichment, water still makes up a very small percentage of the total planet, and that initial water is in any case believed to have been lost or recycled into the Earth ages ago.
As Earth segregated into its iron core, mantle and lithosphere, readily vapourised gases such as water degassed together with volcanic eruptions. Being a very effective greenhouse gas, water aided in heating Earth’s surface and the lower atmosphere, resulting in increased humidity. As the humidity reached saturation, water condensed in the form of rain. The cycle likely continued with volcanoes releasing more water vapour until – as long as three billion years ago – water was available to deposit sediments to form sedimentary rocks.
Whereas Mars was too cold to maintain global warming through trapping greenhouse gases, Venus was too warm and solar radiation
broke water molecules apart. From the first moments of the Universe, water was already part of the design of Earth. And until today, it is still the most important molecule, without which no organism can sustain life.
a long and intricate Geological history
When thinking about Johannes-burg and geology, the first to come to mind is very likely gold and the associated mining activities. Although gold was the reason for Johannesburg’s founding, its place in the geological history is often overlooked.
An early Earth was very likely hot and molten. However, over time since the formation of the planet around 4.6 billion years ago, a solid crust eventually formed through the first crystallisation of molten rock into igneous rocks. Thus the first solid land surface was formed, although still water-deprived, uninhabitable and heated far above present-day climate due to the absence of an atmosphere.
The first solid crust in the area now comprising bulk of the eastern portions of South Africa is referred
“What is harder than rock, or softer than water? Yet soft water hollows out hard rock. Persevere.”– Ovid (Publius Ovidius Naso)

16 | Hydrological Heritage Overview: Johannesburg
Chapter 2
to as the Kaapvaal Craton, with the term craton referring to that first rock basement on the Earth surface. Cratons refer to portions of the Earth’s crust which have reached a stage of stability, as opposed to mobile belts which is still susceptible to plate tectonics, or the motion of oceanic and continental crust relative to each other.
The Kaapvaal Craton hosts large outcrops of pristine rocks formed 3 100 billion years ago and comprises granitic gneisses with remnants of greenstone belts. It extends over a vast area, with Upington and Tshane in Botswana being near the western border, Polokwane in the north, Swaziland in the east, and from Richards Bay transecting Lesotho in the south. In Johannesburg specifically, this is represented by the Johannesburg Dome Granite.
A variety of granites formed through crystallisation of magma, coupled with metamorphic rocks referred to as greenstones due to vast temperature and pressure changes.
A planet such as Earth is subject to stages of development. In terms of its composition (or its mineralogy), three major stages are distinguished:1. Older than 4.55 billion years
represents the era of planetary accretion or ‘planet-building’
2. Until roughly 2.5 billion years is the crustal and mantle reworking where igneous and sedimentary deposits form
3. Until present as the era of bio-mediated mineralogy where the atmosphere contains free oxygen and biological processes diversify.It is within context of these
that we can see the formation of the planet after the Big Bang, the crystallisation of magmas and deposits of old sedimentary rocks to form stable cratons, and since the deposit of those rocks in an oxygen-rich environment. These have very specific formation conditions, resulting in different rock types of different ages and properties.
As the planet cooled down after formation, the first rocks to form were igneous from crystallisation (or freezing) of magma. These first rocks were later weathered and eroded, or metamorphosed, giving rise to sedimentary and metamorphic rocks. Sometimes rocks get buried very deep and melt again to form magma, or they are moved as sediment, progressively enriched by organic materials or mineralised water, to form fertile soils or pedocretes. The rock cycle is an active cycle, continuously – albeit very slow, over millions to billions of years – altering the crust of the Earth.
A
M
IGNEOUS ROCK
M
W
METAMORPHIC SOIL
SEDIMENT (TRANSPORTED)
L
SEDIMENTARY ROCK
D E
PEDOGENIC MATERIALS
P P
RESIDUAL SOIL
C
MAGMASubs
urfa
ce p
roce
sses
Su
rfac
e pr
oces
ses
MW
C
DW
E L
M
A
Crystalisation
Weathering
Mass Wasting
Erosion
Deposition
Pedogenesis
Lithification
Metamorphism
AnatexisPMW

Hydrological Heritage Overview: Johannesburg | 17
As geologists, we define rock types typically based on its formation (or origin) and its composition. The prior, formation, governs whether rocks formed from the cooling of lava or magma as volcanic or plutonic igneous rocks. Or were they formed through the erosion and deposition of fine soil and sediment by rivers, wind or ice? Did they precipitate out from watery solutions, or did they form – like coal – from buried peat? At later stages, did overburden pressure, plate tectonics or elevated temperatures changes the rock into a metamorphic rock?
The origin also influences specific structures and textures in rock, such as the very thin layers (called laminations) in shale or slate, bedding and crossbeds in sandstones, or the polished waviness (called schistosity) in schists.
Albeit very oversimplified, origin or formation tells us the story of the rock, such as a biography will inform you of the person you are meeting.
The composition becomes another important aspect as it relates to the building blocks of rocks. The simile has been used to relate rocks to text where letters are elements, words are compounds
and sentences become minerals. Sentences finally are grouped together coherently, not randomly and not without a very specific set of rules, to make up paragraphs that are rocks.
Minerals (in geology) are intrinsically solid, inorganic and crystalline. In some instances, such as volcanic eruptions, lava cools so rapidly that it fails to become quite solid and organised. These compounds then form glasses, such as volcanic glass, pumice or the well-known gemstone obsidian.
When crystallised, we see minerals in very characteristic arrangements. Recall snowflakes – a beautiful hexagonal (six-sided) asterisk where water molecules arrange themselves very geometrically in a fixed pattern. Although each snowflake may look different, the six-sided structure is intrinsic in the mineral phase of water we see in snow or in polar ice. Another common hexagonal crystal is seen in the mineral quartz: essentially a six-sided prism with pyramidal ends terminating in a single point.
Minerals are then grouped together based on the manner in which they form to form characteristic rock types.
The geometric beauty in nature is shown in quartz crystals grown in a tight honeycomb pattern of hexagonal prisms. As with water, the crystals are characteristically six-sided due to arrangement of the silicon dioxide (SiO2) making up this stable mineral. The abundance of quartz and the strong resistance of the molecule to chemical weathering give cause for beach sands being essentially this mineral. Practically all else fails to survive the long erosion process from the inland, ending up as contributions to the oceans’ salt content. As one of the most abundant elements on the crust of the earth, few people realise the uniqueness of the element silicon and the mineral quartz. Bottom: The mineral pyrite – commonly associated with gold, and often in the past visually mistaken for gold given its dull golden colour – is characteristically cubic, meaning it has six square sides at right angles. It therefore resembles the shape of a square box or a die. Made up of iron sulphide (FeS2), this beautiful mineral is the cause of acid mine drainage (AMD).
18 | Hydrological Heritage Overview: Johannesburg
Chapter 2
Johannesburg is home to almost all major rock groups. The first rocks comprise ancient greenstones contained in different types of granite of the Johannesburg Dome. Almost three-and-a-half billion years in age, this enormous granite underlies bulk of the northern suburbs and Midrand, resulting in the very characteristic gently rolling topography one sees when driving on the N1 between Brakfontein and Buccleugh.
Under its own weight and due to tectonic processes, the granites subsided somewhat, creating a large inland sea. This sea, under different tidal and river flow conditions, deposited pebbles when water
moved fast and clays when water was almost stationary. This succession was named Witwatersrand (meaning ‘Ridge of White Water’) due to springs and waterfalls from these rocks prior to development. The terms have since also been used to distinguish between the geologically distinct West Rand and Central Rand, and to name the official currency of South Africa after the place of discovery of gold. Rock types include mudrocks and shales forming from fine clayey deposits, sandstones from sandy sediments, and conglomerates from stream pebbles.
Shortly after, the solid crust rup-tured, resulting in lava outflow onto
land surface in a distinct volcanic event. These volcanoes formed what is called the Ventersdorp Lava, named after the proximate town where a distinct exposure was first noted.
History repeated itself, and the land surface once again subsided, forming a very large, shallow inland sea. Water was practically stationary in the central portions and rocks were formed through precipitation of calcium and magnesium dissolved in the water around algae colonies. With the growth of these algae – cyanobacteria as the earliest life forms on the planet – carbon dioxide was used to form the mineral dolomite and oxygen was released through the photosynthesis process, eventually resulting in our oxygenated atmosphere. What remains are the dolomites and cherts of the Chuniespoort Group, often still exhibiting the characteristic conical shape of the algae colonies.
Following deposition of the Chuniespoort Group, the Pretoria Group sediments formed as conditions changed from the
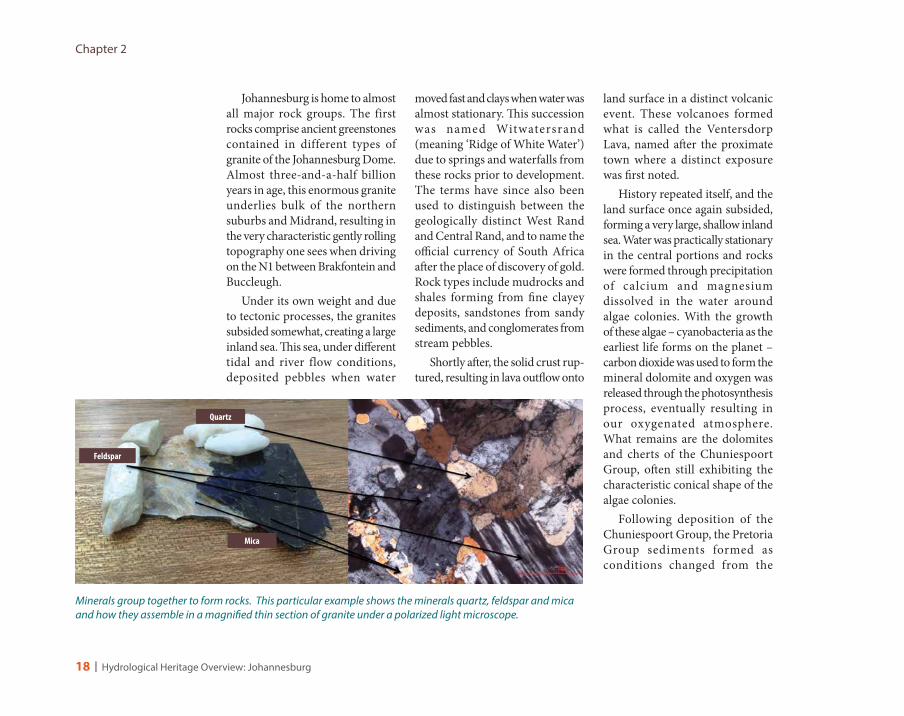
Minerals group together to form rocks. This particular example shows the minerals quartz, feldspar and mica and how they assemble in a magnified thin section of granite under a polarized light microscope.
Feldspar
Quartz
Mica

Hydrological Heritage Overview: Johannesburg | 19
large inland sea to rivers and eventually beach deposits now remnant as the Magaliesberg Mountains. A large magma pluton intruded as the Bushveld Igneous Complex, resulting in the Pretoria and Chuniespoort Groups (collectively known as the Transvaal Supergroup) tilting towards the north in the Gauteng region around 2 billion years ago.
Following the Bushveld event, significant fault systems acted as conduits for magma migrating up through the Earth’s crust. These post-Bushveld and pre-Pilanesberg diabase and syenite dykes crosscut the sedimentary and igneous rocks already deposited.
A long period of erosion followed, during which rocks were weathered and removed from the continent by wind and water action. By the time termed the Carboniferous Period (when Europe was covered by large forests around 345 million years ago), the Southern Hemisphere was in a period of extreme glaciation, with ice sheets covering the southern portions of Gondwanaland. With
the movement of the glaciers, rock below it was abraded and moved with the glaciers and eventually depositing till. The Dwyka Tillite Formation now forms the bottom part of the Karoo Supergroup and represents a time lapse of roughly 65 million years.
Climate reversed between the two hemispheres after deposition of the Dwyka Group Tillite and, as Gondwanaland started breaking apart, the climate gradually heated. Dinosaurs roamed around this period starting 280 million years ago and organic humus from vegetation was buried beneath sediment in swamps to form the Ecca Group sedimentary rocks. Also part of the Karoo Supergroup, the Ecca Group is renowned for its abundant fossils and, also notably, coal deposits formed from these humic swamp deposits.
Following the complete break-up of Gondwanaland, lava erupted from the remaining fissures forming the Drakensburg Formation Basalt of the Karoo Supergroup, named after the mountain of its most notable occurrence. The geology of Gauteng Province and, specifically, the City of
Johannesburg.

20 | Hydrological Heritage Overview: Johannesburg
Chapter 2
The cross-section shows the geology as one is driving from north near the Magaliesberg Mountains in Pretoria via Centurion, Midrand and Johannesburg southward. The section includes the rocks of the Pretoria Group, Chuniespoort Group, Johannesburg Dome, Witwatersrand Supergroup and Ventersdorp Supergroup.

Hydrological Heritage Overview: Johannesburg | 21
The stratigraphic succession refers to the sequence of geological events and rock formation throughout history. The youngest rocks are shown at the top, and age increases towards the bottom of the column. Ages are approximate with Ma denoting million years before present, and Ga billion years before present. The major lithologies (rock types) and stratigraphic units (deposition environments coupled with the age of the rocks) relevant to the Johannesburg region are shown, with notably the Pretoria Group and Karoo Supergroup being shown incompletely where it does not occur in the Johannesburg region. The right-hand side of the column shows the igneous intrusions forming the Johannesburg Dome and the younger diabase and syenite dykes.
Witwatersrand Ventersdorp Transvaal Karoo
SUPER-
GRO
UP
West Rand Central Rand Klipriviersberg Platberg Chu-niespoort
Pretoria
Ecca
GRO
UP
Hospital Hill
Govern-ment
Jeppes Town
Johannes-burg
Turf- fontein
East Driefontein Malmani
To the north of Johannesburg
Others
SUBG
ROU
P
Johannes- burg Dome
GraniteBonanza Afrikaner Marais-
burg Booysens Mondeor Westonaria Edenville Rietgat Allan-ridge Frisco Vryheid
FORM
ATION
Lanseria Gneiss Brixton Elands-
laagteRoode-poort
Krugers-dorp Elsburg Venters-
post Loraine Makwassie Bothaville Eccles
Linden Greiss Parktown Palmiet-
fontein Crown Luipaards-vlei Kimberley Jeannette Goed-
genoeg Lyttleton
Bryanston Granodiorite
Orange Grove Tusschenin Babrosco Rand-
fontein Orkney Kameel-doorns
Monte Christo
Honeydew Granodiorite Coronation Rietkuil Main Alberton Oaktree
Victory Park Granodiorite Promise Koedoes-
laagteBly-
vooruitzichtBlack Reef

22 | Hydrological Heritage Overview: Johannesburg
Greenstone
Remnants of greenstones occur scattered throughout the Johannesburg Dome, comprising amphibolites, gneisses and migmatites in the northern portions. Travelling southwards, greenstones occur more as ultramafic xenoliths comprising dunite, harzburgite, serpentinite and minor gabbro. Outcrops of these southern greenstones are noted in the Muldersdrift area and towards Edenvale. Greenstones pre-date the Johannesburg Dome and are very likely linked to those of the Barberton region.
Johannesburg dome
The Johannesburg Dome Granite, previously referred to as the Halfway House Granite, formed through a series of magmatic events. As opposed to lava flowing out onto the surface, magma crystallises slower in the subsurface, forming better developed mineral crystals and generally coarser-grained rocks. The initial events are represented by greenstones composed of mafic and ultramafic igneous rocks, as well as a full suite of tonalite-trondhjemite-granodiorite (TTG) rocks intruded into the greenstones.
The granitic rocks in the Johannesburg Dome were formed during Mesoarchean times and comprise five distinct varieties. The complete northern half of the dome is underlain by the trondhjemitic Lanseria Gneiss dated around 3340 Ma. The southern edge comprises hornblende-biotite-tonalitic gneiss (Linden Gneiss) dated at roughly 3 170 Ma.
Apart from these, three granodioritic phases are found in the south, namely the Bryanston Granodiorite (southeast), Honeydew Granodiorite (southwest) and Victory Park Granodiorite, all dated around 3 120 Ma.
Chapter 2
Vertical profiles of the Lanseria Gneiss appear distinctly different in Midrand (left) and Linbro Park (right). Weathering may be due to slightly different mineralogical compositions, but are likely more influenced by local climatic history. (© Matthys Dippenaar)

Hydrological Heritage Overview: Johannesburg | 23
Witwatersrand Supergroup
The Witwatersrand Supergroup comprises the West Rand and Central Rand Groups. The older West Rand Group is further subdivided into three subgroups with roughly equal amounts of sandstone and shale. Whereas the sandstones are mostly ascribed to shelf sand (shallow marine) deposits, the shales are iron-rich (ferruginised). Lesser diamictite and andesite lavas occur in some areas.
The Hospital Hill Subgroup forms the base of the West Rand Group and represents shallow-marine quartzites with lesser siltstones, shales and iron-formation. This subgroup was gradually graded through subtidal deposits as the ocean transgressed into fluvial (river) deposits in the upper formations where the shoreline migrated coupled with major transgressions of sea-level.
Overlying the Hospital Hill Subgroup, the Government Subgroup varies from very coarse conglomerates to iron-formation and diamictite. Rapid and multiple sea-level transgressions and
regressions resulted in alternating deposits of conglomerates (often pyritic) and shales in settings varying between marine, fluvial and braided plains.
Finally the Jeppestown Subgroup is composed of conglomerates to iron-formations through marine to fluvial brain-plain deposits. A single basaltic andesite lava flow occurs in the Crown Formation to a maximum thickness of 250 m.
The Central Rand Group overlies the West Rand Group and differs significantly where quartzite is more than 12 times more abundant than shale. The bulk of the Witwatersrand gold occurs in the Central Rand group within the Johannesburg and Turffontein Subgroups.
The older, Johannesburg Sub-group, mainly comprises quartzites deposited in fluvial braid-plain environments. These river systems represent changing flow conditions and lesser changing ocean levels, resulting in the different formations making up the succession. A single lava eruption is preserved as part of the Krugersdorp Formation, followed by some shales deposited as the Booysens Formation.
Overlying the Johannesburg Subgroup, the Turffontein Subgroup makes up the final deposits of the Witwatersrand Supergroup. Also formed mainly through river systems, conglomerates and quartzites and alluvial fan deposits are characteristic of the Turffontein Subgroup.
A hand specimen of the Witwatersrand conglomerate in which the gold occurs showing distinct quartz pebbles with a matrix metamorphosed to quartzite (top). The Witwatersrand quartzite does not contain pebbles, but often shows ripple marks, which is an indication of the flow direction of the old river systems (bottom). (© Matthys Dippenaar)

24 | Hydrological Heritage Overview: Johannesburg
Chapter 2
The exposed and covered Central Rand and West Rand Groups of the Witwatersrand Supergroup and the major gold fields (adapted from SACS 2006).

Hydrological Heritage Overview: Johannesburg | 25
Ventersdorp Supergroup
Following the Witwatersrand sedimen-tation, the Kaapvaal Craton ruptured due to intense uplift. Significant fracture systems developed from which basaltic magma erupted as lava outflows. Almost all the river systems of the Witwatersrand sedimentation were flooded by lava from 2 714 million years ago for a period of roughly 6 million years. The eventual lava deposit reached a maximum thickness of 2 km and is exposed through the formations of the Klipriviersberg Group of the Ventersdorp Supergroup.
The younger part of the Ventersdorp Supergroup, namely the Platberg Group, followed the collision of the Kaapvaal Craton with the Zimbabwe Craton to the north. Both of these formed separately, coming into contact around 2 700 million years ago. With the collision, the Kaapvaal Craton fissured, resulting in renewed lava outflows on surface.
This also happened in a fairly short time (geologically speaking), with the so-called Limpopo Mobile Belt forming the highly deformed contact between the two cratons.
Probably one of the most important aspects of the Ventersdorp Supergroup is the basal (bottom) Venterspost Formation comprising some gold-bearing conglomerates. Gold fields exploiting the Venterspost Formation include, for instance, those around Klerksdorp, Carletonville and some in the West Rand.
transvaal Supergroup and Black Reef formation
The crust stabilised around 2 650 million years ago, after the Ventersdorp lava extrusion, followed by thermal subsidence where the Kaapvaal Craton subsided under its own weight to below the sea level. A large inland sea, called the Transvaal Basin, formed where the Black Reef Formation was deposited under initial high-energy conditions.
As the water level increased and water became more stationary, microorganisms – still in an oxygen-deprived atmosphere – flourished and secreted the mineral dolomite (CaMg(CO3)2) to form the rock dolomite of the same composition. These are still evident in some areas in the form of stromatolites, the dome-shaped relics of ancient algae colonies.
Silica (SiO2) also precipitated out in these inland sea environments, forming the mineral chert. The Chuniespoort Group is subdivided based on the chert content and presence of stromatolites.
As climate changed and the sea levels dropped, a marine system gradually became a fluvial system with the deposits of the Pretoria Group. Alternating sandstones (often metamorphosed to quartzites) and shales (often metamorphosed to slates) occur to the north of Centurion with limited exposure in the boundaries of the Johannesburg municipality.
The characteristic landscape of the Chuniespoort Dolomites is seen in this view towards the visitor’s centre for the Cradle of Humankind (left). Dolomite and calcite forming stalactites and stalagmites in the Sterkfontein caves depict the significant solution of dolomite in water and the precipitation of new minerals as the water evaporates (right). (© Matthys Dippenaar)

26 | Hydrological Heritage Overview: Johannesburg
diabase and Syenite
A long time period elapsed after deposition of the Pretoria Group. During this time, the Bushveld Igneous Complex intruded to the north of present-day Pretoria. This resulted in metamorphism of some of the Pretoria Group rocks, but, more notably, has likely resulted in significant intrusions into the older rocks now underlying Gauteng.
Dykes – magmatic bodies representing the conduits for deep magma to the land surface – formed following the crystallisation of the Bushveld and preceding the extrusion of the Pilanesberg Complex. Diabase and syenite crystallised, cross-cutting the granites and Transvaal Supergroup
rocks throughout the province. In the dolomite areas, these dykes form distinct dolomite compartments where underground water is often not in contact with each other; in the other rock types, it forms distinctly different soils and landforms.
Karoo Supergroup
After the diabase and syenite intrusions, an even longer time gap ensued for which the Kaapvaal Craton has very little remaining evidence. It was only around the Permian Era that the Ecca Group of the Karoo Supergroup was deposited. Significant climate change at this stage depicts conditions ranging from an Ice Age to severe greenhouse conditions
in a final desert stage as preserved in the glacier deposit tillite at the base, followed by mudrocks and sandstones.
landscape development and Surface drainage
At its characteristic position at the top of a water divide, surface water in the Johannesburg region is limited to small rivers and streams. This water divide separates the city into two catchments – the Jukskei River to the north and the Klip River to the south – with smaller tributaries feeding these drainage systems.
Johannesburg Water notes water quality issues in the Klip and Jukskei Catchments, notably due to nutrient enrichment from sewage
Chapter 2
The Jukskei River. (© Lani van Vuuren)

Hydrological Heritage Overview: Johannesburg | 27
Johannesburg is situated on the divides between the Senqu-Orange Basin and the Limpopo Basin. Whereas the prior drains along the Orange River to the Atlantic Ocean, the latter eventually enters the Indian Ocean by means of the Limpopo River.

28 | Hydrological Heritage Overview: Johannesburg
and salinisation due to urban runoff. Contamination emanates from water runoff on roads, urban areas and informal settlements adjacent to rivers and streams, and discharges from wastewater treatment works.
Most of the rivers are, at present, seriously to critically impaired. Key recommendations published by Johannesburg Water address impacts and mitigation measures for 16 sites. Although with slight variations, major impacts are described as removal of indigenous vegetation, encroachment of alien vegetation, erosion, barriers and weirs, bed and channel modification, sedimentation, and the numerous water quality impacts.
Mitigation and management measures are in place for these 16 sites, incorporating the Modder-fonteinspruit, Upper Jukskei, Crocodile, Upper Klip, Lower Klip, Natalspruit, Lower Jukskei, Rietspruit, Braamfonteinspruit, Sandspruit (Sandton), Sandspruit (Randburg), Klein Jukskei, Wilge, Pampoenspruit, Bloubosspruit and Klipspruit Rivers.
Notably in the instance of Johannesburg, significant volumes of water are imported from other catchments. Whereas Johannesburg itself falls mostly within the catchment of the Vaal River (draining towards the Orange River and eventually the Atlantic Ocean) and to some extent in that of the Crocodile River (draining towards the Limpopo River and eventually the Indian Ocean), the importation of water significantly alters the regional catchments’ water balances. Additional water is imported from the Senqu River (in Lesotho, draining to the Orange River and eventually the Atlantic Ocean) and the Tugela River (in Kwazulu-Natal, eventually draining towards the Indian Ocean).
Chapter 2
The City of Johannesburg has a number of wetlands in the form of dams, hillslope seeps, pans and valley bottoms. Wetlands are defined by the National Water Act as land that is transitional between aquatic and terrestrial, implying that it supplies habitat to plants requiring periodical to permanent waterlogging of the roots. Wetland delineation is becoming increasingly important as it regulates water quality between the subsurface and surface waters, promotes biodiversity, and supplies very specific habitats for certain species of fauna and flora.

Hydrological Heritage Overview: Johannesburg | 29
the Rise of man
The evolution of Man – humankind, Homo sapiens – in recent geological times is well preserved in the fossil record of Gauteng. Whereas the Karoo Supergroup sedimentary rocks preserve an abundance of fauna and flora, the Cradle of Humankind World Heritage Site at the Sterkfontein Caves hosts some very important early hominid fossils.
The Cretaceous-Tertiary extinction (ca. 65 million years ago) resulted in the extinction of dinosaurs, granting mammals the opportunity to diversify. Austalopithecus africanus first appeared in South Africa 3 million years ago, followed by the first species of the Homo genus appearing in East Africa half a million years later, around the time of primitive stone tools. Evidence of A. africanus was found in Sterkfontein caves in the form of a near complete adult cranium known as Mrs Ples. Its discoverer, Robert Broom, is memorised in a street named after him in Krugersdorp (Mogale City), the town named after the president of the then Zuid Afrikaansche Republiek (ZAR) at the turn of the nineteenth century.
Bone tools were used around 1.8 million years ago, around the time of Homo erectus. The genus Austalopithecus became extinct one million years ago, followed by the appearance of the first Homo sapiens 800 000 years ago and Homo sapies sapiens 200 000 years ago. A new hominoid species, Homo sebida, was more recently discovered in the same region.
The influence of Homo sapiens is becoming increasingly evident in the geological record. What would a large underground mine cavity look like 100 000 years from now? What would a geologist describe it as, given the significant disruptions in natural state? What would the implications be on how that geological information is interpreted and applied?
Many geologists debate that we are already in a new geological epoch. To incorporate the last few decades, the Anthropocene would follow on the Holocene, but include Man’s impact on the geological environment. These impacts should inherently be significant enough to be preserved in the geological record after millennia.
The A. africanus skull, affectionately known as “Mrs Ples”.

30 | Hydrological Heritage Overview: Johannesburg
Dependent on resources that formed billions of years ago, we – humankind – do not share the history of our world. We merely represent the last milliseconds in time if the Earth’s lifespan is compressed into one day. And yet, our impact is significant through resource exploitation, contributions to climate change and disruption of the Earth’s equilibrium.
Nonetheless, technological advance and development are necessary and, for Johannesburg, it starts with the discovery of a specific geological commodity – gold – formed an immensity of time ago but used internationally for the standard valuation of currency to this day.
“Geology gave us the immensity of time and taught us how little of it our own species has occupied.” – Steven Jay Gould, Ever Since Darwin: Reflections on Natural History.
Chapter 3: A glimpse through time: Recent history
Johannesburg Then and Now
THEN
NO
W

Hydrological Heritage Overview: Johannesburg | 31
Old imagery © Lost Johannesburg (Facebook) and individual authors.

32 | Hydrological Heritage Overview: Johannesburg
Chapter 3
discovery of Gold
Prior to the discovery of significant gold-bearing reefs in the Witwatersrand, the Zuid Afrikaansche Republiek (ZAR) was annexed by Britain in 1877. By this time Pretoria was already an established town near the well-known springs at Groenkloof, and the tensions between the ZAR and Britain have long been building. The First Anglo-Boer War ensued between 1880 and 1881 with Britain being defeated. However, Britain still retained some management and foreign laws of the ZAR. Cecil John Rhodes, Prime Minister of the Cape Colony, was already interested
in the diamonds at Kimberley and looking into prospects of gold mining in present-day Zimbabwe (previously Rhodesia, after his name), and the discovery of gold increased Europe’s ambition to colonise Africa and specifically the ZAR.
The history of Johannesburg itself, however, starts with the discovery of gold. At this stage Pretoria was expanding rapidly and the discovery of gold in such close proximity was almost serendipity.
PJ Marais, official gold seeker of the ZAR, discovered gold in the Johannesburg Region in 1853. Following this, gold discoveries quickly expanded to the Olifants River in present-day Mpumalanga, Lydenburg (now Mashishing) in 1869, the Letaba River in 1870, the farm Eersteling near Marabastad in 1871, Pilgrim’s Rest in 1873 and at Sheba Reef near Barberton in 1884.
December 1874 saw the discovery of gold at Blaauwbank near the town of Magaliesburg by an Australian digger named Henry Lewis. Given that gold haD already been discovered in the dolomitic rocks around Pilgrim’s Rest, the outcropping dolomites of the present-day Gauteng proved
to be a sensible starting point for exploration. Following this, January 1875 saw the founding of the Nil Desperandum Cooperative Quartz Company by Robert Green – the first gold-mining company in the Witwatersrand region. Gold production was, however, very low, resulting in the Blaauwbank goldfield being practical ly abandoned,
David Wardrop discovered gold at Zwartkop north of Krugersdorp in 1878, followed by Stephanus Minnaar’s discovery of gold at Kromdraai west of Zwartkop. With the rapid increases in discoveries, depopulation of the rural areas ensued coupled with population increase in the Witwatersrand area as fortune seekers and hopefuls migrated to become part of the gold rush. Between 1881 and 1884, a prospector named Jan Bantjes together with Minnaar sank a shaft near Kromdraai to the north of Krugersdorp (Mogale City), which was declared a public digging in 1885.
January 1884 saw the Struben brothers Fred and Harry prospecting around the northern slopes of the Witwatersrand, eventually discovering gold at Sterkfontein

Hydrological Heritage Overview: Johannesburg | 33
and at Confidence Reef near Roodepoort. Their first shaft was sunk near the Wilgespruit (Willow Stream) in 1884, and they also constructed the first crushing plant for the region in December 1885.
Jan Bantjes by this time had also abandoned Kromdraai, bringing with him some gold-bearing reef from Kromdraai. Bantjes and Struben in 1886 discovered gold from conglomerates at Vogelstruisfontein (meaning ‘ostrich fountain’) to the east of Roodepoort.
In the year 1885, George Harrison and George Walker arrived on the farm Wilgespruit. Walker left Wilgespruit early in 1886 to join Harrison who was in Langlaagte at the time, stumbling en route on a rock in the Jukskei River. From his preceding gold digging history in Australia, he inspected the rock in detail, discovering the first major gold in what is today referred to as the Main Reef. A long and busy road in the south of Johannesburg is called Main Reef Road to this day.
Discoveries soon expanded throughout the West Rand and East Rand to places such as Springs, Brakpan (meaning ‘brackish
pan’), Benoni, Krugersdorp and Randfontein (‘ridge fountain’).
the Gold Rush and the founding of Johannesburg
The rapid influx of prospectors, miners and foreigners 30 km south of Pretoria was not well appreciated by the then government. Johannes Meyer first attempted to bring order by requiring prospectors to peg out mine claims.
What is now Johannesburg was founded during 1886, when the ZAR appointing Minister of Mines, Christiaan Johannes Joubert, and Land Surveyor General, Johann Rissik, to locate a locality for a town for the thousands of fortune seekers in the Witwatersrand. Joubert and Rissik held a public gathering on the farm Turffontein to address the ZAR’s prospects for future gold diggings, followed by Commissioner Carl von Brandis reading President Paul Kruger’s declaration that the Witwatersrand is a public digging. A small triangular portion of land (uitvalgrond in Afrikaans) – Randjeslaagte – was selected between the farms of Braamfontein, Doornfontein and Turffontein and
named Johannesburg, possibly after Joubert and Rissik.
Randjeslaagte was originally owned by a syndicate ran by Julius Jeppe as it was unfit for mining, and proved to be well-positioned without compromising mining activities to develop as a town (specifically the present-day suburbs of Jeppestown and Fordburg). The town centre was laid out with wide streets intersecting each other perpendicularly. Market Street Square formed the centre, parallel to Commissioner Street, the latter separating government land and Marshall’s Town.
During the same year, private land including the farms Langlaagte, Randjeslaagte, Turffontein, Doorn-fontein, Elandsfontein, Driefontein, Roodepoort, Paardekraal and Vogelstruisfontein was declared public mining areas and was where opencast and surface mines developed.
The following year mining spread to the East Rand areas of present-day Germiston, Benoni and Nigel. The gold rush was further stimulated by the discovery of coal near Vereeniging and Boksburg which helped to meet the energy
34 | Hydrological Heritage Overview: Johannesburg
requirements for the mining operations. By 1885, South Africa was the world’s biggest single gold producer, contributing 27.5% to the global gold production.
Around 1890, the first deep mining commenced, increasing labour requirements and cost. This, coupled with the change with depth from banket to pyritic ore requiring enhanced mining and extraction processes, eventually had 44 of the smaller mining house bankrupt. The remaining mining houses merged into bigger companies known collectively as the Randlords. By 1893 there were ten such large
mine houses, including Rand Mines Ltd (Alfred Beit, Hermann Eckstein and Lionel Phillips), Consolidated Gold Fields of South Africa (Cecil John Rhodes), Johannesburg Consolidated Investment Company (Barney Barnato) and Anglo-French (George Farrar Group).
Coupled with the prosperity of gold mining in the region, poorer inhabitants were employed in the transport industry (prior to the extensive railway development) and brick making. However, the Transvaal gold shares became sought after in the international stock exchanges of London, Paris
and Berlin, resulting eventually in the gold standard being established in Britain. This gold standard was accepted shortly thereafter by the majority of the world’s biggest trading countries, placing London, the Bank of England and the British pound sterling centrally in international trade. Until this day, the monetary standard of any country’s currency is measured against a fixed amount of fine or pure gold, with one sterling pound equalling 113.0016 fine ounce pure gold at the end of the nineteenth century.
Chapter 3
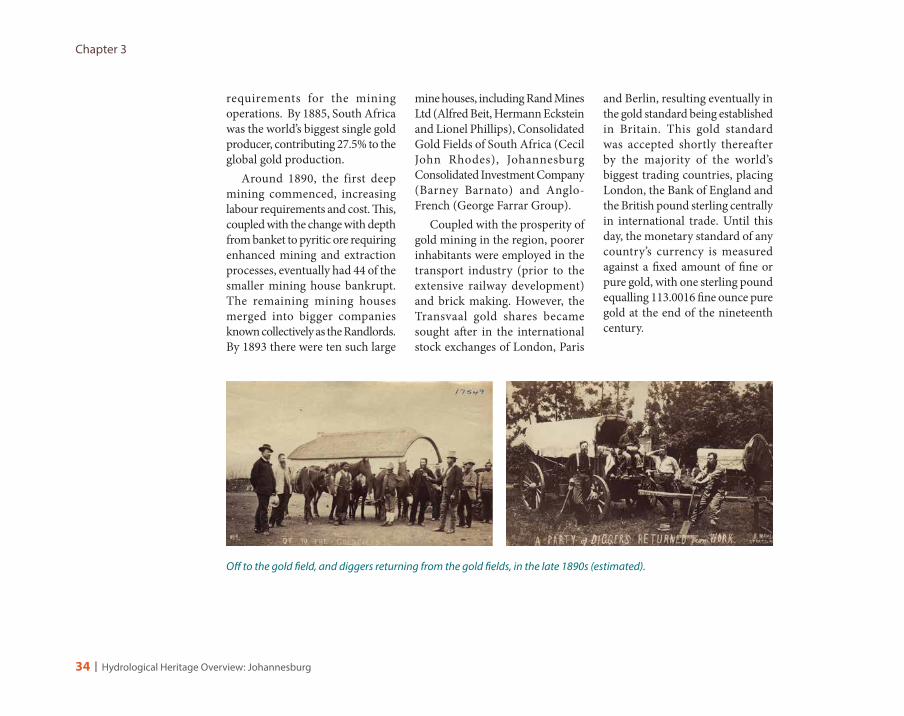
Off to the gold field, and diggers returning from the gold fields, in the late 1890s (estimated).

Hydrological Heritage Overview: Johannesburg | 35
Given continuous increased development, many small farms turned into large-scale commercial operations. Transport was improved, notably railways such as those connecting developed nodes such as Cape Town and Kimberley. Railways from then Delagoabaai (Maputo), Durban and Cape Town reached the Witwatersrand around the middle of the 1890s, and imports became cheaper as transport improved through the new railway systems.
Secondary industries were, at this stage in time, mostly granted to monopolies, notably the coal supplied
from the Witbank (eMalahleni) and Vereeniging coal fields. The first coal-fired electricity plant in the area was completed near Brakpan in 1897, contributing additional energy to the booming town.
The town continued to grow. Only ten years after it was founded its population exceeded 100 000 people. Johannesburg now included workers’ suburbs such as Fordsburg, Jeppe, Malvern, Mayfair, Vrededorp, Burgersdorp, Troyeville, Turffontein, Booysens and Langlaagte. Poorer suburbs of this era included Ferreirasdorp and Brickfields (Braamfontein).
The British Colonial Secretary, Sir John Chamberlain, appointed Sir Alfred Milner as High Commissioner of South Africa during May 1897. One year later Paul Kruger was elected President of the ZAR. His strong foreign citizen policies resulted in Chamberlain and Milner sending a petition to Queen Victoria in 1899.
On 11 October 1899, the South African War commenced and the ZAR surrendered on 31 May 1902. Both the ZAR and the Orange Free State were then incorporated as British colonies.
Historical photographs showing mining-related explosions at Johannesburg.

36 | Hydrological Heritage Overview: Johannesburg
Chapter 3
A glance at Johannesburg in 1897, compiled by B W Melville and printed by Grocott and Sherry Publishers. The population around this time was just over 10 000.

Hydrological Heritage Overview: Johannesburg | 37
after the war
Following the South African War, South Africa was under British rule. The year 1909 saw the founding of Crown Mines Limited through the merging of seven mining properties.
As mining expanded and the population grew, the need for more energy resulted in the establishment of a consortium known as the Victoria Falls and Transvaal Power Company (VFP), who established a plant at Vereeniging around 1912. The VPF later became Eskom, which still manages power generation in South Africa until this day.
At this time, upper class suburbs included Doornfontein, Ophirton, Yeoville, Houghton and Berea. Parktown was almost exclusively inhabited by the Randlonds, and apparently named in honour of the establishment of the first parks in the treeless dusty mining town.
History after the war followed a trajectory defined by gold mining prosperity. The Union of South Africa was declared on 31 May 1910 during which Pretoria was selected as the seat of government and administrative capital, and Cape Town as the legislative capital.
Johannesburg received its city status a few years later, in 1928. The Republic of South Africa was born in 1960, democratic elections followed in 1994, and, until this day, gold mining prevails as the reason for Johannesburg’s existence.
Now, in the twenty-first century, the population well exceeds 10 million in the commercial and industrial heart of South Africa. As water is imported, commodities and currency are exported from Johannesburg and the greater Gauteng Province, stimulating the economy of the whole of South Africa.
Gauteng is presently subdivided into a number of separate municipalities. Population of the greater Johannesburg region exceeds 10 million with 4.5 million residing within the City of Johannesburg itself. The City of Tshwane to the north has a significantly lower population, but houses Pretoria, the administrative capital of South Africa

38 | Hydrological Heritage Overview: Johannesburg
Gold is clearly a commodity with a very significant economic value. Water is often not perceived as such as it does not contribute directly to the economy. Nonetheless, water is a commodity like any other, with the fundamental difference being that it is a basic human need. Costing reflects this.
For Johannesburg, water indeed links us to our neighbours as water is sourced from numerous catchments and imported to the rapidly growing Gauteng Province. The world has marvelled at the scientific and engineering excellence that has gone into the development of Johannesburg’s water supply.
“Water links us to our neighbour in a way more profound and complex than any other.” – John Thorson, on receiving the 2008 Stockholm Water Prize for his “virtual water” concept.
Chapter 4: A matter of demand versus supply
Major rivers and streams in Johannesburg include the Jukskei River and the Klip River. These are shown in context of some of the major water schemes supplying water to the City of Johannesburg to this day.

Hydrological Heritage Overview: Johannesburg | 39
Johannesburg Water Supply at a Glance
The Thukela-Vaal Transfer Scheme supplies water to Rand Water from the Tugela River’s basin while the associated Drakensberg Pumped Storage Scheme contribute electricity to the national grid on behalf of Eskom. Rand Water supply is further augmented by water from the Lesotho Highlands Water Project. Here water from the upper reaches of the Senqu River in Lesotho’s Higlands are dammed, tunnelled to South Africa, and released to the Ash River. Water from both schemes eventually reach the Wilge and Vaal Rivers and the Vaal Dam itself.
A number of dams within South Africa and Lesotho supply water to Gauteng. Forming part of the Sterkfontein-Vaal, Usuthu-Vaal and Lesotho Highlands Schemes, water eventually reaches the Vaal Dam for treatment and distribution by Rand Water.
dam dam type
Wall maximum height (m)
Wall length (m)
Storage capacity (million m3)
Surface area at full supply (ha)
Vaal
Concrete gravity with earthfill right flank
63
518.6 (concrete);
1890 (earthfill)
2540 32300
Sterkfontein Earthfill 93 3060 2656 6937
Woodstock Earthfill 51 760 381 6700
driekloof Rockfill 46.6 500 35.6
Kilburn Earthfill 51 825 36
Grootdraai
Concrete gravity with earthfill flanks
42 2180 364 5500
heyshope Earthfill 26.5 1030 364 4500
Katse
Double-curvature concrete arch
185 710 1950 3600
mohaleConcrete-faced rockfill
145 700 938 2200
GautengProvince
PretoriaJohannesburg
Indian Ocean
DurbanLESOTHO
Vaal
Vaal Dam
Wilge
Tugela
Ash
Katse Dam
Orange
Caled
on
Senqu
LESOTHO HIGHLANDS WATER PROJECT
DRAKENSBERG PUMPED STORAGE SCHEME
Transfer & DeliveryTunnel Phase 1A

40 | Hydrological Heritage Overview: Johannesburg
Chapter 4
Johannesburg Water Supply at a Glance
1855 Pretoria founded
1880 First Anglo-Boer War
1886 Discovery of Gold in WWR
1886 Founding of Johannesburg
1886 Fordburgspruit; Natalspruit (Park Town Spring)
1887 Sievewright Concession
1889 Johannesburg Waterworks and Exploration Company
1889 Vierfontien’s Klip River Scheme at Olifantsvlei
1890 Deep mining commenced
1893 Braamfontein Water Company;Vierfontein Syndicate (established) 5.86 Ml/d)
1896 Weltevreden; Zuurbekom dolomite aquifer
1897 First coal-fired electricity plant (Brakpan)
1899 Second Anglo-Boer War
1899 Zuurbekom pump station
1903 Rand Water Board
1906 Rand Water supply (11 Ml/d)
1910 Unification of SA
1912 Victoria Falls Power Company
1914 Vaal River Development Scheme
1920 Rand Water supply (90 Ml/d)
1924 Vaal Barrage completed
1928 Johannesburg received city status
1928 Pretoria incorporated into Rand Water supply
1938 Vaal Dam completed (add 354 Ml/d)
1949 Zuikerbosch
1960s Vaal River Schemes(4100 Ml/d – complete Vaal; not just Rand Water)
1961 Republic of SA
1965–1970 Usuthu-Vaal scheme
1970–1971 Spioenkop and Sterkfontein Dams
1980 Sterkfontein Dam raised; Kilburn and Driekloof Dams
1981 Grootdraai Dam
1988 Heyshope Dam
1998 Katse and Mohale Dams; Phase 1 of Lesotho Scheme
2000 Johannesburg Water established, managing five Waste Water Treatment Works
2015 Phase 2 of Lesotho Scheme at tender stage
2015 Rand Water supply (3600 Ml/d)

Hydrological Heritage Overview: Johannesburg | 41
Water demand and supply curves for Rand Water over the lifespan of the water supply utility
Ml/d
5000
4500
4000
3500
3000
2500
2000
1500
1000
500
0
Source: Data courtesy of Rand Water
1905
1910
1915
1920
1925
1930
1935
1940
1945
1950
1955
1960
1965
1970
1975
1980
1985
1990
1995
2000
2005
2010
2015
Questionnaire
AIDS without DM
Most likely
AIDS with DM
19231936 1937 1945 1949
1950
1959
1965
1970
1980
ADDITIONAL WATER SUPPLY SCHEMES 1982
1992

42 | Hydrological Heritage Overview: Johannesburg
Johannesburg’s initial Water Supply
Following the euphoria after the discovery of gold on the Witwatersrand in 1886 came an increasing concern over water. In the early days of Johannesburg water was obtained from the Fordburgspruit as well as a spring at the eastern end of present-day Commissioner Street. A second spring forming the Natalspruit, was also used. This spring was located at the present Johannesburg General Hospital in Park Town.
The Sivewright Concession of 1887 was the first significant grant to a private company for water supply on the Witwatersrand. Sir James Sivewright headed the syndicate, utilising the Doornfontein springs and eventually established the Johannesburg Waterworks and Exploration Company Ltd. The company was eventually taken over by Barney Barnato in 1889 at which time it supplied roughly 6.8 million litres daily to the residents of Johannesburg. Around this time, it is said that water was so expensive that people cooked their food in soda water, given that it was cheaper.
Given that roughly 2 000 litres of water was required for processing of one ton of reef and that later extraction processes used cyanide to increase the yield of recoverable gold, water overuse and potential pollution increased rapidly. The need of water in the processing of ore grew the water demand to between 2.89 and 5.86 million litres per day by 1893, resulting in the establishment of small water supply companies such as the Braamfontein Water Company and the Vierfontein Syndicate. Whereas Braamfontein supplied some 0.6 million litres per day to the area around Parktown from two wells, Vierfontein supplied water both for mining purposes and for potable use. Vierfontein
developed the Klip River Valley’s first pumping station in 1889, pumping from Olifantsvlei Farm (near Turffontein). This new Klip River Scheme drained to the Vaal River and was later incorporated into the Johannesburg Waterworks and Exploration Company.
In the years leading up to 1896, another source was identified on the farm Weltevreden north of the Roodepoort mining operations, but also ended up being insufficient for the growing water demand. Additional groundwater was later obtained from the dolomite aquifers on the farm Zuurbekom where a pump station was erected in 1899, which is still in use today.
For the most of the late nine-teenth century, water supply was problematic. However, following the South African War, water supply to the town of Johannesburg metamorphosed through time. Directly following the war, the Johannesburg Waterworks and Exploration Company, the Braamfontein Company and the Vierfontein Syndicate supplied water from the Zuurbekom dolomite, Doornfontein springs (near Ellis Park stadium), springs in the Natalspruit, Berea and
Chapter 4
Barney Barnato

Hydrological Heritage Overview: Johannesburg | 43
Parktown, and the Klip River Valley Pumping Station.
As water demand escalated so did Johannesburg water-related infrastructure, with highlights being the establishment of the Rand Water Board in 1903, followed by a number of dams and water transfer schemes and later Johannesburg Water’s wastewater treatment works.
establishment of the Rand Water Board
Following the end of the South African War in 1902, the ruling British realised the need for investigation of water supply and sanitation services. On 8 May 1903, the Rand Water Board was established to supply water to the entire area (by the Rand Water Board Incorporation Ordinance No 32 of May 1903). The Rand Water Board comprised members of the Johannesburg Town Council, as well as the Chamber of Mines and other relevant authorities within the greater Witwatersrand region. One year later, in 1904, Rand Water took over all endeavours supplying or with capability of supplying water to the Witwatersrand, and in 1905 Rand Water commenced with full-fledged operation.
In 1906 the board supplied to an ever-growing demand of 11 million litres per day until, eventually, water restrictions came into effect while augmentation options of the supply commenced.
Severe droughts in the 1913s were cause for concern and Rand Water adopted the proposed Vaal River Development Scheme in 1914.
The growing capital city, Pretoria, was incorporated into the Rand Water Board’s supply in 1928, with a total of 90 million litres per day required from the board by 1920.
At present, Rand Water’s home-page cites it network including 3 056 km of large diameter pipeline moving water to 58 service reservoirs. The average daily supply just exceeds 3 600 million litres per day to metropolitan and local municipalities, mines and other industries.
damming the Vaal River
In the early 1910s and 1920s, the Vaal River Scheme, including the Barrage, supplied a total of 91 million litres of water per day. The decision to construct the barrage was made in terms of the
The Vaal Barrage, completed in 1928, was the first water storage infrastructure constructed for Rand Water.
© Lani van Vuuren
The original Vaal Dam overflowing shortly after its construction in 1938.
© DWS
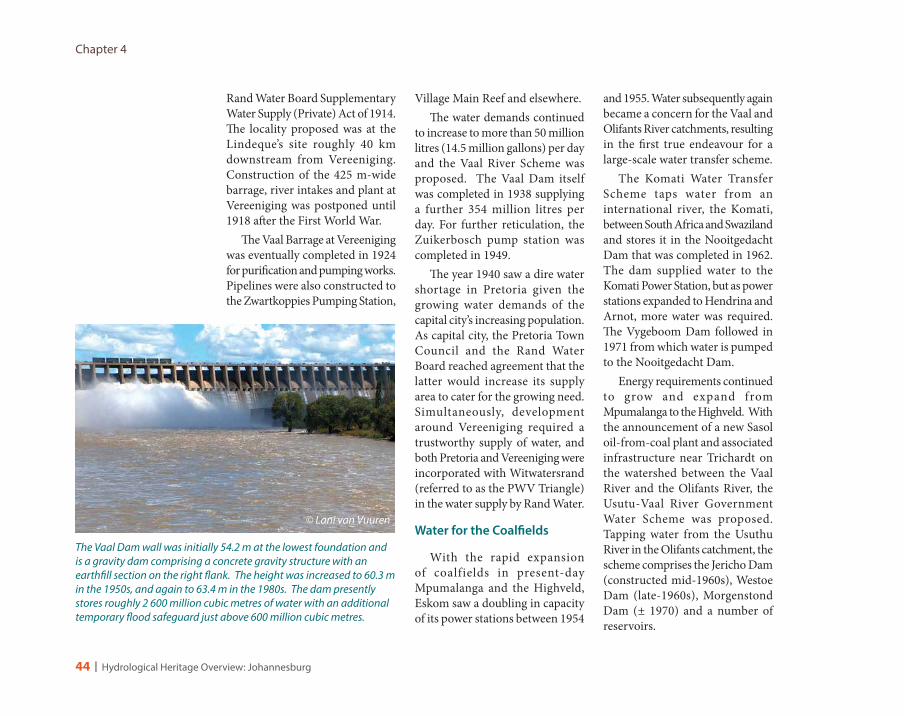
44 | Hydrological Heritage Overview: Johannesburg
Rand Water Board Supplementary Water Supply (Private) Act of 1914. The locality proposed was at the Lindeque’s site roughly 40 km downstream from Vereeniging. Construction of the 425 m-wide barrage, river intakes and plant at Vereeniging was postponed until 1918 after the First World War.
The Vaal Barrage at Vereeniging was eventually completed in 1924 for purification and pumping works. Pipelines were also constructed to the Zwartkoppies Pumping Station,
Village Main Reef and elsewhere.The water demands continued
to increase to more than 50 million litres (14.5 million gallons) per day and the Vaal River Scheme was proposed. The Vaal Dam itself was completed in 1938 supplying a further 354 million litres per day. For further reticulation, the Zuikerbosch pump station was completed in 1949.
The year 1940 saw a dire water shortage in Pretoria given the growing water demands of the capital city’s increasing population. As capital city, the Pretoria Town Council and the Rand Water Board reached agreement that the latter would increase its supply area to cater for the growing need. Simultaneously, development around Vereeniging required a trustworthy supply of water, and both Pretoria and Vereeniging were incorporated with Witwatersrand (referred to as the PWV Triangle) in the water supply by Rand Water.
Water for the Coalfields
With the rapid expansion of coalfields in present-day Mpumalanga and the Highveld, Eskom saw a doubling in capacity of its power stations between 1954
and 1955. Water subsequently again became a concern for the Vaal and Olifants River catchments, resulting in the first true endeavour for a large-scale water transfer scheme.
The Komati Water Transfer Scheme taps water from an international river, the Komati, between South Africa and Swaziland and stores it in the Nooitgedacht Dam that was completed in 1962. The dam supplied water to the Komati Power Station, but as power stations expanded to Hendrina and Arnot, more water was required. The Vygeboom Dam followed in 1971 from which water is pumped to the Nooitgedacht Dam.
Energy requirements continued to grow and expand from Mpumalanga to the Highveld. With the announcement of a new Sasol oil-from-coal plant and associated infrastructure near Trichardt on the watershed between the Vaal River and the Olifants River, the Usutu-Vaal River Government Water Scheme was proposed. Tapping water from the Usuthu River in the Olifants catchment, the scheme comprises the Jericho Dam (constructed mid-1960s), Westoe Dam (late-1960s), Morgenstond Dam (± 1970) and a number of reservoirs.
Chapter 4
The Vaal Dam wall was initially 54.2 m at the lowest foundation and is a gravity dam comprising a concrete gravity structure with an earthfill section on the right flank. The height was increased to 60.3 m in the 1950s, and again to 63.4 m in the 1980s. The dam presently stores roughly 2 600 million cubic metres of water with an additional temporary flood safeguard just above 600 million cubic metres.
© Lani van Vuuren

Hydrological Heritage Overview: Johannesburg | 45
The Vaal River was dammed in its upper reaches by means of the Grootdraai Dam near Standerton (1977-1981). The Heyshope Dam was constructed later – between 1982 and 1988 – in the Assegaai River, pumping 100 million cubic metres of water annually into the Vaal River system, supplementing the Grootvlei Dam.
Water from the tugela River
With growing water demands coupled with significant droughts in the mid-1960s, additional water was required in the then Pretoria-Witwatersrand-Vereeniging (PWV) area. The storage of the existing schemes in the Vaal River was 4 100 million cubic metres supplying a maximum of just over 1 500 million cubic metres of water per year.
The Vaal Dam had reached its limits in terms of the height of its dam wall and high evaporation further affected the prospects of increasing the dam’s storage. Water reuse was already implemented and the proposed Lesotho Highlands Water Project was still in early discussion and therefore not an immediate solution.
At this stage, attention was shifted to the Tugela River. Whereas
the Vaal River eventually meets the Orange River towards the Atlantic Ocean, the Tugela River exits through the eastern escarpment into the Indian Ocean. Then Minister of Water Affairs, Fanie Botha, approved the Thukela-Vaal Transfer Scheme in June 1970.
Construction commenced with the Spioenkop Dam. Following exclusion of options for dams near Harrismith and Qwa-Qwa, the Sterkfontein Dam site was located in the Nuwejaarspruit (a tributary of the Liebenbergsvlei River flowing into the Wilge River and the Vaal Dam).
To link Spioenkop Dam and Sterkfontein Dam and to decrease pumping energy, the Woodstock Dam was proposed at the confluence of the Tugela and Mnweni Rivers. The Woodstock Dam eventually serves to store water for further pumping via the Jagersrust pumpstation to Kilburn Dam and eventually into the Sterkfontein Dam (and subsequently the Vaal River). The Spioenkop Dam, on the other hand, regulates flow of the Tugela River for downstream demands.
Construction of the Sterkfontein Dam commenced in 1971 as a 2 290
m-long earth embankment with original height of 68 m and storage capacity of 1.2 million cubic metres.
In 1980, a decision was made to raise the dam wall of the Sterkfontein Dam to its current height of 93 m, as well as to construct a lower reservoir. Shortly following this, the 51 m-high Kilburn Dam and 46.6 m-high Driekloof Dam were constructed downslope of Sterkfontein. These three dams are used for power generation (as part of the Drakensberg Pumped Storage Scheme) where water is dropped from the Driekloof Dam via an underground power station to the Kilburn Dam. When excess power exists in the grid, the process is reversed and water is pumped back upslope from Kilburn Dam to Driekloof Dam. In instances that the Driekloof Dam is full, the water is simply released into the Sterkfontein Dam.
Water is presently released from the Sterkfontein Dam into the Nuwejaarspruit and eventually the Wilge River and Vaal River. Despite serious droughts between 1983 and 1987 and again in 1995, restricted but adequate water could be supplied by Rand Water thanks to the Thukela-Vaal scheme.

46 | Hydrological Heritage Overview: Johannesburg
Chapter 4
Sterkfontein and the Thukela-Vaal Scheme
The Sterkfontein Dam stores water for release to the Vaal River. Water is sourced from the Tugela River and pumped upwards from the Woodhead Dam. The Vaal and Sterkfontein Dams are among the top five largest dams in South Africa at present.
The Woodhead Dam (in the foreground) and the Spioenkop Dam (in the back) was later constructed to pump water into the Sterkfontein Dam. Whereas the prior dams fall within the catchment of the Thukela (Tugela) River draining towards the Indian Ocean, it is pumped into the Sterkfontein Dam in the Vaal River draining towards the Atlantic Ocean.
© Lani van Vuuren © Lani van Vuuren
© Gerrit Burger
© Gerrit Burger

Hydrological Heritage Overview: Johannesburg | 47
Water from the Senqu River in lesotho
Rand Water presently gets bulk of its water supply from the Lesotho Highlands. The Natural Resources Development Council first proposed the scheme in 1954, aiming to eventually supply 2.2 billion cubic metres of water per year to South Africa. Negotiations between the two countries commenced in the late 1970s with a treaty being formally signed between the governments of South Africa, Lesotho, the European Union, the United Nations and the World Bank in 1986. The initial proposed cost was estimated at R5.5 billion, but the figure was increased to R9.1 billion for the first phase in 1997.
Three phases comprising four dams were proposed to dam water from the Senqu River in Lesotho. Water from the dams completed during the first phase in 1998 – the Katse and Mohale Dams – are diverted via tunnels through the Maluti Mountains to the Ash River in the Free State near the town of Clarens, from where it flows on surface ultimately to the Vaal Dam.
Water is connected between the Mohale and Katse Dams by means of the Mohale Tunnel. From the Katse Dam, water enters the Delivery Tunnel South from Katse to the ‘Muela Power Station and Tailpond Dam, and then enters the tunnel again to the Ash River Outfall. Flow is measured using sensitive
flow metres at the Muela Station and again at a weir at the Ash River Outfall in South Africa. Here the water is released via the Ash, Liebenbergsvlei and Wilge Rivers for the final 200 km travel to the Vaal Dam.
Word has it that the Ash River, originally called the Asrivier in Afrikaans, resulted in some confusion as to whether the accurate translation is Ash or Axle River. It is told that wood was found in the river used to make axles for ox wagons during the Great Trek. Nevertheless, the river has significantly increased in flow due to the transfer from Lesotho and is currently a renowned river rafting location.
Lesotho Highlands Water Project
The Katse (left) and Mohale (right) Dams supply water to the Vaal Dam through the Lesotho Highlands Water Project. They are the first two fully completed dams forming part of the project with Phase 2 presently being at tender stage. Water from these dams are transported 90 km from the Lesotho Highlands to the Ash River Outfall in Clarens, and then another 200 km in the Ash, Liebenbergsvlei and Wilge Rivers to the Vaal Dam (© Matthys Dippenaar 2012).

48 | Hydrological Heritage Overview: Johannesburg
Chapter 4
Lesotho Highlands Water Project
The delivery tunnel was officially oped by Prof Kader Asmal, minister of Water Affairs and Forestry of the time, on 23 January 1998. The Delivery Tunnel North also achieved a South African Institution of Civil Engineering (SAICE) award for the most outstanding civil engineering achievement in the international category. The system is managed by the Trans-Caledon Tunnel Authority (South Africa) and the Lesotho Highlands Development Authority (Lesotho), releasing in the order of 35 million cubic metres per second. Every few years, for maintenance, flow is shut off and the tunnel is inspected. For the adventurous, river rafting is also offered at the Ash River Outfall near the town of Clarens.
Hydrological Heritage Overview: Johannesburg | 49
establishment of Johannesburg Water
Johannesburg Water State Owned Company (SOC) Ltd was incorporated in November 2000 and commenced business in January 2001. Mandated to provide water and sanitation to the Johannesburg residents in the area between Orange Farm in the south, Midrand in the north, Roodepoort in the west, and Alexandra in the east. Whereas Rand Water is an organ of state reporting to the Department of Water and Sanitation, Johannesburg Water is a state-owned company with the sole shareholder being the City of Johannesburg Metropolitan Municipality.
Johannesburg Water operates six regions, ten network deposits and six wastewater treatment plants in Central Gauteng. A continental divide separates the region into a northern and southern area. The northern area’s sewage is treated at the Northern or Driefontein Wastewater Treatment Works, and the southern areas at the G oud koppie , Bush koppie , Olifantsvlei and Ennerdale Wastewater Treatment Works.
For the year 2011/12, 962 million litres of sewage was treated daily, generating roughly 91 611 tonnes of dry sludge for the year. Given the vast volumes of water treated, notably in the northern areas, a significant amount of water is discharged into the northern Limpopo Water Management Area from the Driefontein Works, increasing downstream runoff significantly.
At present, approximately 750 000 domestic, commercial and industrial customers are supplied an average of 1 522 million litres per day. With an estimated 4.4 million people (census 2011), this results in a per capita usage around 345 liters per person per day.
development of Johannes-burg’s Sanitation System
The history of sanitation in Johannesburg follow that of the water supply fairly closely. The first proper sewage treatment scheme was proposed for Wynberg (now in Cape Town) and the first such operational scheme was developed in Bloemfontein. The inland towns became interested in improved sanitation systems and quickly followed suite.
The Johannesburg town engineer submitted reports entitled “Disposal of Sewage” and “Sewerage and Stormwater Drainage” on 9 December 1902. Further reports were subsequently submitted, proposing two alternative sites for sewage farms. The first, on Klipspruit Farm, was constructed with its first sewage delivery in November 1907. Public complaints in 1908, however, resulted in a case in the High Court in June 1909 and the Council was allowed in 1910 to mitigate the issue.
During 1937, new works were commissioned for combined sewage from Germiston and Boksburg. Regions around Springs, Benoni, Brakpan and Krugersdorp quickly followed with conventional sewage purification works.
The promulgation of the first Water Act (Act 54 of 1956) and the creation of the Department of Water Affairs from the then Department of Irrigation (now the Department of Water and Sanitation) resulted in stricter legislation of wastewater and separate standards were developed for wastewater quality in 1962.

50 | Hydrological Heritage Overview: Johannesburg
It is not always the lack of water readily available creating problems in supply, but rather the compromised or inadequate quality thereof. Water for different uses has very specific standards to comply with, ensuring human and environmental health. For this reason, some mention of the importance of water quality and water treatment is well deserved.
Given the heritage of mining and the associated contamination, the increased demands, and the position of Johannesburg at the very top of a significant watershed imply that Johannesburg probably has more difficulty in acquiring sufficient amounts of water than most other cities in South Africa. From a scientific point-of-view, more than a century’s excellence in science and engineering has helped in achieving this: supplying this city with water for its residential, commercial and industrial needs.
Water Quality and Supply
According to the City of Johannesburg, most of the rivers may be considered seriously or critically impaired and deviate from their good or natural state. Sewage, acid mine drainage from slimes dams, incompatible land use, human activities, urban runoff and increased development are noted as some influences on the river systems of the city with surface spills and poor infrastructure maintenance regarded as the most significant drivers of change in these systems. Typical pollution sources include road runoff, urban and informal development adjacent to rivers, and untreated discharge from some of the wastewater treatment works. Increasing population growth, microbial contamination due to inadequate sanitation, littering and waste dumping are some of the additional concerns requiring attention.
Concerning drinking water quality, the term ‘potable water’ is employed for water safe for human consumption. While we endeavour to preserve water quality in natural environments, potable or drinking water quality standards are strict to minimise health impacts on users.
Maximum contaminant levels (MCLs) define levels of a chemical in drinking water according to a given regulatory body (such as the World Health Organisation, US Environmental Protection Agency or Department of Water and Sanitation) below which the water is considered potable for prolonged periods. Water boards and suppliers continuously monitor the quality of their waters through laboratory analyses to ensure that the quality is not compromised.
Drinking water quality in South Africa is governed by South African National Standard (SANS) 241 of 2001.
“Water, water, everywhere, nor any drop to drink.” – Samuel Taylor Coleridge, The Rime of the Ancient Mariner.
Chapter 5: A glimpse through time: Recent history

Hydrological Heritage Overview: Johannesburg | 51
Some minimum requirements are as follows:
pH: 6.0-9.0
TDS: < 450 mg/litre (ℓ)
EC: < 70 mS/m
Calcium: < 80 mg/ ℓ
Chloride: < 100 mg/ ℓ
Fluoride: < 0.7 mg/ ℓ
Magnesium: < 30 mg/ ℓ
Nitrogen: < 6.0 mg/ ℓ
Potassium: < 25 mg/ ℓ
Sodium: < 200 mg/ ℓ
Sulphate: < 200 mg/ ℓ
Coliform bacteria:
0 organism per 100 ml in 95% of samples
Faecal coliform bacteria:
0 organisms per 100 ml in 95% of samples
E. coli: 0 organisms per 100 ml in 95% of samples
Most of Gauteng’s water is sourced from other catchments. This water is released following continuous damming, piping and pumping to the Vaal River’s tributaries and flows vast distances as surface water. Given its direct contact with human development on the land surface, the quality is
often compromised and pristine water from Lesotho and the Tugela requires retreatment in Gauteng.
Scientists distinguish between contamination and pollution. Contamination refers to elevated concentrations of some substance in water. Levels of contamination resulting in adverse effects to health of humans or the environment are then termed pollution. More formally put, contamination is considered the degradation of natural quality, typically due to human intervention, whereas pollution refers to contaminant levels restricting the proposed use of the water.
Urbanisation results in distinctly varying land use with a dense concentration of potential sources of contamination. This, coupled with mining, industrialisation and agriculture, create a need for understanding the potential of contamination and proper mitigation measures to, in the end, preserve both water quality and quantity.
In addressing municipal performance in supplying good quality drinking water and properly managing waste water treatment plants, the Department of Water
and Sanitation introduced the Blue Drop and Green Drop Certification Programmes. The Blue Drop is awarded to a municipality based on exceptional water supply and the Green Drop based on exceptional water treatment practices. As at 15 April 2015, the City of Johannesburg Metropolitan Municipality is more than 99.9% compliant in terms of its microbiological (including bacteria), chemical (major cations, anions and metals), and physical and organoleptic (non-health affecting taste and odour) requirements. The Municipality has been awarded Blue Drop status since the first report in 2009 until 2011. With the 2012 report pending, Johannesburg presently has an overall Blue Drop score of 98.92%. (You can find out the water quality of your area and access the relevant Blue Drop reports on the Internet at https://www.dwa.gov.za/dir_ws/dwqr/.)
In a press release by the then Department of Water Affairs, national non-revenue water is estimated at 36.7%, while for Johannesburg, this was around 35% in 2010/11. A significant portion of these water losses is accounted

52 | Hydrological Heritage Overview: Johannesburg
Chapter 5
Impacts on the Water Cycle and its Quality
for as physical leakages of water reticulation infrastructure such as pipelines. With more than a third of supplied water being lost and unaccounted for, water scarcity is progressively becoming more of a concern. Key issues ascribed as contributing factors include poor planning, budget constraints, lack of technical solutions, lack of community support, lack of skills and poor metering and billing systems.
Subsequently, in 2013, a new No Drop Certification Programme was introduced. This is awarded to municipalities with effective strategies in reducing water demand and water leakages within the municipal area. Water use efficiency is critical in ensuring water supply to the ever-growing demand and visible reductions in water losses and wastage are awarded through this incentive. This is closely related to the Department of Water and Sanitation’s Project 15% through which water conservation and water demand management measures are implemented by municipalities to reduce the demand by 15%.
The water cycle, also called the hydrological cycle, represents the interaction between water in the atmosphere, on land surface, in the oceans, and in the subsurface. Water reaches the land surface through, for instance, rainfall or snowfall (the latter being notably relevant in the Lesotho Highlands). On the land surface, water can either flow as surface runoff in streams and rivers, or infiltrate into the subsurface as groundwater. Both eventually drain towards the ocean. Water also evaporates back into the atmosphere, or is released to the atmosphere through transpiration by plants as a product of photosynthesis. However, given the need for water at specific locations, the water cycle may be interrupted through water transfer schemes, pumped storage schemes and damming.

Hydrological Heritage Overview: Johannesburg | 53
Man has distinct influences on the water cycle. Mining, agricultural and other water needs utilise surface water and lower then natural groundwater table. Pumping for these purposes aim to meet a water demand for the relevant land use, or to lower the water table for the purpose of safe underground mining. Industrial and mining activities contribute to possible groundwater and surface water quality deterioration through acid mine drainage, petroleum, effluent from land fill sites, and so forth, gradually seeping into the subsurface. Hard surfaces in urban settings furthermore load the stormwater system with excess water and reduce gradual infiltration of water into the subsurface. Coupled with sanitation, burial, fertilizers and other commercial and industrial practices, both surface water and groundwater progressively becomes at risk of contamination and, possibly, pollution.
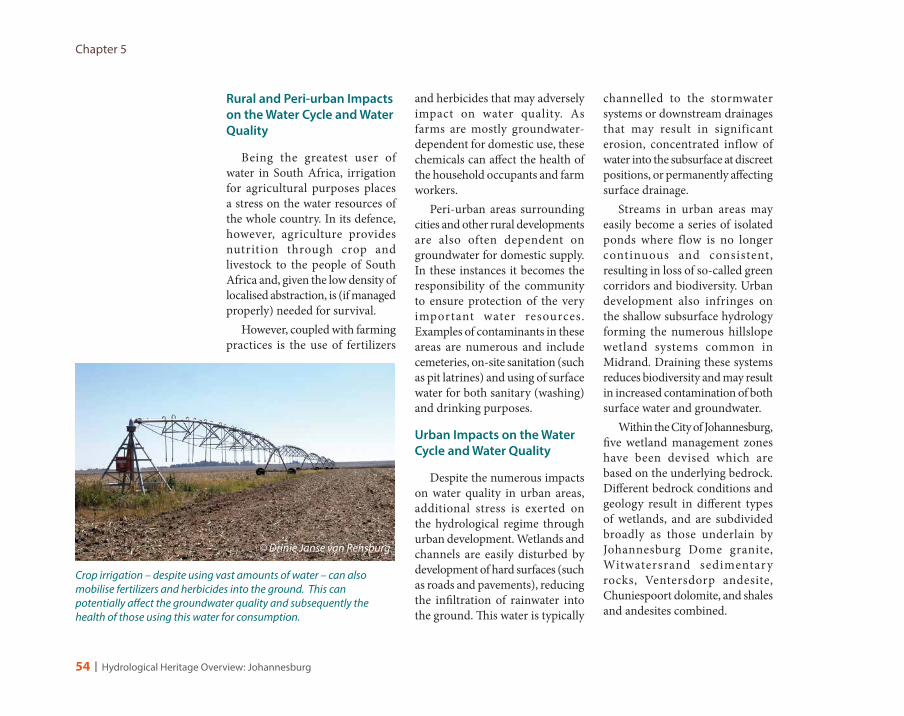
54 | Hydrological Heritage Overview: Johannesburg
Rural and Peri-urban impacts on the Water Cycle and Water Quality
Being the greatest user of water in South Africa, irrigation for agricultural purposes places a stress on the water resources of the whole country. In its defence, however, agriculture provides nutrition through crop and livestock to the people of South Africa and, given the low density of localised abstraction, is (if managed properly) needed for survival.
However, coupled with farming practices is the use of fertilizers
and herbicides that may adversely impact on water quality. As farms are mostly groundwater-dependent for domestic use, these chemicals can affect the health of the household occupants and farm workers.
Peri-urban areas surrounding cities and other rural developments are also often dependent on groundwater for domestic supply. In these instances it becomes the responsibility of the community to ensure protection of the very important water resources. Examples of contaminants in these areas are numerous and include cemeteries, on-site sanitation (such as pit latrines) and using of surface water for both sanitary (washing) and drinking purposes.
Urban impacts on the Water Cycle and Water Quality
Despite the numerous impacts on water quality in urban areas, additional stress is exerted on the hydrological regime through urban development. Wetlands and channels are easily disturbed by development of hard surfaces (such as roads and pavements), reducing the infiltration of rainwater into the ground. This water is typically
channelled to the stormwater systems or downstream drainages that may result in significant erosion, concentrated inflow of water into the subsurface at discreet positions, or permanently affecting surface drainage.
Streams in urban areas may easily become a series of isolated ponds where flow is no longer continuous and consistent, resulting in loss of so-called green corridors and biodiversity. Urban development also infringes on the shallow subsurface hydrology forming the numerous hillslope wetland systems common in Midrand. Draining these systems reduces biodiversity and may result in increased contamination of both surface water and groundwater.
Within the City of Johannesburg, five wetland management zones have been devised which are based on the underlying bedrock. Different bedrock conditions and geology result in different types of wetlands, and are subdivided broadly as those underlain by Johannesburg Dome granite, Witwatersrand sedimentary rocks, Ventersdorp andesite, Chuniespoort dolomite, and shales and andesites combined.
Chapter 5
Crop irrigation – despite using vast amounts of water – can also mobilise fertilizers and herbicides into the ground. This can potentially affect the groundwater quality and subsequently the health of those using this water for consumption.
© Drinie Janse van Rensburg

Hydrological Heritage Overview: Johannesburg | 55
mining impacts on the Water Cycle and Water Quality
Acid mine water or acid mine drainage (AMD) refers to water containing free sulphuric acid resulting from the weathering of pyrite. Weathering is exacerbated by the exposure of pyrite to oxygen during mining, resulting in water with acidic pH values.The mineral pyrite (FeS2) is commonly associated with, for instance, gold ore and oxidizes (in the presence of O2 and water, H2O) to free iron ions (Fe2+) and sulphuric acid (H2SO4).
The pH is typically below 5 and it can be host to a variety of heavy metals as soluble species depending on the geology and redox conditions. pH is a measure of acidity, specifically referring to temperatures of 25˚ and pressures of 1 bar. With 7 indicating neutral water (H2O), values below become progressively more acidic and those above more alkaline or basic.
In the gold-mining industry, gold occurs as ore in native form, meaning that it is not in a chemical compound with other elements. The same applies to the coal industry, supplying important energy to the goldfields, where coal occurs as
metamorphosed elemental carbon. In both these industries, pyrite is a commonly associated accessory mineral and the acid generation from rock weathering is a concern.
Apart from the possible generation of acid mine water, other impacts include lowering of the groundwater table due to dewatering for continuation of mining and ground instabilities. In many instances, pumping continues in areas where deep development may be flooded if water tables rebound. All of these have affected and are affecting South Africa’s already limited water resources in the Witwatersrand area.
Complaints about a decrease in water for agricultural use were apparently noted around 1905 already. The first true subvention – in the form of the 1960 Jordaan Commission Report – however proposed further dewatering of the dolomite areas to the north in order to expand the mining operations. This would impact greatly on surface stability and water quality in the subsequent decades, as no distinct minimum requirements for mine closure was stipulated.
Mine tailings (dumps of waste material) are numerous around
South Africa’s long and intensive gold-mining history resulted in a heritage often associated with pollution. Mine tailings like these form characteristic anthropogenic topography associated with the East Rand and West Rand. Even though some of these tailing dumps are presently being reclaimed (in other words, mined again for lower grade ore that is economically feasible and technologically possible with current technology), thedecant of acid mine drainage remains a problem.

56 | Hydrological Heritage Overview: Johannesburg
the Witwatersrand. These tailings are typically not vegetated, resulting in additional threats of dust, erosion and leaching. These dumps are also enclosed by urban space such as residential and business areas, implying a closed pathway between the possible source of contamination and the receptors or users.
It was only in the late 1990s that the South African Constitution changed together with Mineral and Petroleum Resources Development Act and the National Water Act, whereby ownership of mineral resources and water were transferred from the land owner. At present, these are owned by the public collectively and the state acts as custodian with respect to the allocation of these important resources.
Chapter 5
Mining influences water in numerous ways. Dewatering for the safe continuation of mining activities results in regional lowering of the groundwater table, potentially affecting proximate users. Water emanating from mining activities is generally enriched in a wide array of compounds. Iron notably gives a distinct red colour (e.g. left) and, coupled with acid generation from sulphide-minerals, acid mine water (right) can result. The colour is characteristic of very low pH (high acidity) water; at this position, the pH was measured at 2.5.

Hydrological Heritage Overview: Johannesburg | 57
Water treatment and discharge to other Catchments
Driefontein WWTW
The Driefontein Wastewater Treatment Works is one of Johannesburg’s prime examples of water treatment to standards allowing its discharge into the Crocodile catchment to the north. Being on the the oldest such facilities in the city, it comprises one activated sludge module with a daily capacity of 30 million litres. Given proposed expansions, its capacity will initially increase to 55 million litres and ultimately to 80 million litres per day.
Johannesburg is the first municipality in South Africa to thoroughly incorporate anaerobic sludge digestion at some of its wastewater treatment works. Organic matter from the sewage sludge is used to produce biogas (as methane gas) which is used as an energy source for the treatment process. Through this, energy costs are reduced as the sludge itself provides part of the requirements for the operation of the water treatment works. The process, termed Combined Heat and Power (CGP), is done through a series of chemical processes to produce methane. Combustion of methane then generates energy required for other processes. Based on findings from a WRC report (TT 565/13), the City of Johannesburg’s CHP can potentially produce 10.2 MW electrical energy and 12.2 MW heat from five of its wastewater treatment plants when treating just over one million cubic meters (1 billion litres) of sludge daily.
58 | Hydrological Heritage Overview: Johannesburg
We always look to the past to justify where we are; and we always look to the future to motivate where are going. But we rarely look to the present to appreciate or to actively improve our conditions.
In the buzz that is Johannesburg, South Africa’s economy was born. Now a country with an enormous African importance, South Africa’s presence is marked essentially by a strong mineral heritage and the discovery of gold in the late 1880s. Gold, thanks to its discovery in the Witwatersrand, remains the global financial indicator to this day. The Rand – our currency – is named after these gold-bearing reefs.
When teaching a child speech, easiest is often to relate polar opposite concepts. Switching the light on and off, the notions of ‘light’ and ‘dark’ are understood. Through primitive body language enactments, the opposite emotions of ‘happy’ and ‘sad’ are labelled with words for easier communication.
Scientifically and emotionally, mankind acts much in the same way. We understand the value of mining, urban development, industrial growth and economic prosperity, but we choose to communicate only the dire opposites of pollution, environmental degradation and societal antagonism.
We should, of course, understand the downsides and compromises made in development. We should mitigate and maintain rather than just take and claim. We should shift our focus from the urban sprawl towards rural water and sanitation. But we should simultaneously have an appreciation of our economic prosperity and social independence. South Africa has excelled at large-scale national and international transboundary water imports. As a country, this should be a pride rather than the good side effect of what is sensationally labelled our bad mining heritage. Decades from now, our decisions of today will
be our heritage. Will we still call it a bad heritage, or will the feeling have changed?
Current efforts by the City of Johannesburg to find alternative water supplies include the reuse of effluent from wastewater treatment works, rainwater harvesting and the incorporation of groundwater into the water mix. Treated effluent is discharged back into natural drainage features and is of quality that will not compromise human health. Relevant by-laws are presently being promulgated in order to implement effluent reuse in certain areas.
Rainwater harvesting is already being tested at the City’s depot and will be rolled out to schools within the municipality. Rainwater will mostly be used for the flushing of toilets, subsequently reducing the use of reticulated water for these purposes. And groundwater is presently being investigated for the possible purposes of park and lawn
“Yesterday is gone. Tomorrow has not yet come. We have only today. Let us begin.”– Mother Theresa.
Chapter 6: The road ahead
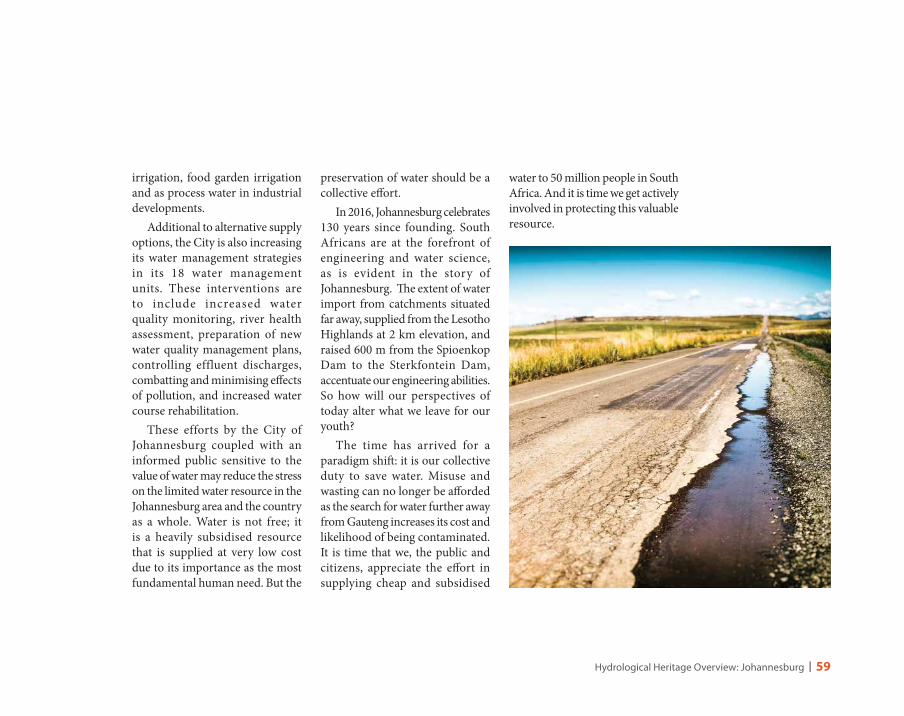
Hydrological Heritage Overview: Johannesburg | 59
irrigation, food garden irrigation and as process water in industrial developments.
Additional to alternative supply options, the City is also increasing its water management strategies in its 18 water management units. These interventions are to include increased water quality monitoring, river health assessment, preparation of new water quality management plans, controlling effluent discharges, combatting and minimising effects of pollution, and increased water course rehabilitation.
These efforts by the City of Johannesburg coupled with an informed public sensitive to the value of water may reduce the stress on the limited water resource in the Johannesburg area and the country as a whole. Water is not free; it is a heavily subsidised resource that is supplied at very low cost due to its importance as the most fundamental human need. But the
preservation of water should be a collective effort.
In 2016, Johannesburg celebrates 130 years since founding. South Africans are at the forefront of engineering and water science, as is evident in the story of Johannesburg. The extent of water import from catchments situated far away, supplied from the Lesotho Highlands at 2 km elevation, and raised 600 m from the Spioenkop Dam to the Sterkfontein Dam, accentuate our engineering abilities. So how will our perspectives of today alter what we leave for our youth?
The time has arrived for a paradigm shift: it is our collective duty to save water. Misuse and wasting can no longer be afforded as the search for water further away from Gauteng increases its cost and likelihood of being contaminated. It is time that we, the public and citizens, appreciate the effort in supplying cheap and subsidised
water to 50 million people in South Africa. And it is time we get actively involved in protecting this valuable resource.
60 | Hydrological Heritage Overview: Johannesburg
Abiye, T. A. (2014). Mine water footprint in the Johannesburg area, South Africa: analysis based on existing and measured data. South African Journal of Geology. 117(1):87-96.
Adler, R. A., Claassen, M., Godfrey, L. and Turton, A. R. (2007). Water, mining, and waste: an historical and economic perspective on conflict management in South Africa. The Economics of Peace and Security Journal. 2(2):33-41.
Bonner, P. and Lekgoathi, P. (2004). Hydropolitical History of South Africa’s International River Basins. Water Research Commission. Report 1220/1/04. Pretoria.
Carruthers, V. (2007). The Magaliesberg: a Place of Wilderness and War, a Mountain Chain linking the Magnificence of Nature with our Turbulent History. Protea Book House. Pretoria. -388pp.
Crooks, J. (2007). Rand Water: 100 Years of Excellence: 1903 – 2003. Rand Water Publication.
Department of Water and Sanitation. A 2011/12 Assessment of Non-revenue Water & Water Losses in South Africa. Aug 2014.
Dippenaar, M. A. (2013). Hydrogeological Heritage Overview: Pretoria’s Fountains – Arteries of Life. SP 44/13. Water Research Commission. Pretoria.
Dippenaar, M. A., Van Rooy, J. L., Breedt, N., Huisamen, A., Muravha, S. E., Mahlangu, S. and Mulders, J. A. (2013). Vadose Zone Hydrology: Concepts and Techniques. Water Research Commission. Report No. TT 584/13. -174pp.
Hazen, R. M., Papineau, D., Bleeker, W., Downs, R. T., Ferry, J. M., McCoy, T. J., Sverjensky, D. A. and Yang, H. (2009). Review paper: mineral evolution. American Mineralogist. 93:1693-1720.
Johannesburg Water SOC. (2015; retrieved 20 March 2015). Johannesburg Water SOC (Ltd) Official Website. Available at http://johannesburgwater.co.za
Kandel, R. (2003). Water from Heaven: the Story of Water from the Big Bang to the Rise of Civilization, and Beyond. Columbia University Press. New York. -312pp.
Kotzé, P. (2011). Johannesburg – City on a watershed. Water Wheel. May/June 2011. 18-21.
LHWP [Lesotho Highlands Water Project]. (2006). Volume 4, November 1996. Authored by Shani Wallis. Laserline.
McCarthy, T.s. and Rubidge, B. (2005). The Story of Earth & Life: a Southern African Perspective on a 4.6-billion-year Journey. Kumba Resources. Struik Publishers.
McKenzie, R. S. (2014). Guidelines for reducing water losses in South African municipalities. TT 595/14. Water Research Commission. Pretoria.
Meredith, M. (2007). Diamonds, Gold and War: the Making of South Africa. Simon & Schuster. UK Ltd. Great Britain. -570pp.
Murray, K. A. (1991). Wastewater Treatment and Pollution Control. 2nd Ed. Water Research Commision Report. Pretoria.
Norman, N. and Whitfield, G. (2006). Geological Journeys: a Traveller’s Guide to South Africa’s Rocks and Landforms. Struik Nature. 320pp.
Pallett, J. (Ed.) (1997). Sharing Water in Southern Africa. Desert Research Foundation of Namibia. -121pp.
Poehls, D. J. and Smith, G. J. (Eds.) (2009). Encyclopedic Dictionary of Hydrogeology. Academic Press. Amsterdam. -517pp.
Selected Bibliography

Hydrological Heritage Overview: Johannesburg | 61
Rand Water (2015; retrieved 23 February 2015). Rand Water – Background. Available at http://randwater.co.za/AboutUs/Pages/Background.aspx
Robb, L. J. and Robb, V. M. (1998). Gold in the Witwatersrand Basin. In: Wilson, M. G. C. and Anhaeusser, C. R. (Eds.) The Mineral Resources of South Africa. Council for Geoscience. Pretoria. 294-349.
SABS [South African Bureau of Standards] (2001). Specification: Drinking Water. SANS 241. Pretoria.
SACS [South African Committee for Stratigraphy]. (2006). A revised stratigraphic framework for the Witwatersrand Supergroup. Lithostratigraphic Series No. 42. Council for Geoscience. Pretoria. -7pp.
Swartz C. D., van der Merwe-Botha, M. and Freëse, S. D. (2013). Energy Efficiency in the South African Water Industry: A Compendium of Best Practices and Case Studies. TT 565/13. Water Research Commission. Pretoria.
Turton, A. (2013). Debunking persistent Myths about AMD in the Quest for a sustainable Solution. South African Energy & Food Forum. SAWEF Paradigm Shifter Series. 1(1):1-39.
Turton, A., Schultz, C., Buckle, H., Kgomongoe, M., Malungani, T. and Drackner. M. (2006). Gold, scorched earth and water: the hydropolitics of Johannesburg. Water Resources Development. 22(2):313-335.
Vaaldam.biz. (retrieved 17 August 2015). History of the Vaaldam: The History of Deneysville. Available in downloadable portable document format from the Internet at http://www.vaaldam.biz/history.html. -48pp.
Van Vuuren, L. (2008). Thukela-Vaal Transfer Scheme: Feeding the hungry heartland. The Water Wheel. November/December 2008. 16-21.
Van Vuuren, L. (2008). Vaal Dam – Underlying Gauteng’s Wealth. The Water Wheel. July/August 20018. 20-23.
Van Vuuren, L. (2012). In the Footsteps of Giants – Exploring the History of South Africa’s large Dams. Water Research Commission. Report No SP 31/12. -333pp.
Van Vuuren, L. (2014). Water loss: are we wasting our way into a potential water crisis? The Water Wheel. November/December. 34-37.
Viljoen, M. J. and Reimold, W. U. (1999). An Introduction to South Africa’s Geological and Mining Heritage. MINTEK. Randburg.
Pretorius, F. (ed.) (2012). Geskiedenis van Suid-Afrika van voortye tot vandag. Tafelberg. Cape Town.
Visser, W. (2012) in Pretorius, F. (ed.). Die minerale revolusie. 183-199.
Pretorius, F. (2012). Almal se oorlog: die Anglo-Boereoorlog (1899-1902). 235-254.
Meyer, A. (2012). Suid-Afrika se oerverlede. 9-16.Johnson, M. R., Anhaeusser, C. R. and Thomas, R. J. (eds.) (2009).
The Geology of South Africa. Geological Society of South Africa, Johannesburg/ Council for Geoscience, Pretoria.
Eriksson, P. G., Altermann, W. and Hartzer, F. J. (2009). The Transvaal Supergroup and its Precursors. 237-260.
Johnson, M. R., van Vuuren, C. J., Visser, J. N. J., Cole, D. I., Wickens, H. de V., Christie, A. D. M., Roberts, D. L. and Brandl, G. (2009). Sedimentary Rocks of the Karoo Supergroup. 461-500.
Van der Westhuizen, W. A., de Bruiyn, H. and Meintjies, P. G. (2009). The Ventersdorp Supergroup. 187-208.
Robb, L. J., Brandl, G., Anhaeusser, C. R. and Poujol, M. (2009). Archaean Granitoid Intrusions. 57-94.
McCarthy, T. S. (2009). The Witwatersrand Supergroup. 155-186.Hunter, D. R., Johnson, M. R., Anhaeusser, C. R. and Thomas, R.
J. (2009). Introduction. 1-8.Brandl, G., Cloete, M. and Anhaeusser, C. R. (2009). Archaean
Greenstone Belts. 9-56.