
“Audit Protocol Guidelines” Rich Culbertson Lockheed Martin.

Hydrographic and Sedimentation Survey of Kajakai Reservoir, Afghanistan
GEOLOGICAL SURVEY WATER-SUPPLY PAPER 1608-M
Prepared in cooperation with the Ministry of Agriculture and Irrigation, Heater and Soil Survey Department of Afghanistan under the auspices of the United States Agency for International Development

Hydrographic and Sedimentation Survey of Kajakai Reservoir, AfghanistanBy DON C. PERKINS and J. K. CULBERTSON
CONTRIBUTIONS TO THE HYDROLOGY OF ASIA AND OCEANIA
GEOLOGICAL SURVEY WATER-SUPPLY PAPER 1608-M
Prepared in cooperation with the Ministry of Agriculture and Irrigation, Heater and Soil Survey Department of Afghanistan under the auspices of the United States Agency for International Development
Sediment deposition in Kajakai Reservoir on Helmand River 1953 to 1968, determined using underwater mapping techniques
UNITED STATES GOVERNMENT PRINTING OFFICE, WASHINGTON : 1970

UNITED STATES DEPARTMENT OF THE INTERIOR
WALTER J. HIGKEL, Secretary
GEOLOGICAL SURVEY
William T. Pecora, Director
Library of Congress catalog-card No. 70 607297
For sale by the Superintendent of Documents, U.S. Government Printing Office Washington, D.C. 20402 - Price 30 cents (paper cover)

CONTENTS
PageAbstract _________________________________________________________ MlIntroduction. _____________________________________________________ 2
Purpose of survey.____________________________________________ 3Acknowledgments _____________________________________________ 3
Location and description of reservoir________________________________ 3Hydrographic survey.______________________________________________ 4
Horizontal control.___________________________________________ 14Vertical control._______________________________________________ 20
Office procedure-___-_________-_________^________________-_________ 26Sedimentation ____________________________________________________ 27
Future sedimentation._________________________________________ 41
ILLUSTRATIONS
Page FIGUBE 1. Sketch map of Afghanistan showing location of Kajakai
Dam on Helmand River___________________________ M22. Sketch map of Kajakai Reservoir showing location of
sediment range lines._____________________________ 43. Sketch map of Kajakai Reservoir showing azimuth from
F2X to orientation monument established for 1968 hydrographic and sedimentation survey______________ 18
4. Photograph of standard navigational sextant__________ 195. Sketch map illustrating position fix by sextant_________ 196. Photograph of fathometer chart for sediment range line
12-12 cross section______________________________ 207. Example of filed notes and office compilation sheet for
determination of position fix by sextant. ____________ 218. Sketch map illustrating position fix by 2-transit method, _ 229. Example of filed notes and office compilation sheet for
determination of position fix by 2-transit method_____ 23 10-13. Photographs showing
10. Transitman directing boat on a given azimuth.. _ 2411. Boat with fathometer crew beginning sounder
run____________________________________ 2412. Triangulation transitman at F2X____________ 2513. Survey crew receiving training in transit op
eration. _______________________________:._ 25
in

IV CONTENTS
FIGURE 14-24. Cross sections of Kajakai Reservoir Page14. Sediment range lines 1-1 and 2-2___________ M2815. Sediment range lines 3-3 and 4-4______________ 2916. Sediment range lines 5-5 and 6-6____________ 3017. Sediment range lines 6-7 and 8-8____________ 3118. Sediment range lines 9-7 and 9-10___________ 3219. Sediment range lines 11-11 and 12-12________ 3320. Sediment range lines 13-13 and 14-14________ 3421. Sediment range lines 14-15, 14-16, and 17-17_ 3522. Sediment range lines 18-18 and 19-19________ 3623. Sediment range lines 20-20 and 21-21________ 3724. Sediment range lines 22-22 and 23-23________ 38
25. Graph showing profile of sediment distribution alongHelmand River channel through Kajakai Reservoir.__ 39
26-28. Photographs showing 26. Foerst bed-material sampler in use____________ 4027. Sediment deposited along river flood plain near
range line 22-22_______________________ 4128. Flow-duration curve of annual inflow to Kajakai
Reservoir, 1953-65 water years _____________ 42
TABLES
Page TABLE 1. Comparative summary, original and 1968 surveys. _____ M5
2. Capacity table of Kajakai Reservoir, 1968_____________ 53. Azimuths of monuments and sediment range lines______ 64. Summary of 1968 Kajakai Reservoir reach data________ 105. Cross-section area of sediment range lines______________ 136. Azimuths to triangulation stations.___________________ 147. Particle-size analyses of bed material-___ ______________ 408. Summary of annual inflow to Kajakai Reservoir______ 43

CONTRIBUTIONS TO THE HYDROLOGY OF ASIA AND OCEANIA
HYDROGRAPHIC ANDSEDIMENTATION SURVEY OF
KAJAKAI RESERVOIR, AFGHANISTAN
By DON C. PERKINS and J. K. CTTLBERTSON
ABSTRACT
A hydrographic and sedimentation survey of Band-e Kajakai (Kajakai Reservoir) on the Darya-ye Hirmand (Helmand River) was carried out during the period September through December 1968. Underwater mapping techniques werer used to determine the reservoir capacity as of 1968. Sediment range lines were established and monumented to facilitate future sedimentation surveys. Afghanistan engineers and technicians were trained to carry out future reser voir surveys.
Samples were obtained of the reservoir bed and in the river upstream from the reservoir. Virtually no sediments coarser than about 0.063 millimeter were found on the reservoir bed surface. The median diameter of sands being trans ported into the reservoir ranged from 0.040 to 0.110 millimeter. The average annual rate of sedimentation was 7,800 acre-feet. Assuming an average density of 50 pounds per cubic foot (800 kilograms per cubic meter), the estimated average sediment inflow to the reservoir was about 8,500,000 tons (7,700,000 metric tons) per year.
The decrease in capacity at spillway elevation for the period 1953 to 1968 due to sediment deposition was 7.8 percent, or 117,700 acre-feet. Redefinition of several contours above the fill area resulted in an increase in capacity at spill way elevation of 13,600 acre-feet; thus, the net change in capacity was 7.0 per cent, or 104,800 acre-feet.
Based on current data and an estimated rate of compaction of deposited sedi ment, the assumption of no appreciable change in hydrologic conditions in the drainage area, the leading edge of the principal delta will reach the irrigation outlet in 40-45 years.
It is recommended that a resurvey of sediment range lines be made during the period 1973-75.
Ml

M2 CONTRIBUTIONS TO THE HYDROLOGY OF ASIA AND OCEANIA
INTRODUCTION
Storage of water behind Kajakai Dam on the Darya-ye Hirmand (Helmand River1 ) (fig. 1) began in January 1953. A reconnaissance survey of Band-e Kajakai (Kajakai Reservoir) was made in May 1967 to observe generally the magnitude and extent of sediment deposition that occurred during the first 14 years of storage. Sediment deposition appeared to be significant, and recommendations were made that a more comprehensive sedimentation survey be carried out.
The Agency for International Development (USAID), an agency of the Government of the United States of America, and the Ministry of Agriculture and Irrigation (MAI), an agency of the Royal Govern ment of Afghanistan (RGA), signed an agreement to conduct a hydrographic and sedimentation survey of Kajakai Reservoir. A sur vey was carried out during the period September through December 1968. The results of the survey are presented in this report.
FIGURE 1. Sketch map of Afghanistan showing location of Kajakai Dam onHelmand River.
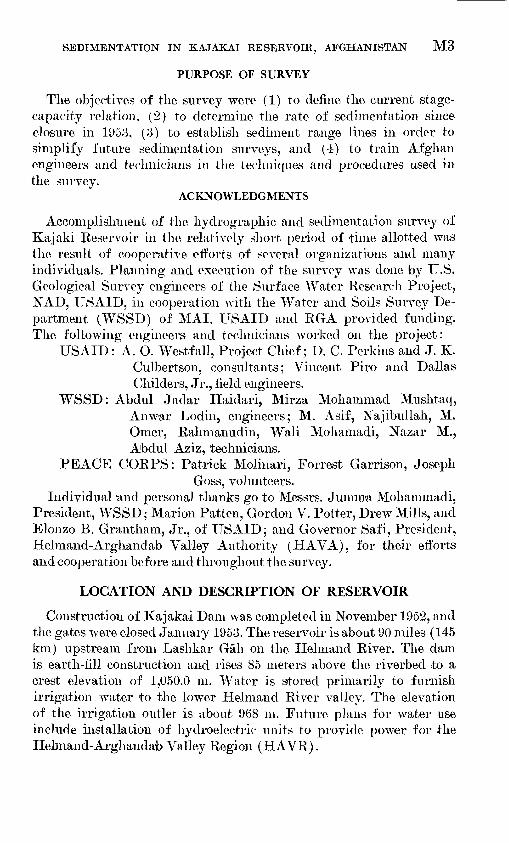
SEDIMENTATION IN KAJAKAI RESERVOIR, AFGHANISTAN M3
PURPOSE OF SURVEY
The objectives of the survey were (1) to define the current stage- capacity relation, (2) to determine the rate of sedimentation since closure in 1953, (3) to establish sediment range lines in order to simplify future sedimentation surveys, and (4) to train Afghan engineers and technicians in the techniques and procedures used in the survey.
ACKNOWLEDGMENTS
Accomplishment of the hydrographic and sedimentation survey of Kajaki Reservoir in the relatively short period of time allotted was the result of cooperative efforts of several organizations and many individuals. Planning and execution of the survey was done by U.S. Geological Survey engineers of the Surface Water Research Project, NAD, USAID, in cooperation with the Water and Soils Survey De partment (WSSD) of MAI. USAID and RGA provided funding. The following engineers and technicians worked on the project:
USAID: A. O. Westfall, Project Chief; D. C. Perkins and J. K. Culbertsoii, consultants; Vincent Piro and Dallas Childers, Jr., field engineers.
WSSD: Abdul Jadar Haidari, Mirza Mohainmad Mushtaq,Anwar Lodin, engineers; M. Asif, Najibullah, M.Omer, Rahmanudin, Wali Mohamadi, Nazar M.,Abdul Aziz, technicians.
PEACE CORPS: Patrick Molinari, Forrest Garrison, JosephGoss, volunteers.
Individual and personal thanks go to Messrs. Jumina Mohammadi, President, WSSD; Marion Patten, Gordon V. Potter, Drew Mills, and Elonzo B. Grantham, Jr., of USAID; and Governor Safi, President, Helmand-Arghandab Valley Authority (HAVA), for their efforts and cooperation before and throughout the survey.
LOCATION AND DESCRIPTION OF RESERVOIR
Construction of Kajakai Dam was completed in November 1952, and the gates were closed January 1953. The reservoir is about 90 miles (145 km) upstream from Lashkar Gah on the Helmand River. The dam is earth-fill construction and rises 85 meters above the riverbed to a crest elevation of 1,050.0 m. Water is stored primarily to furnish irrigation water to the lower Helmand River valley. The elevation of the irrigation outlet is about 968 m. Future plans for water use include installation of hydroelectric units to provide power for the Helmand-Arghandab Valley Region (HAVR).

M4 CONTRIBUTIONS TO THE HYDROLOGY OF ASIA AND OCEANIA
Original capacity of the reservoir was 1,495,000 acre-feet at a spill way elevation of 1,033.5 m and a capacity of 2,300,000 acre-feet at eleva tion 1,045 m. Original zero storage elevation was 965.0 m. The reservoir extends about 28 miles (49,000 m thalweg distance) upstream from Kajakai Dam. Full-capacity widths of the reservoir vary considerably from a minimum of about 200 m in the "narrows'" to about 2,400 m at several points. Figure "2 is a sketch map showing the water-surface contour at. an elevation of about 1,015 m. Also shown in figure '2 are approximate locations of permanent sediment range lines set up as a result of the 1968 survey.
HYDROGRAPHIC SURVEY
A comparative summary of the initial capacities, the 1968 capacities, change in capacities, and percent change in capacities at 5-m incre ments of elevation are given in table 1. The 1968 capacity is given in table 2.
The hydrographic survey determined locations of current under water contours as described in the following sections. New contours were drawn on prints of the original topographic maps produced by the 1953 Fairchild Surveys. Areas within each contour were planim- etered and capacities between contours computed as shown in the example at the bottom of table 1.
FIGTJBE 2. Sketch map of Kajakai Reservoir showing location of sediment rangelines.

SEDIMENTATION IN KAJAKAI RESERVOIR, AFGHANISTAN M5
TABLE 1. Comparative summary, original and 1968 surveys
Elevation (met
1,0351,033. S 1 ------.----
1,025_. ____________
l'oi5I'oio1,005 ___ ________
995990 ____ _ _ ___
980_______________
970968965
Capacity, in thousands of acre-feet
1953
___________ 1,587.0___________ 1,495.0
1 294 0_ _______ 1,039.0
___ ______ 824. 0___________ 644.0
48Q 0___________ 364.0_ _ ______ 266. 0___________ 186.0________ ._ 123. 0___________ 73.0___________ 35.0___________ 13.3___________ 2.7
__ ________ 0
1968 (
1, 479. 1 1, 390. 9 1, 185. 3
931. 6 723. 9 554.3 422. 0 321.2 242.5 175.0 117. 7 70. 8 34. 2 10. 5
1. 2 0 __.
Change in capacity Percent
n thousands loss in af acre-feet capacity
(15 yr)
107. 9 104. 8 108. 7 107. 4 100. 1 89. 7 67.0 42. 8 23. 5 11. 0
5. 3 2. 2 0. 8 2. 8 1. 5
6. 8 7.0 8.4
10. 3 12. 1 13. 9 13. 7 11.8
8. 8 5. 9 4. 3 3. 0 2. 3
21. 1 55.6
1 Spillway elevation.
Example of volume computation: Given:
A=area of 1,005-m contour = 26,681,000 sq m B = area of 1,000-m contour=21,672,000 sq m
Find:V= volume, in acre-feet, between elev 1,000 and 1,005 m
= A+BX 5-Hi,233.49 (cubic meters per acre-foot)2
= 26,681,000+ 21,672,OOOX 5n-1,233.492
= 48,353,OOOX 5-n 1,233.49= 98,000 acre-feet
TABLE 2. Capacity of Kajakai Reservoir, 1968, in thousands of acre-feet
Elevation (meters)
960................970..-.-......---.980... .......... ..990.__. ...... ..... 1,000.............1,010... .........1,020.. _..........1.030.............
0
1.234.2
117.7 242.5422.0723.9
1. 185. 3
1
2.140.7
128.2 257.1446.0763.4
1. 243. 9
2
3.547.6
139.2 272.2471.3803.9
1. 302. 7
3
5.354.9
150.7287.9497. 9845.4
1. 361. 5
4
7.662.6
162. 7 304.2525.8887.9
1. 420. 3
5
10.570.8
175.0 321.2554.3931.6
1.479.1 .
6
14.079.4
187.7 339.1584.3977.2
7
18.188.4
200.9 358.0615.9
1, 024. 9
8
022.897.8
214.4 378.0649.7
1, 075. 2
9
0.528.2
107.6228.3 399.3685.7
1, 128. 3
Discrepancies in segments of some contours shown on the 1953 topo graphic map were revealed during the 1968 hydrographic survey. They are readily apparent in figures 16-18, and others, which show the reservoir bottom in some areas to be lower in 1968 than in 1953, although subjected to sediment deposit for many years. Locations of some contours above the water surface at the time of the survey were
379-082 O 70 2
M6 CONTRIBUTIONS TO THE HYDROLOGY OF ASIA AND OCEANIA
refined on the basis of levels run from the water surface to sediment range-line monuments. As a, result of the refinement in location of some contours, capacity in several reaches of the reservoir was found to be greater than initially indicated. (See figs. 16-18.)
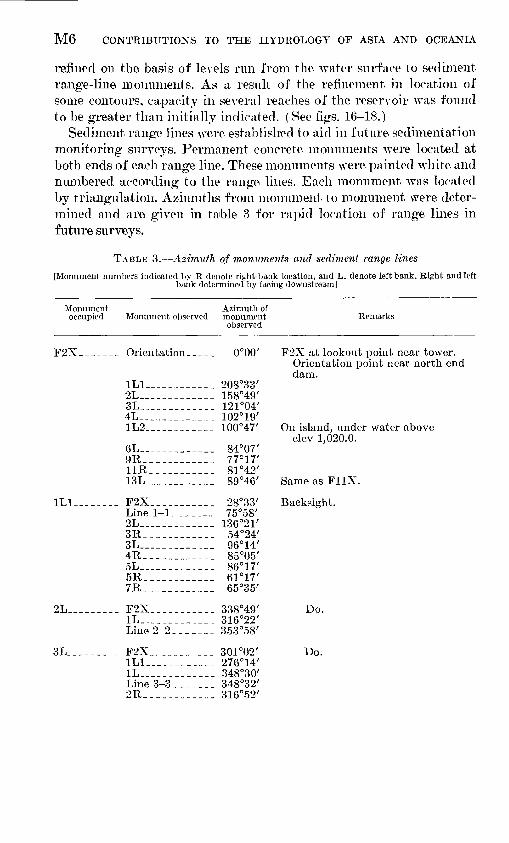
Sediment range lines were established to aid in future sedimentation monitoring surveys. Permanent concrete monuments were located at both ends of each range line. These monuments were painted white and numbered according to the range lines. Each monument was located by triangulation. Azimuths from monument to monument were deter mined and are given in table 3 for rapid location of range lines in future surveys.
TABLE 3. Azimuth of monuments and sediment range lines
[Monument numbers indicated by R denote right-bank location, and L, denote left bank. Right and left bank determined by facing downstream]
Monument occupied Monument observed
Azimuth ofmonumentobserved
Remarks
F2X_______ Orientation_____ 0°00' F2X at lookout point near tower.Orientation point near north enddam.
1L1______.___._ 208°33'2L___________ 158°49'3L___________ 121°04'4L_____________ 102°19'1L2____________ 100°47' On island, under water above
elev 1,020.0. 6L__-.____.____ 84°07'9R___.________ 77°17'11R___________ 81°42'13L____________ 89°46' SameasFllX.
1L1________ F2X___________ 28°33' Backsight.Line !-!_______ 75°58'2L_.___________ 136°21'3R____________ 54°24'3L_____________ 96°14'4R____________ 85°05'5L.________.___ 86°17'5R--_-___-___- 61°17'7R____________ 65°35'
2L_________ F2X___________ 338°49' Do.1L______.______ 316°22'Line 2-2_______ 353°58'
3L_________ F2X___________ 301°02' Do.1L1___.________ 276°14'1L.____________ 348°30'Line 3-3_______ 348°32'2R____________ 316°52'

SEDIMENTATION IN KAJAKAI RESERVOIR, AFGHANISTAN M7
TABLE 3. Azimuth of monuments and sediment range lines Continued[Monument numbers indicated by R denote right-bank location, and L. denote left bank. Right and left
bank determined by facing downstream]
Monument occupied Monument observed
Azimuth of monument observed
Remarks
4L_________ F2X._________ 282°19' Backsight.Line 4-4_______ 351°02'3R_-__________ 314°02'2R_--_________ 290°47'lL_-_-_-_____- 265°05'5L__________-_- 88°11'5R-_--_-____ 36°35'6R___.____._ 27°40'1L___________ 284°54'
5R-__-__ 4L___________ 216°35' Do.Line 5-5_____ 174°57'6L_____________ 127°30'8L_____________ 63°40'
6L_______ 5R---_-------- 307°30' Do.8L___________ 27°09'Line 6-6_____ 316°02'Line 6-7. ____ 5°25' 9_ _ __ 56°24' 11R___ ______ 76°37'
8L_________ 6L______________ 207°09' Do.Line 8-8-_____ 272°22'7___________ 227°08'
9____-_---_ 6L___________ 236°24' Do.Line 9-7_______ 285°15'Line 9-10______ 197°30'
_-_____ lll^S'_______ 114°26'
5R________ 271°40'
11L________ 10_____________ 307°20' Do.Line 11-11______ 210°00'7__________ 318°27'9___________ 347°38'12R___________ 61°52'
12R_______ 10_____________ 263°16' Do.6L___________ 266°30'Line 12-12._____ 185°02'7____________ 290°33'9___________ 294°26'13L____________ 126°22' Same as FlIX.
13L________ 12R___________ 306°22' Backsight.Line 13-13__.___ 0° 00' 11R___________ 302° 55'5R__________ 285° 46'7______________ 294° 41'9____________ 299° 00'6R__________ 290° 20'14R___________ 53° 30'
14L________ 13R.__________ 233° 30' Backsight F10X to F11X.Line 14-14_____ 198° 07' Across lower end of narrows.Line 14-15-____ 115° 44'Line 14-16-____ 40°04'11L____________ 252° 57'

M8 CONTRIBUTIONS TO THE HYDROLOGY OF ASIA AND OCEANIA
TABLE 3. Azimuth of monuments and sediment range lines Continued
[Monuments numbers indicated by R denote right-bank location, and L, denote left bank. Right and left bank determined by facing downstream]
Monument occupied Monument observed
Azimuth of monument observed
Remarks
17R______ Orientation_____ 90° 05' 17R monument is at upper end ofnarrows. Orientation is 17L.
Line 17-17-.. ___ 90° 05' 21L___________- 29° 01'18R-_-___-_-__ 31° 04'19R_--_---_-_- 12° 25'20R__..______. 13° 25'20L_________. 38° 58'
18R_.___-__ 17R--__.______ 211° 04' Backsight.Line 18-18--- 270° 05'19R______.__ 0°20'20R____.______ 7°18'
_-_-_____ 28°24'_______ 13°16'
17L____________ 188°42'Line 19-19____ 132°00' Do.
-__---___ 15°15'__.______ 69°31'_______ 180°20'-__--___- 192°25'___---___ 207°58'
__.-_____ 191°02' Do.Line 20-20 ___ 108°05'
__. ______ 195°15'._._-__ 74°14'_________ 166°15'____-_.__ 187°18'
___-_____ 207°16' Do.______.__ 254°14'_________ 199°35'-__----__ 225°49'_ _- __ 209°01'
18L__________ 218°23'Line 21-22_____ 293°04'22R___________ 39°27'
22R_______ 21L__________ 219°27' Do.Line 22-22_ _ _ _ _ 146°05' 3,320 m upstream of 21.
23L______ Line 23-23--__. 306°42'
SEDIMENTATION IN KAJAKAI RESERVOIR, AFGHANISTAN M9
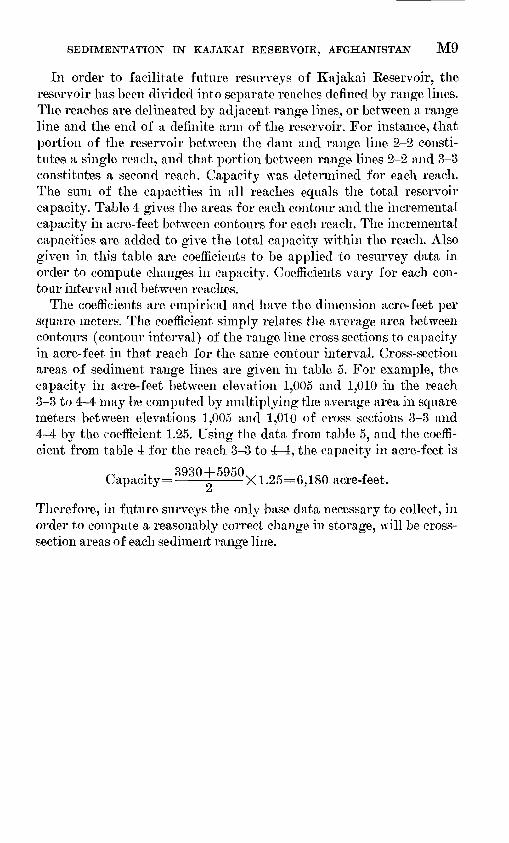
In order to facilitate future resurveys of Kajakai Reservoir, the reservoir has been divided into separate reaches defined by range lines. The reaches are delineated by adjacent range lines, or between a range line and the end of a definite arm of the reservoir. For instance, that portion of the reservoir between the dam and range line 2 2 consti tutes a single reach, and that portion between range lines 2-2 and 3-3 constitutes a second reach. Capacity was determined for each reach. The sum of the capacities in all reaches equals the total reservoir capacity. Table 4 gives the areas for each contour and the incremental capacity in acre-feet between contours for each reach. The incremental capacities 'are added to give the total capacity within the reach. Also given in this table are coefficients to be applied to resurvey data in order to compute changes in capacity. Coefficients vary for each con tour interval and between reaches.
The coefficients are empirical and have the dimension acre-feet per square meters. The coefficient simply relates the average area between contours (contour interval) of the range line cross sections to capacity in acre-feet in that reach for the same contour interval. Cross-section areas of sediment range lines are given in table 5. For example, the capacity in acre-feet between elevation 1,005 and 1,010 in the reach3-3 to 4-4 may be computed by multiplying the average area in square meters between elevations 1,005 and 1,010 of cross sections 3-3 and4-4 by the coefficient 1.25. Using the data from table 5, and the coeffi cient from table 4 for the reach 3-3 to 4-4, the capacity in acre-feet is
Capacity= 3930 l' 5950 X1.25=6 ? 180 acre-feet.£i
Therefore, in future surveys the only base data necessary to collect, in order to compute a reasonably correct change in storage, will be cross- section areas of each sediment range line.

M10 CONTRIBUTIONS TO THE HYDROLOGY OF ASIA AND OCEANIA
TABLE 4. Summary of 1968 Kajakai Reservoir reach data
Elevation (meters)
Area (thou sands
of sqm)
Capac- eity
(thou sands
of ac-ft)
Capac- .Area ity
Coeffl- (thou- (thou- cient sands sands
of of sq m) ae-ft)
Reach dam to 2-2
968 - .
970 . ..
975 .--..
980 .......
985
990
995 .......
1,000.. .......
1,005 .
1,010 ..-..
1,015
1,020 .
1,025 ---..
1,030-.--.--.
1,033.5 .--.
1,035 .
Total..
0
154
367
471
596
762
991
.. 1,280
.. 1,573
.. 1,900
._ 2,276
.- 2,638
.. 3,034
.- 3,529
.. 4,064
..........
0.25
1.05
1.70
2.16
2.75
3.55
4.60
5.78
7.04
8.46
9.96
11.50
13.30
10.77
4.62
87.49
1.07
.689
.676
.698
.732
.782
.914
1.05
1.19
1.20
1.32
1.38
1.32
1.50
------
Reach 5 5 to 6-7
968. .
970...........
975 .
980. --.-..
985 .......
990...........
995 .---.-..
I, 000.. .......
1,005... ......
1,010. .....
1,015. ---.
1,020 --.-.
1,025 -..-.
1,030 -.--.
1,033.5 -..
1,035- . .
Total.
0
320
1 939
.- 2,170
.. 2,468
.- 2,721
.. 2,912
.. 3,093
.. 3,265
. . 3, 460
.. 3,621
.. 3,938
- 4,194
.. 4,390
0.65
4.58
8.30
9.40
10.52
11.42
12.17
12.89
13.63
14.35
15.32
16.48
12.18
5.22
147. 11
2.07
1.13
1.50
1.48
1.56
1.60
1.64
1.67
1.70
1.68
1.71
1.76
1.86
Area (thou-
Coeffl- sands cient of
sq m)
Reach 2-2 to 3-3
0
150
336
410
464
541
638
833
951
1,088
1,220
1,413
1,604
1,715
1,850
0.24
.98
1.51
1.77
2.04
2.39
2.98
3.62
4.13
4.68
5.33
6.11
6.72
5.06
2.17
49.73
1.39
.694
.615
.584
.592
.600
.693
.783
.840
.821
.872
. 825
.752
.79
-----
Reach 6- 7 to 9-10
0
968
1,394
1,646
1,808
1,940
2,072
2,188
2,310
2,420
2,542
2,669
2,784
1.96
4.79
6.16
7.00
7.60
8.13
8.63
9.12
9.59
10.06
10.56
7.74
3.32
94.66
1.78
1.41
1.23
1.31
1.34
1.41
1.47
1.50
1.48
1.50
1.54
1.61
Capac ity
(thou sands
of ac-ft)
Area (thou-
Coeffl- sands cient of
sqm)
Reach 3-3 to 4-4
0
352
748
823
952
1,054
1,188
1,314
1,439
1,610
1,798
2,018
2,320
2,576
2,802
0.57
2.23
3.18
3.60
4.07
4.54
5.07
5.58
6.18
6.91
7.73
8.79
9.92
7.63
3.27
79.27
1.06
1.14
.896
.926
1.02
1.07
1.15
1.20
1.25
1.24
1.31
1.28
1.26
1.34
Reach 8-8 to end
0
2
98
294
840
1,338
2,016
3,331
3,649
0.20
.79
2.30
4.41
6.80
10.84
9.90
4.24
39.48
0.188
.276
.548
.833
1.08
1.36
1.60
Capac ity
(thou sands
of ac-ft)
Coeffi cient
Reach 4-4 to 5-5
0
56
2,128
2,695
2,913
3,094
3,313
3,505
3,687
3,877
4,107
4,413
4,687
4,965
5,234
0.09
4.43
9.77
11.37
12.18
12. 99
13.82
14.58
15. 33
16.18
17.27
18.44
19.56
14.47
6.20 -
186.68 -
0.189
2.75
1.75
1.86
1.94
1.99
2.01
2.02
2.01
1.96
2.02
2.07
2.05
2.12
Reach 8-8 to 9-7
0
60
293
628
933
1,262
1,787
2,149
2,567
2,850
3,036
0.12
.71
1.86
3.16
4.45
6.18
7.98
9.56
10.98
8.35
3.58
56.93
0.018
.499
1.05
1.19
1.10
1.14
1.24
1.35
1.38
1.44

SEDIMENTATION IN KAJAKAI RESERVOIR, AFGHANISTAN Mil
TABLE 4. Summary of 1968 Kajakai Reservoir reach data Continued
Elevation (meters)
Area Capac- Cthou- ity sands (thou-
of sands sq m) of
ac-ft)
Capac- Area ity
Coeffl- (thou- (thou- Coeffi cient sands sands cient
of of sq m) ac-ft)
Reach 9-10 to 11-11
968-----...
970--
975--- ...__
980--.
985-.- .
990-.-
995---
l,000 _
1,005.... ..
1,010... _...
1,015 .
1,020-.
1,025
1,030
1,033.5-
1,035... .......
Total
0477
918
1,140
1,305
1,416
1,523
1,614
1,708
1,810
1,918
2,019
2,125
0.96
2.83
4.17
4.96
5.52
5.96
6.36
6.73
7.13
7.56
7.98
5.88
2.52
68.56
3.51
.976
.793
.895
.956
1.01
1.05
1.08
1.11
1.15
1.19
1.21
Reach 14-14 to 14-15
968-.
970--- -.
975..- ....
980--
985. ..........
990.-
995... ....... .
1,000.
1,005. .
1,010-
1,015 ..
1,020
1,025 ..
1,030.
1,033.5-. .__._..
1,035..........
Total...
0
111
490
1,256
1,507
1,692
1,805
1,908
2,005
2,106
0.23
1.22
3.54
5.60
6.49
7.09
7.52
7.93
5.83
2.50
47.95
1.23
.792
1.76
1.91
1.19
1.18
1.20
1.22
1.27
Reach 11-11 to 12-12
0
756
1,179
1,299
1,384
1,440
1,495
1,537
1,581
1,639
1,690
1,738
1.53 1.01
3. 92 . 915
5.02 1.01
5. 44 . 978
5. 72 . 957
5. 95 . 951
6. 14 . 948
6. 32 . 925
6. 53 . 923
6. 75 . 922
4. 86 . 928
2.08
60.26
Reach 14-15 to 14-16
0
383
908
1,004
1,084
1,174
1,272
1,362
0.78 1.95
2. 62 . 952
3. 88 . 982
4. 23 . 975
4. 58 1. 01
4.96 1.06
3.74 1.11
1.60 .......
26.38
Area (thou sands
of sqm)
Capac ity
(thou sands
of ac-ft)
Coeffi cient
Reach 12-12 to 13-13
0
137
726
864
985
1,120
1,237
1,326
1,468
1,580
1,733
1,903
0.28
1.75
3.22
3.75
4.27
4.78
5.20
5.66
6.18
6.72
5.16
2.21
49.18
1.71
.917
1.02
.944
.961
1.01
1.03
1.05
1.09
1.13
1.24
Reach 14-16 to 17-17
0
40
251
274
298
323
344
371
0.08
.59
1.06
1.16
1.26
1.35
1.01
.43
6.95
0.601
.856
.881
.891
.915
.931
Area Capac- (thou- ity sands (thou- Coeffi-
of sands cient sq m) of
ac-ft)
Reach 13-13 to 14-14
0
170
973
1,148
1,352
1,596
1,773
1,894
1,983
2,098
2,223
0.34
2.19
4.17
5.07
5.98
6.83
7.43
7.86
8.27
6.13
2.63
56.90
0.869
1.76
1.41
1.60
1.70
1.63
1.64
1.63
1.64
1.75
Reach 17-17 to 18-18
0
22
810
1,082
1,320
1,538
1,763
2,050
0.04
1.69
3.84
4.87
5.79
6.69
5.41
2.32
30.65
1.14
1.54
1.71
1.92
2.09
1.49

M12 CONTRIBUTIONS TO THE HYDROLOGY OF ASIA AND OCEANIA
TABLE 4. Summary of 1968 Kajakai Reservoir reach data Continued
Elevation (meters)
968..........
970..........
975..........
980--........
985..........
990..........
995..........
1,000.. .......
1,005.........
1,010.........
1,015.........
1,020.........
1,025..........
1,030.........
1,033.5.......
1,035.........
Total..
968..........
870..........
975..........
980..........
985..........
890..........
895. ........
1,000.........
1,005.........
1,010.........
1,015........
1,020........
1,025........
1,030........
1,033.5......
1,035........
Total.
Area Capac- (thou- ity sands (thou- Coeffi-
of sands cient sq m) of
ac-ft)
Reach 18-18 to 19-19
03. 68 1. 58
. 1,8177. 85 1. 70
. 2,0558. 91 1. 76
. 2,34210. 07 1. 51
. 2,62811.39 1.85
. 2,9949. 20 1. 53
3.94 ....... 3,490
......... 55.04
Reach 22-22 to 23-23
01. 61 8. 27
7964. 48 3. 31
.. 1,4166. 44 2. 53
1 7"'05. 44 2. 69
2.33 ...... .. 2,112
20.30
Area Capac- Area Capac- (thou- ity (thou- ity sands (thou- Coeffl- sands (thou- Coeffl-
of sands cient of sands cient sq m) of sq m) of
ac-ft) ac-ft)
Beach 19-19 Reach 20-20 to 21-21 to 20-20
0 0
1 997 34 10. 25 2. 20 3. 29 1. 16
3, 059 1, 588 13.38 2.09 6.69 .956
3, 542 1, 713 15.38 2.09 7.19 .954
4, 055 1, 834 17.55 2.09 7.65 .928
4, 603 1, 940 13.88 2.12 5.73 .936
5.95...... 2.46 ......5, 176 2, 101
80. 43 33. 08
Reach 23-23 to end
0 0.05 .......
25 10. 53 24. 0
5,169 30. 50 22. 8
9,881 34. 19 27. 4
14.66 .......14,221
89.93
Area Capac- (thou- ity sands (thou- Coeffl-
of sands cient sq m) of
ac-ft)
Reach 21-21 to 22-22
0 3.32
1,638 16.45
6,480 28.19
7,427 31.11
7,921 23.12
9.91 .8,377
112. 10
4.43
4.74
6.33
5.90
6.18

SEDIMENTATION IN KAJAKAI RESERVOIR, AFGHANISTAN M13
TABLE 5. Cross-section area of sediment range lines, in square meters
Sediment range lines
Elevation(meters)
968
970
975QQAyou
985
990
995
1,000
1,005
1,010
1,015
1,020
1,025
1,030
1, 033.5
Total 1968
2-2
0233
1,530
2,510
3,100
3,760
4,540
5,040
5,490
5,920
7,080
7,540
8,360
10,050
7,200
72, 350
3-3
0116
1,310
2,400
2,960
3,120
3,430
3,560
3,750
3,930
4,310
4,710
6,460
7,830
5,610
53,500
4-4
0961
2,600
4,700
4,800
4,830
5,030
5,290
5,540
5,950
6,830
7,080
7,260
7,910
5,800
74,580
5-5
0
627
6,460
7,400
7,710
8,060
8,470
8,870
9,340
9,660
10, 030
10,600
11, 130
7,870
106,230
6-7 8-8
0
1,640
3,690
5,020
5, 440 0
5, 820 62
5,930 1,080
6, 100 2, 880
6, 400 4, 190
7, 060 5, 300
7, 350 6, 300
7, 590 7, 960
5, 230 6, 190
9-7 9-10 11-11 12-12
0
30 3,
1, 390 4,
2, 860 5,
3,480 5,
4, 230 5,
5, 220 5,
6, 670 5,
7, 560 5,
0
550 0 0
090 2, 720 329
970 5, 560 3, 020
290 5, 780 4, 200
480 6, 060 5, 070
600 6, 180 5, 790
670 6,400 6,120
760 6, 680 6, 290
890 6, 900 6, 760
7,830 6,040 7,120 7,020
7, 920 6, 080 7, 310 7, 340
5,360 4,420 5,250 5,230
67,270 33,960 52,550 58,840 65,960 57,170
13-13
0
795
2,130
2,870
3,090
3,330
3,800
3,990
4,330
4,570
3,100
32,000
Sediment range lines
968
970
975
980
985
990
995
1,000
1,005
1,010
1,015
1,020
1,025
1,030
1,033.5
Total 1968
14-14
0
358
3,070
3,230
3,690
4,570
5,060
5,330
5,510
3,890
34,708
14-15
0
797
4,250
6,290
6,990
7,240
7,460
5,320
38,350
14-16
0
1,250
1,600
1,690
1,820
1,900
1,390
9,650
17-17
0
720
880
940
1,000
1,060
780
5,380
18-18 19-19
0 0
2, 230 2, 430
4,090 5,120
4, 750 5, 380
5, 030 6, 280
5, 250 7, 060
6, 500 5, 500
27,850 31,770
20-20
0
4,190
7,440
8,440
9,690
7,560
37,320
21-21 22-22
0
1,500 0
6, 550 390
6, 630 2, 270
6, 800 3, 740
4, 690 2, 790
26, 170 9, 190
23-23
0
438
1,340
1,250
3,030
379-082 0-70-3

M14 CONTRIBUTIONS TO THE HYDROLOGY OF ASIA AND OCEANIA
HORIZONTAL CONTROL
A topographic map compiled by Fairchild Aerial Surveys, Inc., U.S.A., using stereophotogrametric methods was used as the base map. The scale of this map was 1 :50,000, with a contour interval of 5 meters. The original Fairchild triangulation stations were plotted on the map.
Prior to the 1968 hydrographic survey, the U.S. Bureau of Reclama tion of Helmand-Arghaiidab Valley Region (HAVR) recovered and placed flags on the Fairchild triangulation stations that were above the reservoir level. The bearing of the lines between triangulation sta tions were available for the 1968 survey. The azimuth of lines as com puted from the bearings are given in table 6.
TABLE 6. Azimuths to triangulation stations
[Based on the Fairchild Survey. Positions originate at F2X (at tower observation point) and are carried through the triangulation net on the assumed azimuth of 130°00' for the line F2X to F4X. Vertical datum is 1,051.79 m below station F2X elev 1,051.79 m. (See fig. 3)]
Station occupied Station observed Azimuth
F1X______________________.__ F2X ________________________ 09°13'14"F4X _ _ __-_ _ _______ __ 92°25'09"Cutinpeak_--__ _ __ __ ----- 140°30'36"
Cut in peak __ ___ ___ FIX __ _ - ___ _____-____-- 320°30'36"F2X____ ------- 344°13'11"F4X_____ - _ - _ _ 44°30'55"
_____ _---__ - 85°18'12"________--_- ___________ 130°00'00"
Cut in peak. _ __ ______ _ __ 164°13'11"FlX_ _ . -_ 189°13'14"
Cut in peak-___ _ _ _ 224°30'55"-.---_- ----------------- 272°25'09"_____ __ _______________ 310°00'00"______-_---___ _--_-----_ 347°49'40"
F5X__ __ -------- 11°49'12"_______________ -__-__-_ 46°49'39"
____---__-____ _________ 43°53'21"F5X____ --- _---------___ 104°47'21"F4X- 167°49'40"
______________ _________ 265°18'12"
F3X____ -_ _ ------- 284°47'21"F7X_ 21°02'11"F6X___ - __ - - 144°43'07"F4X__________________- ______ 191°49'12"F3X - __ -- - 284°47'21"
F6X_ ________________________ F4X_________-_-______- ______ 226°49'39"F5X____ ____ __________ __ 324°43'07"F7X__ -. 01°21'28"F8X 39°12'59"F9X ________ _______-__-._ 65°40'51"

SEDIMENTATION IN KAJAKAI RESERVOIR, AFGHANISTAN M15
TABLE 6. Azimuths to triangulation stations Continued
Station occupied Station observed Azimuth
F7X_ ________________________ F17X__ _____________ __ _____ 36°46'01"F8X_ _ _____________________ 106°17'51"F9X________ _________________ 137°42'26"F6X________ _________________ 181°21'28"F5X _________ _ --_______._- 201°02'11"F3X____ _____________ _ _____ 223°53'21"
F8X_ ________________________ F7X____--____________- ______ 286°17'51"F17X_____________ ___________ 01°54'59"F18X_ ________________ __ .__ 33°39'29"F10X____ ____________________ 97°19'14"F11X- - _.__ 124°10'27"F9X_ _____________ _ ________ 180°13'05"F6X__ _______________________ 219°12'59"F7X__ _______ _ _____________ 286°17'51"
F9X_ ________________________ F6X_________ _ _____________ 245°40'51"F7X -- ___- _ -----__ 317°42'26"F8X____-______ ______________ 00°13'05"F11X_ __________________ ___ 84°04'37"
----____________-_____ F18X_ _______________________ 97°50'02"F10X___ ____ _______________ 139°53'08"F8X______________. __________ 181°54'59"F7X__ ______ ___ ____________ 216°46'01"
__________________.___ F9X__ ______ ____ ___________ 264°04'37"F8X_ ________________ ________ 304°10'27"F10X_____________ _ _ ____ 53°30'32"F12X__ _ ___________________ 101°32'40"
___________ ___________ 281°32'40"_____________ _________ 314°54'02"
F13X___ ___ ________________ 346°17'56"F14X_ _______________________ 25°21'28"
F10X _ _____________________ F11X____ ____________________ 233°30'32"F8X__ _________________ _ ___ 277°19'14"F17X__ ______________________ 319°53'08"F18X___ _____________________ 340°33'09"F16X_ _________________ ___ _ 22°57'47"F13X_ _______________________ 76°40'42"
_______________ ___ __ 134°54'02"_____ _________________ 233°30'32"
F19X__ _ ___________________ 29°51'45'/F16X_ _______________________ 124°09'50"F10X_______ _________________ 160°33'09"F8X_ ___________ ____ _______ 213°39'29"F17X_ _______________________ 277°50'02"
F19X__ ______________________ F21X___ _____________________ 66°56'17"F20X_____ ___________________ 123°33'59'F16X_ _________ ______________ 171°12'53"
_____________ _________ 209°51'45"

Ml 6 CONTRIBUTIONS TO THE HYDROLOGY OF ASIA AND OCEANIA
TABLE 6. Azimuths to triangulation stations Continued
Station occupied Station observed Azimuth
F16X_ _ __ F19X _ . ___________ 351°12'53"F20X _ ______ 36°39'02"F15X __ _ __--_-__ 84°10'25"F14X__ _. _____ ---_ 112°26'21"F13X _ 173°20'41"F10X_______ _________________ 202°57'47"F18X ____ ____ _____ -__ _ 304°09'50"F19X_ _______________________ 351°12'53"
F13X-- _ __ F14X _ _ _ _ _ 60°09'19"F12X___ _____________________ 166°17'56"F10X _ _ _ _ _ 256°40'42"F16X_ _______________________ 353°20'41"
F14X_ __ F12X 205°21'28"F13X_ _______________________ 240°09'19"F16X . 292°26'21"F15X__ ___________-____---.__ 16°06'59"
F21X__--____-_______________ F24X_. _____________________ 63°52'50"F22X. ______________________ 109°59'00"F20X _ _ _ 175°02'35"F19X__ ______________________ 246°56'17"
F20X______ __________ F21X _ _ 355°02'35"F22X _ __ 51°43'08"F15X ___ _ _ 168°13'12"F16X _ _ 216°39'02"F19X_ ______________________ 303°33'59"F21X_ _______________________ 355°02'35"
______________________ F14X- _ __ ___ ___ 196°06'59"F16X_ _______________________ 264°10'25"F20X- _ _ 348° 13' 12"F22X_____ ___________________ 23°25'51"
______________________ F15X- .__ _____ __ _._ _ 203°26'51"F20X___ _____________________ 231°43'08"F21X___ _____________________ 289°59'00"F24X______ __________________ 341°34'41"F23X______ __________________ 23°10'03"
_---__--._____________ F25X_ _____ _____ _ ___ 05°09'59"F23X- _______________________ 68°45'21"F22X____ ____________________ 161°34'41"F21X_ _______________________ 243°52'50"
______ ______ ____ 44°07'21"F23X- ____________________ _ 121°15'21"F24X__ ____________ __ ______ 185°09'59"
F23X_______ _________________ F22X____ ____________________ 203°10'03"F24X_ . __ _ 248°45'21"F25X___ _____________________ 301°15'21"F27X_ _______________________ 06°06'56"
F23X___ _____________________ 186°06'56"F25X__ _______ ___ ___ 224°07'21"F29X _ _ _ _ _ ______ 359°08'39"F28X___ _____________________ 22°07'33"
_---_- ______ _____ 202°07'33"F29X__ ______ ________________ 247°42'49"F31X_ _______________________ 357°43'12"
______ ________________ 37°14'07"

SEDIMENTATION IN KAJAKAI RESERVOIR, AFGHANISTAN" M17
TABLE 6. Azimuths to triangulation stations Continued
Station occupied Station observed Azimuth
F29X__. _____________________ F31X_____ ___________________ 20°07'57"F28X_____ ___________________ 67°42'49"F27X_ ________.-_-.________-- 179°08'39"
F31X_. ______________________ F30X_________. ..___-_----___ 128°47'33*F28X___. _______.-__._____-__ 177°43'12"
_______. _..._______-._ 200°07'57"
F30X______________. _________ F28X _ _ ________-____--_- 217°14'07"F31X ________ ___ ___ _ _ 308°47'33"
A new triangulation net was established at the approximate high- water elevation and tied to the Fairchild triangulation net (fig. 3). The new triangulation net was necessary in order to establish a horizon tal reference system with which to correlate the 1968 survey with the Fairchild base map.
The new triangulation station network and the lines, or courses, to be sounded were plotted on an overlay of the base map. The azimuths of the lines to be sounded were determined from the overlay and re corded for use in the field.
The horizontal location of the boat in which the sonic sounder was mounted was determined by a transitman located on shore directing the boat operator, by two-way radio, on the predetermined azimuth. A standard navigational sextant (fig. -i) was used to fix the position of the boat on the line being sounded (fig. 5) .
The fathometer chart was marked by the sextant operator pressing the remote control switch mounted on the sextant (fig. 6) .
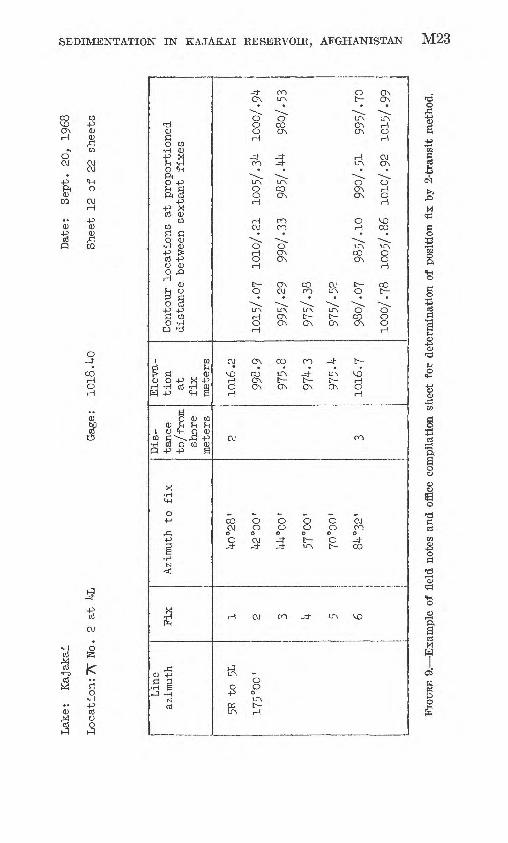
The notekeeper recorded the angle observed by the sextant operator and a fix number on the field notes (fig. 7) . The fix numbers were also recorded on the fathometer chart (fig. 6). The distance from shore was estimated and recorded for the first and last sextant 'angle observed.
An alternate method using two transits to locate the position of the boat was used (fig. 8) . The sextant operator assumed the duties of the second transitman. The transit was located on shore to observe inter secting angles over the entire length of the line being sounded. It was necessary to establish temporary triangulation stations for this purpose when the intersecting angles could not be observed over the entire length of the line being sounded from the previously established tri angulation stations.
Two-way radios were used by the first transitman to direct the boat operator along the selected course. The second transitman and note- keeper in the boat were in radio communication ; however, a different frequency was used to prevent confusing the commands given by the two transit-men, boat operator and fathometer operator-notekeeper.

M18 CONTRIBUTIONS TO THE HYDROLOGY OF ASIA AND OCEANIA
Orientation monument. /"Azimuth from F2X 0°00'
Not to scale
FIGURE 3. Sketch map of Kajakai Reservoir showing azimuth from F2X (trian- gulation station 1953 Fairchild survey) to 'orientation monument established for 1968 hydrographic and sedimentation survey.

SEDIMENTATION IN KAJAKAI RESERVOIR, AFGHANISTAN M19
FIGURE 4. Standard navigational sextant.
KAJAKAI RESERVOIR
EXPLANATION
Boat location at time of sextant observation
\Z' \
Reference point on shore observed with sextant from boat
Monument on shore at end of range line
FIGURE 5. Sketch map illustrating position fix by sextant.

M20 CONTRIBUTIONS TO THE HYDROLOGY OF ASIA AND OCEANIA
- « c -_t*_^*_ * , * s * e , <* r , » e *..--- - »e i" : " »-.- - -«--«
FIGURE 6. Fathometer chart for sediment range line 12-12 cross section.
Coordinating the time of the first and last fix marked on the fathom eter chart and the observation of the intersecting angle 'by the second transitman was accomplished by the fathometer operator giving the command by radio. The intermediate fix marks on the chart were made by the fathometer operator on command from the second transitman. The intersecting angles observed by the second transitman were trans mitted by radio to the notekeeper-fathometer operator to record on the field notes (fig. 9).
Figures 10 through 13 are photographs of other phases of fieldwork.
VERTICAL CONTROL
A continuous water-level recorder installed at the outlet tower pro vided a continuous record of the reservoir level. The water surface was determined by levels from selected Fairchild triangulation stations and compared with the level recorded at the outlet tower to determine the slope throughout the reservoir. The slope of the reservoir water surface was determined to be negligible between sediment range line 21-21 and the tower. Corrections were applied to compensate for water- surface slope upstream from this range line.

SEDIMENTATION IN KAJAKAI RESERVOIR, AFGHANISTAN M21
00
H
Q)
SPo
1 -J
& a o H-p cd o O
I-H
1CO
H d dQ)rt o
H
H COO <U
0 -ll
PM-P P!Co cd+^w !*!P! Q)O M
^P PIo5 o>o <uo >H -P
Q)
O Q)-P 0PI PIO 03 O -P
i> PI X Q) O -P -HH £ * ^
dO Q)
0) Vi !-i1 O ^H O
H o3 O tQP -P -P
0)bO
EH
Prt ^P &0X PICD oj
cn
fi
^
fl 3 H SJ -H
MOS
ON ^O
8H
OO
LfNOOH
HOJ"^^
OHOHt-0
IfNHOH
OJ ON
^O 00 H ON O ONH
dOJ
t?N 11 . ~1
j O<S H
ON VDLfN LfN
o o-* 0
H OJ
£O
0 0-P o
LfN
LfN H
OO LfN
v^
o00ON
_#-*
LfN00ON
oooo
*"^^
OONON
ON 00 OJOJ OO LfN
LfN LfN LfNON t t ON ON ON
oo oo -3-
LfN ^H- LfNt- t- t~ON ON ON
i ON ON
0 « KH LfN LfN
O O O000o o oOO LfN t--\O t~~ VO
OO -^- LT\
R.
^^LfNON ON
HLfN
OONON
OHLfNooON
t~0
oooON
t-
H 0H
d00
«1
LfN
OOLfN
o
LfN
VO
ONON
LfNHOH
OJON
0HOH
MD03
LfNOOH
CO_
"o*
o0H
3efl
Iftart

FIG
UEE
8. S
ket
ch m
ap il
lust
rati
ng p
ositi
on f
ix b
y 2-
tran
sit m
etho
d.
Lake
: Kaja
kai
Loca
tion
: TV
No.
2
atG
age:
10
18A
O
Dat
e:
Sep
t.
20,
1968
Shee
t 12
of
22
shee
ts
Line
azimut
h
5R t
o 5L
175 °00'
Fix 1 2 3 k 5 6
Azimuth
to fix
^0°2
8'
^2°0
0'
M^°00'
57°0
0'
70°0
0'
8^°3
2'
Dis
tanc
e to/from
shor
e meters
2 3
Eleva
tion
at
fix
meters
1016 .2
998.9
975.
8
97^.
3
975.
^
1016.7
Contour
locations
at p
roport
ione
d di
stan
ce b
etween se
xtan
t fi
xes
101 5
/. 07
1010/.21
10057.3^
lo
oo/.
9^
995/
-29
990/.33
98 5/.W
980/
.53
975/.3S
975/-5S
980/
.07
985/
-10
990/
.51
995/-70
10007.78
1005/.86
10107.92
10
15/.
99
FIG
URE
9.
Ex
amp
le o
f fi
eld
note
s an
d of
fice
com
pila
tion
shee
t fo
r de
term
inat
ion
of p
ositi
on f
ix b
y 2-
tran
sit
met
hod.

M24 CONTRIBUTIONS TO THE HYDROLOGY OF ASIA AND OCEANIA
FIGURE 10. Transitman directing boat on a given azimuth.
FIGURE 11. Boat with fathometer crew beginning sounder run.

SEDIMENTATION IN KAJAKAI RESERVOIR, AFGHANISTAN M25
FIGURE 12. Triangulation transitman at F2X.
FIGURE 13. Svirvey crew receiving training in transit operation.

M26 CONTRIBUTIONS TO THE HYDROLOGY OF ASIA AND OCEANIA
OFFICE PROCEDURE
The Fairchild maps were photographically transferred to a matte surface stable-base film. An overlay drafted on stable-base film was prepared for each map sheet.
The new triangulation net, location of the flags and sounding lines were plotted on the overlay. The fix locations on the sounding lines, as indicated in the field notes as sextant angles between targets (fig. 7) were plotted on the overlay by using a two-arm protractor. This method of horizontal positioning is based on the assumption that the boat is in line at the time the sextant angles are observed.
Errors in the observed angles or in the plotting of the angles were usually apparent when the proportionate distance between plotted fix locations were compared with the fix locations indicated on the fathom eter chart. Minor variations in the proportionate distances were ac ceptable and were considered due to minor variations in boat speed.
Compilation of the data recorded on the fathometer chart was accomplished in three steps.
Step 1. The chart (fig. 6) was visually inspected to determine if the zero setting as indicated on the chart remained in the correct position and if the fathometer operator switched to the correct depth range without a loss of record and maintained the gain control at the proper level. The field notes wTere correlated with the fathometer chart and notations made on the chart indicating the reservoir level at the time the soundings were obtained, and the date the soundings were made.
Step 2. The depths indicated on the chart were converted to eleva tions by using a graphical sliding scale placed on the chart in a posi tion to relate the gage height at the time the soundings were made to the zero depth as indicated on the chart. The depth indicated by the chart record was converted to elevation by the sliding scale.
The elevation at each fix mark and the position of each contour elevation to be transferred to the map were noted on the fathometer chart.
Step 3. The elevations at each fix and the contour locations at pro portionate distances between fixes were recorded on the field note sheet.
A variable scale, or a 10-point divider, was used to determine the contour locations at proportionate distances between fixes. The data recorded opposite fix 2 (figs. 7, 9), 1015/.07, 1010/.21, 1005/.34, 1000/.94, indicated that the 1,015-m contour was located 0.07 of the distance between fix 1 and fix 2 and the 1,010-, 1,005-, and 1,000-m contours were at the proportional distances between fix 1 and fix 2 of 0.21, 0.34, and 0.94, respectively.
The proportionate distance between fixes, determined from the re corder chart for each contour location, was transferred to the overlay.

SEDIMENTATION IN KAJAKAI RESERVOIR, AFGHANISTAN M27
Where more definition of the under-water contours was required, addi- tipnal lines to be sounded were plotted on the overlay and the azimuth determined.
SEDIMENTATION
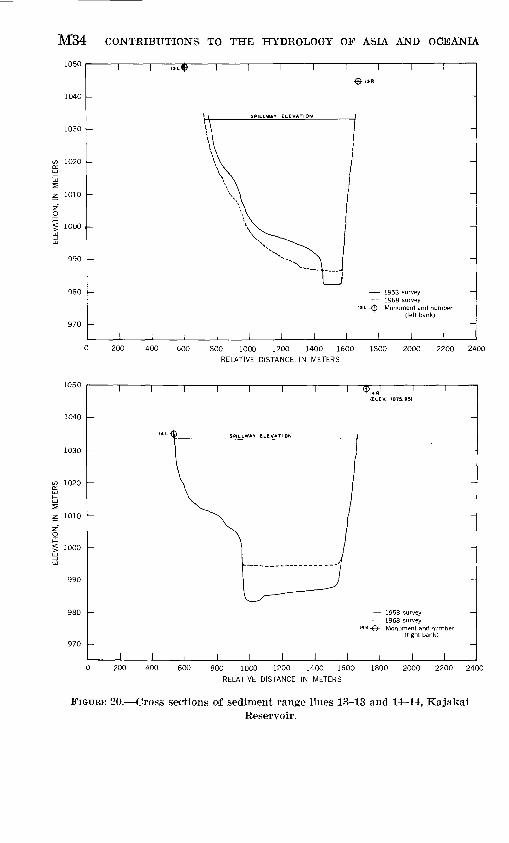
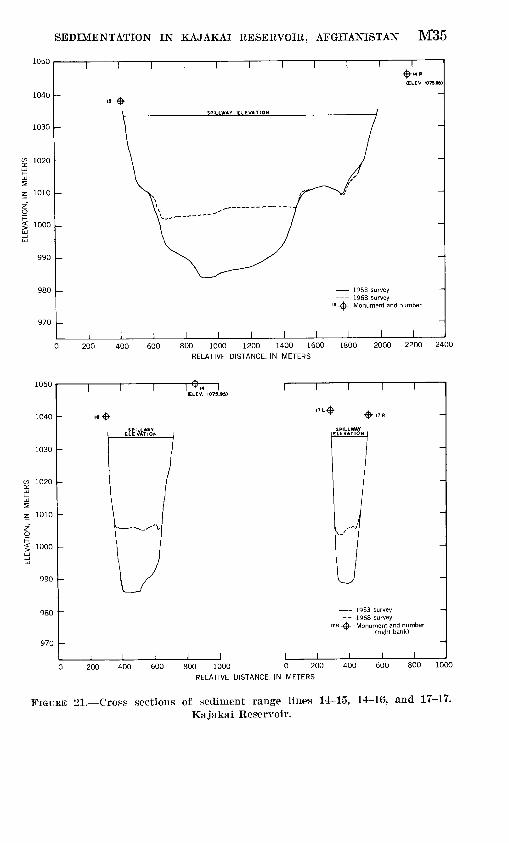
One of the objectives of the survey was to establish permanent sedi ment range lines which could be resurveyed at any later date to deter mine future rates of sediment deposition. Location of range lines was based on probable representativeness of the cross sections to the reach upstream and downstream. Cross-section areas of these range lines are related to capacity in adjacent reaches. Cross sections of all sediment range lines are shown in figures 14 through 24.
Figure 25 shows the relation between the original streambed, or thalweg, profile and the 1968 profile, as determined by this survey. Locations of sediment range lines are indicated. Kange lines were established uplake only to the point where the current and original streambed elevations coincided. This point was determined to be at about elevation 1,025 m and about 45,000 m thalweg distance from the dam.
Depths of deposited material reached a maximum at about range line 14-16 (fig. 21) where the average depth of sediment in the cross section was 18.5 m. The leading edge of the deposition was at cross section 11- 11 (fig. 19). The most active area of deposition was in the delta area formed where the river enters the reservoir. Position of this active delta is governed by reservoir elevation and river discharge. The rate of movement of the delta becomes more rapid when the i'eservoir elevation is low and river discharge is high. During that period of the year when river discharge becomes significantly greater than releases, the reservoir elevation rises rapidly, and the delta movement into the lake slows as more deposition occurs at the higher elevations upstream. As the elevation of the reservoir drops, a part of the sediment de posited in the upstream reaches is carried further into the reservoir. The two small deltas at elevations 1,010 and 1,015 m (fig. 25) are the relatively recent effects of the latter phenomena.
Movement of the leading edge of the deposit, in that reach between range lines 12-12 and 14-15, will not advance appreciably until the secondary deltas between range lines 19-19 and 21-21 are moved to range line 14-15. This may occur rapidly if the water level in the reservoir is drawn down to an elevation of 1,005 m or less for 2 or more years in succession. However, if the minimum reservior elevation is not drawn down below about 1,015 m for a number of years, delta en croachment to the narrows will be slower because the sediments would be deposited as bernis in the upstream river channel between range line 21-21 and some point upstream of where the current profiles coincide.

M28 CONTRIBUTIONS TO THE HYDROLOGY OF ASIA AND OCEANIA
1050
1030
< 1000
i \ i ( i i i i r
1953 survey 1968 survey-- Monument and number
J____L J____L0 200 400 600 800 1000 1200 1400 1600 1800 2000 2200 2400
RELATIVE DISTANCE, IN METERS
en 1020
990
Monument beyond limit of illustration
1953 survey 1968 survey
' "-&- Monument and number (right bank)
0 200 400 600 800 1000 1200 1400 1600 1800 2000 2200 2400 RELATIVE DISTANCE, IN METERS
FIGUKE 14. Cross sections of sediment range lines 1-1 and 2-2, KajakaiReservoir.

SEDIMENTATION IN KAJAKAI RESERVOIR, AFGHANISTAN M29
gi-< 1000
1953 survey 1968 survey
i <J)- Monument and number (left bank)
SPILLWAY ELEVATION
0 200 400 600 800 1000 1200 1400 1600 1800 2000 2200 2400
RELATIVE DISTANCE, IN METERS
1050 i-
Z 1010
S 1000
1953 survey 1968 survey
R -(b- Monument and number (right bank)
0 200 400 600 800 1000 1200 1400 1600 1800 2000 2200 2400 RELATIVE DISTANCE, IN METERS
FIGURE 15. Cross sections of sediment range lines 3-3 and 4 i, KajakaiReservoir.

M30 CONTRIBUTIONS TO THE HYDROLOGY OF ASIA AND OCEANIA
SR'IIIIIII I I I SI
1000
1953 survey- 1968 survey*-£&- Monument and number
(right bank)
I______I______I
0 200 400 600 800 LOGO 1200 1400 1600 1800 2000 2200 2400 RELATIVE DISTANCE, IN METERS
1040^-
I I I I I I I
0 200 400 600 800 1000 1200 1400 1600 1800 2000 2200 2400 RELATIVE DISTANCE, IN METERS
FIGURE 16. Cross sections of sediment range lines 5-5 and 6-6, KajakaiReservoir.

SEDIMENTATION IN KAJAKAI RESERVOIR, AFGHANISTAN M31
1050
1010
< 1000
i i i i I i r
1953 survey 1968 survey
6 L -A- Monument and number (left bank)
200 400 600 800 1000 1200 1400 1600 1800 2000 2200 2400
RELATIVE DISTANCE, IN METERS
1030 -
< 1000
1953 survey 1968 survey
IL -^- Monument and nui (left bank)
0 200 400 600 800 1000 1200 1400 1600 1800 2000 2200 2400 RELATIVE DISTANCE, IN METERS
FIGURE 17. Cross sections of sediment range lines 6-7 and 8-8, KajakaiReservoir.

M32 CONTRIBUTIONS TO THE HYDROLOGY OF ASIA AND OCEANIA
1953 survey 1968 survey Monument and r
0 200 400 600 800 1000 1200 1400 1600 1800 2000 2200 2400 RELATIVE DISTANCE. IN METERS
i r
0 200 400 600 800 1000 1200 1400 1600 1800 2000 2200 2400 RELATIVE DISTANCE, IN METERS
FIGURE 18. Cross sections of sediment range lines 9-7, and 9-10, KajakaiReservoir.

SEDIMENTATION IN KAJAKAI RESERVOIR, AFGHANISTAN M33
1050
1030
tn 1020
< 1000
in 1020
1953 survey 1968 survey ' (D 1 Monument and number
(right bank)
0 200 400 600 800 1000 1200 1400 1600 1800 2000 2200 2400 RELATIVE DISTANCE, IN METERS
1953 survey 1968 survey
I2R-4). Monument and numbe (right bank)
0 200 400 600 800 1000 1200 1400 1600 1800 2000 2200 2400 RELATIVE DISTANCE, IN METERS
FIGURE 19. Cross sections of sediment range lines 11-11 and 12-12, KajakaiReservoir.
M34 CONTRIBUTIONS TO THE HYDROLOGY OF ASIA AND OCEANIA
z 1010
"1 T I T
'x-4~~>
1953 survey 1968 survey
L -(fo- Monument and number (left bank)
J______I J______I
200 400 600 800 1000 1200 1400 1600 1800 2000 2200 2400
RELATIVE DISTANCE, IN METERS
1030 -
tr, 1020a.
fc5z 1010
I 1 I I I T
J ______ I
IELEV. 1075.95)
1953 survey 1968 survey
R -d>- Monument and number fright bank)
I ______ I J ____ J
0 200 400 600 800 1000 1200 1400 1600 1800 2000 2200 2400
RELATIVE DISTANCE, IN METERS
FIGURE 20. Cross sections of sediment range lines 13-13 and 14-14, KajakaiReservoir.
ELE
VA
TIO
N,
IN
ME
TE
RS
ELE
VA
TIO
N,
IN
ME
TE
RS

M36 CONTRIBUTIONS TO THE HYDROLOGY OF ASIA AND OCEANIA
1040
1030
1010
< 1000
1953 survey- 1968 survey
L -d>- Monument and numbe (left bank)
0 200 400 600 800 1000 1200 1400 1600 1800 2000 2200 2400
RELATIVE DISTANCE, IN METERS
1030
<s> 1020
z 1010
1000
970
T I I
1953 survey 1968 survey
"-{j>- Monument and numbe (right bank)
0 200 400 600 800 1000 1200 1400 1600 1800 2000 2200 2400 RELATIVE DISTANCE, IN METERS
FIGURE 22. Cross sections of sediment range lines 18-18 and 19-19, KajakaiReservoir.

ELE
VA
TIO
N,
IN
ME
TE
RS
ELE
VA
TIO
N,
IN
ME
TE
RS
e- ~
£
°
J___I_
__I_
__I
I I

M38 CONTRIBUTIONS TO THE HYDROLOGY OF ASIA AND OCEANIA
1010
1953 survey - 1968 survey
'"-&- Monument and numbeT (right bank)
0 200 400 600 800 1000 0 200 400 600 800 1000
RELATIVE DISTANCE, IN METERS
FIGURE 24. Cross sections of sediment range lines 22-22 and 23-23, KajakaiReservoir.

SEDIMENTATION IN KAJAKAI RESERVOIR, AFGHANISTAN M39
Spillway elevation 1033.5 meters
1953 Profile--- 1968 Profile
10.000 20.000 30.000THALWEG DISTANCE UPSTREAM OF DAM. IN METERS
FIGURE 25. Profile of sediment distribution along Helmand River channel through Kajakai Reservoir.
Samples of the deposited lake-bed material were obtained with a Foerst bed-material sampler. The sampler was raised and lowered by means of a U.S. B-54 sounding reel powered by a 12-volt power unit. Reel, power unit, and sampler were attached to a simple pipe crane which was mounted on the boat (fig. 26). Samples were collected throughout the reservoir, from the river at the confluence and in the river channel upstream of the reservoir. Core samples of the sediment deposits in the reservoir were not obtained because of funds and time limitations.
Samples of the lake-bed material were not analyzed for particle-size distribution other than to determine the percentage passing a 63 micron sieve. These samples were virtually all identical in composition, 99.4 percent limestone clays and silts and 0.6 percent coarser than 63 micron. Estimated density of these fine-material surface deposits was 30-50 (Ib per cu ft), or 480-800 (kg per cu m). Apparently, much of this material originates from the banks of the reservoir, being sorted and washed out of the natural soils by wave action. ,
Samples taken from the area of the river confluence and the river channel upstream were analyzed for particle-size distribution by wet- sieve method. Results of these analyses are given in table Y.

M40 CONTRIBUTIONS TO THE HYDROLOGY OF ASIA AND OCEANIA
-**
FIGURE 26. Foerst bed-material sampler in use.
TABLE 7. Particle-size analyses of bed-material samples of Helmand River
Percent finer than indicatedsize (microns)
Location of sample63 125 250 500
Confluence with river at elev 1,015 m______________ 75. 3 98. 6 99. 8 100Do-_-_____________________________._______ 77. 5 98.8 99.9 100
Dry sample deposited about 1,600 m upstream of range line 23-23____________________ 11.6 93.9 99.9 100
River channel at elev 1,026 m__ _________________ 4.2 63.1 99.2 100
Upstream of sediment range line 23-23, the bed of the river channel consists largely of rock and gravel with only minor deposits of sands and silts. Virtually all material finer than about 0.5 millimeter is car ried in suspension into the upper reaches of the reservoir. During periods when the reservoir elevation is at, or above, spillway elevation, river discharge is also high, and most of the sands carried in suspen sion are deposited in the old river flood plain (fig. 27). To date, these deposits appear to be relatively insignificant in terms of reducing the useful capacity. Measurement of the volumes of sediment deposited in the reservoir area upstream from sediment range line 23-23 was not undertaken in the 1968 survey. Figure 24 is an illustration of typical cross sections in the upper reservoir reaches where berms of fine sand and clay are found in the flood-plain areas.

SEDIMENTATION IN KAJAKAI RESERVOIR, AFGHANISTAN M41
FIGUKE 27. Sediment deposited along river flood plain near range line 22-22.
FUTURE SEDIMENTATION
As shown in table 1, the results of the 1968 survey indicated a loss in capacity of 7.0 percent at the spillway elevation 1,033.5 meters. Owing to discrepancies found in several original contours, however, this indicated loss in capacity cannot be used strictly as a loss due to sediment deposition. Refinement of original contours resulted in an increase in capacity in those reaches between range lines 5-5 and 13-13 of 'about 13,600 acre-feet (figs. 16-18). Applying this correction to the original capacity of 1,495,000 acre-feet at spillway elevation results in a loss due to sediment deposition of 7.8 percent, or a sediment deposition of 117,700 acre-feet during the first 15 years of storage. This was an average annual loss in capacity below spillway elevation of about 7,800 acre-feet per year. Assuming an average sediment density of 50 Ib per cu ft, the average annual sediment inflow was about 8,500,000 tons per year.
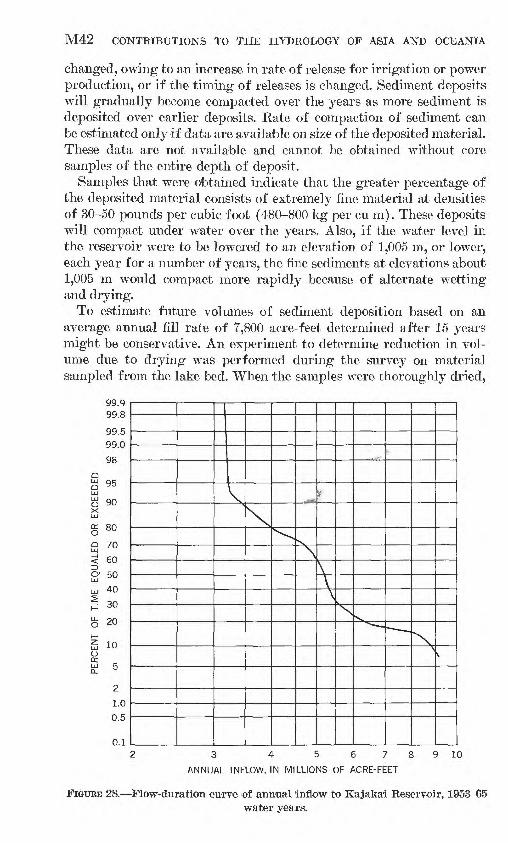
A flow-duration curve (fig. 28) based on data given in table 8 shows that the average annual inflow to Kajakai Reservoir for the period 1953-1965 was 5,200,000 acre-feet. Assuming that inflow characteristics do not change appreciably over the next 15-year period, it is probable that the sediment inflow will average about 8,500,000 tons (7,700,000 metric tons) per year during that period. Future rate of change in capacity, however, may vary considerably if reservoir operation is
M42 CONTRIBUTIONS TO THE HYDROLOGY OF ASIA AND OCEANIA
changed, owing to an increase in rate of release for irrigation or power production, or if the timing of releases is changed. Sediment deposits will gradually become compacted over the years as more sediment is deposited over earlier deposits. Bate of compaction of sediment can be estimated only if data are available on size of the deposited material. These data are not available and cannot be obtained without core samples of the entire depth of deposit.
Samples that were obtained indicate that the greater percentage of the deposited material consists of extremely fine material at densities of 30-50 pounds per cubic foot (480-800 kg per cu m). These deposits will compact under water over the years. Also, if the water level in the reservoir were to be lowered to an elevation of 1,005 m, or low^er, each year for a number of years, the fine sediments at elevations about 1,005 m would compact more rapidly because of alternate wetting and drying.
To estimate future volumes of sediment deposition based on an average annual fill rate of 7,800 acre-feet determined after 15 years might be conservative. An experiment to determine reduction in vol ume due to drying was performed during the survey on material sampled from the lake bed. When the samples were thoroughly dried,
99.8
99.5
99.0
QQ yD
UJ UJ Qn
XUJ
g 80
Q 70UJ< 60
0- 50UJ
uj 40 j| 30
Lj- or\
Z 1nO cc.uj 5
2
1.0
0.5
0.1
\\
^V
\
f
V\
X -^^ ~~ --- Nv
V
3 4 5678
ANNUAL INFLOW, IN MILLIONS OF ACRE-FEET
10
FIGTJBE 28. Flow-duration curve of annual inflow to Kajakai Reservoir, 1953-65water years.
SEDIMENTATION IN KAJAKAI RESERVOIR, AFGHANISTAN M43
TABLE 8. Summary of annual inflow to Kajakai Reservoir
Water year
1953__ __ _______ ___ ______1954________________________1955__________--_____-______1956__ _ _ _ _ __ ____ __._1957 1958_ 1959 _____ ___ __ _____ _1960___-----__--__-__-______1961__________-_____________1962________________________1963___--____________-______1964 __ __1965__ _ __ _ ____________1966
Helmand River near Dehraout
(acre-feet)
_______ 3,896,000_______ 4,932,000_______ 3,575,000_ ____ 5,295,000__ ____ 8, 589, 000___ ___ 4,949,000_ _ ___ 4,548,000____ _ 4,411,000__ ___ 4,591,000__ __ 2,999, 000_ __ __ 3,119,000_______ 4,784,000_______ 7,171,000_____ _ 3, 110, 000 .
Tirin River at Dehraout
(acre-feet)
260, 000591, 000221, 000657, 000470, 000302, 000455, 000324, 000544, 000176, 000182, 000371, 000704, 000
Total (acre-feet)
4, 156, 0005, 523, 0003, 796, 0005, 952, 0009, 059, 0005, 251, 0005, 003, 0004, 735, 0005, 135, 0003, 175, 0003, 301, 0005, 155, 0007, 875, 000
the average percent reduction in volume was 53 percent. This value was used as a basis for estimating reduction in volume of deposits due to alternate wetting and drying.
Based on data that have been presented in this report, an estimated rate of compaction, and the assumption that hydrologic conditions in the reservoir drainage area do not change appreciably, the principal delta front will reach the irrigation outlet (about elev 968 m) in 40-45 years. At the end of this 40- to 45-year period, it is estimated that the reservoir capacity at spillway elevation will be reduced to about 1,200,000 acre-feet. It is recommended that a resurvey of sediment range lines be made at some time during the period 1973-75, especially if changes in reservoir operation are made during the next few years.
U.S. GOVERNMENT PRINTING OFFICE-.1970 O 379-082