Geology and Hydrogeology of the Caribbean Islands Aquifer ...

Hydrogeology and Analysis of AquiferCharacteristics in West-Central PinellasCounty, Florida
By James C. Broska and Holly L. Barnette
U.S. Geological Survey
Open-File Report 99–185
Prepared in cooperation with
PINELLAS COUNTY
Tallahassee, Florida1999

U.S. DEPARTMENT OF THE INTERIOR
BRUCE BABBITT, Secretary
U.S. GEOLOGICAL SURVEY
Charles G. Groat, Director
The use of firm, trade, and brand names in this report is for identification purposesonly and does not constitute endorsement by the U.S. Geological Survey.
For additional information Copies of this report can bewrite to: purchased from:
District Chief U.S. Geological SurveyU.S. Geological Survey Branch of Information ServicesSuite 3015 Box 25286227 North Bronough St. Denver, CO 80225Tallahassee, FL 32301 888-ASK-USGS

Contents III
CONTENTS
Abstract ................................................................................................................................................................ 1Introduction .......................................................................................................................................................... 1
Purpose and Scope ...................................................................................................................................... 2Description of the Study Area..................................................................................................................... 2
Hydrogeologic Framework .................................................................................................................................. 2Surficial Aquifer System............................................................................................................................. 2Intermediate Confining Unit ....................................................................................................................... 2Floridan Aquifer System............................................................................................................................. 6
Zone A ............................................................................................................................................... 6Zone B................................................................................................................................................ 6
Delineation of Hydrogeologic Units Underlying the Study Area............................................................... 6Water-Quality Sampling..................................................................................................................... 7Geophysical Logging ......................................................................................................................... 9Specific-Capacity Tests ......................................................................................................................11Aquifer Test........................................................................................................................................11
Analysis of Aquifer Characteristics .....................................................................................................................13Numerical Methods.....................................................................................................................................13Conceptual Model .......................................................................................................................................15Design of Numerical Model........................................................................................................................15Initial and Boundary Conditions .................................................................................................................15Model Parameters .......................................................................................................................................17Simulation of Aquifer Test..........................................................................................................................18Sensitivity Analysis.....................................................................................................................................18Model Limitations.......................................................................................................................................20
Summary ..............................................................................................................................................................22References Cited ..................................................................................................................................................22
Figures1. Map showing location of the study area in west-central Pinellas County, well names, and
hydrogeologic sectionA-A′...................................................................................................................... 32. Chart showing generalized stratigraphic and hydrogeologic section underlying the Walsingham
Park test site, Pinellas County, and equivalent model units ....................................................................43. Section showing hydrogeologic units underlying the study area correlated to natural-gamma ray
log traces for sectionA-A′ in Pinellas County ......................................................................................... 54. Map showing Walsingham Park test site, including location of wells drilled during the field
investigation, and location of off-site monitor well................................................................................. 75. Diagram showing generalized section view of casing depths and final depths of wells at the
Walsingham Park test site ........................................................................................................................ 86-10. Graphs showing:
6. Relation of dissolved solids and depth from water samples collected during drilling ofWalsingham Park deep exploratory well (WPMW-1)...................................................................... 9
7. Relation between dissolved solids and specific conductance of selected water samples collectedduring drilling of Walsingham Park deep exploratory well (WPMW-1) ......................................... 9
8. Geophysical logs of Walsingham Park deep exploratory well (WPMW-1).....................................10

IV Contents
9. Water levels in all monitor wells before, during, and after the 9-day aquifer test........................... 1210. Changes in specific conductance during the 9-day aquifer test at Walsingham Park Test
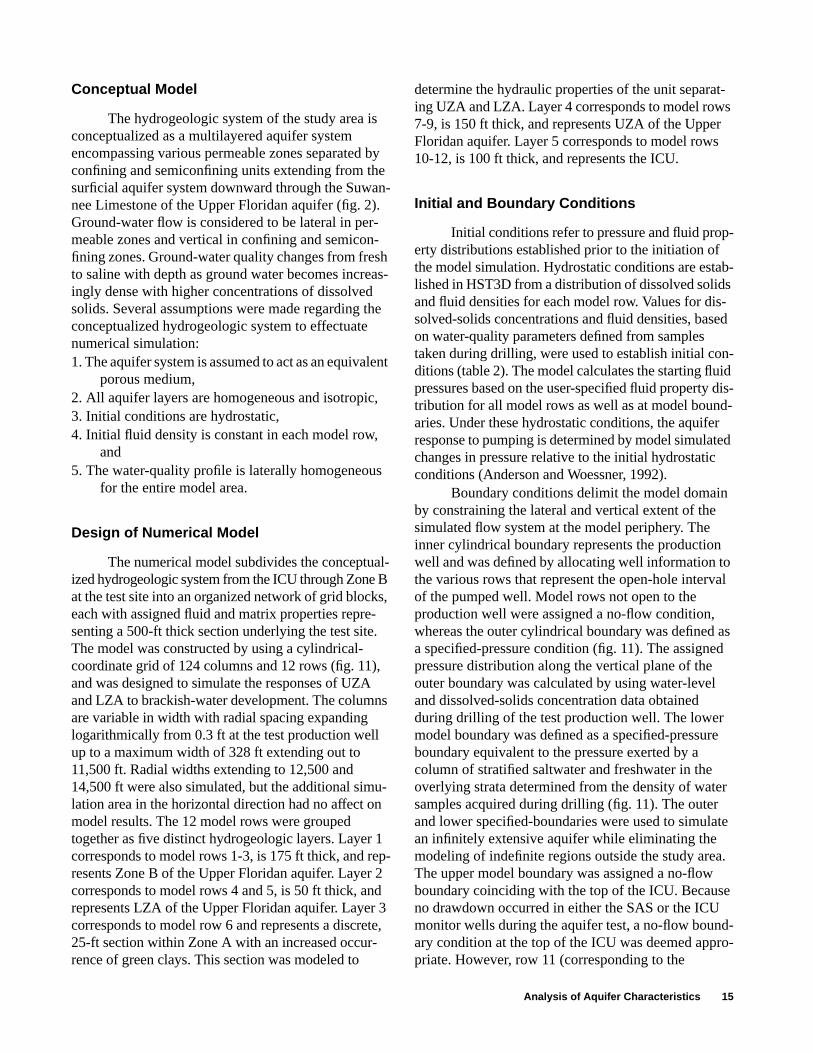
Production Well and Walsingham Park Monitor Wells 1 and 2 ...................................................... 1411. Section showing model grid, simulated open-hole intervals, and boundary conditions used in
the HST3D simulation............................................................................................................................. 1612-14. Graphs showing:
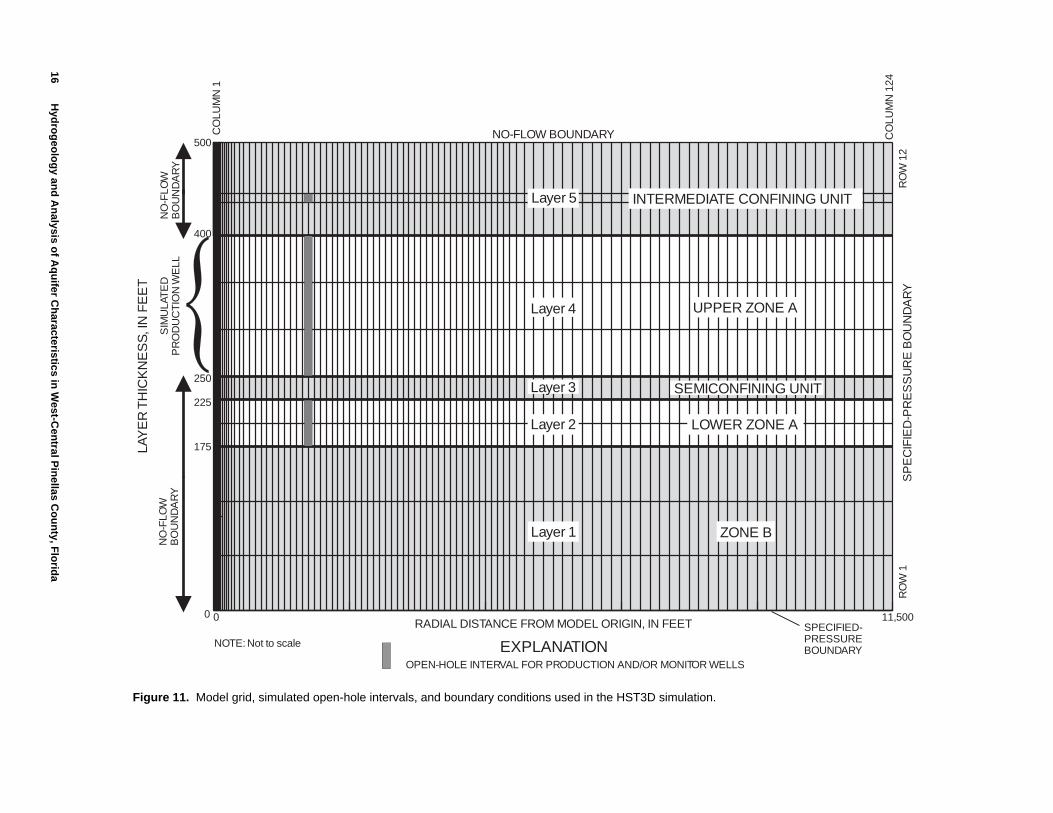
12. Simulated and observed water levels during drawdown and recovery periods at selectedwells during the 9-day aquifer test................................................................................................... 19
13. Simulated and observed water levels in selected monitor wells during the 9-day aquifer test ....... 2014. Sensitivity of simulated water levels to changes in selected model input parameters .................... 21
Tables1. Results from specific capacity and packer tests from the deep exploratory well ........................................... 112. Values for model parameters used to establish initial conditions and values for calibrated
model parameters............................................................................................................................................ 173. Simulated and corrected observed drawdown and recovery for selected monitor wells during the
9-day aquifer test ............................................................................................................................................ 18

Contents V
CONVERSION FACTORS, VERTICAL DATUM, AND ADDITIONAL ABBREVIATIONS
Temperature can be converted between degrees Fahrenheit (oF) and degrees Celsius (oC) as follows:oF = 9/5 (oC ) + 32oC = 5/9 (oF - 32)
Sea level: In this report, “sea level” refers to the National Geodetic Vertical Datum of 1929 (NGVD of 1929)—a geodetic datum derived from a general adjustment of the first-order level nets of the United States and Canada,formerly called Sea Level Datum of 1929.
ADDITIONAL ABBREVIATIONS
Multiply inch-pound unit By To obtain
inch per year (in/yr) 25.4 millimeter per year
inches squared per pound (in2/lb) 1.45x10⁻⁴ square meter per Newton
foot (ft) 0.3048 meter
foot per day (ft/d) 0.3048 meter per day
foot per day per foot (ft/d)/ft 0.3048 meter per day per meter
foot squared per day (ft2/d) 0.093 meter squared per day
cubic feet per day (ft3/d) 0.02832 cubic meter per day
pound per cubic foot (lb/ft3) 16.02 kilogram per cubic meter
gallon per minute (gal/min) 5.45 cubic meter per day
million gallons per day (Mgal/d) 0.04381 cubic meters per second
ICU = Intermediate confining unit
SAS = Surficial aquifer system
LZA = Lower Zone A
UZA = Upper Zone AUSGS = U.S. Geological Surveymg/L = milligrams per liter
µS/cm = microsiemens per centimeter

VI Contents

Introduction 1
Hydrogeology and Analysis of Aquifer Characteristics inWest-Central Pinellas County, Florida
By James C. Broska and Holly L. Barnette
ABSTRACT
The U.S. Geological Survey, in cooperationwith Pinellas County, Florida, conducted an inves-tigation to describe the hydrogeology and analyzethe aquifer characteristics in west-central PinellasCounty. A production test well and four monitorwells were constructed in Pinellas County at Wals-ingham Park during 1996-97. Water-quality sam-pling, static and dynamic borehole geophysicalsurveys, and hydraulic tests were conducted at thewells to delineate the hydrogeology at Walsing-ham Park. A 9-day aquifer test was conducted todetermine the hydraulic characteristics of the aqui-fer system and observe the changes in water qual-ity due to pumping.
A numerical model was constructed to simu-late the aquifer test and calculate values forhydraulic conductivity and storage coefficient forpermeable zones and confining units at Walsing-ham Park. Final calibrated values for hydraulicconductivity for the different permeable zones andconfining units at the test site were 18 feet per dayfor Upper Zone A, 750 feet per day for LowerZone A, 1 foot per day for Zone B, 1x10⁻⁴ feet perday for the intermediate confining unit, and 10 feetper day for the semiconfining unit separatingUpper Zone A and Lower Zone A. Final calibratedvalues for storage coefficient were 3.1x10⁻⁴ forUpper Zone A, 8.6x10⁻⁵ for Lower Zone A,2.6x10-5 for Zone B, 3.1x10⁻⁴ for the intermediateconfining unit, and 4.3x10⁻⁵ for the semiconfiningunit separating Upper Zone A and Lower Zone A.Estimates of transmissivity for Upper Zone A andLower Zone A were about 2,500 and 37,500 feetsquared per day, respectively.
INTRODUCTION
Pinellas County, located in west-central Florida,has limited potable water supplies and is dependent onwater delivered from Tampa Bay Water (formerlycalled the West Coast Regional Water SupplyAuthority) which withdraws water from neighboringinland counties to meet the water demands of a largepopulation. Although the population of PinellasCounty has not increased significantly since 1990,during the period from 1970 to 1990 the population ofPinellas County increased from 552,329 to 851,659(University of Florida, 1991). In 1990, the countyreceived a total of 78 Mgal/d of water from Hillsbor-ough and Pasco Counties (Marella, 1992). To alleviatesome of the demand for this delivered water, PinellasCounty is exploring the possibility of using thebrackish-water resources within the Upper Floridanaquifer underlying the county.
Brackish waters (water with dissolved-solidsconcentrations between 1,000 and 10,000 mg/L) arefound in the Upper Floridan aquifer at depths rangingfrom about 100 to 400 ft below land surface in centralPinellas County (Cherry and others, 1970). The devel-opment of these brackish-water resources throughlow-pressure reverse osmosis could provide a sourceof potable water. Low-pressure reverse osmosis is aprocess of forcing water through a membrane toremove dissolved solids, thus purifying the water;however, the process is economically practical onlywhen dissolved-solids concentrations are less than7,000 mg/L (D. Slonena, Pinellas County Utilities,written commun., 1998).
A production test well and four monitor wellswere constructed in 1996-97 at Walsingham Park inwest-central Pinellas County. The wells were sub-jected to various geologic investigation methods todetermine the hydrogeology at the test site and theviability of brackish-water development in the area.

2 Hydrogeology and Analysis of Aquifer Characteristics in West-Central Pinellas County, Florida
Purpose and Scope
This report presents the results of a study by theU.S. Geological Survey (USGS), in cooperation withPinellas County, to evaluate the brackish-waterresources underlying the Walsingham Park study areain west-central Pinellas County. Results from the fieldinvestigation and numerical simulation to determineaquifer characteristics at the Walsingham Park test sitecould provide valuable information for future develop-ment of brackish water in Pinellas County and in othercoastal counties in west-central Florida. The reportincludes: descriptions of the hydrogeologic frameworkof the study site, hydraulic characteristics of the aqui-fer system, and description of the ground-waterquality.
The objectives of this report are to1.) describe the hydrogeology at the test site, and2.) evaluate an aquifer test conducted in the Upper
Floridan aquifer at the test site.
Description of the Study Area
Pinellas County is a peninsula in west-centralFlorida bounded by Tampa Bay to the east and theGulf of Mexico to the west (fig. 1). The county is partof the Gulf Coastal Lowlands physiographic regiondescribed by White (1970) which consists of lowangle scarps and terraces formed during severalPleistocene sea-level stands. The climate of PinellasCounty is subtropical with an average rainfall of53 inches per year (in/yr). Most rainfall occurs duringthe summer months between June and September(Causseaux and Fretwell, 1983). Land surface eleva-tion at the Walsingham Park test site is about 55 ftabove sea level.
HYDROGEOLOGIC FRAMEWORK
The geology of Florida consists of a pre-Meso-zoic igneous and metamorphic basement and an over-lying thick sequence of sedimentary units depositedduring transgressive and regressive episodes (Heathand Smith, 1954). The hydrogeologic frameworkunderlying the study area consists of Eocene oryounger-age rocks and makes up the surficial aquifersystem, the intermediate confining unit, and the Flori-dan aquifer system (fig. 2). This multilayered systemconsists of several permeable zones interbedded withzones of variable permeability that function as eitherconfining units or semiconfining units. A semiconfin-
ing unit in this report refers to lower-permeabilitycarbonate units that do not produce large quantities ofwater to wells when pumped (Knochenmus and Swen-son, 1996). The hydrogeologic information compiledfrom wells at the test site was correlated with hydro-geologic information from previous studies in west-central Pinellas County. A generalized hydrogeologicsection, oriented north-south, was constructed fromnatural-gamma geophysical logs (fig. 3).
Surficial Aquifer System
The surficial aquifer system (SAS) in PinellasCounty is the shallowest water-bearing formation inthe study area and consists of undifferentiated sandsand clays which change in composition laterally andvertically (Causseaux, 1985). The post-Miocene agesurface deposits in Pinellas County lie unconformablyabove the Hawthorn Group. Surface deposits are char-acterized by a base of marginal marine beds overlainby sandy, marine terrace deposits and capped by aeo-lian sand deposits. The thickness of the SAS, whichranges from a few feet to 50 ft, restricts the amount ofpotable water the aquifer supplies; however, the non-potable water is utilized for irrigation (Gilboy, 1985).The SAS at the Walsingham Park site is about 35 ftthick. Throughout Pinellas County, the water table isless than 15 ft below land surface during dry periodsand close to land surface during wet periods. Precipi-tation is the main source of recharge.
Hydraulic properties of the SAS are highly vari-able due to the diversity in physical characteristics ofthe sediments. Grain size, sorting, and thickness varythroughout the system and greatly influence the per-meability and porosity of the system. Values for spe-cific yield range from 0.1 to 0.35 (Causseaux, 1985).Horizontal hydraulic conductivity is estimated torange from 13 to 33 ft/d (Cherry and Brown, 1974;Sinclair, 1974) and vertical hydraulic conductivity isestimated to range from 0.36 to 13 ft/d (Sinclair, 1974;Hutchinson and Stewart, 1978).
Intermediate Confining Unit
The surficial and Floridan aquifer systems areseparated by the low-permeability intermediate con-fining unit (ICU). The ICU occurs within the upperMiocene undifferentiated Arcadia Formation of theHawthorn Group. The formation consists of interbeddedquartz sands, clays, and carbonates. The clay beds inthe Arcadia Formation act as confining beds

Hydrogeologic Framework 3
throughout Pinellas County (Heath and Smith, 1954).The thickness of the ICU averages about 90 ft andranges from 50 to 140 ft. At the Walsingham Park site,the ICU is about 100 ft thick. Due to the heteroge-neous nature of the unit, a wide range of hydraulicproperties has been reported. Vertical hydraulic con-
ductivity for the ICU ranges from 1.3x10⁻⁴ to 6.9x10⁻³
ft/d (Sinclair, 1974; Black, Crow and Eidness, Inc.,1978). Leakance values reported in previous investi-gations range from 1x10⁻⁵ to 1.5x10⁻² (ft/d)/ft (Black,Crow and Eidness, Inc., 1978; Seaburn and Robertson,Inc., 1983; Brown and Associates, Inc., 1986).
0 1 2 3 MILES
0 1 2 3 KILOMETERS
Walsingham Rd.
Ulmerton Rd.
US 19
US
19
ALT
. 19
E. Bay Dr.
Gulf to Bay Blvd.
Park Blvd.
66th
St.S
R 6
95
W. Bay Dr.G
ulf B
lvd.
LakeSeminole
Cro
ss B
ayou
Long Bayou
Base from SWFWMD digital data, 1:250,000, 1992Albers Equal-Area Conic projectionStandard Parallels 29°30′ and 45°30′, central meridian -83°00′
A
A'
ClearwaterDeep 27
TR 13-1
McKayCreek
MC-OS-1
WPMW-1
South CrossBayou
Bear Creek
StudyArea
Indi
an R
ocks
Rd.
TIDAL STAGEMEASUREMENT
SITE ATINDIAN ROCKS BEACH
WalsinghamPark
Intracoastal Waterway
WPMW-1
TampaBay
A A'G
ULF
OF
ME
XIC
O
PinellasCounty
Area Shown
Florida
EXPLANATION
WELL LOCATION AND NAME
LINE OF SECTION
Tampa Bay
Figure 1. Location of the study area in west-central Pinellas County, well names, and hydrogeologicsection A-A′.

4 Hydrogeology and Analysis of Aquifer Characteristics in West-Central Pinellas County, Florida
Figure 2. Generalized stratigraphic and hydrogeologic section underlying the Walsingham Park testsite, Pinellas County, and equivalent model units (modified from Knochenmus and Swenson, 1996).
HYDROGEOLOGICUNIT
SERIES STRATI-
UNIT
PERMEABLE MODELUNIT
100
SEA
100
200
300
400
500
PLEISTOCENE
MIOCENE
OLIGOCENE SUWANNEELIMESTONE
HA
WT
HO
RN
GR
OU
P
TAMPAMEMBEROF THE
ARCADIAFORMATION
UNDIFFER-ENTIATEDARCADIA
FORMATION
UNDIFFERSANDS & CLAY
SURFICIALAQUIFER
INTERMEDIATECONFINING
UNIT
UPPER
AQUIFER
FLO
RID
AN
AQ
UIF
ER
SY
ST
EM
LAYER 5
LAYER 4
LAYER 3
LAYER 2
LAYER 1
ZONE AND(SEMI)CON-FINING UNIT
SYSTEM SURFICIAL
INTERMEDIATE CONFINING
UNIT
1Not modeled
UPPERPERMEABLE
ZONE A
ZONE B
LOWERPERMEABLE
ZONE A
NM1
SEMICONFININGUNIT
GRAPHICLITHOLOGY
SAND AND
SAND,CLAY, ANDLIMESTONE
LIMESTONE,DOLOMITE,
ANDDOLOMITICLIMESTONE
CLAY
FEET
LEVEL
EOCENE
900
800
700
600
AVON PARKLIMESTONE
OCALA LIMESTONE
NM1
DOLOMITE ZONE C
SEMICONFININGUNIT
Dashed where inferred
LANDSURFACE ENTIATED
FLORIDAN

Hydrogeologic F
ramew
ork5
Figure 3. Hydrogeologic units underlying the study area correlated to natural-gamma ray log traces for section A-A′ in Pinellas County(location of section shown in fig. 1).
LAND
50
150
250
350
450
550
650
750
850
FEET
Cle
arw
ater
Dee
p 27
TR
13-1
McK
ay C
reek
Sou
th C
ross
Bea
r C
reek
0 4 MILES
WP
MW
-1
Bay
ou
0 700
8000
NA
NA
NA
NA
2
0 2 4 KILOMETERS
MC
-OS
-1
Surficial Aquifer System
Intermediate
Zone A
Semiconfining
Zone B
Unit Confining
Unit
CPS
CPS
EXPLANATION
NATURAL GAMMA LOG TRACESCALE NOT AVAILABLECOUNTS PER SECOND
NACPS
BOUNDARY BETWEENHYDROLOGIC UNIT UNCERTAIN
SURFACE
(UFA)
(UFA)
(UFA)
(UFA) UPPER FLORIDAN AQUIFER
A A’

6 Hydrogeology and Analysis of Aquifer Characteristics in West-Central Pinellas County, Florida
Floridan Aquifer System
The Floridan aquifer system consists of lime-stones and dolomites and includes the Upper Floridanaquifer, the middle confining unit, and the LowerFloridan aquifer. The Upper Floridan aquifer in Pinel-las County is composed of the Avon Park Formation,the Ocala Limestone, the Suwannee Limestone, andthe Tampa Member of the Arcadia Formation (fig. 2).The Avon Park Formation consists of marine lime-stones interbedded with dolostones. The limestonesare predominantly well indurated packstones whichare highly fossiliferous. Overlying the Avon Park For-mation is the Ocala Limestone. The Ocala Limestoneconsists of moderately indurated grainstones andpackstones. The foraminiferal limestones in the unitcommonly contain benthic foraminifera, bryozoan,echinoid, and mollusk fossils. The Ocala Limestonehas a gradational contact with the overlying SuwanneeLimestone. The Suwannee Limestone is predomi-nantly foraminiferal packstone to grainstone withabundant mollusk and microfaunal remains (Miller,1986). Overlying the Suwannee Limestone is theTampa Member of the Arcadia Formation, which isthe lower Miocene unit of the Hawthorn Group(Miller, 1986). The Tampa Member lies unconform-ably on the Suwannee Limestone and consists of lime-stone with dolostone, sands, and clays present inminor amounts. Mollusks, foraminifera, and algae arethe common fossil molds present in the unit. The unitvaries from mudstones to packstones, but is predomi-nately wackestones.
In Pinellas County, the Upper Floridan aquifer issubdivided into four permeable zones generally sepa-rated by semiconfining units as defined by Hickey(1982). The zones are labeled alphabetically withincreasing depth from A to D. The focus of this reportis the uppermost part of the Upper Floridan aquifer,specifically the Tampa Member of the Arcadia Forma-tion of the Hawthorn Group (Zone A) and the Suwan-nee Limestone (Zones A and B) because these are theonly zones that contain brackish water at concentra-tions suitable for low-pressure reverse osmosis. Fur-ther discussions will be restricted to Zones A and B.
Zone A
Zone A, the shallowest and freshest permeablezone in the Upper Floridan aquifer, is made up of theTampa Member and the upper part of the SuwanneeLimestone. In Pinellas County, the thickness of Zone Aaverages 180 ft and ranges from approximately 115 to
250 ft. Reported transmissivities for Zone A through-out Pinellas County range from 10,000 to 40,000 ft2/d(Hickey, 1982; Seaburn and Robertson, Inc., 1983;Brown and Associates, Inc., 1986). Values for stora-tivity range from 4x10⁻⁴ to 8x10⁻⁴ (Hickey, 1982).Hickey (1982) divided Zone A into Upper Zone A(UZA) and Lower Zone A (LZA), separated by adiscontinuous semiconfining unit. At the WalsinghamPark site, a 25-ft thick semiconfining unit consisting ofan abundance of marine clay separates the 140 ft thickUZA from LZA, which is about 50 ft thick (fig. 2).
Zone B
In Pinellas County, Zone B underlies Zone A.Thickness of Zone B averages about 150 ft and rangesfrom about 125 to 170 ft. The upper part of Zone Bfunctions as a semiconfining unit in some parts ofPinellas County and is considered a nonproducingzone in these areas (Hickey, 1982; Knochenmus andSwenson, 1996). Reported hydraulic properties forthis sequence are 1.3x10⁻³ to 2 ft/d for vertical hydrau-lic conductivity, 0.1 ft/d for horizontal hydraulic con-ductivity, and 7x10⁻³ (ft/d)/ft for leakance (Hickey,1982; Seaburn and Robertson, Inc., 1983; and Brownand Associates, Inc., 1986). The lower part of Zone Bis more permeable and is comprised of the lower partof the Suwannee Limestone. Thickness of this sectionof Zone B averages about 62 ft and ranges from 50 to75 ft. Transmissivity estimates by Hickey (1982)suggest a value of about 5,000 ft2/d. At the study site,Zone B was encountered between 350 and 547 ftbelow land surface. However, no apparent changes inpermeability in the upper and lower parts of Zone Bcould be determined during drilling.
Delineation of Hydrogeologic UnitsUnderlying the Study Area
The delineation of hydrogeologic units and theirassociated hydraulic properties at the WalsinghamPark test site was accomplished through the collectionand interpretation of lithologic and stratigraphic data,water-quality data, borehole geophysical data, andhydraulic data. During the well construction, rock coredescription, discrete water-quality sampling, boreholegeophysical logging, and specific capacity tests wereperformed. Upon completion of the well construction,a 9-day aquifer test was performed. In total, one testproduction well 3 and four monitor wells wereinstalled at the test site (fig. 4).

Hydrogeologic Framework 7
A production test well and four monitor wellswere drilled by using a dual-wall reverse-circulationrotary drilling method. With this drilling method, pres-surized air is forced down between the inner and outerbarrels of the drilling stem. Rock and/or sediment iscut by the drill bit, and core samples rise to land sur-face through the inner barrel. The first well drilled wasoriginally designed to function as a deep exploratorywell and was drilled to a depth of 547 ft. This well wasdrilled to define the geology, water quality, and verti-cal distribution of producing zones and confining unitsat the test site. Data collected from the deep explor-atory well were used to determine the total depths andcasing depths of the test production well and monitorwells. After drilling and data collection, the deepexploratory well was backplugged to a depth of 266 ftand converted into the Walsingham Park UZA monitorwell 1 (WPMW-1). The WPMW-1 and all other moni-tor wells were constructed to monitor a specific pro-ducing zone or lower permeability unit to evaluate theresponses of various zones to pumping. The otherwells drilled as part of this study are hereafter referredto as the test production well 1 (WPTPW-1), the LZAbrackish-water monitor well 2 (WPMW-2), the inter-mediate confining unit monitor well 3 (WPMW-3),
and the surficial aquifer system monitor well 4(WPMW-4). Total depths and casing depths of all thewells constructed during this study are provided infigure 5.
Water-Quality Sampling
Water-quality samples were collected by theUSGS and Pinellas County personnel during drilling ofWPMW-1 to determine vertical distribution of waterquality at the site. Water samples were collected at dis-crete intervals every 10 ft during drilling and testedonsite for specific conductance, temperature, and pH.When abrupt changes in field measurements occurred,water samples were collected and analyzed for majorions and physical properties at the Pinellas CountyUtilities laboratory. A vertical water-quality profileshowing variations in dissolved solids with depth dur-ing drilling of WPMW-1 is presented in figure 6. Asillustrated, the dissolved-solids concentration beginsincreasing approximately 350 ft below land surface.Although some water samples collected between 360and 425 ft below land surface contained a lower con-centration of dissolved solids, this anomaly may havebeen caused by drilling constraints as water sampleswere collected over a period of 3 consecutive days.
WALSINGHAM ROAD
OFF-SITE MW-5(Botanical well)
WPMW-4WPMW-2
WPMW-3WPMW-1 WPTPW-1
(Walsingham ParkTest Production Well-1)
N
Wals inghamReservoir
216 FEET
700 FEET
PA
RK
EX
IT
WPMW-1
EXPLANATIONWalsingham Park Monitoring Welland number
NOTE: Not to scale
Figure 4. Walsingham Park test site, including location of wells drilled during the fieldinvestigation, and location of off-site monitor well (general location is shown in fig. 1).

8 Hydrogeology and Analysis of Aquifer Characteristics in West-Central Pinellas County, Florida
Figure 5. Generalized section view of casing depths and final depths of wells at the WalsinghamPark test site.
UPPER PERMEABLEZONE A
ZONE B
SEMICONFINING UNIT
LOWER PERMEABLEZONE A
LOWERZONE A
MONITOR
UPPERZONE AMONITOR
INTERMEDIATECONFINING
UNITMONITOR
SURFICIALAQUIFERMONITOR
SALT WATER
BRACKISH WATER
POTABLE WATER
INTERMEDIATECONFINING UNIT
SURFICIAL AQUIFERSYSTEM
TESTPRODUCTION
WELL
OPEN BOREHOLE
SCREENED INTERVAL
EXPLANATIONGROUT OR CEMENT
WELL CASING
31
300
266
99
35
135
277275
300
350
LANDSURFACE
155 140
89
21
WPTPW-1 WPMW-2 WPMW-4 WPMW-3 WPMW-1
NOTE: Not to scale
350
550
LOC
ATIO
N O
F U
NIT
BO
UN
DA
RIE
S A
T D
EP
TH
BE
LOW
LA
ND
SU
RFA
CE
, IN
FE
ET
547
NOTE: Before backplugging to 266 feet, WPMW-1 was referred to as the deep exploratory well.

Hydrogeologic Framework 9
The freshening of water samples between drilling daysmay have been the result of mixing of waters in theborehole. However, previous investigations in northernPinellas County have shown that layering of water withhigher dissolved-solids concentrations can occur overwater with lower dissolved-solids concentrations(Knochenmus and Swenson, 1996). The nature of thiswater-quality anomaly at the Walsingham Park test sitecould not be determined upon completion of drilling.
Additionally, selected samples were used toshow the correlation between specific conductance anddissolved-solids concentrations for ground water repre-sentative of the study site (fig. 7). The linear regressionclosely fits a straight line with a correlation coefficient(r) of 0.997. The correlation of the two parameters waslater used to estimate changes in dissolved-solidsconcentration under pumping conditions; however, therelation of dissolved solids to specific conductancewould not be constant for the entire range of samples(Hem, 1985). As figure 7 illustrates, the slope of thelinear regression is different for specific ranges ofconductance values. Changes in water quality thatoccurred during hydraulic testing are discussed furtherin the aquifer test section of this report.
Geophysical Logging
Borehole geophysical logging was used todelineate hydrogeologic units, flow zones, and water-quality changes at the test site. Geophysical logs werecollected by a Pinellas County contractor under staticand pumping conditions on WPMW-1. A lithologiclog from WPMW-1 was also compiled during drilling.
Logs collected during static conditions included cali-per, natural-gamma radiation, fluid resistivity, andfluid temperature. Logs collected under pumping con-ditions included ascending and descending flow meterwith the pump placed 120 ft below land surface.A schematic of the geophysical logs collected fromWPMW-1 is shown in figure 8.
Interpretations of the geophysical logs in con-junction with the lithologic log were used to determinethe distribution of flow zones and semiconfining units.Natural-gamma radiation logs are used to delineateclay and phosphate-bearing deposits by recording thenaturally occurring radiation coming from the forma-tion adjacent to the borehole. The natural-gamma log,when correlated with the WPMW-1 lithologic log,confirmed the presence of clay and phosphate depositsfrom 35 to 135 ft below land surface. This sequencecorresponded to the ICU at the study site. Thedecrease in the natural-gamma values at about 340 ftbelow land surface indicates a region of low phosphatecontent within the Suwannee Limestone.
Flow logs measured under pumping conditionsare used in conjunction with caliper logs to delineateflow zones. Within a relatively uniform boreholediameter, an increase in counts per second indicates anincrease in fluid velocity, thus an increase in flow.The flow meter logs collected at WPMW-1 indicatethe presence of a major flow zone from around 300 to350 ft below land surface, corresponding to LZA.
Figure 7. Relation between dissolved solids and specificconductance of selected water samples collected duringdrilling of Walsingham Park deep exploratory well (WPMW-1).
Figure 6. Relation of dissolved solids and depth fromwater samples collected during drilling of Walsingham Parkdeep exploratory well (WPMW-1).
35,0
000
5,00
0
10,0
00
15,0
00
20,0
00
25,0
00
30,0
00
600
100
150
200
250
300
350
400
450
500
550
DE
PT
H B
ELO
W L
AN
D S
UR
FA
CE
,
DISSOLVED SOLIDS,
IN F
EE
T
IN MILLIGRAMS PER LITER
40,0
000
10,0
00
20,0
00
30,0
00
0
50,000
10,000
20,000
30,000
40,000
DISSOLVED SOLIDS,IN MILLIGRAMS PER LITER
DS = 0.6769 * SP. COND.r = 0.997
DS = DISSOLVED SOLIDSSP.COND. = SPECIFIC CONDUCTANCE
r = CORRELATION COEFFICIENT
SP
EC
IFIC
CO
ND
UC
TA
NC
E, I
NM
ICR
OS
IEM
EN
S P
ER
CE
NT
IME
TE
RA
T 2
5 D
EG
RE
ES
CE
LSIU
S

10H
ydrogeology and Analysis of A
quifer Characteristics in W
est-Central P
inellas County, F
lorida
200
300
400
500
600
CALIPER FLOWFLOW STATIC STATIC
* FLOW METER LOGS CONDUCTED AT A PUMPING RATE OF 387 GALLONS PER MINUTE
METERASCENDING*
METERDESCENDING* RESISTIVITY TEMPERATURE
10 16
INCHES COUNTS PER SECOND
0 30
COUNTS PER SECOND
0 3
OHM-METER
74 8077
DEGREES FAHRENHEIT
GAMMA RAY
0 700
COUNTS PER SECOND
0 12.5
FLUID FLUID
100
DE
PT
H B
ELO
W L
AN
D S
UR
FA
CE
, IN
FE
ET
LANDSURFACE
Figure 8. Geophysical logs of Walsingham Park deep exploratory well (WPMW-1).

Hydrogeologic Framework 11
Fluid resistivity and temperature logs are usedto identify zones of water-quality change. The fluidresistivity and fluid temperature logs indicate a rapidwater-quality change approximately 350 ft below landsurface as fluid resistivity decreases and fluid tempera-ture increases. The change in water quality at 350 ftbelow land surface was noted in the water-quality pro-file developed from water samples taken during drill-ing. However, unlike the water-quality profile, neitherthe fluid resistivity nor temperature logs suggest afreshening of water from 360 ft below land surface tothe lowest extent of the logs at about 415 ft below landsurface (fig. 8).
Specific-Capacity Tests
Specific-capacity tests were performed onWPMW-1 to evaluate the various hydrogeologic unitsat the study site. Water-level data, collected under arange of pumping rates, were analyzed to estimatehydraulic parameters of the system. Specific-capacitytests measure well yield per unit of drawdown forspecific intervals of individual hydrogeologic units.Results were used to estimate hydraulic properties ofspecific intervals, locate permeable zones, and deter-mine the well and casing depths of the monitor andproduction wells. In addition to specific-capacity tests,packer tests were performed upon completion ofWPMW-1 (prior to backplugging) to further identifypermeable zones at the site. Transmissivity andhydraulic conductivity values, estimated from spe-cific-capacity and packer tests performed on the deepexploratory well (WPMW-1), are listed in table 1.
The values were estimated by applying specific-capacity and packer-test data to empirical equationsdeveloped from the modified Jacob nonequilibriumequation for a single-well test (Driscoll, 1986, p. 1021).Due to the difficulty in placing packers in the boreholeand leakage problems detected around the packers,confidence in the packer-test data was low for deter-mining hydraulic parameters. However, UZA fromabout 135 to 270 ft below land surface and LZA fromabout 300 to 350 ft below land surface were deter-mined to be the primary flow zones contributingground water to the wells. Although LZA had a higherspecific capacity, it was located directly above a highlymineralized water-quality zone. Therefore, UZA wasmore suitable for a longer-term aquifer test.
Aquifer Test
A 9-day aquifer test was conducted at the testsite from July 29 to August 7, 1997, to estimate thehydraulic parameters of Zone A and determinechanges in water quality due to long-term pumping.The four onsite and one offsite monitor wells wereused to observe responses in various zones to pumpingfrom UZA at WPTPW-1. Background water-level datacollected before and after pumping showed that headdifferences between zones at the test site reflected adownward head gradient (fig. 9). At the onset of theaquifer test, the water level in the SAS monitor(WPMW-4) was about 2.5 ft above the water level inthe ICU monitor (WPMW-3), whereas the water levelin the ICU monitor was more than 36 ft higher thanthe water level in the UZA monitor (WPMW-1).
Moreover, the water level in the UZAmonitor was 0.15 ft higher than the waterlevel in the LZA monitor (WPMW-2).The test production well (WPTPW-1) waspumped at a rate of 220 gal/min for thelength of the test. After the initiation ofpumping, responses were noted for thevarious monitor wells. WPMW-1responded immediately with a loweringof water level in the first minute of pump-ing. WPMW-2 also responded quicklywith the first drawdown noted after 4minutes of pumping. Contrasting thechanges in water levels at these two wells,the water level in WPMW-1 decreased by1.0 ft, whereas the water level in WPMW-2decreased by 0.02 ft after 4 minutes ofpumping. Furthermore, a “reverse water-level fluctuation” (Andreasen and
Table 1. Results from specific capacity and packer tests from the deepexploratory well[ft, feet; ft3/d, cubic feet per day; (gal/min)/ft, gallons per minute per foot; ft2/d,feet squared per day; ft/d, feet per day]
aPacker test interval.
Depth intervalbelow land
surface(ft)
Pumprate
(ft3/d)
Totalchangein head
(ft)
Specificcapacity
(gal/min)/ft
Transmis-sivity(ft2/d)
Hydraulicconductivity
(ft/d)
135-185 11,744 9.73 6.3 1,675 34135-235 11,934 8.87 7.0 1,870 19135-235 59,864 59.64 5.2 1,400 14205-235 9,336 9.59 5.1 1,350 45230-282a 17,901 13.74 6.8 1,810 35268-285a 9,182 4.63 10.3 2,750 162288-340a 18,289 14.50 6.6 1,750 34338-355a 9,624 4.31 11.6 3,100 182385-542a 9,124 5.77 8.2 2,195 33

12 Hydrogeology and Analysis of Aquifer Characteristics in West-Central Pinellas County, Florida
0.5
5.0
1.0
2.0
3.0
4.0
44
47
45
46
WA
TE
R L
EV
EL,
IN F
EE
T A
BO
VE
SE
A L
EV
EL
TIDAL STAGE MEASUREMENT
WPMW-3 (INTERMEDIATE CONFINING UNIT)
WPMW-4 (SURFICIAL AQUIFER SYSTEM)
27 28 29 30 31 1 2 3 4 5 6 7 8
July August
1997
4.5
8.5
5.0
5.5
6.0
6.5
7.0
7.5
8.0
WPMW-1 (UPPER ZONE A)
WPMW-2 (LOWER ZONE A)
OFF-SITE MW-5 (UPPER ZONE A)
PUMP ON PUMP OFF
PUMPTEMPORARILY
OFF
(Site location shown in figure 1)
REVERSEWATER-LEVELFLUCTUATION
Figure 9. Water levels in all monitor wells before, during, and after the 9-day aquifer test.

Analysis of Aquifer Characteristics 13
Brookhart, 1963) was observed in the ICU monitorwell WPMW-3. The water level in the ICU began torise immediately after pumping began and declinedwhen pumping ended (fig. 9). A possible explanationfor this occurrence is that the release of water fromcompressive storage produced by pumping in UZAcaused a reduction in aquifer volume of UZA, which inturn caused both horizontal and vertical deformationsin the overlying ICU. These deformations of the ICUsubsequently induced the measured water-level rise.This phenomenon has been documented and is oftenreferred to as the Noordbergum Effect (Hsieh, 1996).No response due to pumping was denoted in the surfi-cial aquifer system monitor well WPMW-4. Althoughwater levels were monitored in the five wells for theduration of the test, drawdowns reached steady-statewithin the first 3 hours of pumping when tidal effectsbegan to interfere with drawdown measurements(fig. 9).
Water-quality data were collected for the dura-tion of the 9-day aquifer test. Specific conductanceprobes were placed in WPMW-1 and WPMW-2 atdepths of 250 ft and 330 ft, respectively. Dischargewater from WPTPW-1 was monitored hourly for spe-cific conductance for the duration of the aquifer test.The changes in specific conductance measured duringthe test are shown in figure 10. Interestingly, water-quality changes noted in the UZA and the LZAmonitor wells exhibited opposite trends. By using therelation between dissolved solids and specific conduc-tance developed earlier (fig. 7), an inference can bemade regarding the changes in dissolved solids con-centrations during the aquifer test. The specific con-ductance in WPMW-1 in UZA increased from about1,050 to 1,600µS/cm corresponding to an increase indissolved- solids concentration of about 372 mg/L.By contrast, the specific conductance in WPMW-2 inLZA decreased from about 11,900 to 11,200µS/cmcorresponding to a decrease in dissolved-solids con-centrations of about 440 mg/L over the 9 days of thetest. The specific conductance of the composite sam-ple collected from WPTPW-1 increased from 470 to488µS/cm. Although this slight increase in measuredspecific conductance can be considered to be withinthe error of measurement of the conductance probe,the data showed a consistent trend (fig. 10).
The opposite trends in water-quality changesnoted between the UZA and the LZA monitor wellsduring the 9-day aquifer test are difficult to explain.
The upward hydraulic gradient between LZA andUZA induced during the aquifer test may haveresulted in upward movement of more saline water.However, the freshening of water in the LZA monitorwell (WPMW-2) during the aquifer test is anomalous.As figure 10 illustrates, the rate of change of measuredspecific conductance appears to decrease from thetime pumping began. It is possible that mineralizedwater may have invaded LZA during drilling of thedeep exploratory well and may have evacuated LZAduring the aquifer test, thus returning to native condi-tions. Since the aquifer test lasted only 9 days, no dataare available to determine the specific conductancevalues at longer pumping times.
Data and the results of the aquifer test are on fileand available at the USGS Tampa office. Because ana-lytical methods are constrained by limitations in thesimplification of a flow system into one- or two-dimensional flow, the 9-day aquifer test was analyzedby using numerical methods. Numerical methods cansimultaneously calculate changes in head and advec-tive transport in a variable-density flow system formultiple observation points.
ANALYSIS OF AQUIFERCHARACTERISTICS
A numerical modeling approach was used tosimulate the effects of pumping the variable-densityground-water flow system at the test site. The modelwas constructed to simulate the 9-day aquifer test con-ducted at the site and to refine estimates of hydraulicparameters such as hydraulic conductivity and storagecoefficient determined from specific-capacity tests andprevious investigations.
Numerical Methods
The USGS computer code HST3D (Kipp, 1987)was used to solve the equation for ground-water flowand solute transport using backward-in-space andbackward-in-time finite-difference approximationmethods. Mass-fractional concentrations and totalfluid pressures were simulated using the model. Thereader is referred to the original report that documentsthe computer code (Kipp, 1987) for a complete discus-sion of the numerical methods and model code.

14 Hydrogeology and Analysis of Aquifer Characteristics in West-Central Pinellas County, Florida
SP
EC
IFIC
CO
ND
UC
TAN
CE
, IN
MIC
RO
SIE
ME
NS
PE
R C
EN
TIM
ET
ER
AT
25
DE
GR
EE
S C
ELS
IUS
29 30 31 1 2 3 4 5 6 7440
500
450
460
470
480
490
PUMPOFF
PUMP ON
Composite Discharge Sample
27 28 29 30 31 1 2 3 4 5 6 7 8 91,000
1,700
1,100
1,200
1,300
1,400
1,500
1,600
27 28 29 30 31 1 2 3 4 5 6 7 8 9July August
1997
11,000
12,200
11,200
11,400
11,600
11,800
12,000
(Upper Zone A)Probe at 250 feet below
(Lower Zone A)Probe at 330 feet below
PUMP ON
PUMPOFF
PUMP ON
PUMPOFF
land surface
land surface
Walsingham Park Test Production Well-1
Walsingham Park Monitor Well-1
Walsingham Park Monitor Well-2
Figure 10. Changes in specific conductance during the 9-day aquifer test at Walsingham Park TestProduction Well and Walsingham Park Monitor Wells 1 and 2.
Analysis of Aquifer Characteristics 15
Conceptual Model
The hydrogeologic system of the study area isconceptualized as a multilayered aquifer systemencompassing various permeable zones separated byconfining and semiconfining units extending from thesurficial aquifer system downward through the Suwan-nee Limestone of the Upper Floridan aquifer (fig. 2).Ground-water flow is considered to be lateral in per-meable zones and vertical in confining and semicon-fining zones. Ground-water quality changes from freshto saline with depth as ground water becomes increas-ingly dense with higher concentrations of dissolvedsolids. Several assumptions were made regarding theconceptualized hydrogeologic system to effectuatenumerical simulation:1. The aquifer system is assumed to act as an equivalent
porous medium,2. All aquifer layers are homogeneous and isotropic,3. Initial conditions are hydrostatic,4. Initial fluid density is constant in each model row,
and5. The water-quality profile is laterally homogeneous
for the entire model area.
Design of Numerical Model
The numerical model subdivides the conceptual-ized hydrogeologic system from the ICU through Zone Bat the test site into an organized network of grid blocks,each with assigned fluid and matrix properties repre-senting a 500-ft thick section underlying the test site.The model was constructed by using a cylindrical-coordinate grid of 124 columns and 12 rows (fig. 11),and was designed to simulate the responses of UZAand LZA to brackish-water development. The columnsare variable in width with radial spacing expandinglogarithmically from 0.3 ft at the test production wellup to a maximum width of 328 ft extending out to11,500 ft. Radial widths extending to 12,500 and14,500 ft were also simulated, but the additional simu-lation area in the horizontal direction had no affect onmodel results. The 12 model rows were groupedtogether as five distinct hydrogeologic layers. Layer 1corresponds to model rows 1-3, is 175 ft thick, and rep-resents Zone B of the Upper Floridan aquifer. Layer 2corresponds to model rows 4 and 5, is 50 ft thick, andrepresents LZA of the Upper Floridan aquifer. Layer 3corresponds to model row 6 and represents a discrete,25-ft section within Zone A with an increased occur-rence of green clays. This section was modeled to
determine the hydraulic properties of the unit separat-ing UZA and LZA. Layer 4 corresponds to model rows7-9, is 150 ft thick, and represents UZA of the UpperFloridan aquifer. Layer 5 corresponds to model rows10-12, is 100 ft thick, and represents the ICU.
Initial and Boundary Conditions
Initial conditions refer to pressure and fluid prop-erty distributions established prior to the initiation ofthe model simulation. Hydrostatic conditions are estab-lished in HST3D from a distribution of dissolved solidsand fluid densities for each model row. Values for dis-solved-solids concentrations and fluid densities, basedon water-quality parameters defined from samplestaken during drilling, were used to establish initial con-ditions (table 2). The model calculates the starting fluidpressures based on the user-specified fluid property dis-tribution for all model rows as well as at model bound-aries. Under these hydrostatic conditions, the aquiferresponse to pumping is determined by model simulatedchanges in pressure relative to the initial hydrostaticconditions (Anderson and Woessner, 1992).
Boundary conditions delimit the model domainby constraining the lateral and vertical extent of thesimulated flow system at the model periphery. Theinner cylindrical boundary represents the productionwell and was defined by allocating well information tothe various rows that represent the open-hole intervalof the pumped well. Model rows not open to theproduction well were assigned a no-flow condition,whereas the outer cylindrical boundary was defined asa specified-pressure condition (fig. 11). The assignedpressure distribution along the vertical plane of theouter boundary was calculated by using water-leveland dissolved-solids concentration data obtainedduring drilling of the test production well. The lowermodel boundary was defined as a specified-pressureboundary equivalent to the pressure exerted by acolumn of stratified saltwater and freshwater in theoverlying strata determined from the density of watersamples acquired during drilling (fig. 11). The outerand lower specified-boundaries were used to simulatean infinitely extensive aquifer while eliminating themodeling of indefinite regions outside the study area.The upper model boundary was assigned a no-flowboundary coinciding with the top of the ICU. Becauseno drawdown occurred in either the SAS or the ICUmonitor wells during the aquifer test, a no-flow bound-ary condition at the top of the ICU was deemed appro-priate. However, row 11 (corresponding to the
16H
ydrogeology and Analysis of A
quifer Characteristics in W
est-Central P
inellas County, F
lorida
SPECIFIED-PRESSUREBOUNDARY
OPEN-HOLE INTERVAL FOR PRODUCTION AND/OR MONITOR WELLS
LAY
ER
TH
ICK
NE
SS
, IN
FE
ET
NOTE: Not to scale
Layer 1
Layer 2
Layer 3
Layer 4
Layer 5
NO-FLOW BOUNDARY
SP
EC
IFIE
D-P
RE
SS
UR
E B
OU
ND
AR
Y
0 11,500
SEMICONFINING UNIT
LOWER ZONE A
INTERMEDIATE CONFINING UNIT
UPPER ZONE A
ZONE B
RADIAL DISTANCE FROM MODEL ORIGIN, IN FEET
500
0
175
225
250
400
NO
-FLO
WB
OU
ND
AR
YN
O-F
LOW
BO
UN
DA
RY
SIM
ULA
TE
DP
RO
DU
CT
ION
WE
LL
CO
LUM
N 1
CO
LUM
N 1
24R
OW
12
RO
W 1
EXPLANATION
{
Figure 11. Model grid, simulated open-hole intervals, and boundary conditions used in the HST3D simulation.

Analysis of Aquifer Characteristics 17
open-hole interval of WPMW-3) was used as anindictor for the upper limit of hydraulic parameters thatwould simulate a no-response condition in the ICU.Although the lack of a drawdown in the ICU made itimpossible to accurately estimate hydraulic propertiesof the unit, model parameters in rows representing theICU were adjusted to eliminate drawdown during thesimulation.
Model Parameters
Model parameters including bulk matrix proper-ties, fluid properties, and well information weredefined for the five hydrogeologic units simulated(table 2). Although some adjustments were made tothe parameters during calibration, initial values werecarefully selected based on data collected during thisinvestigation and previous studies (Hickey, 1982,1989; Knochenmus and Swenson, 1996; Yobbi, 1996).Each model parameter is discussed in detail below:
1. Bulk matrix properties.—Bulk matrix propertiesinclude effective porosity, hydraulic conductivity(as a function of intrinsic permeability), storagecoefficient (as a function of matrix compressibil-ity), and dispersivity. Bulk matrix properties(except dispersivity) for each hydrogeologic layerare listed in table 2. Because values of dispersivity
are poorly known within the study area, a conser-vative approach was used by setting longitudinaland transverse dispersivity to zero.
2. Fluid properties.—Fluid properties include viscos-ity, density, compressibility, temperature, and dis-solved-solids concentration. Dissolved-solidsconcentration is expressed as a scaled-solute massfraction ranging from 0 to 1 in HST3D. A value of0 represents pure freshwater whereas a value of 1represents water with the highest dissolved-solidsconcentration (28,000 mg/L) in the model. Valuesfor density and dissolved solids for each hydro-geologic layer are summarized in table 2. Fluidviscosity was held constant for the entire model at1.0x10-3 centipoise. Likewise, fluid temperatureand fluid compressibility were held constant withvalues of 77oF, and 3.03x10⁻⁶ in2/lb, respectively.
3. Well information.—Well information needed formodel input includes the withdrawal rate of thepumping well and is distributed equally over thethree rows representing the pumped zone. The testproduction well open to UZA was simulated inmodel rows 7-9. The simulated pumpage was dis-cretized with a constant withdrawal rate assignedto each of the three rows. The total pumpageassigned for all three rows for the aquifer test sim-ulation equaled 220 gal/min. Pumpage was variedthereafter from 200 to 700 gal/min during thebrackish-water development simulations.
Table 2. Values for model parameters used to establish initial conditions and values for calibratedmodel parameters[lb/ft3, pound per cubic foot; mg/L, milligrams per liter; ft2, feet squared; ft/d, feet per day]
a Input parameters varied between the two rows representing Lower Zone A.
Hydrogeologic unit
Initial conditions Calibrated model
Density(lb/ft 3)
Scaled-solutemass fraction /
dissolved solids(mg/L)
Intrinsicpermeability (ft 2) /
hydraulicconductivity (ft/d)
Storagecoefficient
Effectiveporosity(percent)
Intermediate confining unit 62.38 0.0089 / 250 3.9x10⁻¹⁵ / 0.0001 3.1x10⁻⁴ 35Upper Zone A 62.38 0.0098 / 275 7.0x10⁻¹¹ / 18 2.6x10⁻⁴ 30Semiconfining unit 62.41 0.0250 / 700 3.9x10⁻¹¹ / 10 4.3x10⁻⁵ 35Lower Zone Aa
(Row 6)62.61 0.1786 / 5,000 2.9x10⁻⁹ / 750 8.6x10⁻⁵ 30
Lower Zone A(Row 5)
62.72 0.2679 / 7,500 2.9x10⁻⁹ / 750 8.6x10⁻⁵ 30
Zone B 63.65 1.0 / 28,000 3.9x10⁻¹² / 1 2.6x10⁻⁵ 30

18 Hydrogeology and Analysis of Aquifer Characteristics in West-Central Pinellas County, Florida
Simulation of Aquifer Test
Numerical analysis of the 9-day aquifer test dataprovided a method for calculating hydraulic propertiesof various hydrogeologic units at the test site. Thenumerical model was calibrated by simulating theaquifer system’s response to pumping UZA during theaquifer test. The model analysis of the 9-day aquifertest consisted of meeting two calibration objectiveswithin acceptable limits: (1) simulate the drawdownand recovery of water levels in selected wells mea-sured during the test, and (2) simulate the overallresponse of the system to pumping.
The first objective involved matching the initialdrawdown part of the aquifer test. The initial 139 min-utes of the aquifer test was used because nearly alldrawdown effects occurred during this time and moni-tor well drawdowns could be separated from tidaleffects. Tidal effect corrections were made by calculat-ing the tidal efficiency for the monitor zone andadjusting drawdown and recovery data accordingly.Tidal efficiency is the ratio of the water-level ampli-tude measured in a well to the oceanic tidal amplitude(Ferris and others, 1962). Tidal data were collected ata gage located on the intracoastal waterway at IndianRocks Beach, 2 mi west of the study site (fig. 1). Thecalculated tidal efficiency for Zone A averaged 10 per-cent for ebbing tides and 16 percent for flooding tides.After tidal corrections were made to the observed data,the corrected drawdowns were compared to simulateddrawdowns.
Model parameters were adjusted until a reason-able match was derived where simulated drawdownsclosely paralleled the observed drawdowns. A reason-able match was considered less than 0.10 ft differencebetween simulated and observed drawdown data. Finalcalibrated values for hydraulic conductivity were 18ft/d for UZA, 750 ft/d for LZA, 1 ft/d for Zone B,1x10-4 ft/d for the ICU, and 10 ft/d for the semiconfin-ing unit separating UZA and LZA. Final calibratedvalues for storage coefficient were 3.1x10⁻⁴ for UZA,8.6x10-5 for LZA, 2.6x10⁻⁵ for Zone B, 3.1x10⁻⁴ forthe ICU, and 4.3x10⁻⁵ for the semiconfining unit sepa-rating UZA and LZA. Calibrated model parameterswere further checked by comparing the observedrecovery data of the aquifer test to the simulatedrecovery water levels (fig. 12). Values of the corrected,observed drawdown and recovery and simulated valuesare provided in table 3.
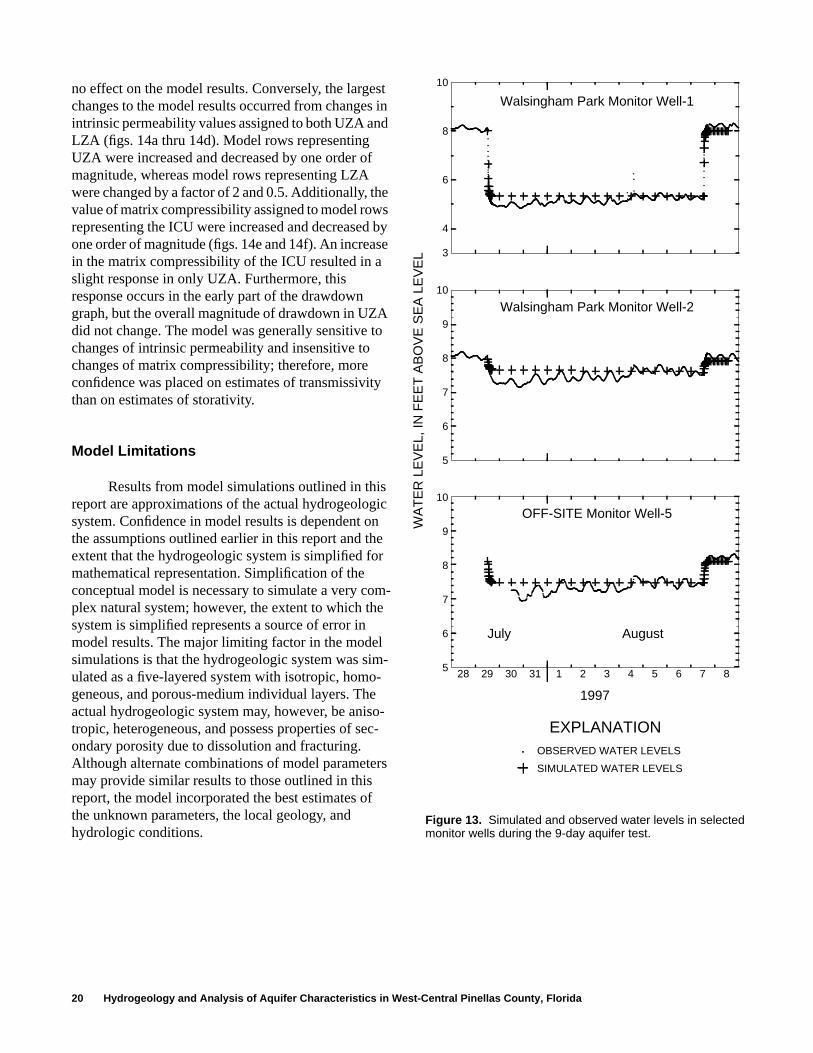
The second objective involved matching thelong-term pattern of drawdown and recovery for thelength of the 9-day aquifer test. As figure 9 shows,after the initial 139 minutes of pumping, observeddrawdowns stabilized (excluding tidal effects) for theremainder of the 9-day test until the pump was turnedoff and recovery effects occurred. A reasonable matchwas accomplished when simulated drawdowns func-tioned in a similar fashion with drawdowns decreasingafter the initial drop in water levels and stabilizingthroughout the simulation until the recovery part of thetest (fig. 13). It should be noted that the simulatedhydrographs are superimposed over the uncorrectedfield hydrographs. No attempt was made to simulatethe variations in water levels due to tidal effects.
Sensitivity Analysis
Sensitivity analysis was used to determine theeffect of each parameter on the calibrated modelresults. Input parameters were individually varied overa reasonable range of values to determine the sensitiv-ity of the model to that particular parameter over theentire simulation period. Ranges were based on valuesfrom previous investigations discussed in the hydro-geologic framework section of this report. Changes incertain parameters had no effect on the model,whereas others noticeably affected the model results.For example, a one order of magnitude increase anddecrease in the value of matrix compressibility inmodel rows representing both UZA and LZA had noeffect on the model results. Furthermore, a one orderof magnitude increase and decrease in the intrinsicpermeability of model rows representing the ICU had
Table 3. Simulated and corrected observed drawdown andrecovery for selected monitor wells during the 9-day aquifer test
[UZA, upper zone A; LZA, lower zone A; NA, data not available;all values are in feet]
aCorrected drawdown for first 139 minutes of pumping.bCorrected recovery for first 136 minutes of recovery in
WPMW-1 and Botanical Well, and first 192 minutes of recoveryin WPMW-2.
Zoneandwell
Correctedobserved
drawdown a
Simulateddrawdown
Correctedobservedrecovery b
Simu-lated
recovery
UZAWPMW-1
2.69 2.66 2.79 2.66
LZAWPMW-2
0.29 0.30 0.36 0.31
UZABotanical Well
NA 0.59 0.54 0.60
Analysis of Aquifer Characteristics 19
1200 1230 1300 1330 1400 1430 1500 1530 16004
9
5
6
7
8
1200 1230 1300 1330 1400 1430 1500 1530 1600
29July 1997
7
9
8
WA
TE
R L
EV
EL
AB
OV
E S
EA
LE
VE
L, IN
FE
ET
1300 1330 1400 1430 1500 1530 1600 1630 17004
9
5
6
7
8
1300 1330 1400 1430 1500 1530 1600 1630 17007
9
8
1300 1330 1400 1430 1500 1530 1600 1630 1700
7August 1997
6
9
7
8
EXPLANATION
OBSERVED WATER LEVELS
SIMULATED WATER LEVELS
DRAWDOWN RECOVERY
Walsingham Park Monitoring Well-1 (WPMW-1)
Upper Zone A Upper Zone A
Upper Zone A
Lower Zone A Lower Zone A
Walsingham Park Monitoring Well-1 (WPMW-1)
Walsingham Park Monitoring Well-2 (WPMW-2) Walsingham Park Monitoring Well-2 (WPMW-2)
Off-site Monitoring Well-5 (MW-5)
Figure 12. Simulated and observed water levels during drawdown and recovery periods at selected wellsduring the 9-day aquifer test.
20 Hydrogeology and Analysis of Aquifer Characteristics in West-Central Pinellas County, Florida
no effect on the model results. Conversely, the largestchanges to the model results occurred from changes inintrinsic permeability values assigned to both UZA andLZA (figs. 14a thru 14d). Model rows representingUZA were increased and decreased by one order ofmagnitude, whereas model rows representing LZAwere changed by a factor of 2 and 0.5. Additionally, thevalue of matrix compressibility assigned to model rowsrepresenting the ICU were increased and decreased byone order of magnitude (figs. 14e and 14f). An increasein the matrix compressibility of the ICU resulted in aslight response in only UZA. Furthermore, thisresponse occurs in the early part of the drawdowngraph, but the overall magnitude of drawdown in UZAdid not change. The model was generally sensitive tochanges of intrinsic permeability and insensitive tochanges of matrix compressibility; therefore, moreconfidence was placed on estimates of transmissivitythan on estimates of storativity.
Model Limitations
Results from model simulations outlined in thisreport are approximations of the actual hydrogeologicsystem. Confidence in model results is dependent onthe assumptions outlined earlier in this report and theextent that the hydrogeologic system is simplified formathematical representation. Simplification of theconceptual model is necessary to simulate a very com-plex natural system; however, the extent to which thesystem is simplified represents a source of error inmodel results. The major limiting factor in the modelsimulations is that the hydrogeologic system was sim-ulated as a five-layered system with isotropic, homo-geneous, and porous-medium individual layers. Theactual hydrogeologic system may, however, be aniso-tropic, heterogeneous, and possess properties of sec-ondary porosity due to dissolution and fracturing.Although alternate combinations of model parametersmay provide similar results to those outlined in thisreport, the model incorporated the best estimates ofthe unknown parameters, the local geology, andhydrologic conditions.
3
10
4
6
8
EXPLANATIONOBSERVED WATER LEVELS
SIMULATED WATER LEVELS
5
10
6
7
8
9
28 29 30 31 1 2 3 4 5 6 7 8
July August
1997
5
10
6
7
8
9
WA
TE
R L
EV
EL,
IN F
EE
T A
BO
VE
SE
A L
EV
EL
OFF-SITE Monitor Well-5
Walsingham Park Monitor Well-2
Walsingham Park Monitor Well-1
Figure 13. Simulated and observed water levels in selectedmonitor wells during the 9-day aquifer test.

Analysis of Aquifer Characteristics 21
Figure 14. Sensitivity of simulated water levels to changes in selected model input parameters.
-6
10
-4
-2
0
2
4
6
8
Upper Zone A k * 10
Upper Zone A k * 0.1
5
10
6
7
8
9
Upper Zone A k * 10
Upper Zone A k * .10
4
9
5
6
7
8Lower Zone A k * 2
Lower Zone A k * .5
5
10
6
7
8
9Lower Zone A k * 2
Lower Zone A k * .5
28 29 30 31 1 2 3 4 5 6 7 8July August
1997
4
9
5
6
7
8
OBSERVED WATER LEVELS
SIMULATED WATER LEVELS
28 29 30 31 1 2 3 4 5 6 7 8July August
1997
5
10
6
7
8
9
WA
TE
R L
EV
EL,
IN F
EE
T A
BO
VE
SE
A L
EV
EL
Intermediate
IntermediateConfining Unit ~ * 10
Confining Unit ~ * 0.10
WPMW-1 WPMW-2
~ MATRIX COMPRESSIBILITY
k INTRINSIC PERMEABILITY
EXPLANATION
a. b.
c. d.
e. f.Intermediate
IntermediateConfining Unit ~ * 10
Confining Unit ~ * 0.10

22 Hydrogeology and Analysis of Aquifer Characteristics in West-Central Pinellas County, Florida
SUMMARY
This report presents the results of a study toevaluate the brackish-water resources in the UpperFloridan aquifer underlying west-central PinellasCounty, Florida. A production test well and four moni-tor wells were constructed at a location in WalsinghamPark in 1996-97. The wells were sampled for water-quality parameters and investigated using boreholegeophysical methods and hydraulic testing. The datacollected were analyzed by using numerical tech-niques to delineate the hydrogeologic framework atthe test site.
Collected data indicate that a multilayered aqui-fer system consisting of two permeable zones under-lies Walsingham Park. One zone extends from about135 to 275 ft below land surface and corresponds toUZA of the Upper Floridan aquifer. Another perme-able zone extends from about 300 to 350 ft below landsurface and corresponds to LZA of the Upper Floridanaquifer. Analysis of water-quality data indicates thatLZA may not provide water of consistent qualitybecause of rapidly increasing dissolved-solids concen-trations occurring around 350 ft below land surface.UZA was deemed more appropriate for productionpumping and was tested during a 9-day aquifer test.
A numerical model was developed to simulatethe 9-day aquifer test performed at the WalsinghamPark test site. The model was calibrated to the draw-down and recovery water levels of selected monitorwells at the test site. Final calibrated values forhydraulic conductivity were 18 ft/d for UZA, 750 ft/dfor LZA, 1 ft/d for Zone B, 1x10⁻⁴ ft/d for the ICU,and 10 ft/d for the semiconfining unit separating UZAand LZA. Final calibrated values for storage coeffi-cient were 3.1x10⁻⁴ for UZA, 8.6x10⁻⁵ for LZA,2.6x10-5 for Zone B, 3.1x10⁻⁴ for the ICU, and4.3x10-5 for the semiconfining unit separating UZAand LZA.
REFERENCES CITED
Anderson, M.P., and Woessner, W.W., 1992, Appliedgroundwater modeling: Simulation of flow and advec-tive transport: San Diego, Calif., Academic Press,381 p.
Andreasen, G.E., and Brookhart, J.W., 1963, Reverse water-level fluctuations: Methods of collecting and interpret-ing ground-water data: U.S. Geological Survey Water-Supply Paper 1544-H, p. 30-35.
Black, Crow and Eidness, Inc., 1978, Drilling and testing ofthe monitoring and injection wells at the SouthwestWastewater Treatment Plant for the city of St. Peters-burg, Florida: Brooksville, Consultant’s report in thefiles of the Southwest Florida Water Management Dis-trict.
Brown and Associates, Inc., 1986, Hydrological investiga-tion for the development and management of the Flori-dan aquifer, city of Dunedin: Consultant’s report in thefiles of the city of Dunedin, Florida
Causseaux, K.W., 1985, The surficial aquifer in PinellasCounty, Florida: U.S. Geological Survey Water-Resources Investigations Report 84-4289, 26 p.
Causseaux, K.W., and Fretwell, J.D., 1983, Chloride con-centrations in the coastal margin of the Floridan aqui-fer, southwest Florida: U.S. Geological Survey Water-Resources Investigations Report 82-4070, 33 p.
Cherry, R.N., and Brown, D.P., 1974, Hydrogeologicaspects of a proposed sanitary landfill near Old TampaBay, Florida: Florida Bureau of Geology Report ofInvestigations 68, 25 p.
Cherry, R.N., Stewart, J.W., and Mann, J.A., 1970, Generalhydrology of the middle Gulf area, Florida: FloridaBureau of Geology Report of Investigations 56, 96 p.
Driscoll, F.G., 1986, Groundwater and wells (2d ed.): St.Paul, Minn., Johnson Filtration Systems, Inc., 1089 p.
Ferris, J.G., Knowles, D.B., Brown, R.H., and Stallman,R.W., 1962, Theory of aquifer tests: U.S. GeologicalSurvey Water-Supply Paper 1536-E, 174 p.
Gilboy, A.E., 1985, Hydrogeology of the Southwest FloridaWater Management District: Southwest Florida WaterManagement District: Regional Analysis Section Tech-nical Report 85-01, 18 p.
Heath, R.C., and Smith, P.C., 1954, Ground water resourcesof Pinellas County Florida: Florida Geological SurveyReport of Investigations 12, 139 p.
Hem, J.D., 1985, Study and interpretation of the chemicalcharacteristics of natural water: U.S. Geological SurveyWater-Supply Paper 2254, 263 p.
Hickey, J.J., 1982, Hydrogeology and results of injectiontests at waste-injection test sites in Pinellas County,Florida: U.S. Geological Survey Water Supply Paper2183, 42 p.

References Cited 23
----- 1989, Circular convection during subsurface injectionof liquid waste, St. Petersburg, Florida: WaterResources Research, v. 25, no. 7, 1481-1494 p.
Hsieh, P.A., 1996, Deformation-induced changes in hydrau-lic head during ground-water withdrawal: GroundWater, v. 34, no. 6, p. 1082-1089.
Hutchinson, C.B., and Stewart, J.W., 1978, Geohydrologicevaluation of a landfill in a coastal area, St. Petersburg,Florida: U.S. Geological Survey Water-ResourcesInvestigations Report 77-78, 40 p.
Kipp, K.L., Jr., 1987, HST3D: A computer code for simula-tion of heat and solute transport in three-dimensionalground-water flow systems: U.S. Geological SurveyWater-Resources Investigations Report 86-4095, 519 p.
Knochenmus, L.A., and Swenson, E.S., 1996, Assessmentof the fresh- and brackish-water resources underlyingDunedin, Florida: U.S. Geological Survey Water-Resources Investigations Report 96-4164, 40 p.
Marella, R.L., 1992, Water withdrawals, use, and trends inFlorida: U.S. Geological Survey Water-ResourcesInvestigations Report 92-4140, 38 p.
Miller, J.A., 1986, Hydrogeologic framework of the Flori-dan aquifer system in Florida and in parts of Georgia,Alabama, and South Carolina: U.S. Geological SurveyProfessional Paper 1403-B, 91 p.
Seaburn and Robertson, Inc., 1983, Results of the hydro-logic testing program for the city of Clearwater watersupply investigation: Consultant’s report in the files ofthe city of Clearwater.
Sinclair, W.C., 1974, Hydrogeologic characteristics of thesurficial aquifer in northwest Hillsborough County,Florida: Florida Bureau of Geology Information Circu-lar 86, 98 p.
University of Florida, 1991, Florida population: Censussummary 1990: Gainesville, University of Florida,Bureau of Economic and Business Research, 55 p.
White, W.A., 1970, The geomorphology of the Florida Pen-insula: Florida Bureau of Geology Bulletin 51, 164 p.
Yobbi, D.K., 1996, Simulation of subsurface storage andrecovery of treated effluent injected in a saline aquifer,St. Petersburg, Florida: U.S. Geological Survey Water-Resources Investigations Report 95-4271, 29 p.