Hydrogeological Investigation and Analyzing Groundwater ... · greatly hampers the socio-economic...
7
International Research Journal of Engineering and Technology (IRJET) e-ISSN: 2395 -0056 Volume: 04 Issue: 02 | Feb -2017 www.irjet.net p-ISSN: 2395-0072 © 2017, IRJET | Impact Factor value: 5.181 | ISO 9001:2008 Certified Journal | Page 559 Hydrogeological Investigation and Analyzing Groundwater Scenario in Haringhata Block, West Bengal Alivia Chowdhury Department of Soil and Water Engineering Faculty of Agricultural Engineering Bidhan Chandra Krishi Viswavidyalaya (BCKV) Mohanpur, District-Nadia, 741252, West Bengal, India ----------------------------------------------------------------***------------------------------------------------------------- Abstract: A hydrogeological investigation was carried out in Haringhata Block, Nadia district, West Bengal to understand the groundwater scenario in the block. The groundwater condition and the stratigraphy were analyzed at seventeen sites of the study area. The rainfall-groundwater dynamics was also analyzed to understand the recharge condition in the study area. Groundwater level data was used for preparation of pre- and post-monsoon groundwater depth contour maps and a groundwater fluctuation map. The analysis of 5 years (2004-2008) seasonal groundwater level data of 17 sites indicated appreciable groundwater fluctuations over the area. The groundwater drops 5 to 8 m from the ground surface at most sites during the dry season, whereas, mean post-monsoon (November) groundwater depth varies from 2 to 4 m. It is concluded that long-term monitoring of groundwater level and understanding the rainfall-groundwater dynamics are helpful for formulating strategies for sustainable development and management of groundwater resources in the study area. Keywords: Hydrogeologic analysis, Aquifer characterization, Groundwater dynamics, water scarcity 1. INTRODUCTION Groundwater plays a central role in maintaining and ensuring the ecosystem and livelihood security of this planet. Nowadays groundwater has become a very dependable and popular freshwater resource in both urban and rural areas of our country due to it’s easy and ensured availability at the required time. The socio-economic dependency on groundwater can be explained over a wide range of factors [1]. Recent research shows that groundwater irrigation has overtaken surface-water irrigation as the main supplier of water for India’s crops. Quantitative and qualitative aquifer mining is the major outcomes of this unplanned over-exploitation of groundwater resources [2]. Therefore, policy makers must rise to the challenge of finding ways to manage groundwater resources sustainably. Haringhata Block located in southern part of Nadia district, West Bengal is suffering from water shortage problems both qualititatively and quantitatively. As the main occupation of the local people is agriculture, the water scarcity problem greatly hampers the socio-economic condition in the area. The block is mainly irrigated through extraction of ground water. There are 3477 shallow tube wells, 42 Deep Tube wells run by the Department of Agri-irrigation, Govt. of West Bengal. The existing surface irrigation sources are not sufficient to ensure proper quantity of water at required time due to the erratic nature of the rainfall in the country. Therefore, groundwater becomes an inevitable source of water supply in the study area. However, the unrestricted excessive pumping of groundwater has resulted in groundwater lowering problem in the area in past few years. In addition to that, the area has an arsenic contamination problem. The detrimental health effect has increased in recent years because of increased use of tube wells. Therefore, there is an urgent need to develop management strategies for the sustainable utilization of groundwater resources in the study area. With this background, a hydrogeological investigation was carried out to understand the groundwater scenario in Haringhata Block, Nadia district, West Bengal for the sustainable utilization of vulnerable groundwater resource of the area. The objectives of the present study were (i) to analyze available lithologic data to understand the aquifer system in the area, (ii) to explore groundwater dynamics in the study area.
Transcript of Hydrogeological Investigation and Analyzing Groundwater ... · greatly hampers the socio-economic...
International Research Journal of Engineering and Technology (IRJET) e-ISSN: 2395 -0056
Volume: 04 Issue: 02 | Feb -2017 www.irjet.net p-ISSN: 2395-0072
© 2017, IRJET | Impact Factor value: 5.181 | ISO 9001:2008 Certified Journal | Page 559
Hydrogeological Investigation and Analyzing Groundwater Scenario in
Haringhata Block, West Bengal
Alivia Chowdhury
Department of Soil and Water Engineering Faculty of Agricultural Engineering
Bidhan Chandra Krishi Viswavidyalaya (BCKV) Mohanpur, District-Nadia, 741252, West Bengal, India
----------------------------------------------------------------***-------------------------------------------------------------Abstract: A hydrogeological investigation was carried out in Haringhata Block, Nadia district, West Bengal to understand the groundwater scenario in the block. The groundwater condition and the stratigraphy were analyzed at seventeen sites of the study area. The rainfall-groundwater dynamics was also analyzed to understand the recharge condition in the study area. Groundwater level data was used for preparation of pre- and post-monsoon groundwater depth contour maps and a groundwater fluctuation map. The analysis of 5 years (2004-2008) seasonal groundwater level data of 17 sites indicated appreciable groundwater fluctuations over the area. The groundwater drops 5 to 8 m from the ground surface at most sites during the dry season, whereas, mean post-monsoon (November) groundwater depth varies from 2 to 4 m. It is concluded that long-term monitoring of groundwater level and understanding the rainfall-groundwater dynamics are helpful for formulating strategies for sustainable development and management of groundwater resources in the study area.
Keywords: Hydrogeologic analysis, Aquifer characterization, Groundwater dynamics, water scarcity
1. INTRODUCTION
Groundwater plays a central role in maintaining and ensuring the ecosystem and livelihood security of this planet. Nowadays groundwater has become a very dependable and popular freshwater resource in both urban and rural areas of our country due to it’s easy and ensured availability at the required time. The socio-economic dependency on groundwater can be explained over a wide range of factors [1]. Recent research shows that groundwater irrigation has overtaken surface-water irrigation as the main supplier of water for India’s crops. Quantitative and qualitative aquifer mining is the major outcomes of this unplanned over-exploitation of groundwater resources [2]. Therefore, policy makers must rise to the challenge of finding ways to manage groundwater resources sustainably.
Haringhata Block located in southern part of Nadia district, West Bengal is suffering from water shortage problems both qualititatively and quantitatively. As the main occupation of the local people is agriculture, the water scarcity problem greatly hampers the socio-economic condition in the area. The block is mainly irrigated through extraction of ground water. There are 3477 shallow tube wells, 42 Deep Tube wells run by the Department of Agri-irrigation, Govt. of West Bengal. The existing surface irrigation sources are not sufficient to ensure proper quantity of water at required time due to the erratic nature of the rainfall in the country. Therefore, groundwater becomes an inevitable source of water supply in the study area. However, the unrestricted excessive pumping of groundwater has resulted in groundwater lowering problem in the area in past few years. In addition to that, the area has an arsenic contamination problem. The detrimental health effect has increased in recent years because of increased use of tube wells. Therefore, there is an urgent need to develop management strategies for the sustainable utilization of groundwater resources in the study area. With this background, a hydrogeological investigation was carried out to understand the groundwater scenario in Haringhata Block, Nadia district, West Bengal for the sustainable utilization of vulnerable groundwater resource of the area. The objectives of the present study were (i) to analyze available lithologic data to understand the aquifer system in the area, (ii) to explore groundwater dynamics in the study area.
International Research Journal of Engineering and Technology (IRJET) e-ISSN: 2395 -0056
Volume: 04 Issue: 02 | Feb -2017 www.irjet.net p-ISSN: 2395-0072
© 2017, IRJET | Impact Factor value: 5.181 | ISO 9001:2008 Certified Journal | Page 560
2. MATERIALS AND METHODS
2.1 Study Area Description
Haringhata Block, study area of this present study, is located in extreme south of Nadia district of West Bengal. The geographical extent of Haringhata Block lies within a latitude of 22054/ N to 2302/ N and longitude of 88030/ E to 88041/ E which covers an area of about 170.32 Sq. Km. The location of the study area is shown in Figure1. The block comprises of 10 Gram Panchayats (GP). The block is bound by Chakdah block in the north and the west. South and east part of the block is bounded by North 24Parganas District. A small river system which is locally known as Jamuna is flowing through the block. The soil of the block is mostly clay loamy type. The climate of the block is characterized by oppressively hot summer, high humidity and high rainfall during the monsoon. Winter starts from the middle of November which continues up to the end of February. During the monsoon from June to September about 71% of annual rainfall occurs. The rainiest month is August. The mean annual rainfall is about 1400 mm. Average elevation of the block is 10 m from mean sea level.
Figure 1. Location map of the study area.
2.2 Data Collection and Analysis
Monthly rainfall data for the period of 2004-2008 were collected from the rainguage station monitored by B.C.K.V., Mohanpur, Nadia. In addition, the pre-monsoon and post-monsoon groundwater level data for the 2004-2008 period were collected for 17 sites over the Haringhata Block from State Water Investigation Directorate (SWID), Government of West Bengal, Kolkata; the location of the sites are shown in Fig 1. These groundwater level data were used for analyzing rainfall-groundwater dynamics as well as to prepare pre- and post-monsoon groundwater depth contour maps and a groundwater fluctuation map.
Moreover, the lithologic data at sventeen sites of Haringhata Block, were collected from the SWID, Kolkata. The lithologic data of different sites were used for stratigraphy analysis to know aquifer types, depth and thickness of main water-bearing strata and other subsurface layers in the study area.
3. RESULTS AND DISCUSSIONS
3.1 Sratigraphy of the Study Area
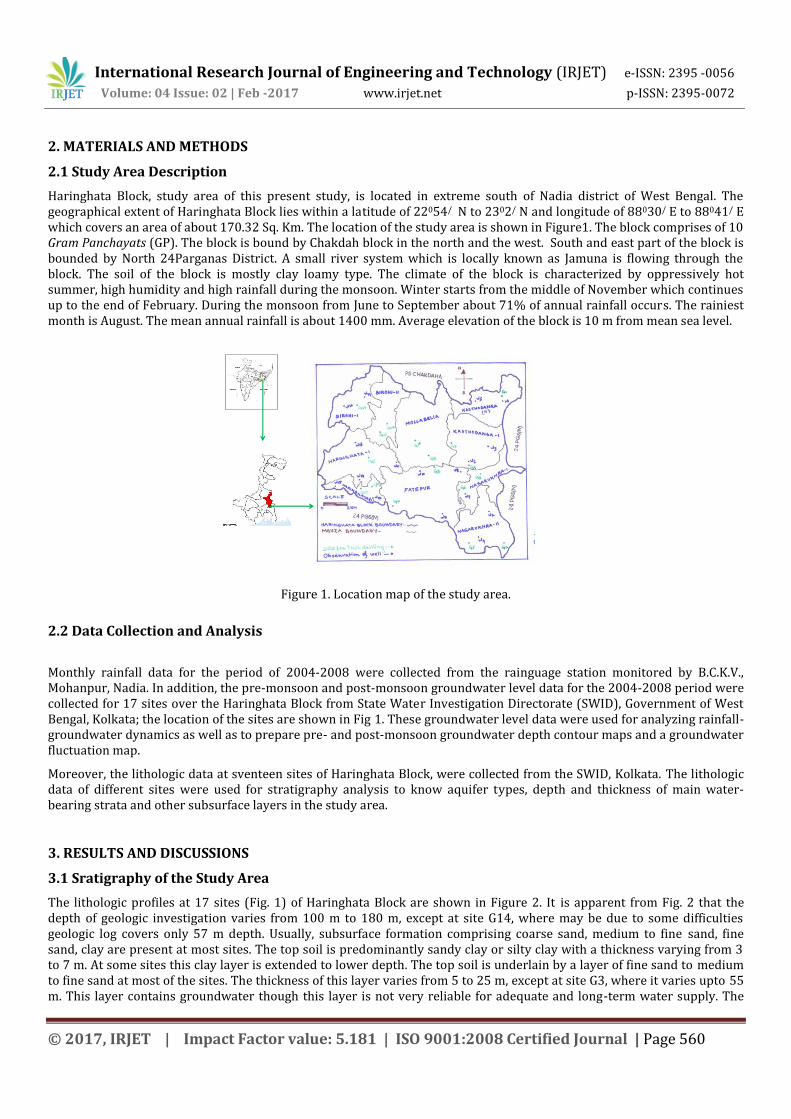
The lithologic profiles at 17 sites (Fig. 1) of Haringhata Block are shown in Figure 2. It is apparent from Fig. 2 that the depth of geologic investigation varies from 100 m to 180 m, except at site G14, where may be due to some difficulties geologic log covers only 57 m depth. Usually, subsurface formation comprising coarse sand, medium to fine sand, fine sand, clay are present at most sites. The top soil is predominantly sandy clay or silty clay with a thickness varying from 3 to 7 m. At some sites this clay layer is extended to lower depth. The top soil is underlain by a layer of fine sand to medium to fine sand at most of the sites. The thickness of this layer varies from 5 to 25 m, except at site G3, where it varies upto 55 m. This layer contains groundwater though this layer is not very reliable for adequate and long-term water supply. The
International Research Journal of Engineering and Technology (IRJET) e-ISSN: 2395 -0056
Volume: 04 Issue: 02 | Feb -2017 www.irjet.net p-ISSN: 2395-0072
© 2017, IRJET | Impact Factor value: 5.181 | ISO 9001:2008 Certified Journal | Page 561
0.00
20.00
40.00
60.00
80.00
100.00
120.00
140.00
160.00
180.00
200.00
G1 G4 G5 G6 G8 G13 G14 G16
Well Log Site
Dep
th, m
top soil fine sand clay coarse sandfine sand coarse sand clay medium to fine sandcoarse sand clay fine sand medium to fine sandcoarse sand medium to fine sand fine sand coarse sandclay medium to fine sand coarse sand claymedium to fine sand coarse sand sand stone coarse sandclay
0
1
2
3
4
5
6
7
8
9
10
pre'06 post'06 pre'07 post'07 pre'08 post'08
Dep
th
to
waterle
vel (m
bg
l)
W1 W4 W6 W7 W10 W12 W14 W16
subsurface formation pattern changes in the extreme west and south-west of the block, where the top soil is underlain by clay layer. The thickness of this layer varies from 6 to 75 m. The main aquifer exists below this layer in this zone.
Figure 2. Lithologic profiles of Haringhata Block t 17 sites
3.2 Groundwater Characteristic
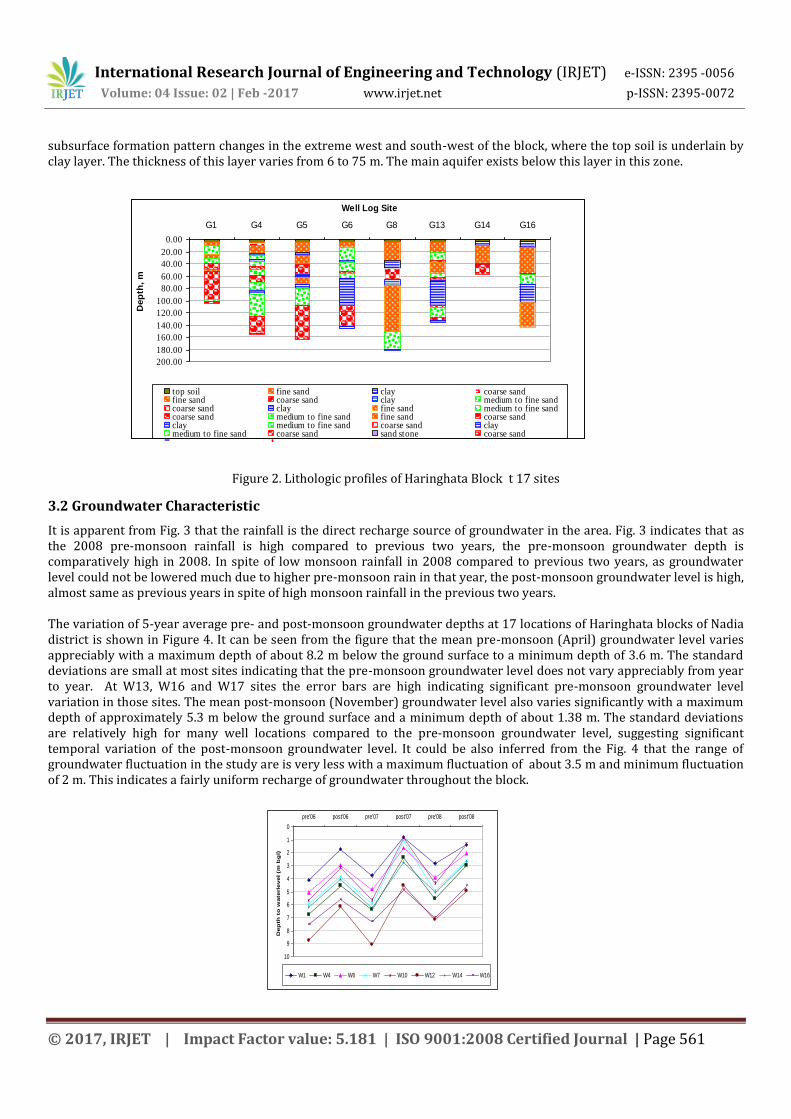
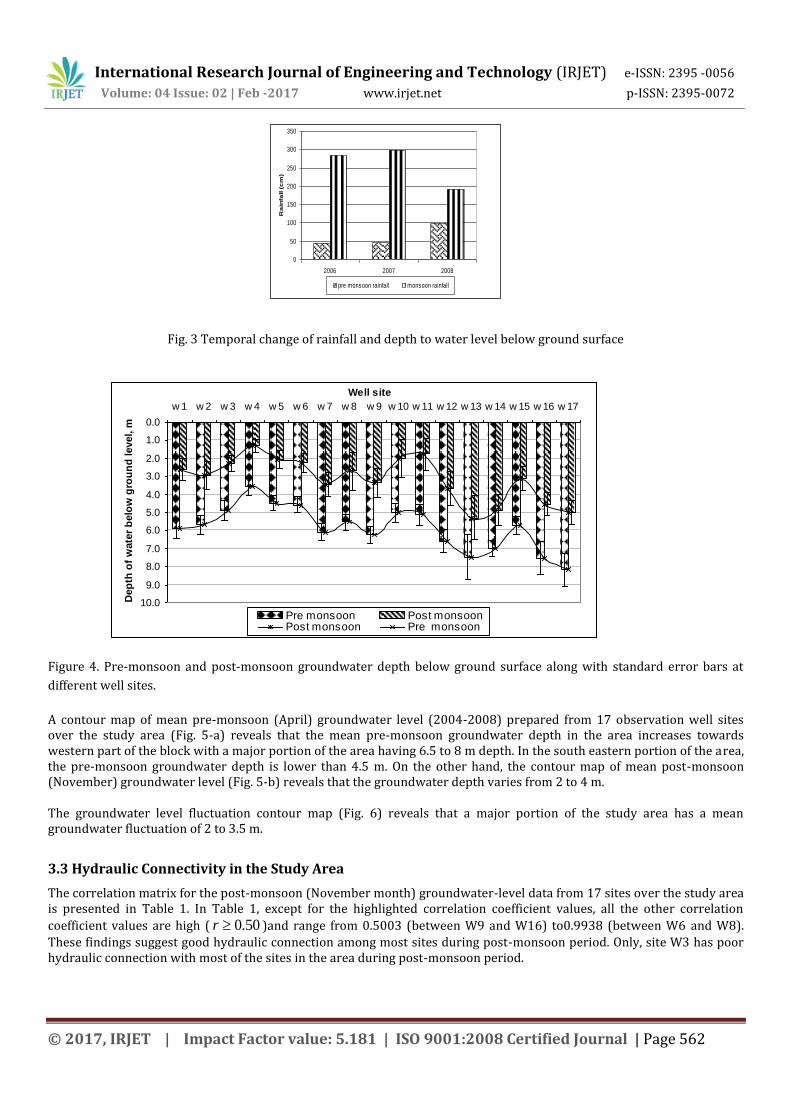
It is apparent from Fig. 3 that the rainfall is the direct recharge source of groundwater in the area. Fig. 3 indicates that as the 2008 pre-monsoon rainfall is high compared to previous two years, the pre-monsoon groundwater depth is comparatively high in 2008. In spite of low monsoon rainfall in 2008 compared to previous two years, as groundwater level could not be lowered much due to higher pre-monsoon rain in that year, the post-monsoon groundwater level is high, almost same as previous years in spite of high monsoon rainfall in the previous two years. The variation of 5-year average pre- and post-monsoon groundwater depths at 17 locations of Haringhata blocks of Nadia district is shown in Figure 4. It can be seen from the figure that the mean pre-monsoon (April) groundwater level varies appreciably with a maximum depth of about 8.2 m below the ground surface to a minimum depth of 3.6 m. The standard deviations are small at most sites indicating that the pre-monsoon groundwater level does not vary appreciably from year to year. At W13, W16 and W17 sites the error bars are high indicating significant pre-monsoon groundwater level variation in those sites. The mean post-monsoon (November) groundwater level also varies significantly with a maximum depth of approximately 5.3 m below the ground surface and a minimum depth of about 1.38 m. The standard deviations are relatively high for many well locations compared to the pre-monsoon groundwater level, suggesting significant temporal variation of the post-monsoon groundwater level. It could be also inferred from the Fig. 4 that the range of groundwater fluctuation in the study are is very less with a maximum fluctuation of about 3.5 m and minimum fluctuation of 2 m. This indicates a fairly uniform recharge of groundwater throughout the block.
International Research Journal of Engineering and Technology (IRJET) e-ISSN: 2395 -0056
Volume: 04 Issue: 02 | Feb -2017 www.irjet.net p-ISSN: 2395-0072
© 2017, IRJET | Impact Factor value: 5.181 | ISO 9001:2008 Certified Journal | Page 562
0
50
100
150
200
250
300
350
2006 2007 2008R
ain
fall (
cm
)
pre monsoon rainfall monsoon rainfall
0.0
1.0
2.0
3.0
4.0
5.0
6.0
7.0
8.0
9.0
10.0
w 1 w 2 w 3 w 4 w 5 w 6 w 7 w 8 w 9 w 10 w 11 w 12 w 13 w 14 w 15 w 16 w 17
Well site
Dep
th o
f w
ate
r b
elo
w g
rou
nd
level, m
Pre monsoon Post monsoonPost monsoon Pre monsoon
Fig. 3 Temporal change of rainfall and depth to water level below ground surface
Figure 4. Pre-monsoon and post-monsoon groundwater depth below ground surface along with standard error bars at
different well sites.
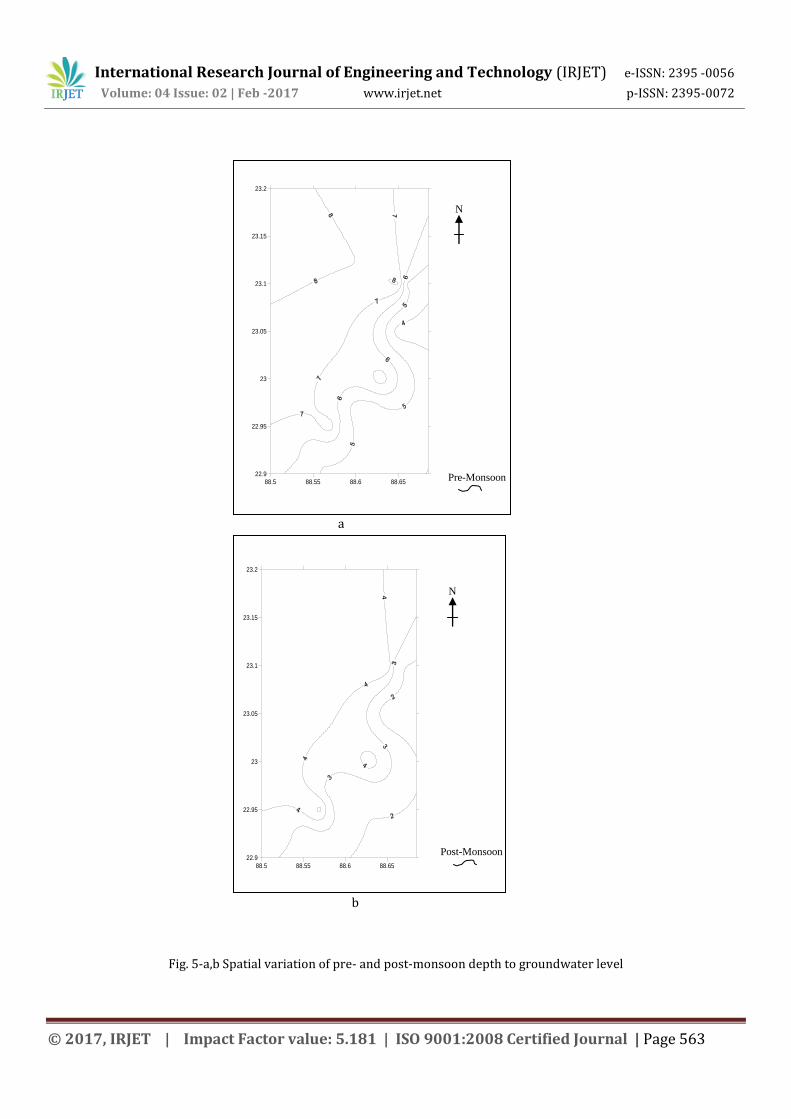
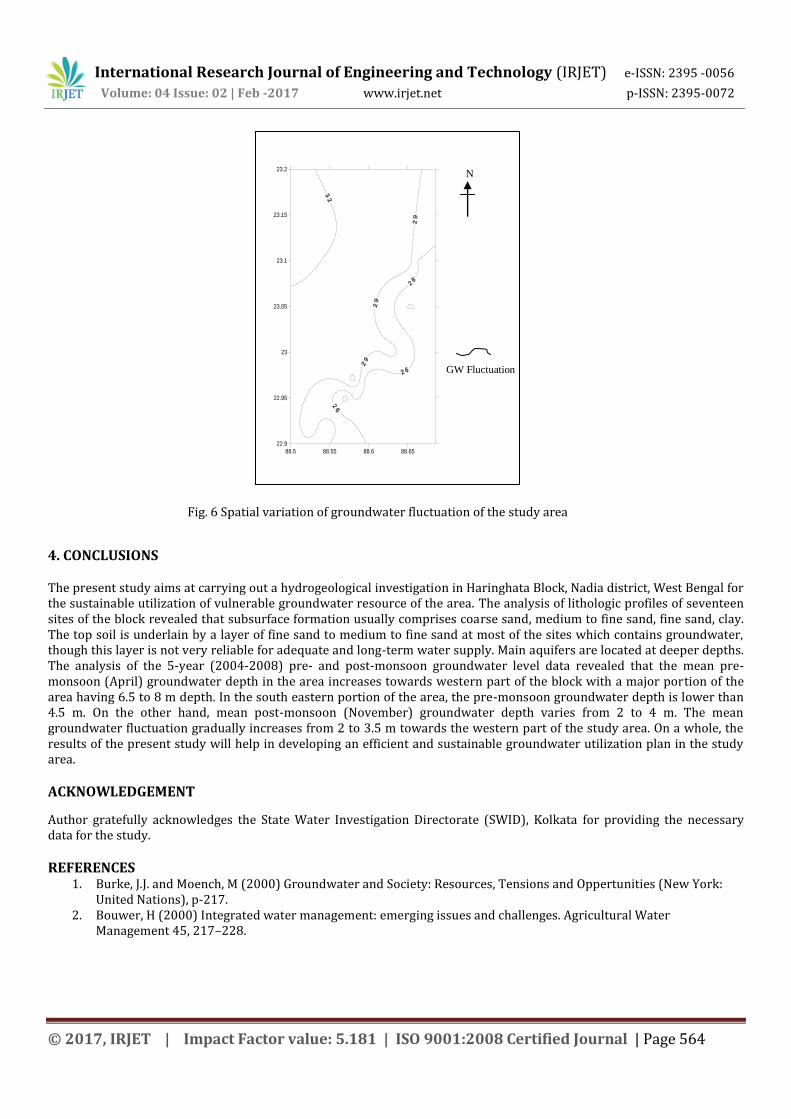
A contour map of mean pre-monsoon (April) groundwater level (2004-2008) prepared from 17 observation well sites over the study area (Fig. 5-a) reveals that the mean pre-monsoon groundwater depth in the area increases towards western part of the block with a major portion of the area having 6.5 to 8 m depth. In the south eastern portion of the area, the pre-monsoon groundwater depth is lower than 4.5 m. On the other hand, the contour map of mean post-monsoon (November) groundwater level (Fig. 5-b) reveals that the groundwater depth varies from 2 to 4 m. The groundwater level fluctuation contour map (Fig. 6) reveals that a major portion of the study area has a mean groundwater fluctuation of 2 to 3.5 m.
3.3 Hydraulic Connectivity in the Study Area
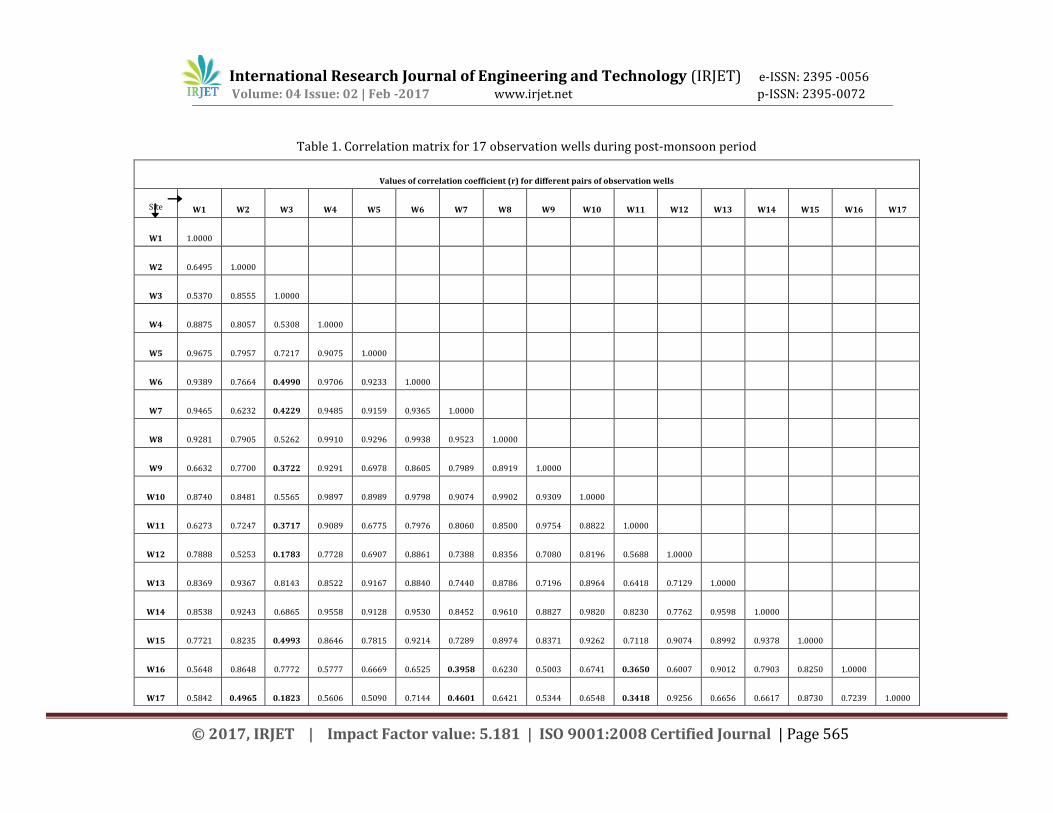
The correlation matrix for the post-monsoon (November month) groundwater-level data from 17 sites over the study area is presented in Table 1. In Table 1, except for the highlighted correlation coefficient values, all the other correlation
coefficient values are high ( 50.0r )and range from 0.5003 (between W9 and W16) to0.9938 (between W6 and W8).
These findings suggest good hydraulic connection among most sites during post-monsoon period. Only, site W3 has poor hydraulic connection with most of the sites in the area during post-monsoon period.
International Research Journal of Engineering and Technology (IRJET) e-ISSN: 2395 -0056
Volume: 04 Issue: 02 | Feb -2017 www.irjet.net p-ISSN: 2395-0072
© 2017, IRJET | Impact Factor value: 5.181 | ISO 9001:2008 Certified Journal | Page 563
Fig. 5-a,b Spatial variation of pre- and post-monsoon depth to groundwater level
88.5 88.55 88.6 88.65
22.9
22.95
23
23.05
23.1
23.15
23.2
N
Pre-Monsoon
GW depth
a
88.5 88.55 88.6 88.65
22.9
22.95
23
23.05
23.1
23.15
23.2
N
Post-Monsoon
GW depth
b
International Research Journal of Engineering and Technology (IRJET) e-ISSN: 2395 -0056
Volume: 04 Issue: 02 | Feb -2017 www.irjet.net p-ISSN: 2395-0072
© 2017, IRJET | Impact Factor value: 5.181 | ISO 9001:2008 Certified Journal | Page 564
4. CONCLUSIONS
The present study aims at carrying out a hydrogeological investigation in Haringhata Block, Nadia district, West Bengal for the sustainable utilization of vulnerable groundwater resource of the area. The analysis of lithologic profiles of seventeen sites of the block revealed that subsurface formation usually comprises coarse sand, medium to fine sand, fine sand, clay. The top soil is underlain by a layer of fine sand to medium to fine sand at most of the sites which contains groundwater, though this layer is not very reliable for adequate and long-term water supply. Main aquifers are located at deeper depths. The analysis of the 5-year (2004-2008) pre- and post-monsoon groundwater level data revealed that the mean pre-monsoon (April) groundwater depth in the area increases towards western part of the block with a major portion of the area having 6.5 to 8 m depth. In the south eastern portion of the area, the pre-monsoon groundwater depth is lower than 4.5 m. On the other hand, mean post-monsoon (November) groundwater depth varies from 2 to 4 m. The mean groundwater fluctuation gradually increases from 2 to 3.5 m towards the western part of the study area. On a whole, the results of the present study will help in developing an efficient and sustainable groundwater utilization plan in the study area.
ACKNOWLEDGEMENT
Author gratefully acknowledges the State Water Investigation Directorate (SWID), Kolkata for providing the necessary data for the study.
REFERENCES 1. Burke, J.J. and Moench, M (2000) Groundwater and Society: Resources, Tensions and Oppertunities (New York:
United Nations), p-217. 2. Bouwer, H (2000) Integrated water management: emerging issues and challenges. Agricultural Water
Management 45, 217–228.
GW Fluctuation
N 23.2
23.15
23.1
23.05
23
22.95
22.9
88.5 88.55 88.6 88.65
Fig. 6 Spatial variation of groundwater fluctuation of the study area
International Research Journal of Engineering and Technology (IRJET) e-ISSN: 2395 -0056
Volume: 04 Issue: 02 | Feb -2017 www.irjet.net p-ISSN: 2395-0072
© 2017, IRJET | Impact Factor value: 5.181 | ISO 9001:2008 Certified Journal | Page 565
Table 1. Correlation matrix for 17 observation wells during post-monsoon period
Values of correlation coefficient (r) for different pairs of observation wells
Site W1 W2 W3 W4 W5 W6 W7 W8 W9 W10 W11 W12 W13 W14 W15 W16 W17
W1 1.0000
W2 0.6495 1.0000
W3 0.5370 0.8555 1.0000
W4 0.8875 0.8057 0.5308 1.0000
W5 0.9675 0.7957 0.7217 0.9075 1.0000
W6 0.9389 0.7664 0.4990 0.9706 0.9233 1.0000
W7 0.9465 0.6232 0.4229 0.9485 0.9159 0.9365 1.0000
W8 0.9281 0.7905 0.5262 0.9910 0.9296 0.9938 0.9523 1.0000
W9 0.6632 0.7700 0.3722 0.9291 0.6978 0.8605 0.7989 0.8919 1.0000
W10 0.8740 0.8481 0.5565 0.9897 0.8989 0.9798 0.9074 0.9902 0.9309 1.0000
W11 0.6273 0.7247 0.3717 0.9089 0.6775 0.7976 0.8060 0.8500 0.9754 0.8822 1.0000
W12 0.7888 0.5253 0.1783 0.7728 0.6907 0.8861 0.7388 0.8356 0.7080 0.8196 0.5688 1.0000
W13 0.8369 0.9367 0.8143 0.8522 0.9167 0.8840 0.7440 0.8786 0.7196 0.8964 0.6418 0.7129 1.0000
W14 0.8538 0.9243 0.6865 0.9558 0.9128 0.9530 0.8452 0.9610 0.8827 0.9820 0.8230 0.7762 0.9598 1.0000
W15 0.7721 0.8235 0.4993 0.8646 0.7815 0.9214 0.7289 0.8974 0.8371 0.9262 0.7118 0.9074 0.8992 0.9378 1.0000
W16 0.5648 0.8648 0.7772 0.5777 0.6669 0.6525 0.3958 0.6230 0.5003 0.6741 0.3650 0.6007 0.9012 0.7903 0.8250 1.0000
W17 0.5842 0.4965 0.1823 0.5606 0.5090 0.7144 0.4601 0.6421 0.5344 0.6548 0.3418 0.9256 0.6656 0.6617 0.8730 0.7239 1.0000