HYDROGEN PRODUCTION FROM WATER USING …library.iyte.edu.tr/tezler/master/enerjimuh/T000633.pdfUSING...
94
i HYDROGEN PRODUCTION FROM WATER USING SOLAR CELLS POWERED NAFION MEMBRANE ELECTROLYZERS A Thesis Submitted to The Graduate School of Engineering and Sciences of Đzmir Institute of Technology In Partial Fulfillment of the Requirements for the Degree of MASTER OF SCIENCE in Energy Engineering (Energy and Power Systems) by Ziya Can Aksakal July 2007 ĐZMĐR DOCTOR OF PHILOSOPHY
Transcript of HYDROGEN PRODUCTION FROM WATER USING …library.iyte.edu.tr/tezler/master/enerjimuh/T000633.pdfUSING...
i
HYDROGEN PRODUCTION FROM WATER
USING SOLAR CELLS POWERED NAFION
MEMBRANE ELECTROLYZERS
A Thesis Submitted to The Graduate School of Engineering and Sciences of
Đzmir Institute of Technology In Partial Fulfillment of the Requirements for the Degree of
MASTER OF SCIENCE
in Energy Engineering
(Energy and Power Systems)
by Ziya Can Aksakal
July 2007 ĐZMĐR
DOCTOR OF PHILOSOPHY

ii
We approve the thesis of Ziya Can Aksakal
Date of Signature
………………………… 19 July 2007
Assist. Prof. Dr. Erol Şeker Supervisor Department of Chemical Engineering Đzmir Institute of Technology ………………………… 19 July 2007 Assoc. Prof. Dr. Gülden Gökçen Co- supervisor Department of Mechanical Engineering Đzmir Institute of Technology ………………………… 19 July 2007 Assist. Prof. Dr. Fikret Đnal Department of Chemical Engineering Đzmir Institute of Technology ………………………… 19 July 2007 Prof. Dr. Tamerkan Özgen Department of Chemistry Đzmir Institute of Technology ………………………… 19 July 2007 Assist. Prof. Dr. Yusuf Selamet Department of Physics Đzmir Institute of Technology ………………………… 19 July 2007 Assoc. Prof. Dr. Gülden Gökçen Head of Department Đzmir Institute of Technology
……………………………
Prof Dr. M. Barış ÖZERDEM
Head of the Graduate School

iii
ACKNOWLEDGEMENTS
This study was carried out at the program of Energy Engineering and at the
department of Chemical Engineering, Izmir Institute of Technology during the years 2004-
2007. The study was funded through the Department of Prime Ministry State Planning
Organization
I express my warmest gratitude to my supervisors Dr. Gülden Gökçen and Dr. Erol
Şeker for introducing me to the promising world of hydrogen and its related applications.
Their endless supports and contributions throughout the course of this thesis encourage me
to pull of this work.
I would like to thank Dr. Fikret Đnal, Dr. Sacide Alsoy Altınkaya, Dr. Zafer Đlken for
their valuable teachings during my undergraduate and graduate.
I wish to thank Güler Narin for her patience and guidance on testing my hydrogen
samples and wish to thank Mahir Tosun for his hard data gathering work in Iztech Weather
Station and for his sharing.
I am grateful to the whole stuff of Department of Mechanical and Department of
Chemical Engineering for their help and technical assistance.
I express my thanks to all my friends and colleagues; Serdar Özer, Özge Malay,
Güler Aslan, Dane Ruscuklu, Erkin Gezgin for their friendship and for taking my mind out
of the work from time to time.
Finally my special thanks go to my family Kerem Aksakal, Gülser Aksakal, Burhan
Aksakal, Ziya Yavuz and Pervin Yavuz for their support.

iv
ABSTRACT
HYDROGEN PRODUCTION FROM WATER USING SOLAR CELLS
POWERED NAFION MEMBRANE ELECTROLYZERS
The aims of this thesis are two folds; to construct single and multi cell proton
exchange membrane electrolyzers and to evaluate the performance of these electrolyzers
powered by solar panels on Iztech campus. All other parts, except the purchased membrane
electrode assemblies, were designed, manufactured and assembled in our labs.
In the construction of single and multiple cell proton exchange membrane
electrolyzers, Nafion-117 based membrane electrode assemblies were used. Graphite
bipolar plates, end plates, current collectors and gaskets were machined on institute’s
computer numerical controlled lathe.
In the first stage, a single cell electrolyzer with 20cm2 available electrolysis surface
areas was examined with a direct current power supply by varying current density (0-
500mAmp/cm2), water flow rate (0.05 to 0.5g/cm2min), and temperature (30-50oC). It was
found that average cell voltage decreases from 2.18V at 30oC to 1.97V at 50oC when the
current density is 500mAmp/cm2. Since cell gaskets were softened and stick to the
membrane above 50oC of operating temperature, temperatures higher than 50 oC could not
be tested.
5 cell electrolyzer stack was constructed according to the final single cell design. It was
observed that the stack could generate 388ml/min hydrogen under 500mAmp/cm2 and
10.09V of the operating condition at 41.5oC. When the stack was directly coupled with a
solar array, voltage of the stack was found to vary from 7.5V to 12.5V and the current
density changes from 0 to 1000mAmp/cm2 with respect to the solar radiance of the day.
This results in a voltage efficiency ranging from 98.7% to 60% based on the higher heating
value of hydrogen. Electrolyzer powered by solar cells can generate up to 750ml/min
hydrogen and total daily production could be as high as 350L per day but weather condition
greatly affects the production rate. Together with the losses inside the electrolyzer, another
important energy loss is due to voltage mismatches between PV array and electrolyzer in
low solar irradiance during sunrise and sunset.

v
ÖZET
GÜNEŞ PĐLLERĐ ĐLE ÇALIŞAN NAFION MEMBRAN
ELEKTROLĐZÖRLER ĐLE SUDAN HĐDROJEN ÜRETĐMĐ
Bu çalışmanın amaçları iki ana başlıkta incelemek gerekirse öncelikle proton
geçirgen membran tipinde tek ve çok hücreli elektrolizörler imal etmek daha sonra da bu
elektrolizörleri Đzmir Yüksek Teknoloji Enstitüsü`nde kurulan fotovoltaik paneller ile
biraraya getirerek kampüsümüzde güneş enerjisinden hidrojen üretmektir. Katalist kaplı
membranlar haricinde, grafit ara ve son yüzeyler, sıkıştırma levhaları, silikon contalar vb.
malzemelerin tamamı enstitümüzdeki bilgisayar kontrollü tezgahlarda yapılıp biraraya
getirilerek tek ve çok hücreli elektrolizörler imal edilmiştir.
Yapılan bütün elektrolizörlerde DuPont firmasının Nafion-117 serisi membranları
kullanılmış olup ilk aşamada 20 cm2 aktif yüzey alanına sahip tek hücreli elektrolizörler
imal edilmiştir. Değişen akım yoğunluğu (0-500mAmp/cm2), çalışma sıcaklığı (30-50oC)
ve su beslemesinde 1-10gr/d hücre verimi gözlenmiştir. Görülmüştür ki 30oC de 2.18V olan
ortalama hücre voltajı 50oC de 1.97V’a düşmüş daha da yüksek sıcaklılara çıkılmaya
çalışıldığında hücre contaları eriyerek gaz kanallarını tıkamış ve membrana yapışmıştır.
Đmal edilen son tek hücreli elektrolizör tasarımı baz alınarak 5 hücreli bir
elektrolizör imal edilmiştir. 41.5oC de çalışır iken 500mAmp/cm2 akım yoğunluğunda
10.09V gerilim ile çalıabilen bu elektrolizör aynı akım yoğunluğunda dakikada 388ml
hidrojen çıkışı verebilmektedir. Aynı elektrolizöre fotovoltaik modüller ile enerji verilmiş
ve mevsimsel deneyler sonucunda, elektrolizör akım yoğunluğunun 0 ile 1000mAmp/cm2
arası değişir iken gerilimin 7.5V ile 12.5V arasında değiştiği gözlemlenmiştir. Maksimum
750ml/d hidrojen üretebilen sistemin günlük üretimi hava koşullarına göre 50 ila 350L
arasında değişmiştir.
Elektrolizörden kaynaklanan verim kayıplarının yanısıra, sistemdeki önemli bir
başka enerji kaybı da elektrolizör çalışma voltaj aralığının fotovoltaik panellerin
maksimum enerji üretim noktasındaki voltajına olan uzaklığından kaynaklanmıştır.

vi
TABLE OF CONTENTS
LIST OF FIGURES ....................................................................................................... viii
LIST OF TABLES............................................................................................................ x
CHAPTER 1. INTRODUCTION .................................................................................. 1
CHAPTER 2. LITERATURE SURVEY....................................................................... 9
2.1. Hydrogen Production Methods............................................................. 9
2.2. Electrolyzers ...................................................................................... 11
2.2.1. Proton Exchange Membrane Electrolyzer ................................... 13
2.2.1.1 Thermodynamics of a PEM Electrolysis Cell...................... 14
2.2.1.2.Proton Exchange Membrane of an Electrolyzer Cell........... 17
2.2.1.3.Membrane Electrode Assembly and Electrode Structure
of Proton Exchange Membrane Electrolysis Cell ................ 19
2.2.1.4 Bipolar Plates ....................................................................... 24
2.2.1.5.Solar Power Driven Proton Exchange Membrane
Electrolyzer Application ...................................................... 27
CHAPTER 3. MATERIALS AND METHODS.......................................................... 30
3.1. Materials and Equipments .................................................................. 30
3.2. Methods .............................................................................................. 31
3.2.1. Producing the PEM Electrolysis Cell ........................................... 31
3.2.2. Assembly and Test Procedure for the PEM Electrolysis Cell ...... 34
3.2.3. PEM Electrolysis Stacks .............................................................. 36
3.2.4. Assembly and Test Procedure for a Multi Cell Electrolyzer ........ 38
3.2.5. Assembly and Test Procedure for the Solar Power Driven
PEM Electrolysis Stack ................................................................. 40
CHAPTER 4. RESULTS AND DISCUSSION ........................................................... 42
4.1. Electrolyzer Manufacturing Experiences on a
Single Cell Electrolyzer...................................................................... 42

vii
4.2. Results on a Single Cell PEM Electrolyzer ........................................ 48
4.2.1. Effects of Temperature on PEM Electrolysis ............................... 49
4.2.2. Effects of Excess Water Flow on PEM Electrolysis..................... 52
4.3. Results on a 5 cell PEM Electrolyzer Stack ....................................... 56
4.4. Results on a Solar Power Driven 5 Cell PEM Electrolyzer Stack...... 58
CHAPTER 5. CONCLUSIONS................................................................................... 66
REFERENCES .............................................................................................................. 69
APPENDICES
APPENDIX A Hydrogen Production Results from Various Days ................................ 72
APPENDIX B Mass Balance of the 5 Cell Stack Electrolyzer ...................................... 77

viii
LIST OF FIGURES
Figure 2.1. Various sources for electroylsis .....................................................................43
Figure 2.2. Schematic represantation of a PEM electrolysis cell .....................................14
Figure 2.3. Molecular Formula of Nafion.........................................................................19
Figure 3.1. 2D Schematic representation of an electrolysis cell.......................................32
Figure 3.2. Anode side of the electrolysis cell..................................................................44
Figure 3.3. Cathode side of the electrolysis cell ...............................................................33
Figure 3.4. Parts of an electrolysis cell .............................................................................34
Figure 3.5. Single cell electrolysis setup ..........................................................................36
Figure 3.6. 2D schematic representation of a PEM electrolysis stack..............................37
Figure 3.7. a) Front Side of the bipolar plate........................................................................45
b) Rear Side of the bipolar plate .........................................................................37 Figure 3.8. Two cell electrolysis stack .............................................................................38
Figure 3.9. Multi Cell Electrolysis Stack Test Setup........................................................40
Figure 3.10. Solar power driven electrolyzer stack setup...................................................47
Figure 4.1. X” type flow field design ...............................................................................43
Figure 4.2. Pin Type Flow Field .......................................................................................44
Figure 4.3. Empty Flow Field ...........................................................................................45
Figure 4.4. Empty Flow field with crosswise ducts..........................................................44
Figure 4.5. Results of Electrolysis Trials..........................................................................48
Figure 4.6. (a-d) Temperature Effect on Electrolysis .......................................................50
Figure 4.7. Voltage of the cells at 500mAmp/cm2 ...........................................................51
Figure 4.8. Minimum and Thermoneutral Electrolysis Voltage .......................................51
Figure 4.9. (a)-(c) Excess Water Flow Effect on Electrolysis ..........................................53
Figure 4.10. Voltage of the cells at 500mAmp/cm2 ...........................................................54
Figure 4.11. Calculated and Measured Oxygen and Hydrogen Flows ...............................55
Figure 4.12. Current Voltage Curves of the Cells of an Electrolyzer Stack.......................56
Figure 4.13. Hydrogen Production vs. Current Density .....................................................57
Figure 4.14. Current-Voltage Curves of a PV Module.......................................................58
Figure 4.15. Solar Radiance Data on 18.12.2006 ...............................................................60

ix
Figure 4.16. Hydrogen Production and Stack Temperature on 18.12.2006 .........................60
Figure 4.17. Hydrogen Production and Stack Temperature at 09.01.2007 ..........................61
Figure 4.18. Solar Radiance on 22.02.2007..........................................................................62
Figure 4.19. Hydrogen Production and Stack Temperature on 22.02.2007 .........................62
Figure 4.20. Solar Radiance on 14.05.2007..........................................................................63
Figure 4.21. Hydrogen Production and Stak Temperature on 14.05.2007 ...........................64
Figure A.1. Hydrogen Production and Stack Temperature at 18.12.2006...........................72
Figure A.2. Hydrogen Production and Stack Temperature at 09.01.2007...........................72
Figure A.3. Hydrogen Production and Stack Temperature at 01.02.2007...........................73
Figure A.4. Hydrogen Production and Stack Temperature at 22.02.2007...........................73
Figure A.5. Hydrogen Production and Stack Temperature at 02.03.2007...........................74
Figure A.6. Hydrogen Production and Stack Temperature at 27.03.2007...........................74
Figure A.7. Hydrogen Production and Stack Temperature at 06.04.2007...........................75
Figure A.8. Hydrogen Production and Stack Temperature at 24.04.2007...........................75
Figure A.9. Hydrogen Production and Stack Temperature at 01.05.2007...........................76
Figure A.10.Hydrogen Production and Stack Temperature at 14.05.2007...........................76
Figure B.1. Stream Numbers of the System ........................................................................77
Figure B.2 Input and output streams of the graduated cylinder..........................................82
Figure B.3 Input and output streams of the eleectrolyzer...................................................83
Figure B.4. Overall Mass Balance of the System .................................................................84

x
LIST OF TABLES
Table 1.1. Turkey`s energy usage as a function of the energy sources ...............................3
Table 1.2. Types of Electrolyzers ........................................................................................6
Table 2.1. Electrode types versus cell potential.................................................................45
Table 2.2. Electrodes versus cell potential ........................................................................23
Table 3.1. Properties of materials used in electrolysis cell................................................44
Table B.1. Measured Stream Units .....................................................................................77
Table B.2. Recorded Outputs of the Steady State System..................................................78
Table B.3. Mass Balance of Species on the Overall System ..............................................79
Table B.4. Stream 6 ............................................................................................................79
Table B.5. Stream 5 ............................................................................................................80
Table B.6. Stream 2 ............................................................................................................80
Table B.7. Stream 4 ............................................................................................................80
Table B.8. Stream 3 ............................................................................................................81
Table B.9. Overall Mass Balance of Species......................................................................81
Table B.10. Calculation of Liquid Water in Stream 4 ..........................................................82
Table B.11. Validation of the Overall Mass Balance of the System ....................................83

1
CHAPTER 1
INTRODUCTION
World energy consumption was reported to be above 10.5 billion tones of oil
equivalent in 2005 and also found that it was increasing due to both the world population
growth and the increasing life standards of humans with an average of 2.5% every year
since sixties (BP-WSR 2006). Almost ninety percent of the energy used in the world has
been supplied from fossil fuels but it was estimated that the economically accessible fossil
fuel resources would finish soon according to “Hubbert’s Peak” theory. The theory tells
that as the world’s energy demand increases, the production rates of fossil fuels are
increased. This relationship continues up to a time when there will be no economical fossil
fuel reserves available and thus, after this time, the production of primary fuels starts to
decrease and according to supply/demand relationship, the fuel prices start to increase
(Hubbert 1956). Therefore, in recent years, studies on alternative fuels and renewable
energy resources have been increased. Although there are many proposed energy
conversion systems using alternative fuels, such as biomass, hydrogen or biodiesel, there is
no unique and viable solution.
All the developing countries and many of the developed countries are using fossil
fuels as their primary energy source (an average of 87.6% of energy supply comes from
fossil fuels in 2005). 27.1%, 36.8% and 23.7% of worldwide energy needs are provided by
coal, oil and natural gas respectively (BP-WSR 2006). In addition, nuclear and
hydroelectric energies are also used but their contributions to world energy demand are not
as significant as the fossil fuels since they can produce electricity and their contributions to
energy supply are limited with electric consumption. In fact, the nuclear and hydroelectric
energy usages provide 6.1% and 6.2% of the total energy demand, respectively. Power
productions from renewable energy sources, such as solar, wind or wave with the exception
of hydroelectric are insignificant as compared to that from fossil fuels power generation.
Although the energy demand is increasing continuously and fossil fuels are not
renewable, United States Department of Energy claims that the world fossil fuel reserve to
annual production ratio is not changing seriously due to the exploration of new fossil fuel

2
reserves (DOE-AEO 2006). According to British Petrol reports, the total proven oil could
last for 40 years, the natural gas can last for 66 years and the coal reserves would be
depleted in 164 years if the world continues to consume energy sources at the today’s
consumption rates (BP-WSR 2006). The thing overlooked is the easily accessible fossil
reserves are almost depleted and the required utilization and capital costs per unit fossil fuel
is increasing; hence it seems to be unfeasible to explore and use new fossil fuel areas in
near future. Similarly, nuclear energy based on fission technology is not an alternative
solution due to its low reserves and unresolved problems, such as handling and storage of
highly toxic and carcinogenic wastes with very long half times. Also, hydroelectricity will
not be able to meet the increasing energy usage because the electricity produced in dams
can only supply 15% of the total electric demand if all the available potential water
resources are used (DOE-AEO 2006).
Looking to the Hubbert’s Peak phenomena from Turkey’s perspective is not a
heartwarming situation either. Similar to other developing countries Turkey’s energy
demand is increasing continuously. Though, fossil fuel reserves and the mining activities
(except lignite) of the country are limited. The most important fossil reserve is coal which
is roughly 9 billion tones where 8 billion is in the lignite form (WEB_3 2007). Hence, the
economy in Turkey is very much dependent on oil and natural gas imports. Total oil
equivalent primary energy consumption in Turkey is 91.5 million tons in 2006, where 30.0
million tones are from oil, 14.75 from natural gas 31.7 from coal and 8.8 from
hydroelectricity (WEB_2 2007). The oil production in Turkey is 2.28 million tons in 2006
from oil reserves located near Hakkari and Batman which meets 7.6% of total oil
consumption, also 0.98 billion cubic meter of natural gas production meets 3.6% of total
natural gas consumption (WEB_2 2007). As a result, Turkey’s energy production rate is
much less than its consumption; thus Turkey is a fossil fuel (including coal) importer. Table
1.1 summarize the production and consumption of the energy sources in Turkey in 2004
according to Department of Energy and Natural Sources Ministry of Turkey (WEB_2
2007).

3
Table 1.1. Turkey`s energy usage as a function of the energy sources (WEB_2 2007).
Coal (Mton)
Oil
Mton
Natural
Gas
(109 m
3)
Lignite Hard coal
Hydro
electric
(TWh)
SUM of
Mton oil
equivalence
Consumption 30.0 19.9 56.5 19.4 39.6 91.5
Production 2.28 0.7 55.3 2.2 39.6 25.2
In addition to the limited supply and related cost problems of the fossil fuels, the
atmospheric CO2 concentration has been increasing due to increasing fossil fuel
consumption. It has been agreed by the scientific community that there is a correlation
between the average atmospheric temperature of the world and the atmospheric
concentration of CO2 and has been found that the average atmospheric temperature is
increasing with CO2 concentration (Shi 2003). In fact, not only CO2 but also the other gases
with long atmospheric duration, such as methane, nitrous oxide and some fluorocarbons,
cause greenhouse effect. The greenhouse effect is that the shorter-wavelength solar
radiation emitted from the sun passes through atmosphere and causes earth to warm while a
part of the absorbed radiation is reradiated back to the space through the atmosphere as
long wave radiation but this long wavelength radiation is absorbed by greenhouses gases
such as CO2 in the atmosphere and reemitted to Earth; hence causing the lower atmosphere
warmer. To stop the global warming, an international protocol called “Kyoto protocol” was
accepted by many countries in 1997 to decrease the concentrations of the greenhouse gases
in the atmosphere. Up until now, 169 countries (except United States and Australia) which
are emitting 61.6% of greenhouse gases have accepted the Kyoto protocol. The countries
who signed Kyoto protocol must decrease their CO2 emission within the time period
decided by the committee. In other words, the governments of these countries are supposed
to produce power by emitting less greenhouse gases than the level that they emit now using
either improved energy conversion technologies or alternative fuels with the current
conversion technologies. Efforts have been towards using renewable energy sources, such
as solar, wind, biomass and geothermal energies. Examples for the renewable resource

4
utilization are the million solar Roof project in California and the offshore windmill farms
in Holland.
The proposed energy conversion systems to use renewable energy resources/sources
are unfortunately unviable as compared to the well-known and cost effective energy
conversion systems for the fossil fuels. Another problem with the renewable energy
systems is their power production regimes are controlled by environmental conditions. For
example windmills can only convert wind energy into electricity when it is windy.
Similarly, photovoltaic panels can only convert solar energy into electricity during day
times.
The energy conversion technologies based on the renewable energy
sources/resources are most suitable for stationary applications, such as powering and
heating of home or businesses. For vehicles, the direct applications of these conversion
technologies are not straight forward and also not practical but novel materials for Li-Ion
batteries or super capacitors that could be charged using electricity obtained from solar
panels or windmills have been investigated to replace the gasoline engines with the
electrical motors.
Among renewable energy sources, hydrogen as a synthetic fuel seems to be a viable
solution for stationary and mobile applications. For example, hydrogen could be used in
internal combustion engines with some modifications and also it could be used with various
fuel cell systems to power vehicles or houses. Although it is the most abundant element in
the universe, there is no natural pure hydrogen resource on earth and it is always bound to
other substances. Therefore, hydrogen must be produced using other energy
sources/resources. In fact, hydrogen is a secondary energy source which can be produced
from primary energy sources. In other words, hydrogen is not the energy source but it is an
energy carrier like electricity. It can be transferred from its production site to its usage areas
via pipelines or could be used to be converted into other energy types, such as electricity or
direct mechanical work. Hydrogen can be produced from all kind of fossil fuel types; for
example through coal gasification or methane reforming or the pyrolysis of oils. It can be
also produced via water electrolysis or other economically non-mature alternatives like
photoelectrical and photobiological methods. Hydrogen production via thermochemical
treatments of fossil fuels results with a significant amount of carbon dioxide release to the

5
atmosphere according to their hydrogen/carbon ratios. Today, hydrogen is commercially
produced by the steam reforming of natural gas. Although methane among many fossils
fuels has the lowest carbon content (hence leading to low emission of CO2), natural gas
reserves are inadequate to be accepted as a main fuel for future. In addition, hydrogen could
be produced through coal gasification but the usage of coal causes the land, air and water
pollutions. Similarly, nuclear energy could also be used to produce hydrogen but there are
unresolved safety and radioactive waste disposal issues. Therefore, petroleum, coal, natural
gas and nuclear resources are all potential sources of hydrogen but they are not clean and
long-term solutions.
Energy conversion technologies, such as photovoltaic solar cells (from solar energy
to electricity), wind turbines (from wind energy to electricity), small scale sustainable
hydropower (from water potential to electricity), geothermal (from hot underground water
to heat or electricity), are increasingly being used as alternative or supportive ways to
replace traditional energy conversion technologies. These alternative renewable energy
sources and their conversion technologies could be used to produce hydrogen via
electrolysis to power up motor vehicles. This is important, since the internal combustion
engines are responsible for one half of the air pollution. In the electrolysis process, water is
split into hydrogen and oxygen by applying the necessary amount of current for the desired
hydrogen production rate. There are two commercially available electrolyzer types. First
one based on alkaline water electrolysis technology which is relatively well known and
mature. The second one is the proton exchange membrane (PEM) electrolyzer. There are
also other types of electrolyzers such as inorganic membrane electrolyzer or solid oxide
electrolyzers as shown in Table 1.2 but their operation life time is very limited; thus they
are premature to be compared with alkaline and PEM electrolyzers.

6
Table 1.2. Types of Electrolyzers
Cathode Material
Anode Material
Separation Media
Electrolyte Working Temp
Conventional Alkaline
Electrolyzer
Steel or Nickel
Nickel Asbestos 25-35% KOH 50-60
Advanced Alkaline
Electrolyzer
Activated Nickel
Activated Nickel
Polymer reinforced asbestos
25-35% KOH 80-100
Proton Exchange Membrane Electrolyzer
Pt, Ir, Ru coatings
Pt coating
Proton Exchange Membrane
Separation media acts as an solid electrolyte
70-90
Inorganic Membrane Electrolyzer
Nickel Sulfur
Cobalt Polyantemon 14-15% 120-130
Solid Oxide Electrolyzer
Nickel in Zirconium
Platinum Spots
- solid ceramic electrolyte
800-1000
Among the electrolyzers listed in Table 2, the proton exchange membrane (PEM)
seems to be the most suitable electrolyzer to produce hydrogen using renewable energy
sources because PEM electrolyzers can operate over a wide range of current density, hence
making them suitable for integration with photovoltaic panels or wind turbines. PEM based
electrolyzers are similar devices with PEM fuel cells being operated in reverse but the
catalyst types and loadings on membrane surfaces are different. Moreover, unitized
regenerative fuel cells can be used both in fuel cell and electrolyzer mode. PEM
electrolyzers consist of membrane electrode assembly (MEA) (composed of PEM solid
electrolyte with each side coated with suitable catalysts for the anode and the cathode), gas
diffusion layers and electric current collectors. The electrolyte of PEM is a solid
perfluorinated membrane being a barrier to keep hydrogen and oxygen gases separate
during the electrolysis. In a PEM electrolyzer, water splits into oxygen and hydrogen
through the overall reaction shown below in equation 1.1;
2222
1OHOH +→← (1.1)

7
The reaction goes through two half reactions called anode and cathode reactions
under an applied potential across the MEA. The water decomposition reaction shown below
in equation 1.2 occurs on the anode side;
−+++→← eOHOH 2
2
12 22
(1.2)
Where water splits into oxygen, protons and electrons over a suitable catalyst on the
anode and the protons go through PEM electrolyte to the cathode side while the electrons
go to an external power supply in order to complete the electrical circuit. At the cathode
side, the protons coming from the anode through PEM electrolyte react with electrons
supplied by the external power supply on a suitable catalyst to produce hydrogen gas
molecule with the following reaction equation 1.3;
222 HeH →←+−+
(1.3)
It seems that the water electrolysis is very straight forward to accomplish and also
suitable for the integration with the renewable energy conversion technologies. But in
practice, there are many obstacles needed to be overcome so that the integrated electrolysis
systems are viable choice for the production of hydrogen. This is especially obvious for the
stack electrolyzer cells which contain many single cells to achieve the desired level of
hydrogen production rate. For example, uniform water distribution, durable and active
catalysts and also good contact between catalyst and membrane could affect the efficiency
of the electrolyzer cell. In addition to the basic material problems, the engineering know-
how to construct the PEM electrolyzers plays the critical role on the overall electrolyzer
efficiency.
The ultimate goal in this thesis is to achieve hydrogen production via photovoltaic
panels using our own designed and constructed electrolysis stack in campus area. Thesis
can be divided into two main parts. In the first part a single PEM electrolysis cell was
constructed and effects of current density, temperature and water flow rate on voltage
responses were investigated to find the working characteristic of a single electrolysis cell.

8
In the second part a multiple cell stack was constructed and integrated with photovoltaic
array to evaluate cell performance with the optimum working condition findings that was
found in the first part.
The thesis contains six chapters. Following with this introduction, a literature
review on the production of hydrogen and also the PEM electrolyzer (from material
development to thermodynamic analyses studies to the investigation of integration of PEMs
with solar cells) is presented in details in Chapter II. In Chapter III, the specifications of the
materials and also the procedures used to construct PEM electrolyzer and the integration
with the solar panels are explained. In addition, the test methods to analyze the performance
of the PEM electrolyzer using the bench scale power supply and also the solar panels are
presented in this chapter. In Chapter four, the characteristic performance evaluation plots,
such as the voltage versus the current density or the power density versus the current
density and mass balance across the cell, are presented for the bench scale power supply
operated and also the solar panels integrated electrolyzers. The parameters affecting their
performances are discussed by considering the hydrogen production rates, the cell
efficiency, the construction materials and also the cell construction way. Finally, the
conclusions obtained in this study are listed in Chapter five which follows by some
recommendations in same chapter.

9
CHAPTER 2
LITERATURE SURVEY
2.1. Hydrogen Production Methods
Today, most of the hydrogen is produced with the processes of coal extraction, oil
pyrolysis and the catalytic steam reforming. Unfortunately, these fossil fuel depended
hydrogen production methods release significant amount of CO2 (a major green house gas)
to atmosphere. To eliminate/decrease CO2 emission from such processes, carbon
sequestration approach could be integrated to these methods but the overall system
efficiency was found to decrease. Hence, today, most of the commercial hydrogen
production is obtained from the catalytic steam reforming of natural gas without carbon
sequestration process. However, alternative hydrogen production techniques, such as
biological systems, photocatalytic systems, renewable energy based electrolysis systems
and nuclear power plant assisted high temperature steam electrolysis systems are available
and currently they are either in research & development stage or locally under large scale
system test.
Biological hydrogen could be produced by various bacterial methods such as direct
biophotolysis, indirect biophotolysis, photo-fermentation, dark fermentation and water-gas
shift reaction of photoheterotrophic bacteria. Certain photosynthetic bacteria produce
hydrogen from water in their metabolic activities using light energy as an example for
direct biophotolysis applications. It is reported that a green alga, such as Scenedesmus,
produce molecular hydrogen under light after being kept under anaerobic and dark
conditions (Melis and Melnicki 2006).
The fastest hydrogen synthesis rates were reported with mesophilic dark
fermentation bacteria (Chang et al. 2002) and CO-oxidation bacteria (Zhu et al. 2002) at
121mmol and 96mmol of H2 per liter of bioreactor per hour, respectively.
Unfortunately, the technology must overcome the limitation of oxygen sensitivity of
the hydrogen-evolving enzyme in order to increase both the efficiency and gas purity. The

10
total efficiencies of the fermentation systems are very low at about 5-10%. Levin and
coworkers calculated that 758m3 of photo-fermentation bacteria tank were required to
supply a necessary amount of H2 to a 5kW PEM fuel cell. The volume could be decreased
to 1.25m3 for CO-oxidation bacteria bioreactor, and 1 m3 for dark fermentation mesophilic
bacteria (Levin et al. 2004). It is projected for photo-fermentation bacteria that their low
investment costs could overcome this low efficiency problem. The major challenges for
dark fermentation and CO-oxidation bacteria are the mass transfer problems of their bio-
reactors. The researchers were not able to scale up the experiments because they cannot
achieve high reactant gas concentrations for the bacteria in the solution. High volume
hydrogen bioreactors require new reactor designs and may require radically new
technologies.
Another way to produce hydrogen is to use water electrolysis which is electricity
depended hydrogen production method. In general, electrolysis is a process that the ionic
compound is dissolved in a solvent so that its ions are available in the liquid. Current is
applied between a pair of inert electrodes immersed in the liquid. Each electrode attracts
ions which are of the opposite charge. In the water electrolysis case, cations are hydrogen
ions and anions are the oxygen atoms. The energy required to separate these ions, and cause
them to migrate to the respective electrodes, is provided by an electrical power supply.
Therefore electrolysis is an electricity depended process and it could be viable if the
electricity is cheap.
Hydrogen production using electrolysis cannot be classified as a renewable method
because it depends on the source of the electricity. For example, wind, solar PV, wave and
geothermal energies can all be a source to produce renewable hydrogen using electrolysis
while fossil or nuclear fuel based electricity depended electrolysis cannot be classified as
renewable hydrogen production. The Figure 2.1 below categorizes the hydrogen production
methods according to their energy source.

11
Figure 2.1. Various Sources for electrolysis
2.2. Electrolyzers
There are two mature electrolyzer types: Alkaline electrolyzers and Proton
Exchange Membrane (PEM) electrolyzers.
Alkaline electrolyzers are the most commonly used electrolyzers in industry. Their
hydrogen output is above 99% purity, although usually requires a further purification unit
due to corrosive electrolyte vapor especially in fuel cell applications. Generally, 25 – 30
weight percent potassium hydroxide solution is used as a liquid electrolyte. Hydrogen
production with this method has an efficiency of up to 80% (based on the high heating
value of hydrogen). They are most effective when running on low current densities at about
0.3Amp/cm2 or lower. However, disadvantages of this type of electrolyzers are their liquid
electrolyte which is highly corrosive in high temperatures, thus resulting in relatively low
electrolyzer lifetime (Barbir 2004).
The proton exchange membrane (PEM) fuel cell operated “in reverse” is actually a
PEM electrolyzer. But the optimum operating conditions for the power and hydrogen
production are significantly different than that one could expect to obtain from a PEM fuel
cells operating in reverse. Although a lot of research and development was done on PEM

12
electrolyzers, the high cost of membrane, electrocatalyst (doped with noble metal, such as
Pt, Ir, Ru), the requirement of highly “clean” water and a high cost of constructional
materials limit the wide usage of this type electrolyzer. In spite of their high costs, there are
several advantages of using PEM electrolyzers. They produce high purity (99.999%)
hydrogen and oxygen (Grigoriev et al. 2006) which are very important for some
applications, such as submarines and space shuttles. In addition, high purity hydrogen could
be used in PEM fuel cells without requiring after-purification step unlike the alkaline
electrolysis method. PEM electrolyzers could also work at high pressures up to 300 bar;
thus reducing the compressor cost. Up until now, the most efficient electrolysis using PEM
electrolyzers have been reported to operate at 1.556 cell voltage and 1Amp/cm2 at 80oC
(Yamaguchi et al. 2000), hence achieving 95.1% efficiency (based on high heating value of
hydrogen). Moreover, PEM electrolyzer can operate over a wide range of temperature,
pressure and current density as compared to alkaline-type water electrolyzer (Tsutomu and
Sakaki 2003). This unique feature makes PEM electrolyzers suitable for integrating with
renewable energy sources which usually have variable electricity output due to their
uncontrolled primary energy inputs. For example, the photovoltaic panels produce power
proportional to solar intensity, which looks like a bell shape curve during the day or wind
turbines produce power with the cubic function of the wind speed. Thus, hydrogen
production based on PEM technology is a promising option for many renewable sources as
it stores the uncontrolled production of electricity.
There are some difficulties with PEM electrolysis that need to be addressed before
being a viable choice of power generation for future “hydrogen economy”. The most
obvious and commonly known obstacle is cheap electricity supply for electrolysis reaction.
Theoretical electricity equivalent of 1kg hydrogen is about 40kWh, which is the main
hydrogen production cost. In order to reduce the electricity cost of the electrolysis
operation, researchers all over the world are trying to combine electrolyzers and renewable
electricity generators with more efficient coupling methods (Bilgen 2000, Ahmad et al.
2006). Also electrolyzers are being interconnected to currently available grid system during
the off-peak period to increase the load factor of the electric grid and use less expensive
electricity (Oi and Sakaki 2003). Another way of reducing the electricity usage is to
increase the efficiency of electrolyzers. Improvement of the membrane material and the

13
electrode design are being sought to reduce the inner resistances, hence increasing the cell
efficiency. Mathematical models (Choi et al. 2004) and experimental works (Millet et al,
1989) points out that the electrical processes inside the cell show that the biggest voltage
loss in an electrolysis cell occurs due to the anode overpotential while the cathode
overpotential is relatively small due to fast reaction kinetics of hydrogen ions on platinum.
Decreasing the gas diffusivity and ohmic resistance of the membrane and increasing
the ionic conductivity are currently under investigation by many research groups in the
world. Besides, the relatively short operation life time of PEM electrolyzers (about 5000h),
a high cost of membrane and noble metal coated electrodes and also high assembly cost
(due to non-automated small scale production) are other obstacles needed to be solved for
the renewable electricity powered PEM electrolyzers to be accepted as a mature
technology.
2.2.1. Proton Exchange Membrane Electrolyzers
The working principle of PEM, reactions on each electrode and thermodynamics of
the cell need to be known to better understand the PEM electrolyzers. Briefly, water
electrolysis is a chemical reaction where water is the reactant whereas hydrogen and
oxygen are the products. The electrolysis cell is a reaction medium composed of membrane
electrode assembly (MEA), the electric current collectors, the gas distribution layers and
the gaskets (Oi and Sakaki 2004). Unlike the alkaline electrolyzers, the electrolyte of a
PEM electrolyzer is a solid perfluorinated membrane. Water is the only circulating liquid
inside the cell although electrodes encountered an acidic environment equal to 20 wt%
sulfuric acid solution owing to sulfonic acid groups of the membrane (Millet et al 1989).
Mostly Nafion® (a trademark of DuPont) is used as proton exchange membrane. PEM is a
solid electrolyte which is a barrier for both hydrogen and oxygen gases while it can
transport protons and high current densities. Both sides of membrane are coated with noble
metals which are usually Pt, Ir and Ru or some combinations of these metals. This catalyst
coated membrane is called as membrane electrode assembly (MEA). Schematic
representation of the parts of a single electrolysis cell is given in Figure 2.2.

14
Figure 2.2. Schematic representation of a PEM electrolysis cell
De-ionized water must be used for PEM electrolysis in order to prevent the
impurities and poisoning of the catalyst on each side. Water splits into oxygen, two protons
and two electrons at the anode by applying a DC voltage higher than the thermoneutral
voltage which is 1.481 V at standard temperature and pressure. Hydrogen ions (protons)
pass through the proton exchange membrane and at the cathode they combine with
electrons coming from the external power source to form hydrogen gas.
2.2.1.1. Thermodynamics of Proton Exchange Membrane Electrolysis
The formation of hydrogen and oxygen gases from liquid water is highly
endothermic process; hence, resulting in a very low reaction rates, except at very high
temperatures, such as 2000oC. Total amount of energy which is the heat of reaction, ∆H, is
required to decompose water in the liquid phase and to expand the products in gas phase.

15
285,830J/mol + (g)O+(g)HO(l)H 2222
1→
(2.1)
However by applying the electricity water can be split into hydrogen and oxygen ions at
lower temperatures, the dissociation of water requires the amount of electrical energy
corresponding to ∆G of the water splitting reaction. The electrical potential proportional to
reaction Gibbs free energy is required between the electrodes to initiate water
decomposition. This voltage is found from the definition of Gibbs free energy. In fact,
theoretically it is the minimum electrolysis voltage (i.e. the ideal fuel cell voltage). The
summation of the required electrical potential to compensate the Gibbs free energy and
entropy at a temperature is called the thermoneutral (VTN) voltage at the standard
temperature and pressure, it equals to;
nF
∆H=
nF
T∆∆+
nF
∆G=V
pt,pt,
pt,
−− = V=
)(1,481
964852
285830
×
−−
(2.2)
VTN is the voltage at which a perfectly insulated electrolyzer would operate. Thus, VTN is
equal to the sum of higher heating value voltage corresponding to the energy required for
the saturation of hydrogen and oxygen with water vapor (Oi and Sakaki 2004). The cell
efficiency is found through using the thermoneutral voltage. In this case, VTN is divided by
the actual voltage applied to the cell to obtain the efficiency of an electrolyzer (Oi and
Sakaki 2004).
ACTACT
TN
V=
V
V=η
1.481
(2.3)
Another way to find the efficiency of an electrolyzer is that the energy equivalent of
hydrogen output is divided by the given energy as shown in the equation 2.4 below (Ahmad
et al. 2006).

16
CurrentVolt
QE=η erelectrolyz
×
×
(2.4)
Where E is the calorific value of hydrogen (J/ml) and Q is the hydrogen flow rate (ml/s).
The efficiency of an electrolyzer is found to decrease as the current density and
corresponding H2 production rate of the cell increases. This means that the required
electrical potential increases as the current density increases. This is due to the
irreversibility occurring in the cell, which can be divided as the activation losses, ohmic
losses, mass transport and concentration losses and increasing crossover of products
through membrane in the high reaction rates and the operating pressures. (Onda et al.
2003).
Typical PEM electrolysis cell voltage is reported to be around 2V and the
commercial electrolyzers have an efficiency ranging from 65% to 80% (Barbir 2004).
Although an electrolyzer can be operated at higher efficiencies (up to 95%), this condition
requires a lower cell voltage which also lowers the current passes through the electrolyte
and the hydrogen production rate (Grigoriev et al. 2006). This dilemma could be overcome
with the utilization of an electrolyzer stack with the high efficiency. Although 70% of the
hydrogen production cost in PEM electrolyzers is due to the cost of electricity, increasing
the efficiency was reported to compensate the relatively high capital expense of a PEM
electrolyzer (Grigoriev et al. 2006). The analysis reported by Larminie and Dicks 2003
shows that an electrolyzer needed to be optimized by considering the efficiency which in
turn affected the unit production cost and also the utilization of electrolyzer which
ultimately affected the initial investment of the device.
Operating temperature of an electrolyzer is another important parameter on the
system design. From electrolysis thermodynamic equations, it is expected that as the
temperature increases the cell voltage should decrease. Yim and coworkers investigated the
temperature effect on PEM electrolyzer with a 4.0 mg/cm2 Pt loaded electrodes for both
anode and cathode. It was found that voltage decreased from 1900mV to 1700mV as the
temperature increased from 50oC to 80oC at 500mAmp/cm2 current density (Yim et al.
2004). However, it is known that lifetime of solid polymer electrolytes decreases and
product crossover through membrane increases with the increasing temperature. Thus,

17
another optimization should be done between the electricity price, purchased membrane
cost and the produced hydrogen price to find the ideal temperature for a PEM electrolyzer.
There are several theoretical models to explain the current voltage and temperature
characteristics of PEM electrolyzers. Choi and coworkers model assumes that the efficiency
of a single or a stack of electrolyzer cells could be affected by either component(s) or
operating parameter(s) of the electrolyzer (Choi et al. 2004). In fact their model separates
the components of electrolyzer and reveals its electric circuit equivalent. The model
provides a fairly good relation between the voltage and the current in Nernst potential
through the exchange current densities of anode and cathode electrodes according to Butler-
Volmer kinetics.
2.2.1.2. Proton Exchange Membrane of an Electrolyzer Cell
Proton exchange membrane (PEM) is a proton conducting polymeric membrane
which acts as an electrolyte for both the fuel cell and the electrolysis applications. The first
PEM used in a fuel cell is developed by General Electric in early sixties for use in a space
mission for NASA. This premature copolymer showed insufficient oxidative stability under
its operating conditions and it could work properly for only 500h during the mission. A
major breakthrough in PEM technology came up with the announcement of
perfluorosulfonic acid membranes called Nafion® by DuPont in 1967. (Larminie and Dicks
2003).
Typically perfluorosulfonic acid membranes are poor proton conductors unless
water is present in the medium. Therefore the hydration of PEM is very important with
respect to the performance of the cell. Although this is important for fuel cells, it is usually
not the case for the electrolysis applications since the one side of the membrane is always
introduced with water as a reactant.
Einsla 2005 reported that a typical proton exchange membrane had to match the
following requirements in order to be able to be used in fuel cells and electrolyzers;
18
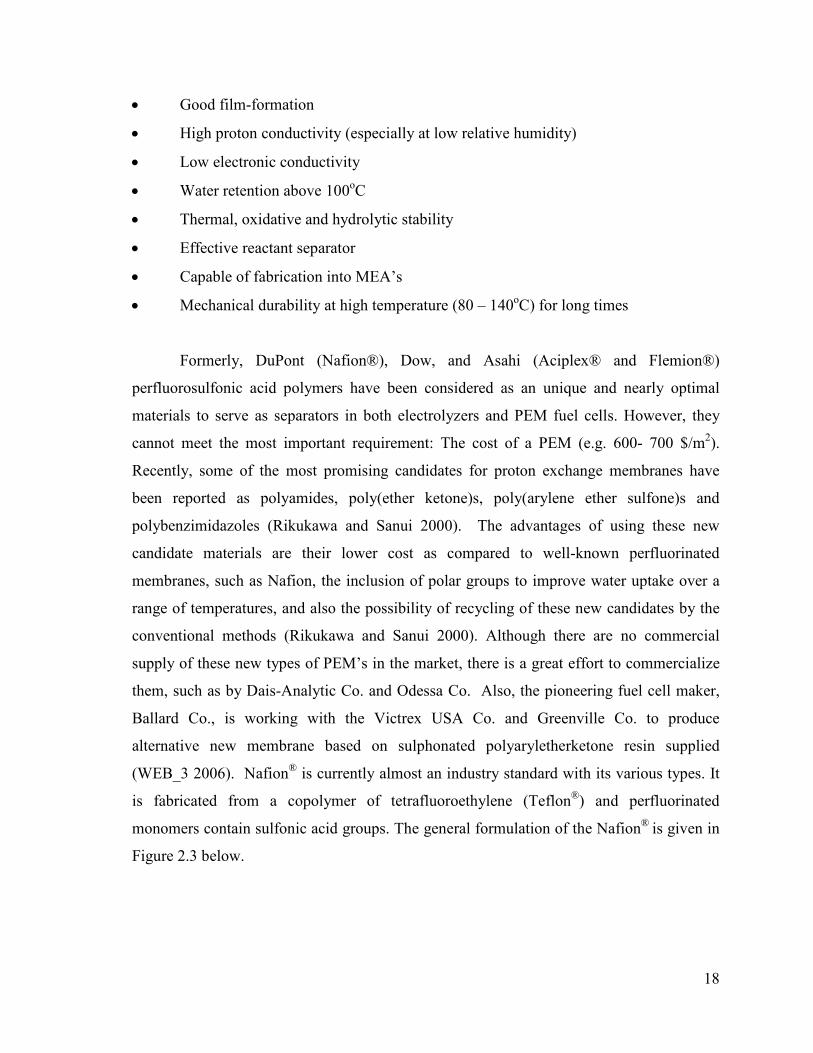
• Good film-formation
• High proton conductivity (especially at low relative humidity)
• Low electronic conductivity
• Water retention above 100oC
• Thermal, oxidative and hydrolytic stability
• Effective reactant separator
• Capable of fabrication into MEA’s
• Mechanical durability at high temperature (80 – 140oC) for long times
Formerly, DuPont (Nafion®), Dow, and Asahi (Aciplex® and Flemion®)
perfluorosulfonic acid polymers have been considered as an unique and nearly optimal
materials to serve as separators in both electrolyzers and PEM fuel cells. However, they
cannot meet the most important requirement: The cost of a PEM (e.g. 600- 700 $/m2).
Recently, some of the most promising candidates for proton exchange membranes have
been reported as polyamides, poly(ether ketone)s, poly(arylene ether sulfone)s and
polybenzimidazoles (Rikukawa and Sanui 2000). The advantages of using these new
candidate materials are their lower cost as compared to well-known perfluorinated
membranes, such as Nafion, the inclusion of polar groups to improve water uptake over a
range of temperatures, and also the possibility of recycling of these new candidates by the
conventional methods (Rikukawa and Sanui 2000). Although there are no commercial
supply of these new types of PEM’s in the market, there is a great effort to commercialize
them, such as by Dais-Analytic Co. and Odessa Co. Also, the pioneering fuel cell maker,
Ballard Co., is working with the Victrex USA Co. and Greenville Co. to produce
alternative new membrane based on sulphonated polyaryletherketone resin supplied
(WEB_3 2006). Nafion® is currently almost an industry standard with its various types. It
is fabricated from a copolymer of tetrafluoroethylene (Teflon®) and perfluorinated
monomers contain sulfonic acid groups. The general formulation of the Nafion® is given in
Figure 2.3 below.

19
Figure 2.3. Molecular Formula of Nafion®
The hydrophilic regions around the clusters of sulphonated side chains enable water
adsorption. The water adsorption process can increase the weight of membrane as much as
50%. Hydrogen ions are weakly attracted to the SO3- group and they are able to move in
these hydrated regions of the membrane. Though the hydrated regions are separate from
each other, hydrogen ions able to move through the supporting structure but this situation
decreases the proton conductivity. In a well hydrated membrane 20 water molecules could
exist for each SO3- side chain (Larminie and Dicks 2003). Thickness of the membrane is a
crucial parameter because Einsla 2005 reported that as the thickness increased, the
hydration of the membrane generally decreased which resulted in relatively poor ion
conductivity. But as the thickness increased, the products, such as hydrogen, crossover
decreased. Since the hydration of the membrane is usually not a problem in electrolysis
application, thicker membranes are preferred for these devices.
2.2.1.3. Membrane Electrode Assembly and Electrode Structure of a
Proton Exchange Membrane Electrolyzer Cell
The distance between the anode and the cathode reaction mediums increases the
electrical resistance between these electrodes, thus reducing the cell efficiency drastically.
Efforts to reduce the distance between these reaction mediums bring about the catalyst
coated membranes which are known as membrane electrode assembly (MEA). Applying
catalyst on both sides of the membrane minimize the distance between anode and cathode
electrode, in fact the only media between anode and cathode reaction is the membrane

20
itself. The design minimizes the electrical resistances since the reaction occurs on both
surface of the membrane due to the presence of the catalyst.
The definitions of anode and cathode electrodes are as follows; anode is “the
electrode in a device that electrons flow out to return to the circuit” and the definition of
cathode is “the electrode at which electrons go into a cell, tube or diode, whether driven
externally or internally”. According to that, the cathode of the fuel cell is the side where
water composes (oxygen side) and anode is the hydrogen inlet side. Though according to
definition of cathode is the hydrogen generation side and anode is the side where water
decomposes (Larminie and Dicks 2003).
Although PEM electrolyzer and PEM fuel cells seem similar devices they have
significant differences such as, catalyst loadings and support material of their electrodes.
Fabrication of membrane electrode assemblies for PEM electrolysis requires additional
effort since duties of their electrodes are different than PEM fuel cell electrodes. The
electrode in a fuel cell is used to expel the product water and to draw the reactant gases as
quickly as possible whereas the idea behind an electrolyzer electrode is to draw the water
and expel the gases as quickly as possible.
There are two alternative routes for the electrode fabrication used in PEM fuel cell
and PEM electrolysis. First method is the separate electrode method which carbon
supported catalyst is fixed with various techniques to a porous and conductive material,
such as carbon cloth or carbon paper. Polytetrafluoroethylene (PTFE) is often be added for
the fuel cell cathodes because it is hydrophobic and expels the product water (Larminie and
Dicks 2003). The carbon paper cloth is also used to diffuse the gas through its pores onto
the catalyst surface, which is called as the gas diffusion layer. Two similar electrodes are
then fixed to each side of the proton exchange membrane (Larminie and Dicks 2003). The
second method is to build electrodes directly onto the membrane. The catalyst is applied to
the electrolyte with the methods, such as mechanical pressing, hot pressing, decal transfer,
coating or clamping of precursors sol-impregnated electrode (Thangamuthu and Lin 2005).
These fabrication approaches are used to achieve a good conduction of the catalyst surface
with the proton exchange membrane which increases the effectiveness of the cell per unit
mass of the catalyst. Although these methods are used for electrolysis MEA fabrication,
catalyst and support materials may change in the electrolysis case, for example the

21
hydrophobic substances in electrodes will show worse performance due to the high
resistance between the membrane and reactant water. Hydrophilic additives, such as
Nafion®, are used to enhance the anode performances of electrolyzers (Ioroi et al. 2002).
At the beginning of PEM technology, the catalyst loading for both anode and
cathode sides were as high as 28 mg/cm2 of platinum (Larminie and Dicks 2003) where as
0.2mg/cm2 or less is used now (Kim et al. 1998). Due to increased catalyst activity precious
raw materials became only a small portion of both electrolyzer and fuel cells.
The kinetics of hydrogen on platinum is well known and shows that hydrogen
evolution is the most efficient over platinum based catalyst material. Also, high current
densities could be achieved at low overpotential with almost no mass transport limitation.
Thus Pt is the most suitable catalyst for hydrogen generation on the cathode side of a PEM
electrolysis cell. But there are some restrictions about platinum such as its sensitivity to
poisoning gases like CO, COS and H2S above 10 ppm. (Levin et al. 2004). The models
developed by Choi and coworkers shows that the overpotential of Pt coated cathode
electrode is as small as 0.17 V at 1Amp/cm2 for PEM electrolysis under standard conditions
(Choi et al. 2004). Experimental works usually does not mention anode or cathode
overpotential directly because of the experimental difficulties except Millet’s found that the
cathode overpotential changed from 0.15 V to 0.1 V with respect to Pt loading and
temperature (Millet et al. 1992).
Different support and catalyst materials are used to investigate their effects on the
total cell voltage (Grigoriev et al. 2006, Yim et al. 2003). There have been a lot of studies
on electrodes and high efficient electrocatalysts for fuel cells and electrolyzers but they
mainly focuses on anode electrode since the main energy losses occurs in water
dissociation reaction.
Stable and active oxygen electrode is one of the key issue for the manufacture of
electrolyzers. It is known that for oxygen reduction, platinum does not work well in the
electrolyzer anode (Petersson et al. 2006). Thus, unlike fuel cell, the anode of the
electrolyzer has different electrocatalyst, such as IrO2, RuO2, SnO2 or their combinations
(Grigoriev et al. 2006). These catalyst is usually mixed with Ta2O5, TiO2 or SnO2 to
stabilize the structure (Rasten et al. 2003).

22
Ioroi et al. examined the effects of several additives, such as Nafion, PTFE, iridium,
on the oxygen electrode of a regenerative fuel cell. They found out that as the PTFE content
increased from 0 wt. % to 12 wt. %, the electrolysis cell voltage increased from 1900mV to
1950mV at 500mA/cm2 current density. As it is expected hydrophobic effect of PTFE
increases the cell voltage and also causes to decrease the voltage efficiency of the cell.
However, Nafion as an additive to the anode electrode was found to have a favorable effect
and in fact, 14 wt. % Nafion additive decreased the cell voltage up to 200mV at
500mA/cm2 which equaled to an 8% increase in voltage efficiency. In addition, they
reported that iridium content had the most significant effect for the electrolysis voltage. For
example, even 1 wt% iridium additive was able to decrease the cell potential of 100mV and
also 50 wt. % Ir loading decreased the cell potential up to 500mV at 500mA/cm2. (Ioroi et
al. 2002)
Grigoriev and coworkers showed that the activity of the electrode with 50% RuO2
was better than that with pure IrO2. They investigated four anode electrocatalysts which are
summarized in Table 2.1.
Table 2.1. Electrode types versus Cell Potential
(Source: Grigoriev et al. 2006)
Catalysts Anode Cathode Potential at 1A/cm2
1 2.4 mg/cm2 Ir (100 wt %) Pt30/C 2.0 mg/cm2 1750 mV
2 2.0 mg/cm2 RuO2-IrO2-SnO2 (30-32-38 wt %)
Pt30/C 2.0 mg/cm2 1700mV
3 2.4 mg/cm2 Ir (100 wt %) Pd40/C 2.4 mg/cm2 1660mV
4 2.0 mg/cm2 RuO2-IrO2 (50:50 wt %)
Pt30/C 2.0 mg/cm2 1650mV
(Pt30/C: 30 wt% pf Pt on carbon carrier electrolysis temp:90oC)
It is seen that RuO2-IrO2 loaded anode electrode shows the smallest cell potential
with respect to others. Grigoriev and coworkers reported that electrolyzers were operated
up to 10000 hour but they did not mention about the degradation of anode loadings (thus
voltage increments) with respect to time which is another important parameter.
23
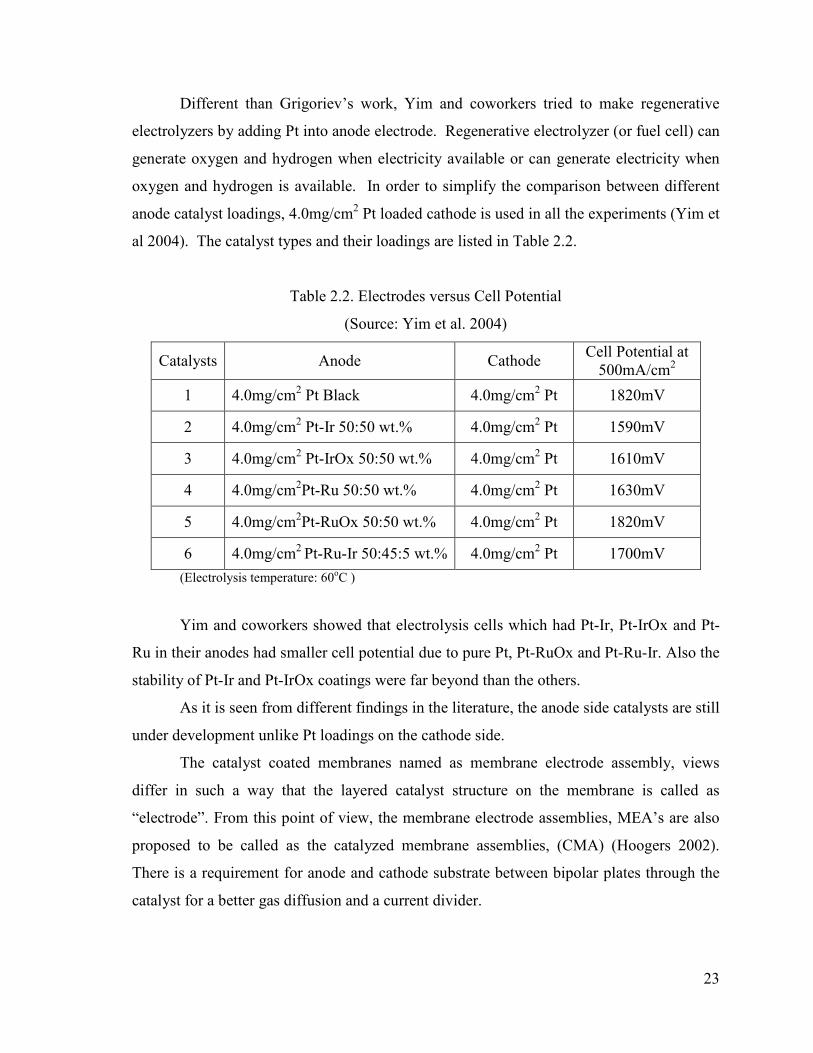
Different than Grigoriev’s work, Yim and coworkers tried to make regenerative
electrolyzers by adding Pt into anode electrode. Regenerative electrolyzer (or fuel cell) can
generate oxygen and hydrogen when electricity available or can generate electricity when
oxygen and hydrogen is available. In order to simplify the comparison between different
anode catalyst loadings, 4.0mg/cm2 Pt loaded cathode is used in all the experiments (Yim et
al 2004). The catalyst types and their loadings are listed in Table 2.2.
Table 2.2. Electrodes versus Cell Potential
(Source: Yim et al. 2004)
Catalysts Anode Cathode Cell Potential at 500mA/cm2
1 4.0mg/cm2 Pt Black 4.0mg/cm2 Pt 1820mV
2 4.0mg/cm2 Pt-Ir 50:50 wt.% 4.0mg/cm2 Pt 1590mV
3 4.0mg/cm2 Pt-IrOx 50:50 wt.% 4.0mg/cm2 Pt 1610mV
4 4.0mg/cm2Pt-Ru 50:50 wt.% 4.0mg/cm2 Pt 1630mV
5 4.0mg/cm2Pt-RuOx 50:50 wt.% 4.0mg/cm2 Pt 1820mV
6 4.0mg/cm2 Pt-Ru-Ir 50:45:5 wt.% 4.0mg/cm2 Pt 1700mV
(Electrolysis temperature: 60oC )
Yim and coworkers showed that electrolysis cells which had Pt-Ir, Pt-IrOx and Pt-
Ru in their anodes had smaller cell potential due to pure Pt, Pt-RuOx and Pt-Ru-Ir. Also the
stability of Pt-Ir and Pt-IrOx coatings were far beyond than the others.
As it is seen from different findings in the literature, the anode side catalysts are still
under development unlike Pt loadings on the cathode side.
The catalyst coated membranes named as membrane electrode assembly, views
differ in such a way that the layered catalyst structure on the membrane is called as
“electrode”. From this point of view, the membrane electrode assemblies, MEA’s are also
proposed to be called as the catalyzed membrane assemblies, (CMA) (Hoogers 2002).
There is a requirement for anode and cathode substrate between bipolar plates through the
catalyst for a better gas diffusion and a current divider.

24
The gas diffusion layer must be a highly conductive material for both fuel cell and
electrolysis applications. It must have a porous structure to bring the reactants to the PEM
for fuel cell and to expel the products for the electrolysis. In the conventional fuel cells, the
gas diffusion layers are usually porous carbon matrix, such as carbon cloth or carbon paper.
However, this structure is not suitable for water electrolysis due to the oxidation of carbon
with active oxygen species, such as oxygen atom or hydroxyl free radicals, at high positive
potentials of anode (Song et al. 2006, Petersson et al. 2006).
Gas diffusion layer of an anode electrode should not be a hydrophobic material.
Thus, PTFE loading generally decreases the efficiency of the cell similar to the PTFE
loading effect on the catalyst layer (Ioroi et al. 2003). Woven metal cloths, expanded metal
sheets, perforated metal sheets or metal foams which are made up of corrosive resistive
metals, such as titanium, zirconium, hafnium, niobium and tantalum, are used as the
electrolyzer gas diffusion plates (Petersson et al. 2006).
Another approach for making electrolysis gas diffusion layer is to promote the
traditional carbon matrix used in the fuel cells with a suitable metal(s). This approach aims
to form an oxygen molecule rapidly before the atoms starts to diffuse the gas diffusion
layer (Song et al. 2006) proposed it as a new cathode for electrolysis cell which had a water
reservoir placed inside the cell contacting with the membrane, and with the Toray carbon
paper used as the gas diffusion layer. After the electrolysis operation, no corrosion of the
oxygen electrode occurred because the water did not come in direct contact with the
electrode and the active oxygen species were combined before reaching the gas diffusion
layer. However, their cell structure was complicated and the gap between anode and
cathode was wide which caused less voltage efficient electrolysis operation (Song et al
2006).
2.2.1.4. Bipolar Plates
All the fuel cells and electrolyzers (with the exception of laboratory bench scale
ones) are constructed with many cells connected in series. Similar to the serially connected
battery systems, the serially connected fuel cell systems could generate electricity at high

25
voltages. This concept is also valid for the electrolysis cells connected in series. The
serially connected cells are called as “stack” and they could be operated at high voltages
which are proportional to the number of cells. To connect cells in series, the anode side of
one cell should connect with the cathode of another one. This can be achieved by wiring
each cell with next one in the stack. In this way, current can pass from one cell to the next
one but for a higher current rate (which is usually the case for electrolysis) the current
distribution problems may occur. The other way to pass the current between cells is to
construct an electric conductive plate which is called as bipolar plate. The name of the
bipolar comes from this unwired stacking configuration where one side of the plate acts as
the anode of the cell while the other side behaves as the cathode for the adjacent cell. Other
duties of bipolar plates are that they have to supply water to the anode gas diffusion layer
while dispelling the oxygen gas from electrode and also it has to dispel hydrogen gas from
the cathode gas diffusion layer. These are major duties of a bipolar plate in an electrolyzer
but also it has to be a good heat conductor to prevent the high temperatures inside the cell
and it has to be made from a durable and high strength materials since the other parts of the
cell are made up of low mechanical strength materials. A bipolar plate should have low
permeability values for both oxygen and hydrogen to ensure that they are separate.
Metals can be used as bipolar plates since they are abundant and cheap although the
most common material used for bipolar plates is graphite since it is a good thermal and
electrical conductor like metals. Moreover, it is easy to machine the flow channels on
graphite blocks with respect to other metals. Graphite is also less permeable to hydrogen
than most of the metals.
Graphite bipolar plates constitute almost 88% of the electrolyzer and in particular
coated metal bipolar plates constitute 81% by mass of a stack since the other parts are very
thin (Li and Sabir 2004).
As department of energy (DOE) points out that, one of the main obstacles in front
of the hydrogen economy is the low power density (according to internal combustion
engines) of fuel cells and electrolyzers. Reducing the weight of bipolar plates can increase
the power density significantly as it can be understood from its total weight sharing (DOE-
HVR 2006).

26
Other than material specifications, the pattern of the channels on the plate is one of
the most important issues for the fuel cells. Since there is no specific pattern published for
electrolyzers, the subject has similar importance for the electrolyzers because the PEM
electrolyzers are also devices where three phases, solid (electrocatalyst), liquid and gas,
must be in a proper contact. Various possible flow field designs for the fuel cells were
proposed during the development of fuel cells.
The simplest flow field design is the pin-type flow field which is a network formed
by many fins arranged in a regular pattern. As a result of this design pin-type flow fields
result in very low pressure drop (Reiser and Sawyer 1988). But, reactant flows through
paths which have the least resistance. This situation leads to an inadequate reactant
distribution which causes unbalanced current distribution and resulting in spatial
temperature variations.
Studies to prevent the deficiencies of pin-type flow field have resulted in straight
flow fields (Pollegri and Spaziante 1980). The design was further investigated by General
Electric and Hamilton Standard. In this design separate parallel flow channels were
connected to one inlet and one outlet of the field. The idea behind the design is to transmit
the inlet pressure of the reactant in to the thin channels. Thus reactant can go all the way
through the channel which prevents the inadequate reactant distribution. The pattern works
well in the beginning but the deficiency of the pattern appears as the operating time
increases. If water flow is obstructed or encountered with more resistance than other
channels, the stagnant areas appear inside the cell. This situation results with similar
problems as found in pin type flow field (Li and Sabir 2005).
Serpentine flow pattern were studied to overcome the heterogeneity developed in
pin type and straight flow fields (Watkins et al. 1991). Watkins designed a pattern which
have only one flow channel between inlet and outlet. In order to maximize the contact with
MEA the channel were roamed from one side to other side several times. The design
prevents the obstruction of flow since there is only one way to go for fluid although high
reactant pressure losses occur due to very long flow channels. The pressure losses can be as
much as 30% of the total stack power of fuel cells (Li and Sabir 2005). The concept was
improved by various researchers to decrease the pressure drop such as multiple channel
modified serpentine flows.

27
Interdigitated flow field is a different approach to flow field design. In other flow
field designs, reactant and products are transported in bulk phase in the channels via
pressure differences. Interdigitated flow field has a two parallel channel with dead ends.
The reactant flows through the input channel network and also diffuses into the membrane
to pass to the output channel network. The interdigitated flow field forces the reactants into
the active layer of the electrode thus high power densities can be achieved (Wang and Liu
2004). Large pressure loss occurs for the reactant which limits the using area of this pattern
with small stacks (Li and Sabir 2005).
Combining the observations from nature with interdigitated flow had led to some
modification on this flow type. A similar pattern like the tissues of plant or in animal lungs
was applied to the interdigitated flow field (Boff et al. 2006). Applying such a pattern of
channels of different width and depth has a great advantage to distribute gases uniformly.
The inventors have also realized that by forming sufficiently fine channels on the face of
the flow field gas diffusion layers are becoming unnecessary for electrolyzers.
In addition to the flow patterns mentioned above, a gas diffusion layer without any
flow channel or catalyst coated metal mesh (which is usually the case for PEM
electrolyzers because of the reduced catalyst life due to the carbon deposition from carbon
based layers) can be used for the distribution of reactants and collection of the products.
Various gas distribution methods have been shown to influence stack performances
in fuel cells and electrolyzers like various catalyst loadings and different membranes. As
the catalyst usage and membrane costs are reduced drastically, the cost of bipolar plates
becomes a significant portion (up to 30%) of electrolyzer and fuel cell stacks (Li and Sabir
2004, Larminie and Dicks 2003).
2.2.1.5. Solar Powered PEM Electrolyzer Applications
PEM electrolyzer driven by the power of photovoltaic array is one of the promising
hydrogen production methods just like wind turbines connected to the hydrogen generation
systems. Photovoltaic (PV) cells turn the sunlight into electricity directly. Briefly, when the
sunlight shines onto the semiconductor materials, the electrons in atoms of the

28
semiconductor leave and become free in the material so that they are carried externally
through a load as a current (WEB_5 2006). These renewable systems generate electricity in
fluctuated manners and this operating behavior makes them unsuitable for the power grid
supply at high percentage sharing (Gonzales et al. 2003). However, for the electrolysis
using renewable electricity, the load factor of these sources can be redounded. This
combined usage concept to produce hydrogen has received considerable attention (Dıncer,
2002). Photovoltaic powered electrolysis applications are widely used all over the world
although the efficiency of the photovoltaic panels could be as high as 15% (hence making
them the most expensive electricity generators) (Torres et al. 1998, Ahmad and Sheneawy
2005).
Power generation from a photovoltaic panel is proportional to the sunlight intensity.
In an open circuit, the panel can give the maximum voltage. But as the current taken from
panels increases, the voltage of the panel starts to decrease. To overcome this problem, the
modules are combined in such a way to obtain the maximum power. A successful PV
powered electrolyzer system requires an electrolyzer design working at solar cells
maximum power or vice versa. As discussed in the beginning of the chapter, voltage
required for electrolysis increases as the current density increases. If the electrolysis curve
could match as closely as possible with the maximum power point of the photovoltaic
panels, a successful solar hydrogen generation seems to be doable. In the early work of
Carpetis, the maximum power point line of a photovoltaic module and the solid polymer
electrolyzer were plotted at varying voltages and currents. This study shows that a
successful match between the electrolyzer and PV power line could increase the efficiency
dramatically from 3.9% up to 5.5% (Carpetis 1984). Steeb and coworkers (1985) focused
on maximum power point tracker called power conditioning. They pointed out that the
power conditioning between PV’s and the electrolyzers was not constant because the power
generated by panels was not constant during the day and could fluctuate with weather
conditions in a year. Also the power consumed by the electrolyzer is not constant due to the
working temperature and degradation of components inside the cell. It is clear that even a
successful match between an electrolyzer and photovoltaic source could be achieved; the
maintaining this match in long term seemed not possible. A power conditioner decouples
the source from the load and pushing to work them in different working points. The solar
29
generator is always working at its maximum power output point while the power given to
the electrolyzer can be set according to its cell characteristics (Steeb et al. 1985).
In Aegean zone in Turkey, hydrogen generation by solar power driven electrolyzer
was studied by Atagündüz et al. (Atagündüz, 1993). In this work the constructed
electrolyzer is a 5 cell conventional alkaline one. Potassium hydroxide was used as the
electrolyte and asbestos was used as the separation medium while nickel was used as
electrode for anode and cathode. They tried to match the electrolysis unit with the PV panel
maximum power point with a DC-DC converter. It was reported that the efficiency of the
electrolyzer was about 80-87% while the converter efficiency was about 50%. The
electrolyzer cell voltage changed between 3.5V to 4.5V.

30
CHAPTER 3
MATERIALS AND METHODS
Single and multiple cell electrolyzers were manufactured using the catalyst coated
Ion-Power Co. membrane electrode assemblies (MEA). After that, manufactured stacks
were powered by photovoltaic arrays to evaluate the solar hydrogen production ability on
our campus.
MEA’s were first tested in single cells and then tested in various stack formations in
order to identify the possible problems easily and to eliminate the experimental difficulties
such as the mixing of product gases, water leakage or obtaining uniform pressure through
the MEA.
3.1. Materials and Equipments
Materials with their specifications used to prepare the electrolysis cell and stack are
given in the table below.
Table 3.1. Properties of Materials used in Electrolysis Cell
Materials Specifications
Membrane Electrode
Assembly (MEA)
Catalyst coated N-117 membrane (Ion Power)
(70x70)mm total area
Gas Diffusion Layer (GDL) 1 micron Pt coated 1.5 mm Titanium screen (45x45)mm
Bipolar Plate Carbone Lorraine 1940PT Graphite Layer
Gaskets temperature resistant 1mm thick silicon gaskets
Endplates 8mm thick stainless steel plates (70x70)mm
Compression Bolts 5mm diameter 8 steel bolts covered with plastic
insulators
Electric Conduction Plates 1mm thick TSE 554 copper plates
DC regulated power source; GP1305TP of EZ Electronics was used to supply the required
electrical energy for electrolysis cell and TES 2732 Universal data logger was used to

31
record the voltage and the current simultaneously for single and multi cell bench
experiments. Power supply of the solar power driven electrolysis stack was an array which
was consisted of six Siemens SM-55 photovoltaic panels connected in parallel. Current and
voltage of these panels were measured by a DC power analyzer of CASE Electronics.
3.2. Methods
The experiments of this study can be categorized into two groups.
- To manufacture an electrolysis cell and investigate its optimum working
conditions.
- To manufacture an electrolysis stack and couple it with photovoltaic panels to
investigate the solar hydrogen production ability on Iztech campus.
3.2.1. Producing the PEM Electrolysis Cell
The design of a cell structure which supplies water and electricity while
withdrawing oxygen and hydrogen simultaneously from membrane electrode assembly is
critical. Carbon graphite plates were selected as construction materials due to their high
electrical and heat conductivity and easy to machine properties. The plates were designed in
Solid Works® and then transformed into a Parasolid model computer file to process in our
institute’s computer numerical controlled (CNC) lathe. 2D diagram of the proposed
electrolysis cell design is given in Figure 3.1

32
Figure 3.1. 2D Schematic Representation of an Electrolysis Cell
After various designs, an empty flow field is enough to support the metal screen and
apply pressure uniformly; thus eliminating compression variations through the membrane.
The porous screen structure of the gas diffusion layer transport the product gases and water
from compartments to membrane electrode assembly (MEA) even in the absence of a
specific flow pattern behind it. The proposed oxygen side can be seen in Figure 3.2.

33
Figure 3.2. Anode side of the electrolysis cell
Water inlet and oxygen outlet holes were first drilled vertically and then connected
diagonally to the empty part of the anode side to feed water and withdraw the generated
oxygen with some unreacted water from the gas diffusion layer. Hydrogen output stream
coming from cathode side and bypassed the anode zone through a hole, A.
Empty base design was used again for the cathode side to uniformly counterbalance
the pressure on GDL. The hydrogen generation on the cathode catalyst surface cause a
pressure increment which leads the gas to diagonally drilled hole on the graphite. Figure
3.3 shows the proposed cathode layer of the cell.
Figure 3.3. Cathode Side of the electrolysis cell
A

34
In order to level the surface of GDL with silicon gasket, depth of the fields was set
to 0.5mm for both anode and cathode side. GDL’s were placed into the field and gaskets
were placed to the surroundings of GDL.
Figure 3.4. Parts of the Electrolysis Cell
Manufactured electrolysis cell was tightened with eight metric 5mm bolts. Metal
bolts were sealed with plastic tubes to avoid the electrical conduction. 8mm thick stainless
steel plates were also used at both ends to apply much uniform pressure on the components
of the cell.
3.2.2. Assembly and Test Procedures for the PEM Electrolysis Cell
• Single Cell PEM Electrolyzer Assembly Procedure
1. Insert 6 bolts to the cathode side end plate and fix the plate to the bench.
2. Place a 1mm thick silicon layer on the end plate.
3. Place the copper electric conduction plate on silicon layer.
4. Place the cathode side graphite.
5. Place the cathode side GDL into the cathode graphite layer.

35
6. Cover the cathode GDL with 1mm thick silicon gasket.
7. Submerge the MEA into water and wait until the expansion of membrane stops.
8. Insert the wet MEA on GDL.
9. Place the anode side GDL on the anode graphite layer.
10. Cover the anode GDL with 1mm thick silicon gasket.
11. Place the anode side graphite with its mounted components on MEA.
12. Place the water inlet, hydrogen and oxygen outlet tubes into the anode graphite.
13. Place the copper plate on anode graphite.
14. Place a silicon layer on copper plate.
15. Fixate the anode side end plate.
16. Insert the cap screws to the bolts and tighten them diagonally.
17. Stick the thermocouple probe on to graphite.
After the assembly, deionized water was fed to the water inlet using peristaltic
pump. To make sure that water filled up the inside of cell, filling should continue until
flooding of water from oxygen output is observed. It takes 0.6 to 6 minutes according to the
water feed rate since the inner volume of the cell is 6 cm3. The oxygen output was
connected to the inlet water reservoir in order to return the unreacted water to the system.
Hydrogen output was connected to a gas liquid separator to separate the liquid water
coming with hydrogen. Finally water vapor was adsorbed using silica gel filled bubbler
from the hydrogen stream. Positive terminal was connected to the anode side, negative
terminal was connected to the cathode side to apply the electricity from the power supply.
Current applied to the cell was increased gradually up to 10.13 Amp which is equal
to 500mAmp/cm2 for the proposed cell design. The other control variable, water flow rate,
was changed from 1ml/min to 10 ml/min. Temperature and voltage was measured
continuously. The setup of the single cell electrolysis experiment is given in Figure 3.5.

36
Figure 3.5. Single Cell Electrolysis Setup
Effects of the temperature and the flow rate on voltage-current density
characteristics of the electrolysis cells were studied. Current given to the electrolyzer was
increased with respect to time in each set. Potential difference between the electrodes,
hydrogen and oxygen flow rates and water permeation through membrane, were recorded
using voltmeter and digital soap bubble flow meters.
3.2.3 PEM Electrolysis Stack
The design is analogous to the single cell electrolyzer. In fact, first and last graphite
plates, end plates, silicon gaskets, gas diffusion layers of the stack were identical with the
plates used in single cell electrolyzer, though connecting two cells in serial requires an
electrical conduction between the cathode and adjacent cells anode. Thus, the only
difference from single cell electrolyzer is that two sided plates are used to achieve the
conduction between cells. Both sides of these plates were machined to place anode and
cathode GDL and appropriate ducts were drilled on plates to collect the product gases and

37
to deliver water. The front side of each plate is the cathode of the cell and the back side is
the anode side of the adjacent cell. This two sided plates are named bipolar plates. Similar
cell concept was applied to stack formation and the schematic representation of this
formation is given in Figure 3.6.
Figure 3.6. 2D Schematic of a PEM electrolysis stack
Front (cathode) and back (anode) side graphs of the proposed bipolar plate are given in the
figure below.
A B
Figure 3.7.a) Front Side of the Bipolar Plate b) Rear Side of the Bipolar Plate
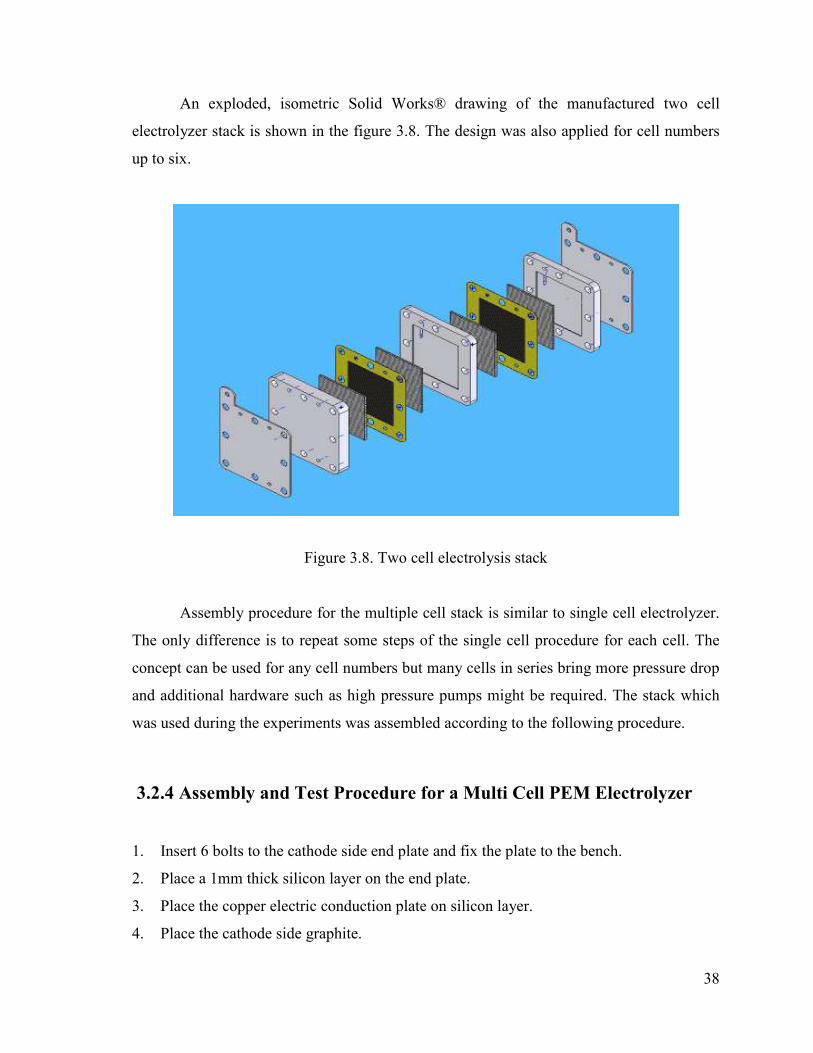
38
An exploded, isometric Solid Works® drawing of the manufactured two cell
electrolyzer stack is shown in the figure 3.8. The design was also applied for cell numbers
up to six.
Figure 3.8. Two cell electrolysis stack
Assembly procedure for the multiple cell stack is similar to single cell electrolyzer.
The only difference is to repeat some steps of the single cell procedure for each cell. The
concept can be used for any cell numbers but many cells in series bring more pressure drop
and additional hardware such as high pressure pumps might be required. The stack which
was used during the experiments was assembled according to the following procedure.
3.2.4 Assembly and Test Procedure for a Multi Cell PEM Electrolyzer
1. Insert 6 bolts to the cathode side end plate and fix the plate to the bench.
2. Place a 1mm thick silicon layer on the end plate.
3. Place the copper electric conduction plate on silicon layer.
4. Place the cathode side graphite.

39
5. Place the cathode side GDL into the cathode graphite layer.
6. Cover the cathode GDL with 1mm thick silicon gasket.
7. Submerge the MEA into water and wait until the expansion of membrane stops
8. Insert the wet MEA on cathode GDL.
9. Place the anode side GDL on the anode side of the bipolar plate.
10. Cover the anode GDL with 1mm thick silicon gasket.
11. Place the bipolar plate with its mounted components on MEA.
12. Place the cathode GDL into the cathode side of the bipolar plate.
13. Go to step 6 (repeat this step equal to the “number of cells -1” in the stack)
14. Place the water inlet, hydrogen and oxygen outlet graphite plate.
15. Place the copper plate on anode graphite.
16. Place a silicon layer on copper plate.
17. Fixate the anode side end plate.
18. Insert the cap screws to the bolts and tighten them diagonally.
19. Stick the thermocouple probe on to graphite.
Multiple cell electrolyzers have smaller heat transfer area per active electrolysis
area with respect to single cell ones. Thus, the stack electrolyzers tend to get hotter than
single cell ones; especially at a low water flow and a high current density. Hot electrolysis
surfaces usually damage the membrane thus it should be avoided. To control the water inlet
temperature, water reservoir was placed in a constant temperature water bath.
Non-uniform water distribution, contact pressure differences between cells, clogged
passage ways may cause voltage and temperature gradient between cells or even the
melting of the membrane. So, the aim was to operate all the cells of the stack at the same
current, voltage and temperature. This requires proper water distribution and gas collecting
through all the cells of the stack. Applied current and water feed were kept the same as the
previous experimental sets but the occurred electrical potential or temperature of the cells
due to less heat transfer area were different. Deionized water was fed to the water inlet via
peristaltic pump until the water flooded from the oxygen output. The oxygen output was
connected to the inlet water reservoir to return the unreacted water. Hydrogen output line

40
was treated as before. Positive terminal was connected to first plate (from the top), negative
terminal was connected to the last plate.
Figure 3.9. Multi Cell Electrolysis Stack Test Setup
3.2.5. Assembly and Test Procedure for the Solar Power Driven PEM
Electrolysis Stack
To investigate the solar power driven hydrogen production ability of the proposed
cell design 5 cell electrolysis stack was constructed and tested in the same as described in
section 3.2.3.
DC power supply was disconnected from the system and the negative terminal of
the solar array was connected directly to the last plate (cathode end plate) of the stack.
Positive terminal of the array was connected to a sensitive 6x10⁻⁴ Ω electric resistance
which was then connected to the first plate of the stack in series. A voltmeter was
connected to both ends of the resistance to measure the potential difference on the
resistance continuously. Dividing the observed potential on resistance gives us the current
supplied to the electrolyzer. Another voltmeter was connected to both end of the
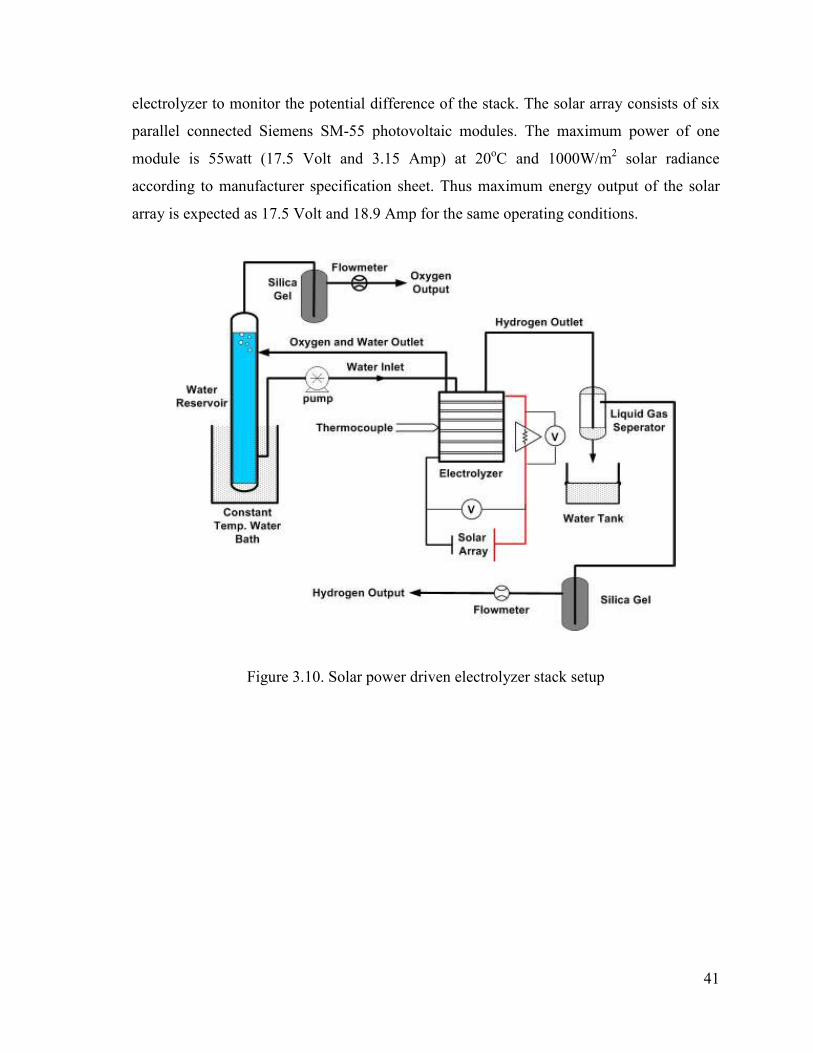
41
electrolyzer to monitor the potential difference of the stack. The solar array consists of six
parallel connected Siemens SM-55 photovoltaic modules. The maximum power of one
module is 55watt (17.5 Volt and 3.15 Amp) at 20oC and 1000W/m2 solar radiance
according to manufacturer specification sheet. Thus maximum energy output of the solar
array is expected as 17.5 Volt and 18.9 Amp for the same operating conditions.
Figure 3.10. Solar power driven electrolyzer stack setup
42
CHAPTER IV
RESULTS AND DISCUSSION
4.1 Electrolyzer Manufacturing Experiences on a Single Cell Electrolyzer
Catalyst loadings, cell temperature, operating pressure, various membranes all affect
electrolysis efficiency as mentioned in the literature. To construct a properly working
electrolysis cell at an acceptable efficiency level, gasket material, flow field design, gas and
liquid delivery compartments and the compression level of the cell are also important
factors.
The works on the design of inner parts of the electrolyzers in the literature are not
given in details and usually did not mention about the compression level of the cell, gasket
material, the inside configuration of inlet and outlet gas compartments and the flow field on
the graphite layer. In this work, before investigating the performance of the solar power
driven proton exchange membrane electrolyzer, research effort was first focused on the
construction of a properly working single electrolysis unit.
The design of the cell was improved from experiences gained from the design at
hand. During these trials, the shape of the fluid flow field, gasket materials, compression
bolts, the formation of gas and liquid chambers were changed step by step.
Seven different electrolysis cell designs were tested. In these trials, water flow rate
was set to 2g/min while the temperature of the cell was kept constant at 30oC. Identical
MEA and GDL were used while their active electrolysis areas were 20cm2 in all these
experiments.
In the first trial, a graphite layer having an “X” shape flow pattern was machined as
shown in figure 4.1.

43
Figure 4.1. “X” type flow field design
The depth of the field was 2mm while the pins were 3mmx3mm squares and 1mm
in height. 0.5mm. Rubber gaskets were used as sealing material to equalize the height of
the GDL with gasket. Polypropylene bolts having 5mm diameter were used to avoid short
circuit between cathode and anode. Water feeding to the electrolyzer and gas removal were
accomplished with horizontally drilled 3mm thick ducts. The bolts were tightened as much
as possible. After the completion of the assembly, current was applied to the cell and
increased gradually. It was observed that the potential difference, such as 5V at
200mAmp/cm2 current density, was too high to be used in practical applications. Due to
this low efficiency, heat production in the cell was high which avoided further
experimentation at current densities higher than 200 mAmp/cm2.
At the end of the experiment, the cell was disassembled and it was easily seen that
the metal GDL was damaged and curled in an “X” shape similar to its support graphite
layer due to non-homogeneous conduction of the pressure. Graphite layer design decreased
the usable contact area between MEA and GDL and because of that applied current seems
to pass from a small area of pins due to better contact between the membrane and gas liquid
distributor.
In the second design, to avoid the non homogeneous pressure distribution effect of
the X type flow field, pin type flow pattern was used to distribute compression pressure
uniformly. Figure 4.2 is the technical drawing of the pin type flow pattern of cathode.
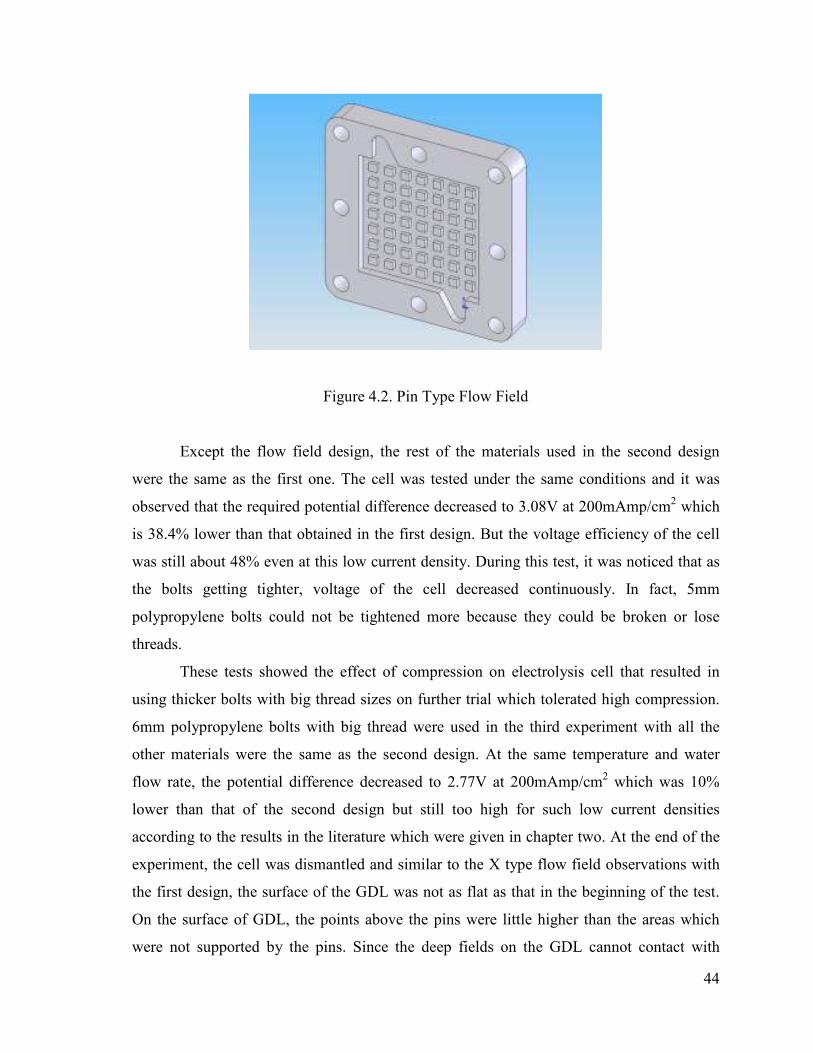
44
Figure 4.2. Pin Type Flow Field
Except the flow field design, the rest of the materials used in the second design
were the same as the first one. The cell was tested under the same conditions and it was
observed that the required potential difference decreased to 3.08V at 200mAmp/cm2 which
is 38.4% lower than that obtained in the first design. But the voltage efficiency of the cell
was still about 48% even at this low current density. During this test, it was noticed that as
the bolts getting tighter, voltage of the cell decreased continuously. In fact, 5mm
polypropylene bolts could not be tightened more because they could be broken or lose
threads.
These tests showed the effect of compression on electrolysis cell that resulted in
using thicker bolts with big thread sizes on further trial which tolerated high compression.
6mm polypropylene bolts with big thread were used in the third experiment with all the
other materials were the same as the second design. At the same temperature and water
flow rate, the potential difference decreased to 2.77V at 200mAmp/cm2 which was 10%
lower than that of the second design but still too high for such low current densities
according to the results in the literature which were given in chapter two. At the end of the
experiment, the cell was dismantled and similar to the X type flow field observations with
the first design, the surface of the GDL was not as flat as that in the beginning of the test.
On the surface of GDL, the points above the pins were little higher than the areas which
were not supported by the pins. Since the deep fields on the GDL cannot contact with

45
MEA, there were no electrolysis on these areas. Thus, it was decided that further
increments on the compression rate would not have a beneficial effect since both GDL’s
were not able to preserve their flatness at that compression level.
The flow field was changed to an empty flat surface for the fourth electrolyzer cell
design. The idea behind the attempt was based on the fact that water and product gases can
transport inside the GDL in both horizontal and vertical directions since the GDL was
composed of many thin metal screens and there seems to have enough empty space
between these metal sheets for the passage of water and gases.
Figure 4.3. Empty Flow Field
Hence, there is no need to put an extra part for the product and reactant
transportation behind the GDL. The depth of the empty field was set to 1mm while the
rubber gaskets were 0.5mm in thick. The same 6 mm in diameter polypropylene bolts were
used for compression. The current was applied to the cell and increased gradually. It was
found that this approach seemed to work well. Hydrogen and oxygen GDL’s works
properly and could remove the product gases as expected. However, there was no voltage
usage improvement (2.66V at 200mAmp/cm2) as compared to the previous designs at the
same compression levels. After disassembling the cell, it was observed that the flatness of
the GDL was preserved. So, it was decided to increase the compression on the cell.
Polypropylene is a useful material to be used as a bolt since it is an electrical insulator and

46
easy to machine. As the higher compression levels were required, the mechanical properties
of polypropylene bolts became insufficient. Thus, the steel bolts with plastic covers were
used in the further experiments.
In the fifth design, the same graphite layer (shown in Figure 4.3) was used. 5mm
diameter metal bolts were used to tighten the cell. Bolts were covered with 6mm plastic
tubes having 0.5mm wall thickness to prevent the electrical short circuit between graphite
plates. Both graphite plates were covered with a rubber and 5mm thick steel compression
plates were placed at the both ends of the cell. Plastic coated metal bolts and rubber gasket
covered graphite plates also enabled to protect the experimenter from a hazardous electrical
shock during the experiments. Bolts were tightened diagonally and each time every bolt
was only turned one quarter in order to prevent the graphite layer from breaking. Similar to
previous experiments, current was applied from a power supply to the cell and increased
gradually. It was found that efficiency was greatly improved. The required voltage was
decreased to 1.93V at 200mAmp/cm2. However, it was observed that the gas flow from
hydrogen side was lower than the flow as it should be and also at the same time, the amount
of oxygen gas flow was higher than that one would expect. The well tightened cell
increases the efficiency up to 77% (according to voltage efficiency) though after
dismantling, it was found that the rubber between the plates overflew and intruded from the
sides to both of the gas/liquid exit openings inside the active area. The intruded plastic
gasket parts tore the membrane and caused the product gases to mix.
In the sixth electrolysis cell design, the gaskets were cut from silicon since silicon
sheets were softer than the rubber and it was expected that the silicon would not tear the
membrane. Thicknesses of the silicon sheets were 1mm which is the thinnest silicon
available in the market. In order to equalize the height of the membrane electrode assembly
and gaskets depth of the flow field was machined as 0.5mm. During the experiment, it was
observed that the voltage requirement was slightly decreased to 1.88V at 200mAmp/cm2.
Better contact surface was obtained between GDL and MEA due to soft gasket material
which became thinner than the rubber at high tightening pressure. However, the silicon
gasket did not help to solve the gas mixing problem since the gas flows were still not equal
to expected hydrogen and oxygen flow rates.

47
In fact, it was observed on the disassembled cell that there was not any hole or a
tear occurred on the membrane, though the gas collection parts located at the top of the
graphite was too big and the soft silicon sheet on the top of this part generated an
imbalanced pressure on membrane that caused the membrane to stretch from anode to
cathode which allowed the gas mixing.
It was decided to remove the gas/liquid exit openings beside the empty field to
support the gasket all along the surrounding line of the active electrolysis area. To do that,
gas removal and water feed line passages were drilled crosswise from behind the GDL. The
graphite plate shown in Figure 4.4 was used in the seventh design.
Figure 4.4. Empty Flow field with crosswise ducts
Silicon gaskets were used again while the compression of the cell was provided by
plastic covered metal bolts with compression plates as used in the sixth design. In the first
step, the cell was tested up to 250mAmp/cm2. The potential difference was found to be
1.80V at 200mAmp/cm2 and also mass balance made on the cell was closed within 3%
error. The heat dissipation was very low due to low electrolysis overvoltage. Then, based
on the encouraging results, the cell was tested with current densities up to 500mAmp/cm2.
The voltage-current characteristic was almost a linear line and the voltage of the cell was
measured as 2.20V at 500mAmp/cm2.
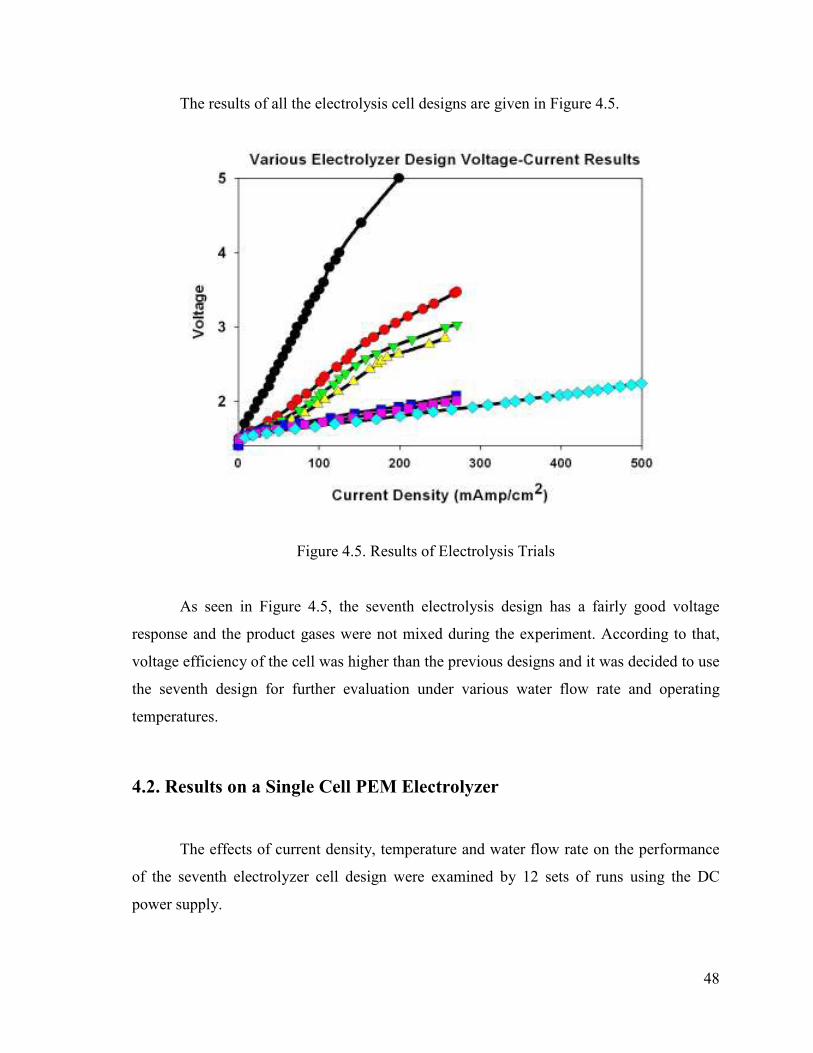
48
The results of all the electrolysis cell designs are given in Figure 4.5.
Figure 4.5. Results of Electrolysis Trials As seen in Figure 4.5, the seventh electrolysis design has a fairly good voltage
response and the product gases were not mixed during the experiment. According to that,
voltage efficiency of the cell was higher than the previous designs and it was decided to use
the seventh design for further evaluation under various water flow rate and operating
temperatures.
4.2. Results on a Single Cell PEM Electrolyzer
The effects of current density, temperature and water flow rate on the performance
of the seventh electrolyzer cell design were examined by 12 sets of runs using the DC
power supply.

49
In each run, current density was increased from 0mAmp/cm2 to 500mAmp/cm2
gradually (0, 10, 25, 40, 55, 75, 100, 125, 150, 200, 250, 300, 350, 400, 450 and 500). In
each step, the applied current was fixed and electrolysis was continued for a minute at that
current and then, voltage of the cell was recorded.
Temperature and water flow rates were kept constant during each run. Hydrogen
and oxygen outputs were calculated continuously according to energy efficiency
formulations and also at each run, the gas outputs were measured at 100mAmp/cm2 and at
400mAmp/cm2 to check the mass balance on the cell.
4.2.1. Effects of Temperature on PEM Electrolysis
Similar to the previous runs, as the current density increased, high potential
differences were required. It was observed that increasing temperature had a favorable
effect on electrolysis efficiency since it decreased the potential difference. Voltage of the
cell fluctuated between 2.16V and 2.20V with an average value of 2.18V at 500mAmp/cm2
and 30oC. The average voltage decreased to 2.05V and 1.97V under the same current
density at 40oC and 50oC, respectively. However, the cell was not successfully tested at
high temperatures due to clogging by melted silicon gaskets.
The results were grouped to clearly see the temperature effect, as given in Figure
4.6. (a)-(d). The water flow rates were 1g/min in Figure 4.6(a), 3g/min in Figure 4.6(b),
5g/min in Figure 4.6(c), and 10g/min in Figure 4.6(d).
The inverse correlation between temperature and potential difference seems
consistent with the literature. According to the findings of Grigoriev et al., their PEM
electrolyzer could generate hydrogen at 500mAmp/cm2 and 30oC with a voltage of 1.80V.
The required potential difference decreases to 1.55V at 90oC for the same current density
(Grigoriev et al. 2006). The relatively low voltage requirement of their cell as compared to
the results obtained in this thesis could be due to the low membrane resistance. They used
N-112 membranes which had a thickness of 50µm and almost one third of the membranes
used in the electrolyzer of this thesis.

50
a b
c d
Figure 4.6. (a)-(d) Temperature Effect on Electrolysis
In Figure 4.7, voltage responses of all the cells for varying water flow rates are
given at 500mAmp/cm2. The figure shows the relation between temperature and voltage.
For all water flow rates, as seen in Figure 4.7, temperature has a positive effect on
electrolysis efficiency. In this respect, high cell temperature is advantageous for PEM water
electrolysis but with respect to thermal stability of cell components used in this thesis,
optimum cell temperature was selected as 50oC. Temperature of the electrolyzers was
controlled with an external fan to achieve isothermal operation (as much as possible) at
50oC especially for high current densities.
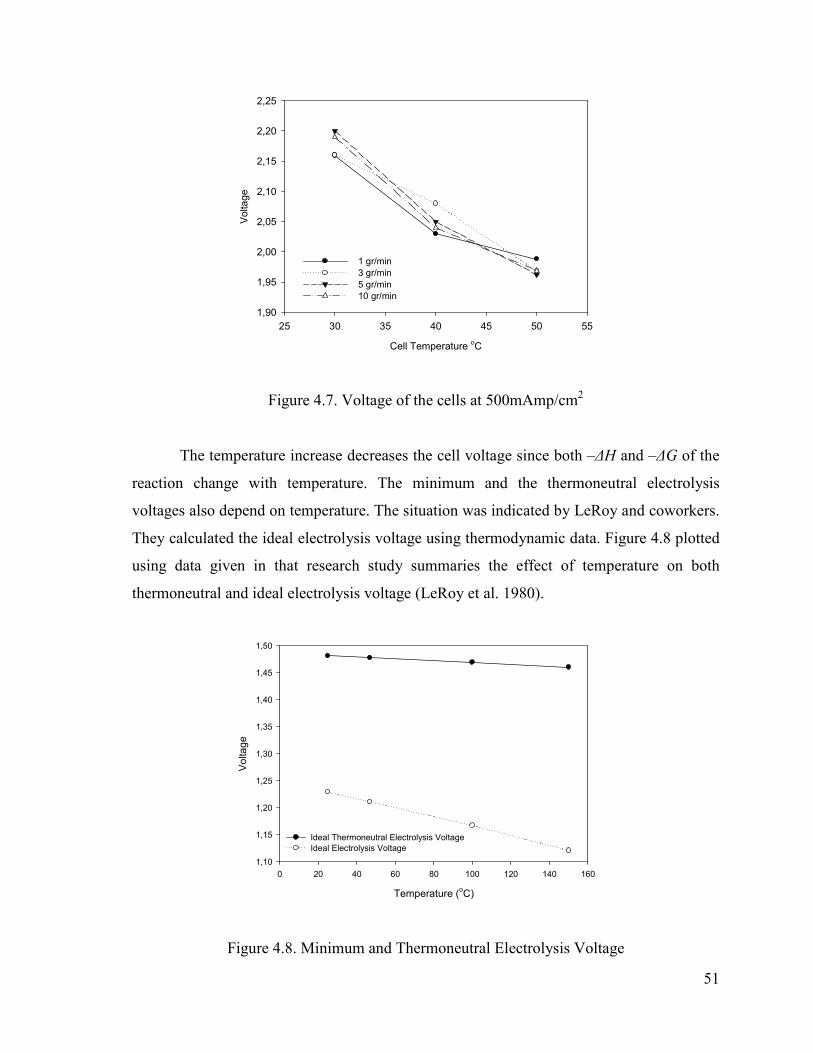
51
Cell Temperature oC
25 30 35 40 45 50 55
Voltage
1,90
1,95
2,00
2,05
2,10
2,15
2,20
2,25
1 gr/min
3 gr/min
5 gr/min
10 gr/min
Figure 4.7. Voltage of the cells at 500mAmp/cm2
The temperature increase decreases the cell voltage since both –∆H and –∆G of the
reaction change with temperature. The minimum and the thermoneutral electrolysis
voltages also depend on temperature. The situation was indicated by LeRoy and coworkers.
They calculated the ideal electrolysis voltage using thermodynamic data. Figure 4.8 plotted
using data given in that research study summaries the effect of temperature on both
thermoneutral and ideal electrolysis voltage (LeRoy et al. 1980).
Temperature (oC)
0 20 40 60 80 100 120 140 160
Voltage
1,10
1,15
1,20
1,25
1,30
1,35
1,40
1,45
1,50
Ideal Thermoneutral Electrolysis Voltage
Ideal Electrolysis Voltage
Figure 4.8. Minimum and Thermoneutral Electrolysis Voltage

52
The thermoneutral electrolysis voltage decreases from 1.481V to 1.477V as
temperature increases from 30oC to 50oC. Similarly, minimum electrolysis voltage
decreases to 1.21V from 1.23V for the same temperature interval. However, on an ideal
electrolyzer, the change of voltage with temperature is smaller than that found on a non-
ideal single cell electrolyzer. High voltage decrements of non-ideal cells with incrasing
temperature have other reasons such as decreasing membrane resistance and lower
electrode overpotentials due to increasing catalytic activities at elevated temperatures.
4.2.2. Effects of Excess Water Flow on PEM Electrolysis
From measured gas output flow rates, it was calculated that actual water converted
during the electrolysis was 0,056gr/min at the highest current density. This amount was
very low as compared to water fed to the system. So, when the exact amount of water
necessary for the electrolysis was introduced into the cell, some problems, such as non-
homogeneous electrolysis, occurred. This may be due to that some part of the membrane
cannot uniformly be wetted with water.
After the electrolysis started (even the anode side was filled with water at the
beginning), the generated oxygen carried away water quickly from the cell when the
theoretical minimum water flow rates were used. Especially, it was found that when the cell
was disassembled, upper parts of the membrane electrode assembly was dry; indicating that
those part was not in contact with water at high current densities if water flow rate was
below 1g/min. The situation led to partial melting of the membrane at elevated current
levels after a certain time. To overcome this problem, a minimum water flow rate was set as
1g/min and increased to 3g/min, 5g/min and 10g/min to observe the effect of excess water
flow rate on the voltage-current density behavior and also the gas flow rates. Since the flow
pattern inside the cell has not been studied yet, it is not easy to know how water and gases
rates affect each other. In other words, the cell design needs to be optimized by considering
flow contact pattern, the catalyst formulation and also types of the materials before
stoichiometric water could be used to eliminate the circulation of unused water through the
system; hence ultimately decreasing the energy consumed by the circulation water pump.

53
Therefore, for the current cell design, excess water was used to control the temperature of
the cell and also to prevent the membrane electrode assembly from drying.
The experimental results were grouped together to clearly see the effect of excess
water flow on the voltage. These are shown in Figure 4.9 (a)-(c). Temperatures were 30oC
in Figure 4.9(a), 40oC in Figure 4.9(b) and 50oC in Figure 4.9(c).
a b
c
Figure 4.9. (a)-(c) Excess Water Flow Effect on Electrolysis
At 500mAmp/cm2, oxygen flow rate from the cell was 37.5ml/min. At 1g/min water
flow rate, 2.5% (by volume) of the output stream coming from anode side was water (the
rest was oxygen) and at 10g/min, this fraction increased to 21%. Total liquid volumetric
flow rate from the cell increased 23% although oxygen generated was the same at a
constant current density. In addition, excess water did not result in adverse effect on the
voltage (at a constant current denisty). The main advantage of excess water is to control
the temperature of the cell. This is especially critical at high current densities. In other
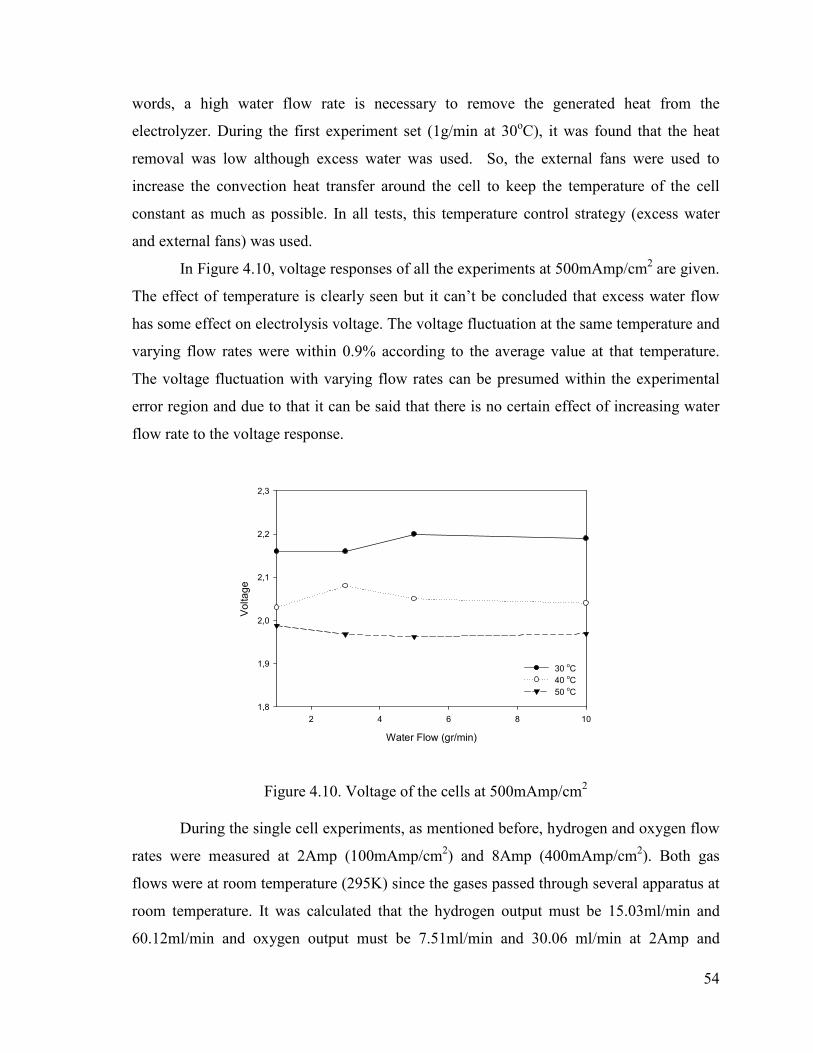
54
words, a high water flow rate is necessary to remove the generated heat from the
electrolyzer. During the first experiment set (1g/min at 30oC), it was found that the heat
removal was low although excess water was used. So, the external fans were used to
increase the convection heat transfer around the cell to keep the temperature of the cell
constant as much as possible. In all tests, this temperature control strategy (excess water
and external fans) was used.
In Figure 4.10, voltage responses of all the experiments at 500mAmp/cm2 are given.
The effect of temperature is clearly seen but it can’t be concluded that excess water flow
has some effect on electrolysis voltage. The voltage fluctuation at the same temperature and
varying flow rates were within 0.9% according to the average value at that temperature.
The voltage fluctuation with varying flow rates can be presumed within the experimental
error region and due to that it can be said that there is no certain effect of increasing water
flow rate to the voltage response.
Water Flow (gr/min)
2 4 6 8 10
Voltage
1,8
1,9
2,0
2,1
2,2
2,3
30 oC
40 oC
50 oC
Figure 4.10. Voltage of the cells at 500mAmp/cm2
During the single cell experiments, as mentioned before, hydrogen and oxygen flow
rates were measured at 2Amp (100mAmp/cm2) and 8Amp (400mAmp/cm2). Both gas
flows were at room temperature (295K) since the gases passed through several apparatus at
room temperature. It was calculated that the hydrogen output must be 15.03ml/min and
60.12ml/min and oxygen output must be 7.51ml/min and 30.06 ml/min at 2Amp and

55
8Amp, respectively. The calculated and measured results are given in Figure 4.11(a) for
oxygen flow and Figure 4.11(b) for hydrogen flow.
a b
Figure 4.11. Calculated and Measured Oxygen and Hydrogen Flows
Averages of the measured gas output were within 1% range of the calculated values
although oxygen output readings fluctuated within 10% range of flow. This might be due to
that the excess water and oxygen competed each other to escape from the cell and also
oxygen gas bubbled through the upper part of the water reservoir was coming out; resulting
in difficulties in flow measurements with the soap flow meter.
The single cell operated at 500mAmp/cm2 shows that the cell can generate
hydrogen at 67.9% to 75.2% efficiency. The reason of the change in the efficiency is due to
the temperature and non-optimized design of the current cell, though the results seem to be
promising as compared to previously constructed alkaline electrolyzer which operated in
previous studies at about 3.5V per cell in our institute (Atagündüz, 1993). However, the
major drawback of the current design proposed in this thesis is the operating temperature
limitation of the materials used to assemble the cell, such as melting of gasket. This
problem prevented the cell from being used at high efficiency levels; i.e. at high
temperatures.
Moreover, to increase the cell efficiency, thinner proton exchange membranes can
be used instead of using N-117 which is 150µm in thickness because voltage drop on
membrane was proportional with its thickness. Though thinner membranes such as N-112
(50µm) have higher hydrogen back diffusion rates. Especially at low current densities,
Experiment Number
2 4 6 8 10 12
Oxygen Production (ml/min)
0
5
10
15
20
25
30
35
Calculated O2 at 2Amp
Measured O2 at 2Amp
Calculated O2 at 8Amp
Measured O2 at 8Amp
Experiment Number
2 4 6 8 10 12
Hydrogen Production (ml/min)
0
10
20
30
40
50
60
70
Calculated H2 at 2Amp
Measured H2 at 2Amp
Calculated H2 at 8Amp
Measured H2 at 8Amp

56
(which is usually the case for photovoltaic powered electrolysis) hydrogen back diffusion
results with an explosive gas output on the oxygen line. To avoid that N-117 was selected
as proton exchange membrane for this experimental setup.
4.3. Results on a Five cell PEM Electrolyzer Stack
A five cell electrolysis stack was constructed according to the procedure as
mentioned in the previous chapter. First, the stack was tested with a regulated DC current
supply to examine if there is any problem, such as gas mixing, water distribution or voltage
distribution between the cells of the stack.
The water flow was set to 10g/min and also external fans were used depending on
the current densities so that it was easy to keep the stack temperature at 40oC. The supplied
current was increased gradually similar to single cell experiments. The voltage response of
individual cell in the stack is given in Figure 4.12.
Current Density (mAmp/cm2)
0 100 200 300 400 500
Cell Voltage
1,4
1,5
1,6
1,7
1,8
1,9
2,0
2,1
Cell 1
Cell 2
Cell 3
Cell 4
Cell 5
Figure 4.12 Current Voltage Curves of the Cells of an Electrolyzer Stack

57
At 500mAmp/cm2, the potential difference developed on the stack was 10.09V. The
minimum cell voltage obtained across an individual cell was 1.96V (cell 2), the maximum
cell voltage was 2.06V (cell 3) and the average cell voltage was 2.018V.
The same assembly procedure was applied to each cell but voltage response of the
individual cell was not the same. This might be due to that GDL and MEA in some cells
had better contact than the others. Hence, less efficient cells were dissipating more heat
than others. This causes a temperature variation between the cells. The maximum
temperature was observed as 41.5oC at cell 3 while the minimum was observed at cell 1 as
39oC.
Although the cell voltage response was not identical, the voltage efficiency
difference between the most and the least efficient cells was 3.67% at 500mAmp/cm2. The
hydrogen output and the voltage of the stack were measured continuously as the current
increased. The stack can generate 388ml/min hydrogen at 10Amp (500mAmp/cm2) and
10.09V. Hydrogen generation versus current density and voltage of the stack are given in
Figure 4.13.
Current Density (mAmp/cm2)
0 100 200 300 400 500
Hydrogen Production (ml/min)
0
100
200
300
400
500
Stack Voltage
7,5
8,0
8,5
9,0
9,5
10,0
10,5
Measured H2 production
Stack Voltage
Figure 4.13. Hydrogen Production vs. Current Density

58
The 5 cell stack was tested for several hours at the maximum possible current
density (500mAmp/cm2) supplied by the DC power supply. There were no noticeable
fluctuations at the stack temperature, voltage and gas outputs during this test. Mass balance
of the stack was also done after reaching steady state (1 hour test at 300mAmp/cm2). It was
seen that mass balance could be closed within a 3% error. Detailed information about stack
mass balance is given in Appendix B. After that, it was decided to test the cell with a
photovoltaic array since this way of hydrogen generation using renewable energy source is
the ultimate goal of this thesis.
4.4. Results on a Solar Power Driven Five Cell PEM Electrolyzer Stack
Voltage-current characteristic of a photovoltaic panel is affected by solar intensity
and the surface temperature of the panel. Voltage-current curves of a Siemens SM-55 PV
module was taken from the manufacturer’s product specification sheet and given in Figure
4.14. As seen in the figure, short circuit current of a single module is 3.5Amp and the
maximum power point of the module is 3.15Amp at 17.4V when solar radiance is
1000W/m2.
Figure 4.14. Current-Voltage Curves of a PV Module (Source: Siemens SM55 product specification sheet)

59
The installed system had 6 of this module connected in parallel. The maximum
current of the array was 21Amp and the maximum power point of the array was 18.9Amp
at 17.4V when exposed to 1000W/m2 solar radiance at 25oC panel surface temperature. In
fact, at this ambient condition, the array can produce 328W power at its maximum power
point. The PV array can supply higher current than the used DC power source GP-1305TP.
Therefore, the electrolyzer will be exposed to high current densities up to 1000mAmp/cm2
during the solar powered experiments which means that the heat dissipation will be very
high and the temperature control of the stack is very important.
In solar power driven electrolyzer experiments, although water flow was set to
15g/min, the temperature of the stack wasn’t constant due to the fast changing weather
condition. Moreover, especially heat removal via excess water was not sufficient at high
solar radiances due to very high heat dissipation and the stack temperature started to
increase rapidly. To prevent the membrane from being damaged at high temperatures, a fan
which works at 12V and 0.1 Amp was attached in parallel to the stack. Positive part of the
fan’s cable was attached to the first anode and negative one was attached to the last
cathode. So, the given voltage to the fan was exactly the same with the electrolysis stack.
Since the voltage response of the stack changes according to solar radiance, fan revolution
was changing accordingly. At high hydrogen production levels, due to high voltage
response of the stack, high fan revolutions were observed and increased heat removal was
achieved. This configuration prevents high temperature from occurring on the stack at high
solar radiances.
The stack was tested for several days from December to June. The solar radiance
data and hydrogen production results of some selected days are given in this chapter and
the rest of the results are listed in Appendix A.
The stack was tested on 18.12.06 from 8.45AM to 16.15PM. In Figure 4.15, solar
radiance data belong to that day is given. The day was partly cloudy as could be understood
from the figure. The sharp decrement on solar radiance between 11.00AM and 12.30PM
was a result of sun covered by clouds, the low solar radiance decreases the current
generation of the array dramatically as represented in Figure 4.14. The highest measured
solar radiance was 685W/m2 at 13.30PM.
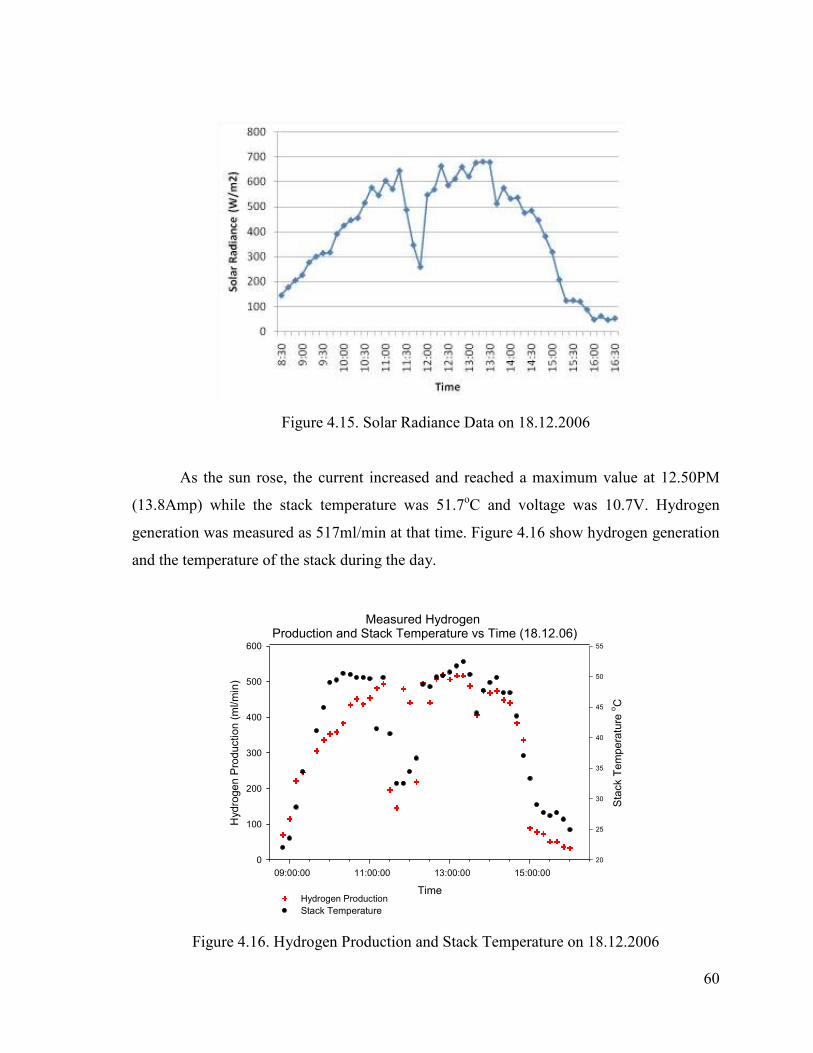
60
Figure 4.15. Solar Radiance Data on 18.12.2006
As the sun rose, the current increased and reached a maximum value at 12.50PM
(13.8Amp) while the stack temperature was 51.7oC and voltage was 10.7V. Hydrogen
generation was measured as 517ml/min at that time. Figure 4.16 show hydrogen generation
and the temperature of the stack during the day.
Measured Hydrogen Production and Stack Temperature vs Time (18.12.06)
Time
09:00:00 11:00:00 13:00:00 15:00:00
Hydrogen Production (ml/min)
0
100
200
300
400
500
600
Stack Temperature oC
20
25
30
35
40
45
50
55
Hydrogen Production
Stack Temperature
Figure 4.16. Hydrogen Production and Stack Temperature on 18.12.2006

61
At 11.00 AM, as the current density decreased, voltage requirement of the stack
decreased; thus, total power consumption of the stack decreased sharply. The low voltage
and current density caused the stack to work at a high efficiency. Most importantly, this
lowered the heat generation and the temperature of the stack and the temperature of the
stack decreases as a response to that during the cloudy hours.
Another test day was 09.01.07. The electrolysis was performed from 8.45AM to
16.15PM. The day was almost cloudless until 12.50PM. Hydrogen generation and stack
temperature decreased after that time and fluctuated as a function of solar radiance. The
maximum current was measured as 12.3 Amp at 12.10PM and the maximum hydrogen
generation was obtained at this time as 480ml/min. Figure 4.17 shows the hydrogen
generation and the stack temperature on that day.
Measured Hydrogen Production and Stack Temperature vs. Time 09.01.2007
Time
08:00:00 10:00:00 12:00:00 14:00:00 16:00:00
Hydrogen G
eneration (ml/min)
0
100
200
300
400
500
600
Stack Temperature oC
15
20
25
30
35
40
45
50
55
Hydrogen Production
Stack Temperature
Figure 4.17. Hydrogen Production and Stack Temperature on 09.01.2007
February 22, 2007 was a rainy day and the stack was tested from sunrise to sunset
during that day. Solar radiance data of the day is given in Figure 4.18. The highest solar
radiance was observed as 780W/m2 at 10.15AM. The rain was started at 10.30AM and
continued to 14.15PM, at 15.00PM the rain was started again and continued for the rest of
the day.

62
Figure 4.18. Solar Radiance on 22.02.2007
Hydrogen production of the system is given in Figure 4.18. for the same day. On
this day, as compared to the previous examples, electrolysis continued up to 17.00PM due
to that long day light observed in that month. At the end of the day, total hydrogen
production was found to be 55L.
Measured Hydorgen Production and Stack Temperature vs. Time (22.02.2007)
Time
08:00:00 10:00:00 12:00:00 14:00:00 16:00:00 18:00:00
Hydrogen Production (ml/min)
0
100
200
300
400
500
600
Stack Temperature oC
20
25
30
35
40
45
50
55
Hydrogen Production
Stack Temperature
Figure 4.19. Hydrogen Production and Stack Temperature on 22.02.2007

63
Figure 4.19 shows solar radiance data on Iztech campus on a clear day (14 May
2007). The maximum radiance was observed as 950W/m2 at 13.30PM. Total daylight time
which is adequate for electrolysis was about 13 hours.
Figure 4.20. Solar Radiance Data on 14.05.2007
The hydrogen production and stack temperature data for the same day is given in
Figure 4.20. The maximum hydrogen generation at 13.30PM was measured as 708ml/min.
The maximum stack temperature was measured as 53.2oC at the same time. The electrolysis
continued up to 20.00PM since day time saving started on 25.03.07. Total hydrogen
production was calculated to be 344L at the end of the day.

64
Measured Hydorgen Production and Stack Temperature vs. Time (14.05.2007)
Time
08:00:00 12:00:00 16:00:00 20:00:00
Hydrogen Production (ml/min)
0
100
200
300
400
500
600
700
800
Stack Temperature oC
20
25
30
35
40
45
50
55
60
Hydrogen Production
Stack Temperature
Figure 4.21. Hydrogen Production and Stack Temperature on 14.05.2007
In partly cloudy days, solar radiance fluctuates very rapidly and the temperature of
the stack gives a delayed response to that. In some cases, even the hydrogen production was
low the stack temperature was almost 50oC which resulted in a highly efficient cell
operation. But in some cases, the delayed temperature response of the stack became
dangerous when the solar radiance increases rapidly the current density increases very fast
from a low point to almost 1000mAmp/cm2 within seconds. At that time, the stack exposes
to a high current when it is cold. The situation leads a high voltage requirement (less
efficient stack) which results in high heat dissipation per unit time. To prevent membrane
from melting, even higher water flow rate than that used for previous tests was required.
This is the reason why the minimum water flow rate was set to 15g/min flow rate at the
solar array powered stack experiments.
As its power source depends on weather conditions, hydrogen production varies
from day to day. Minimum daily hydrogen production was observed on 22.02.07 as 55L
while the maximum production was 344L at the end of the day on 14.05.07.

65
On Iztech campus, the system constructed in this thesis can convert up to 4Mj
energy equivalent sunlight into chemical energy by producing 28gr hydrogen per day. The
efficiency of the stack decreases from 98% to 60% from sunrise to sunset. In addition to
that, another energy loss seems to occur between the PV array and the electrolyzer stack.
The working voltage of the stack changed between 7.5V to 12.5V which was below that of
the PV array maximum power point which is changing between 14.5V to 17.3V according
to solar radiance level and panel surface temperature. Due to that, part of the PV voltage
capacity cannot be utilized by electrolyzer stack.

66
CHAPTER 5
CONCLUSIONS
The single cell experiments have shown that the flow pattern design and the types
of the components used in the construction of the electrolyzers have great influence on the
electrolyzer life time and its performance. The cell operating temperature at 500mAmp/cm2
increases the voltage efficiency from 67.9% at 30oC to 75.2% at 50oC. It was avoided to
test the cell at further high temperatures due to gasket melting problem. Various water flow
rates have shown that the excess water flow has no influence on the electrolysis cell voltage
(i.e. no direct adverse effect on the efficiency) although high water flow rates has made
easy to control the cell temperature which is very important especially at high current
densities to protect temperature sensitive components of the electrolyzers.
5 cell electrolysis stack was constructed and tested with the regulated power supply.
For a constant current density and the stack voltage, the temperature of each cell, hydrogen
and oxygen flow rates remain constant and the stack was working properly without any
problem. Mass balance made on the cell is closed within 3% error. Though multi cell
experiments show that even the components and assembly procedure of all cells are
identical, voltage differences up to 5% occur from cell to cell. The situation results in a
2.5oC temperature difference between the most and least efficient cell in the stack.
The long term usage of the solar array powered 5 cells electrolyzer shows that the
applied current to the electrolyzer changes from 0Amp to 20Amp as a function of solar
radiance during the day. As a result of that, electrolyzer current density can reach
1000mAmp/cm2 at high solar radiance levels. The voltage drop from 7.5V to 12.5V occurs
on the stack based on the current passed through the stack. A maximum hydrogen
generation of 750 ml/min could be obtained and also a daily production changes between
50L to 350L according to weather condition of the day.
One of the most apparent way to increase the electrolysis efficiency of the system is
to increase the cell working temperature. To provide that, the most heat sensitive material
of the system, silicon gaskets must be replaced with heat resistant ones. According to
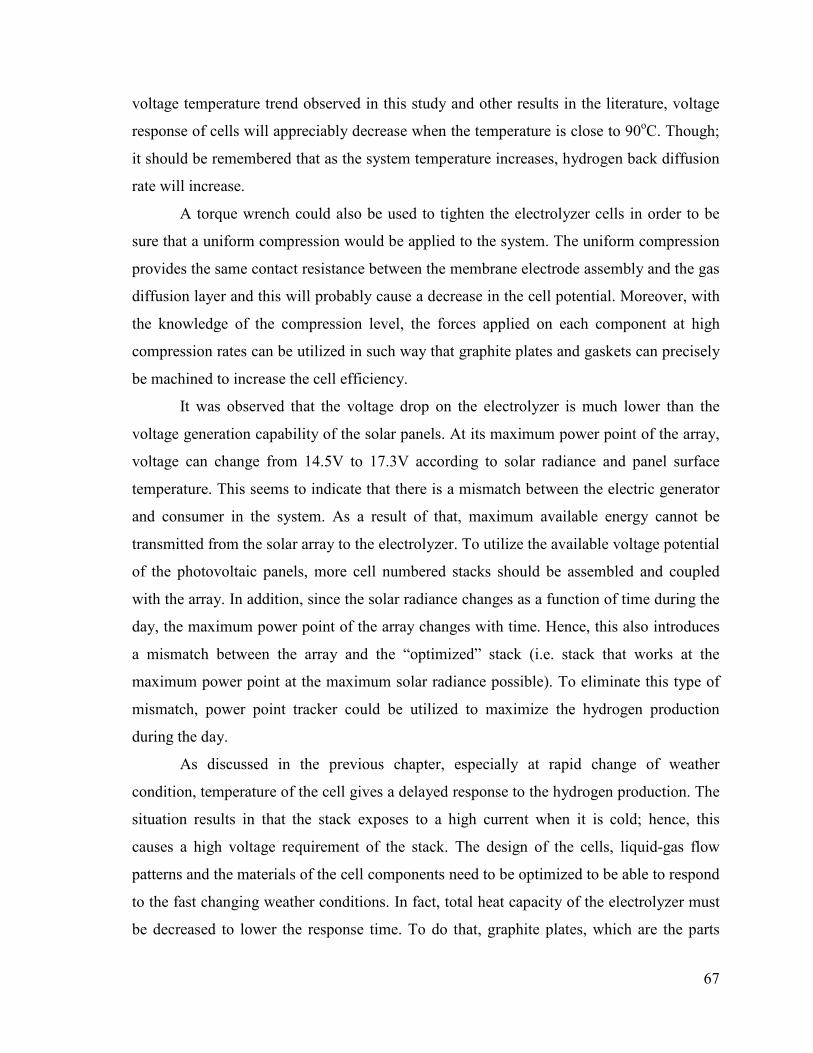
67
voltage temperature trend observed in this study and other results in the literature, voltage
response of cells will appreciably decrease when the temperature is close to 90oC. Though;
it should be remembered that as the system temperature increases, hydrogen back diffusion
rate will increase.
A torque wrench could also be used to tighten the electrolyzer cells in order to be
sure that a uniform compression would be applied to the system. The uniform compression
provides the same contact resistance between the membrane electrode assembly and the gas
diffusion layer and this will probably cause a decrease in the cell potential. Moreover, with
the knowledge of the compression level, the forces applied on each component at high
compression rates can be utilized in such way that graphite plates and gaskets can precisely
be machined to increase the cell efficiency.
It was observed that the voltage drop on the electrolyzer is much lower than the
voltage generation capability of the solar panels. At its maximum power point of the array,
voltage can change from 14.5V to 17.3V according to solar radiance and panel surface
temperature. This seems to indicate that there is a mismatch between the electric generator
and consumer in the system. As a result of that, maximum available energy cannot be
transmitted from the solar array to the electrolyzer. To utilize the available voltage potential
of the photovoltaic panels, more cell numbered stacks should be assembled and coupled
with the array. In addition, since the solar radiance changes as a function of time during the
day, the maximum power point of the array changes with time. Hence, this also introduces
a mismatch between the array and the “optimized” stack (i.e. stack that works at the
maximum power point at the maximum solar radiance possible). To eliminate this type of
mismatch, power point tracker could be utilized to maximize the hydrogen production
during the day.
As discussed in the previous chapter, especially at rapid change of weather
condition, temperature of the cell gives a delayed response to the hydrogen production. The
situation results in that the stack exposes to a high current when it is cold; hence, this
causes a high voltage requirement of the stack. The design of the cells, liquid-gas flow
patterns and the materials of the cell components need to be optimized to be able to respond
to the fast changing weather conditions. In fact, total heat capacity of the electrolyzer must
be decreased to lower the response time. To do that, graphite plates, which are the parts

68
with the highest heat capacity in the system, can be replaced with stainless metal plates
because metal plates can be machined in much thinner sizes according to graphite and
molding or pressing methods could be used for fast and large scale productions.

69
REFERENCES
Grigoriev S.A.,Porembsky V.I., Fateev V.N., 2006, “Pure hydrogen Production by PEM
electrolysis for hydrogen energy” International Journal of Hydrogen Energy 31(2006) 171-175
Yamaguchi M, Horiguchi M, Nakanori T. 2000, “Development of large-scale water
electrolyser using solid polymer electrolyte in WE-NET” Proceedings of the 13th
World Hydrogen Energy Conference, vol. 1, June 12–15, 2000, Beijing, China. p. 274–281.
Tsutomu Oi, Yoshinori Sakaki, 2003 “Optimum hydrogen production and current density
of the PEM type water electrolyser operated only during the off-peak period of electricity demand” Journal of Power Sources 129(2004) 229-337
Shidong Song, Huamin Zhang, Xiaoping Ma, Zhi-Gang Shao, Yining Zhang, Baolian Yi,
2006 “Bifunctional oxygen electrode with corrosion-resistive gas diffusion layer for unitized regenerative fuel cell” Electrochemistry Communications 8 (2006) 399–405
Pettersson J., Ramsey B., Harrison D.,2006 “A review of the latest developments in
electrodes for unitized regenerative polymer electrolyte fuel cells” Journal of Power
Sources 157 (2006) 28–34
Frano Barbir, 2005 “PEM electrolysis for production of hydrogen from renewable energy
sources” Solar Energy 78 (2005) 661–669 Kazuo Onda, Takahiro Kyakuno, Kikuo Hattori, Kohei Ito, 2004 “Prediction of production
power for high-pressure hydrogen by high-pressure water electrolysis” Journal of
Power Sources 132 (2004) 64–70 Tsutomu Oi, Yoshinori Sakaki, 2004 “Optimum hydrogen generation capacity and current
density of the PEM-type water electrolyser operated only during the off-peak period of electricity demand” Journal of Power Sources 129 (2004) 229–237
Tsutomu Ioroi, Takanori Oku, Kazuaki Yasuda, Naokazu Kumagai, Yoshinori Miyazaki,
2003 “Influence of PTFE coating on gas diffusion backing for unitized regenerative polymer electrolyte fuel cells” Journal of Power Sources 124 (2003) 385–389
Lee S. J., Mukerjee S., McBreen J., Rho Y. W., Kho Y. T., Lee T. H., 1998 ” Effects of
Nafion impregnation on performances of PEMFC electrodes” Electrochimica Acta, Vol. 43, No. 24, pp. 3693-3701, 1998

70
Kim C. S., Chun Y. G., Peck D. H., Shin D. R., 1998 “A Novel Process to Fabricate Membrane Electrode Assemblies for Proton Exchange Membrane Fuel Cells” International Journal of Hydrogen Energy Vol23 No:11 pp1045-1048
Sung-Dae Yim, Won-Yong Lee, Young-Gi Yoon, Young-Jun Sohn, Gu-Gon Park, Tae-
Hyun Yang, Chang-Soo Kim, 2004 “Optimization of bifunctional electrocatalyst for PEM unitized regenerative fuel cell” Electrochimica Acta 50 (2004) 713-718
Tsutomu Ioroi, Kazuaki Yasuda, Zyun Siroma, Naoko Fujiwara, Yoshinori Miyazaki, 2002
“Thin film electrocatalyst layer for unitized regenerative polymer electrolyte fuel cells” Journal of Power Sources 112 (2002) 583–587
Xianguo Li, Imran Sabir, 2005 “Review of bipolar plates in PEM fuel cells: Flow-field
designs” International Journal of Hydrogen Energy 30 (2005) 359 – 371 Rikukawa M., Sanui K.,2000 “Proton-conducting polymer electrolyte membranes based on
hydrocarbon polymers “ Prog. Polymer Science 25 (2000) 1463-1502 Hankyu Lee, Jiyun Kim, Jongho Park, Yungil Joe, Taehee Lee, 2004 “Performance of
polypyrrole-impregnated composite electrode for unitized regenerative fuel cell” Journal of Power Sources 131 (2004) 188–193
Rodney L. LeRoy ,Christopher T. Bowen, 1980 “Thermodynamics of aqueous water electrolysis” Journal of. Electrochemical Society, Volume 127, Issue 9, pp. 1954-1962 (September 1980)
Brian Russel Einsla, 2005 Doctor of Philosophy in Macromolecular Science and Engineering Thesis Virginia Polytechnic Institute “High Temperature Polymers for Proton Exchange Membrane Fuel Cells”
Gürbüz Atagündüz,1992 “ Solar Driven Electrolysis Cell Developed for Hydrogen
Production” Aegean University Solar Energy Institute Publications Ahmad G.E., El Shenawy E.T., 2006 “Optimized photovoltaic system for hydrogen
Production” Renewable Energy 31 (2006) 1043–1054
Hubbert M. King, Shell Development Company Exploration and Production Research Division, Publication No:95 Houston Texas (1956)
Torres L.A., Rodriguez F.J, Sebastian P.J., 1998 “Simulation of a Solar Hydrogen-Fuel Cell System: Results for a different locations in Mexico” International Journal of
Hydrogen Energy Vol. 23 No.11 pp. 1005-1009 Hoogers, G.,2003 “ Fuel Cell Technology Handbook” (CRC Press) Larminie J., Dicks A., 2003 “Fuel Cell Systems Explained” (John Wiley and Sons)

71
British Petrol World Statistical Reviews 2006 Energy Outlook
DuPont Product Information Sheet Bulletin No: 97-01 (Rev. 1/4/99) “General Information on Nafion Membrane for Electrolysis Siemens Solar Industries, Solar Module 55 (SM55) Product Information Sheet The Annual Energy Outlook 2006, Department of Energy-Energy Information Administration WEB_1 2006 International Energy Agency Website, http://www.iea.org/ WEB_2.2005 Department of Energy and Natural Sources Ministry Website http://www.enerji.gov.tr/ WEB_3.2005 Green Hydrogen Coalition Website http://www.greenhydrogencoalition.org/ WEB_4 2006 10/04/06 Plastics Technology http://www.plasticstechnology.com/articles/200201cu3.html WEB_5 2006 8/01/06 Wikipedia http://en.wikipedia.org/wiki/Solar_cells
WEB_6 2006 U.S Department of Energy, Hydrogen, Fuel Cells Infrastructure Program www.eere.energy.gov/hydrogenandfuelcells/production/thermal_processes.html

72
APPENDIX A
HYDROGEN PRODUCTION RESULTS FROM VARIOUS DAYS
Measured Hydrogen Production and Stack Temperature vs Time (18.12.06)
Time
09:00:00 11:00:00 13:00:00 15:00:00
Hydrogen Production (ml/min)
0
100
200
300
400
500
600
Stack Temperature oC
20
25
30
35
40
45
50
55
Hydrogen Production
Stack Temperature
Figure A1
Measured Hydrogen Production and Stack Temperature vs. Time 09.01.2007
Time
08:00:00 10:00:00 12:00:00 14:00:00 16:00:00
Hydrogen G
eneration (ml/min)
0
100
200
300
400
500
600
Stack Temperature oC
15
20
25
30
35
40
45
50
55
Hydrogen Production
Stack Temperature
Figure A2

73
Measured Hydrogen Production and Stack Temperature vs. Time (01.02.2007)
Time
09:00:00 11:00:00 13:00:00 15:00:00 17:00:00
Hydrogen Production (ml/min)
0
100
200
300
400
500
600
Stack Temperature oC
20
25
30
35
40
45
50
55
Hydrogen Production
Stack Temperature
Figure A3
Measured Hydrogen Production
and Stack Temperature vs. Time (22.02.2007)
Time
08:00:00 10:00:00 12:00:00 14:00:00 16:00:00 18:00:00
Hydrogen Production (ml/min)
0
100
200
300
400
500
600
Stack Temperature oC
20
25
30
35
40
45
50
55
Hydrogen Production
Stack Temperature
Figure A4

74
Measured Hydrogen Production and Stack Temperature vs. Time (02.03.2007)
Time
09:00:00 11:00:00 13:00:00 15:00:00 17:00:00
Hydrogen Production (ml/min)
0
100
200
300
400
500
600
Stack Temperature oC
20
25
30
35
40
45
50
55
Hydrogen Production
Stack Temperature
Figure A5
Measured Hydrogen Production and Stack Temperature vs. Time
27.03.2007
Time
08:00:00 10:00:00 12:00:00 14:00:00 16:00:00 18:00:00
Hydrogen Flow (ml/min)
0
100
200
300
400
500
600
700
800
Stack Temperature oC
20
25
30
35
40
45
50
55
60
Measured Hydrogen Flow
Electrolyzer Temperature
Figure A6

75
Measured Hydrogen Production and Stack Temperature vs. Time (06.04.2007)
Time
08:00:00 12:00:00 16:00:00 20:00:00
Hydrogen Production (ml/min)
0
100
200
300
400
500
600
Stack Temperature oC
20
25
30
35
40
45
50
55
Hydrogen Production
Stack Temperature
Figure A7
Measured Hydrogen
Production and Stack Temperature vs. Time (24.04.2007)
Time
08:00:00 12:00:00 16:00:00 20:00:00
Hydrogen Production (ml/min)
0
100
200
300
400
500
600
700
800
Stack Temperature oC
20
25
30
35
40
45
50
55
60
Hydrogen Production
Stack Temperature
Figure A8
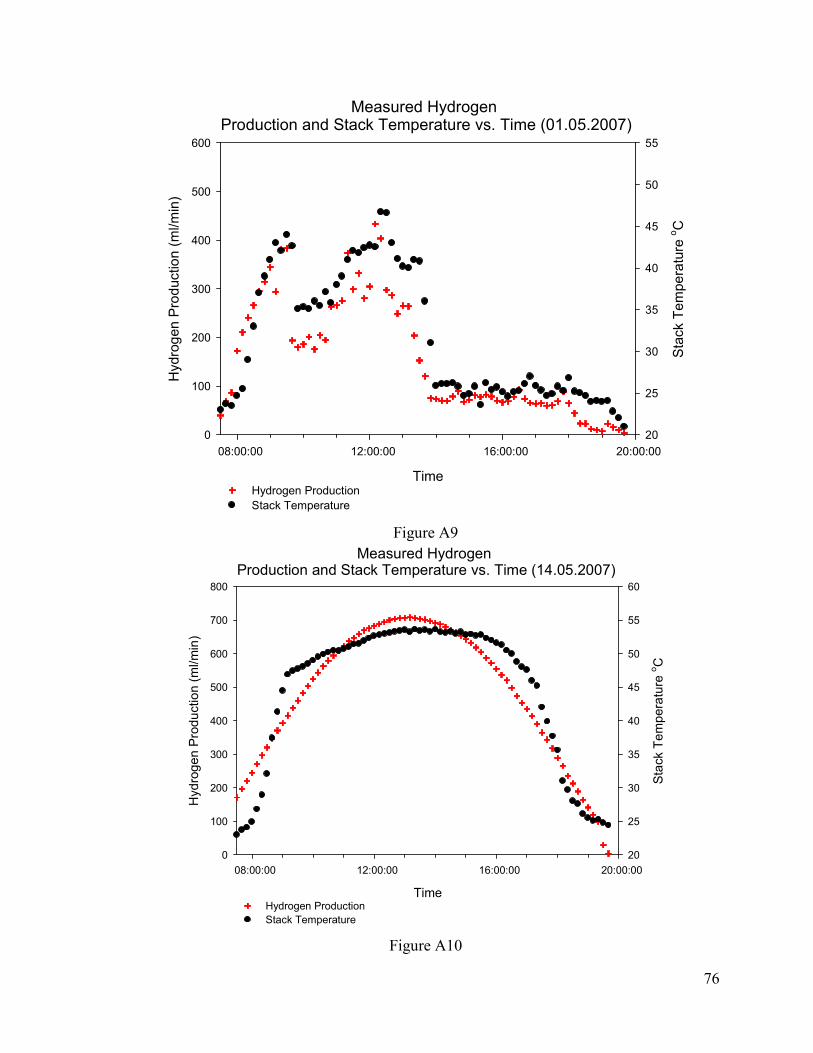
76
Measured Hydrogen Production and Stack Temperature vs. Time (01.05.2007)
Time
08:00:00 12:00:00 16:00:00 20:00:00
Hydrogen Production (ml/min)
0
100
200
300
400
500
600
Stack Temperature oC
20
25
30
35
40
45
50
55
Hydrogen Production
Stack Temperature
Figure A9
Measured Hydrogen Production and Stack Temperature vs. Time (14.05.2007)
Time
08:00:00 12:00:00 16:00:00 20:00:00
Hydrogen Production (ml/min)
0
100
200
300
400
500
600
700
800
Stack Temperature oC
20
25
30
35
40
45
50
55
60
Hydrogen Production
Stack Temperature
Figure A10
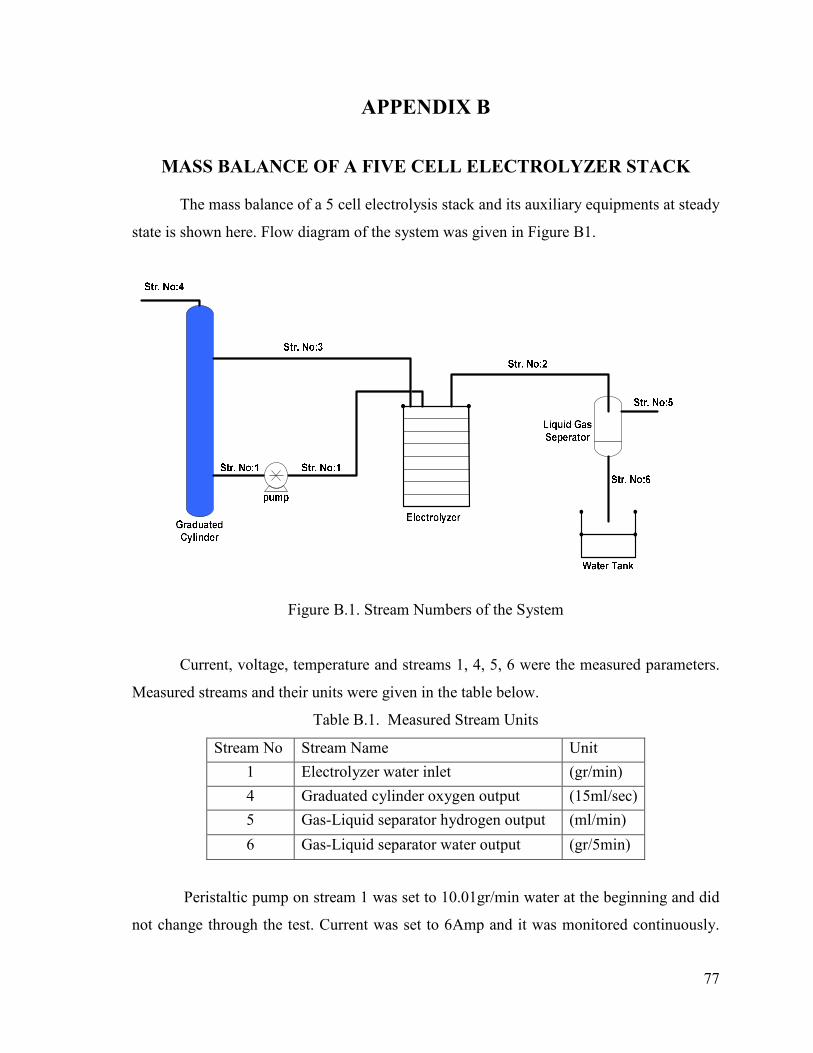
77
APPENDIX B
MASS BALANCE OF A FIVE CELL ELECTROLYZER STACK
The mass balance of a 5 cell electrolysis stack and its auxiliary equipments at steady
state is shown here. Flow diagram of the system was given in Figure B1.
Figure B.1. Stream Numbers of the System
Current, voltage, temperature and streams 1, 4, 5, 6 were the measured parameters.
Measured streams and their units were given in the table below.
Table B.1. Measured Stream Units
Stream No Stream Name Unit
1 Electrolyzer water inlet (gr/min)
4 Graduated cylinder oxygen output (15ml/sec)
5 Gas-Liquid separator hydrogen output (ml/min)
6 Gas-Liquid separator water output (gr/5min)
Peristaltic pump on stream 1 was set to 10.01gr/min water at the beginning and did
not change through the test. Current was set to 6Amp and it was monitored continuously.

78
Hydrogen output (stream 5) was connected to a digital flow meter while oxygen output
(stream 4) was monitored via soap film bubble meter.
In order to provide thermal stability of the setup, system was run for 1 hour before
the measurement starts. After that pre-run graduated cylinder was filled with deionized
water up to 250ml line. Both electrolyzed water and water permeation through membrane
was compensated from the graduated cylinder.
Electrolyzer was operated for 30minutes. Data were taken at the end of 5 minutes
interval to see if there was any fluctuation. At the end of the experiment water in the
graduated cylinder was 222ml.
Measured Parameters of the experimental setup were given in the table below.
Table B.2. Recorded Outputs of the Steady State System
Time Voltage Current Temp Stream 1 Stream 4 Stream 5 Stream 6
C (gr/min) ml/min ml/min gr/min
11:00 9.27 6.00 41.5 10.01 113.9 226 ----
11:05 9.27 6.00 41.4 10.01 113.9 227 0.748
11:10 9.27 6.00 41.5 10.01 113.9 228 0.768
11:15 9.28 6.00 41.6 10.01 113.9 228 0.746
11:20 9.27 6.00 41.4 10.01 113.9 227 0.764
11:25 9.26 6.00 41.5 10.01 115.3 228 0.752
11:30 9.27 6.00 41.5 10.01 113.9 225 0.756
Average 9.27 6.00 41.4 10.01 114.1 227 0.756
The data show that the system was in steady state during the experiment. Stream 1
and 6 were pure water. Stream 2 and 5 were hydrogen output. Stream 3 and 4 were oxygen
outputs. There should be some impurities in these streams such as hydrogen gas in oxygen
and vice versa. Also water vapor could exist in stream 2, 3, 4 and 5 with respect to
temperature of the flow. Solubility of oxygen and hydrogen gases in water are neglected.
According to these assumptions mass of species in streams were tabulated in the
table below. Measured parameters were entered while the unknown parameters represented
with capital letters.

79
Table B.3. Mass Balance of Species on the Overall System
Mass of Species on Streams
H2O H2 O2
gr/min Liquid Gas Liquid Gas Liquid gas SUM(gr/min) measured streams
St. 1 10.01 ----- ------- ------ ------- ----- 10.01 10.01gr/m H2O@298K
St. 2 A B ------- C ------- D A+B+C+D [email protected]
St. 3 E F ------- G ------- H E+F+G+H [email protected]
St. 4 ------- I ------- J ------- K I+J+K 114ml/m gas@298K
St. 5 -------- L ------- M ------- N L+M+N 227ml/m gas@298K
St. 6 0.756 ----- ------- ------ ------- ----- 0.756 0.756gr/m H2O@298K
It was measured that water in the graduated cylinder and water output of the gas
liquid separator were at 298K. Thus it is assumed that stream 1, 4, 5 and 6 were at the same
temperature with their connected equipments. Saturated water vapor pressure is
23.76mmHg at that temperature which resulted 3.13% in stream 4 and 5 as water vapor at 1
ATM. Also, it is reported that N117 membranes can produce both oxygen and hydrogen
with 99.5% purity (except water vapor) without any after purification step.
Electrolyzer operating temperature is 314.6K where the saturated water vapor
pressure is 58.14mmHg. It was assumed that electrolyzer outputs were also at that
temperature. At 1 atm 7.65% of the gas phase of stream 2 and 3 was water vapor. Streams
are given in the following tables.
Stream 6 is pure water;
Table B.4. Stream 6
Species % ml/min at 298K mol/min gr/min
H2O liquid 100 0.758 0.042 0.756
Sum 100 0.758 0.042 0.756
It is assumed that all the hydrogen and oxygen gases on stream 2 were separated from
liquid water in the liquid gas separator. Thus C=M and D=N

80
Stream5;
Table B.5. Stream 5
Species % of gases ml/min at 298K mol/min gr/min
O2 (N) 0.484 1.09 4,49E-05 1,44E-03
H2 (M) 96.4 218.8 8,95E-03 1,79E-02
H2O gas (L) 3.13 7.10 2,91E-04 5,23E-03
Sum 100 227 9,28E-03 2,46E-02
Since there is no water accumulation in the liquid gas separator mass flow of
stream2 is equal to sum of stream 5 and 6.
Stream2;
Table B.6. Stream 2
Species %of gases ml/min at 314.6K mol/min gr/min
O2 (N) 0.46175 1.15 4,49E-05 1,44E-03
H2 (M) 91.88825 230.9 8,95E-03 1,79E-02
H2O gas (A) 7.65 19.2 7,45E-04 1,34E-02
Gas Phase Sum 100 251.4 9,74E-03 3,27E-02
H2O liquid (B) --- 0.74 4,15E-02 7,48E-01
Total sum --- 252.1 5,13E-02 7,81E-01
Stream4;
Table B.7. Stream 4
Species % of gases ml/min at 298K mol/min gr/min
O2 (K) 96.386 110 4,50E-03 1,44E-01
H2 (J) 0.484 0.55 2,30E-05 4,50E-05
H2O (I) 3.13 3.58 1,46E-04 2,63E-03
Sum 100 114.13 4,67E-03 1,47E-01

81
Stream3;
Table B.8. Stream 3
Species stream 3 at 314.6K
ml/min at 314.6K mol/min gr/min
O2 (N) 91.9 116.13 4,50E-03 1,44E-01
H2 (M) 0.46 0.58 2,30E-05 4,52E-01
H2O gas () 7.65 9.66 3,75E-04 6,74E-03
Sum 100 126.4 4,90E-03 1,51E-01
H2O liquid () --- --- --- E
Table B.9. Overall Mass Balance on Species
Mass of Species on Streams
H2O H2 O2
gr/m Liquid Gas Liq. Gas Liq. gas SUM (gr/min) measured streams
St. 1 10.01 ------ ------- ------- ------- ------- 10.01 10.01gr/m H2O@298K
St. 2 0.74 1,34E-02 ------- 1,79E-02 ------- 1,43E-03 7,81E-01 Unmeasured@314K
St. 3 E 6,74E-03 ------- 4,00E-05 ------- 1,44E-01 E+0,1507 Unmeasured@314K
St. 4 ------- 2,63E-03 ------- 4,00E-05 ------- 1,44E-01 1,47E-01 114ml/m gas@298K
St. 5 -------- 5,23E-03 ------- 1,79E-02 ------- 1,43E-03 2,46E-02 227ml/m gas@298K
St. 6 0.756 ------ ------- -------- ------- ------- 0.756 0.756gr/m H2O@298K
Remained unknown E represents the liquid water in stream no:3. This quantity can
be found from the consumed water from graduated cylinder during the experiment.
Twater = 25oC, Density of water at 25oC=0.99707gr/ml
Vwater at t0 = 250ml, Wwater at t0=249.2675gr
Vwater at t30 = 222ml, Wwater at t30=221.3495gr

82
Figure B.2. Input and output streams of the graduated cylinder
Str.No:1 and 4 are the outputs and Str.No:3 is the input.
Table B.10. Calculation of Liquid Water in Stream 4
H2O H2 O2
gr/min liquid Gas liquid gas liquid gas SUM(gr/min)
St. 1 1,00E+01 ------ ------- ------- ------- ------- -1,00E+01
St. 3 E 6,74E-03 ------- 4,50E-05 ------- 1,44E-01 E+0,150753
St. 4 ------- -2,63E-03 ------- -4,50E-05 ------- -1,44E-01 -1,47E-01
Net E-10,01 4,11E-03 0,00E+00 0,00E+00 0,00E+00 0,00E+00 E-10,0059
.min/07529.9E
r.249.2675)g-(221.3495 min30min/10.00589)-(E
gr
gr
=
=×
Now all the unknowns are known to calculate the mass balance of the electrolysis
stack. Inlet stream is No: 1 which is pure water, outlet streams are stream No: 2 and No: 3.

83
Figure B.3. Input and output streams of the electrolyzer
Table B.11. Validation of the overall mass malance of the system
Mass Balance on Electrolyzer
H2O H2 O2 gr/min liquid gas liquid gas liquid gas SUM(gr/min)
St. 1 10.01 0 0 0 0 0 10.01
St. 2 7,48E-01 1,34E-02 --- 1,79E-02 --- 1,44E-03 7,81E-01
St. 3 9,08E+05 6,74E-03 --- 4,50E-05 --- 1,44E-01 9,23E+06
NET 1,87E-01 -2,02E-02 0 -1,79E-02 0 -1,45E-01 3,39E-03
According to that total consumed water was 0,167g/min total H2 production was
0.018g/min and total O2 production was 0.145g/min. Conservation of mass was validated
within a 2% error for the system.
Net mass flow must be zero to say that there is no accumulation or leakage.
Though, it was calculated that there was a little amount of positive net flow on electrolyzer.
This might be due to experimental measurement errors such as chronometer timing on
oxygen output or reading of volume from the graduated cylinder.

84
Figure B.4. Overall Mass Balance of the System