![IICEC Energy Market Newsletter 2[2] - Sabancı Üniversitesi€¦ · IICEC Energy Market Newsletter May 28, 2019 No:2 GLOBAL ENERGY INVESTMENT STABILIZED AFTER 3 YEARS OF DECLINE](https://static.fdocuments.us/doc/165x107/5f035b097e708231d408ce7e/iicec-energy-market-newsletter-22-sabanc-oeniversitesi-iicec-energy-market.jpg)
HYDROGEN FUEL CELL VEHICLES - IICEC · Table 1: Fuel Economy of ICE, Diesel, HFCV, BEV, Hybrid...
40
Sabancı University Mehmet Doğan Üçok IICEC ENERGY AND CLIMATE RESEARCH PAPER HYDROGEN FUEL CELL VEHICLES August 2019
Transcript of HYDROGEN FUEL CELL VEHICLES - IICEC · Table 1: Fuel Economy of ICE, Diesel, HFCV, BEV, Hybrid...

Sabancı University
Mehmet Doğan Üçok
IICEC ENERGY AND CLIMATE RESEARCH PAPER
HYDROGEN FUEL CELL VEHICLES
August 2019
2 iicec.sabanciuniv.edu/
4
7
5
8
8
9
10
10
I. Executive Summary
II. Introduction
III. Are Hydrogen Fuel Cell Vehicles Necessary?
i. Virtues of the HFCV
ii. HFCVs’ Progress
iii. What is an HFCV?
iv. Hydrogen and the Polymer Electrolyte Membrane Fuel Cell (PEMFC)
v. BEVs and HFCVs : A Comparison of Features
a. Cost
b. Range and Refueling Time
c. Specific Energy and Energy Density
d. Dependency on Resources and Environmental Concerns
e. Safety
vi. Global Stock
vii. Hydrogen Production Pathways
i. Hydrogen from Non-Renewable and Renewable Resources
a. Hydrogen from Fossil Fuels
I. Steam Methane Reforming (SMR)
II. Coal Gasification
b. Hydrogen from Electricity
I. Electrolysis
II. Photolysis (Direct Solar Water Splitting Process)
ii. Centralized vs. Distributed Hydrogen Production
viii. Emissions
I. Well-To-Wheel Emission Pathways
II. Heavy-Duty Applications
ix. Landscape of Government Programs
I. National HFCV Targets and National Hydrogen Refueling Station Targets
II. Hydrogen Infrastructure Development
III. California’s Integrated HFCV Hydrogen Vehicle Program
IV. Conclusions
V. Appendix A: Status Report: Government Support for BEVs and PHEVs
VI. List of Abbreviations
VII. References
10
13
15
16
16
17
18
18
18
18
19
19
19
20
20
21
21
23
24
24
26
27
28
29
36
37
Table of Contents

Table 1: Fuel Economy of ICE, Diesel, HFCV, BEV, Hybrid Gasoline
Table 2: HFCV Ranges (Current Models)
Table 3: Chemistry of Cells Produced by Major Battery Cell Manufacturers for EV Producer Companies
Table 4: Integrated Transportation Fuel Cell Power Systems Operating with 700 bar Fuel Tanks
Table 5: National HFCV Targets Announced by Country
Table 6: National HRS Targets Announced by Countries
Table 7: Incentives to Promote HFCV and HRS Deployment
Table 8: Announced Country Targets 2020-2030 (BEV and PHEV)
Table 9: Government Incentives for Electric Vehicles (BEVs and PHEVs)
Figures & Tables
Figure 1: CO2 Emissions from Transport (1990-2015)
Figure 2: Vehicle Sales of Different Types of Light Duty Vehicles to Achieve Climate Targets
Figure 3: Production Cost for PEMFCs for HFEVs as a Function of Annual Production
Figure 4: Operating Principles of HFCVs
Figure 5: Schematics of PEMFC
Figure 6: Scenario for Adoption of Light Duty Hydrogen Fuel Cell Vehicles in the US
Figure 7: Fuel-cell LDVs Learning Curve: Green dots are taken from the literature and blue dots are constructed by exponential fitting, with different coefficients before and after 2020
Figure 8: Cumulative Supply Chain cost (Current Estimate)
Figure 9: Range of BEVs (2019) per full charge
Figure 10: Range of ICE, BEV and FCEV (HFCV)
Figure 11: Stock of Hydrogen Fuel Cell Vehicles (HFCVs) in 2018
Figure 12: Passenger Electric Car Stock in Major Regions and Countries
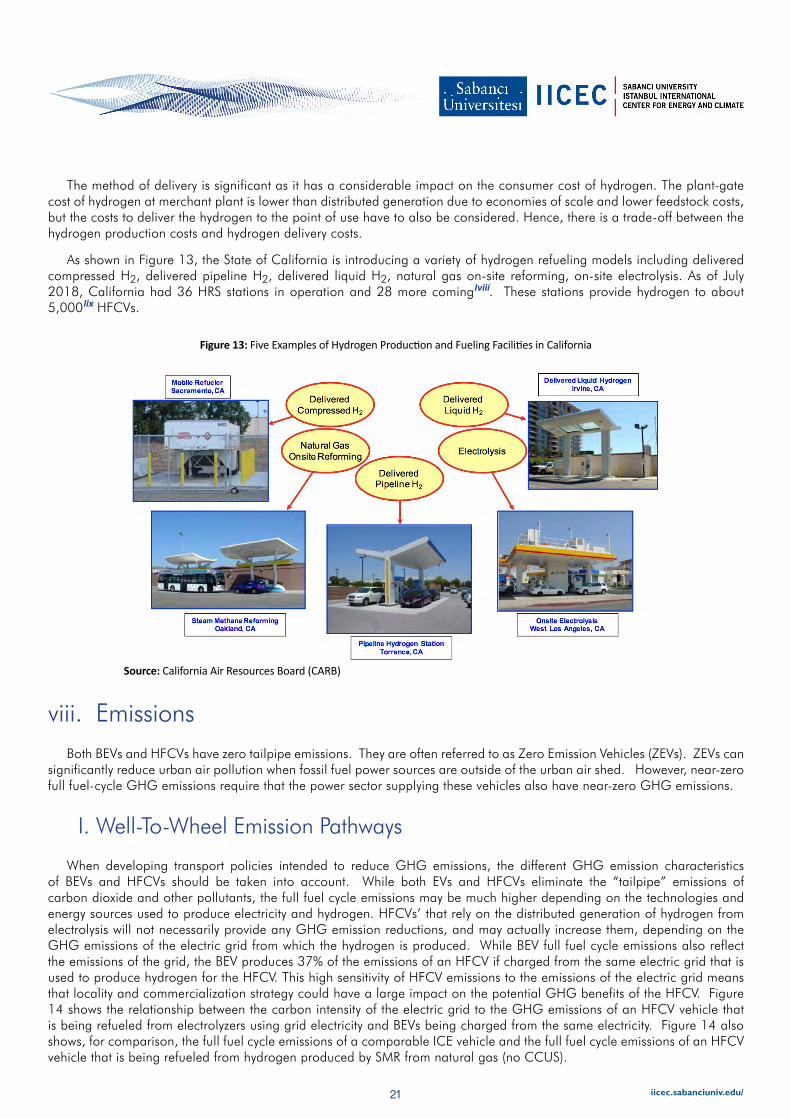
Figure 13: Five Examples of Hydrogen Production and Fueling Facilities in California
Figure 14: HFCV & BEV Full Fuel Cycle GHG Emissions vs. the GHG Emissions of the Electric Grid (Assuming Distributed Generation of Hydrogen from Electricity for HFCVs)
Figure 15: Selected Government Spending on Hydrogen and Fuel-cell Programs ($ million)
Figure 16: Hydrogen Station Point Density Heat Map for 200 HRS in 2025 and 1000 HRS in 2030
Figure 17: Hydrogen Station Roll-Our Scenario, California
Figure 18: Passenger Electric Car Stock in Major Regions and Countries
Figure 19: Annual BEV and PHEV Sales in China (Commercial Vehicles and Passenger Cars)
Figure 20: Annual BEV and PHEV Sales in USA (Commercial Vehicles and Passenger Cars)
Figure 21: Annual BEV and PHEV Sales in the EU (Commercial Vehicles and Passenger Cars)
Figure 22: Number of Highway Charging Stations and Distribution Targets in Selected Regions
Figure 23: Electric Car Stock and Publicly Accessible Charging Outlets by Type and Country
Figures
Tables

4 iicec.sabanciuniv.edu/
I. Executive Summary After many years of research, government programs, and commercial development, two main candidates have emerged
to replace the internal combustion engine (ICE) vehicle in order to reduce greenhouse gas (GHG) emissions: Battery Electric Vehicles (BEVs) and Hydrogen Fuel Cell Vehicles (HFCVs)i. BEVs and HFCVs have zero tail-pipe emissions and could enable deep cuts in transport sector emissions by using electricity or hydrogen that is derived from low emission sources.
In the context of a global GHG emission reduction strategy, BEVs, by themselves, could provide sufficient emission benefits to achieve global climate targets if the widespread consumer acceptance of BEVs could be assumed. However, BEVs do not provide the range and refueling experience of an ICE, bringing into question whether they can achieve widespread acceptance in the private light-duty vehicle market. In addition, battery-electric technology is less applicable to medium and heavy-duty trucks. Consequently, another low-emission vehicle technology may be needed that provides the same consumer experience as the ICE vehicle and has broader applicability to heavier-duty vehicles. Current hydrogen fuel cell automobiles pass the “just like what I am used to” test while the current BEV does not. Also, hydrogen fuel cell technology is broadly applicable to heavy-duty vehicles. Nonetheless, BEV commercial uptake far exceeds HFCV sales because HFCVs are relative latecomers, they are currently expensive and, most of all, they rely on refueling infrastructure that is not available except in limited demonstration markets.
Technological and commercial progress will change the picture for HFCVs and BEVs as each type gains a larger share of the motor vehicle market. Government programs could bring about widespread hydrogen refueling infrastructure and HFCV costs will decline by a significant degree with lower fuel cell stack costs. Nonetheless, it will be 2025 or 2030 before hydrogen refueling infrastructure is widely available. Until then, BEVs and HFCVs will not be static products as they will undergo technological progress. While HFCVs will improve, so will BEVs, with increased vehicle range, less costly batteries and, perhaps, shorter recharging times. As a result, the relative consumer characteristics of BEVs and HFCVs may be significantly different than what they are today. We do not know what the competitive comparison of HFCVs vs. BEVs would be in the future although it does seem unlikely that BEVs could ever be recharged as quickly as liquid or gaseous powered vehicles can be refueled.
The current momentum to commercialize HFCVs reflects considerable technology development to date. HFCVs have clocked more than 20 million kilometers under real-world conditions, using Polymer Electrolyte Membrane Fuel Cell (PEMFC). The fuel cell costs have been cut by 80% since 2002, while achieving a four-fold increase in durability to over 120.000 miles. These developments paved the way for the automotive companies (OEMs) to sell and lease HFCVs today. The global HFCV car stock reached 11,200 units in 2018.
Road freight accounts for 75% of all freight transport CO2 emissions. Due to more favorable energy density and specific power characteristics of hydrogen fuel cell systems compared to battery-electric systems, fuel cells are better suited for heavy-duty vehicles. Consequently, HFCVs are under development to serve in the heavy-duty vehicle market. Besides medium and heavy duty trucks, hydrogen technology can be applied to trains, ferry boats, marine vessels, and various niche markets.
Government support has been a necessary factor to achieve the uptake of both BEV and HFCV technologies. These efforts include R&D, purchase incentives and development of refueling or recharging infrastructure. While HFCV commercialization that started in 2014ii is well behind that for BEVs, it is now following the same path aided by significant government support in several motor vehicle markets. OEM HFCVs are readily available, albeit at high cost. Providing sufficient hydrogen refueling infrastructure is the main challenge for government demonstration programs.
The raison d’être for developing HFCVs as a supplement or replacement for BEVs has been its potential consumer appeal compared to the BEV. Assuming widespread hydrogen refueling availability, an HFCV would provide consumers a more similar to ICE operating experience than a BEV since HFCV range and refueling time are much closer to what consumers are used to. Based on currently available models, HFCVs typically carry enough fuel so they can travel 600 km or more before refueling. BEV vehicle range has been noted to be a significant drawback, but this is a rapidly changing landscape. As of the publication of this paper, the current Tesla Model S is capable of traveling about 525 km “real-world” range (or 580 km U.S. EPA test range), eliminating the vehicle range issue for this vehicle, however not the general “range anxiety” concerns for BEVs altogether as refueling availability and refueling time still compromise the applicability of BEV use for long-distance travel. BEVs have two market segments between longer range models of about 400 km to 525 km real-world range or less expensive models with driving ranges aimed at serving local driving between 90 km - 400 km (Figure 9). Technological progress will likely increase the energy density of batteries, increasing the travel range of all BEVsiii while gaseous hydrogen

5 iicec.sabanciuniv.edu/
II. IntroductionTransportation services have been, throughout history, an essential ingredient for economic progress and social welfare.
Road transport has, since ancient times, been the foundation of how people transport goods and move around. This has not changed in modern times. Economic development is always associated with a dramatic growth of light-duty vehicles as well as medium and heavy trucks to accommodate a growing economy and increasingly mobile society. At the same time, these services must be provided with dramatically lower greenhouse gas (GHG) emissions. Transport sector’s emissions increased by 2.5% annually between 2010 and 2015, and the share of global energy-related CO2 emissions from this sector is 23%iv. To get on track with the 2 Degree Scenario (2DS) targets, this trend must be reversed.
Multiple studies have shown that the road-transport sector would have to achieve deep cuts in GHG emissions in order to make significant cuts in overall GHG emissions because a large share of energy-sector GHG emissions come from road transport. Road transport is almost entirely dependent on vehicles powered with fossil fuels. The increase in the transport sectors’ emissions was led by increasing emissions from the road sector, that accounted for three-quarters of transport emissions. Road sector’s CO2 emissions increased 68%, from 3.3 Gt in 1990 to almost 6 Gt in 2015 (Figure 1).
FCV vehicle range could be increased by higher-pressure fuel tanks, larger tanks or more efficient fuel cell stacks. As noted above, the future comparative consumer appear of BEVs and HFCVs is uncertain, especially considering the driving range.
If vehicle range recedes as an issue for BEVs, the other significant BEV concern, recharging time, may remain despite technological progress. HFCV refueling time is 3-5 minutes similar to ICE vehicles, while it takes half an hour or more to achieve an 80% charge with a high-voltage supercharger. While home and workplace recharging typically take considerably longer, these charging opportunities reduce the frequency of BEV recharging at service stations, often by a significant degree, compared to the need to always refuel an HFCV or ICE at a retail outlet. Nonetheless, for long-distance travel, providing adequate BEV charging infrastructure could be problematic considering the amount of time each BEV would take to be recharged and be occupying space at the service outlet.
Widespread HFCV uptake will take continued government support. Compared to the current uptake of BEVs, HFCV uptake will require a more synchronized policy intervention as adequate retail refueling infrastructure will be required before motorists can be expected to purchase HFCVs. Several examples of synchronized policies are provided in Section III.ix. (Landscape of Government Programs).
When developing transport policies intended to reduce GHG emissions, the different GHG emission characteristics of BEVs and HFCVs should be taken into account. While both BEVs and HFCVs eliminate the “tailpipe” emissions of carbon dioxide and other pollutants, the full fuel cycle emissions may be much higher depending on the technologies and energy sources used to produce electricity and hydrogen. HFCV’s that rely on the distributed generation of hydrogen from electrolysis will not necessarily provide any GHG emission reductions, and may actually increase them, depending on the GHG emissions of the electric grid from which the hydrogen is produced. While BEV full fuel cycle emissions also reflect the emissions of the grid, the BEV produces 37% of the emissions of an HFCV if charged from the same electric grid that is used to produce hydrogen for the HFCV. This high sensitivity of HFCV emissions to the emissions of the electric grid means that locality and commercialization strategy could have a large impact on the potential GHG benefits of the HFCV. HFCV use will likely begin, in many markets, by relying on the distributed generation of hydrogen from electricity at service stations. Doing this in Norway would produce near-zero HFCV full fuel-cycle GHG emissions. In China, an HFCV fueled at a typical service station using electrolysis would have full fuel-cycle GHG emissions that are almost twice as high as an ICE vehicle. However, a BEV, recharged at the same service station, would provide a 37% emission reduction. Consequently, unless a country has a power sector with low GHG emissions, it would be better to produce hydrogen from merchant plants that use electricity or synthetic gas that are produced from renewable power, nuclear power or fossil fuels with carbon capture, utilization, and storage. A more complete discussion of HFCV and BEV fuel full-cycle emission characteristics, including hydrogen generation using natural gas and coal, is provided in Section III.viii. (Emissions).

6 iicec.sabanciuniv.edu/
Moreover, one of the consequences of rapid economic growth in developing countries is the significant increase in the number of light-duty vehicles, which is expected to continue. According to the International Energy Agency (IEA), between 2016 and 2040, the global car fleet will doublevi. Emission cuts will require that, in the near term, motor vehicle fuel economy continues to improve and, in the longer term, internal combustion engines (ICEs) are replaced with low-emission electric-powered vehicles. The motors in these vehicles may be supplied with electricity from batteries (BEVs) or from fuel cells with on-board hydrogen storage (HFCVs).
IEA ETP scenarios indicate that HFCVs would have an important role in achieving such deep reductions, along with BEVs. 2DS targets correspond to 80% GHG emissions reductions by 2050 where HFCV and BEVs account for ~75% of on-road passenger cars by 2050vii. In line with this, for example, the European Commission has identified HFCVs and BEVs among the needed technologies for the EU to reach a minimum 60% GHG emissions reductions from transport by 2050viii.
The estimates in Figure 2 below show that moving from a 4 Degree Scenario (4DS) to a 2 Degree Scenario (2DS-Improve) would require that BEVs continue to penetrate the light-duty vehicle (LDV) market at a rapid pace. The estimates also project, by 2030, that HFCVs will increase the clean vehicle share1. The 2DS-Improve scenario shows fossil fuel vehicles being reduced to only 25% of the LDV fleet instead of 85% in the 4DS.
Figure 1: CO2 Emissions from Transport (1990-2015)
Source: IEA ETPix
Source: IEA, 2017v
Figure 2: Vehicle Sales of Different Types of Light Duty Vehicles to Achieve Climate Targets
1 ETP scenarios also assume that the electricity and hydrogen used to power these vehicles is derived from low-emission sources.

7 iicec.sabanciuniv.edu/
III. Are Hydrogen Fuel Cell Vehicles Necessary? This study seeks to explore the current relevancy of HFCVs, bearing in the mind the significant head start that BEVs have
achieved in recent years to be the world’s sustainable vehicle for the future. Since both BEVs and HFCVs may offer similar levels of emission reduction, what attributes do HFCVs possess that will cause them to commercially competitive with BEVs despite the need to introduce yet another alternative fuel, along with another widely available fuel distribution infrastructure?
Given the current commercialization of BEVs, it might appear that the BEVs has already “won” since the commercial success of BEVs is far ahead of the HFCV. This can be explained by two factors: 1) Battery technology has rapidly advanced in other sectors, for example, for mobile devices, and fuel cell technology has taken much longer to develop for motor vehicle application; and 2) BEVs take advantage of existing electricity generation and distribution infrastructure. While widespread use of BEVs will also require a new extensive retail recharging infrastructure “with all potential charging options having their own specific challenges, not least with respect to practicability and customer acceptance, but also economic viability”x; BEV uptake has not required a completely new fuel production, transportation or distribution system before HFCV sales can commence outside of demonstration programs. Initial sales of BEVs did not depend on a widespread commercial recharging infrastructure due to the use of home chargers and chargers at other locations.
It is unclear how much commercial recharging will be required to support the growth of BEVs. Much will depend on whether consumers avoid using BEVs for long distance travel and instead take those trips with ICE-powered vehicles. Since long-distance travel constitutes a smaller share (25%) of total LDV travel, there is a lot of room for more BEV uptake to serve urban travelxi.
A new hydrogen-based refueling system is required to commercialize even initial sales of HFCVs. The market development for the roll-out of HFCVs is expected to have a gradual expansion; expanding from “densely populated areas, major cities, and highway, into less urbanized areas and eventually rural areas. The critical phase consists of bridging the gap between isolated demonstration clusters and a pre-commercial stage.”xii Absent government support, it is unlikely that independent industries (including fuel production, transportation and distribution, service stations and vehicle manufacturers) would make coordinated investments that would be necessary for the commercial introduction of HFCVs to be successful. Investments by each industry would only return value if corresponding investments were made by all of the other industries. Coordination would be necessary. Therefore, it is significant that the United States, Japan2, China, South Korea, Germany, France, and other EU states have established programs to promote HFCVs. These programs typically include the introduction of Hydrogen Refueling Stations (HRS), other HFCV infrastructure and incentives to support HFCV sales. The most signification programs include Hydrogen Mobility Europe, H2USA, Germany’s H2 Mobility, California’s Fuel Cell Partnership, Japan’s H2 Mobility program, H2 Mobility UK, and H2 Korea.
The important role of OEMs cannot be overemphasized. The OEMs are introducing HFCV models despite the tiny consumer market that exists today. Daimler AG, Ford Motor Company, General Motors Corporation/Opel, Honda Motor, Hyundai Motor Company, Kia Motors Corporation, alliance of Renault SA and Nissan Motor and Toyota Motor have agreed to commercialize HFCVs3 and several HFCV choices are currently available.
There is also significant commercial cooperation to provide HFCV refueling. The Hydrogen Council includes 18 leading multinationals including Air Liquide, Alstom, Anglo American, Audi, BMW GROUP, Daimler, ENGIE, General Motors, Honda, Hyundai Motor, Iwatani, Kawasaki, Plastic Omnium, Royal Dutch Shell, Statoil, The Linde Group, Total, and Toyota. Also participating are Ballard, Faber Industries, Faurecia, First Element Fuel (True Zero), Gore, Hydrogenics, Mitsubishi Corporation, Mitsui & Co, Plug Power, and Toyota Tsusho. The main objective of the Hydrogen Council is accelerating the commercialization of hydrogen and fuel cell-powered transportationxiii. The Council pledged to invest €10.7 billion in the next five yearsxiv and to work with appropriate public agencies towards achieving this goal; seeing “the potential for hydrogen to power about 10 to 15 million cars and 500,000 trucks by 2030, with many uses in other sectors as well, such as industry processes and feedstocks, building heating and power, power generation and storage.”xv
2 In March 2018, seventeen Japanese corporations (including Development Bank of Japan (DBJ), Toyota Motors, Nissan Motor, Honda Motor, JXTG Nippon Oil & Energy Corporation, Idemitsu Kosan, Iwatani Corporation, Tokyo Gas, Toho Gas, Nemoto Tsusho, Air Liquide Japan, Toyota Tsusho, NEC Capital, JA Mitsui Leasing, Seiryu Power Energy Co., Mirai Creation Fund, Sumimoto Mitsui Finance) announced the formation of Japan H2 Mobility (JHyM) alliance. These companies representing auto manufacturers, fueling infrastructure developers, and the investment community aim to accelerate Japan’s hydrogen initiatives, via three main pillars; strategic hydrogen station deployment, hydrogen station cost reductions, and improved
convenience for HFCV customers. Japan H2 Mobility. https://www.jhym.co.jp/en/ and https://www.jhym.co.jp/en/#about 3 Signing OEMs stated that: “Based on current knowledge and subject to a variety of prerequisites and conditions, the signing OEMs strongly anticipate that from 2015 onwards a quite significant number of fuel cell vehicles could be commercialized”.
8 iicec.sabanciuniv.edu/
HFCVs are much closer to the current ICE vehicles from the consumer perspective. HFCV range is typically longer than for many BEVs and refueling time of 3-5 minutes is much more similar to refueling an ICE vehicle. These characteristics make the HFCV a more natural consumer choice to replace the general-purpose ICE vehicle that is also suitable for long-distance travel (presuming, of course, that there would be widespread availability of hydrogen refueling outlets). Refueling time is just a little longer than refueling an ICE vehicle and takes much less time than required to recharge a BEV. If a centrally produced system is achieved, with merchant plant hydrogen production, transport, and distribution, retail hydrogen outlets would be much like gasoline/diesel fuel service stations; having underground hydrogen storage and refueling pumps much like those in any service station. Early development of hydrogen refueling system would more likely involve distributed hydrogen production at the retail service outlet. Service stations would use electrolyzers or natural gas reformers to produce hydrogen and the hydrogen storage tanks would be smaller. The attractive characteristics of a BEV vehicle are retained in the HFCV: High initial torque from the electric motors, brisk acceleration, and smooth operation.
Hydrogen fuel and HFCVs are increasingly becoming a collective international endeavor. The global HFCV car stock reached 11,200 units in 2018xvi. The United States accounts for about half of the global HFCVs in circulation (mostly in California), followed by Japan with about a quarter. Japan is followed by Korea, Germany, and France. There are four commercially-available HFCVs for sale or lease in the United States: the Honda Clarity (366 miles EPA rated range), the Toyota Mirai (312 miles range), the Hyundai Tucson (265 miles range) and the Hyundai NEXO (354-mile range or 380 miles for the NEXO Blue).
Hyundai, Toyota, Honda, and other OEMs are continuing to improve HFCV technology. Other OEMs, such as GMC, Mercedes, Nissan, Ford, Lexus, and BMWxvii, are also working on manufacturing their own HFCVsxviii . Honda and General Motors recently established a joint venture to co-develop and mass-produce a next-generation hydrogen fuel cell system.xix As said earlier, technological progress for both HFCVs and BEVs will continue as OEMs complete for BEV market share and as they anticipate a new market for HFCVs.
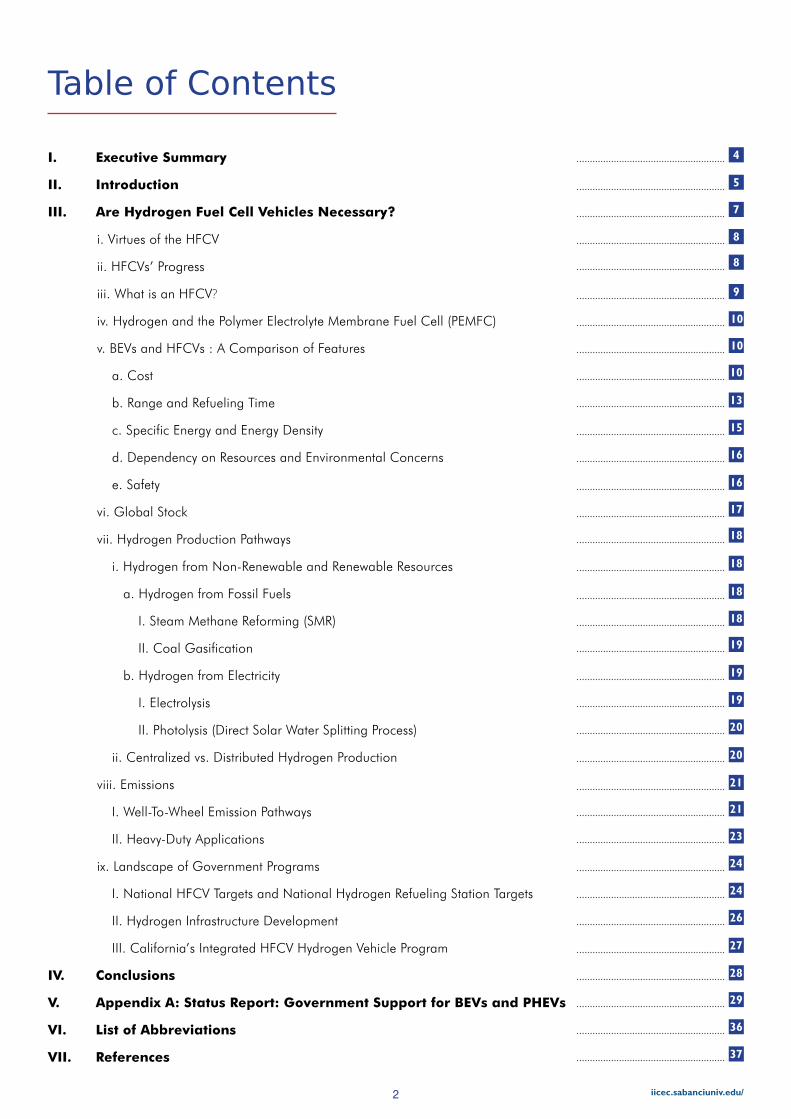
HFCVs have clocked more than 20 million km under real-world conditionsxx. As commercially available products, they satisfy all safety certifications and regulations. The past problems of hydrogen storagexxi, fuel cell operation time and low durability have largely been overcome. Fuel cell stack costs have also been reduced but remain relatively high. Consequently, current HFCVs are relatively expensive compared to similar ICE vehicles. Once fuel cell stacks begin to be produced in sizable numbers, learning by doing will further reduce costxxii. Figure 3 shows U.S. Department of Energy (USDOE) estimates showing that the cost of fuel cells would be cut by more than 50% when fuel cell stacks production surpasses 25,000. The dark green line represents DOE’s 2007 estimates, while the light green line represents 2014 estimates. According to USDOE, fuel cell systems have a high-cost reduction potentialxxiii.
i. Virtues of the HFCV
ii. HFCVs’ Progress
Figure 3: Production Cost for PEMFCs for HFCVs as a Function of Annual Production
Source: USDOE
9 iicec.sabanciuniv.edu/
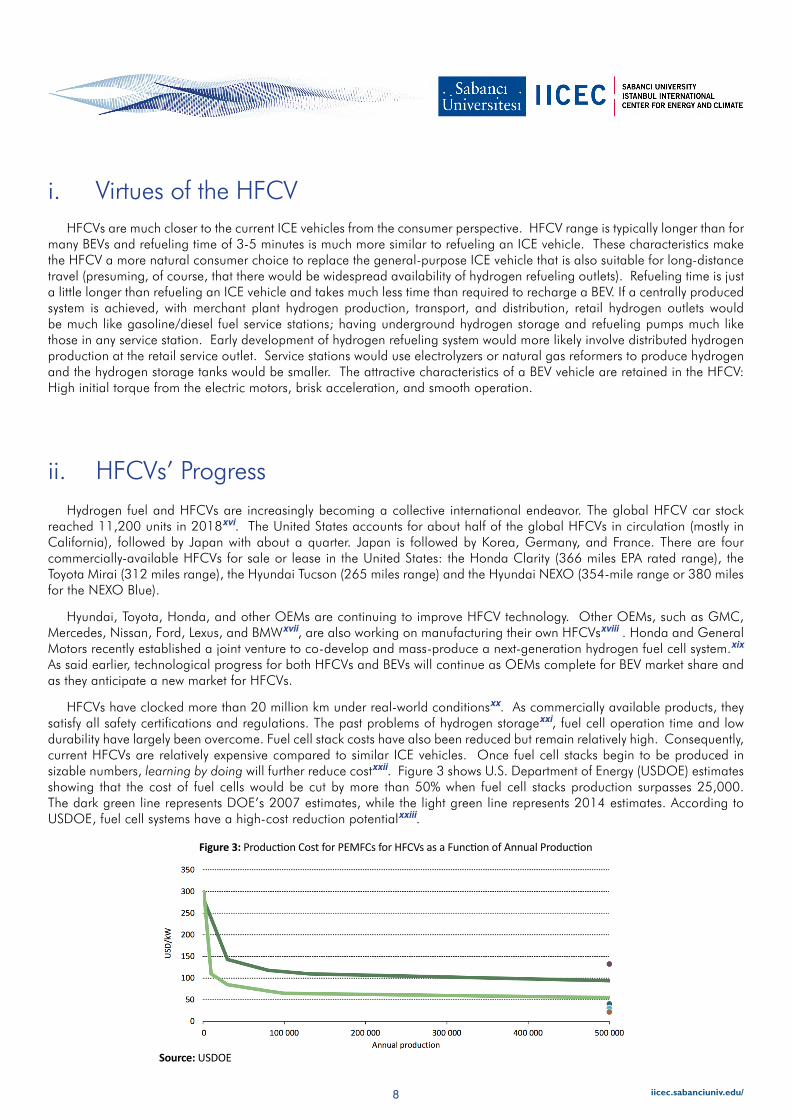
HFCVs are electric vehicles that use an electrochemical process to convert hydrogen to electricity. HFCVs store hydrogen (compressed at 700 bar) in the vehicle instead of storing electricity in batteries. Today’s commercially available HFCVs from Honda, Toyota and Hyundai use the Polymer Electrolyte Membrane Fuel Cell (PEMFC) technology. It is the most common type of fuel cell in transportation applications4. As the HFCV’s fuel is H2, the only emission from the electrochemical process via the fuel cell is water (H2O) making them “zero-tailpipe” emission vehicles. Batteries are used for auxiliary functions to give a power boost to the motors and to take advantage of fuel efficiency features like regenerative braking. As with BEVs, HFCVs produce no local or global pollutants, but the electricity or hydrogen fuel consumed by them may be polluting if produced from non-renewable resources.5
The main components of an HFCV can be seen in Figure 4 below:
iii. What is an HFCV ?
Figure 4: Operating Principles of HFCVs
Source: Japanese Government Official Websitexxiv
4 The solid polymer membrane, actually a proton-exchange membrane, employed in PEMFC has dual functions in PEMFC. First, it is employed as
the separator to divide the fuel cell into two parts. In one side (anode), hydrogen as the fuel is introduced and in another side (cathode) the oxygen as
the oxidant. Second, the membrane is utilized as the electrolyte. Gases (oxygen and hydrogen) cannot go through this membrane, but the polymer
membrane can transfer proton from anode to cathode since it is proton conducting.5 Well-to-Wheel emissions will be provided in the “Emissions” section of this study.
10 iicec.sabanciuniv.edu/
6 Prices after $7,500 federal tax credit for electric vehicles.
Applications of hydrogen and fuel cells are broad, ranging from “powering buildings, cars, trucks, to portable electronic devices and backup power systems. Because fuel cells can be grid-independent, they’re also an attractive option for critical load functions such as data centers, telecommunications towers, hospitals, emergency response systems, and even military applications for national defense.”xxv It was in 1838/1839 when Christian Friedrich Schönbein and Sir William Robert Grove invented the first fuel cell. After this invention, it took more than a century for serious interest in the fuel cell as a practical generator to beganxxvi. It was 1962 when the U.S. Space Program chose fuel cell over riskier nuclear power and more expensive solar technology, to furnish power for the Apollo and Gemini space missionsxxvii.
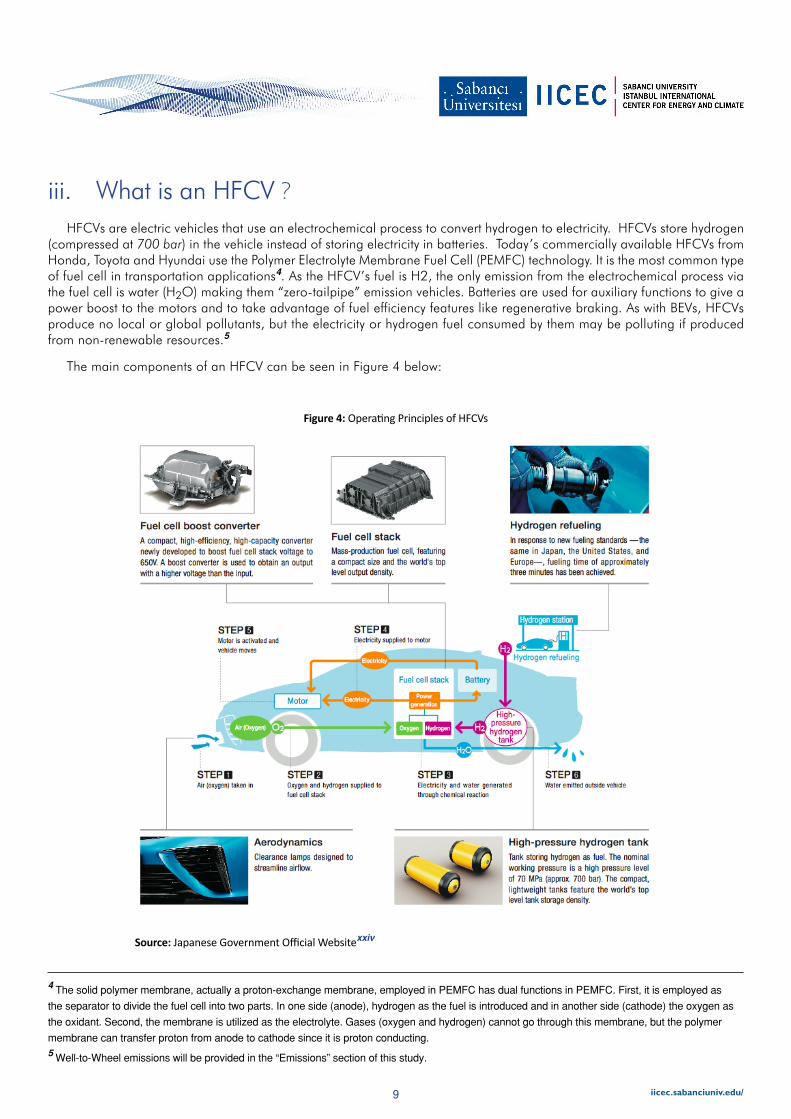
The Polymer Electrolyte Membrane Fuel Cell (PEMFC) is the electrochemical device that converts chemical energy (stored in hydrogen) into electricity to power an electric engine with water and heat being the only by-productxxviii, and are used in transportation applications, power generation, and portable devices. In a PEMFC, there are two main reactions: Anode and Cathode. At the anode, hydrogen oxidation reaction occurs, while at the cathode, oxygen reduction reaction takes place (Figure 5 below). The membrane electrode assembly is the core component of a fuel cell that helps produce the electrochemical reactions needed to separate electrons and is composed of a Polymer Electrode Membrane (PEM). As a result of these reactions, electricity is produced directly without combustion. Water and heat are only byproducts; no pollution from the tailpipe. The PEMFC is the most preferred fuel cell, due to its high power density and are especially suitable for transportation applications because of their cold start ability.
Vehicle Price: The current prices of HFCVs are higher than the prices of BEVs which, in turn, are higher compared to ICE vehicles:
lIn the U.S., a Toyota Mirai is available for purchase at $57.000, the Honda Clarity at $60.000xxix, and the Hyundai Nexo Tucson at $58.300.xxx
lStarting cost for popular electric cars6 ; Nissan Leaf $22.490, Chevrolet Bolt $29.995, Tesla Model S $67.000, Tesla Model X $72.000.
iv. Hydrogen and the Polymer Electrolyte Membrane Fuel Cell (PEMFC)
v. BEVs and HFCVs: A Comparison of Features a. Cost
Figure 5: Schematics of PEMFC
Source: DOE EERE

11 iicec.sabanciuniv.edu/
As each type of vehicle employs new technologies, future cost reduction can be expected from further research and “technology learning” or “learning-by-doing.” The literature on technology learning has observed that a new technology, once it goes into commercial production, will have a constant cost reduction for each doubling of production volume. Figure 6 below shows the cost of HFCV versus cumulative number sold, where the x-axis is time, and year 1 refers to the first year of HFCV introduction.
In Figure 6 above, it can be seen that the cost of HFCVs decreases over time due to learning-by-doing as the number of HFCVs increase and technology improves. The cumulative number of fuel cell vehicles sold is shown in the right-hand y-axis. The cost of fuel cell and gasoline cars are given in $ per vehicle in the left-hand y-axis.
IEA Fuel Cell LDVs learning curvexxxii (Figure 7 below) and exponential fitting, depends on a market considering a cumulative production of 150,000 and 1,350,000 FCEVs in 2020 and 2030 respectively, accounting for a small to large share of the long-range captive LDV market; however always a small share of the total LDV market. The method used to estimate the cost of the vehicles is based on the extra cost of HFCVs in 2020 and 2030 compared to ICE vehicles in 2015xxxiii, where the decreasing exponential growth curve is fitted (based on the literature reviewxxxiv) to estimate the extra cost each year from 2015 to 2030.
Figure 7: Fuel-cell LDVs Learning Curve: Green dots are taken from the literature and blue dots are constructed by exponential fitting, with different coefficients before and after 2020.
Figure 6: Scenario for Adoption of Light Duty Hydrogen Fuel Cell Vehicles in the US
Source: UC Davis Analysisxxxi
Source: IEA, 2016.
12 iicec.sabanciuniv.edu/
7 1 kg of hydrogen has roughly the same energy content as 1 gallon of gasoline (EPA). Hydrogen price assumed $14/kg.8 Based on EPA’s formula, in which 33.7 kilowatt-hours (121 megajoules) of electricity is equivalent to one (US) gallon of gasoline.
As the number of cumulative installed capacity increases, with negative correlation, the extra cost of HFCV compared to ICE shows a decreasing exponential growth. Figure 7 above presents this relationship. This relationship is approximate and would only apply to the components in an HFCV (or BEV) that are new technologies, for example, the fuel cell stack in the HFCV. Estimating the expected vehicle cost reduction from technology learning requires some detailed considerations for each vehicle under consideration.
Detailed consideration is provided in Argonne National Laboratory’s recent analysis. The analysis of how technological progress affects the technical and economic feasibility of fuel cell vehicles shows that with expected cost reduction, by 2030, HFCVs will be comparable to present-day conventional vehicles. If other technologies achieve a high level of progress, the economic feasibility of HFCVs could accelerate making this technology an affordable and economically feasible choice within the next 15 yearsxxxv. Nonetheless, consideration has to be given to the year that scaled-up production would begin that would be dependent on the availability of refueling infrastructure.
Operating Cost: Non-fuel operating costs of BEVs and HFCVs may be lower than ICEs due to fewer moving parts and less vibration. However, the importance of these factors still needs to be quantified after there is more on-road experience for each type of vehicle.
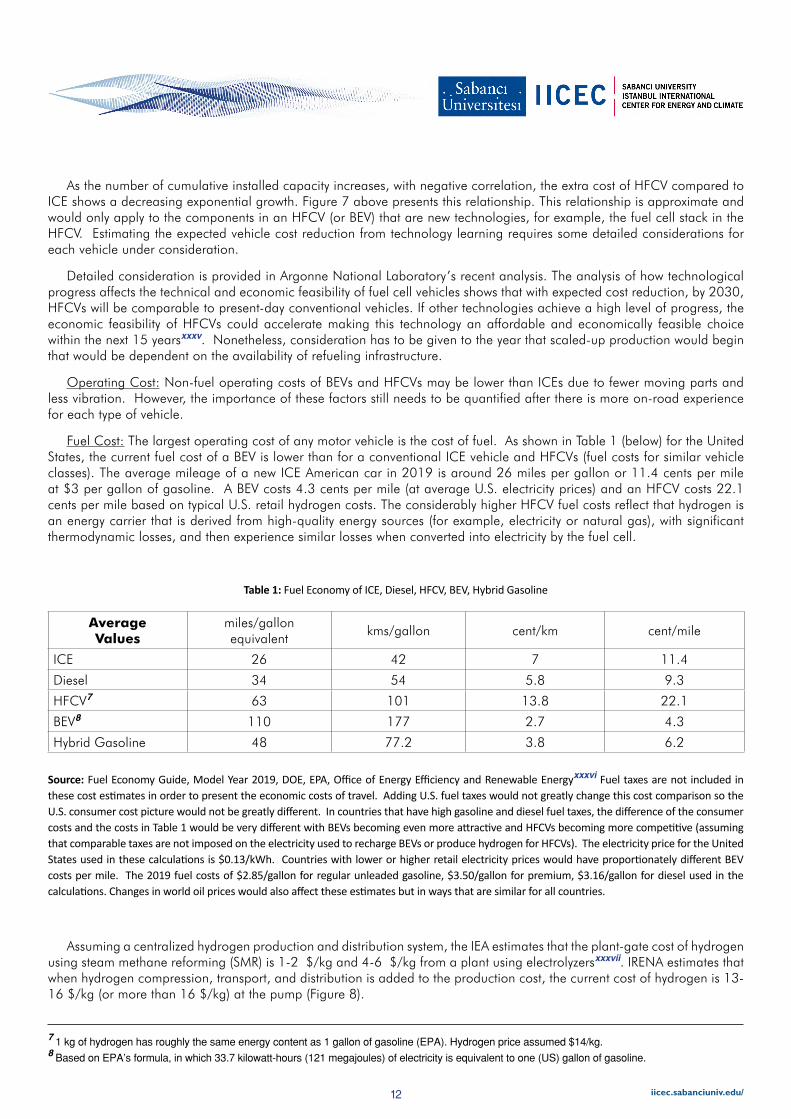
Fuel Cost: The largest operating cost of any motor vehicle is the cost of fuel. As shown in Table 1 (below) for the United States, the current fuel cost of a BEV is lower than for a conventional ICE vehicle and HFCVs (fuel costs for similar vehicle classes). The average mileage of a new ICE American car in 2019 is around 26 miles per gallon or 11.4 cents per mile at $3 per gallon of gasoline. A BEV costs 4.3 cents per mile (at average U.S. electricity prices) and an HFCV costs 22.1 cents per mile based on typical U.S. retail hydrogen costs. The considerably higher HFCV fuel costs reflect that hydrogen is an energy carrier that is derived from high-quality energy sources (for example, electricity or natural gas), with significant thermodynamic losses, and then experience similar losses when converted into electricity by the fuel cell.
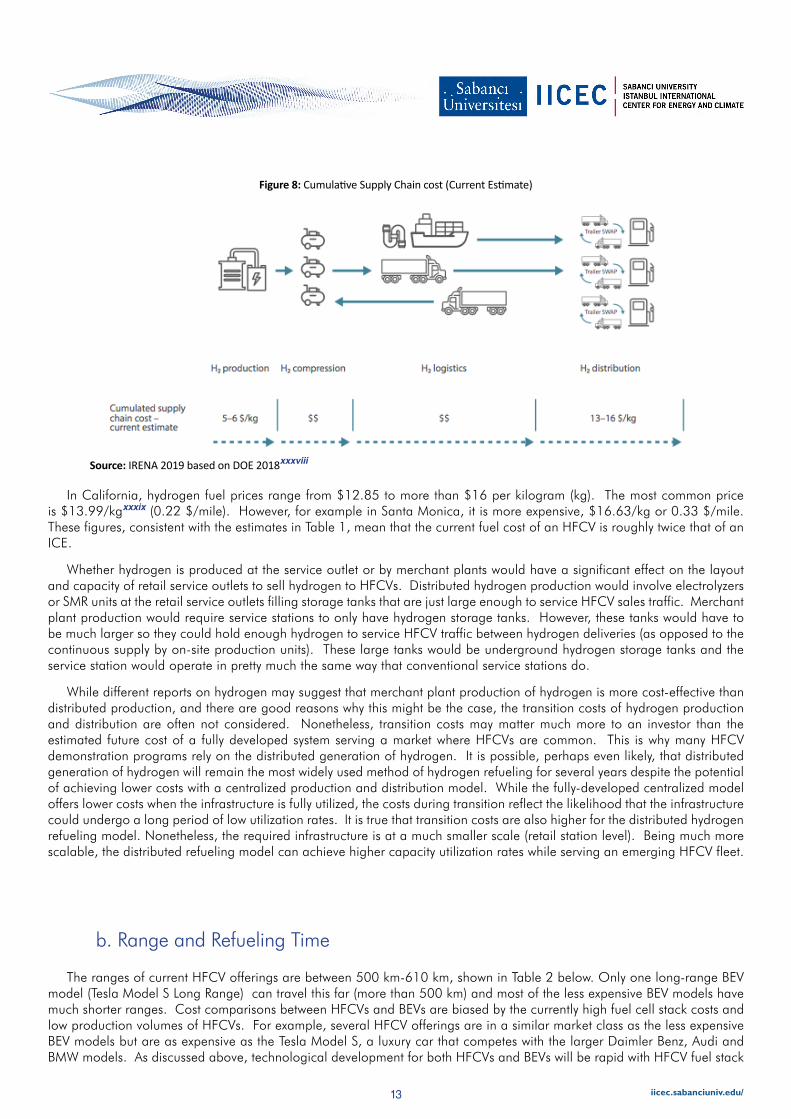
Assuming a centralized hydrogen production and distribution system, the IEA estimates that the plant-gate cost of hydrogen using steam methane reforming (SMR) is 1-2 $/kg and 4-6 $/kg from a plant using electrolyzersxxxvii. IRENA estimates that when hydrogen compression, transport, and distribution is added to the production cost, the current cost of hydrogen is 13-16 $/kg (or more than 16 $/kg) at the pump (Figure 8).
Average Values
miles/gallon equivalent
kms/gallon cent/km cent/mile
ICE 26 42 7 11.4
Diesel 34 54 5.8 9.3
HFCV7 63 101 13.8 22.1
BEV8 110 177 2.7 4.3
Hybrid Gasoline 48 77.2 3.8 6.2
Source: Fuel Economy Guide, Model Year 2019, DOE, EPA, Office of Energy Efficiency and Renewable Energyxxxvi Fuel taxes are not included in these cost estimates in order to present the economic costs of travel. Adding U.S. fuel taxes would not greatly change this cost comparison so the U.S. consumer cost picture would not be greatly different. In countries that have high gasoline and diesel fuel taxes, the difference of the consumer costs and the costs in Table 1 would be very different with BEVs becoming even more attractive and HFCVs becoming more competitive (assuming that comparable taxes are not imposed on the electricity used to recharge BEVs or produce hydrogen for HFCVs). The electricity price for the United States used in these calculations is $0.13/kWh. Countries with lower or higher retail electricity prices would have proportionately different BEV costs per mile. The 2019 fuel costs of $2.85/gallon for regular unleaded gasoline, $3.50/gallon for premium, $3.16/gallon for diesel used in the calculations. Changes in world oil prices would also affect these estimates but in ways that are similar for all countries.
Table 1: Fuel Economy of ICE, Diesel, HFCV, BEV, Hybrid Gasoline
13 iicec.sabanciuniv.edu/
In California, hydrogen fuel prices range from $12.85 to more than $16 per kilogram (kg). The most common price is $13.99/kgxxxix (0.22 $/mile). However, for example in Santa Monica, it is more expensive, $16.63/kg or 0.33 $/mile. These figures, consistent with the estimates in Table 1, mean that the current fuel cost of an HFCV is roughly twice that of an ICE.
Whether hydrogen is produced at the service outlet or by merchant plants would have a significant effect on the layout and capacity of retail service outlets to sell hydrogen to HFCVs. Distributed hydrogen production would involve electrolyzers or SMR units at the retail service outlets filling storage tanks that are just large enough to service HFCV sales traffic. Merchant plant production would require service stations to only have hydrogen storage tanks. However, these tanks would have to be much larger so they could hold enough hydrogen to service HFCV traffic between hydrogen deliveries (as opposed to the continuous supply by on-site production units). These large tanks would be underground hydrogen storage tanks and the service station would operate in pretty much the same way that conventional service stations do.
While different reports on hydrogen may suggest that merchant plant production of hydrogen is more cost-effective than distributed production, and there are good reasons why this might be the case, the transition costs of hydrogen production and distribution are often not considered. Nonetheless, transition costs may matter much more to an investor than the estimated future cost of a fully developed system serving a market where HFCVs are common. This is why many HFCV demonstration programs rely on the distributed generation of hydrogen. It is possible, perhaps even likely, that distributed generation of hydrogen will remain the most widely used method of hydrogen refueling for several years despite the potential of achieving lower costs with a centralized production and distribution model. While the fully-developed centralized model offers lower costs when the infrastructure is fully utilized, the costs during transition reflect the likelihood that the infrastructure could undergo a long period of low utilization rates. It is true that transition costs are also higher for the distributed hydrogen refueling model. Nonetheless, the required infrastructure is at a much smaller scale (retail station level). Being much more scalable, the distributed refueling model can achieve higher capacity utilization rates while serving an emerging HFCV fleet.
Figure 8: Cumulative Supply Chain cost (Current Estimate)
The ranges of current HFCV offerings are between 500 km-610 km, shown in Table 2 below. Only one long-range BEV model (Tesla Model S Long Range) can travel this far (more than 500 km) and most of the less expensive BEV models have much shorter ranges. Cost comparisons between HFCVs and BEVs are biased by the currently high fuel cell stack costs and low production volumes of HFCVs. For example, several HFCV offerings are in a similar market class as the less expensive BEV models but are as expensive as the Tesla Model S, a luxury car that competes with the larger Daimler Benz, Audi and BMW models. As discussed above, technological development for both HFCVs and BEVs will be rapid with HFCV fuel stack
b. Range and Refueling Time
Source: IRENA 2019 based on DOE 2018xxxviii

14 iicec.sabanciuniv.edu/
costs coming down and BEV battery energy density and cost improving. It is likely that HFCV and BEV costs will become roughly comparable within each market class.
For BEVs, the market now includes many models that have a variety of driving ranges from very short to over 500 km. This may reflect the priorities of different BEV consumers. Some purchasers use their BEVs for local travel and rely on at-home charging. Others want to be able to travel longer distances before recharging. For example, Tesla’s Long Range models that have a 450-525 km real-world range (or 500-580 km U.S. EPA-rated range). As can be seen in Figure 9, other BEV models have ranges exceeding 300 km of real-world range. Most probably longer-range BEV models will be introduced as more OEMs compete in the BEV market and as battery technology improves. For example, VW has announced its ID.3 Long Range with an estimated range of 470 km (not shown in Figure 9).
Source: EV Databasexl (Data is based on real-world estimates rather than U.S. EPA or other official test estimates.)
Figure 9: Range of BEVs (2019) per full charge
HFCV (2019) Range
Hyundai Nexo Blue 380 miles (608 km)
Honda Clarity 366 miles (586 km)
Hyundai Nexo 354 miles (566 km)
Toyota Mirai 312 miles (500 km)
Table 2: HFCV Ranges (Current Models)
Source: U.S. EPA rated fuel economy.
15 iicec.sabanciuniv.edu/
BEV refueling times are too long to provide consumers the usual refueling experience and would pose logistical and space problems for retail fuel outlets to accommodate many BEV vehicles. Home and workplace recharging of BEVs take considerably longer than would be available without a high voltage supercharger.
There are three basic types of chargingxli:
lLevel 1: A regular 120-volt (V) outlet. Slowest type provides 2 to 5 miles of range per hour of charging.
lLevel 2: 240 V (or 208 V) and provide 10 to 30 miles of range per hour of charging. Most public chargers are Level 2 chargers.
lFast charging: Direct current (DC) quick charging, fastest kind of charging, providing 50 or more miles of range to the battery in 20 minutes. Not all vehicles can accept fast charging.
Nonetheless, longer recharging times (often to a partially charged battery pack) at home and workplace recharging stations would reduce the frequency of BEV recharging at retail outlets compared to the refueling of HFCVs or conventional vehicles. Nonetheless, for long-distance travel, providing adequate BEV charging infrastructure would be problematic considering the amount of time each BEV would take to be recharged and be occupying space at the service outlet.
Source: USDOE
Table 4: Integrated Transportation Fuel Cell Power Systems Operating with 700 bar Fuel Tanks.
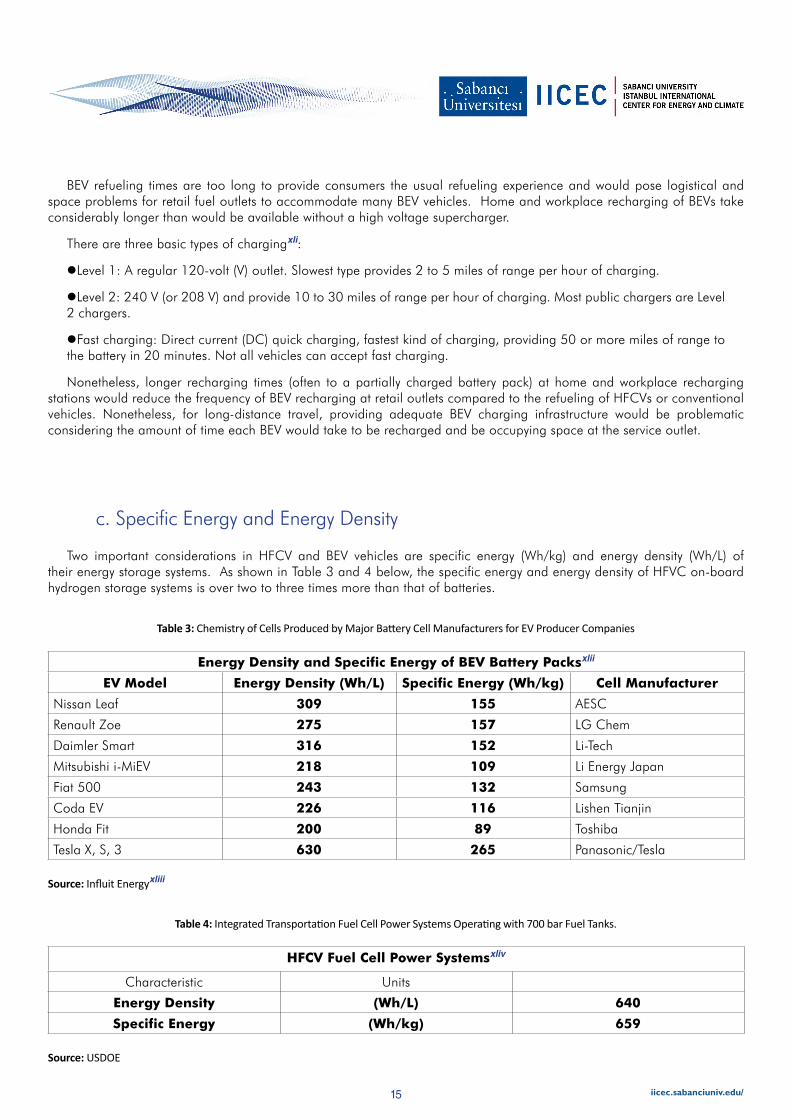
Two important considerations in HFCV and BEV vehicles are specific energy (Wh/kg) and energy density (Wh/L) of their energy storage systems. As shown in Table 3 and 4 below, the specific energy and energy density of HFVC on-board hydrogen storage systems is over two to three times more than that of batteries.
HFCV Fuel Cell Power Systemsxliv
Characteristic Units
Energy Density (Wh/L) 640
Specific Energy (Wh/kg) 659
Source: Influit Energyxliii
Table 3: Chemistry of Cells Produced by Major Battery Cell Manufacturers for EV Producer Companies
Energy Density and Specific Energy of BEV Battery Packsxlii
EV Model Energy Density (Wh/L) Specific Energy (Wh/kg) Cell Manufacturer
Nissan Leaf 309 155 AESC
Renault Zoe 275 157 LG Chem
Daimler Smart 316 152 Li-Tech
Mitsubishi i-MiEV 218 109 Li Energy Japan
Fiat 500 243 132 Samsung
Coda EV 226 116 Lishen Tianjin
Honda Fit 200 89 Toshiba
Tesla X, S, 3 630 265 Panasonic/Tesla
c. Specific Energy and Energy Density
16 iicec.sabanciuniv.edu/
These data show that HFCVs fuel systems provide two to three times more specific energy and energy density than for a BEV. However, a larger volume of batteries can be accommodated in a vehicle chassis than a hydrogen fuel tank (or tanks) because the packaging opportunities for batteries are more flexible compared to cylindrical tanks. They can be placed at the bottom of the vehicle, under the passenger and truck compartments (i.e., under the floor pan). This ameliorates two issues. A larger battery volume can be accommodated without intruding into passenger or trunk space and the weight of the batteries is placed below the roll center of the vehicle resulting in improved handling properties. These opportunities also show the benefit of developing a BEV chassis from scratch rather than using an existing ICE or hybrid model as the vehicle platform. Converted ICEs or hybrids do not accommodate as many batteries in a space-efficient manner to provide the long-range we observe in “ground up” models such as Tesla and the Chevrolet Bolt.
HFCVs use platinum in the fuel cells, and BEVs use lithium in the lithium-ion batteries. HFCVs have become less dependent on platinum in the last decade and have the possibility to not to be dependent on platinum as research progresses. Platinum (Pt) is used as a catalyst material for both anode and cathode sides in a PEMFC and is a major cost driver. Consequently, OEMs are reducing the use of platinum in the PEMFCs, for example, the Mercedes GLC F-Cell uses 90 percent less platinum than its previous fuel-cell model, the 2009 B-Class F-Cell. Nissan announced a 75% reduction in platinum from earlier fuel cell stacks by 201xlv Due to the high cost of platinum, more progress can be expected to reduce fuel cell stack costs by minimizing platinum use.
Regarding the BEVs, recent estimates indicate that there is enough lithium in the world’s reserves even with the projected growth in electric vehicles, however, from an environmental point of view, carmakers, recyclers, and technology startups are working to solve the question of how to deal with discarded lithium-ion batteries, as they pose considerable challenges in ecological protection and sustainable developmentxlvi. Currently, recycled lithium is more expensive than lithium obtained through mining. There have been proposals to use discarded BEV batteries for utility grid storage, although it is not clear whether this would be a major opportunity as the number of BEVs grows. Even these re-used batteries still have to be disposed of. However, as with so many aspects of the rapidly changing energy landscape, changes in the economic calculation may occur especially if required by governments’ environmental policies.
As commercially available products, both BEVs and HFCVs satisfy all safety certifications and regulations, however, safety is a factor that has to be considered with significant attention in detail. Hydrogen has to be compressed to about 700 bars in the storage tank of HFCVs. The pressure vessel has to be designed in a way that it doesn’t allow hydrogen leakage or burst under impact. Hydrogen is very flammable and once ignited, and the flame is invisible, which could cause a significant safety hazard. Once the hydrogen does leak, the chance for fire is very high; that’s why to detect leakages, research and development activities are focused on developing hydrogen sensors and leak detection technologies.
Batteries also have safety hazards. In severe accidents, batteries can spontaneously ignite producing intense heat. These fires have often proved to be difficult to extinguish. Batteries can catch also fire after crashes or other circumstances. However, despite these concerns, governments are promoting both vehicle technologies with the belief that safety issues can be addressed with effective regulations, codes, and standards. The USDOE view is, “like most fuels, hydrogen can be handled and used safely with appropriate sensing, handling, and engineering measures.”xlvii To put this into perspective, it is easy to imagine the various environmental and safety questions we would have about using gasoline in motor vehicles if it were the new alternative fuel that was proposed for widespread use.
d. Dependency on Resources and Environmental Concerns
e. Safety
17 iicec.sabanciuniv.edu/
9 A status report on BEV and PHEV stocks, infrastructure development and government support is provided in Appendix A. 10 Top-ten countries in IEA’s Electric Vehicle Initiative. (Global EV Outlook 2018, IEA.)
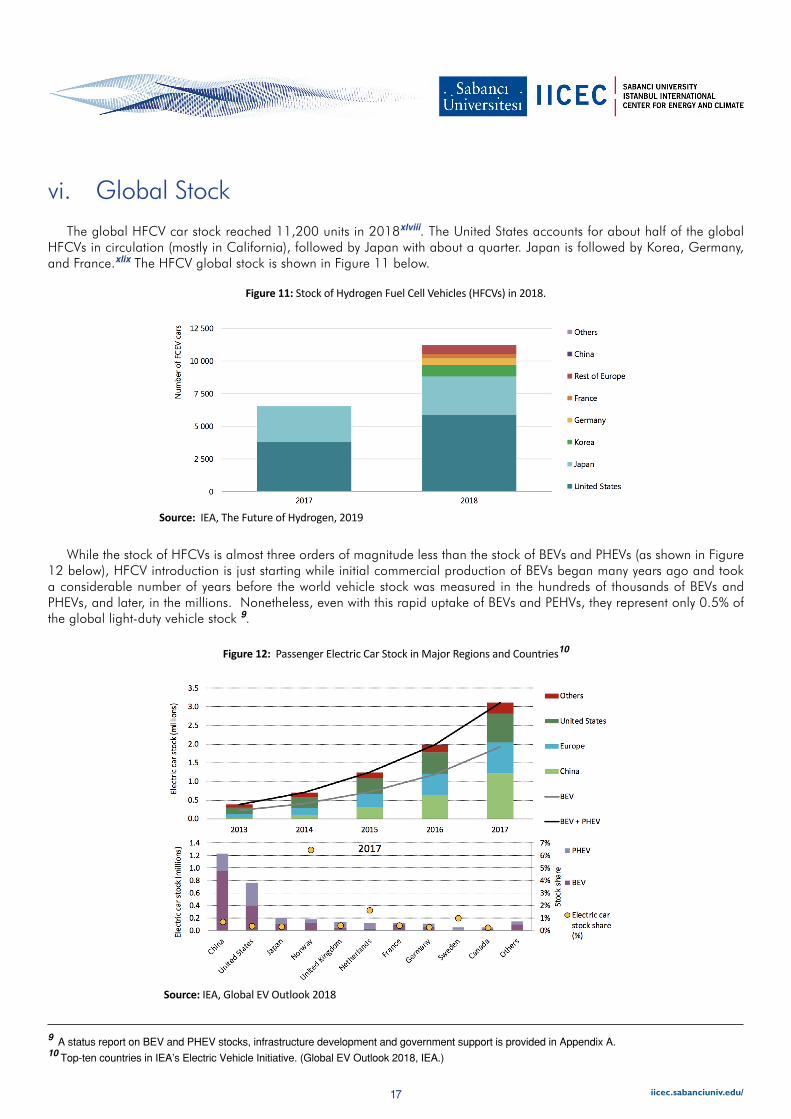
vi. Global StockThe global HFCV car stock reached 11,200 units in 2018xlviii. The United States accounts for about half of the global
HFCVs in circulation (mostly in California), followed by Japan with about a quarter. Japan is followed by Korea, Germany, and France.xlix The HFCV global stock is shown in Figure 11 below.
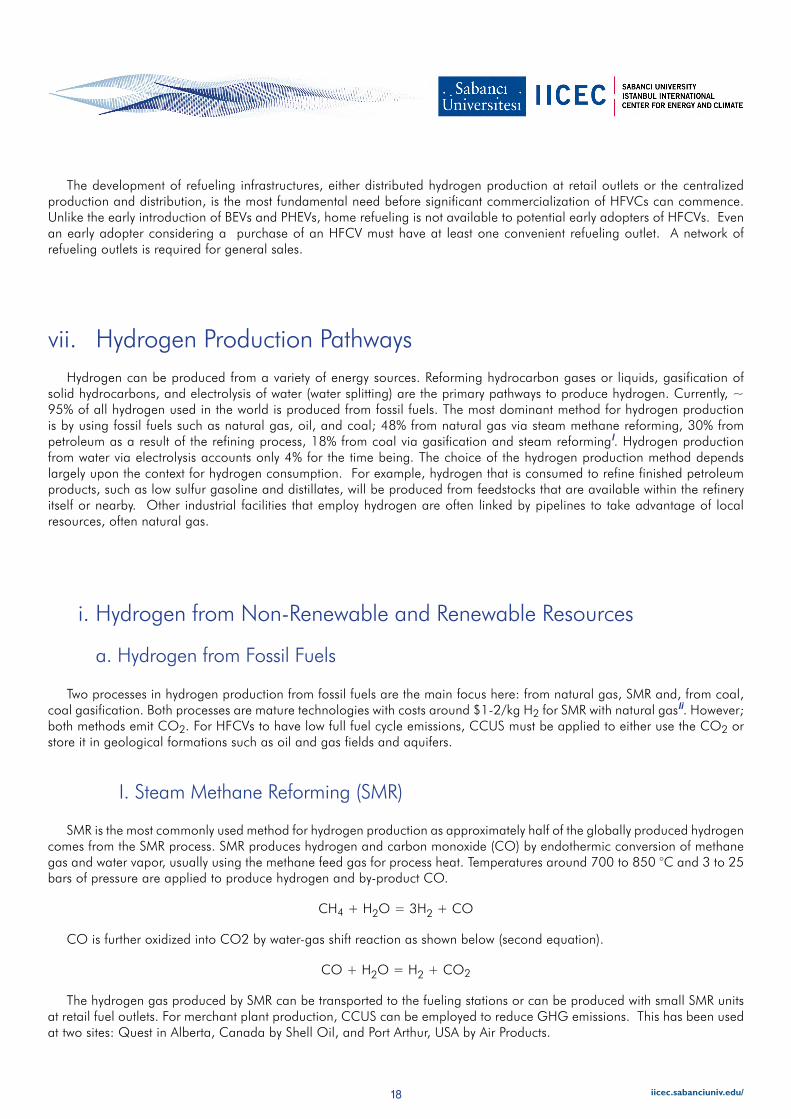
While the stock of HFCVs is almost three orders of magnitude less than the stock of BEVs and PHEVs (as shown in Figure 12 below), HFCV introduction is just starting while initial commercial production of BEVs began many years ago and took a considerable number of years before the world vehicle stock was measured in the hundreds of thousands of BEVs and PHEVs, and later, in the millions. Nonetheless, even with this rapid uptake of BEVs and PEHVs, they represent only 0.5% of the global light-duty vehicle stock 9.
Figure 11: Stock of Hydrogen Fuel Cell Vehicles (HFCVs) in 2018.
Figure 12: Passenger Electric Car Stock in Major Regions and Countries10
Source: IEA, The Future of Hydrogen, 2019
Source: IEA, Global EV Outlook 2018
18 iicec.sabanciuniv.edu/
The development of refueling infrastructures, either distributed hydrogen production at retail outlets or the centralized production and distribution, is the most fundamental need before significant commercialization of HFVCs can commence. Unlike the early introduction of BEVs and PHEVs, home refueling is not available to potential early adopters of HFCVs. Even an early adopter considering a purchase of an HFCV must have at least one convenient refueling outlet. A network of refueling outlets is required for general sales.
Hydrogen can be produced from a variety of energy sources. Reforming hydrocarbon gases or liquids, gasification of solid hydrocarbons, and electrolysis of water (water splitting) are the primary pathways to produce hydrogen. Currently, ~ 95% of all hydrogen used in the world is produced from fossil fuels. The most dominant method for hydrogen production is by using fossil fuels such as natural gas, oil, and coal; 48% from natural gas via steam methane reforming, 30% from petroleum as a result of the refining process, 18% from coal via gasification and steam reformingl. Hydrogen production from water via electrolysis accounts only 4% for the time being. The choice of the hydrogen production method depends largely upon the context for hydrogen consumption. For example, hydrogen that is consumed to refine finished petroleum products, such as low sulfur gasoline and distillates, will be produced from feedstocks that are available within the refinery itself or nearby. Other industrial facilities that employ hydrogen are often linked by pipelines to take advantage of local resources, often natural gas.
vii. Hydrogen Production Pathways
Two processes in hydrogen production from fossil fuels are the main focus here: from natural gas, SMR and, from coal, coal gasification. Both processes are mature technologies with costs around $1-2/kg H2 for SMR with natural gasli. However; both methods emit CO2. For HFCVs to have low full fuel cycle emissions, CCUS must be applied to either use the CO2 or store it in geological formations such as oil and gas fields and aquifers.
SMR is the most commonly used method for hydrogen production as approximately half of the globally produced hydrogen comes from the SMR process. SMR produces hydrogen and carbon monoxide (CO) by endothermic conversion of methane gas and water vapor, usually using the methane feed gas for process heat. Temperatures around 700 to 850 °C and 3 to 25 bars of pressure are applied to produce hydrogen and by-product CO.
CH4 + H2O = 3H2 + CO
CO is further oxidized into CO2 by water-gas shift reaction as shown below (second equation).
CO + H2O = H2 + CO2
The hydrogen gas produced by SMR can be transported to the fueling stations or can be produced with small SMR units at retail fuel outlets. For merchant plant production, CCUS can be employed to reduce GHG emissions. This has been used at two sites: Quest in Alberta, Canada by Shell Oil, and Port Arthur, USA by Air Products.
i. Hydrogen from Non-Renewable and Renewable Resources
a. Hydrogen from Fossil Fuels
I. Steam Methane Reforming (SMR)
19 iicec.sabanciuniv.edu/
Coal Gasification also employs steam reforming chemistry but must gasify coal to produce syngas (CO + H2). Syngas is more easily produced when CH4 is used as the feedstock since gasifying coal presents a number of technological and economic problems. The high capital costs of coal gasification combined with low natural gas and oil prices have made the technology economically unattractive for most applications. In order for hydrogen production from coal to avoid high emissions of CO2, it is even more urgent to apply CCUS technology. While the costs of coal gasification are currently high compared to other methods, the abundance of coal in many parts of the world cause a continued interest in the technology as further research and development are continuing.
By reacting coal with oxygen and steam under high pressures and temperatures, a mixture consisting primarily of carbon monoxide and hydrogen (synthesis gas) is formed. High temperature is preferable to get the most gas out of carbon content.
CH0.8 + O2 + H2O → CO + CO2 + H2 + other species
Then, from the synthesis gas, the impurities (other species) are removed, and the carbon monoxide in the gas mixture is reacted with steam through the water-gas shift reaction to produce additional hydrogen and carbon dioxide.
b. Hydrogen from Electricity
II. Coal Gasification
While currently expensive, electrolysis of water is a promising option for hydrogen production. If the electricity used for electrolysis has near-zero full fuel cycle GHG emissions, then HFCVs will also have near-zero full fuel-cycle emissions. Electrolysis is an electrochemical process that splits water into hydrogen and oxygen. This process takes places in a unit called an electrolyzer. The reaction for this process is:
H2O + electricity = H2 + ½ O
Electrolyzers sizes differ so they can be used either in distributed hydrogen production at retail outlets or at merchant hydrogen plants. With merchant plants, the source of electricity does not depend on the general electric grid. They can be supplied by specific power sources, in particular, those without significant GHG emissions such as renewable or nuclear power plants.
Hydrogen production costs via electrolysis are higher ($4-6/kg H2) compared to SMR ($1-2/kg H2), partly due to capital cost of the electrolyzer and partly due to cost of electricity used for this processlii. A strategy to reduce the cost of hydrogen production from electricity is to trade off the capital utilization of the electrolyzer for the opportunity to purchase electricity during periods when electricity prices are low. There are two major opportunities to purchase carbon-free electricity at low cost: 1) from intermittent renewable generators during periods when there is oversupply relative to demand; and 2) from 24/7 nuclear power plants when there is, likewise, oversupply relative to demand and low prices. These opportunities depend greatly on the structure of the local electricity market but, in general, when electricity is being sold into a competitive grid, and power prices are very low, any electricity source would likely take advantage of the opportunity to sell power to a merchant power plant as long as they are interconnected.
As the hydrogen merchant plant would seek a low GHG source of electricity, for a variety of reasons, that means that variable renewable generators and nuclear power plants would be the best candidates. There is currently a significant availability of low-priced nuclear power during which competitive grid prices are low and there is a growing supply of intermittent wind and solar power that, similarly, faces oversupply and low prices in competitive grids. Dispatching this power to merchant hydrogen plants could, depending on the capital cost vs. electricity cost tradeoffs, might significantly lower the cost of hydrogen produced by electrolysis while also benefiting nuclear and/or renewable power producers. Much of the literature on the “hydrogen economy” and HFCVs have focused on this opportunity.
I. Electrolysis
20 iicec.sabanciuniv.edu/
There are several ways hydrogen can be supplied to HFCV but they can be divided into two basic types: decentralized (retail outlet) production from locally available energy sources and centralized (merchant plant) production with transportation and distribution networks.
Two methods are being currently used at hydrogen retail stations to produce hydrogen for HFCVs: 1) Electrolysis using electricity from the grid (plus water); and 2) Reforming natural gas if the service station has access to a natural gas network. In both instances, electric or natural gas distribution capacity must be upgraded over the usual power or natural gas requirements of the service outlet. Nonetheless, one or both of these energy sources are almost always available and provides a hydrogen supply option that does not require the development of a larger, integrated, hydrogen supply network.
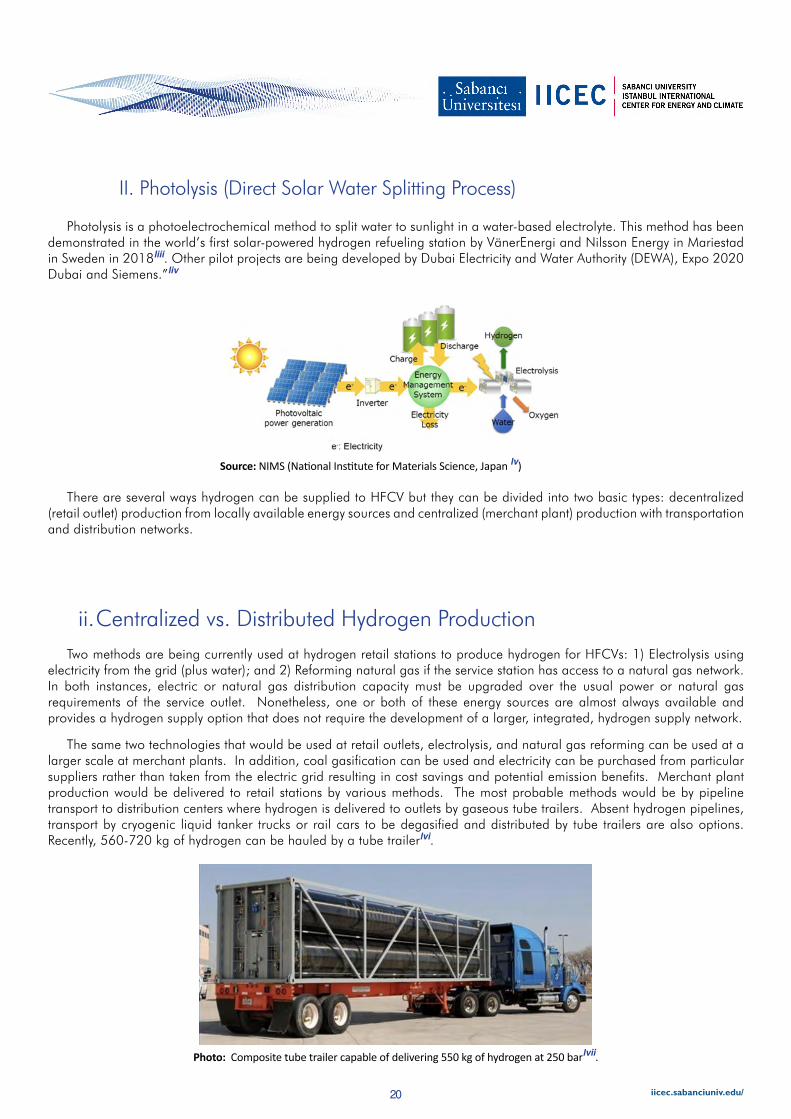
The same two technologies that would be used at retail outlets, electrolysis, and natural gas reforming can be used at a larger scale at merchant plants. In addition, coal gasification can be used and electricity can be purchased from particular suppliers rather than taken from the electric grid resulting in cost savings and potential emission benefits. Merchant plant production would be delivered to retail stations by various methods. The most probable methods would be by pipeline transport to distribution centers where hydrogen is delivered to outlets by gaseous tube trailers. Absent hydrogen pipelines, transport by cryogenic liquid tanker trucks or rail cars to be degasified and distributed by tube trailers are also options. Recently, 560-720 kg of hydrogen can be hauled by a tube trailerlvi.
Photo: Composite tube trailer capable of delivering 550 kg of hydrogen at 250 barlvii.
Photolysis is a photoelectrochemical method to split water to sunlight in a water-based electrolyte. This method has been demonstrated in the world’s first solar-powered hydrogen refueling station by VanerEnergi and Nilsson Energy in Mariestad in Sweden in 2018liii. Other pilot projects are being developed by Dubai Electricity and Water Authority (DEWA), Expo 2020 Dubai and Siemens.”liv
II. Photolysis (Direct Solar Water Splitting Process)
Source: NIMS (National Institute for Materials Science, Japan lv)
ii. Centralized vs. Distributed Hydrogen Production
21 iicec.sabanciuniv.edu/
The method of delivery is significant as it has a considerable impact on the consumer cost of hydrogen. The plant-gate cost of hydrogen at merchant plant is lower than distributed generation due to economies of scale and lower feedstock costs, but the costs to deliver the hydrogen to the point of use have to also be considered. Hence, there is a trade-off between the hydrogen production costs and hydrogen delivery costs.
As shown in Figure 13, the State of California is introducing a variety of hydrogen refueling models including delivered compressed H2, delivered pipeline H2, delivered liquid H2, natural gas on-site reforming, on-site electrolysis. As of July 2018, California had 36 HRS stations in operation and 28 more cominglviii. These stations provide hydrogen to about 5,000lix HFCVs.
Both BEVs and HFCVs have zero tailpipe emissions. They are often referred to as Zero Emission Vehicles (ZEVs). ZEVs can significantly reduce urban air pollution when fossil fuel power sources are outside of the urban air shed. However, near-zero full fuel-cycle GHG emissions require that the power sector supplying these vehicles also have near-zero GHG emissions.
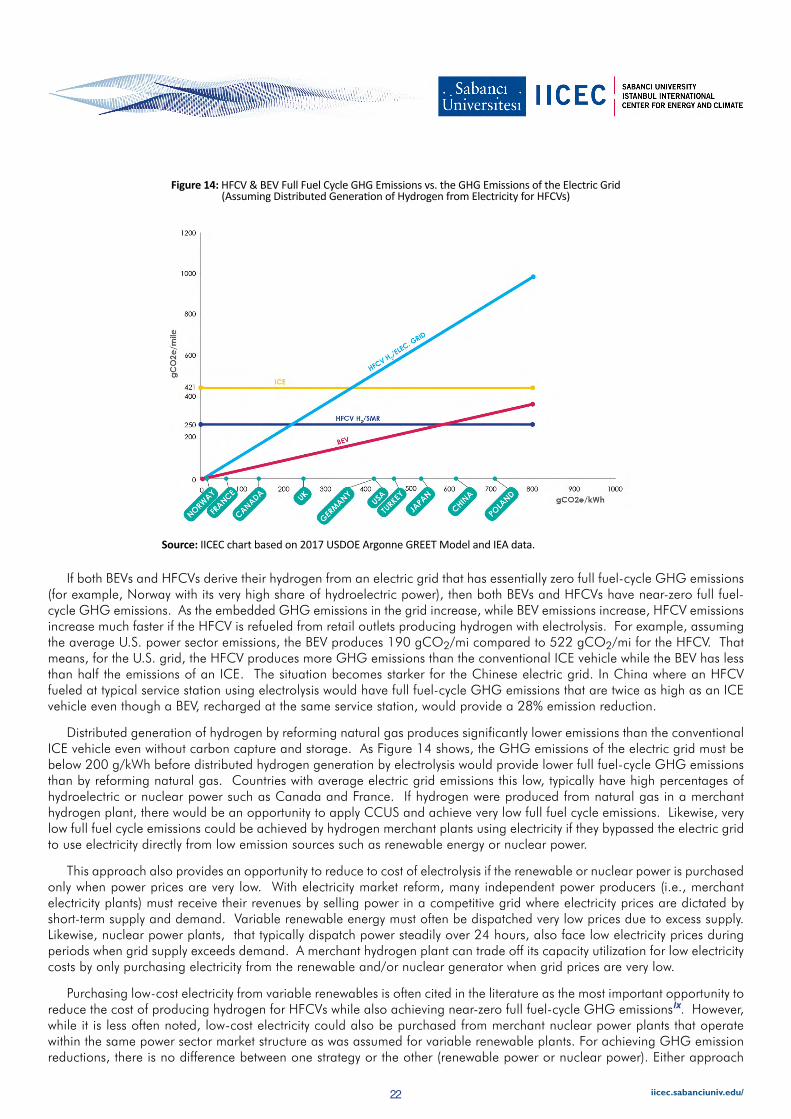
When developing transport policies intended to reduce GHG emissions, the different GHG emission characteristics of BEVs and HFCVs should be taken into account. While both EVs and HFCVs eliminate the “tailpipe” emissions of carbon dioxide and other pollutants, the full fuel cycle emissions may be much higher depending on the technologies and energy sources used to produce electricity and hydrogen. HFCVs’ that rely on the distributed generation of hydrogen from electrolysis will not necessarily provide any GHG emission reductions, and may actually increase them, depending on the GHG emissions of the electric grid from which the hydrogen is produced. While BEV full fuel cycle emissions also reflect the emissions of the grid, the BEV produces 37% of the emissions of an HFCV if charged from the same electric grid that is used to produce hydrogen for the HFCV. This high sensitivity of HFCV emissions to the emissions of the electric grid means that locality and commercialization strategy could have a large impact on the potential GHG benefits of the HFCV. Figure 14 shows the relationship between the carbon intensity of the electric grid to the GHG emissions of an HFCV vehicle that is being refueled from electrolyzers using grid electricity and BEVs being charged from the same electricity. Figure 14 also shows, for comparison, the full fuel cycle emissions of a comparable ICE vehicle and the full fuel cycle emissions of an HFCV vehicle that is being refueled from hydrogen produced by SMR from natural gas (no CCUS).
viii. Emissions
I. Well-To-Wheel Emission Pathways
Figure 13: Five Examples of Hydrogen Production and Fueling Facilities in California
Source: California Air Resources Board (CARB)
22 iicec.sabanciuniv.edu/
If both BEVs and HFCVs derive their hydrogen from an electric grid that has essentially zero full fuel-cycle GHG emissions (for example, Norway with its very high share of hydroelectric power), then both BEVs and HFCVs have near-zero full fuel-cycle GHG emissions. As the embedded GHG emissions in the grid increase, while BEV emissions increase, HFCV emissions increase much faster if the HFCV is refueled from retail outlets producing hydrogen with electrolysis. For example, assuming the average U.S. power sector emissions, the BEV produces 190 gCO2/mi compared to 522 gCO2/mi for the HFCV. That means, for the U.S. grid, the HFCV produces more GHG emissions than the conventional ICE vehicle while the BEV has less than half the emissions of an ICE. The situation becomes starker for the Chinese electric grid. In China where an HFCV fueled at typical service station using electrolysis would have full fuel-cycle GHG emissions that are twice as high as an ICE vehicle even though a BEV, recharged at the same service station, would provide a 28% emission reduction.
Distributed generation of hydrogen by reforming natural gas produces significantly lower emissions than the conventional ICE vehicle even without carbon capture and storage. As Figure 14 shows, the GHG emissions of the electric grid must be below 200 g/kWh before distributed hydrogen generation by electrolysis would provide lower full fuel-cycle GHG emissions than by reforming natural gas. Countries with average electric grid emissions this low, typically have high percentages of hydroelectric or nuclear power such as Canada and France. If hydrogen were produced from natural gas in a merchant hydrogen plant, there would be an opportunity to apply CCUS and achieve very low full fuel cycle emissions. Likewise, very low full fuel cycle emissions could be achieved by hydrogen merchant plants using electricity if they bypassed the electric grid to use electricity directly from low emission sources such as renewable energy or nuclear power.
This approach also provides an opportunity to reduce to cost of electrolysis if the renewable or nuclear power is purchased only when power prices are very low. With electricity market reform, many independent power producers (i.e., merchant electricity plants) must receive their revenues by selling power in a competitive grid where electricity prices are dictated by short-term supply and demand. Variable renewable energy must often be dispatched very low prices due to excess supply. Likewise, nuclear power plants, that typically dispatch power steadily over 24 hours, also face low electricity prices during periods when grid supply exceeds demand. A merchant hydrogen plant can trade off its capacity utilization for low electricity costs by only purchasing electricity from the renewable and/or nuclear generator when grid prices are very low.
Purchasing low-cost electricity from variable renewables is often cited in the literature as the most important opportunity to reduce the cost of producing hydrogen for HFCVs while also achieving near-zero full fuel-cycle GHG emissionslx. However, while it is less often noted, low-cost electricity could also be purchased from merchant nuclear power plants that operate within the same power sector market structure as was assumed for variable renewable plants. For achieving GHG emission reductions, there is no difference between one strategy or the other (renewable power or nuclear power). Either approach
Source: IICEC chart based on 2017 USDOE Argonne GREET Model and IEA data.
Figure 14: HFCV & BEV Full Fuel Cycle GHG Emissions vs. the GHG Emissions of the Electric Grid (Assuming Distributed Generation of Hydrogen from Electricity for HFCVs)
23 iicec.sabanciuniv.edu/
Emissions from road freight are a significant share of total transport emissions. Between 2000-2015, emissions from road freight vehicles rose from 1.7 Gt to 2.6 Gt, contributing to more than 40% of CO2 emissions growth from transport over that period and account for more than 75% of all freight emissionslxii.
HFCVs are being developed to serve in the heavy-duty vehicle market since heavy-duty vehicles require large bursts of power, something that BEVs are less able to do. In these sectors, HFCVs can provide low-emission electric power to a range of medium and heavy-duty trucks as well as various other applications in which batteries would not be a practical source of electricity. It is also important to remember that, based on IEA projections, the growth of oil demand is projected to be in transportation sector and petrochemicalslxiii. Consequently, electrifying road transport will be needed to reach global GHG emission goals and appears to be an important opportunity for hydrogen-powered vehicles to help achieve these goals.
HFCV trucks and buses that follow fixed routes can be more easily commercialized than private light-duty HFCVs because they are centrally fueled, making it more practical to provide hydrogen refueling. But even for long-distance travel, trucks are more able to hold sufficient hydrogen tanks and travel over long distances without refueling. Also, as most long-haul truck transport occurs over major highways, installing hydrogen refueling infrastructure at existing truck stops could accommodate a high percentage of road transport.
OEMs are active in developing this segment including Nikola and Hyundai and are entering the market in the US and Switzerland. Alstom is operating hydrogen passenger trains in Germany. Hyundai has announced 1,000 hydrogen fuel cell trucks for Switzerland and Korea. Nikola, Toyota, and Hyundai also announced plans to produce heavy-duty hydrogen fuel cell trucks with ranges of 500 to 1200 kilometerslxiv lxv.
Buses are also an important opportunity for both BEVs and HFCVs. Europe, Japan, South Korea, and China have fuel cell and battery electric bus programs. By end-2019, several thousands of buses and trucks are expected in Chinalxvi. Smaller buses and buses with shorter-range requirements are planned to be BEVs while longer runs can be served by HFCVs. As with centrally fueled truck fleets, bus operations ease the development of refueling infrastructure easier. So far, more than 450 HFCV buses from are on the road in the US, Europe, Japan, and China and countries have plans to deploy thousands more over the next few years. For example, South Korea plans to replace 26,000 buses from compressed natural gas with hydrogen fuel cell buses until 2030 while Shanghai has plans to operate 3,000 HFCV buses by 2020.”lxvii Japan has a national target of 40,000 HFCV buses on the road with additional 160 hydrogen fueling stations by 2020 in time for the Tokyo Olympics.
II. Heavy-Duty Applications
reduces hydrogen production cost and achieves low full fuel-cycle GHG emissions. It is even conceivable, perhaps not practical, for a merchant hydrogen power plant to be connected to a variable renewable plant and a nuclear power plant in order to increase the number of hours during the day and night that the hydrogen power plant can operate with low-cost electricity.
For countries that do not have an electric grid with very low GHG emissions or prospects for achieving low emissions, using HFCVs fueled by the distributed generation of hydrogen from electricity is a poor GHG strategy unless it is reasonable to assume that the distributed generation infrastructure would be soon be replaced by a centralized system. A distributed generation system using SMR from natural gas produces much better results, but the GHG reduction would still not be appreciably different than what would be achieved from plug-in hybrid electric vehicleslxi. When considering a hydrogen fuel distribution strategy, government policies should consider the high investment costs needed to purchase electrolysis or reforming equipment at retail outlets that would later have to be removed and replaced with much larger hydrogen storage tanks to accommodate a centralized hydrogen network. Either approach, distributed or centralized hydrogen production involves transition costs that are significantly higher than “end state” costs when there is a balance between refueling outlets and HFCVs. Initially, there must be an underutilization of refueling infrastructure since consumers will not buy the first HFCV unless there are convenient opportunities to refuel the vehicle. Solving this problem by having two successive refueling strategies, distributed and centralized, may reduce transition costs as opposed to beginning with a centralized system. Nonetheless, transition costs for each phase exist and may be significant.
xl
24 iicec.sabanciuniv.edu/
There are two barriers for the uptake of the HFCVs: 1) Vehicle cost is higher than the ICEs and BEVs; and 2) Need to provide enough refueling infrastructure to motivate HFCV purchase by the general public. By providing various types of incentives, governments aim to motivate and synchronize HFCV uptake and refueling infrastructure development. In 2017, 330 hydrogen refueling stations were in operation worldwide, the majority in Japanlxix.
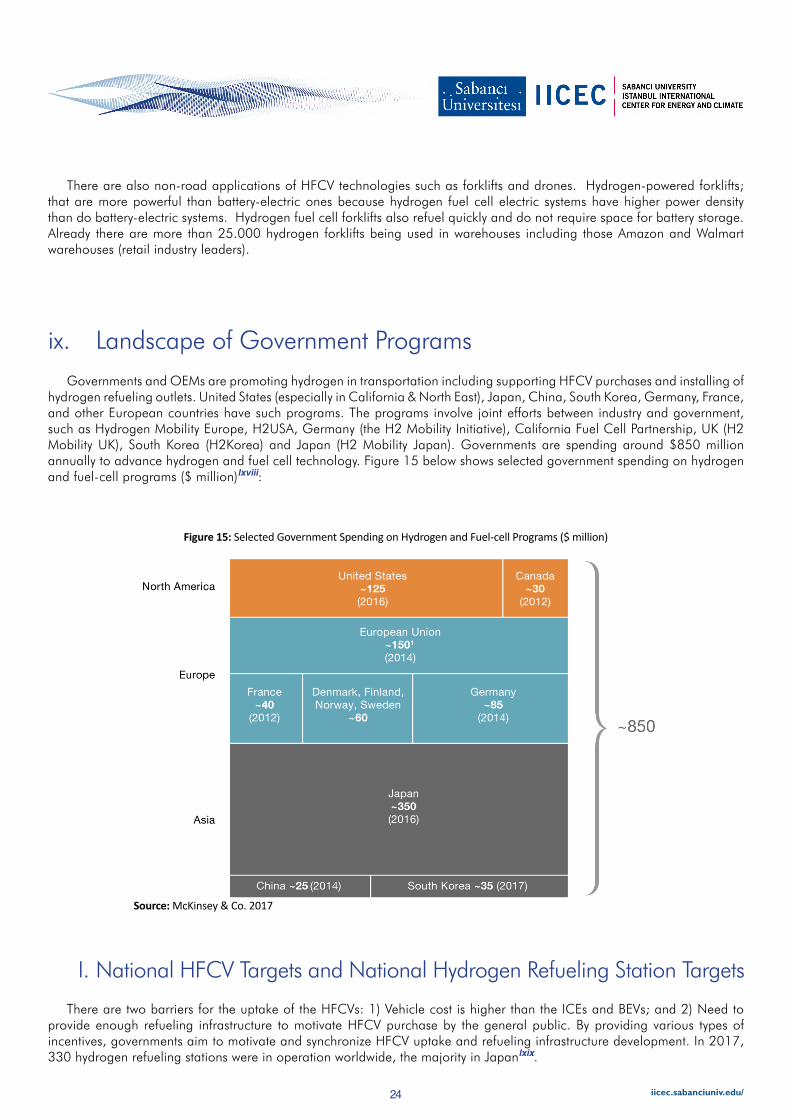
Governments and OEMs are promoting hydrogen in transportation including supporting HFCV purchases and installing of hydrogen refueling outlets. United States (especially in California & North East), Japan, China, South Korea, Germany, France, and other European countries have such programs. The programs involve joint efforts between industry and government, such as Hydrogen Mobility Europe, H2USA, Germany (the H2 Mobility Initiative), California Fuel Cell Partnership, UK (H2 Mobility UK), South Korea (H2Korea) and Japan (H2 Mobility Japan). Governments are spending around $850 million annually to advance hydrogen and fuel cell technology. Figure 15 below shows selected government spending on hydrogen and fuel-cell programs ($ million)lxviii:
There are also non-road applications of HFCV technologies such as forklifts and drones. Hydrogen-powered forklifts; that are more powerful than battery-electric ones because hydrogen fuel cell electric systems have higher power density than do battery-electric systems. Hydrogen fuel cell forklifts also refuel quickly and do not require space for battery storage. Already there are more than 25.000 hydrogen forklifts being used in warehouses including those Amazon and Walmart warehouses (retail industry leaders).
ix. Landscape of Government Programs
Figure 15: Selected Government Spending on Hydrogen and Fuel-cell Programs ($ million)
Source: McKinsey & Co. 2017
I. National HFCV Targets and National Hydrogen Refueling Station Targets
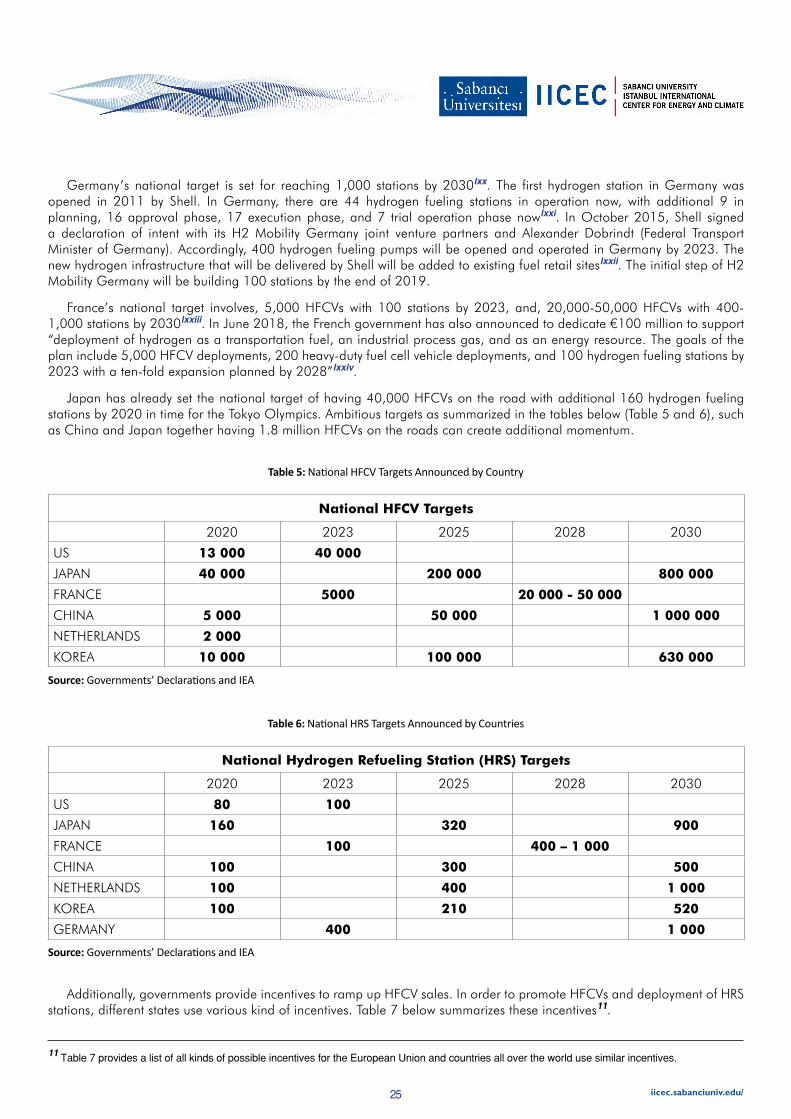
25 iicec.sabanciuniv.edu/
Additionally, governments provide incentives to ramp up HFCV sales. In order to promote HFCVs and deployment of HRS stations, different states use various kind of incentives. Table 7 below summarizes these incentives11.
National HFCV Targets
2020 2023 2025 2028 2030
US 13 000 40 000
JAPAN 40 000 200 000 800 000
FRANCE 5000 20 000 - 50 000
CHINA 5 000 50 000 1 000 000
NETHERLANDS 2 000
KOREA 10 000 100 000 630 000
National Hydrogen Refueling Station (HRS) Targets
2020 2023 2025 2028 2030
US 80 100
JAPAN 160 320 900
FRANCE 100 400 – 1 000
CHINA 100 300 500
NETHERLANDS 100 400 1 000
KOREA 100 210 520
GERMANY 400 1 000
Source: Governments’ Declarations and IEA
Table 5: National HFCV Targets Announced by Country
Source: Governments’ Declarations and IEA
Table 6: National HRS Targets Announced by Countries
11 Table 7 provides a list of all kinds of possible incentives for the European Union and countries all over the world use similar incentives.
Germany’s national target is set for reaching 1,000 stations by 2030lxx. The first hydrogen station in Germany was opened in 2011 by Shell. In Germany, there are 44 hydrogen fueling stations in operation now, with additional 9 in planning, 16 approval phase, 17 execution phase, and 7 trial operation phase nowlxxi. In October 2015, Shell signed a declaration of intent with its H2 Mobility Germany joint venture partners and Alexander Dobrindt (Federal Transport Minister of Germany). Accordingly, 400 hydrogen fueling pumps will be opened and operated in Germany by 2023. The new hydrogen infrastructure that will be delivered by Shell will be added to existing fuel retail siteslxxii. The initial step of H2 Mobility Germany will be building 100 stations by the end of 2019.
France’s national target involves, 5,000 HFCVs with 100 stations by 2023, and, 20,000-50,000 HFCVs with 400-1,000 stations by 2030lxxiii. In June 2018, the French government has also announced to dedicate €100 million to support “deployment of hydrogen as a transportation fuel, an industrial process gas, and as an energy resource. The goals of the plan include 5,000 HFCV deployments, 200 heavy-duty fuel cell vehicle deployments, and 100 hydrogen fueling stations by 2023 with a ten-fold expansion planned by 2028”lxxiv.
Japan has already set the national target of having 40,000 HFCVs on the road with additional 160 hydrogen fueling stations by 2020 in time for the Tokyo Olympics. Ambitious targets as summarized in the tables below (Table 5 and 6), such as China and Japan together having 1.8 million HFCVs on the roads can create additional momentum.

26 iicec.sabanciuniv.edu/
Source: Adapted from National Implementation Plan, Hydrogen Refuelling Infrastructurelxxv
Table 7: Incentives to Promote HFCV and HRS Deployment
Just like gasoline stations, HFCVs need a widely available infrastructure of refueling stations to motivate HFCV purchase by consumers. The difficulty to achieve this with any alternative transportation fuel has often been referred to as the chicken-egg problem. Without refueling stations, car manufacturers are reluctant to invest in mass production of HFCVs. Likewise, energy companies are also reluctant to deploy the hydrogen refueling station (HRS) infrastructure for lack of customers
II. Hydrogen Infrastructure Development
Incentives to promote HFCV and HRS Deploymentlx
General IncentivesAlign hydrogen in mobility with other plans like storage of electricity, renewable energy, air quality policy etc.
Incentives for production of ‘green’ hydrogen
Investment support for industrial scale demonstration projects
HFCV IncentivesPublic procurements with zero emission targets
Negative incentives for fossil fuels like diesel, natural gas and petrol
Reduced registration tax depending on tailpipe CO2
Purchase support depending on tailpipe CO2
Reduced tax on car ownership, Reduced tax on private usage
Tax deductions for environmentally friendly investments
Specific incentives for specified fleets (taxi’s, garbage trucks, logistics etc.)
Free public parking, Road fee exemption
Driving in bus lanes, Carpool lane driving
Low Emission Zones
Subsidy on buying vehicle
HRS IncentivesExcise duty exemption for hydrogen (fit to market development phase)
Public procurements/auctions for refueling stations near highways (extra requirements for alternative fuels and/or extension contracts if clean fuels are offered)
Fossil fuels added CO2 and energy tax
Governmental subsidies in station CAPEX and OPEX:Capital expense grants for HRS (linked to cost or capacity) Operation expense grants (linked to cost, capacity or throughput) Market assurance grants (linked to utilization)Possibly for first mover benefits: Geographical buffer for early investors, Priority status, Multi-station grants
Tax benefit for investment and productionTax benefit for accelerated and bonus depreciation Tax benefit for property and other exemptions
Permitting support by offering clear procedure/legislation
Promote ‘living labs’ (HRS coupled to local and regional vehicles/fleets)
Introduce zero emission target for governmental fleets (buses, waste companies etc.). Fleets connected to HRS are important early clients

27 iicec.sabanciuniv.edu/
Source: California Fuel Cell Partnership
California currently has a total of 64 stations (36 Open-Retail in operation and 28 additional funded coming in the pipeline), that enabled the deployment of and provide hydrogen to service nearly 5,000 HFCVs to California’s roadways. Additionally, in January 2018, California governor issued an Executive Order that sets an additional hydrogen station network development target of 200 stations by 2025lxxviii. To meet the goal of 200 stations by 2025, the industry is opening approximately one new fueling station a monthlxxix. This gradual expansion of the refueling station roll-out for HFCVs is portrayed in CHIT (California Hydrogen Infrastructure Tool) analysis of the California Air Resources Board (CARB). The CHIT “provides the capability to perform spatially-resolved analyses of projected HFCV market growth, fueling network coverage, and the gap between these two metrics”lxxx.
The California Fuel Cell Partnership (CaFCP) also announced their “2030 Vision”, that the partnership is aiming a network of 1,000 HRS and an HFCV population of up to 1,000,000 vehicles by 2030lxxxi. According to CARB, projections over the previously reported data until 2018 point to an increase, and “projections for on-the-road HFCV counts now exceed 23,000 in 2021 and 47,000 in 2024”lxxxii (Figure 16 and 17).
III. California’s Integrated HFCV Hydrogen Vehicle Program
on the road and likely customers to be on the road in the immediate future. With the resulting low utilization, since not enough HFCVs will be on the roads, there is little prospects for profit, only a question of how much the losses would be. Consequently, government support is a widely employed strategy in all current HFCV demonstration programs. Government-industry synchronization is essential until the chicken-egg problem dissolves with a large network of refueling stations and enough HFCVs passing by each one to return value to the required investments. The amount of time required to achieve that is variable but, in many instances, could be measured in decades from initial program implementation.
Integrated efforts are required among the various stakeholders such as the car manufacturers, energy companies and government with timely sales of HFCVs to consumers at affordable prices and benefits for early adopters. A strongly synchronized roll-out of retail infrastructure supported by appropriate government policies would provide the customers’ access to needed infrastructure from the beginning: “The need for synchronization is obvious. Governments can catalyze this synchronization by providing clarity and certainty on the policy and regulatory framework, and initiate structures for industry-government cooperation”lxxvi.
The market development for the roll-out of HFCVs is expected to have “a gradual expansion; expanding from densely populated areas, major cities, and highway, into less urbanized areas and eventually rural areas. The critical phase consists in bridging the gap between isolated demonstration clusters and a pre-commercial stage.” lxxvii
Figure 16: Hydrogen Station Point Density Heat Map for 200 HRS in 2025 and 1000 HRS in 2030.
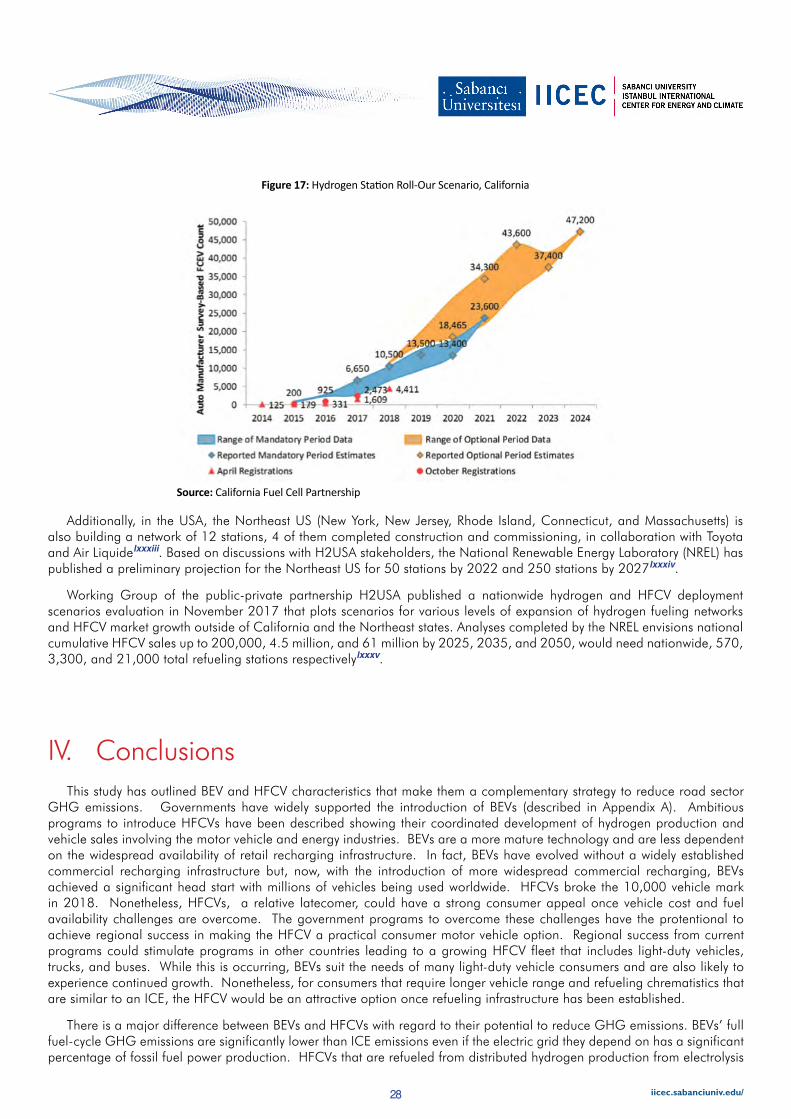
28 iicec.sabanciuniv.edu/
This study has outlined BEV and HFCV characteristics that make them a complementary strategy to reduce road sector GHG emissions. Governments have widely supported the introduction of BEVs (described in Appendix A). Ambitious programs to introduce HFCVs have been described showing their coordinated development of hydrogen production and vehicle sales involving the motor vehicle and energy industries. BEVs are a more mature technology and are less dependent on the widespread availability of retail recharging infrastructure. In fact, BEVs have evolved without a widely established commercial recharging infrastructure but, now, with the introduction of more widespread commercial recharging, BEVs achieved a significant head start with millions of vehicles being used worldwide. HFCVs broke the 10,000 vehicle mark in 2018. Nonetheless, HFCVs, a relative latecomer, could have a strong consumer appeal once vehicle cost and fuel availability challenges are overcome. The government programs to overcome these challenges have the protentional to achieve regional success in making the HFCV a practical consumer motor vehicle option. Regional success from current programs could stimulate programs in other countries leading to a growing HFCV fleet that includes light-duty vehicles, trucks, and buses. While this is occurring, BEVs suit the needs of many light-duty vehicle consumers and are also likely to experience continued growth. Nonetheless, for consumers that require longer vehicle range and refueling chrematistics that are similar to an ICE, the HFCV would be an attractive option once refueling infrastructure has been established.
There is a major difference between BEVs and HFCVs with regard to their potential to reduce GHG emissions. BEVs’ full fuel-cycle GHG emissions are significantly lower than ICE emissions even if the electric grid they depend on has a significant percentage of fossil fuel power production. HFCVs that are refueled from distributed hydrogen production from electrolysis
IV. Conclusions
Figure 17: Hydrogen Station Roll-Our Scenario, California
Additionally, in the USA, the Northeast US (New York, New Jersey, Rhode Island, Connecticut, and Massachusetts) is also building a network of 12 stations, 4 of them completed construction and commissioning, in collaboration with Toyota and Air Liquidelxxxiii. Based on discussions with H2USA stakeholders, the National Renewable Energy Laboratory (NREL) has published a preliminary projection for the Northeast US for 50 stations by 2022 and 250 stations by 2027lxxxiv.
Working Group of the public-private partnership H2USA published a nationwide hydrogen and HFCV deployment scenarios evaluation in November 2017 that plots scenarios for various levels of expansion of hydrogen fueling networks and HFCV market growth outside of California and the Northeast states. Analyses completed by the NREL envisions national cumulative HFCV sales up to 200,000, 4.5 million, and 61 million by 2025, 2035, and 2050, would need nationwide, 570, 3,300, and 21,000 total refueling stations respectivelylxxxv.
Source: California Fuel Cell Partnership
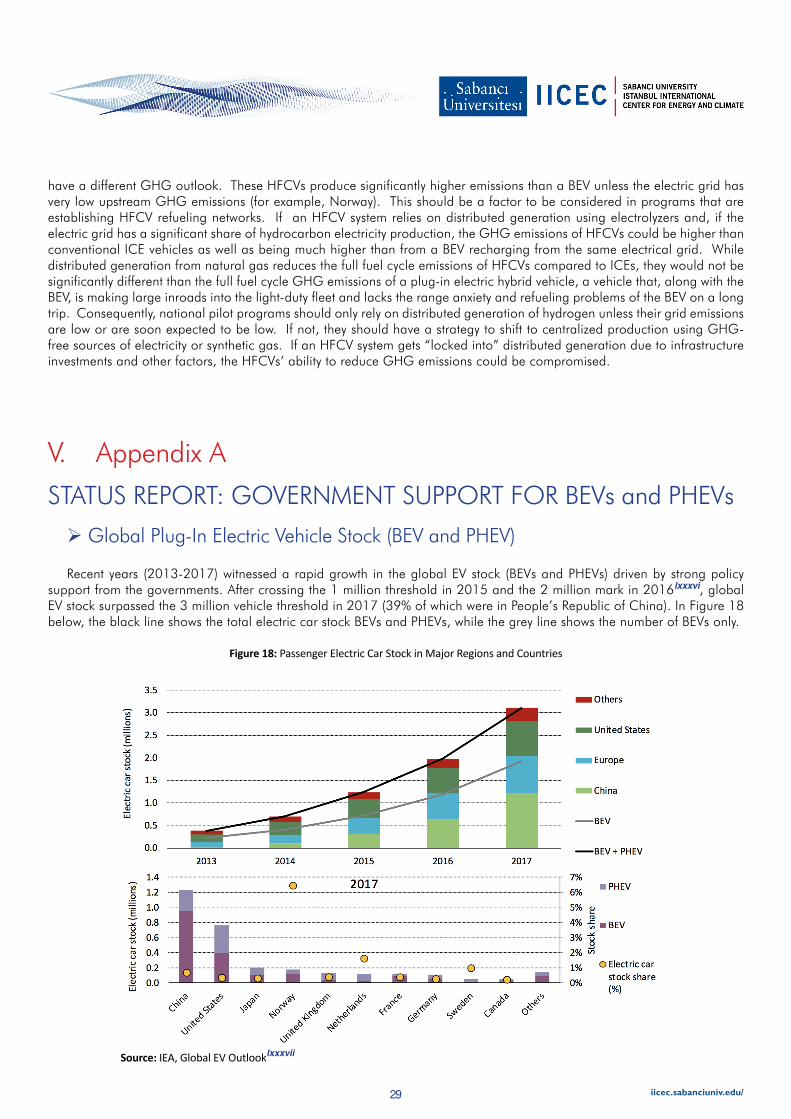
29 iicec.sabanciuniv.edu/
have a different GHG outlook. These HFCVs produce significantly higher emissions than a BEV unless the electric grid has very low upstream GHG emissions (for example, Norway). This should be a factor to be considered in programs that are establishing HFCV refueling networks. If an HFCV system relies on distributed generation using electrolyzers and, if the electric grid has a significant share of hydrocarbon electricity production, the GHG emissions of HFCVs could be higher than conventional ICE vehicles as well as being much higher than from a BEV recharging from the same electrical grid. While distributed generation from natural gas reduces the full fuel cycle emissions of HFCVs compared to ICEs, they would not be significantly different than the full fuel cycle GHG emissions of a plug-in electric hybrid vehicle, a vehicle that, along with the BEV, is making large inroads into the light-duty fleet and lacks the range anxiety and refueling problems of the BEV on a long trip. Consequently, national pilot programs should only rely on distributed generation of hydrogen unless their grid emissions are low or are soon expected to be low. If not, they should have a strategy to shift to centralized production using GHG-free sources of electricity or synthetic gas. If an HFCV system gets “locked into” distributed generation due to infrastructure investments and other factors, the HFCVs’ ability to reduce GHG emissions could be compromised.
Figure 18: Passenger Electric Car Stock in Major Regions and Countries
V. Appendix A
STATUS REPORT: GOVERNMENT SUPPORT FOR BEVs and PHEVs
Recent years (2013-2017) witnessed a rapid growth in the global EV stock (BEVs and PHEVs) driven by strong policy support from the governments. After crossing the 1 million threshold in 2015 and the 2 million mark in 2016lxxxvi, global EV stock surpassed the 3 million vehicle threshold in 2017 (39% of which were in People’s Republic of China). In Figure 18 below, the black line shows the total electric car stock BEVs and PHEVs, while the grey line shows the number of BEVs only.
Global Plug-In Electric Vehicle Stock (BEV and PHEV)
Source: IEA, Global EV Outlooklxxxvii

30 iicec.sabanciuniv.edu/
China:
Chinese government (China from now on) uses the term New Energy Vehicles (NEVs) for BEVs, HFCVs, and PHEVs. China issued a New Energy Vehicle mandate in 2017 that took effect in 2018; setting a minimum requirement for the car industry regarding the production of new energy vehicles. According to this new requirement, a minimum range requirement for BEVs, HFCVs and PHEVs are 100km, 300km and 50km respectivelyxc. The mandate pressures and fosters BEV manufacturing companies, to have a driving range over 300 km via ‘more incentives for more range’. This pressure might help to the production of BEVs that would have longer ranges and be more likely to travel inter-city distances.
Since 2009, China has been the world’s largest automotive market; a total of 28.88 million cars were sold (~25 million being passenger cars) in 2017xci. In China, the number of electric cars on the road surpassed 1 million in 2017, making up ~40% of the total (global) electric car fleetxcii. With these numbers China remains unchallenged; the sales of BEVs and PHEVs was 605,500 in 2017 (Figure 19 belowxciii). For 2018, the sales expectation for BEVs and PHEVs sales was 920,000 units (passenger cars, 82 % of them BEVs and 18 % PHEVs).
Despite high growth rates, however, when the total number is considered, global EV stock represents approximately 0.5% of the total number of more than 1 billion light-duty vehicles worldwide by end of 2018, with ~5 million electric vehicles by the end of 2018lxxxviii. China holds the largest electric car stock 39% of the global total, US represents 25% and Europe 23%lxxxix. Compared to BEVs, as a general trend, the market share of the PHEVs is increased in the EU and US, while there has been a contrary trend in China; the BEV / PHEV mix has been trending towards BEV since the last 2 years.
Sales in China, USA, and EU
The increase in sales naturally necessitates infrastructure deployment. According to Beijing Municipal Commission, “the number of public charging points for electric vehicles in China grew by 51% year-on-year to 214,000 in 2017, and just over double that, around 450,000, if private charging points are counted. Over 110,000 electric vehicle charging poles have been installed in Beijing alone and over 40% of Beijing’s residential areas are equipped with charging facilities. This leaves China with the largest number of public NEVs charging stations in the world”xcv. For private chargers, IEA cites Zheng (2018); there were 232,000 private chargers in 2017xcvi , which is in line with the figure of Beijing Municipal Commission.
Figure 19: Annual BEV and PHEV Sales in China (Commercial Vehicles and Passenger Cars)
Source: IEV Volumes websitexciv

31 iicec.sabanciuniv.edu/
USA:
After China, the USA is the 2nd largest country for sales of BEVs and PHEVs, with sales increasing consistently. 122,000 electric vehicles have been delivered in the first half of 2018xcvii. End of 2018 sales is expected to be 350,000. In the transition to vehicle electrification in the US, California is the leading state. In the US, BEV and PHEV sales remain concentrated in few states: Almost 50 % of USA sales are in California12 (50% BEV and 50% PHEV)xcviii, and rest of the sales are concentrated in specific states.
In January 2018, California Governor signed an executive order to increase the supply of zero-emission vehicles (ZEVs)13
and charging and refueling stations, calling for a new target of 5 million ZEVs in California by 2030c. Additionally, a new eight-year initiative is proposed. With this initiative ($2.5 billion) 250,000 vehicle (BEV and PHEV)) charging stations and 200 hydrogen fueling stations is planned to be brought to California by 2025ci. 10,000 of the 250,000 charging stations is planned to be DC fast chargerscii. (California is leading in the roll-out scenarios for both BEVs and HFCVs, and California’s HRS Roll-Out Scenarios will be provided as a case at the end of this section). California’s population is ~12% of the total US population, yet residents purchased more than half (50%) of all the EVs sold in the US in 2016, and this pace continued in the preceding yearsciii.
lEuropean Union (EU):
The total share of BEVs and PHEVs was only around 0.3% in 2017 in the EU, compared to the total stock of passenger carsciv. This number presents the current state of play. According to the Communication from the European Commission, “for electric vehicles, the Impact Assessment for Directive 2014/94/EU had considered a conservative benchmark of 4 million electric vehicles on the road by 2020”cv, which represents a strong increase compared to 2017, corresponding to approximately only 1.5 % of today’s vehicle stock (256 million vehicles on the roads in the EU today). This requires infrastructure investment needs up to EUR 904 million by 2020 by the Member States, according to the Commission.
BEVs and PHEVs sales numbers in Europe were 307.400 units in the passenger cars and light commercial vehicles categories) in 2017, 39% higher than for 2016. BEVs composed 51%, and the PHEVs composed 49% of the 2017 sales volume. After Norway, the German market was a flourishing market in 2017, with a 108% increase over 2016cvi.
A more rapid increase of electric vehicles, leading to a share of 7% in 2025, would necessitate 440.000 publicly accessible recharging points by 2020 (requiring investment into publicly accessible recharging points of up to EUR 3.9 billion) and by 2025, approximately 2 million publicly-accessible recharging points would be neededcvii. According to European Commission’s communication document, there were 118.000 publicly accessible recharging points for BEVs (and 82 refueling points for hydrogen vehicles) available as of September 2017 in the EU, and only Netherlands and Denmark could provide more than 100 recharging points for electric vehicles per 100.000 city inhabitantscviii.
12 “According to the Auto Alliance’s ZEV tracker, nearly 50 % of USA plug-in EV sales are in California, 12 % are in other states with ZEV
mandates and 38 % are outside the 10 states with ZEV mandates”. 13 Zero Emission Vehicles (ZEVs) include BEVs, PHEVs and HFCVs.
Figure 20: Annual BEV and PHEV Sales in USA (Commercial Vehicles and Passenger Cars)
Source: EV Volumes websitexcix

32 iicec.sabanciuniv.edu/
Figure 21: Annual BEV and PHEV Sales in the EU (Commercial Vehicles and Passenger Cars)
BEV and PHEV deployment has mostly driven by government policies such as national targets, regulations, and incentives. These have been used by many countries during the development of the electric vehicle market. National targets set a significant policy tool and aim at informing the public on direction setting to achieve specific desired outcomes and to support achievements. Table 8 below summarizes “Announced National Targets” 14 for BEVs and PHEVs (2020-2030)cx.
Country or Region Announced Country Targets 2020-30 (BEV and PHEV)
China
l5 million EVs by 2020, including 4.6 million passenger light-duty vehicles (LDVs), 0.2 million buses and 0.2 million trucks.lNew Energy Vehicle (NEV)15 mandate: 12% NEV credit sales ofpassenger cars by 2020.lNEV sales share: 7-10% by 2020, 15-20% by 2025 and 40-50% by 2030.
European Union (EU)
lPost 2020 proposed CO2 targets for cars and vans include benchmarks: 15% EV sales by 2025 and 30% by 2030.lEuropean Commission requested from its member governments to set deployment targets for infrastructure for 2020, 2025 and 2030cxi. The ratio of one publicly accessible EV charging station per ten cars is expected to be achieved by 2020cxii.
Finland l250 000 EVs by 2030.
France lObjectives under revision.
Indial30% electric car sales by 2030.l100% BEV sales for urban buses by 2030.
Ireland l500 000 EVs and 100% EV sales by 2030.
Japan l20-30% electric car sales by 2030.
Netherlandsl10% electric car market share by 2020.l100% EV sales in passenger LDVs by 2030.l100% electric public bus sales by 2025 and 100% electric public bus stock by 2030.
New Zealand l64 000 EVs by 2021.
BEV Government Policy Support
14 Source: IEA Global EV Outlook 2018 and IICEC.15 In China “New Energy Vehicles” include BEVs, PHEVs and HFCVs.
Table 8: Announced Country Targets 2020-2030 (BEV and PHEV)
Source: EV Volumes websitecix

33 iicec.sabanciuniv.edu/
Additionally, ten states (Canada, China, Finland, France, India, Japan, Mexico, Netherlands, Norway, Sweden) that represent over 60% of the global electric car stock, established a multi-governmental policy forum, The Electric Vehicles Initiative (EVI) in 2009cxiii. United States, United Kingdom, Germany, New Zealand, Norway, Portugal, and Chile also joined this initiative that is dedicated to accelerate the deployment of electric vehicles worldwide. These major-economy states collectively set the goal of a 30% market share for electric vehicles (in the total of all vehicles) by 2030 at the Eighth Clean Energy Ministerial in 2017 . Most of these states were among the most rapidly growing electric vehicle (BEV and PHEV) markets worldwide in 2017.
Countries use various types of incentives to stimulate the uptake of BEVs and PHEVs; such as direct rebates (financial purchase subsidies) to facilitate the acquisition, restrictions on ICE vehicles, free-parking advantages, tax breaks (i.e. reduced purchase tax, reductions in registration tax) and/or tax exemptions, reduction or exemption from road tax and free charging points have been effective in the rapid growth of sales. Generally, incentive policies have an extensive variability to cover in detail in this paper. However, the role of major incentives is to support the consumers and to make BEVs and PHEVs an attractive option in the market. Table 9 below summarizes incentives provided by governments.
Table 9: Government Incentives for Electric Vehicles (BEVs and PHEVs)
Norwayl100% EV sales in passenger LDVs, light commercial vehicles (LCVs) and urban buses by 2025.
l75% EV sales in long-distance buses and 50% in trucks by 2030.
Korea l200 000 EVs in passenger LDVs by 2020.
Slovenia l100% electric car sales by 2030.
United Kingdom l396 000 to 431 000 electric cars by 2020.
United States (selected states)
l3 300 000 EVs in eight states combined by 202516.lZero Emission Vehicle (ZEV) mandate in ten states17: 22% ZEV credit sales in passenger cars and light-duty trucks by 2025.lCalifornia: 1.5 million ZEVs and 15% of effective sales by 2025, and 5 million ZEVs by 2030.
Other European Union (EU)
l450 000 to 760 000 electric cars by 2020.l5.42 million to 6.27 million electric cars by 2030
Government Incentives for Electric Vehicles (BEVs and PHEVs)
China
lTrial program to provide incentives up to ~US$9.500 for private purchase of BEVs and ~US$7.500 for PHEVs. Shanghai, Shenzhen, Hangzhou, Hefei and Changchun participated to the program. (2011)
lTax exemption for NEVs introduced in 2012.
lNew mandate: Subsidies raised for NEVs that meet additional range requirements (2017, effective as of 2018).
lChina raised subsidies for electric vehicles meeting additional range requirements in February 2018; incentives for EVs with at least 400 km of range increased from 44,000 yuan to 50,000 yuan according to the Finance Ministry18, while vehicles with less than 150 km of range were eliminated for qualifying for an incentivecxv.
lFree charging at public stations provided (i.e. Shanghai)
16 California, Connecticut, Maryland, Massachusetts, New York, Oregon, Rhode Island, Vermont.17 Eight above-cited States plus Maine and New Jersey, who joined in 2016. ZEVs also include HFCVs.18 According to the Statement of the Ministry (China), with the new rules that went into effect in February, subsidies were also cut (by varying
degrees) for cars with a driving range of less than 300 kilometers. With this regulation, China is pressuring the OEMs to produce electric cars with
more range.
Source: IEA, Global EV Outlook 2018

34 iicec.sabanciuniv.edu/
Source: Governments’ Declarations and various sources given in the endnotes.
19 The European Green Cars Initiative is one of the three Public Private Partnerships included in the European Economic Recovery Plan.
India
lMinistry of New and Renewable Energy (MNRE) announced subsidy levels for manufacturers (2010, ended 2012.)
lIndian government announced a new plan to provide subsidies for BEVs and PHEVs with the aim of 7 million EVs on the road by 2020.
lBased on COP21 (The Paris Accord), Indian government has set deadline for “Only Electric Vehicle (BEVs) Manufacturing” by 2030. “Make in India” policy. No subsidy or incentive for hybrids and imported vehicles. New framework released in 2017.
Japan
l”Green Vehicle Purchasing Promotion Measure” program went into effect (2009). Program established tax reductions and exemptions and included purchasing subsidies consumers purchasing a new passenger car without trade-in (non-replacement program), and for those consumers buying a new car trading a used car registered 13 years ago or earlier.
lConsumers purchasing new next generation BEVs and HFCVs benefit from a 50% reduction of the annual automobile tax.
European Union
lElectrification of transport (electromobility) is a priority in the Community Research Programmecxvi.
lThe Green Car Initiative (GCI) included in the European Economic Recovery Plan19 supports Electrification of Transport (“electromobility”) project on EVs and related infrastructure with a total budget of around €50 million as part of the Green Car Initiative (2008).
lThe Directorate-General for Mobility and Transport supports a large European “electromobility” demonstration project on electric vehicles and related infrastructure with an EC contribution of around € 24 million as part of the Green Car Initiative.
United States
lThe federal government and a number of states offer financial incentives, including tax credits for BEVs.
lThe purchaser of a new BEV receives an income tax credit from $2,500 to $7,500 where the amount of credit depends on the size of the vehicle and its battery capacitycxvii.
lThis tax credit phases out for each manufacturer when 200,000 qualified EVs are sold in the United States. No manufacturers have been phased out yetcxviii.
France
lEUR 4,000- 7,000 premium (one-time grant)
lReduced toll and parking fees
lFree parking, exempt from road and registration tax, access to bus lanes
Spain
l25% (up to EUR 6,000) off
lUp to 75% road tax reduction
lFree parking in regulated areas
lFree charging at road-side stations, hotels and university (for e-bikes)
Netherlands
lEUR 5,000 / 10,000 / 40,000 for passenger car / taxi / truck
lFor taxis: EUR 5,000 subsidy for taxi given by municipality, EUR 5,000 by government
lNo waiting list for parking permits
l4 parking garages with free charging
lExempt from registration tax and annual circulation tax

35 iicec.sabanciuniv.edu/
The number of publicly available fast and slow charging points show significant variations across different countries, “China has approximately three-quarters of the world’s publicly accessible fast chargers and a major part of the slow chargers” as can be seen in (Figure 23) the pie-chart below. In 2017, number of publicly accessible (slow charger equipped) charging stations were 318.000, and the number of fast charger stations was 112.000cxix. In both types of chargers, China is followed by Japan and United States, as can be seen below.
The rapid growth of the BEVs and PHEVs necessitate the deployment of an extensive network of practical and economically viable charging infrastructure. This is essential to enable long-distance driving of BEVs and for the uptake of BEVs by the consumers. China, the European Union, and the United States have increased their efforts to install fast-charging facilities along highways with minimum distance targets in between EV charging stations being 45 km, 60 km and 115 km, respectively for each country as shown (with black spots) in Figure 22. Hence, the target is deploying an EV charging station for major highways at an interval of 45 kms-115 kms. On the other side, the left axis shows the target number of highway charging stations, ~400 for China, ~500 for EU, and ~950 for the US.
BEV Infrastructure
Source: IEA, Global EV Outlook 2018cxxx
Figure 23: Electric Car Stock and Publicly Accessible Charging Outlets by Type and Country
Figure 22: Number of Highway Charging Stations and Distribution Targets in Selected Regions
Source: IEA, Global EV Outlook 2018
36 iicec.sabanciuniv.edu/
VI. List of Abbreviations
BEV Battery Electric Vehicle
CaFCP California Fuel Cell Partnership
CAPEX Capital Expenditure
CARB California Air Resources Board
CCS Carbon Capture and Storage
COP 21 21st Conference of the Parties to UN Framework Convention on Climate Change
CO2 Carbon Capture and Storage
CO2e Carbon dioxide equivalents
EPA Environmental Protection Agency
EVI Electric Vehicles Initiative
GCI Green Car Initiative
GHG Greenhouse gases
HFCV Hydrogen Fuel Cell Vehicle
HRS Hydrogen Refueling Station
H2 Hydrogen
ICE Internal Combustion Engine
IEA International Energy Agency
IRENA International Renewable Energy agency
LDV Light Duty Vehicle
NREL National Renewable Energy Laboratory
OEM Original Equipment Manufacturers
OPEX Operating Expenditure
PEC Photoelectrochemical
PEMFC Polymer Electrolyte Membrane Fuel Cell
PHEV Plug-in Hybrid Electric Vehicle
PV Photovoltaic
SMR Steam Methane Reforming
VRE Variable Renewable Energy
UN United Nations
WTW Well-to-Wheel
ZEV Zero-Emission Vehicle

37 iicec.sabanciuniv.edu/
VII. References
i Comparative analysis of battery electric, hydrogen fuel cell and hybrid vehicles in a future sustainable road transport system, G.J.Offer, D. Howey, M.Contestabile, R. Clague, N.P. Brandon, Energy Policy 38, (2010), 24.
ii Natural gas as a bridge to hydrogen transportation fuel: Insights from the literatre, Joan Ogden, Amy Myers Jaffe, Daniel Scheitrum, Zane McDonald, Marshall Miller, Energy Policy, 115 (2018), pg. 317.
iii Assessing the progress toward lower priced long range battery electric vehicles, Björn Nykvist, Frances Sprei, Mans Nilsson, Energy Policy 123 (2019), pgs. 144-155.
iv IEA Energy Technology Perspectives 2017, pg.84.
v IEA Statistics, CO2 emissons from fuel combustion, Highlights, 2017, pg.14. https://www.iea.org/publications/freepublications/publication/CO2EmissionsfromFuelCombustionHighlights2017.pdf
vi IEA World Energy Outlook, WEO 2017, pg.153.
vii IEA ETP 2014, in ITS UCDavis Institute for Transportation Studies, Research Report – UCD-ITS-RR-18-07, Prospects for Hydrogen in the Future Energy System, March 2018, John M. Ogden, pg.5.
viii Roadmap to a Single European Transport Area—Towards a Competitive and Resource Efficient Transport System COM; 144 Final, 28/3/2011; European Commission: Brussels, Belgium, 2011.
ix International Energy Agency, https://www.iea.org/publications/freepublications/publication/ETP2014_free.pdf
x The hydrogen economy – Vision or reality?, Ball, Michael ; Weeda, Marcel, International Journal of Hydrogen Energy, 6 July 2015, Vol.40(25), pp.790, ibid., pg.7905
xi Federal Highway Administration, https://www.fhwa.dot.gov/policyinformation/statistics/2015/pdf/vm1.pdf
xii Hydrogen refueling station infrastructure roll-up, an indicative assessment of the commercial viability and profitability, Iordache, Ioan ; Schitea, Dorin ; Iordache, Mihaela, International Journal of Hydrogen Energy, 23 February 2017, Vol.42(8), pg.4722
xiii California Air Resources Board, 2017 Annual Evaluation of, Fuel Cell Electric Vehicle Deployment and Hydrogen Fuel Station Network Development, August 2017, pg. 27.
xiv https://www.energylivenews.com/2019/06/19/bp-and-japans-itochu-among-new-firms-joining-hydrogen-council/
xv Hydrogen Council, Hydrogen Scaling Up, pg. 27.
xvi IEA, The Future of Hydrogen, Seizing today’s opportunities, Report prepared by IEA fort he G20, Japan, June 2019. pg. 126.
xvii http://www.fuelcellcars.com/bmw-promises-fuel-cell-car-in-the-early-2020s/
xviii IHS Markit, https://ihsmarkit.com/research-analysis/ihs-forecasts-fcev-production-to-reach-69000-upa-by-2027.html
xix https://www.reuters.com/article/us-gm-honda-idUSKBN15B2EK , and, Why Fuel Cells Help Meet State Policy Goals, FCHEA Presentation. https://www.naseo.org/Data/Sites/1/events/regional/northeast/2017/FCHEA--Fuel-Cells.pdfand Press Release https://www.honda.ca/newsdetails/nca/en/news/release/GM-Honda-to-Collaborate-on-NextGeneration-Fuel-Cell-Technologies
xx Hydrogen Council, Hydrogen Scaling Up, pg. 29.
xxi Developments of Electric cars and Fuel Cell Hydrogen Electric Cars, Wilberforce, Tabbi et al., International Journal of Hydrogen Energy 42 (2017), 25695-25734.
xxii Economic prospects and policy framework for hydrogen as fuel in the transport sector, Amela Ajanovic, Reinhard Haas, Energy Policy 123 (2018), pg. 286.
xxiii Ibid.
xxiv Japanese Government Official Website, https://www.japan.go.jp/_src/217878/spring15_30-31.pdf
xxv DOE, https://www.energy.gov/eere/articles/5-fast-facts-about-hydrogen-and-fuel-cells
xxvi Wand G. Fuel Cell History, Part One, pg.14 in Y. Wang, K. S. Chen, J. Mishler, S. C. Cho, and X. C. Adroher, “A review of polymer electrolyte membrane fuel cells: Technology, applications, and needs on fundamental research,” Applied Energy, vol. 88,
38 iicec.sabanciuniv.edu/
no. 4, pp. 981–1007, 2011.
xxvii Y. Wang, K. S. Chen, J. Mishler, S. C. Cho, and X. C. Adroher, “A review of polymer electrolyte membrane fuel cells: Technology, applications, and needs on fundamental research,” Applied Energy, vol. 88, no. 4, pp. 981–1007, 2011, pg. 982.
xxviii H2 Mobility Europe, https://h2me.eu/about/fcevs/
xxix IEA Hydrogen, Global Trends and Outlook for Hydrogen, December 2017, pg.9.
xxx https://www.hyundaiusa.com/nexo/index.aspx
xxxi ITS UCDavis Institute for Transportation Studies, Research Report – UCD-ITS-RR-18-07, Prospects for Hydrogen in the Future Energy System, March 2018, John M. Ogden
xxxii IEA Renewable Energy Technology Deployment (RETD), Non-individual transport – Paving the way for renewable power-to-gas (RE-P2G), Sector Analysis and Policy Recommendation, July 2016, pg.34.
xxxiii The cost of diesel ICE vehicles was deemed constant from 2015 to 2030.
xxxivMcKinsey, “A portfolio of power-trains for Europe: a fact-based Analysis,” 2010, Christopher Yang, Michael Nicholas and Lew Fulton Joan Ogden, “The Hydrogen Transition,” UC Davies Institute of Transportation Studies, 2014, Anna Creti et al., “Defining the Abatment Cost in Presence of Learning-by-doing: Application to the Fuel Cell Electric Vehicle,” Ecole Polytechnique, Universite Paris Dauphine, INRA-UR1303 ALISS, CNRS, 2015.
xxxv Argonne National Laboratory, Fuel Cell Powered Vehicles: An Analysis of How Technology Progress Affects the Technical and Economic Feasibility, Ram Vijayagopal, Namdoo Kim and Aymeric Rousseau, May 2017. ANL-17/07.
xxxvi Fuel Economy Guide, Model Year 2019, DOE, EPA, Office of Energy Efficiency and Renewable Energy.
xxxvii IEA, World Energy Outlook, 2018.
xxxviii IRENA, Hydrogen from Renewables, 2018, pg.28.
xxxix California Fuel Cell Partnership, https://cafcp.org/content/cost-refill
xl https://ev-database.org/cheatsheet/range-electric-car
xli Fuel Economy Guide, Model Year 2019, DOE, EPA, Office of Energy Efficiency and Renewable Energy
xlii http://www.influitenergy.com/the-spectrum-of-ev-battery-chemistries/
xliii http://www.influitenergy.com/the-spectrum-of-ev-battery-chemistries/
xliv DOE, Fuel Cell Technologies Office Multi-Year Research, Development, and Demostration Plan, Section 3.4, Table 3.4.3, page.17 https://www.energy.gov/sites/prod/files/2017/05/f34/fcto_myrdd_fuel_cells.pdf and,https://www.energy.gov/eere/fuelcells/downloads/fuel-cell-technologies-office-multi-year-research-development-and-22
xlv https://newatlas.com/nissan-doubles-power-density-with-new-fuel-cell-stack/20156/
xlvi The social-economic-environmental impacts of recycling retired EV batteries under reward-penalty mechanism, Yanyan Tang, Qi Zhang, Yaoming Li, Hailong Li, Xunzhang Pan, Benjamin Mclellan, Applied Energy 251 (2019) 113313, pg.1.
xlvii https://www.hydrogen.energy.gov/safety.html
xlviii IEA, The Future of Hydrogen, Seizing today’s opportunities, Report prepared by IEA fort he G20, Japan, June 2019. pg.126.
xlix http://www.iea.org/tcep/energyintegration/hydrogen/
l IEA 2015 and EPRI 2016 (Electric Power Research Institute), “Hydrogen Energy Systems Development in Europe”, 2016.
li IEA, World Energy Outlook, 2018, pg. 508.
lii IEA, World Energy Outlook, 2018, pg. 508.
liii http://ieahydrogen.org/pdfs/2018_Summer_Newsletter_WEB-(4).aspx
liv https://www.pv-tech.org/news/dewa-and-siemens-start-work-on-solar-powered-hydrogen-production-facility
lv https://www.greencarcongress.com/2019/02/20190201-solarh2.html
lvi https://www.energy.gov/eere/fuelcells/hydrogen-tube-trailers
lvii Ibid.

39 iicec.sabanciuniv.edu/
lviii DOE (2016) Report to Congress: “As of 2016, California has more than 20 commercial fueling stations and approximately 30 additional stations planned for 2017, which will support more than 10,000 HFCVs (CEC/CARB 2015)”, Valuation of Energy Security for the United States, Report to the Congress, Washington DC, January 2017, pg.40.
lix California Air Resources Board, 2018 Annual Evaluation of Fuel Cell Electric Vehicle Deployment & Hydrogen Fuel Station Network Development, July 2018, pg.3. https://www.arb.ca.gov/msprog/zevprog/ab8/ab8_report_2018_print.pdf
lx IRENA, Hydrogen from Renewables, 2018. https://www.iea.org/newsroom/news/2017/april/producing-industrial-hydrogen-from-renewable-energy.html
lxi Based on USDOE Argonne GREET Model Data, 2017.
lxii The Future of Trucks, Implications for energy and the environment, IEA 2017, pg.18-19.
lxiii World Energy Outlook 2018.
lxiv https://nikolamotor.com/press_releases/nikola-launches-stunning-truck-for-european-market-53
lxv https://newsroom.toyota.co.jp/en/corporate/23722307.html
lxvi IEA, The Future of Hydrogen, Seizing today’s opportunities, Report prepared by IEA fort he G20, Japan, June 2019. pg.125.
lxvii Hydrogen Council, Hydrogen Scaling Up, pg.37.
lxviii McKinsey, 2017. https://www.mckinsey.com/industries/automotive-and-assembly/our-insights/hydrogen-the-next-wave-for-electric-vehicles
lxix IEA, Global EV Outlook 2018, pg.41.
lxx IEA, http://www.iea.org/tcep/energyintegration/hydrogen/
lxxi H2 Mobility Live, https://h2.live/en
lxxii Shell International Website, https://www.shell.com/media/news-and-media-releases/2015/shell-to-install-nationwide-network-hydrogen-vehicle-fuelling-pumps-germany.html
lxxiii IEA, http://www.iea.org/tcep/energyintegration/hydrogen/
lxxiv J. Sampson, “French Minister unveils €100m hydrogen plan”, Gasworld, 1 June 2018. https://www.gasworld.com/french-minister-unveils-100m-hydrogen-plan/2014840.article in California Air Resources Board, 2018 Annual Evaluation of Fuel Cell Electric Vehicle Deployment & Hydrogen Fuel Station Network Development, July 2018, pg.6.
lxxv Adopted from National Implementation Plan, Hydrogen Refuelling Infrastructure Belgium, December 2015.
lxxvi Hydrogen Council, Hydrogen Scaling Up, p.40.
lxxvii Hydrogen refueling station infrastructure roll-up, an indicative assessment of the commercial viability and profitability, Iordache, Ioan ; Schitea, Dorin ; Iordache, Mihaela, International Journal of Hydrogen Energy, 23 February 2017, Vol.42(8), pg.4722.
lxxviii California Air Resources Board, 2018 Annual Evaluation of Fuel Cell Electric Vehicle Deployment & Hydrogen Fuel Station Network Development, July 2018, pg.vi.
lxxix https://cafcp.org/sites/default/files/February-2018-Retail-H2-Fueling-Station-Network-Update.pdf
lxxx California Air Resources Board, 2018 Annual Evaluation of Fuel Cell Electric Vehicle Deployment & Hydrogen Fuel Station Network Development, July 2018, pg.xi.
lxxxi The California Fuel Cell Revolution, A Vision for Advancing Economic, Social, and Environmental Priorities, by the California Fuel Cell Partnership, July 2018.
lxxxii Ibid., pg.vii.
lxxxiii Retail Hydrogen Fueling Station Network Update, Joe Gagliano & Ben Xiong, February 15, 2018, California Fuel Cell Partnership
lxxxiv https://www.nrel.gov/docs/fy18osti/67401.pdf
lxxxv H2USA, “National Hydrogen Scenarios,” 2017.
lxxxvi IEA, Global EV Outlook 2018, pg.9.
lxxxvii Ibid., pg.19.
lxxxviii http://www.ev-volumes.com/news/global-plug-in-vehicle-sales-for-2017-final-results/

40 iicec.sabanciuniv.edu/
lxxxix IEA, Global EV Outlook 2018.
xc Ibid, pg.24.
xci Yang Frank, Goldmann Mattias, Lagercrantz Jakob, Sustainable Mobility The Chinese Way, Exakta Print, Malmö, Sweden, 2018, pg.38. (Data from China Association of Automobile Manufacturers).
xcii IEA, Global EV Outlook 2018, ibid.
xciii Plug-in passenger cars delivered from January to December. http://www.ev-volumes.com/country/china/
xciv http://www.ev-volumes.com
xcv Sustainable Mobility The Chinese Way, Yang Frank, Goldmann Mattias, Lagercrantz Jakob, Exakta Print, Malmö, Sweden, 2018, pg.33.
xcvi IEA, Global EV Outlook 2018, pg.45.
xcvii http://www.ev-volumes.com/country/usa/
xcviii http://evadoption.com/wp-content/uploads/2017/06/US-EV-Sales-Share-By-State-2016.png
xcix http://www.ev-volumes.com/country/usa/
c Office of Governor, https://www.gov.ca.gov/2018/01/25/governor-brown-delivers-2018-state-of-the-state-address-california-is-setting-the-pace-for-america/
ci Office of Governor, https://www.gov.ca.gov/2018/01/26/governor-brown-takes-action-to-increase-zero-emission-vehicles-fund-new-climate-investments/
cii IEA, Global EV Outlook 2018, pg.48.
ciii International Council on Clean Transportation (ICCT), EVAdoption, California & Electric Vehicles By The Numbers, http://evadoption.com/california-evs-by-the-numbers-20-statistics-that-might-surprise-you/
civ European Parliament, Research for TRAN Committee - Charging Infrastructure for Electric Road Vehicles, Policy Department for Structural and Cohesion Policies, Directorate General for Internal Policies of the Union, June 2018, pg.11.
cv Communication from the Commission to the European Parliament, The Council, The European Economic and Social Committee and the Committee of the Regions, Towards the Broadest Use of Alternative Fuels - An Action Plan on Alternative Fuels Infrastructure under Article 10(6) of Directive 2014/94/EU, including the Assessment of National Policy Frameworks under Article 10(2) of Directive 2014/94/EU, Brussels, 30.11.2017. pg.4.
cvi http://www.ev-volumes.com/country/total-euefta-plug-in-vehicle-volumes-2/
cvii Ibid.
cviii European Parliament, Research for TRAN Committee - Charging Infrastructure for Electric Road Vehicles, Policy Department for Structural and Cohesion Policies, Directorate General for Internal Policies of the Union, June 2018, pg.11.
cix http://www.ev-volumes.com/country/total-euefta-plug-in-vehicle-volumes-2/.
cx IEA, Global EV Outlook 2018, p.34-35.
cxi Based on the Alternative Fuels Infrastructure Directive of the European Commission, AFI 2014, Directive 2014/94/EU of the European Parliament and of the Council of 22 October 2014 on the Deployment of Alternative Fuels Infrastructure
cxii IEA, Global EV Outlook 2018, pg.48.
cxiii Ibid., p.15.
cxiv Ibid., p.16.
cxv https://www.bloomberg.com/news/articles/2018-02-13/china-raises-subsidies-to-reward-longer-traveling-electric-cars
cxvi https://www.bloomberg.com/news/articles/2018-02-13/china-raises-subsidies-to-reward-longer-traveling-electric-cars
cxvii https://www.energy.gov/eere/electricvehicles/electric-vehicles-tax-credits-and-other-incentives
cxviii https://www.irs.gov/businesses/plug-in-electric-vehicle-credit-irc-30-and-irc-30d
cxix IEA, Global EV Outlook 2018, p.10.
cxx IEA, Global EV Outlook 2018, pg.46.


![IICEC Energy Market Newsletter 2[2]...NEWSLETTER IICEC Energy Market Newsletter May 28, 2019 No:2 GLOBAL ENERGY INVESTMENT STABILIZED AFTER 3 YEARS OF DECLINE TURKEY’S RENEWABLES](https://static.fdocuments.us/doc/165x107/5f0964687e708231d4269e4e/iicec-energy-market-newsletter-22-newsletter-iicec-energy-market-newsletter.jpg)