
Hydrogen for Energy Storage Analysis Overview …. Scenarios for Hydrogen Energy Storage Analyses....
19
NREL is a national laboratory of the U.S. Department of Energy, Office of Energy Efficiency and Renewable Energy, operated by the Alliance for Sustainable Energy, LLC. Hydrogen for Energy Storage Analysis Overview National Hydrogen Association Conference & Expo Darlene Steward, Todd Ramsden, Kevin Harrison National Renewable Energy Laboratory May 3-6, 2010 Long Beach, CA NREL/PR-560-48360 This presentation does not contain any proprietary, confidential, or otherwise restricted information
-
Upload
truongngoc -
Category
Documents
-
view
228 -
download
3
Transcript of Hydrogen for Energy Storage Analysis Overview …. Scenarios for Hydrogen Energy Storage Analyses....

NREL is a national laboratory of the U.S. Department of Energy, Office of Energy Efficiency and Renewable Energy, operated by the Alliance for Sustainable Energy, LLC.
Hydrogen for Energy Storage Analysis Overview
National Hydrogen Association Conference & Expo
Darlene Steward, Todd Ramsden, Kevin Harrison
National Renewable Energy Laboratory
May 3-6, 2010
Long Beach, CA
NREL/PR-560-48360
This presentation does not contain any proprietary, confidential, or otherwise restricted information

2National Renewable Energy Laboratory Innovation for Our Energy Future
ObjectivesCompare hydrogen and competing technologies for utility-scale energy storage systems.
Explore the cost and GHG emissions impacts of interaction of hydrogen storage and variable renewable resources
OutlineStudy FrameworkPreliminary Study Results
– Lifecycle cost analysis for hydrogen and competing technologies
– GHG emissions credit impact for a remote wind farmNREL Wind to Hydrogen Study Perspectives
Hydrogen Energy Storage System Modeling
2

3
Scenarios for Hydrogen Energy Storage Analyses
National Renewable Energy Laboratory Innovation for Our Energy Future3
BatteryElectricity
Pump/Compressor/Turbine
Electricity
Air or Water Reservoir
?Is hydrogen a potential solution for utility-scale energy storage
Shed electricity
?How would using hydrogen for storage impact cost and emissions for renewable resources Hydrogen
Storage
Shed electricity
Comparison of costs for hydrogen and competing technologies
Study of hydrogen energy storage for a specific renewable resource

4
Energy Storage Scenario for Comparison Study
Nominal storage volume is 300 MWh (50 MW, 6 hours)o Electricity is produced from the storage system during 6 peak hours (1 to 7 pm)
on weekdayso Electricity is purchased during off-peak hours to charge the system
Electricity source: excess wind/off-peak grid electricity o Assumed steady and unlimited supply during off-peak hours (18 hours on
weekdays and 24 hours on weekends)o Assumed fixed purchase price of off-peak/renewable electricity
Source: HOMER model output
National Renewable Energy Laboratory Innovation for Our Energy Future
5
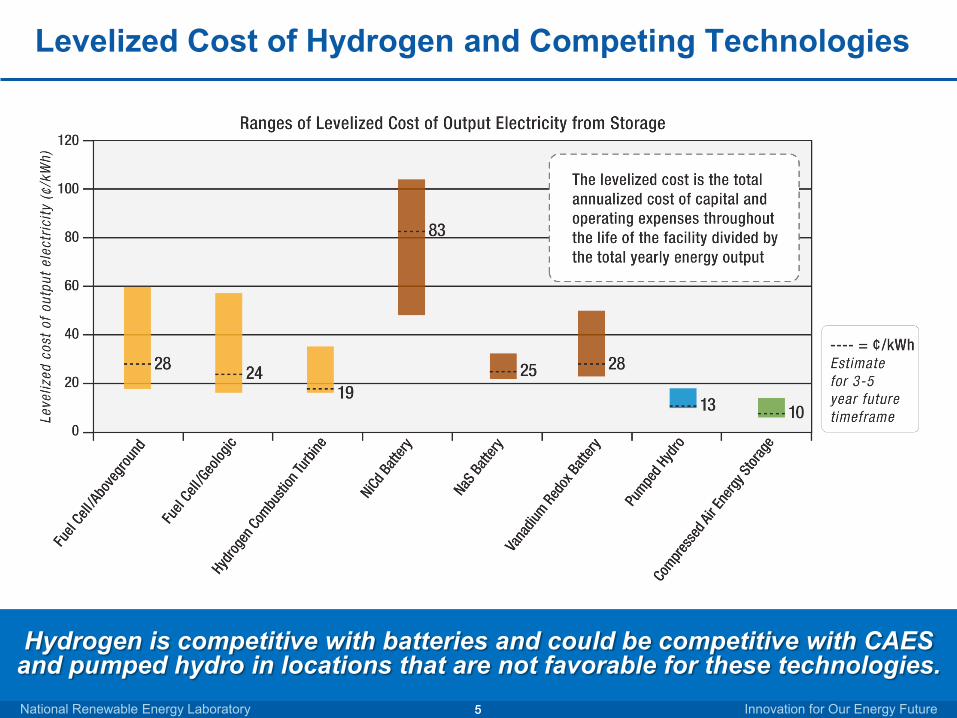
Levelized Cost of Hydrogen and Competing Technologies
Hydrogen is competitive with batteries and could be competitive with CAESand pumped hydro in locations that are not favorable for these technologies.National Renewable Energy Laboratory Innovation for Our Energy Future5

6National Renewable Energy Laboratory Innovation for Our Energy Future
Round-Trip Efficiency and Electricity Price Sensitivity
• Electricity price sensitivityo Low-capital-cost, high-efficiency pumped hydro system is sensitive to electricity priceo High-capital-cost NiCd system is insensitive to electricity priceo For other storage systems, sensitivity to electricity price is roughly inversely
proportional to round-trip efficiency
NiCd battery
CAES
FC abovegroundPumped hydro
FC/geologicH2 Comb turbine
NaS batteryVR battery
0.00%
2.00%
4.00%
6.00%
8.00%
10.00%
12.00%
14.00%
0.0% 10.0% 20.0% 30.0% 40.0% 50.0% 60.0% 70.0% 80.0% 90.0%
Storage System Round-Trip Efficiency
Elec
trici
ty P
rice
Sens
itivi
ty (%
cha
nge
in
LCE/
c)
National Renewable Energy Laboratory Innovation for Our Energy Future
7National Renewable Energy Laboratory Innovation for Our Energy Future
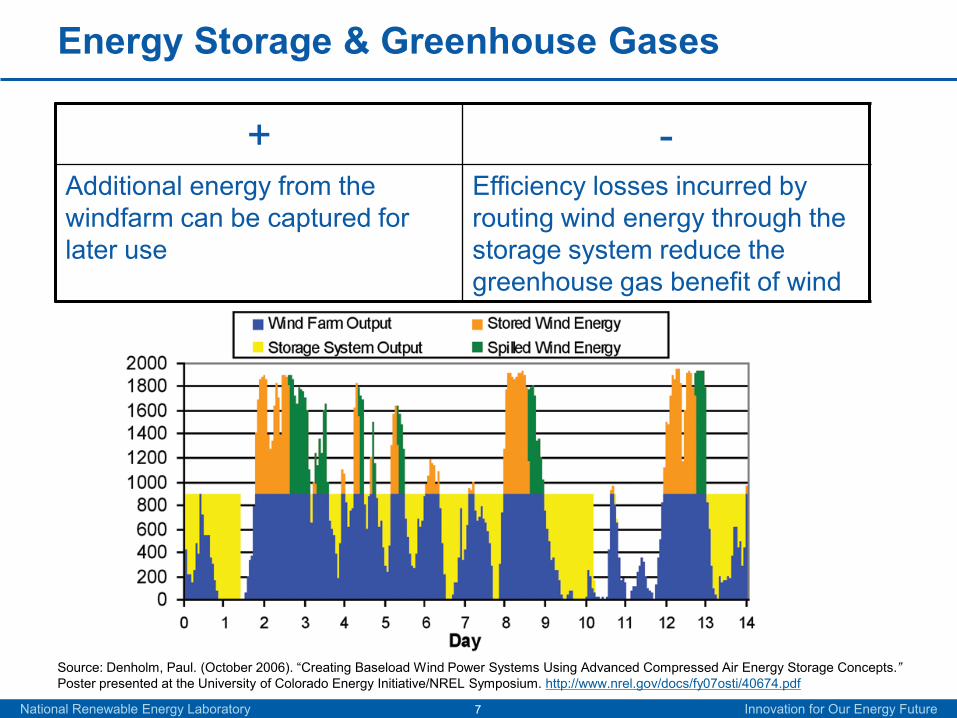
Energy Storage & Greenhouse Gases
Source: Denholm, Paul. (October 2006). “Creating Baseload Wind Power Systems Using Advanced Compressed Air Energy Storage Concepts.” Poster presented at the University of Colorado Energy Initiative/NREL Symposium. http://www.nrel.gov/docs/fy07osti/40674.pdf
+ -Additional energy from the windfarm can be captured for later use
Efficiency losses incurred by routing wind energy through the storage system reduce the greenhouse gas benefit of wind

8
Wind Farm Location
8National Renewable Energy Laboratory Innovation for Our Energy Future
The NREL Western Wind Data Set was used to identify a realistic
remote wind farm location

9
Study Framework - Add Hydrogen Storage to a Base Case Without Storage
National Renewable Energy Laboratory Innovation for Our Energy Future
750 MW
Hydrogen Storage400 MT
Curtailed electricity
2%
Electricity to grid (storage + direct)87% of total wind farm output
Storage Constrained CaseElectricity to storage16% of total wind farm outputElectricity from storage5% of total output
500MW
Hydrogen Storage2,600 MT
Curtailed electricity
12%
(storage + direct)68% of total wind farm output
Transmission Constrained Case
Electricity to storage27% of total wind farm outputElectricity from storage7% of total output
Curtailed electricity
17%
Electricity to grid83%
750 MW
Base Case (without storage)
9National Renewable Energy Laboratory Innovation for Our Energy Future
Analysis of the base case provides LCOE and avoided emissions for comparison
10National Renewable Energy Laboratory Innovation for Our Energy Future
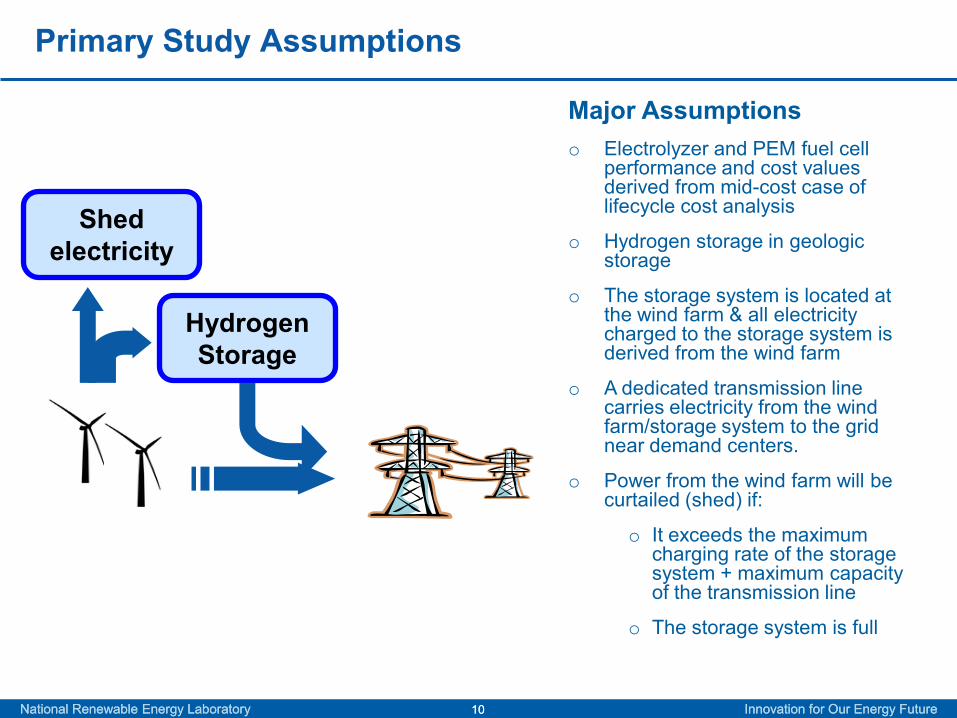
Primary Study Assumptions
Major Assumptionso Electrolyzer and PEM fuel cell
performance and cost values derived from mid-cost case of lifecycle cost analysis
o Hydrogen storage in geologic storage
o The storage system is located at the wind farm & all electricity charged to the storage system is derived from the wind farm
o A dedicated transmission line carries electricity from the wind farm/storage system to the grid near demand centers.
o Power from the wind farm will be curtailed (shed) if:
o It exceeds the maximum charging rate of the storage system + maximum capacity of the transmission line
o The storage system is full
National Renewable Energy Laboratory Innovation for Our Energy Future
Hydrogen Storage
Shed electricity
10

11National Renewable Energy Laboratory Innovation for Our Energy Future
Wind Farm and Hydrogen Storage for Storage Constrained Case - Hydrogen to Storage
National Renewable Energy Laboratory Innovation for Our Energy Future11
0
5,000
10,000
15,000
20,000
25,000
30,000
1/2/0
6
2/2/0
6
3/2/0
6
4/2/0
6
5/2/0
6
6/2/0
6
7/2/0
6
8/2/0
6
9/2/0
6
10/2/0
6
11/2/0
6
12/2/0
6
Ener
gy (M
Wh/
day)
Electricity From Wind (kW)
Hydrogen to Storage (kW)

12National Renewable Energy Laboratory Innovation for Our Energy Future
Wind Farm and Hydrogen Storage for Storage Constrained Case - Hydrogen from Storage
National Renewable Energy Laboratory Innovation for Our Energy Future12
0
5,000
10,000
15,000
20,000
25,000
30,000
1/2/0
6
2/2/0
6
3/2/0
6
4/2/0
6
5/2/0
6
6/2/0
6
7/2/0
6
8/2/0
6
9/2/0
6
10/2/0
6
11/2/0
6
12/2/0
6
Ener
gy (M
Wh/
day)
Electricity FromWind (kW)Hydrogen fromStorage (kW)

13
Summary of Preliminary Results
National Renewable Energy Laboratory Innovation for Our Energy Future
Storage reduces the amount of electricity that must be curtailed and reduces the LCOE
Base Case Storage Constrained
Transmission Constrained
Electricity Direct from Wind Farm to Transmission Line
82.7 82.7 60.8
Electricity from Storage N/A 4.5 7.4Electricity Shed 17.3 1.9 11.7Net Electricity to Transmission Line
82.7 87.2 68.2
Transmission Line Utilization 56.0 59.0 69.0
Without cost of carbon 13 10 12@ cost of carbon $50/MT CO2eq
9 6 8
@ cost of carbon $100/MT CO2eq
5 2 4
(% of Total Wind Farm Output)
(% of Total Transmission Line Capacity)
(LCOE ¢/kWh)
13National Renewable Energy Laboratory Innovation for Our Energy Future

14
Effect of a Cost of Carbon on the Competitiveness of Wind & Hydrogen Storage System
Cost comparison for Chicago Grid Electricity v Wind Electricity for Various Storage Configurations
National Renewable Energy Laboratory Innovation for Our Energy Future
0
2
4
6
8
10
12
14
16
0 50 100
Cost
of
Elec
tric
ity
c/kW
h
Cost of Carbon $2008/MT CO2eq
Chicago grid
Base case wind
Transmission constrained wind
Storage constrained wind
Credit for avoided emissions reduces LCOE for wind electricity below grid price
14

15
NREL Wind to Hydrogen Project - 10kW Wind Turbine Powered Electrolysis• Initial tests with third generation power electronics, wind speed
measurement and control algorithm indicate further improved energy capture of wind electricity into hydrogen production
0
2000
4000
6000
8000
10000
12000
14000
0 5 10 15 20 25 30 35 40
Wind Speed (MPH)
Pow
er (W
atts
)
Gen 2 – DC Power Gen 1 – DC Power
Planned increased energy capture from
Gen 2 to Gen 3
Increased energy capture from Gen 1
to Gen 2
Available wind power= Preliminary results
showing increased energy capture with new TSR algorithm. Algorithm is currently being tuned for stability.

16
Cost Analysis
• Cost analysis performed based on NREL’s power electronics optimization and testing and on our electrolyzer cost analysis study
• Large centralized system capable of 50,000 kg per day production
• Optimized power conversion system due to a closer coupling of the wind turbine to the electrolyzer stack can reduce the total cost of hydrogen by 7%.
Capital Component (uninstalled) Baseline System
Optimized System
1.5 MW Wind Turbine
Rotor $248,000 $248,000
Drive Train $1,280,000 $1,180,000
including power electronics $100,000 $0
Control System $10,000 $10,000
Tower $184,000 $184,000
Balance of Station $262,000 $262,000
2.33 MW Electrolyzer $1,570,000 $1,350,000
including power electronics $220,000 $0
New Power Electronics Interface $0 $70,000
Resulting Hydrogen Cost ($/kg) $6.25 $5.83

17
Key Findings from Wind2H2 RD&D
System Efficiency (HHV): At rated stack current…– The PEM electrolyzer system efficiency of 57% – The alkaline system had a system efficiency of 41%
• H2 production about 20% lower than the manufacturer’s rated flow rate• 50% system efficiency would be realized if rated flow were achieved
Cost Reductions from Power Electronics Optimization:– Analysis showed a potential 7% reduction in cost per kg of
hydrogen based on capital cost improvement• Projected cost of hydrogen falling to $5.83/kg from a baseline of
$6.25/kg
Energy Transfer Improvements: PV configuration testing compared direct-connection to the electrolyzer stack with a connection through power electronics– The MPPT power electronics system captured between 10% and
20% more energy than the direct-connect configuration

18National Renewable Energy Laboratory Innovation for Our Energy Future
Thank You
Questions?

19
Thank You
National Renewable Energy Laboratory Innovation for Our Energy Future19
Darlene [email protected]