Hydrodynamic Models of Port Phillip Bay
143
ISSN 1039-3218 Hydrodynamic Models of Port Phillip Bay S. J. Walker CSIRO Marine Research Castray Esplanade, Hobart, Tasmania, Australia GPO Box 1538, Hobart 7001 Australia Technical Report No. 38 Port Phillip Bay Environmental Study CSIRO Environmental Projects Office Building 9, Forestry Site, Banks Street Yarralumla, ACT, Australia
Transcript of Hydrodynamic Models of Port Phillip Bay

ISSN 1039-3218
Hydrodynamic Modelsof
Port Phillip Bay
S. J. WalkerCSIRO Marine Research
Castray Esplanade, Hobart, Tasmania, Australia
GPO Box 1538, Hobart 7001 Australia
Technical Report No. 38
Port Phillip Bay Environmental StudyCSIRO Environmental Projects OfficeBuilding 9, Forestry Site, Banks Street
Yarralumla, ACT, Australia

PO Box 225, Dickson, ACT 2602 Australia
February 1997
1

Contents
1 Introduction 5
2 Model Inputs 6
2.1 Bathymetry . . . . . . . . . . . . . . . . . . . . . . . . . . . . 6
2.2 Sea-level . . . . . . . . . . . . . . . . . . . . . . . . . . . . . . 7
2.3 Freshwater . . . . . . . . . . . . . . . . . . . . . . . . . . . . . 9
2.3.1 Rainfall . . . . . . . . . . . . . . . . . . . . . . . . . . 9
2.3.2 Evaporation . . . . . . . . . . . . . . . . . . . . . . . . 10
2.3.3 Yarra River . . . . . . . . . . . . . . . . . . . . . . . . 11
2.3.4 Eastern rivers, creeks and drains . . . . . . . . . . . . . 11
2.3.5 Western Treatment Plant . . . . . . . . . . . . . . . . 12
2.3.6 Western rivers, creeks and drains . . . . . . . . . . . . 13
2.4 Wind . . . . . . . . . . . . . . . . . . . . . . . . . . . . . . . . 14
2.5 Atmospheric pressure . . . . . . . . . . . . . . . . . . . . . . . 14
2.6 Salinity . . . . . . . . . . . . . . . . . . . . . . . . . . . . . . 15
2.7 Heat . . . . . . . . . . . . . . . . . . . . . . . . . . . . . . . . 15
2.7.1 Solar radiation . . . . . . . . . . . . . . . . . . . . . . 16
2

2.7.2 Wind . . . . . . . . . . . . . . . . . . . . . . . . . . . . 16
2.7.3 Air temperature . . . . . . . . . . . . . . . . . . . . . . 16
2.7.4 Humidity . . . . . . . . . . . . . . . . . . . . . . . . . 17
2.7.5 Evaporation . . . . . . . . . . . . . . . . . . . . . . . . 17
2.7.6 Cloud cover . . . . . . . . . . . . . . . . . . . . . . . . 18
2.7.7 Bass Strait temperature . . . . . . . . . . . . . . . . . 18
2.8 Bottom friction parameters . . . . . . . . . . . . . . . . . . . . 19
2.9 Mixing parameters . . . . . . . . . . . . . . . . . . . . . . . . 19
3 Model Calibration 20
3.1 Elevation . . . . . . . . . . . . . . . . . . . . . . . . . . . . . 21
3.2 Velocities . . . . . . . . . . . . . . . . . . . . . . . . . . . . . 22
3.2.1 Martha Point . . . . . . . . . . . . . . . . . . . . . . . 23
3.2.2 Great Sands . . . . . . . . . . . . . . . . . . . . . . . . 24
3.2.3 Central Bay . . . . . . . . . . . . . . . . . . . . . . . . 25
3.2.4 Point Cook . . . . . . . . . . . . . . . . . . . . . . . . 25
3.2.5 Red Bluff . . . . . . . . . . . . . . . . . . . . . . . . . 26
3.3 Salinity and Temperature . . . . . . . . . . . . . . . . . . . . 26
3

4 Model Validation 27
4.1 Elevation . . . . . . . . . . . . . . . . . . . . . . . . . . . . . 28
4.2 Velocities . . . . . . . . . . . . . . . . . . . . . . . . . . . . . 29
4.2.1 Martha Point . . . . . . . . . . . . . . . . . . . . . . . 30
4.2.2 Schnapper Point . . . . . . . . . . . . . . . . . . . . . 31
4.2.3 Central Bay . . . . . . . . . . . . . . . . . . . . . . . . 31
4.2.4 Point Cook . . . . . . . . . . . . . . . . . . . . . . . . 32
4.2.5 Red Bluff . . . . . . . . . . . . . . . . . . . . . . . . . 32
4.3 Salinity and Temperature . . . . . . . . . . . . . . . . . . . . 33
5 Long term simulations - Transport model inputs 34
6 Summary 35
7 Acknowledgements 36
References 37
A Harmonic analyses of currents 39
Figures 40
4

1 Introduction
This report describes the development, calibration, validation andapplication of hydrodynamic models of Port Phillip Bay. These modelswere developed as part of the Port Phillip Bay Environmental Study P8task. The main purpose of developing these models was to provide detailedinformation on the movement of water around the Bay. This informationwas fed into the Transport and Ecological models of the Bay to form theso-called Integrated model (Technical Reports 39 and 44 - Walker andSherwood 1997 and Murray and Parslow 1997) - a model of the Bay whichwas developed to describe the physics and ecology of the Bay at a widerange of time and space scales.
A prime requirement was a hydrodynamic model which realisticallyrepresented the longer term (predominantly wind driven) circulationswithin the Bay, as well as representing the slow exchange between the Bayand Bass strait. In order to be able to provide climatologically realisticsimulations, it was also necessary that the model was capable of performingvery long model runs (simulations of the order of five to ten years) in arealistic time frame. As well, the model output needed to be in a formsuitable for use by the Transport model.
A number of hydrodynamic models of the Bay were implemented duringthe course of the study. The models were fully three-dimensional,non-linear and included density effects. Horizontal model resolutionsranged from 500m to 3000m. Vertical resolution was generally set to 2m.Most simulations were performed using a model with 1000m horizontalresolution, and this report concentrates on that model. The model wascalibrated against data obtained during the May 1994 field program, andwas validated against data obtained during the September 1994 fieldprogram. This report describes the models used to provide the long termhydrodynamic simulation data for the Bay. At the time of writing thisreport, runs had been performed to simulate the period 1 July 1990 to 30June 1995. Some other model development, calibration and validation isalso described in Lawson and Treloar Pty Ltd (1995).
5

The hydrodynamic models provided three-dimensional distributions ofvelocity, temperature and salinity, given input fluxes of water, salt, heatand and forcing by winds, atmospheric pressure gradients and sea-levelvariations. As well, the models included a large number of ‘particles’ whichwere tracked in a Lagrangian manner to provide the exchange inputsrequired by the Transport model.
The model code used in this study is a three dimensional, non-linear,variable density, hydrodynamic model developed by CSIRO in Hobart. Itprovides three dimensional distributions of velocity, temperature andsalinity as well as concentrations of passive tracers given input fluxes ofwater, salt, heat and passive tracers, and forcing by winds, atmosphericpressure gradients and tides. The equations forming the basis of the modelare similar to those described in Blumberg and Herring (1987) , except thatthe model uses so-called ‘z’ coordinates in the vertical to better representstratified flows. The equations are solved using finite-difference techniqueson a C-type grid (see for example Mesinger and Arakawa, 1976) . Themodel is described in more detail in Walker and Fandry (1993).
2 Model Inputs
2.1 Bathymetry
The model covers the entire Bay, plus a region of Bass Strait just outsidethe Bay which was included to allow a reasonable representation ofexchange between the Bay and Bass Strait. Figure 1 shows the 1000mresolution model grid and the locations of sites at which various field datawere obtained.
Bathymetric data was obtained in digital form from the Royal AustralianNavy Hydrographic Office. These data were obtained from survey datarelating to charts AUS 143, 154, 155, 157 and 158. Depths were obtained at3419 locations, covering the Bay and a narrow strip of northern Bass Strait
6

adjacent to the Bay. Data were adjusted so that all depths were referencedto mean sea level rather than chart datum.
These data were averaged within each model cell. Depths for cells with nodata were set by interpolating, using a weighted nearest neighbourtechnique, from surrounding cells. It was necessary to modify some of themodel bathymetry in the Rip and the Sands area manually, in order toadequately represent the rather narrow and deep channels in those areas.The model was quite sensitive to these changes, particularly with regard totidal elevations and tidal currents. A number of runs were done todetermine the bathymetry which allowed the most accurate representationof tides in the Bay.
For the 1000m resolution grid, there were 3 cells across the Rip, so that thevery complex bathymetry there was not well represented. Modelbathymetry was set there to maintain the cross-sectional area of the Rip(about 38000m2, from Black and Mourtikas (1992) - Technical Report 3).Some smoothing of the bathymetry in Bass Strait immediately outside theRip was done, in order to improve the stability of the model. Tidal currentsreach several metres per second in this area, causing large vertical velocitieswhich constrain the model time step, regardless of horizontal resolution.
Vertically, the model grids had 25 layers, with uniform resolution of 2m ineach layer. The maximum depth in the models was 50 metres. This slightlytruncated the actual bathymetry in Bass Strait near the south-westernboundary, but had negligible effects on model results (some preliminaryruns were done without truncated bathymetry).
2.2 Sea-level
The open boundary of the model was forced by specifying elevations fromobserved sea level data at Lorne, about 60 km along the Victorian coast tothe south-west of the Bay. Sea-level data for Lorne were obtained by thestudy from the National Tidal Facility (NTF), covering the period 1993 to
7
1995.
In order to provide forcing data prior to 1993 (when Lorne observationswere not available) sea-levels were synthesised by combining tidal levelscalculated from the M2, S2, K1 and O1 harmonic constituents for Lorne(calculated by the NTF) with residual (low-pass filtered) sea-levels observedat Point Lonsdale. Point Lonsdale data was obtained from the NTF, for theperiod 1985 to 1995. Although not entirely accurate, this procedure doescapture the main characteristics of the tidal signal, and reproduces lowfrequency changes in sea-level well. Raw Point Lonsdale sea-level data isnot suitable for forcing the model, as it comes from an area where there arevery rapid spatial changes in tidal amplitudes, and where the observedsignal is strongly affected by the dynamics of the energetic tidal currentsthrough the Rip.
In preliminary runs, the models were forced with hourly data, linearlyinterpolated in time. This was observed to give a noisy model response inthe Bass Strait part of the model. This effect is probably due to anartificial seiche between the coast and the model boundary, with a periodnear to 1 hour and hence excited by the hourly sampling frequency of thedata. This effect was completely eliminated by re-sampling the tidal datato 15 minute resolution, using a smooth spline technique.
A depth-averaged 4km resolution model of Bass Strait (previouslydeveloped at CSIRO Oceanography) was used to estimate the phase speedof the tidal signal along the model boundary in Bass Strait. Tidalelevations along the boundary were then specified as those at Lorne,delayed by a time which depended on the distance from a specified point.This attempted to correct both for the fact that Lorne is located somedistance to the southwest of the model, and for the propagation of the tidalsignal along the boundary.
As well as the sea-levels and phase correction described above, a slope wasimposed on the south-eastern open boundary (the more ’cross-shore’boundary in Bass Strait). This imposed slope was proportional to the netflow through that boundary times the Coriolis parameter.
8
2.3 Freshwater
Freshwater forcing for the models consisted of data describing rainfall,evaporation, and flow data for the major rivers, creeks and drains. Thesedata were obtained primarily from the Bureau of Meteorology, theVictorian EPA and Melbourne Water.
All freshwater inputs (rain and flows from rivers, creeks and drains) wereassumed to have zero salinity, and a temperature variation corresponding tothe seasonal air temperature observed over the Bay (between about 9.5 and18.5 degrees C). The inputs from rivers, creeks and drains were located inthe model grid at the cells nearest their actual locations around the Bay.Rainfall and evaporation were applied over the surface of the Bay accordingto their observed distributions.
The various freshwater inputs are described in more detail in the followingsections.
2.3.1 Rainfall
Rainfall data were obtained from a number of sources during the study. Forthe purposes of modelling, rainfall data were required on a uniform gridcovering the Bay. Due to the lack of data from gauges located on the Bay(only Hovell Pile, 1994-1995), rainfall data were interpolated from sites onland surrounding the Bay. Such data were obtained from both theVictorian EPA, and the Bureau of Meteorology. These two data sets werevery similar, with small differences probably due to slight differences inchoice of sites and interpolation techniques.
In all, 14 sites were used to provide rainfall coverage over the Bay. Aninverse distance weighted interpolation scheme was used to calculaterainfall on a uniform 10km resolution grid covering the Bay, for the period1985 to 1995. This data was used as model input. As an example of thisdata, Figure 2 shows total annual rainfall over the Bay for 1994, together
9

with the sites for which data was obtained. Figure ?? shows a time-series of(spatial mean) rainfall over the Bay for the period 1990 to 1995.
2.3.2 Evaporation
Evaporation is only recorded at two stations in the Melbourne area, bothon land and to the north of the Bay (Hunter 1992). For input to thephysical models, data describing hourly evaporation from the Bay surfacewas obtained from the Victorian EPA, covering the years 1985 to 1994, andthe first half of 1995. The data was located on a 10km resolution grid,calculated from wind speed, air and water temperature and relativehumidity, using a method described in World Meteorological OrganisationTechnical Note No. 83 - ’Measurement and estimation of evaporation andevapotranspiration’.
When used by both the hydrodynamic models and transport models (seeTechnical Report 39 - Walker and Sherwood 1997), these calculatedevaporation rates led to predictions of salinity in the Bay which were higherthan observed values. A problem with the evaporation calculation is that itis highly sensitive to the humidity value used. Unattended measurement ofhumidity for extended periods is a difficult task, particularly over water,and so the humidity (and hence evaporation) values obtained by the studyneed to be treated with some caution. Better comparisons betweenobserved and modelled salinities was obtained when the evaporation valueswere reduced by about 30% (or rainfall increased by about 60%, which isalmost equivalent as far as the models are concerned - an importantdifference being that rainfall and evaporation appear to exhibit differentspatial patterns over the Bay). A somewhat arbitrary experiment was doneto reduce the evaporation values by re-doing the calculation with a slightlyhigher, constant, humidity of 80%. By comparison, average humidity atLaverton, calculated from an 11 year record of wet and dry bulbtemperatures, was 74% (Section 2.7.4). This recalculation led tosignificantly better agreement between modelled and measured salinities.Further investigation of the fresh-water budget of the Bay is warranted, butis considered beyond the scope of this report.
10

2.3.3 Yarra River
Flow data for the Yarra River and some of its tributaries were obtained aspart of the catchment modelling work done for the PPBES by the VictorianInstitute of Marine Science (VIMS). Data were obtained for the sites andperiods shown in Table 1.
Site PeriodYarra River (Chandler Highway) 1975-1995Maribyrnong River (Keilor) 1980-1995Gardiners Creek 1980-1995Merri Creek 1980-1995Moonee Ponds Creek 1990-1995
Table 1: Flow data for the Yarra river and its tributaries.
The long term mean flow at the Yarra mouth for the period January 1980to October 1995 is about 21m3/s. There is substantial variability, bothseasonal and from year to year. Figure 4 shows flows at the mouth of theYarra over the period 1990 to 1995. Note the large ‘seasonal’ events,particularly towards the ends of 1992 and 1993, and the lack of any suchevent in 1994.
2.3.4 Eastern rivers, creeks and drains
Flow data for rivers, creeks and drains on the eastern side of the Bay wereobtained as shown in Table 2.
Data for the Patterson River/Mordialloc creek system were obtained aspart of the catchment modelling work undertaken by VIMS. These dataincorporate the effects of a simple algorithm which takes into account theflow diversion which occurs in this system. Dandenong and Eumemmerringcreeks were not directly used in the modelling of the Bay, as their flows areincluded in data for the Patterson River/Mordialloc creek system
11

Site PeriodDandenong creek 1994Eumemmerring creek 1994Mordialloc creek 1988 - 1994Patterson river 1988 - 1994Elsternwick MD 1990 - Feb 1994
Table 2: Flow data for the main eastern inputs to the Bay
For modelling purposes, data was required for the entire period covering1985 to 1995. Where data was not available, it was synthesised as follows:
• Mordialloc creek: Mean flow of 2.24m3/s was used.
• Patterson River: Correlation against total Yarra flow was used. Therelationship found was Patterson = 0.1663 Yarra + 0.406, with an rsquared value of 0.42. The correlation is not good, and mainly arisesfrom seasonal variations in the flows. Correlations with various Yarratributaries and with rainfall were also explored, but all fitted morepoorly than that shown above.
• Elwood Canal (Elsternwick): Mean flow of 0.18 m3/s was used.
Mean flows and correlations quoted above were calculated over the entireperiod where data was available.
Figure A shows flow in the Patterson River for the period 1990 to 1995.Note the change in nature of the data in 1995, where correlation with theYarra river was used. Data for this year has recently become available, andshould be used for any future model runs.
2.3.5 Western Treatment Plant
Inputs of fresh water enter the Bay from the Western Treatment Plant viafour outlets (15E, 145W, Lake Borrie and Murtcaim). These outlets are
12

located over about 10km of coastline on the western side of the Bay. Flowdata for these outlets were obtained from Melbourne Water for the period1980 - 1995. Data was also obtained for a fifth outlet (Little River), whichceased operation in 1989. All five outlets were included as model inputs,distributed in the model grid according to their locations along the coast.
Figure ?? shows total flow from the Western Treatment Plant for theperiod 1990-1995. A clear seasonal signal is present, but on an annual basis,flow rates have remained fairly constant in the past 6 years. Thedistribution of flows has changed, however, with increased flow from the15E outlet, and decreased flows from other outlets. Note that changes inthe flow data sampling frequency are also apparent in Figure ??.
2.3.6 Western rivers, creeks and drains
Data for two further sources of fresh water were obtained by the study, asshown in Table 3.
Site PeriodWerribee river 1993 - May 1995Kororoit creek 1993 - Feb 1994
Table 3: Flow data for western rivers and creeks.
Neither of these inputs showed significant flows apart from a single event inSeptember 1993, when flows peaked at over 300m3/s in the Werribee river,and over 60m3/s in Kororoit creek. At most other times flows in both ofthese systems was less than 0.5m3/s. This makes it essentially impossible toextend these data sets to cover the period 1985 to 1995 in a realistic way.No correlation with rainfall was found. In the end, to fill periods wheredata was not available, flows were set to the low values of 0.25m3/s for theWerribee river, and 0.20m3/s for Kororoit creek. The model thus does notshow effects of flood events which may have occurred in these systems priorto 1993.
13

2.4 Wind
Wind data over the Bay were provided by the Victorian EPA, interpolatedfrom observations at 3 sites within the Bay (Hovell Pile, Point Wilson andFawkner Beacon) and one site on land (Point Cook - a well exposed sitewith a long record of observations).
Correlations between points on the Bay and Point Cook were calculated forperiods when all sites were available, and these correlations were used tocalculate Bay-wide winds when only Point Cook data were available. Theend results of this process were continuous hourly wind data on a 10kmresolution grid covering the entire Bay for the period 1985 to 1995.
Potential problems with this data set are that there is no source of winddata from any point near the main (central) body of the Bay, and that formuch of the period the data is from a single site. There will undoubtedlybe times when the wind varies strongly from place to place on the Bay(during local storms, and the passage of fronts, for example). During suchtimes, the winds used to force the model are unlikely to be realistic, and sothe ability of the model to reproduce circulation patterns in the Bay will becompromised.
In order to calculate the stress exerted by the wind on the water surface inthe models, the formulation of Large and Pond (1981) was used.
2.5 Atmospheric pressure
Atmospheric pressure affects sea-level (the inverse barometer effect).However, the Bay is much smaller than the typical length scales associatedwith atmospheric pressure gradients, and differences across the Bay arelikely to be very small. The effect on sea-level is incorporated in theobserved sea-level values prescribed at the model open boundary in BassStrait. As a result, it was not necessary to include spatial or temporalvariations in atmospheric pressure as an explicit model input.
14

2.6 Salinity
As stated above, the salinity of all freshwater inputs was assumed to bezero. As well, salinity needs to be specified at the model open boundary inBass Strait. In the absence of measurements in Bass Strait during thestudy, data extracted from surveys conducted by VFRI were used to setBass Strait boundary conditions for the model. These data were obtainedfrom a site near the Rip (the N1F site), where measurements were madeduring the flood tide to minimise the influence of Bay waters. Examinationof these data showed that the salinity varied little from a value of 35.4, andso that value was used as the Bass Strait boundary salinity for all modelruns.
Initial salinity fields for model runs were obtained by interpolating (in bothspace and time) the underway salinity observations collected by VFRIroughly monthly throughout the study. The water column was assumed tohave uniform salinity with depth, except in Hobsons Bay, where the profilefrom VFRI site 9 was used to guide the model initialisation. For modelruns simulating periods which started prior to the study (before aboutmid-1993), initial salinities were interpolated from the VFRI fortnightlystations known as sites 1, 4, 6, 9, 11 and 13 (see Technical Report 24 -Longmore et al., 1996). A dummy site reproducing the properties of site 11was also added near Point Cook, to limit the area of influence of site 9(which is situated in Hobsons Bay, and so strongly affected by the Yarra).
2.7 Heat
In order to model changes in water temperature in the Bay, bulk formulaewere used to calculate surface heat fluxes (see Gill (1982) for example).These formulae required the data sets described below.
15

2.7.1 Solar radiation
Hourly total solar radiation (TSR) data was obtained from the VictorianEPA for sites at Brighton (1994-1995) and Dandenong (1995). Half-hourlyTSR data was also obtained from the Bureau of Meteorology for a site atLaverton, covering the period January 1985 to February 1994. These datasets were combined to give hourly coverage of the period 1985 to 1995,using mostly Laverton data, and Brighton data to cover the last part of theperiod. Small gaps (less than about 4 hours) were filled by linearinterpolation. There were some larger gaps, which were filled withcalculated clear sky TSR values (using a maximum solar input at normalincidence of 1200 W/m2, a value chosen to give a good match betweencalculated and observed values).
When applying the TSR data in the model, the albedo of the water surfacewas set to 0.2, and the attenuation coefficient of light with depth was set to0.2m−1. These values were chosen to best match the observed Bay watertemperature during 1994 (see Section 5 and Figure 97).
2.7.2 Wind
Wind data, as described previously, were used in the calculation of sensibleheat flux, according to Gill (1982).
2.7.3 Air temperature
Air temperature is also needed in the calculation of sensible heat flux. Datawere obtained from Victorian EPA sites at Frankston and Point Wilson,and from measurements at Hovell Pile. Data were also obtained from theBureau of Meteorology for sites at Melbourne, Moorabbin and Laverton forthe period 1985 - 1995. For the purposes of driving the hydrodynamicmodel, air temperature observed over the Bay waters is most desirable.
16

However, data from Hovell Pile were only available for a period of 1 year,with significant gaps. Much longer records were available at the land-basedBureau of Meteorology sites (Laverton, Melbourne and Moorabbin). Thesesites showed a larger diurnal cycle than that observed at Hovell Pile. Apartfrom this obvious difference, however, these sites, particularly Laverton andMoorabbin, show similar behaviour to the records from Hovell Pile. As aresult, data from Laverton and Moorabbin were lightly low-pass filtered toreduce the amplitude of the diurnal cycle to that seen at Hovell Pile. Thedata from the two sites was then averaged to provide the long term airtemperature time series used to drive the model.
2.7.4 Humidity
For the purposes of the surface heat flux (and assuming evaporation isalready known) humidity is needed in the radiative heat flux terms.Humidity data were obtained from Victorian EPA sites at Frankston andPoint Wilson, and from measurements at Hovell Pile. The Hovell Pile datacontained many gaps, and was not considered to be reliable. The EPAVdata spanned 1990 to 1993, and also contained numerous gaps. As a result,humidity values used by the model were calculated from dry and wet-bulbtemperature records from Bureau of Meteorology sites at Laverton. Overthe eleven year period 1985 to 1995, the calculated humidity at Lavertonhad a mean value of 74.0% and a standard deviation of 16.4%.
2.7.5 Evaporation
Heat loss due to evaporation was calculated using the evaporation datadescribed in Section 2.3.2.
17

2.7.6 Cloud cover
Cloud cover affects the radiative heat flux terms. Because observed TSRvalues were used, they were not further modulated by cloud cover valuesinside the model. However, the long-wave radiative heat flux term didinclude the effects of cloud cover. Three hourly cloud cover data wereobtained from the Bureau of Meteorology for sites at Melbourne,Moorabbin and Laverton for the period 1985 - 1995. There were large gapsin the data for Moorabbin and Laverton, so that the Melbourne data wasused as model input, applied uniformly across the Bay. This is obviously afairly coarse approximation.
2.7.7 Bass Strait temperature
Again, in the absence of measurements in Bass Strait during the study,data extracted from surveys conducted by VFRI at the N1F site (the Rip,flood tide) were used to set Bass Strait temperature boundary conditionsfor the model. Temperatures show a clear seasonal fluctuation, rangingfrom about 12.5C to 18.0C (during the measurement period from March1994 to March 1995). These data were used for all model runs, with thedata repeated in an annual cycle to provide conditions for years where therewere no measurements.
Note that historical data may exist which might allow better temperatureboundary conditions to be set. For example, the CSIRO Division ofOceanography holds an extensive archive of AVHRR satellite imagerywhich could possibly be used to estimate surface temperature. Discussionof the annual cycle of the density field in Bass Strait can be found in Bainesand Fandry (1983).
Initial temperature fields inside the Bay were obtained by interpolatingmonthly VFRI underway data in a way similar to that described for salinityin Section 2.6.
18

2.8 Bottom friction parameters
Quadratic bottom friction was used in the model, with a roughness lengthof 0.002m and minimum drag coefficient of 0.0025 (Blumberg and Herring1987, equation 19). These parameters were constant in both time and spacethroughout the models.
The model was found to be relatively insensitive to these choices.decreasing roughness length to 0.001m increased tidal elevation and tidalcurrent amplitudes inside the Bay by about 5%. Increasing roughnesslength to 0.01m reduced tidal elevation amplitudes inside the Bay (north ofthe Great Sands) by about 15%, but increased tidal elevation amplitudes atQueenscliff (south of the Great Sands) by about 10%.
2.9 Mixing parameters
The vertical momentum diffusion coefficient Vz and vertical tracer diffusioncoefficient Kz were calculated in the models using a formulation along thelines described in Csanady (1982), equation 6.22b, with modification due tostratification as described by Bowden and Hamilton (1975):
Vz = Vz0 + αV u?H(1 + 10Ri)− 1
2 (1)
Kz = Kz0 + αKu?H(1 + 3.33Ri)− 3
2 (2)
where u? is the maximum of the surface and bottom friction velocities (toaccount for both tidal and wind mixing), H is the depth of water, Vz0, Kz0,αV and αK are constants, and Ri is a Richardson number, dependent onthe vertical stratification and vertical velocity shear. The backgroundmixing constants Vz0 and Kz0 were both set to the value of 0.00001m2s−1.The model sensitivity to the value of αV was explored, with a value of 0.08giving best results (in terms of comparisons with measured currents insidethe Bay). This value is somewhat higher than the value of 1/16 (0.0625)quoted by Csanady (1982). The value of αK was set to 0.04.
19

Horizontal diffusion of momentum was added, with a diffusion coefficient of2m2s−1. This value is consistent with observations of horizontal mixing inthe Bay (Pattiaratchi et al. 1989). No exploration of the sensitivity of themodel to this value was performed, and it may be that the model willremain stable with smaller values.
Horizontal diffusion of tracers (salinity and temperature) was not explicitlyincluded in the model. The upwind scheme used by the model for advectionof tracers yields a numerical diffusion of the order of 1
2u∆x, where u is the
local velocity and ∆x is the grid resolution. For typical velocities of 0.1m/sinside the Bay, and a grid resolution of 1000m, this corresponds to anumerical diffusion coefficient of of 50 m2/s, which is about an order ofmagnitude larger than observed (Pattiaratchi et al. 1989. Whether this is aproblem or not is debatable. It certainly affects the fields of temperatureand salinity, particularly where there are large velocities (the Rip and Sandsarea), or strong gradients (salinity in Hobsons Bay, for example). However,tracers used for ecological simulations of the Bay were included in theTransport Model (see Technical Report 39, Walker and Sherwood 1997),not the Hydrodynamic model, and transports used to drive that modelwere calculated from the hydrodynamic simulations using particle tracking- a technique which is not subject to this sort of numerical diffusion effect.
3 Model Calibration
Model calibration data consisted primarily of measured sea-levels andcurrents inside the Bay during the month of May 1994. A number of modelruns were performed, adjusting mainly model bathymetry in the Rip andSands, and vertical mixing parameter (αV ), to obtain good agreementbetween simulation and observation. The most important adjustment fortidal comparisons was the bathymetry in the Rip and Sands areas, with themodel being particularly sensitive to the cross-sectional area of the Rip, therepresentation of the South channel, and the depth over the shallow areasof the Sands. For non-tidal (low-pass filtered) currents, the vertical mixingparameter (αV ) was the most significant adjustment.
20
Figure 7 shows the sea-level from Lorne used to force the model for thecalibration period. As an example of the winds used to force the model,winds measured at Hovell Pile during May 1994 are shown in Figure 8. Thelatter half of this month was very windy, with strong north tonorth-westerly winds rarely dropping below speeds of 10 m/s. An unusualfeature earlier in the month is a strong easterly wind, on the 8th and 9th ofMay.
Salinity and temperature were measured during two CTD surveys, oneconducted on 3-4 May and the other over the period 12 - 16 May 1994. Aswell, underway surface salinity and temperature data were collected roughlymonthly during the study as part of the nutrient surveys of the Bay(Technical Report 24 - Longmore et al., 1996). As described above, themodel initial salinity and temperature fields were derived from theunderway data.
Given the long flushing time of the Bay (of the order of a year), onlyrelatively minor changes occur in salinity (and temperature, which ismainly seasonal) over periods of the order of one month, except duringinfrequent events such as major floods. It is hence not very practical toattempt to adjust the salinity or temperature performance of the modelusing a one month (May 1994) calibration period. Instead, a coarser model(3000m resolution) was set up, and its tidal behaviour adjusted to matchthe 1000m model as much as possible. This allowed a large number of long(1 to 2 year) runs to be done, in order to examine longer term modelledtime series of salinity and temperature. Salinity was calibrated primarily byvarying the evaporation input (which is only known relatively poorly), andtemperature was adjusted primarily by adjusting the albedo of the Bay (forsolar radiation input).
3.1 Elevation
Figures 9 to 13 show plots of measured and modelled sea-level at 5 sitesinside the Bay. Note that, as supplied, the Hovell Pile observations
21
appeared to show a constant offset of 7cm below other gauges in the Bay.This offset can be seen in Figure 10. Apart from that offset, all sites showgood agreement between modelled and observed values. This agreementwas achieved after a number of minor adjustments to the modelbathymetry in the Rip and Great Sands areas. The tidal response of themodel is sensitive to the bathymetry in these areas.
The results of harmonic analysis of measured and modelled sea-levels arepresented with the model validation results below (Section 4).
3.2 Velocities
The first current meter deployment covered the period from 21 April 1994to 2 June 1994, with 5 moorings, located near Martha Point, the northernedge of the Great Sands, the Bay centre, Point Cook, and Red Bluff. Therewere 2 meters on each mooring, generally at about 4-5m below the watersurface and about 4-5m above the bottom. Data were recovered from allmeters during this period.
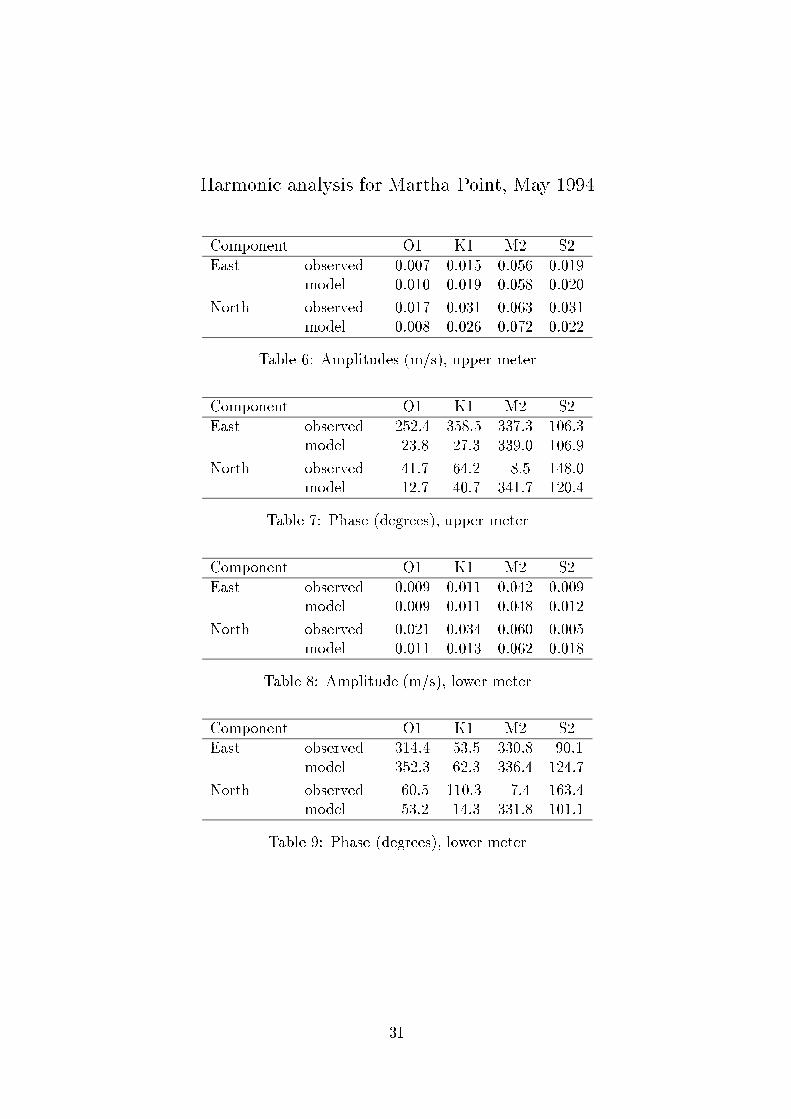
A comparison of raw measured and modelled currents for the month of May1994 is shown in Figures ?? to ??. These plots show both tidal andnon-tidal currents. At most sites, the tidal part of the currents arereproduced well by the model. This is quantified by tidal analyses of themeasured and modelled currents for the period, presented in Appendix A.At most sites, the agreement between modelled and observed tidal currentsis very good, particularly for the dominant M2 component. There is a largephase error at the lower Great Sands meter during the May calibrationperiod. This probably arises from a timing error in the observed data, ascomparisons of time series of currents from the upper and lower meter atthat site show a similar large difference in phase.
Of course, tidal currents are strongest in the southernmost parts of the Bay,where there were no current meter moorings. However, coastal radar(COSRAD) data was obtained in the Sands region for the period 5 - 12
22

May 1994 (Prytz and Heron 1994). Comparisons between measuredCOSRAD currents and modelled currents for this period were produced at3 locations shown in Figure ??. The measured and modelled currenttime-series at these sites are shown in Figures ?? to ??. These figures allindicate that the model does a good job of representing the tidal flows inthe southern part of the Bay.
Of more interest for the transport of substances around the Bay are thelonger term non-tidal currents. Comparisons of low-pass filtered (24.8 hourperiod cutoff) measured and modelled currents are shown as both timeseries plots and as scatter plots in Figures ?? to ??. As well, a comparisonof the vector mean current at each meter over the entire May calibrationperiod is shown in Figure ??.
In summary, during the calibration period (May 1994) the model representslow-pass filtered currents very well at Point Cook, Red Bluff, and the lowermeter at the Great Sands site. It performs reasonably well at the CentralBay site and at the lower meter at Martha Point, and performs poorly atthe upper meters at the Martha Point and Great Sands sites. This pooragreement at the upper Martha Point meter can probably be explained bythe proximity of this site to the bay-ward end of the South channel. Themodelled currents at Martha Point were found to be very sensitive to themodel bathymetry in this region. The poor agreement at the upper GreatSands meter is problematic, particularly given the very good agreement atthe lower meter at this site. The upper meter there may be affected byflows over the Sands, or possibly through Symonds Channel.
The low-pass filtered current comparisons are discussed in more detail foreach mooring site below:
3.2.1 Martha Point
The model does not reproduce low-pass filtered currents well at the uppermeter. The east component shows some correlation (r = 0.68), but there islittle correlation for the north component. The model underestimates
23
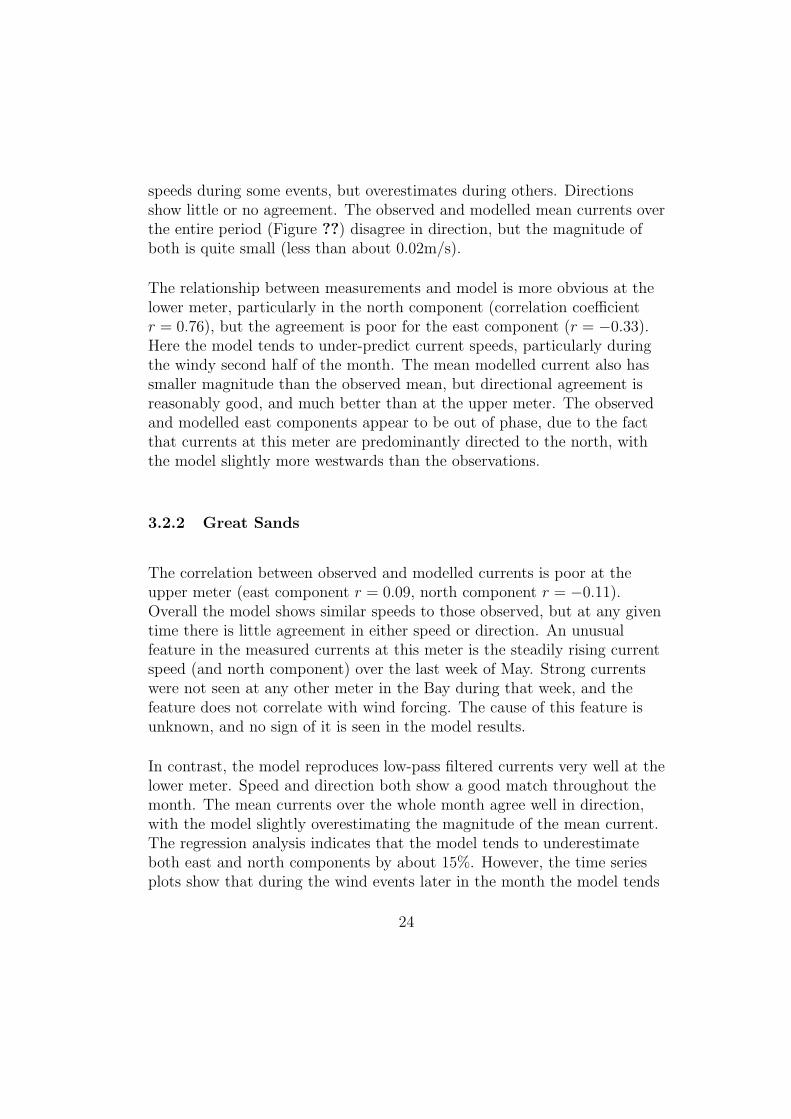
speeds during some events, but overestimates during others. Directionsshow little or no agreement. The observed and modelled mean currents overthe entire period (Figure ??) disagree in direction, but the magnitude ofboth is quite small (less than about 0.02m/s).
The relationship between measurements and model is more obvious at thelower meter, particularly in the north component (correlation coefficientr = 0.76), but the agreement is poor for the east component (r = −0.33).Here the model tends to under-predict current speeds, particularly duringthe windy second half of the month. The mean modelled current also hassmaller magnitude than the observed mean, but directional agreement isreasonably good, and much better than at the upper meter. The observedand modelled east components appear to be out of phase, due to the factthat currents at this meter are predominantly directed to the north, withthe model slightly more westwards than the observations.
3.2.2 Great Sands
The correlation between observed and modelled currents is poor at theupper meter (east component r = 0.09, north component r = −0.11).Overall the model shows similar speeds to those observed, but at any giventime there is little agreement in either speed or direction. An unusualfeature in the measured currents at this meter is the steadily rising currentspeed (and north component) over the last week of May. Strong currentswere not seen at any other meter in the Bay during that week, and thefeature does not correlate with wind forcing. The cause of this feature isunknown, and no sign of it is seen in the model results.
In contrast, the model reproduces low-pass filtered currents very well at thelower meter. Speed and direction both show a good match throughout themonth. The mean currents over the whole month agree well in direction,with the model slightly overestimating the magnitude of the mean current.The regression analysis indicates that the model tends to underestimateboth east and north components by about 15%. However, the time seriesplots show that during the wind events later in the month the model tends
24

to over-predict speeds to a moderate extent. The east and northcomponents show correlation coefficients of r = 0.88 and r = 0.80respectively.
3.2.3 Central Bay
At this site, the model represents the current north component reasonablywell at both the upper and lower meters (r = 0.75 and r = 0.80respectively). However, the east component is poorly represented(r = −0.06 at the top meter and r = −0.16 at the bottom meter). Thetime series plots show that speeds are well represented at both meters, butdirections are not, particularly during the first half of the month, whenlow-pass filtered currents at this site are small (typically a few centimetresper second). Both meters show better agreement in direction during thewindy second half of the month.
3.2.4 Point Cook
This site shows good agreement between the model and measured currents,apart from the north component at the lower meter, where there is littlesignal in either model or measurements. At the top meter, the east andnorth correlation coefficients are r = 0.88 and r = 0.68 respectively. Here,the model tends to overestimate current speed during strong wind events.It also shows a systematic direction offset of about 40 degrees anticlockwisewith respect to the measurements. This offset could possibly be caused bybathymetric variations near the meters, although it is somewhat hard tounderstand why the upper meter would be affected more than the lowermeter. At the bottom meter, the east and north correlation coefficients arer = 0.89 and r = 0.00 respectively. Here the model gives a goodrepresentation of both speed and direction.
The magnitude of the mean current is overestimated by the model at boththe upper and lower meters at this site. The observed means are very small
25
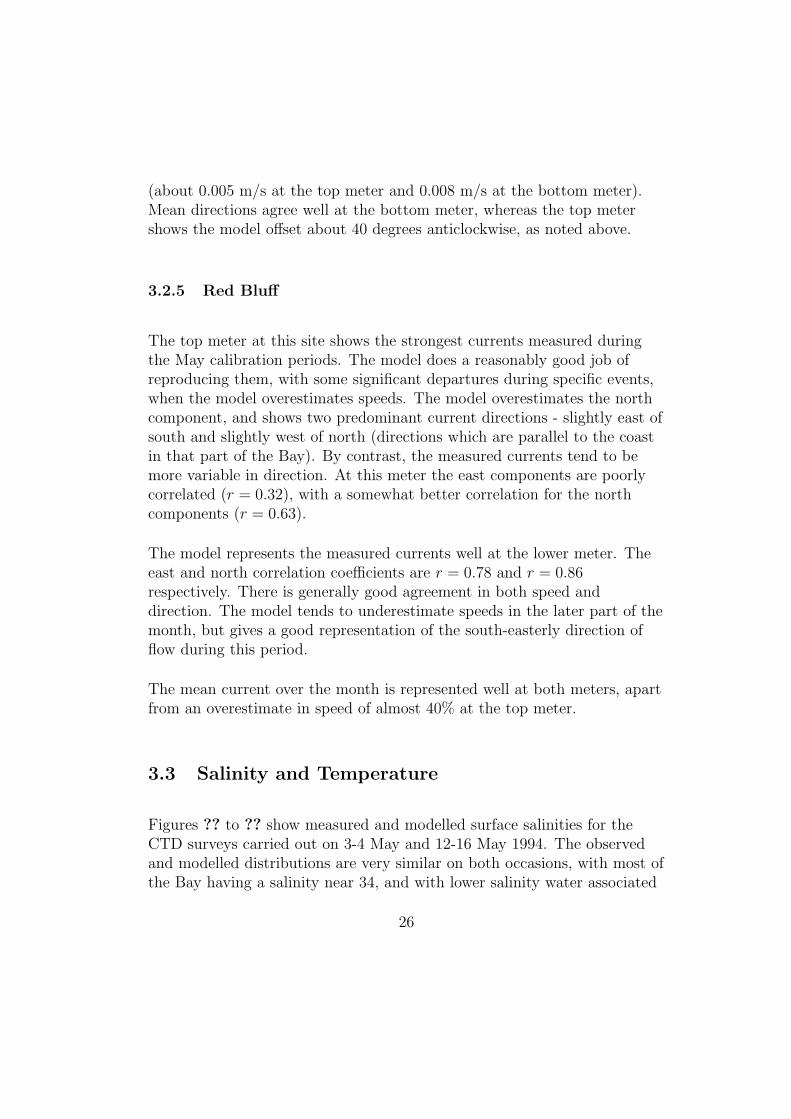
(about 0.005 m/s at the top meter and 0.008 m/s at the bottom meter).Mean directions agree well at the bottom meter, whereas the top metershows the model offset about 40 degrees anticlockwise, as noted above.
3.2.5 Red Bluff
The top meter at this site shows the strongest currents measured duringthe May calibration periods. The model does a reasonably good job ofreproducing them, with some significant departures during specific events,when the model overestimates speeds. The model overestimates the northcomponent, and shows two predominant current directions - slightly east ofsouth and slightly west of north (directions which are parallel to the coastin that part of the Bay). By contrast, the measured currents tend to bemore variable in direction. At this meter the east components are poorlycorrelated (r = 0.32), with a somewhat better correlation for the northcomponents (r = 0.63).
The model represents the measured currents well at the lower meter. Theeast and north correlation coefficients are r = 0.78 and r = 0.86respectively. There is generally good agreement in both speed anddirection. The model tends to underestimate speeds in the later part of themonth, but gives a good representation of the south-easterly direction offlow during this period.
The mean current over the month is represented well at both meters, apartfrom an overestimate in speed of almost 40% at the top meter.
3.3 Salinity and Temperature
Figures ?? to ?? show measured and modelled surface salinities for theCTD surveys carried out on 3-4 May and 12-16 May 1994. The observedand modelled distributions are very similar on both occasions, with most ofthe Bay having a salinity near 34, and with lower salinity water associated
26

with the Yarra plume extending along the north-east coast. The influenceof the Western Treatment Plant can also be seen near its outfalls in thewest of the Bay. Quantitative comparisons of these plots are somewhatproblematic, as the observations are collected over a period of 2 - 4 days,whereas the model yields a plot at a single instant in time. A more rigorouscomparison would be possible by sampling the model using the sameschedule (the same times and places) as used for the observations. Thissomewhat time-consuming exercise has not been attempted for this report.
Figures ?? to ?? show measured and modelled surface temperatures for thesame CTD surveys. The measured and modelled temperatures for thesurvey on 3-4 May are very similar - a not very surprising result, given thatthe model was initialised from observed underway temperatures(interpolated in time) four model days earlier. For the survey on the 12-16May, the model shows the main body of the Bay to be about 0.5◦C coolerthan observed. The model also shows substantially more cooling thanobserved towards the Werribee coast and in the Geelong Arm, withmodelled temperatures up to 2◦C cooler than observations in those regions.The reasons for this discrepancy are probably related to the approximationsmade in the surface heat fluxes for the model, particularly evaporation,humidity and air temperature.
4 Model Validation
Model validation data consisted of measured sea-levels and currents insidethe Bay during September and the first half of October 1994. As well, CTDsurveys of the Bay were carried out on 14-15 September and 29 Septemberto 3 October 1994. The validation period was simulated using the modelparameters chosen during the calibration process. The model was initialisedwith salinity and temperature fields at 00:00, 31 August 1994 from themonthly VFRI underway data, interpolated in space and time. The resultsare described below.
27

4.1 Elevation
Figures ?? to ?? show comparisons of measured and modelled sea-level asboth time series (for September 1994) and scatter plots (for the entire 1994calendar year) at 5 sites inside the Bay. These plots indicate that the modeldoes a very good job of representing sea-level inside the Bay. As well, aharmonic analysis was performed on modelled and observed sea-level datafrom 5 sites for the entire 1994 calendar year. The results are shown inTables 4 (amplitudes) and 5 (phases).
Site O1 K1 N2 M2 S2Breakwater Pier observed 0.068 0.098 0.039 0.236 0.054
model 0.074 0.106 0.040 0.229 0.057
Geelong observed 0.072 0.100 0.047 0.268 0.066model 0.078 0.112 0.045 0.267 0.069
Hovell Pile observed 0.070 0.096 0.035 0.202 0.049model 0.072 0.102 0.033 0.189 0.046
Queenscliff observed 0.085 0.111 0.052 0.259 0.073model 0.086 0.122 0.052 0.292 0.088
West Channel Pile observed 0.067 0.096 0.036 0.205 0.046model 0.074 0.104 0.034 0.195 0.048
Table 4: Observed and modelled tidal constituent amplitudes (inmetres) calculated for 1994.
It is clear from these tables that the model reproduces both the amplitudeand phase of the major tidal constituents very well. The largestdiscrepancy occurs at Queenscliff, where the model overestimates the M2amplitude by 3.3cm, and has an M2 phase error of 7 degrees. It should benoted that Queenscliff is near the entrance to the Bay - an area where tidalamplitudes and phases change rapidly with position. At other sites,amplitude errors are of the order of 1cm or less, and phase errors are of theorder of a few degrees.
28

Site O1 K1 N2 M2 S2Breakwater Pier observed 95.1 131.8 12.4 60.4 197.6
model 94.8 129.8 14.7 62.7 193.4
Geelong observed 96.1 133.3 17.4 61.3 198.1model 96.6 130.4 17.1 64.6 197.7
Hovell Pile observed 96.0 133.4 14.1 60.4 199.9model 95.6 129.5 14.1 62.4 194.0
Queenscliff observed 62.2 95.0 297.3 344.8 119.7model 49.2 80.7 290.4 337.7 103.1
West Channel Pile observed 94.9 131.1 10.2 57.0 193.5model 92.6 126.3 8.1 56.5 187.4
Table 5: Observed and modelled tidal constituent phase (in degrees)calculated for 1994.
4.2 Velocities
During the validation period (late August to mid October 1994), currentmeter moorings were again made at 5 sites, with meters at two depths ateach site. The sites used during this period were Martha Point, SchnapperPoint, the Central Bay, Point Cook, and Red Bluff. No data was recoveredfrom the lower meters at the Central Bay and Red Bluff moorings for thisdeployment.
A comparison of raw measured and modelled currents for the validationperiod is shown in Figures ?? to ??. These plots show both tidal andnon-tidal currents. As was found during the May calibration period, thetidal part of the currents are reproduced well by the model. This is againquantified by tidal analyses of the measured and modelled currents for theperiod, presented in Appendix A.
Comparisons of low-pass filtered (24.8 hour period cutoff) measured andmodelled currents are shown as both time series plots and as scatter plotsin Figures ?? to ??. As well, a comparison of the vector mean current ateach meter over the entire validation period is shown in Figure ??.
29

In summary, the model reproduces low-pass filtered currents well in thenorthern part of the Bay (Point Cook and Red Bluff). Its performance isless good at the Schnapper point and Central Bay sites, but both measuredand modelled currents at these sites are very weak throughout thevalidation period, so that, although the relative errors between modelledand measured currents are large, the absolute errors are quite small.Performance at the Martha Point site is improved at the upper meter(compared to the calibration period), but poorer at the lower meter, wherethe model significantly underestimates current speeds.
These comparisons are discussed in more detail for each mooring site below:
4.2.1 Martha Point
There is moderate agreement between the model and measurements at theupper meter, with the model overestimating speeds on some occasions andunderestimating on others. The east component shows a better correlation(r = 0.54) than the north component (r = 0.39). Current directions tend toagree during periods when the current speed is higher (an unsurprisingresult, as directions become ill-defined as speeds approach zero). The meancurrent over the entire period is quite well represented by the model, apartfrom a directional offset of about 30 degrees clockwise.
At the lower meter, there is good agreement in the east component(correlation coefficient r = 0.65), but poor agreement in the northcomponent (r = 0.17), with the model rarely showing a north componentmagnitude above a few centimetres per second. The model almost alwaysunderestimates speeds at this meter, a result consistent with the Maycalibration period. There is occasional agreement in direction, but themodelled currents are often weak and hence tend to show large variations indirection. The mean current over the entire period is badly underestimatedby the model at this meter.
30

4.2.2 Schnapper Point
The model correlates well with the observed north component (r = 0.76) atthe upper meter, but underestimates its amplitude. The east component ispoorly represented at this meter (r = 0.27), and is underestimated duringstronger events. Current speeds are well represented during themid-September period (when they are very low), but are underestimated bythe model at other times. There is some agreement in direction,particularly during mid-September. It should be noted that recordsaccompanying the data from this meter state that the raw data were verynoisy, were subjected to a significant amount of post-processing prior todelivery, and that caution is needed in their use, particularly for residual ormean currents.
At the lower meter, the model again represents speed reasonably wellduring mid-September, and underestimates speeds at other times. Modelledand measured speeds are both low (mostly less than 0.05m/s) at this meter.Directions tend to be variable, but with the measurements tending tofavour a westerly direction, while the model appears to favours a northerlydirection. The correlation coefficients for the east and north componentsare r = 0.33 and r = 0.49 respectively.
The mean currents over the entire period are weak at this site - about0.02m/s directed to the south-east at the upper meter and about the samespeed directed to the west at the lower meter. The modelled means areboth directed roughly to the north, with somewhat smaller magnitude.Because speeds are so small, the absolute error in the means is small, butthe relative error is large.
4.2.3 Central Bay
Both modelled and measured currents are small at the upper meterthroughout the validation period. The east component shows a faircorrelation (r = 0.52), but there is no correlation between model and
31

observations for the north component (r = 0.09). The model overall showsa similar range of speeds to those observed, but there is only occasionalagreement at various times in the period. The observed currents show along term rotation in current direction, with 3 full clockwise rotations indirection between mid-September and mid-October. Interestingly, themodel shows similar behaviour, but with the opposite sense of rotation. Asa result, there is only occasional agreement in direction, mainly when thecurrents are flowing northward.
The mean measured current at the upper meter over the validation periodis very small - about 0.005 m/s. The model shows a mean current of about0.02m/s directed to the northeast over this period.
No data was obtained from the lower meter at this site during thevalidation period.
4.2.4 Point Cook
The model gives a very good representation of currents at both meters atthis site. In general, speeds are slightly underestimated at both meters,with good agreement in direction. At the upper meter, both east and northcomponent correlation coefficients have a value of r = 0.82. At the lowermeter the values are r = 0.66 and r = 0.70 respectively. Here, the modelunderestimates speed during a couple of stronger events. The meancurrents over the entire period are small (about 0.01 m/s) at both meters.The model reproduces these well, with a direction offset of about 45 degreesanticlockwise at the lower meter.
4.2.5 Red Bluff
As in the calibration period, the model tends to overestimate speed at theupper meter at this site. The east and north components show goodcorrelation with measurements, with r = 0.77 and r = 0.62 respectively.
32

Both model and measurements show flow predominantly directed towardsthe south-east, with occasional reversals. The measured directions tend tobe somewhat more variable than those shown by the model. The meancurrent over the period is directed to the south-east, with the modelshowing good agreement in direction, but overestimating magnitude byalmost 50%. In general, the model does a good job of representing thenature of the currents at this site, but with speeds that are somewhat high.
No data was obtained from the lower meter at this site during thevalidation period.
4.3 Salinity and Temperature
Figures ?? to ?? show measured and modelled surface salinities for theCTD surveys carried out on 14-15 September and 29 September - 3October 1994. As in the calibration period, the observed and modelleddistributions are again very similar on both occasions, apart from the factthat in this (validation) period, the model tends to show the main body ofthe Bay having a salinity about 0.25 (psu) higher than the measurements.The Yarra plume can again be seen extending along the north-east coast,with a more significant influence in the late September distribution thanthat in mid September. The influence of the Western Treatment Plant canjust be seen near its outfalls in the model output, but not in the measureddistributions (perhaps due to the contour interval chosen for these plots).
Temperature plots (Figures ?? to ??) show the main body of the Bay ataround 11.5◦C on the 14-15 September, and perhaps 0.25 to 0.5 degreescooler at the 29 September to 3 October survey. The model appears to becooling faster, showing the Bay at about 10.5◦ C on 15 September, andbetween 9.5◦to 10◦ C on 1 October. The model again shows morepronounced cooling along the western coast, a feature which is not presentin the observations. This again points to inadequacies in the data sets usedto provide heat fluxes for the model and in possibly also in the model heatflux terms.
33
5 Long term simulations - Transport model
inputs
In order to produce long-term forcing sets for the Transport model,hydrodynamic simulations were performed for the entire period from 1 July1990 to 30 June 1995. Primarily for computing convenience, these runs weredone in six month segments, with the model re-initialised just prior to thestart of each six month period. As an example of the output of these runs,Figures ?? and 97 shows time series of modelled salinity and temperature atthe Central Bay site plotted against monthly observations from the nearbyVFRI site known as MW2. Salinity rises throughout 1994, due to the lowrainfall over this period. The model reproduces these salinity changes wellat this site (which is representative of the main body of the Bay).Temperature shows an obvious seasonal cycle, with the model tending toovershoot by 1 or 2 degrees C in both summer and particularly late winterand spring. These are not intended to be rigorous comparisons, as moredetailed comparisons of observed and modelled salinity at a number of sitesaround the Bay are presented in Technical Report 39, where the Transportmodel was forced by the output of the long term runs described above.
In order to provide the exchanges of water required by the transport model,the hydrodynamic model included a particle tracking module. A very largenumber of particles (typically 200000) were seeded randomly into the modeland tracked for 24 hours, after which time all particle positions wererecorded, and the particles then re-seeded. The transport model interfaceused particle positions at the start and end of each 24 hour period tocalculate daily exchanges of water between transport model cells. Bothhorizontal and vertical exchanges were represented in this way, as theparticles were tracked in three dimensions in the hydrodynamic model, andtheir movement included a diffusive process (random walk) scaled by thediffusivities calculated in the hydrodynamic model.
Time series of daily particle positions have been generated for the periodJuly 1990 to June 1995 (a data set requiring approximately 9Gb ofstorage). These are used to calculate exchanges for various Transport
34

model geometries, and the resulting exchange files form the primaryphysical forcing data to the Transport Model (Technical Report 39).
6 Summary
A number of hydrodynamic models of Port Phillip Bay have been set up aspart of this study. Most calibration and validation work has beenperformed on a 1000m resolution model of the Bay, a resolution chosenprimarily with regard to the computing resources available to the study.Importantly, a very comprehensive data set has been assembled to provideforcing data for the model. This data set contains a vast amount ofoceanographic and meteorological information, and allows model runs to beperformed which simulate any period in the decade 1985 to 1995.
The model has been calibrated and validated against data sets obtainedfrom field measurement programs conducted in May and September, 1994.The model reproduces changes in sea-level (both tidal and non-tidal) verywell throughout the Bay. It also gives a good representation of tidalcurrents throughout the Bay. Its ability to represent low frequency currentsis more mixed, with consistently good performance in the north of the Bay(Point Cook, Red Bluff), and more variable performance elsewhere.
For low-pass filtered currents, the performance of the model at the MarthaPoint site is not good during either the calibration or validation periods.Although the model shows currents which are of similar magnitudes tothose observed, there are generally only fair to poor correlations betweenmodelled and observed currents there. It seems clear that there areprocesses affecting the currents at this site which are not well representedin the model. Possible candidates are the formation of persistent jets oreddies in response to the energetic tidal flows through the Sands region(particularly the South channel). It is significant that the modelled currentsat this site are quite sensitive to the model bathymetry in the area and inthe South channel, and it may be that a 1000m resolution model is notsufficient to resolve the flows in this area. Although 750m and 500m
35

resolution models were developed during the course of this task, both wereabandoned as being too expensive (in terms of CPU time) to run on thecomputers available to the task at the time.
As well, the limitations of the data sets used to force the model should beremembered. Wind data was available from between 1 and 4 sites, all nearthe edges of the Bay. Given that the low frequency currents in the Bay areprimarily wind forced, an improvement in the input wind field to the modelis likely to result in an improvement in model performance. As well, thefresh-water budget of the Bay still contains significant uncertanites,particularly with regard to evaporation.
Long term hydrodynamic simulations of the Bay have been conducted forthe period July 1990 to June 1995. These outputs have been processed toprovide forcing data for the Transport model (Technical Report 39), so thatlong term ecological simulations of the Bay (Technical Report 44) can bedeveloped with a realistic range of hydrodynamic and climatological forcing.
7 Acknowledgements
A great many people and organisations contributed to the development ofthe model and data sets described in this report. Data sets were obtainedfrom the Victorian EPA, the Bureau of Meteorology, Melbourne Water, thePort Authorities, the National Tidal Facility, WNI Pty. Ltd. (formerlyOceanroutes) VFRI and VIMS (now MAFRI), James Cook University, theUniversity of Western Australia, and Lawson and Treloar Pty. Ltd. Modelswere obtained from the Victorian EPA, Lawson and Treloar Pty. Ltd, andthe (then) CSIRO Division of Oceanography. Special mention should bemade of Barry Cook (formerly Vic. EPA) and Andy Longmore (MAFRI),who both fielded requests for historical data sets most helpfully. JohnHunter (CSIRO) designed the physics tasks and over-saw much of thephysical field work. Brian Newell, Colin Arrowsmith, Doug Hall and RobMolloy provided valuable support and interfacing throughout the study.
36

Funding was provided by Melbourne Water through the Port Phillip BayEnvironmental Study.
References
Baines, P. G., and C. B. Fandry, 1983: Annualcycle of the density field in Bass Strait, Aust. J. Mar. Freshw. Res.
Black, K. P., and S. Mourtikas, 1992:Literature review of the Physics of Port Phillip Bay, Tech. Rep. 3,CSIRO Port Phillip Bay Environmental Study.
Blumberg, A. F., and J. Herring, 1987:Circulation modelling using orthogonal curvilinear coordinates, inThree-Dimensional Models of Marine and Estuarine Dynamics, edited byNihoul, and Jamart, Elsevier.
Bowden, K. F., and P. Hamilton, 1975: Someexperiments with a numerical model of circulation and mixing in a tidalestuary, Estuarine and Coastal Marine Science, 3, 281–301.
Csanady, G. T., 1982: Circulation in the coastal ocean, D.Reidel Publishing company.
Gill, A. E., 1982: Atmosphere-ocean dynamics, Academic press.
Hunter, J. R., 1992: Review of physical processes, in PortPhillip Bay Environmental Study: Status review, edited by D. N. Hall,Technical Report 9, CSIRO.
Large, W. G., and S. Pond, 1981: Open oceanmomentum flux measurements in moderate to strong winds, J. Phys.Oceanogr., 11, 324–336.
Lawson & Treloar Pty Ltd, 1995: PortPhillip Bay Environmental Study hydrodynamic model, Tech. Rep.J5007/R1598.
37

Longmore, A. R., R. A. Cowdell and R. Flint, 1996:Nutrient status of the water in Port Phillip Bay, Tech. rep., CSIRO PortPhillip Bay Environmental Study.
Mesinger, F., and A. Arakawa, 1976:Numerical methods used in atmospheric models, GARP Publ. Ser. No.17 WMO-ICSU.
Murray, A. G., and J. P. Parslow, 1997: PortPhillip Bay integrated model: final report, Tech. Rep. 44, CSIRO PortPhillip Bay Environmental Study.
Pattiaratchi, C. B., T. Svenson and J. Imberger,1989: Field study program off Werribee, Port Phillip Bay, Tech. Rep.WP-288-CP, University of Western Australia, CWR.
Prytz, A., and M. L. Heron, 1994: HF oceansurface radar surface currents: Final report, Tech. rep., Port Phillip BayEnvironmental Study.
Walker, S. J., and C. B. Fandry, 1993:Modelling effluent dispersion in Australian coastal waters – Devonport1991–1992, hydrodynamic modelling, Tech. Rep. OMR-59/40, CSIRODivision of Oceanography.
Walker, S. J., and C. R. Sherwood, 1997: Atransport model of Port Phillip Bay, Tech. Rep. 39, CSIRO Port PhillipBay Environmental Study.
38

A Harmonic analyses of currents
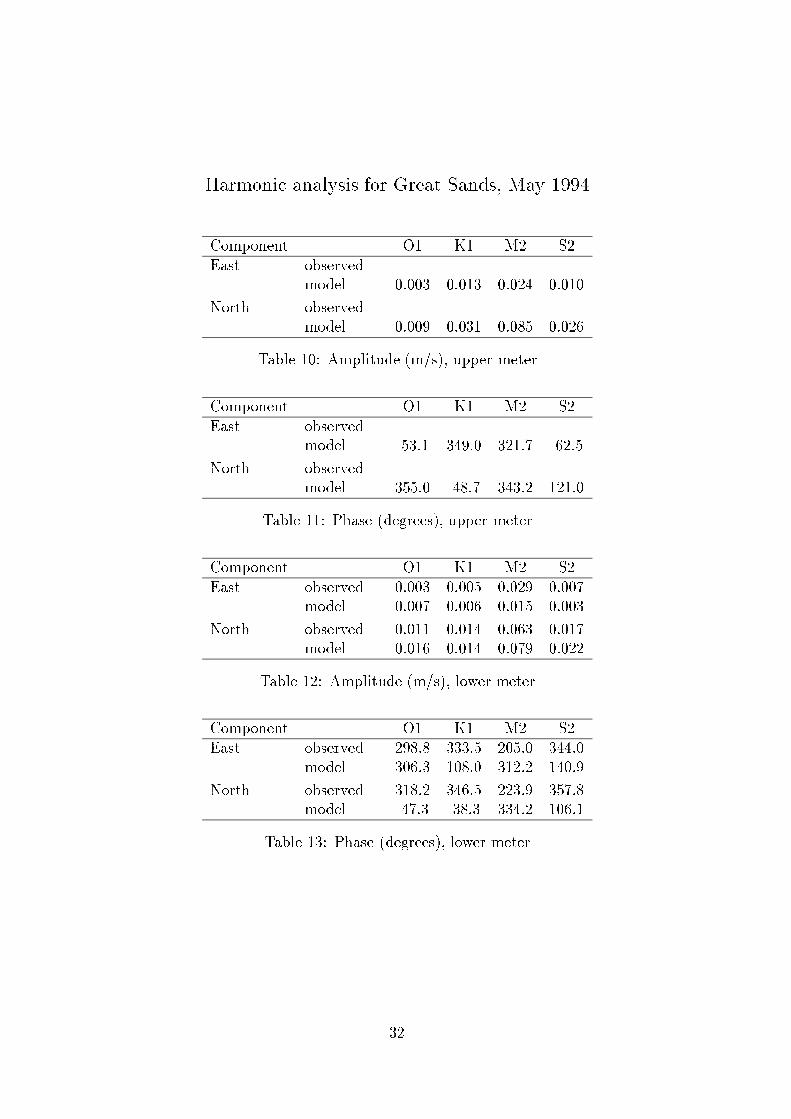
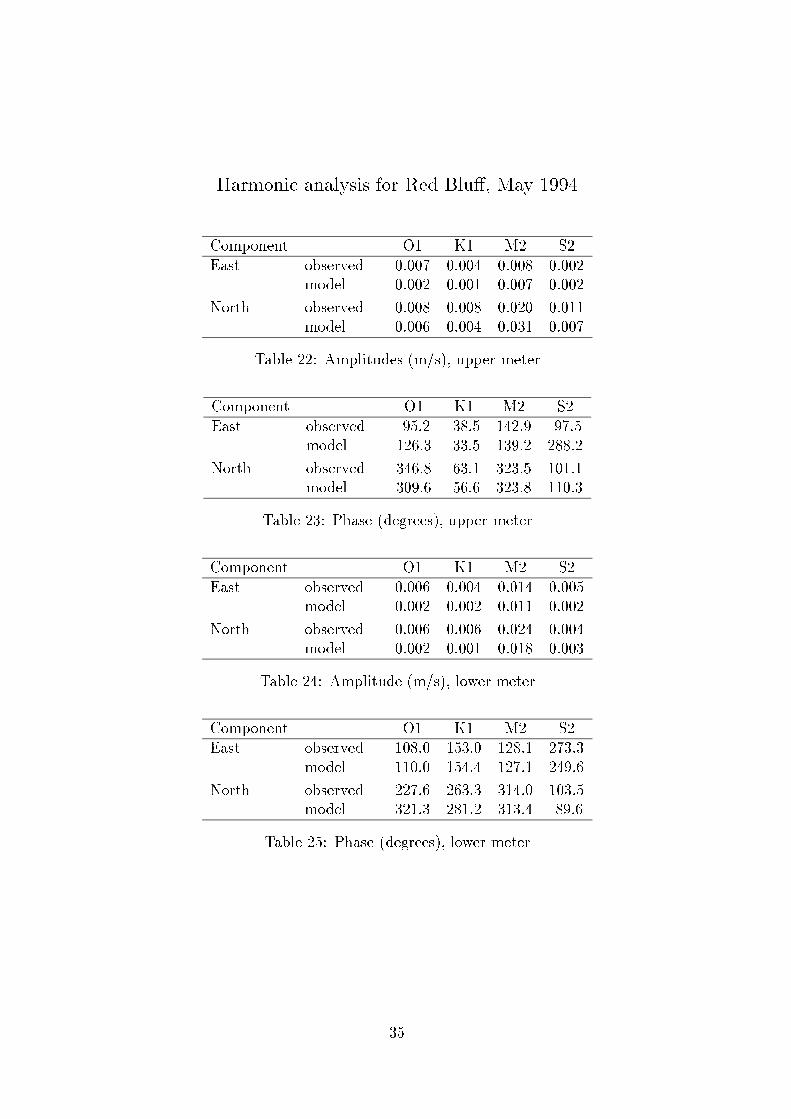
This Appendix contains results of harmonic analyses of both measured andmodelled currents from the May 1994 and September 1994 current meterdeployment periods. Results are missing for observed currents in some ofthe tables, due to current meter failures or gaps in observed data.
39
J K M O P R S T K R K V W X S X Y P M [ K M ^ _ K ` P S R ^ b [ K W c d d f
I c h ] c P F P Z L � � � M � � �\ A T Z c e T F H } F _ � = � � s � = � � q � = � q � � = � � �
h c _ F C � = � � � � = � � � � = � q � � = � � �
� c H Z Y c e T F H } F _ � = � � s � = � � � = � � � = � �h c _ F C � = � � � � = � � � � = � s � � = � � �
f A e C F � � j h ] C O Z k _ F T ê h ! T í ` k ] ] F H h F Z F H
I c h ] c P F P Z L � � � M � � �\ A T Z c e T F H } F _ � q � = µ q � = q s = � � � =
h c _ F C � = � � s = � = � � � � = �
� c H Z Y c e T F H } F _ µ � = s � µ = � � = q � µ � = �h c _ F C � � = s µ � = s µ � = s � � � = µ
f A e C F s � m Y A T F ê _ F � H F F T í ` k ] ] F H h F Z F H
I c h ] c P F P Z L � � � M � � �\ A T Z c e T F H } F _ � = � � � � = � � � � = � µ � � = � � �
h c _ F C � = � � � � = � � � � = � µ � � = � � �
� c H Z Y c e T F H } F _ � = � � � � = � µ � = � � � � = � � qh c _ F C � = � � � � = � � � = � � � � = � � �
f A e C F � � j h ] C O Z k _ F ê h ! T í ` C c ± F H h F Z F H
I c h ] c P F P Z L � � � M � � �\ A T Z c e T F H } F _ � µ = µ q = q � = � � � = �
h c _ F C q � = � � = � = µ � � µ = s
� c H Z Y c e T F H } F _ � � = q � � � = s = µ � � = µh c _ F C q = � � µ = � = � � � � = �
f A e C F � � m Y A T F ê _ F � H F F T í ` C c ± F H h F Z F H
�
J K M O P R S T K R K V W X S X Y P M k M l K ^ m K R o X b [ K W c d d f
I c h ] c P F P Z L � � � M � � �\ A T Z c e T F H } F _
h c _ F C � = � � � = � � � = � � µ � = � � �
� c H Z Y c e T F H } F _h c _ F C � = � � � � = � � � = � � q � = � � �
f A e C F � � � j h ] C O Z k _ F ê h ! T í ` k ] ] F H h F Z F H
I c h ] c P F P Z L � � � M � � �\ A T Z c e T F H } F _
h c _ F C q = � µ � = � � � = s � � = q
� c H Z Y c e T F H } F _h c _ F C q q = � µ � = s µ = � � � � = �
f A e C F � � � m Y A T F ê _ F � H F F T í ` k ] ] F H h F Z F H
I c h ] c P F P Z L � � � M � � �\ A T Z c e T F H } F _ � = � � � = � � q � = � � � � = � � s
h c _ F C � = � � s � = � � � � = � � q � = � �
� c H Z Y c e T F H } F _ � = � � � � = � � µ � = � � � = � � sh c _ F C � = � � � � = � � µ � = � s � � = � � �
f A e C F � � � j h ] C O Z k _ F ê h ! T í ` C c ± F H h F Z F H
I c h ] c P F P Z L � � � M � � �\ A T Z c e T F H } F _ � � � = � = q � � q = � µ µ = �
h c _ F C � � = � � � = � � � = � � µ � = �
� c H Z Y c e T F H } F _ � � = � µ � = q � � = � q s = �h c _ F C µ s = � = µ = � � � � = �
f A e C F � � m Y A T F ê _ F � H F F T í ` C c ± F H h F Z F H
�

J K M O P R S T K R K V W X S X Y P M q l R ^ M K V s K W b [ K W c d d f
I c h ] c P F P Z L � � � M � � �\ A T Z c e T F H } F _ � = � � � � = � � � � = � � � � = � �
h c _ F C � = � � q � = � � � � = � � � � = � � �
� c H Z Y c e T F H } F _ � = � � µ � = � � µ � = � µ � � = � � qh c _ F C � = � � q � = � � � � = � � � = � � s
f A e C F � µ � j h ] C O Z k _ F T ê h ! T í ` k ] ] F H h F Z F H
I c h ] c P F P Z L � � � M � � �\ A T Z c e T F H } F _ � q � = � � = µ � � = � � � � = �
h c _ F C � � � = � � = � � � � = � � = q
� c H Z Y c e T F H } F _ = � µ � = � = � � � q = h c _ F C � = � q � = s µ = � � � s = �
f A e C F � q � m Y A T F ê _ F � H F F T í ` k ] ] F H h F Z F H
I c h ] c P F P Z L � � � M � � �\ A T Z c e T F H } F _ � = � � � = � � � = � � � � = � � µ
h c _ F C � = � � µ � = � � � � = � � µ � = � �
� c H Z Y c e T F H } F _ � = � � � � = � � µ � = � q � � = � � µh c _ F C � = � � � � = � � s � = � q � � = � � q
f A e C F � � � j h ] C O Z k _ F ê h ! T í ` C c ± F H h F Z F H
I c h ] c P F P Z L � � � M � � �\ A T Z c e T F H } F _ � q = � � � = � s q = � � � q = s
h c _ F C � � = s � µ � = � � � µ = � � µ � = s
� c H Z Y c e T F H } F _ q s = µ µ � = = � � � q = �h c _ F C µ � = � � q = � � � = s � � = s
f A e C F � s � m Y A T F ê _ F � H F F T í ` C c ± F H h F Z F H

J K M O P R S T K R K V W X S X Y P M ` P S R ^ q P P w b [ K W c d d f
I c h ] c P F P Z L � � � M � � �\ A T Z c e T F H } F _ � = � � � � = � � � = � � � � = � � µ
h c _ F C � = � � � = � � � = � � � � = � � µ
� c H Z Y c e T F H } F _ � = � � � � = � � � � = � � q � = � � sh c _ F C � = � � q � = � � s � = � � s � = � � �
f A e C F � � � j h ] C O Z k _ F T ê h ! T í ` k ] ] F H h F Z F H
I c h ] c P F P Z L � � � M � � �\ A T Z c e T F H } F _ � � = � � q = � � µ s = s � � = �
h c _ F C � � = � � � � = � � q � = � � s = �
� c H Z Y c e T F H } F _ q s = � � = � µ = � � � = �h c _ F C � � = � q µ = � µ � = � � � � = µ
f A e C F � � � m Y A T F ê _ F � H F F T í ` k ] ] F H h F Z F H
I c h ] c P F P Z L � � � M � � �\ A T Z c e T F H } F _ � = � � s � = � � � � = � � � � = � � µ
h c _ F C � = � � � � = � � � = � � � � = � � �
� c H Z Y c e T F H } F _ � = � � q � = � � s � = � � � � = � � µh c _ F C � = � � q � = � � µ � = � � � � = � � q
f A e C F � � � j h ] C O Z k _ F ê h ! T í ` C c ± F H h F Z F H
I c h ] c P F P Z L � � � M � � �\ A T Z c e T F H } F _ � � � = µ � µ = q � µ � = � � � s = �
h c _ F C � q = � � � µ = µ � q µ = � � s = �
� c H Z Y c e T F H } F _ � � = � � = � µ = s � s = µh c _ F C µ = � q = � µ = µ � � � = q
f A e C F � � � m Y A T F ê _ F � H F F T í ` C c ± F H h F Z F H
µ
J K M O P R S T K R K V W X S X Y P M z l o s V } ~ b [ K W c d d f
I c h ] c P F P Z L � � � M � � �\ A T Z c e T F H } F _ � = � � s � = � � µ � = � � � � = � � �
h c _ F C � = � � � � = � � � � = � � s � = � � �
� c H Z Y c e T F H } F _ � = � � � � = � � � � = � � � � = � � �h c _ F C � = � � � � = � � µ � = � � � = � � s
f A e C F � � � j h ] C O Z k _ F T ê h ! T í ` k ] ] F H h F Z F H
I c h ] c P F P Z L � � � M � � �\ A T Z c e T F H } F _ � q = � � = q � µ � = � � s = q
h c _ F C � � � = = q � � = � � � � = �
� c H Z Y c e T F H } F _ µ � = � � = � � = q � � � = �h c _ F C � � = � q � = � � = � � � � =
f A e C F � � m Y A T F ê _ F � H F F T í ` k ] ] F H h F Z F H
I c h ] c P F P Z L � � � M � � �\ A T Z c e T F H } F _ � = � � � � = � � µ � = � � µ � = � � q
h c _ F C � = � � � � = � � � � = � � � � = � � �
� c H Z Y c e T F H } F _ � = � � � � = � � � � = � � µ � = � � µh c _ F C � = � � � � = � � � � = � � � � = � �
f A e C F � µ � j h ] C O Z k _ F ê h ! T í ` C c ± F H h F Z F H
I c h ] c P F P Z L � � � M � � �\ A T Z c e T F H } F _ � � � = � � q = � � � � = � � s =
h c _ F C � � � = � � q µ = µ � � s = � � µ � = �
� c H Z Y c e T F H } F _ � � s = � � � = � µ = � � � = qh c _ F C � � = � � � = � � = µ � � = �
f A e C F � q � m Y A T F ê _ F � H F F T í ` C c ± F H h F Z F H
q
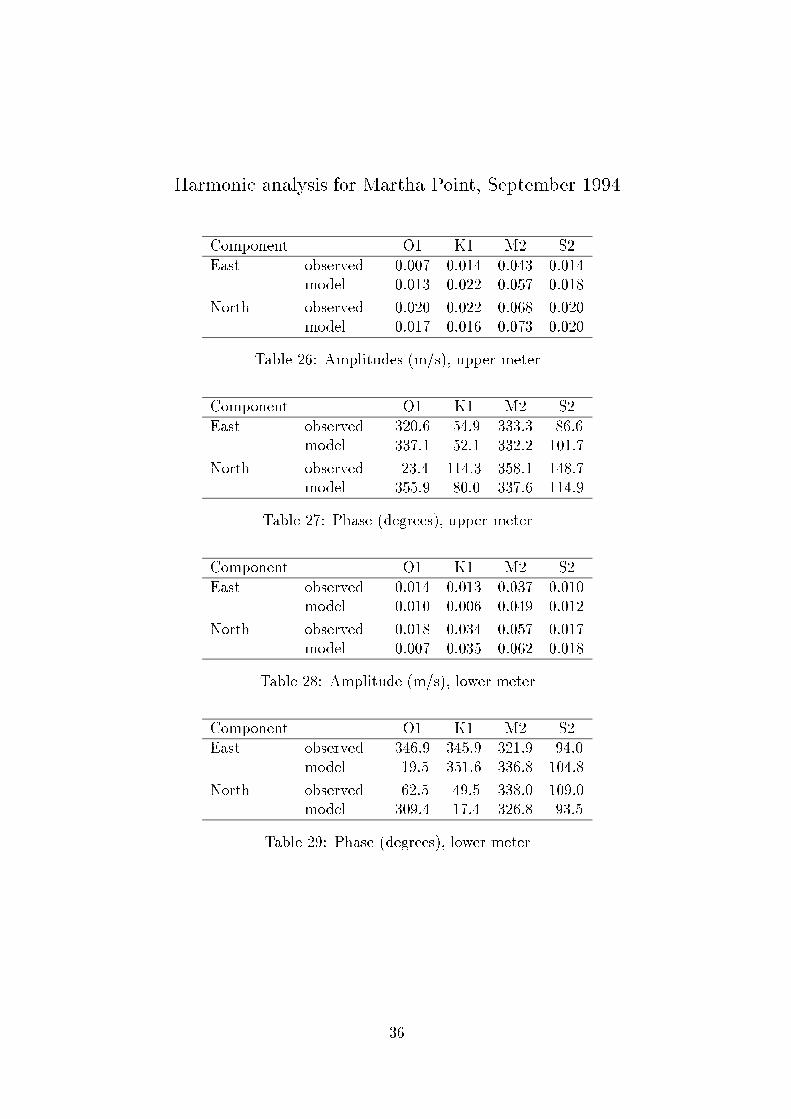
J K M O P R S T K R K V W X S X Y P M [ K M ^ _ K ` P S R ^ b m l � ^ l O � l M c d d f
I c h ] c P F P Z L � � � M � � �\ A T Z c e T F H } F _ � = � � s � = � � µ � = � µ � = � � µ
h c _ F C � = � � � = � � � � = � q s � = � � �
� c H Z Y c e T F H } F _ � = � � � � = � � � � = � � � � = � � �h c _ F C � = � � s � = � � � � = � s � = � � �
f A e C F � � � j h ] C O Z k _ F T ê h ! T í ` k ] ] F H h F Z F H
I c h ] c P F P Z L � � � M � � �\ A T Z c e T F H } F _ � � = � q µ = � = � � = �
h c _ F C s = � q � = � � = � � � � = s
� c H Z Y c e T F H } F _ � = µ � � µ = q � = � � µ � = sh c _ F C q q = � � � = � s = � � � µ = �
f A e C F � s � m Y A T F ê _ F � H F F T í ` k ] ] F H h F Z F H
I c h ] c P F P Z L � � � M � � �\ A T Z c e T F H } F _ � = � � µ � = � � � = � s � = � � �
h c _ F C � = � � � � = � � � � = � µ � � = � � �
� c H Z Y c e T F H } F _ � = � � � � = � µ � = � q s � = � � sh c _ F C � = � � s � = � q � = � � � � = � � �
f A e C F � � � j h ] C O Z k _ F ê h ! T í ` C c ± F H h F Z F H
I c h ] c P F P Z L � � � M � � �\ A T Z c e T F H } F _ µ � = � µ q = � � � = � � µ = �
h c _ F C � � = q q � = � � = � � � µ = �
� c H Z Y c e T F H } F _ � � = q µ � = q � = � � � � = �h c _ F C � � = µ � s = µ � � = � � = q
f A e C F � � � m Y A T F ê _ F � H F F T í ` C c ± F H h F Z F H
�

J K M O P R S T K R K V W X S X Y P M m T _ R K � � l M ` P S R ^ b m l � ^ l O � l M c d d f
I c h ] c P F P Z L � � � M � � �\ A T Z c e T F H } F _ � = � � � � = � � � � = � � � � = � � �
h c _ F C � = � � q � = � � � � = � � � � = � � �
� c H Z Y c e T F H } F _ � = � � � � = � � � � = � µ q � = � � �h c _ F C � = � � � � = � � � � = � q s � = � � s
f A e C F � � j h ] C O Z k _ F T ê h ! T í ` k ] ] F H h F Z F H
I c h ] c P F P Z L � � � M � � �\ A T Z c e T F H } F _ � � = � � � = � � � = q � � µ = q
h c _ F C � q = � � � = s � s = � s = �
� c H Z Y c e T F H } F _ � � = µ � � � = � � � = � � � s = �h c _ F C q = � s � = = s � � � = s
f A e C F � � m Y A T F ê _ F � H F F T í ` k ] ] F H h F Z F H
I c h ] c P F P Z L � � � M � � �\ A T Z c e T F H } F _ � = � � q � = � � � � = � � q � = � �
h c _ F C � = � � � � = � � � � = � � � = � � �
� c H Z Y c e T F H } F _ � = � � � � = � � µ � = � q � � = � � �h c _ F C � = � � � � = � � � � = � q � � = � � µ
f A e C F � � j h ] C O Z k _ F ê h ! T í ` C c ± F H h F Z F H
I c h ] c P F P Z L � � � M � � �\ A T Z c e T F H } F _ µ � = � µ q = � µ q = � � � = �
h c _ F C � � = � � � � = = � � � � =
� c H Z Y c e T F H } F _ � µ = q µ = � q q = � � � � = �h c _ F C µ � = µ � � = q � � = � � � = µ
f A e C F � m Y A T F ê _ F � H F F T í ` C c ± F H h F Z F H
s

J K M O P R S T K R K V W X S X Y P M q l R ^ M K V s K W b m l � ^ l O � l M c d d f
I c h ] c P F P Z L � � � M � � �\ A T Z c e T F H } F _ � = � � � � = � � � � = � � µ � = � � q
h c _ F C � = � � µ � = � � q � = � � � = � � �
� c H Z Y c e T F H } F _ � = � � s � = � � � � = � µ � � = � � �h c _ F C � = � � � = � � � � = � � µ � = � � s
f A e C F µ � j h ] C O Z k _ F ê h ! T í ` k ] ] F H h F Z F H
I c h ] c P F P Z L � � � M � � �\ A T Z c e T F H } F _ � µ = µ µ � = � � � � = � � � = �
h c _ F C � � = s µ s = s � � = � � � = s
� c H Z Y c e T F H } F _ � = � � � � = � � = � � � s = �h c _ F C � = � � = � µ � = � � � � = �
f A e C F q � m Y A T F ê _ F � H F F T í ` k ] ] F H h F Z F H
I c h ] c P F P Z L � � � M � � �\ A T Z c e T F H } F _
h c _ F C � = � � � � = � � µ � = � � s � = � �
� c H Z Y c e T F H } F _h c _ F C � = � � � = � � q � = � q � � = � �
f A e C F � � j h ] C O Z k _ F ê h ! T í ` C c ± F H h F Z F H
I c h ] c P F P Z L � � � M � � �\ A T Z c e T F H } F _
h c _ F C � � � = q � � � = � � q = � � q � = q
� c H Z Y c e T F H } F _h c _ F C q � = s � � = � � q = s � q = µ
f A e C F s � m Y A T F ê _ F � H F F T í ` C c ± F H h F Z F H
�

J K M O P R S T K R K V W X S X Y P M ` P S R ^ q P P w b m l � ^ l O � l M c d d f
I c h ] c P F P Z L � � � M � � �\ A T Z c e T F H } F _ � = � � µ � = � � � � = � � � � = � � �
h c _ F C � = � � � � = � � � � = � � � = � � µ
� c H Z Y c e T F H } F _ � = � � q � = � � � � = � � µ � = � � qh c _ F C � = � � s � = � � q � = � � � � = � � q
f A e C F � � j h ] C O Z k _ F T ê h ! T í ` k ] ] F H h F Z F H
I c h ] c P F P Z L � � � M � � �\ A T Z c e T F H } F _ � � = � � � � = � � � s = s µ � = �
h c _ F C � � = µ � � � = µ � s µ = q � q =
� c H Z Y c e T F H } F _ � = � � s � = � � = � � � = �h c _ F C � � = � � � = q µ = � � = s
f A e C F � � m Y A T F ê _ F � H F F T í ` k ] ] F H h F Z F H
I c h ] c P F P Z L � � � M � � �\ A T Z c e T F H } F _
h c _ F C � = � � � � = � � � � = � � � � = � �
� c H Z Y c e T F H } F _h c _ F C � = � � � = � � s � = � � s � = � �
f A e C F µ � � j h ] C O Z k _ F ê h ! T í ` C c ± F H h F Z F H
I c h ] c P F P Z L � � � M � � �\ A T Z c e T F H } F _
h c _ F C � � µ = � � = � � � µ = � � q = q
� c H Z Y c e T F H } F _h c _ F C � = � � µ = � � = q � � � = �
f A e C F µ � � m Y A T F ê _ F � H F F T í ` C c ± F H h F Z F H
�

J K M O P R S T K R K V W X S X Y P M z l o s V } ~ b m l � ^ l O � l M c d d f
I c h ] c P F P Z L � � � M � � �\ A T Z c e T F H } F _ � = � � q � = � � � � = � � s � = � � q
h c _ F C � = � � � = � � � � = � � � � = � �
� c H Z Y c e T F H } F _ � = � � µ � = � � � � = � � � = � � �h c _ F C � = � � q � = � � µ � = � � � = � � �
f A e C F µ � � j h ] C O Z k _ F T ê h ! T í ` k ] ] F H h F Z F H
I c h ] c P F P Z L � � � M � � �\ A T Z c e T F H } F _ � q = q � � � = s � q � = � � � � = �
h c _ F C q = µ � s = � � � � = � � � � = �
� c H Z Y c e T F H } F _ q = � q s = s � q = � � � � = h c _ F C � = � � � q = s � � = s � � � = µ
f A e C F µ � m Y A T F ê _ F � H F F T í ` k ] ] F H h F Z F H
I c h ] c P F P Z L � � � M � � �\ A T Z c e T F H } F _
h c _ F C � = � � µ � = � � s � = � � � � = � � �
� c H Z Y c e T F H } F _h c _ F C � = � � � = � � µ � = � � � � = � � µ
f A e C F µ µ � j h ] C O Z k _ F ê h ! T í ` C c ± F H h F Z F H
I c h ] c P F P Z L � � � M � � �\ A T Z c e T F H } F _
h c _ F C � q s = s � � q = s � � s = s � µ q = �
� c H Z Y c e T F H } F _h c _ F C q � = � � q = q � � = � � s =
f A e C F µ q � m Y A T F ê _ F � H F F T í ` C c ± F H h F Z F H
µ �

� æ � � � ¡ � æ � ã à � �
� f Y F h c _ F C � H O _ A P _ ñ F C _ h F A T k H F h F P Z C c W A Z O c P T µ �
� f c Z A C A P P k A C H A O P ² A C C ` � � � µ µ s
n A [ � ± O _ F h F A P H A O P ² A C C ` � � � � � � � � q µ �
µ f c Z A C � A H H A H O } F H õ c ± ` � � � � � � � � q µ �
q m A Z Z F H T c P H O } F H õ c ± ` � � � � � � � � q q �
� f c Z A C õ c ± ` @ F T Z F H P f H F A Z h F P Z m C A P Z ` � � � � � � � � q q �
s � F A � C F } F C _ A Z A A Z ô c H P F ` M A [ � � � µ q �
� @ O P _ _ A Z A A Z a c } F C C m O C F q
� M A [ � � � µ T F A � C F } F C A Z l F F C c P � q µ
� � M A [ � � � µ T F A � C F } F C A Z a c } F C C m O C F q q
� � M A [ � � � µ T F A � C F } F C A Z K k F F P T W C O È q �
� � M A [ � � � µ T F A � C F } F C A Z Å O W Z c H O A � c W D q s
� M A [ � � � µ T F A � C F } F C A Z @ F T Z I Y A P P F C m O C F q �
� µ M A [ � � � µ ` H A ± W k H H F P Z T A Z M A H Z Y A m c O P Z ` k ] ] F H h F Z F H q �
� q M A [ � � � µ ` H A ± W k H H F P Z T A Z M A H Z Y A m c O P Z ` C c ± F H h F Z F H � �
� � M A [ � � � µ ` H A ± W k H H F P Z T A Z l H F A Z � A P _ T ` k ] ] F H h F Z F H � �
� s M A [ � � � µ ` H A ± W k H H F P Z T A Z l H F A Z � A P _ T ` C c ± F H h F Z F H � �
� � M A [ � � � µ ` H A ± W k H H F P Z T A Z I F P Z H A C n A [ ` k ] ] F H h F Z F H �
� � M A [ � � � µ ` H A ± W k H H F P Z T A Z I F P Z H A C n A [ ` C c ± F H h F Z F H � µ
µ �

� � M A [ � � � µ ` H A ± W k H H F P Z T A Z m c O P Z I c c D ` k ] ] F H h F Z F H � q
� � M A [ � � � µ ` H A ± W k H H F P Z T A Z m c O P Z I c c D ` C c ± F H h F Z F H � �
� � M A [ � � � µ ` H A ± W k H H F P Z T A Z K F _ n C k È ` k ] ] F H h F Z F H � s
� M A [ � � � µ ` H A ± W k H H F P Z T A Z K F _ n C k È ` C c ± F H h F Z F H � �
� µ I L � K j � ! h c _ F C W c h ] A H O T c P T O Z F T ` M A [ � � � µ � �
� q I L � K j � ! h c _ F C W k H H F P Z T A Z \ � ` M A [ � � � µ s �
� � I L � K j � ! h c _ F C W k H H F P Z T A Z \ � ` M A [ � � � µ s �
� s I L � K j � ! h c _ F C W k H H F P Z T A Z \ ` M A [ � � � µ s �
� � M A [ � � � µ ` C c ± ] A T T ñ C Z F H F _ W k H H F P Z T A Z M A H Z Y A m c O P Z ` k ] ] F H h F Z F H s
� � M A [ � � � µ ` C c ± ] A T T ñ C Z F H F _ W k H H F P Z T A Z M A H Z Y A m c O P Z ` C c ± F H h F Z F H s µ
� � W A Z Z F H ] C c Z ² c H M A H Z Y A m c O P Z ` M A [ � � � µ W k H H F P Z T s q
� M A [ � � � µ ` C c ± ] A T T ñ C Z F H F _ W k H H F P Z T A Z l H F A Z � A P _ T ` k ] ] F H h F Z F H s �
� M A [ � � � µ ` C c ± ] A T T ñ C Z F H F _ W k H H F P Z T A Z l H F A Z � A P _ T ` C c ± F H h F Z F H s s
� W A Z Z F H ] C c Z ² c H l H F A Z � A P _ T ` M A [ � � � µ W k H H F P Z T s �
µ M A [ � � � µ ` C c ± ] A T T ñ C Z F H F _ W k H H F P Z T A Z I F P Z H A C n A [ ` k ] ] F H h F Z F H s �
q M A [ � � � µ ` C c ± ] A T T ñ C Z F H F _ W k H H F P Z T A Z I F P Z H A C n A [ ` C c ± F H h F Z F H � �
� � W A Z Z F H ] C c Z ² c H I F P Z H A C n A [ ` M A [ � � � µ W k H H F P Z T � �
s M A [ � � � µ ` C c ± ] A T T ñ C Z F H F _ W k H H F P Z T A Z m c O P Z I c c D ` k ] ] F H h F Z F H � �
� M A [ � � � µ ` C c ± ] A T T ñ C Z F H F _ W k H H F P Z T A Z m c O P Z I c c D ` C c ± F H h F Z F H �
� � W A Z Z F H ] C c Z ² c H m c O P Z I c c D ` M A [ � � � µ W k H H F P Z T � µ
µ � M A [ � � � µ ` C c ± ] A T T ñ C Z F H F _ W k H H F P Z T A Z K F _ n C k È ` k ] ] F H h F Z F H � q
µ �

µ � M A [ � � � µ ` C c ± ] A T T ñ C Z F H F _ W k H H F P Z T A Z K F _ n C k È ` C c ± F H h F Z F H � �
µ � � W A Z Z F H ] C c Z ² c H K F _ n C k È ` M A [ � � � µ W k H H F P Z T � s
µ M A [ � � � µ h F A T k H F _ A P _ h c _ F C C F _ } F W Z c H h F A P W k H H F P Z T � �
µ µ M F A T k H F _ T A C O P O Z [ � µ M A [ � � � µ � �
µ q M c _ F C C F _ T A C O P O Z [ � µ M A [ � � � µ � �
µ � M F A T k H F _ T A C O P O Z [ � � � � � M A [ � � � µ � �
µ s M c _ F C C F _ T A C O P O Z [ � � � � � M A [ � � � µ � �
µ � M F A T k H F _ Z F h ] F H A Z k H F � µ M A [ � � � µ � �
µ � M c _ F C C F _ Z F h ] F H A Z k H F � µ M A [ � � � µ � �
q � M F A T k H F _ Z F h ] F H A Z k H F � � � � � M A [ � � � µ � �
q � M c _ F C C F _ Z F h ] F H A Z k H F � � � � � M A [ � � � µ � �
q � � F ] Z F h e F H � � � µ T F A � C F } F C A Z l F F C c P � �
q � � � µ T F A � C F } F C A Z l F F C c P � � µ
q µ � F ] Z F h e F H � � � µ T F A � C F } F C A Z a c } F C C m O C F � q
q q � � � µ T F A � C F } F C A Z a c } F C C m O C F � �
q � � F ] Z F h e F H � � � µ T F A � C F } F C A Z K k F F P T W C O È � s
q s � � � µ T F A � C F } F C A Z K k F F P T W C O È � �
q � � F ] Z F h e F H � � � µ T F A � C F } F C A Z Å O W Z c H O A � c W D � �
q � � � � µ T F A � C F } F C A Z Å O W Z c H O A � c W D � � �
� � � F ] Z F h e F H � � � µ T F A � C F } F C A Z @ F T Z I Y A P P F C m O C F � � �
� � � � � µ T F A � C F } F C A Z @ F T Z I Y A P P F C m O C F � � �
µ

� � � F ] Z F h e F H � � � µ ` H A ± W k H H F P Z T A Z M A H Z Y A m c O P Z ` k ] ] F H h F Z F H � �
� � F ] Z F h e F H � � � µ ` H A ± W k H H F P Z T A Z M A H Z Y A m c O P Z ` C c ± F H h F Z F H � � µ
� µ � F ] Z F h e F H � � � µ ` H A ± W k H H F P Z T A Z l H F A Z � A P _ T ` k ] ] F H h F Z F H � � q
� q � F ] Z F h e F H � � � µ ` H A ± W k H H F P Z T A Z l H F A Z � A P _ T ` C c ± F H h F Z F H � � �
� � � F ] Z F h e F H � � � µ ` H A ± W k H H F P Z T A Z I F P Z H A C n A [ ` k ] ] F H h F Z F H � � s
� s � F ] Z F h e F H � � � µ ` H A ± W k H H F P Z T A Z I F P Z H A C n A [ ` C c ± F H h F Z F H � � �
� � � F ] Z F h e F H � � � µ ` H A ± W k H H F P Z T A Z m c O P Z I c c D ` k ] ] F H h F Z F H � � �
� � � F ] Z F h e F H � � � µ ` H A ± W k H H F P Z T A Z m c O P Z I c c D ` C c ± F H h F Z F H � � �
s � � F ] Z F h e F H � � � µ ` H A ± W k H H F P Z T A Z K F _ n C k È ` k ] ] F H h F Z F H � � �
s � � F ] Z F h e F H � � � µ ` H A ± W k H H F P Z T A Z K F _ n C k È ` C c ± F H h F Z F H � � �
s � � F ] Z F h e F H � � � µ ` C c ± ] A T T ñ C Z F H F _ W k H H F P Z T A Z M A H Z Y A m c O P Z ` k ] ] F H h F Z F H � �
s � F ] Z F h e F H � � � µ ` C c ± ] A T T ñ C Z F H F _ W k H H F P Z T A Z M A H Z Y A m c O P Z ` C c ± F H h F Z F H � � µ
s µ � W A Z Z F H ] C c Z ² c H M A H Z Y A m c O P Z ` � F ] Z F h e F H � L W Z c e F H � � � µ W k H H F P Z T � � q
s q � F ] Z F h e F H � � � µ ` C c ± ] A T T ñ C Z F H F _ W k H H F P Z T A Z l H F A Z � A P _ T ` k ] ] F H h F Z F H � � �
s � � F ] Z F h e F H � � � µ ` C c ± ] A T T ñ C Z F H F _ W k H H F P Z T A Z l H F A Z � A P _ T ` C c ± F H h F Z F H � � s
s s � W A Z Z F H ] C c Z ² c H � W Y P A ] ] F H m c O P Z ` � F ] Z F h e F H � L W Z c e F H � � � µ W k H H F P Z T � � �
s � � F ] Z F h e F H � � � µ ` C c ± ] A T T ñ C Z F H F _ W k H H F P Z T A Z I F P Z H A C n A [ ` k ] ] F H h F Z F H � � �
s � � F ] Z F h e F H � � � µ ` C c ± ] A T T ñ C Z F H F _ W k H H F P Z T A Z I F P Z H A C n A [ ` C c ± F H h F Z F H � � �
� � � W A Z Z F H ] C c Z ² c H I F P Z H A C n A [ ` � F ] Z F h e F H � L W Z c e F H � � � µ W k H H F P Z T � � �
� � � F ] Z F h e F H � � � µ ` C c ± ] A T T ñ C Z F H F _ W k H H F P Z T A Z m c O P Z I c c D ` k ] ] F H h F Z F H � � �
� � � F ] Z F h e F H � � � µ ` C c ± ] A T T ñ C Z F H F _ W k H H F P Z T A Z m c O P Z I c c D ` C c ± F H h F Z F H � �
µ µ

� � W A Z Z F H ] C c Z ² c H m c O P Z I c c D ` � F ] Z F h e F H � L W Z c e F H � � � µ W k H H F P Z T � � µ
� µ � F ] Z F h e F H � � � µ ` C c ± ] A T T ñ C Z F H F _ W k H H F P Z T A Z K F _ n C k È ` k ] ] F H h F Z F H � � q
� q � F ] Z F h e F H � � � µ ` C c ± ] A T T ñ C Z F H F _ W k H H F P Z T A Z K F _ n C k È ` C c ± F H h F Z F H � � �
� � � W A Z Z F H ] C c Z ² c H K F _ n C k È ` � F ] Z F h e F H � L W Z c e F H � � � µ W k H H F P Z T � � s
� s � F ] Z F h e F H � � � µ h F A T k H F _ A P _ h c _ F C C F _ } F W Z c H h F A P W k H H F P Z T � � �
� � M F A T k H F _ T A C O P O Z [ � µ � � q � F ] Z F h e F H � � � µ � � �
� � M c _ F C C F _ T A C O P O Z [ � µ � � q � F ] Z F h e F H � � � µ � � �
� � M F A T k H F _ T A C O P O Z [ � � � F ] Z F h e F H � L W Z c e F H � � � µ � �
� � M c _ F C C F _ T A C O P O Z [ � � � F ] Z F h e F H � L W Z c e F H � � � µ � �
� � M F A T k H F _ Z F h ] F H A Z k H F � µ � � q � F ] Z F h e F H � � � µ � �
� M c _ F C C F _ Z F h ] F H A Z k H F � µ � � q � F ] Z F h e F H � � � µ � �
� µ M F A T k H F _ Z F h ] F H A Z k H F � � � F ] Z F h e F H � L W Z c e F H � � � µ � �
� q M c _ F C C F _ Z F h ] F H A Z k H F � � � F ] Z F h e F H � L W Z c e F H � � � µ � �
� � � A C O P O Z [ A Z I F P Z H A C n A [ ` � � � µ �
� s f F h ] F H A Z k H F A Z I F P Z H A C n A [ ` � � � µ �
µ q

265000 340000
265000� 340000�
5735000
5820000
5735000�
5820000�
Martha Point�
Great Sands�
Central Bay�
Point Cook Red Bluff
Schnapper Point�
Hovell Pile
West Channel Pile�
Victoria Dock�
Queenscliff
Breakwater Pier�
Geelong
� O � k H F � � ô c W A Z O c P _ O A � H A h ² c H Z Y F m c H Z m Y O C C O ] n A [ h c _ F C � H O _ A P _ ñ F C _ h F A T k H F h F P ZT O Z F T = I c c H _ O P A Z F T T Y c ± P c P Z Y F F _ � F c ² Z Y O T ] C c Z A P _ c Z Y F H ] C c Z T A H F O P h F Z H F T ê j k T Z H A C O A PM A ] l H O _ ` � c P F q q í
µ �

380
400
440
460480
500
520
540
560
580
600
265000 340000
265000 340000
5745000
5815000
57450
58150
ALTONA
BARWON_HEADS
CARRUM
CHELTENHAM
EAST_BRIGHTON
GEELONG
LAVERTON
MELBOURNE
MOORABBIN
MORNINGTON
PORTARLINGTON
QUEENSCLIFF
ROSEBUD
WERRIBEE
Figure 2: Contours of total annual rainfall (mm) for 1994, calculated from interpolated rainfall data, observed at the stations shown.
47

Year1990 1991 1992 1993 1994 1995
0
5
10
15
20
25
Rai
nfal
l (m
m/d
ay)
� O � k H F � n A [ � ± O _ F ê T ] A Z O A C h F A P í H A O P ² A C C ê h h ! _ A [ í ` � � � � � � � � q
µ �

Year1990 1991 1992 1993 1994 1995
0
50
100
150
200
250
300
Flo
w (
m3/
s)
�
� O � k H F µ � f c Z A C õ c ± ê h � ! T í A Z Z Y F h c k Z Y c ² Z Y F � A H H A H O } F H ` � � � � Z c � � � q
µ �

Year1990 1991 1992 1993 1994 1995
0
10
20
30
40
50
60
Flo
w (
m3/
s)
�
� O � k H F q � m A Z Z F H T c P H O } F H õ c ± ê h � ! T í ` � � � � Z c � � � q
q �

Year1990 1991 1992 1993 1994 1995
0
2
4
6
8
10
12
Flo
w (
m3/
s)
�
� O � k H F � � @ F T Z F H P f H F A Z h F P Z m C A P Z c k Z C F Z T ` Z c Z A C õ c ± Z c Z Y F n A [ ê h � ! T í ` � � � � Z c � � � q
q �

May 19941
�
2
�
3
�
4
�
5
�
6
�
7
�
8
�
9
�
10 11 12 13 14 15 16 17 18 19 20 21 22 23 24 25 26 27 28 29 30 31-1.5
-1
-0.5
0
0.5
1
1.5�O�
kHF
s�
�FA
�CF}FC
_AZA
²Hch
ôc
HPF
`k
TF_Zc
_HO}
FZY
Fh
c_
FCc
]FP
ec
kP
_A
H[²c
HM
A[
���
µ=
q�

0 5 10 15 20
Wind Speed (m/s)
May 1994
12
34
56
78
910
1112
1314
1516
1718
1920
2122
2324
2526
2728
2930
31
0 90
180
270
360
Direction (deg, FROM)¡
�O�kHF��MFATkHF_±OP_TAZac}FCCmOCF`kTF_êACcP�±OZYmcOPZ@OCTcP`mcOPZIccDAP_�A±DPFHnFAWcPíZc]Hc}O_F_AZAZc_HO}FZYFhc_FC=
q

May 19941
¢
2
£
3
¤
4
¥
5
¦
6
§
7
¨
8
©
9
ª
10 11 12 13 14 15 16 17 18 19 20 21 22 23 24 25 26 27 28 29 30 31-1
-0.5
0
0.5
1
Ele
vatio
n (m
)
«
¬®°
±²³
´µ
²¶·°±²¹
º·»¼¹¾
¶À¹
»
¹²¼¼²¹
º¹¶·Å
²¹¾
²¼²Ç¶È»À¶È
ɲ²¼»À
®Ê
µ¶Ë
̳³Í
Î Í

May 19941
Ï
2
Ð
3
Ñ
4
Ò
5
¦
6
§
7
¨
8
©
9
ª
10 11 12 13 14 15 16 17 18 19 20 21 22 23 24 25 26 27 28 29 30 31-1
-0.5
0
0.5
1
Ele
vatio
n (m
)
«
¬®°
±²ÌÓ
´µ
²¶·°±²¹
º·»¼¹¾
¶À¹
»
¹²¼¼²¹
º¹¶·Å
²¹¾
²¼²Ç¶È»À¶È
ԻDz¼¼
Ö¼²Ê
µ¶Ë
̳³Í
ÎÎ

May 19941
Ï
2
Ð
3
Ñ
4
Ò
5
¦
6
§
7
¨
8
©
9
ª
10 11 12 13 14 15 16 17 18 19 20 21 22 23 24 25 26 27 28 29 30 31-1
-0.5
0
0.5
1
Ele
vatio
n (m
)
«
¬®°
±²ÌÌ´
µ²¶·°
±²¹º·»¼¹
¾¶À
¹Â
»¹
²¼¼²¹º¹
¶·Å²¹
¾²¼²Ç¶È»À
¶ÈØ
°²²À
·Ú¼ÛÊ
µ¶Ë
̳³Í
ÎÞ

May 19941
ß
2
à
3
á
4
â
5
ã
6
ä
7
å
8
æ
9
ç
10 11 12 13 14 15 16 17 18 19 20 21 22 23 24 25 26 27 28 29 30 31-1
-0.5
0
0.5
1
Ele
vatio
n (m
)
è
¬®°
±²Ìé
´µ
²¶·°±²¹
º·»¼¹¾
¶À¹
»
¹²¼¼²¹
º¹¶·Å
²¹¾
²¼²Ç¶È»À¶È
êÚÈ»±¶
ì»
ÚíÊ
µ¶Ë
̳³Í
Îð

May 19941
Ï
2
Ð
3
Ñ
4
Ò
5
¦
6
§
7
¨
8
©
9
ª
10 11 12 13 14 15 16 17 18 19 20 21 22 23 24 25 26 27 28 29 30 31-1
-0.5
0
0.5
1
Ele
vatio
n (m
)
«
¬®°
±²Ìò
´µ
²¶·°±²¹
º·»¼¹¾
¶À¹
»
¹²¼¼²¹
º¹¶·Å
²¹¾
²¼²Ç¶È»À¶È
ó²·È
ôÅ
¶ÀÀ
²¼Ö
¼²Êµ
¶Ë̳³Í
Îõ

MARTHA POINT water depth 17m Meter 13m above bottom ö
May 19941 2 3 4 5 6 7 8 9 10 11 12 13 14 15 16 17 18 19 20 21 22 23 24 25 26 27 28 29 30 31
-0.2
-0.1
0
0.1
0.2
Eas
t com
pone
nt (
m/s
)
÷
-0.2
-0.1
0
0.1
0.2
Nor
th c
ompo
nent
(m
/s)
ø
0
90
180
270
360
Dire
ctio
n (T
O)
÷
0
0.1
0.2
0.3
0.4
Spe
ed (
m/s
)
ù
-0.2
-0.1
0
0.1
0.2
Eas
t com
pone
nt (
m/s
)
÷
-0.2
-0.1
0
0.1
0.2
Nor
th c
ompo
nent
(m
/s)
ø
0
90
180
270
360
Dire
ctio
n (T
O)
÷
0
0.1
0.2
0.3
0.4
Spe
ed (
m/s
)
ù
ú û ® ° ± ² Ì Í ´ µ ² ¶ · ° ± ² ¹ º · » ¼ û ¹ ¾ ¶ À ¹ Â » ¹ ² ¼ ¼ ² ¹ º ¹ ¶ · Å ² ¹ ¾ Ú ° ± ± ² À È · ¶ È È Å ² µ ¶ ± È Å ¶ Ö » û À È · û È ² Ê° ÿ ÿ ² ± Â ² È ² ± Ê µ ¶ Ë Ì ³ ³ Í �
Î ³

MARTHA POINT water depth 17m Meter 4.25m above bottom �
May 19941 2 3 4 5 6 7 8 9 10 11 12 13 14 15 16 17 18 19 20 21 22 23 24 25 26 27 28 29 30 31
-0.2
-0.1
0
0.1
0.2
Eas
t com
pone
nt (
m/s
)
÷
-0.2
-0.1
0
0.1
0.2
Nor
th c
ompo
nent
(m
/s)
ø
0
90
180
270
360
Dire
ctio
n (T
O)
÷
0
0.1
0.2
0.3
0.4
Spe
ed (
m/s
)
ù
-0.2
-0.1
0
0.1
0.2
Eas
t com
pone
nt (
m/s
)
÷
-0.2
-0.1
0
0.1
0.2
Nor
th c
ompo
nent
(m
/s)
ø
0
90
180
270
360
Dire
ctio
n (T
O)
÷
0
0.1
0.2
0.3
0.4
Spe
ed (
m/s
)
ù
ú û ® ° ± ² Ì Î ´ µ ² ¶ · ° ± ² ¹ º · » ¼ û ¹ ¾ ¶ À ¹  » ¹ ² ¼ ¼ ² ¹ º ¹ ¶ · Å ² ¹ ¾ Ú ° ± ± ² À È · ¶ È È Å ² µ ¶ ± È Å ¶ Ö » û À È · û È ² ʼ » � ² ±  ² È ² ± Ê µ ¶ Ë Ì ³ ³ Í �
Þ Ó

GREAT SANDS water depth 23m �Meter 19m above bottom ö
May 19941 2 3 4 5 6 7 8 9 10 11 12 13 14 15 16 17 18 19 20 21 22 23 24 25 26 27 28 29 30 31
-0.2
-0.1
0
0.1
0.2
Eas
t com
pone
nt (
m/s
)
÷
-0.2
-0.1
0
0.1
0.2
Nor
th c
ompo
nent
(m
/s)
ø
0
90
180
270
360
Dire
ctio
n (T
O)
÷
0
0.1
0.2
0.3
0.4
Spe
ed (
m/s
)
ù
-0.2
-0.1
0
0.1
0.2
Eas
t com
pone
nt (
m/s
)
÷
-0.2
-0.1
0
0.1
0.2
Nor
th c
ompo
nent
(m
/s)
ø
0
90
180
270
360
Dire
ctio
n (T
O)
÷
0
0.1
0.2
0.3
0.4
Spe
ed (
m/s
)
ù
ú û ® ° ± ² Ì Þ ´ µ ² ¶ · ° ± ² ¹ º · » ¼ û ¹ ¾ ¶ À ¹ Â » ¹ ² ¼ ¼ ² ¹ º ¹ ¶ · Å ² ¹ ¾ Ú ° ± ± ² À È · ¶ È È Å ² É ± ² ¶ È � ¶ À ¹ · · û È ² Ê° ÿ ÿ ² ± Â ² È ² ± Ê µ ¶ Ë Ì ³ ³ Í �
Þ Ì

GREAT SANDS water depth 23m �Meter 6m above bottom ö
May 19941 2 3 4 5 6 7 8 9 10 11 12 13 14 15 16 17 18 19 20 21 22 23 24 25 26 27 28 29 30 31
-0.2
-0.1
0
0.1
0.2
Eas
t com
pone
nt (
m/s
)
÷
-0.2
-0.1
0
0.1
0.2
Nor
th c
ompo
nent
(m
/s)
ø
0
90
180
270
360
Dire
ctio
n (T
O)
÷
0
0.1
0.2
0.3
0.4
Spe
ed (
m/s
)
ù
-0.2
-0.1
0
0.1
0.2
Eas
t com
pone
nt (
m/s
)
÷
-0.2
-0.1
0
0.1
0.2
Nor
th c
ompo
nent
(m
/s)
ø
0
90
180
270
360
Dire
ctio
n (T
O)
÷
0
0.1
0.2
0.3
0.4
Spe
ed (
m/s
)
ù
ú û ® ° ± ² Ì ð ´ µ ² ¶ · ° ± ² ¹ º · » ¼ û ¹ ¾ ¶ À ¹  » ¹ ² ¼ ¼ ² ¹ º ¹ ¶ · Å ² ¹ ¾ Ú ° ± ± ² À È · ¶ È È Å ² É ± ² ¶ È � ¶ À ¹ · · û È ² ʼ » � ² ±  ² È ² ± Ê µ ¶ Ë Ì ³ ³ Í � » È ² È Å ¶ È È Å ²  ² ¶ · ° ± ² ¹ ¹ ¶ È ¶ ¶ ÿ ÿ ² ¶ ± · È » Å ¶ Ç ² ¶ · û ® À û � Ú ¶ À È È û  û À ®² ± ± » ± � Å ² À Ú »  ÿ ¶ ± ² ¹ È » � » È Å È Å ²  » ¹ ² ¼ ¶ À ¹ È Å ² ° ÿ ÿ ² ±  ² È ² ± ¶ È È Å û · · û È ² �
Þ é

CENTRAL BAY water depth 24m �Meter 19m above bottom ö
May 19941 2 3 4 5 6 7 8 9 10 11 12 13 14 15 16 17 18 19 20 21 22 23 24 25 26 27 28 29 30 31
-0.2
-0.1
0
0.1
0.2
Eas
t com
pone
nt (
m/s
)
÷
-0.2
-0.1
0
0.1
0.2
Nor
th c
ompo
nent
(m
/s)
ø
0
90
180
270
360
Dire
ctio
n (T
O)
÷
0
0.1
0.2
0.3
0.4
Spe
ed (
m/s
)
ù
-0.2
-0.1
0
0.1
0.2
Eas
t com
pone
nt (
m/s
)
÷
-0.2
-0.1
0
0.1
0.2
Nor
th c
ompo
nent
(m
/s)
ø
0
90
180
270
360
Dire
ctio
n (T
O)
÷
0
0.1
0.2
0.3
0.4
Spe
ed (
m/s
)
ù
ú û ® ° ± ² Ì õ ´ µ ² ¶ · ° ± ² ¹ º · » ¼ û ¹ ¾ ¶ À ¹ Â » ¹ ² ¼ ¼ ² ¹ º ¹ ¶ · Å ² ¹ ¾ Ú ° ± ± ² À È · ¶ È È Å ² ô ² À È ± ¶ ¼ � ¶ Ë · û È ² Ê° ÿ ÿ ² ± Â ² È ² ± Ê µ ¶ Ë Ì ³ ³ Í �
Þ ò

CENTRAL BAY water depth 24m �Meter 5.75m above bottom �
May 19941 2 3 4 5 6 7 8 9 10 11 12 13 14 15 16 17 18 19 20 21 22 23 24 25 26 27 28 29 30 31
-0.2
-0.1
0
0.1
0.2
Eas
t com
pone
nt (
m/s
)
÷
-0.2
-0.1
0
0.1
0.2
Nor
th c
ompo
nent
(m
/s)
ø
0
90
180
270
360
Dire
ctio
n (T
O)
÷
0
0.1
0.2
0.3
0.4
Spe
ed (
m/s
)
ù
-0.2
-0.1
0
0.1
0.2
Eas
t com
pone
nt (
m/s
)
÷
-0.2
-0.1
0
0.1
0.2
Nor
th c
ompo
nent
(m
/s)
ø
0
90
180
270
360
Dire
ctio
n (T
O)
÷
0
0.1
0.2
0.3
0.4
Spe
ed (
m/s
)
ù
ú û ® ° ± ² Ì ³ ´ µ ² ¶ · ° ± ² ¹ º · » ¼ û ¹ ¾ ¶ À ¹  » ¹ ² ¼ ¼ ² ¹ º ¹ ¶ · Å ² ¹ ¾ Ú ° ± ± ² À È · ¶ È È Å ² ô ² À È ± ¶ ¼ � ¶ Ë · û È ² Ê ¼ » � ² ±Â ² È ² ± Ê µ ¶ Ë Ì ³ ³ Í �
Þ Í

POINT COOK water depth 10m �Meter 6m above bottom ö
May 19941 2 3 4 5 6 7 8 9 10 11 12 13 14 15 16 17 18 19 20 21 22 23 24 25 26 27 28 29 30 31
-0.2
-0.1
0
0.1
0.2
Eas
t com
pone
nt (
m/s
)
÷
-0.2
-0.1
0
0.1
0.2
Nor
th c
ompo
nent
(m
/s)
ø
0
90
180
270
360
Dire
ctio
n (T
O)
÷
0
0.1
0.2
0.3
0.4
Spe
ed (
m/s
)
ù
-0.2
-0.1
0
0.1
0.2
Eas
t com
pone
nt (
m/s
)
÷
-0.2
-0.1
0
0.1
0.2
Nor
th c
ompo
nent
(m
/s)
ø
0
90
180
270
360
Dire
ctio
n (T
O)
÷
0
0.1
0.2
0.3
0.4
Spe
ed (
m/s
)
ù
ú û ® ° ± ² é Ó ´ µ ² ¶ · ° ± ² ¹ º · » ¼ û ¹ ¾ ¶ À ¹  » ¹ ² ¼ ¼ ² ¹ º ¹ ¶ · Å ² ¹ ¾ Ú ° ± ± ² À È · ¶ È È Å ² Ö » û À È ô » » í · û È ² Ê ° ÿ ÿ ² ±Â ² È ² ± Ê µ ¶ Ë Ì ³ ³ Í �
Þ Î

POINT COOK water depth 10m �Meter 2.5m above bottom �
May 19941 2 3 4 5 6 7 8 9 10 11 12 13 14 15 16 17 18 19 20 21 22 23 24 25 26 27 28 29 30 31
-0.2
-0.1
0
0.1
0.2
Eas
t com
pone
nt (
m/s
)
÷
-0.2
-0.1
0
0.1
0.2
Nor
th c
ompo
nent
(m
/s)
ø
0
90
180
270
360
Dire
ctio
n (T
O)
÷
0
0.1
0.2
0.3
0.4
Spe
ed (
m/s
)
ù
-0.2
-0.1
0
0.1
0.2
Eas
t com
pone
nt (
m/s
)
÷
-0.2
-0.1
0
0.1
0.2
Nor
th c
ompo
nent
(m
/s)
ø
0
90
180
270
360
Dire
ctio
n (T
O)
÷
0
0.1
0.2
0.3
0.4
Spe
ed (
m/s
)
ù
ú û ® ° ± ² é Ì ´ µ ² ¶ · ° ± ² ¹ º · » ¼ û ¹ ¾ ¶ À ¹  » ¹ ² ¼ ¼ ² ¹ º ¹ ¶ · Å ² ¹ ¾ Ú ° ± ± ² À È · ¶ È È Å ² Ö » û À È ô » » í · û È ² Ê ¼ » � ² ±Â ² È ² ± Ê µ ¶ Ë Ì ³ ³ Í �
Þ Þ
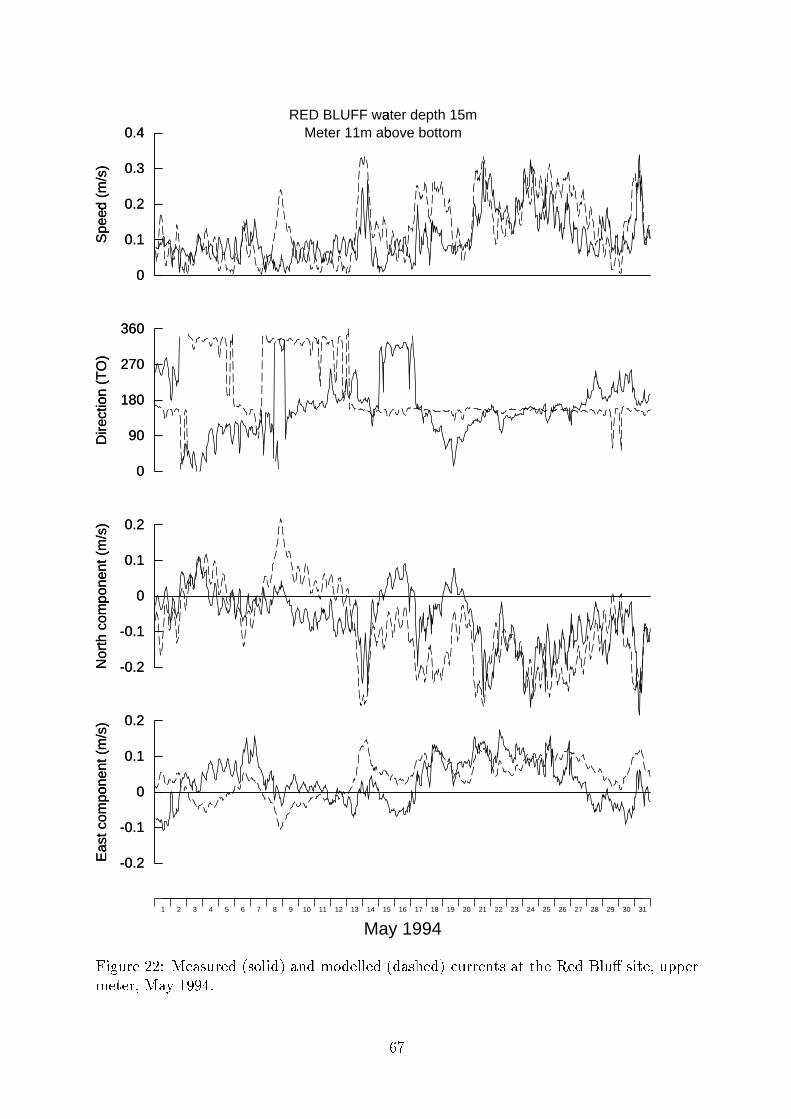
RED BLUFF water depth 15m �
Meter 11m above bottom ö
May 19941 2 3 4 5 6 7 8 9 10 11 12 13 14 15 16 17 18 19 20 21 22 23 24 25 26 27 28 29 30 31
-0.2
-0.1
0
0.1
0.2
Eas
t com
pone
nt (
m/s
)
÷
-0.2
-0.1
0
0.1
0.2
Nor
th c
ompo
nent
(m
/s)
ø
0
90
180
270
360
Dire
ctio
n (T
O)
÷
0
0.1
0.2
0.3
0.4
Spe
ed (
m/s
)
ù
-0.2
-0.1
0
0.1
0.2
Eas
t com
pone
nt (
m/s
)
÷
-0.2
-0.1
0
0.1
0.2
Nor
th c
ompo
nent
(m
/s)
ø
0
90
180
270
360
Dire
ctio
n (T
O)
÷
0
0.1
0.2
0.3
0.4
Spe
ed (
m/s
)
ù
ú û ® ° ± ² é é ´ µ ² ¶ · ° ± ² ¹ º · » ¼ û ¹ ¾ ¶ À ¹  » ¹ ² ¼ ¼ ² ¹ º ¹ ¶ · Å ² ¹ ¾ Ú ° ± ± ² À È · ¶ È È Å ² � ² ¹ � ¼ ° Û · û È ² Ê ° ÿ ÿ ² ±Â ² È ² ± Ê µ ¶ Ë Ì ³ ³ Í �
Þ ð

RED BLUFF water depth 15m �
Meter 3.75m above bottom �
May 19941 2 3 4 5 6 7 8 9 10 11 12 13 14 15 16 17 18 19 20 21 22 23 24 25 26 27 28 29 30 31
-0.2
-0.1
0
0.1
0.2
Eas
t com
pone
nt (
m/s
)
÷
-0.2
-0.1
0
0.1
0.2
Nor
th c
ompo
nent
(m
/s)
ø
0
90
180
270
360
Dire
ctio
n (T
O)
÷
0
0.1
0.2
0.3
0.4
Spe
ed (
m/s
)
ù
-0.2
-0.1
0
0.1
0.2
Eas
t com
pone
nt (
m/s
)
÷
-0.2
-0.1
0
0.1
0.2
Nor
th c
ompo
nent
(m
/s)
ø
0
90
180
270
360
Dire
ctio
n (T
O)
÷
0
0.1
0.2
0.3
0.4
Spe
ed (
m/s
)
ù
ú û ® ° ± ² é ò ´ µ ² ¶ · ° ± ² ¹ º · » ¼ û ¹ ¾ ¶ À ¹  » ¹ ² ¼ ¼ ² ¹ º ¹ ¶ · Å ² ¹ ¾ Ú ° ± ± ² À È · ¶ È È Å ² � ² ¹ � ¼ ° Û · û È ² Ê ¼ » � ² ±Â ² È ² ± Ê µ ¶ Ë Ì ³ ³ Í �
Þ õ

290000 328000
290000� 328000�
5745000
5775000
5745000�
5775000�
E1
E2
E3
ú û ® ° ± ² é Í ´ � û È ² · � Å ² ± ² ô � � � � ì Ú ° ± ± ² À È · � ² ± ² Ú » Â ÿ ¶ ± ² ¹ � û È Å Â » ¹ ² ¼ Ú ° ± ± ² À È · Ê µ ¶ Ë Ì ³ ³ Í �
Þ ³

-1
-0.5 0
0.5 1
East component (m/s)"
-1
-0.5 0
0.5 1
North component (m/s)#
0 90
180
270
360
Direction (TO)"
0
0.5 1
1.5 2
Speed (m/s)
$
-1
-0.5 0
0.5 1
East component (m/s)"
-1
-0.5 0
0.5 1
North component (m/s)#
0 90
180
270
360
Direction (TO)"
0
0.5 1
1.5 2
Speed (m/s)
$
67
89
1011
May 1994
úû®°
±²éÎ
´µ
²¶·°±²¹
º·»¼û¹¾
¶À¹
»
¹²¼¼²¹
º¹¶·Å
²¹¾
Ú°±±²À
È·¶È
ÿ»ûÀ
È%
Ìʵ
¶Ë̳³Í
�
ð Ó

-1
-0.5 0
0.5 1
East component (m/s)"
-1
-0.5 0
0.5 1
North component (m/s)#
0 90
180
270
360
Direction (TO)"
0
0.5 1
1.5 2
Speed (m/s)
$
-1
-0.5 0
0.5 1
East component (m/s)"
-1
-0.5 0
0.5 1
North component (m/s)#
0 90
180
270
360
Direction (TO)"
0
0.5 1
1.5 2
Speed (m/s)
$
67
89
1011
May 1994
úû®°
±²éÞ
´µ
²¶·°±²¹
º·»¼û¹¾
¶À¹
»
¹²¼¼²¹
º¹¶·Å
²¹¾
Ú°±±²À
È·¶È
ÿ»ûÀ
È%
éÊ
µ¶Ë
̳³Í�
ð Ì

-1
-0.5 0
0.5 1
East component (m/s)"
-1
-0.5 0
0.5 1
North component (m/s)#
0 90
180
270
360
Direction (TO)"
0
0.5 1
1.5 2
Speed (m/s)
$
-1
-0.5 0
0.5 1
East component (m/s)"
-1
-0.5 0
0.5 1
North component (m/s)#
0 90
180
270
360
Direction (TO)"
0
0.5 1
1.5 2
Speed (m/s)
$
67
89
1011
May 1994
úû®°
±²é
ð ´µ
²¶·°±²¹
º·»¼û¹¾
¶À¹
»
¹²¼¼²¹
º¹¶·Å
²¹¾
Ú°±±²À
È·¶È
ÿ»ûÀ
È%
òÊ
µ¶Ë
̳³Í�
ð é

MARTHA POINT water depth 17m Meter 13m above bottom ö
May 19941 2 3 4 5 6 7 8 9 10 11 12 13 14 15 16 17 18 19 20 21 22 23 24 25 26 27 28 29 30 31
-0.2
-0.1
0
0.1
0.2
Eas
t com
pone
nt (
m/s
)
÷
-0.2
-0.1
0
0.1
0.2
Nor
th c
ompo
nent
(m
/s)
ø
0
90
180
270
360
Dire
ctio
n (T
O)
÷
0
0.1
0.2
0.3
0.4
Spe
ed (
m/s
)
ù
-0.2
-0.1
0
0.1
0.2
Eas
t com
pone
nt (
m/s
)
÷
-0.2
-0.1
0
0.1
0.2
Nor
th c
ompo
nent
(m
/s)
ø
0
90
180
270
360
Dire
ctio
n (T
O)
÷
0
0.1
0.2
0.3
0.4
Spe
ed (
m/s
)
ù
ú û ® ° ± ² é õ ´ µ ² ¶ · ° ± ² ¹ º · » ¼ û ¹ ¾ ¶ À ¹ Â » ¹ ² ¼ ¼ ² ¹ º ¹ ¶ · Å ² ¹ ¾ ¼ » � ÿ ¶ · · � ¼ È ² ± ² ¹ Ú ° ± ± ² À È · ¶ È È Å ²µ ¶ ± È Å ¶ Ö » û À È · û È ² Ê ° ÿ ÿ ² ± Â ² È ² ± Ê µ ¶ Ë Ì ³ ³ Í �
ð ò

MARTHA POINT water depth 17m Meter 4.25m above bottom �
May 19941 2 3 4 5 6 7 8 9 10 11 12 13 14 15 16 17 18 19 20 21 22 23 24 25 26 27 28 29 30 31
-0.2
-0.1
0
0.1
0.2
Eas
t com
pone
nt (
m/s
)
÷
-0.2
-0.1
0
0.1
0.2
Nor
th c
ompo
nent
(m
/s)
ø
0
90
180
270
360
Dire
ctio
n (T
O)
÷
0
0.1
0.2
0.3
0.4
Spe
ed (
m/s
)
ù
-0.2
-0.1
0
0.1
0.2
Eas
t com
pone
nt (
m/s
)
÷
-0.2
-0.1
0
0.1
0.2
Nor
th c
ompo
nent
(m
/s)
ø
0
90
180
270
360
Dire
ctio
n (T
O)
÷
0
0.1
0.2
0.3
0.4
Spe
ed (
m/s
)
ù
ú û ® ° ± ² é ³ ´ µ ² ¶ · ° ± ² ¹ º · » ¼ û ¹ ¾ ¶ À ¹ Â » ¹ ² ¼ ¼ ² ¹ º ¹ ¶ · Å ² ¹ ¾ ¼ » � ÿ ¶ · · � ¼ È ² ± ² ¹ Ú ° ± ± ² À È · ¶ È È Å ²µ ¶ ± È Å ¶ Ö » û À È · û È ² Ê ¼ » � ² ± Â ² È ² ± Ê µ ¶ Ë Ì ³ ³ Í �
ð Í

−0.2 −0.1 0 0.1 0.2−0.2
−0.1
0
0.1
0.2
Mod
elle
d
Top meter, East Current
Martha Point (May 1994)
No.Pts = 557
Slope = 0.721Error = 0.033Intcpt = 0.015R = 0.678
−0.2 −0.1 0 0.1 0.2−0.2
−0.1
0
0.1
0.2Top meter, North Current
No.Pts = 557
Slope = 0.339Error = 0.042Intcpt = −0.024R = 0.324
−0.2 −0.1 0 0.1 0.2−0.2
−0.1
0
0.1
0.2
Observed
Mod
elle
d
Bottom meter, East Current
No.Pts = 696
Slope = −0.591Error = 0.064Intcpt = −0.033R = −0.329
−0.2 −0.1 0 0.1 0.2−0.2
−0.1
0
0.1
0.2
Observed
Bottom meter, North Current
No.Pts = 696
Slope = 0.447Error = 0.015Intcpt = −0.0038R = 0.755
ú û ® ° ± ² ò Ó ´ � � · ² ± Ç ² ¹ º ( * ¶ ( û · ¾ Ç ² ± · ° · Â » ¹ ² ¼ ¼ ² ¹ º Ë * ¶ ( û · ¾ ¼ » � ÿ ¶ · · � ¼ È ² ± ² ¹ Ú ° ± ± ² À È Ú » Â ÿ » À ² À È ·. » ± È Å ² µ ¶ ± È Å ¶ Ö » û À È Â » » ± û À ® Ê µ ¶ Ë Ì ³ ³ Í �
ð Î

GREAT SANDS water depth 23m �Meter 19m above bottom ö
May 19941 2 3 4 5 6 7 8 9 10 11 12 13 14 15 16 17 18 19 20 21 22 23 24 25 26 27 28 29 30 31
-0.2
-0.1
0
0.1
0.2
Eas
t com
pone
nt (
m/s
)
÷
-0.2
-0.1
0
0.1
0.2
Nor
th c
ompo
nent
(m
/s)
ø
0
90
180
270
360
Dire
ctio
n (T
O)
÷
0
0.1
0.2
0.3
0.4
Spe
ed (
m/s
)
ù
-0.2
-0.1
0
0.1
0.2
Eas
t com
pone
nt (
m/s
)
÷
-0.2
-0.1
0
0.1
0.2
Nor
th c
ompo
nent
(m
/s)
ø
0
90
180
270
360
Dire
ctio
n (T
O)
÷
0
0.1
0.2
0.3
0.4
Spe
ed (
m/s
)
ù
ú û ® ° ± ² ò Ì ´ µ ² ¶ · ° ± ² ¹ º · » ¼ û ¹ ¾ ¶ À ¹  » ¹ ² ¼ ¼ ² ¹ º ¹ ¶ · Å ² ¹ ¾ ¼ » � ÿ ¶ · · � ¼ È ² ± ² ¹ Ú ° ± ± ² À È · ¶ È È Å ² É ± ² ¶ È� ¶ À ¹ · · û È ² Ê ° ÿ ÿ ² ±  ² È ² ± Ê µ ¶ Ë Ì ³ ³ Í �
ð Þ

GREAT SANDS water depth 23m �Meter 6m above bottom ö
May 19941 2 3 4 5 6 7 8 9 10 11 12 13 14 15 16 17 18 19 20 21 22 23 24 25 26 27 28 29 30 31
-0.2
-0.1
0
0.1
0.2
Eas
t com
pone
nt (
m/s
)
÷
-0.2
-0.1
0
0.1
0.2
Nor
th c
ompo
nent
(m
/s)
ø
0
90
180
270
360
Dire
ctio
n (T
O)
÷
0
0.1
0.2
0.3
0.4
Spe
ed (
m/s
)
ù
-0.2
-0.1
0
0.1
0.2
Eas
t com
pone
nt (
m/s
)
÷
-0.2
-0.1
0
0.1
0.2
Nor
th c
ompo
nent
(m
/s)
ø
0
90
180
270
360
Dire
ctio
n (T
O)
÷
0
0.1
0.2
0.3
0.4
Spe
ed (
m/s
)
ù
ú û ® ° ± ² ò é ´ µ ² ¶ · ° ± ² ¹ º · » ¼ û ¹ ¾ ¶ À ¹  » ¹ ² ¼ ¼ ² ¹ º ¹ ¶ · Å ² ¹ ¾ ¼ » � ÿ ¶ · · � ¼ È ² ± ² ¹ Ú ° ± ± ² À È · ¶ È È Å ² É ± ² ¶ È� ¶ À ¹ · · û È ² Ê ¼ » � ² ±  ² È ² ± Ê µ ¶ Ë Ì ³ ³ Í �
ð ð
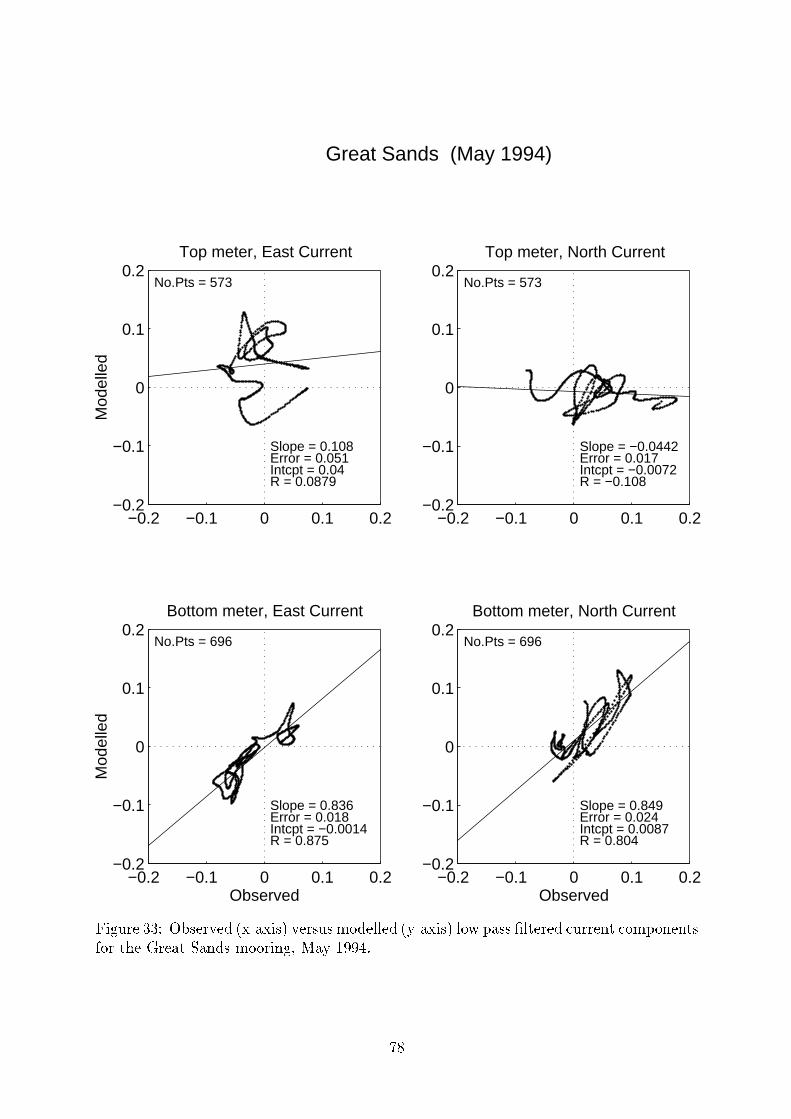
−0.2 −0.1 0 0.1 0.2−0.2
−0.1
0
0.1
0.2
Mod
elle
d
Top meter, East Current
Great Sands (May 1994)
No.Pts = 573
Slope = 0.108Error = 0.051Intcpt = 0.04R = 0.0879
−0.2 −0.1 0 0.1 0.2−0.2
−0.1
0
0.1
0.2Top meter, North Current
No.Pts = 573
Slope = −0.0442Error = 0.017Intcpt = −0.0072R = −0.108
−0.2 −0.1 0 0.1 0.2−0.2
−0.1
0
0.1
0.2
Observed
Mod
elle
d
Bottom meter, East Current
No.Pts = 696
Slope = 0.836Error = 0.018Intcpt = −0.0014R = 0.875
−0.2 −0.1 0 0.1 0.2−0.2
−0.1
0
0.1
0.2
Observed
Bottom meter, North Current
No.Pts = 696
Slope = 0.849Error = 0.024Intcpt = 0.0087R = 0.804
ú û ® ° ± ² ò ò ´ � � · ² ± Ç ² ¹ º ( * ¶ ( û · ¾ Ç ² ± · ° · Â » ¹ ² ¼ ¼ ² ¹ º Ë * ¶ ( û · ¾ ¼ » � ÿ ¶ · · � ¼ È ² ± ² ¹ Ú ° ± ± ² À È Ú » Â ÿ » À ² À È ·. » ± È Å ² É ± ² ¶ È � ¶ À ¹ · Â » » ± û À ® Ê µ ¶ Ë Ì ³ ³ Í �
ð õ

CENTRAL BAY water depth 24m �Meter 19m above bottom ö
May 19941 2 3 4 5 6 7 8 9 10 11 12 13 14 15 16 17 18 19 20 21 22 23 24 25 26 27 28 29 30 31
-0.2
-0.1
0
0.1
0.2
Eas
t com
pone
nt (
m/s
)
÷
-0.2
-0.1
0
0.1
0.2
Nor
th c
ompo
nent
(m
/s)
ø
0
90
180
270
360
Dire
ctio
n (T
O)
÷
0
0.1
0.2
0.3
0.4
Spe
ed (
m/s
)
ù
-0.2
-0.1
0
0.1
0.2
Eas
t com
pone
nt (
m/s
)
÷
-0.2
-0.1
0
0.1
0.2
Nor
th c
ompo
nent
(m
/s)
ø
0
90
180
270
360
Dire
ctio
n (T
O)
÷
0
0.1
0.2
0.3
0.4
Spe
ed (
m/s
)
ù
ú û ® ° ± ² ò Í ´ µ ² ¶ · ° ± ² ¹ º · » ¼ û ¹ ¾ ¶ À ¹ Â » ¹ ² ¼ ¼ ² ¹ º ¹ ¶ · Å ² ¹ ¾ ¼ » � ÿ ¶ · · � ¼ È ² ± ² ¹ Ú ° ± ± ² À È · ¶ È È Å ²ô ² À È ± ¶ ¼ � ¶ Ë · û È ² Ê ° ÿ ÿ ² ± Â ² È ² ± Ê µ ¶ Ë Ì ³ ³ Í �
ð ³

CENTRAL BAY water depth 24m �Meter 5.75m above bottom �
May 19941 2 3 4 5 6 7 8 9 10 11 12 13 14 15 16 17 18 19 20 21 22 23 24 25 26 27 28 29 30 31
-0.2
-0.1
0
0.1
0.2
Eas
t com
pone
nt (
m/s
)
÷
-0.2
-0.1
0
0.1
0.2
Nor
th c
ompo
nent
(m
/s)
ø
0
90
180
270
360
Dire
ctio
n (T
O)
÷
0
0.1
0.2
0.3
0.4
Spe
ed (
m/s
)
ù
-0.2
-0.1
0
0.1
0.2
Eas
t com
pone
nt (
m/s
)
÷
-0.2
-0.1
0
0.1
0.2
Nor
th c
ompo
nent
(m
/s)
ø
0
90
180
270
360
Dire
ctio
n (T
O)
÷
0
0.1
0.2
0.3
0.4
Spe
ed (
m/s
)
ù
ú û ® ° ± ² ò Î ´ µ ² ¶ · ° ± ² ¹ º · » ¼ û ¹ ¾ ¶ À ¹ Â » ¹ ² ¼ ¼ ² ¹ º ¹ ¶ · Å ² ¹ ¾ ¼ » � ÿ ¶ · · � ¼ È ² ± ² ¹ Ú ° ± ± ² À È · ¶ È È Å ²ô ² À È ± ¶ ¼ � ¶ Ë · û È ² Ê ¼ » � ² ± Â ² È ² ± Ê µ ¶ Ë Ì ³ ³ Í �
õ Ó

−0.2 −0.1 0 0.1 0.2−0.2
−0.1
0
0.1
0.2
Mod
elle
d
Top meter, East Current
Central Bay (May 1994)
No.Pts = 696
Slope = −0.0455Error = 0.028Intcpt = 0.036R = −0.0626
−0.2 −0.1 0 0.1 0.2−0.2
−0.1
0
0.1
0.2Top meter, North Current
No.Pts = 696
Slope = 0.539Error = 0.018Intcpt = 0.00063R = 0.75
−0.2 −0.1 0 0.1 0.2−0.2
−0.1
0
0.1
0.2
Observed
Mod
elle
d
Bottom meter, East Current
No.Pts = 696
Slope = −0.298Error = 0.072Intcpt = −0.012R = −0.155
−0.2 −0.1 0 0.1 0.2−0.2
−0.1
0
0.1
0.2
Observed
Bottom meter, North Current
No.Pts = 696
Slope = 0.662Error = 0.019Intcpt = 0.021R = 0.801
ú û ® ° ± ² ò Þ ´ � � · ² ± Ç ² ¹ º ( * ¶ ( û · ¾ Ç ² ± · ° · Â » ¹ ² ¼ ¼ ² ¹ º Ë * ¶ ( û · ¾ ¼ » � ÿ ¶ · · � ¼ È ² ± ² ¹ Ú ° ± ± ² À È Ú » Â ÿ » À ² À È ·. » ± È Å ² ô ² À È ± ¶ ¼ � ¶ Ë Â » » ± û À ® Ê µ ¶ Ë Ì ³ ³ Í �
õ Ì

POINT COOK water depth 10m �Meter 6m above bottom ö
May 19941 2 3 4 5 6 7 8 9 10 11 12 13 14 15 16 17 18 19 20 21 22 23 24 25 26 27 28 29 30 31
-0.2
-0.1
0
0.1
0.2
Eas
t com
pone
nt (
m/s
)
÷
-0.2
-0.1
0
0.1
0.2
Nor
th c
ompo
nent
(m
/s)
ø
0
90
180
270
360
Dire
ctio
n (T
O)
÷
0
0.1
0.2
0.3
0.4
Spe
ed (
m/s
)
ù
-0.2
-0.1
0
0.1
0.2
Eas
t com
pone
nt (
m/s
)
÷
-0.2
-0.1
0
0.1
0.2
Nor
th c
ompo
nent
(m
/s)
ø
0
90
180
270
360
Dire
ctio
n (T
O)
÷
0
0.1
0.2
0.3
0.4
Spe
ed (
m/s
)
ù
ú û ® ° ± ² ò ð ´ µ ² ¶ · ° ± ² ¹ º · » ¼ û ¹ ¾ ¶ À ¹ Â » ¹ ² ¼ ¼ ² ¹ º ¹ ¶ · Å ² ¹ ¾ ¼ » � ÿ ¶ · · � ¼ È ² ± ² ¹ Ú ° ± ± ² À È · ¶ È È Å ² Ö » û À Èô » » í · û È ² Ê ° ÿ ÿ ² ± Â ² È ² ± Ê µ ¶ Ë Ì ³ ³ Í �
õ é

POINT COOK water depth 10m �Meter 2.5m above bottom �
May 19941 2 3 4 5 6 7 8 9 10 11 12 13 14 15 16 17 18 19 20 21 22 23 24 25 26 27 28 29 30 31
-0.2
-0.1
0
0.1
0.2
Eas
t com
pone
nt (
m/s
)
÷
-0.2
-0.1
0
0.1
0.2
Nor
th c
ompo
nent
(m
/s)
ø
0
90
180
270
360
Dire
ctio
n (T
O)
÷
0
0.1
0.2
0.3
0.4
Spe
ed (
m/s
)
ù
-0.2
-0.1
0
0.1
0.2
Eas
t com
pone
nt (
m/s
)
÷
-0.2
-0.1
0
0.1
0.2
Nor
th c
ompo
nent
(m
/s)
ø
0
90
180
270
360
Dire
ctio
n (T
O)
÷
0
0.1
0.2
0.3
0.4
Spe
ed (
m/s
)
ù
ú û ® ° ± ² ò õ ´ µ ² ¶ · ° ± ² ¹ º · » ¼ û ¹ ¾ ¶ À ¹ Â » ¹ ² ¼ ¼ ² ¹ º ¹ ¶ · Å ² ¹ ¾ ¼ » � ÿ ¶ · · � ¼ È ² ± ² ¹ Ú ° ± ± ² À È · ¶ È È Å ² Ö » û À Èô » » í · û È ² Ê ¼ » � ² ± Â ² È ² ± Ê µ ¶ Ë Ì ³ ³ Í �
õ ò

−0.2 −0.1 0 0.1 0.2−0.2
−0.1
0
0.1
0.2
Mod
elle
d
Top meter, East Current
Point Cook (May 1994)
No.Pts = 696
Slope = 0.625Error = 0.013Intcpt = −0.028R = 0.881
−0.2 −0.1 0 0.1 0.2−0.2
−0.1
0
0.1
0.2Top meter, North Current
No.Pts = 696
Slope = 1.15Error = 0.046Intcpt = −0.027R = 0.684
−0.2 −0.1 0 0.1 0.2−0.2
−0.1
0
0.1
0.2
Observed
Mod
elle
d
Bottom meter, East Current
No.Pts = 696
Slope = 0.859Error = 0.017Intcpt = −0.025R = 0.891
−0.2 −0.1 0 0.1 0.2−0.2
−0.1
0
0.1
0.2
Observed
Bottom meter, North Current
No.Pts = 696
Slope = 0.000513Error = 0.034Intcpt = −0.0045R = 0.000566
ú û ® ° ± ² ò ³ ´ � � · ² ± Ç ² ¹ º ( * ¶ ( û · ¾ Ç ² ± · ° · Â » ¹ ² ¼ ¼ ² ¹ º Ë * ¶ ( û · ¾ ¼ » � ÿ ¶ · · � ¼ È ² ± ² ¹ Ú ° ± ± ² À È Ú » Â ÿ » À ² À È ·. » ± È Å ² Ö » û À È ô » » í Â » » ± û À ® Ê µ ¶ Ë Ì ³ ³ Í �
õ Í

RED BLUFF water depth 15m �
Meter 11m above bottom ö
May 19941 2 3 4 5 6 7 8 9 10 11 12 13 14 15 16 17 18 19 20 21 22 23 24 25 26 27 28 29 30 31
-0.2
-0.1
0
0.1
0.2
Eas
t com
pone
nt (
m/s
)
÷
-0.2
-0.1
0
0.1
0.2
Nor
th c
ompo
nent
(m
/s)
ø
0
90
180
270
360
Dire
ctio
n (T
O)
÷
0
0.1
0.2
0.3
0.4
Spe
ed (
m/s
)
ù
-0.2
-0.1
0
0.1
0.2
Eas
t com
pone
nt (
m/s
)
÷
-0.2
-0.1
0
0.1
0.2
Nor
th c
ompo
nent
(m
/s)
ø
0
90
180
270
360
Dire
ctio
n (T
O)
÷
0
0.1
0.2
0.3
0.4
Spe
ed (
m/s
)
ù
ú û ® ° ± ² Í Ó ´ µ ² ¶ · ° ± ² ¹ º · » ¼ û ¹ ¾ ¶ À ¹  » ¹ ² ¼ ¼ ² ¹ º ¹ ¶ · Å ² ¹ ¾ ¼ » � ÿ ¶ · · � ¼ È ² ± ² ¹ Ú ° ± ± ² À È · ¶ È È Å ² � ² ¹� ¼ ° Û · û È ² Ê ° ÿ ÿ ² ±  ² È ² ± Ê µ ¶ Ë Ì ³ ³ Í �
õ Î
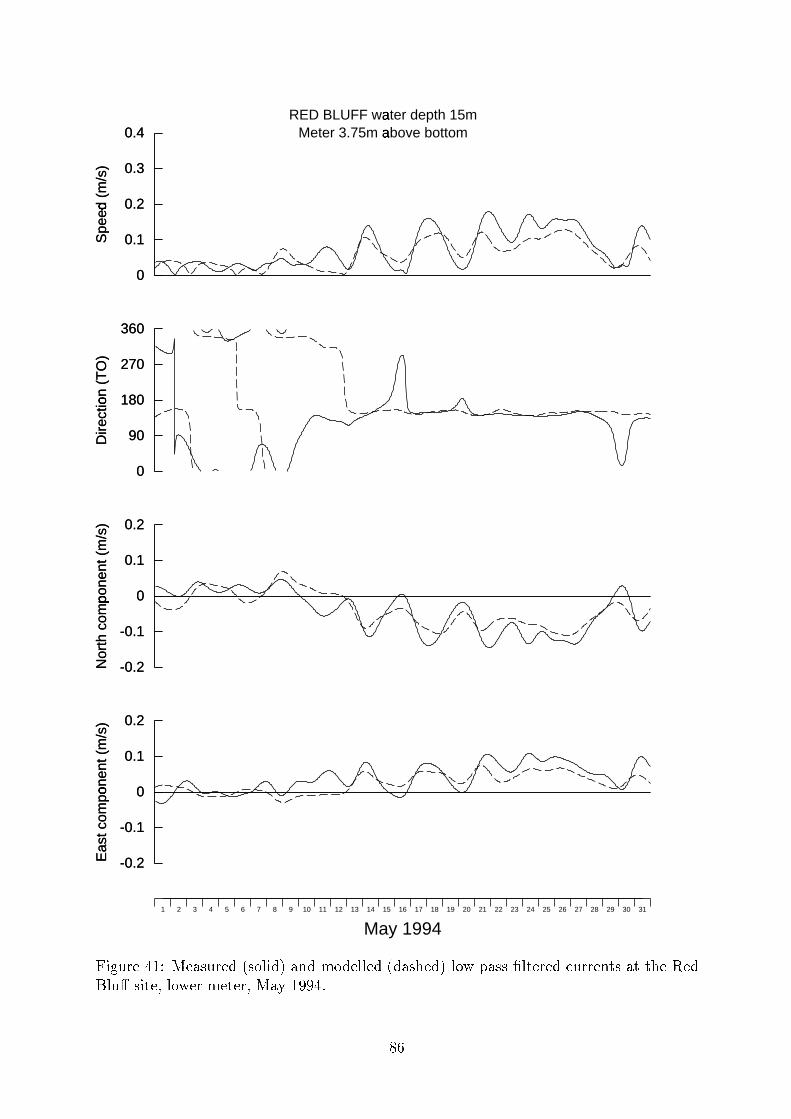
RED BLUFF water depth 15m �
Meter 3.75m above bottom �
May 19941 2 3 4 5 6 7 8 9 10 11 12 13 14 15 16 17 18 19 20 21 22 23 24 25 26 27 28 29 30 31
-0.2
-0.1
0
0.1
0.2
Eas
t com
pone
nt (
m/s
)
÷
-0.2
-0.1
0
0.1
0.2
Nor
th c
ompo
nent
(m
/s)
ø
0
90
180
270
360
Dire
ctio
n (T
O)
÷
0
0.1
0.2
0.3
0.4
Spe
ed (
m/s
)
ù
-0.2
-0.1
0
0.1
0.2
Eas
t com
pone
nt (
m/s
)
÷
-0.2
-0.1
0
0.1
0.2
Nor
th c
ompo
nent
(m
/s)
ø
0
90
180
270
360
Dire
ctio
n (T
O)
÷
0
0.1
0.2
0.3
0.4
Spe
ed (
m/s
)
ù
ú û ® ° ± ² Í Ì ´ µ ² ¶ · ° ± ² ¹ º · » ¼ û ¹ ¾ ¶ À ¹  » ¹ ² ¼ ¼ ² ¹ º ¹ ¶ · Å ² ¹ ¾ ¼ » � ÿ ¶ · · � ¼ È ² ± ² ¹ Ú ° ± ± ² À È · ¶ È È Å ² � ² ¹� ¼ ° Û · û È ² Ê ¼ » � ² ±  ² È ² ± Ê µ ¶ Ë Ì ³ ³ Í �
õ Þ
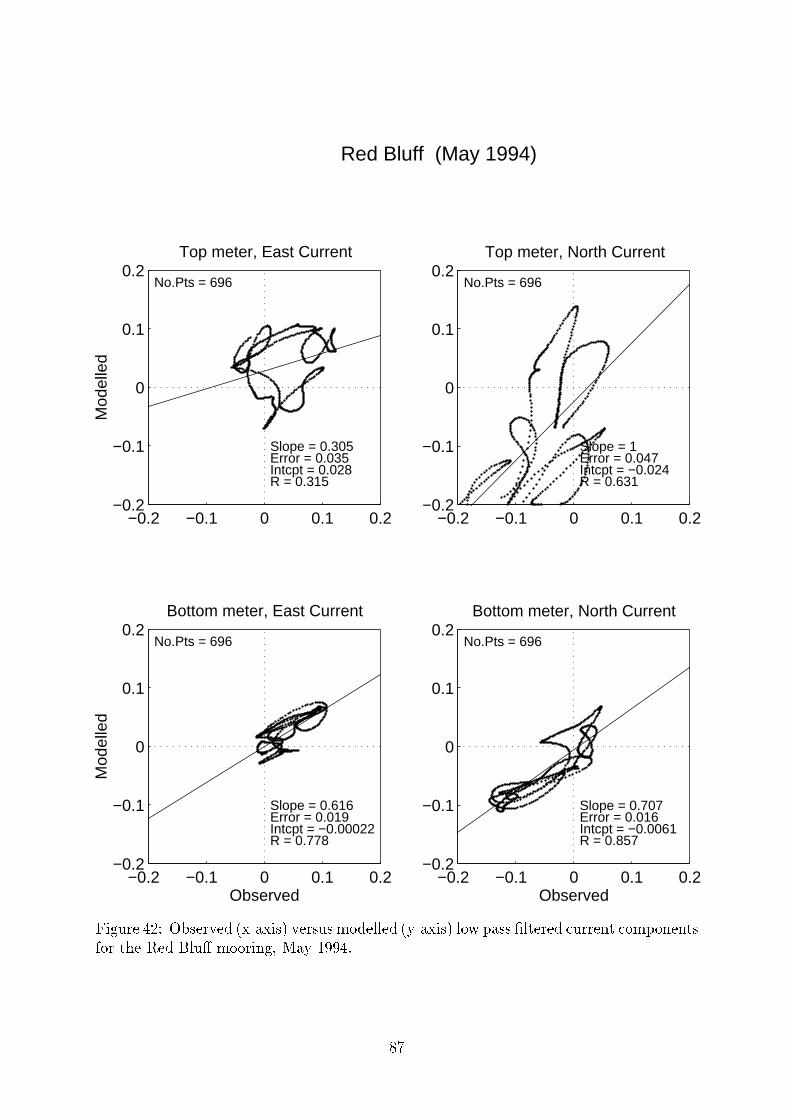
−0.2 −0.1 0 0.1 0.2−0.2
−0.1
0
0.1
0.2
Mod
elle
d
Top meter, East Current
Red Bluff (May 1994)
No.Pts = 696
Slope = 0.305Error = 0.035Intcpt = 0.028R = 0.315
−0.2 −0.1 0 0.1 0.2−0.2
−0.1
0
0.1
0.2Top meter, North Current
No.Pts = 696
Slope = 1Error = 0.047Intcpt = −0.024R = 0.631
−0.2 −0.1 0 0.1 0.2−0.2
−0.1
0
0.1
0.2
Observed
Mod
elle
d
Bottom meter, East Current
No.Pts = 696
Slope = 0.616Error = 0.019Intcpt = −0.00022R = 0.778
−0.2 −0.1 0 0.1 0.2−0.2
−0.1
0
0.1
0.2
Observed
Bottom meter, North Current
No.Pts = 696
Slope = 0.707Error = 0.016Intcpt = −0.0061R = 0.857
ú û ® ° ± ² Í é ´ � � · ² ± Ç ² ¹ º ( * ¶ ( û · ¾ Ç ² ± · ° · Â » ¹ ² ¼ ¼ ² ¹ º Ë * ¶ ( û · ¾ ¼ » � ÿ ¶ · · � ¼ È ² ± ² ¹ Ú ° ± ± ² À È Ú » Â ÿ » À ² À È ·. » ± È Å ² � ² ¹ � ¼ ° Û Â » » ± û À ® Ê µ ¶ Ë Ì ³ ³ Í �
õ ð

Upper meter Lower meter
0.05 m/s
Martha Point
Great Sands
Central Bay
Point Cook
Red Bluff
ú û ® ° ± ² Í ò ´ ê ² Ú È » ±  ² ¶ À Ú ° ± ± ² À È · . » ± È Å ² ² À È û ± ² µ ¶ Ë Ì ³ ³ Í Ú ° ± ± ² À È Â ² È ² ± ¹ ² ÿ ¼ » Ë Â ² À È ÿ ² ± û » ¹ �µ ² ¶ · ° ± ² ¹ ¹ ¶ È ¶ ¶ ± ² · Å » � À ¶ · � ¼ ¶ Ú í ¶ ± ± » � · Ê Â » ¹ ² ¼ ± ² · ° ¼ È · ¶ ± ² · Å » � À ¶ · ® ± ² Ë ¶ ± ± » � · � 4 Å ²
¶ ± ± » � ¶ È È Å ² È » ÿ » . È Å ² � ® ° ± ² û À ¹ û Ú ¶ È ² · ¶ Â ¶ ® À û È ° ¹ ² » . Ó � Ó Î Â 6 · � » ± È Å û · È » � ¶ ± ¹ · È Å ²
È » ÿ » . È Å ² ÿ ¶ ® ² �
õ õ

319 : 31;31.5<
32= >
32.5?
33@
33.5A33
.5B
34
C D
34E F
34.5
G35
265000 340000
265000 340000
5745000
5815000
5745000
5815000
ú û ® ° ± ² Í Í ´ � ° ± . ¶ Ú ² º Ó * é Â ¾ · ¶ ¼ û À û È Ë Â ² ¶ · ° ± ² ¹ � Ë ô 4 ì Ê ò * Í µ ¶ Ë Ì ³ ³ Í �
31
I
31.5J
32
K L
32.5M
32.5N
33
33O33P P
33.5Q
33.5R33.5
S
34T U
34
34.5V
34.5
W
35
35
265000 340000
265000 340000
5745000
5815000
5745000
5815000
ú û ® ° ± ² Í Î ´ � ° ± . ¶ Ú ² º Ó * é  ¾ · ¶ ¼ û À û È Ë . ± »   » ¹ ² ¼ Ê Ó Ó ´ Ó Ó Í µ ¶ Ë Ì ³ ³ Í�
õ ³

31.5
X32Y Z
32[
32
\ ]
32^32.5_ 33`
33.5a
33.5b
34c
34d
34e34
.5f
34.5
g
35h i35j k
265000 340000
265000 340000
5745000
5815000
5745000
5815000
ú û ® ° ± ² Í Þ ´ � ° ± . ¶ Ú ² º Ó * é Â ¾ · ¶ ¼ û À û È Ë Â ² ¶ · ° ± ² ¹ � Ë ô 4 ì Ê Ì é * Ì Þ µ ¶ Ë Ì ³ ³ Í �
31.5l
32
m n32
.5o33p p
33q3333
r r
33.5
s33.5t
34
34u
34.5v35
w x
35
y z35{ |
265000 340000
265000 340000
5745000
5815000
5745000
5815000
ú û ® ° ± ² Í ð ´ � ° ± . ¶ Ú ² º Ó * é  ¾ · ¶ ¼ û À û È Ë . ± »   » ¹ ² ¼ Ê Ó Ó ´ Ó Ó Ì Þ µ ¶ Ë Ì ³ ³ Í�
³ Ó

14
14.5}
14.5~
14.5�
15
�
15� �
15.5�
15.5
�
15.5
�
15.5�15.5�
16
16�
265000 340000
265000 340000
5745000
5815000
5745000
5815000
ú û ® ° ± ² Í õ ´ � ° ± . ¶ Ú ² º Ó * é Â ¾ È ² Â ÿ ² ± ¶ È ° ± ² Â ² ¶ · ° ± ² ¹ � Ë ô 4 ì Ê ò * Í µ ¶ Ë Ì ³ ³ Í �14
14.5�15� �
15� �
15�
15.5�
15.5� 16� �
16�
265000 340000
265000 340000
5745000
5815000
5745000
5815000
ú û ® ° ± ² Í ³ ´ � ° ± . ¶ Ú ² º Ó * é  ¾ È ²  ÿ ² ± ¶ È ° ± ² . ± »   » ¹ ² ¼ Ê Ó Ó ´ Ó Ó Í µ ¶ Ë Ì ³ ³ Í�
³ Ì

13.5�
13.5
� 14
14
14
14
14�
14� �
14
14.5�
14.5
�
15� �
265000 340000
265000 340000
5745000
5815000
5745000
5815000
ú û ® ° ± ² Î Ó ´ � ° ± . ¶ Ú ² º Ó * é Â ¾ È ² Â ÿ ² ± ¶ È ° ± ² Â ² ¶ · ° ± ² ¹ � Ë ô 4 ì Ê Ì é * Ì Þ µ ¶ Ë Ì ³ ³ Í �
9�9.5
10.5
�
10.5 11
¡
11
11.5¢
12
£ ¤
12
12.5¥
13
¦ § 13.5¨
14©
14ª «
14.5
¬
1515® ¯
15
° ±
265000 340000
265000 340000
5745000
5815000
5745000
5815000
ú û ® ° ± ² Î Ì ´ � ° ± . ¶ Ú ² º Ó * é  ¾ È ²  ÿ ² ± ¶ È ° ± ² . ± »   » ¹ ² ¼ Ê Ó Ó ´ Ó Ó Ì Þ µ ¶ Ë Ì ³ ³ Í�
³ é

-1
-0.5
0
0.5
1
Ele
vatio
n (m
)
²
September 1994³
October 1994
´
1
µ
2
¶
3
·
4
¸
5
¹
6
º
7
»
8
¼
9
½
10 11 12 13 14 15 16 17 18 19 20 21 22 23 24 25 26 27 28 29 30 1
µ
2
¶
3
·
4
¸
5
¹
6
º
7
»
8
¼
9
½
10 11 12 13 14
úû®°
±²Î é
´µ
²¶·°±²¹
º·»¼û¹¾
¶À¹
»
¹²¼¼²¹
º¹¶·Å
²¹¾
²¼²Ç¶Èû»À¶È
ɲ²¼»À
®Ê
�²ÿȲÂ
�²±
̳³Í
³ò
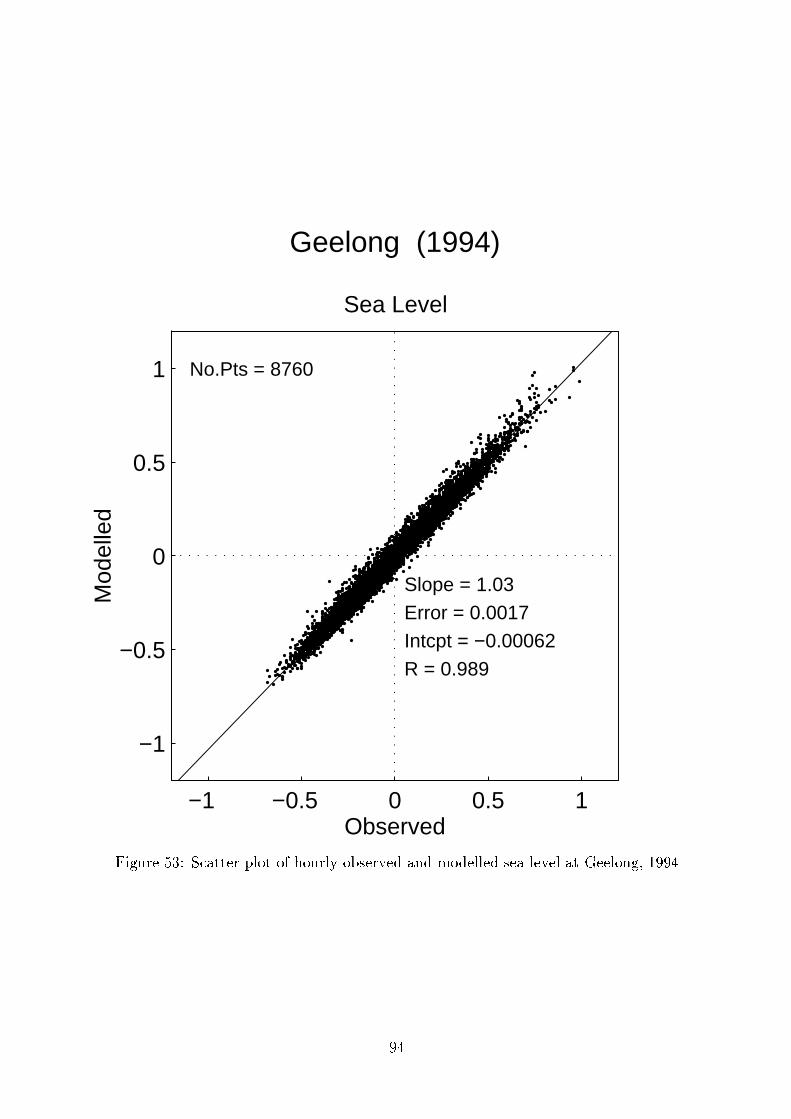
−1 −0.5 0 0.5 1
−1
−0.5
0
0.5
1
Observed
Mod
elle
d
Sea Level
Geelong (1994)
No.Pts = 8760
Slope = 1.03Error = 0.0017Intcpt = −0.00062R = 0.989
ú û ® ° ± ² Î ò ´ � Ú ¶ È È ² ± ÿ ¼ » È » . Å » ° ± ¼ Ë » � · ² ± Ç ² ¹ ¶ À ¹ Â » ¹ ² ¼ ¼ ² ¹ · ² ¶ * ¼ ² Ç ² ¼ ¶ È É ² ² ¼ » À ® Ê Ì ³ ³ Í
³ Í

-1
-0.5
0
0.5
1
Ele
vatio
n (m
)
²
September 1994
³
October 1994
´
1
µ
2
¶
3
·
4
¸
5
¹
6
º
7
»
8
¼
9
½
10 11 12 13 14 15 16 17 18 19 20 21 22 23 24 25 26 27 28 29 30 1
µ
2
¶
3
·
4
¸
5
¹
6
º
7
»
8
¼
9
½
10 11 12 13 14
úû®°
±²Î Í
´µ
²¶·°±²¹
º·»¼û¹¾
¶À¹
»
¹²¼¼²¹
º¹¶·Å
²¹¾
²¼²Ç¶Èû»À¶È
ԻDz¼¼
Öû¼²Ê
�²ÿȲÂ
�²±
̳³Í
³Î

−1 −0.5 0 0.5 1
−1
−0.5
0
0.5
1
Observed
Mod
elle
d
Sea Level
Hovell Pile (1994)
No.Pts = 8668
Slope = 1.06Error = 0.0016Intcpt = 0.12R = 0.99
ú û ® ° ± ² Î Î ´ � Ú ¶ È È ² ± ÿ ¼ » È » . Å » ° ± ¼ Ë » � · ² ± Ç ² ¹ ¶ À ¹ Â » ¹ ² ¼ ¼ ² ¹ · ² ¶ * ¼ ² Ç ² ¼ ¶ È Ô » Ç ² ¼ ¼ Ö û ¼ ² Ê Ì ³ ³ Í
³ Þ

-1
-0.5
0
0.5
1
Ele
vatio
n (m
)
²
September 1994
³
October 1994
´
1
µ
2
¶
3
·
4
¸
5
¹
6
º
7
»
8
¼
9
½
10 11 12 13 14 15 16 17 18 19 20 21 22 23 24 25 26 27 28 29 30 1
µ
2
¶
3
·
4
¸
5
¹
6
º
7
»
8
¼
9
½
10 11 12 13 14
úû®°
±²ÎÞ
´µ
²¶·°±²¹
º·»¼û¹¾
¶À¹
»
¹²¼¼²¹
º¹¶·Å
²¹¾
²¼²Ç¶Èû»À¶È
Ø°
²²À·Ú¼ûÛ
Ê�²ÿ
Ȳ�
²±Ì³³Í
³ð

−1 −0.5 0 0.5 1
−1
−0.5
0
0.5
1
Observed
Mod
elle
d
Sea Level
Queenscliff (1994)
No.Pts = 8438
Slope = 1.08Error = 0.0018Intcpt = −0.0019R = 0.988
ú û ® ° ± ² Î ð ´ � Ú ¶ È È ² ± ÿ ¼ » È » . Å » ° ± ¼ Ë » � · ² ± Ç ² ¹ ¶ À ¹ Â » ¹ ² ¼ ¼ ² ¹ · ² ¶ * ¼ ² Ç ² ¼ ¶ È Ø ° ² ² À · Ú ¼ û Û Ê Ì ³ ³ Í
³ õ

-1
-0.5
0
0.5
1
Ele
vatio
n (m
)
²
September 1994
³
October 1994
´
1
µ
2
¶
3
·
4
¸
5
¹
6
º
7
»
8
¼
9
½
10 11 12 13 14 15 16 17 18 19 20 21 22 23 24 25 26 27 28 29 30 1
µ
2
¶
3
·
4
¸
5
¹
6
º
7
»
8
¼
9
½
10 11 12 13 14
úû®°
±²Îõ
´µ
²¶·°±²¹
º·»¼û¹¾
¶À¹
»
¹²¼¼²¹
º¹¶·Å
²¹¾
²¼²Ç¶Èû»À¶È
êûÚÈ»±û¶
ì»
ÚíÊ
�²ÿȲÂ
�²±
̳³Í
³³

−1 −0.5 0 0.5 1
−1
−0.5
0
0.5
1
Observed
Mod
elle
d
Sea Level
Victoria Dock (1994)
No.Pts = 8024
Slope = 0.992Error = 0.0011Intcpt = 0.066R = 0.995
ú û ® ° ± ² Î ³ ´ � Ú ¶ È È ² ± ÿ ¼ » È » . Å » ° ± ¼ Ë » � · ² ± Ç ² ¹ ¶ À ¹ Â » ¹ ² ¼ ¼ ² ¹ · ² ¶ * ¼ ² Ç ² ¼ ¶ È ê û Ú È » ± û ¶ ì » Ú í Ê Ì ³ ³ Í
Ì Ó Ó
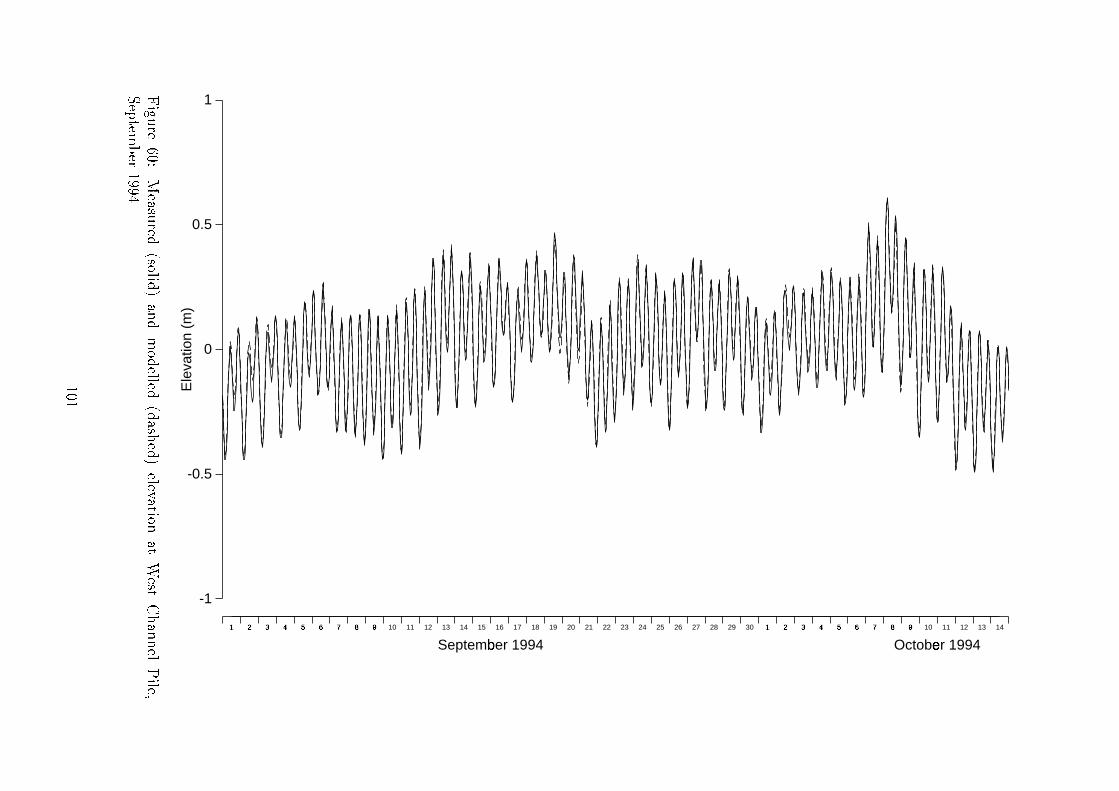
-1
-0.5
0
0.5
1
Ele
vatio
n (m
)
²
September 1994
³
October 1994
´
1
µ
2
¶
3
·
4
¸
5
¹
6
º
7
»
8
¼
9
½
10 11 12 13 14 15 16 17 18 19 20 21 22 23 24 25 26 27 28 29 30 1
µ
2
¶
3
·
4
¸
5
¹
6
º
7
»
8
¼
9
½
10 11 12 13 14
úû®°
±²Þ Ó
´µ
²¶·°±²¹
º·»¼û¹¾
¶À¹
»
¹²¼¼²¹
º¹¶·Å
²¹¾
²¼²Ç¶Èû»À¶È
ó²·È
ôÅ
¶ÀÀ
²¼Ö
û¼²Ê�²ÿ
Ȳ�
²±Ì³³Í
ÌÓÌ

−1 −0.5 0 0.5 1
−1
−0.5
0
0.5
1
Observed
Mod
elle
d
Sea Level
West Channel Pile (1994)
No.Pts = 7585
Slope = 0.988Error = 0.0011Intcpt = 0.0076R = 0.996
ú û ® ° ± ² Þ Ì ´ � Ú ¶ È È ² ± ÿ ¼ » È » . Å » ° ± ¼ Ë » � · ² ± Ç ² ¹ ¶ À ¹ Â » ¹ ² ¼ ¼ ² ¹ · ² ¶ * ¼ ² Ç ² ¼ ¶ È ó ² · È ô Å ¶ À À ² ¼ Ö û ¼ ² Ê
Ì ³ ³ Í
Ì Ó é

MARTHA POINT water depth 17m Meter 13m above bottom Á
September 1994Á October 1994Â1 2 3 4 5 6 7 8 9 10 11 12 13 14 15 16 17 18 19 20 21 22 23 24 25 26 27 28 29 30 1 2 3 4 5 6 7 8 9 10 11 12 13 14
-0.2
-0.1
0
0.1
0.2
Eas
t com
pone
nt (
m/s
)
Ã
-0.2
-0.1
0
0.1
0.2
Nor
th c
ompo
nent
(m
/s)
Ä
0
90
180
270
360
Dire
ctio
n (T
O)
Ã
0
0.1
0.2
0.3
0.4
Spe
ed (
m/s
)
Å
-0.2
-0.1
0
0.1
0.2
Eas
t com
pone
nt (
m/s
)
Ã
-0.2
-0.1
0
0.1
0.2
Nor
th c
ompo
nent
(m
/s)
Ä
0
90
180
270
360
Dire
ctio
n (T
O)
Ã
0
0.1
0.2
0.3
0.4
Spe
ed (
m/s
)
Å
ú û ® ° ± ² Þ é ´ µ ² ¶ · ° ± ² ¹ º · » ¼ û ¹ ¾ ¶ À ¹ Â » ¹ ² ¼ ¼ ² ¹ º ¹ ¶ · Å ² ¹ ¾ Ú ° ± ± ² À È · ¶ È È Å ² µ ¶ ± È Å ¶ Ö » û À È · û È ² Ê° ÿ ÿ ² ± Â ² È ² ± Ê � ² ÿ È ² Â � ² ± * � Ú È » � ² ± Ì ³ ³ Í �
Ì Ó ò

MARTHA POINT water depth 17m Meter 4.25m above bottom È
September 1994Á October 1994Â1 2 3 4 5 6 7 8 9 10 11 12 13 14 15 16 17 18 19 20 21 22 23 24 25 26 27 28 29 30 1 2 3 4 5 6 7 8 9 10 11 12 13 14
-0.2
-0.1
0
0.1
0.2
Eas
t com
pone
nt (
m/s
)
Ã
-0.2
-0.1
0
0.1
0.2
Nor
th c
ompo
nent
(m
/s)
Ä
0
90
180
270
360
Dire
ctio
n (T
O)
Ã
0
0.1
0.2
0.3
0.4
Spe
ed (
m/s
)
Å
-0.2
-0.1
0
0.1
0.2
Eas
t com
pone
nt (
m/s
)
Ã
-0.2
-0.1
0
0.1
0.2
Nor
th c
ompo
nent
(m
/s)
Ä
0
90
180
270
360
Dire
ctio
n (T
O)
Ã
0
0.1
0.2
0.3
0.4
Spe
ed (
m/s
)
Å
ú û ® ° ± ² Þ ò ´ µ ² ¶ · ° ± ² ¹ º · » ¼ û ¹ ¾ ¶ À ¹  » ¹ ² ¼ ¼ ² ¹ º ¹ ¶ · Å ² ¹ ¾ Ú ° ± ± ² À È · ¶ È È Å ² µ ¶ ± È Å ¶ Ö » û À È · û È ² ʼ » � ² ±  ² È ² ± Ê � ² ÿ È ²  � ² ± * � Ú È » � ² ± Ì ³ ³ Í �
Ì Ó Í
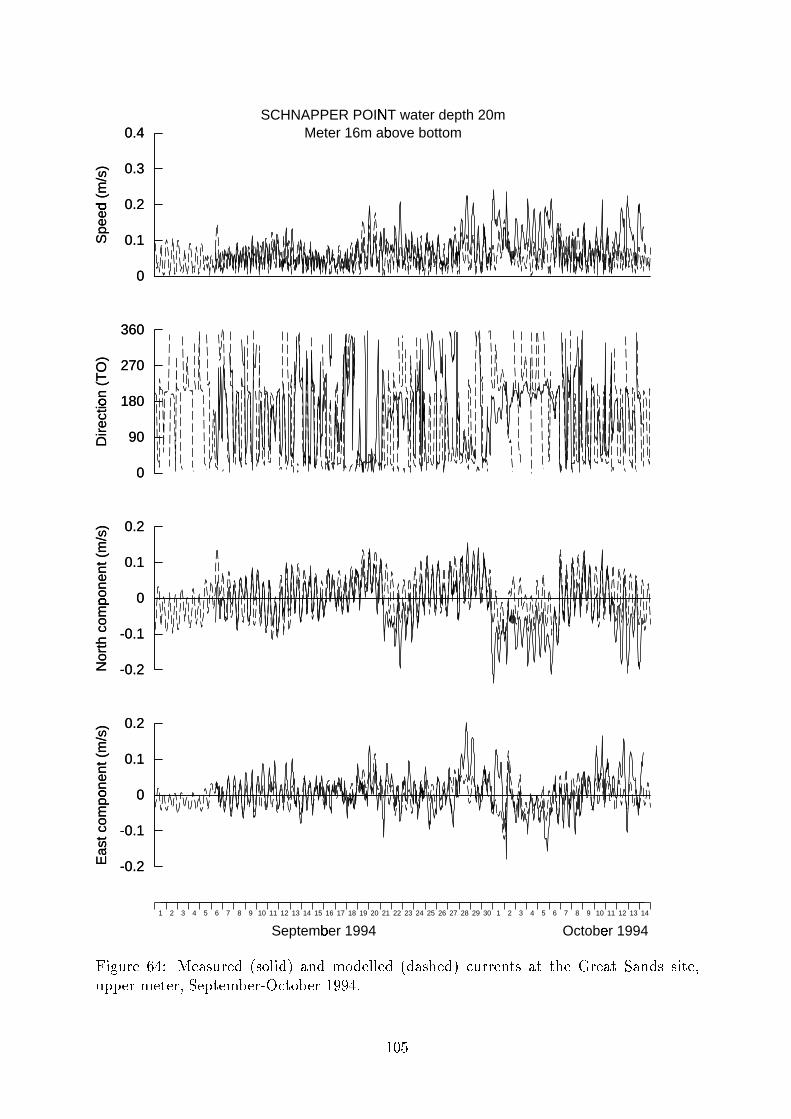
SCHNAPPER POINT water depth 20m ÉMeter 16m above bottom Á
September 1994Á October 1994Â1 2 3 4 5 6 7 8 9 10 11 12 13 14 15 16 17 18 19 20 21 22 23 24 25 26 27 28 29 30 1 2 3 4 5 6 7 8 9 10 11 12 13 14
-0.2
-0.1
0
0.1
0.2
Eas
t com
pone
nt (
m/s
)
Ã
-0.2
-0.1
0
0.1
0.2
Nor
th c
ompo
nent
(m
/s)
Ä
0
90
180
270
360
Dire
ctio
n (T
O)
Ã
0
0.1
0.2
0.3
0.4
Spe
ed (
m/s
)
Å
-0.2
-0.1
0
0.1
0.2
Eas
t com
pone
nt (
m/s
)
Ã
-0.2
-0.1
0
0.1
0.2
Nor
th c
ompo
nent
(m
/s)
Ä
0
90
180
270
360
Dire
ctio
n (T
O)
Ã
0
0.1
0.2
0.3
0.4
Spe
ed (
m/s
)
Å
ú û ® ° ± ² Þ Í ´ µ ² ¶ · ° ± ² ¹ º · » ¼ û ¹ ¾ ¶ À ¹ Â » ¹ ² ¼ ¼ ² ¹ º ¹ ¶ · Å ² ¹ ¾ Ú ° ± ± ² À È · ¶ È È Å ² É ± ² ¶ È � ¶ À ¹ · · û È ² Ê° ÿ ÿ ² ± Â ² È ² ± Ê � ² ÿ È ² Â � ² ± * � Ú È » � ² ± Ì ³ ³ Í �
Ì Ó Î

SCHNAPPER POINT water depth 20m ÉMeter 5m above bottom Á
September 1994Á October 1994Â1 2 3 4 5 6 7 8 9 10 11 12 13 14 15 16 17 18 19 20 21 22 23 24 25 26 27 28 29 30 1 2 3 4 5 6 7 8 9 10 11 12 13 14
-0.2
-0.1
0
0.1
0.2
Eas
t com
pone
nt (
m/s
)
Ã
-0.2
-0.1
0
0.1
0.2
Nor
th c
ompo
nent
(m
/s)
Ä
0
90
180
270
360
Dire
ctio
n (T
O)
Ã
0
0.1
0.2
0.3
0.4
Spe
ed (
m/s
)
Å
-0.2
-0.1
0
0.1
0.2
Eas
t com
pone
nt (
m/s
)
Ã
-0.2
-0.1
0
0.1
0.2
Nor
th c
ompo
nent
(m
/s)
Ä
0
90
180
270
360
Dire
ctio
n (T
O)
Ã
0
0.1
0.2
0.3
0.4
Spe
ed (
m/s
)
Å
ú û ® ° ± ² Þ Î ´ µ ² ¶ · ° ± ² ¹ º · » ¼ û ¹ ¾ ¶ À ¹  » ¹ ² ¼ ¼ ² ¹ º ¹ ¶ · Å ² ¹ ¾ Ú ° ± ± ² À È · ¶ È È Å ² É ± ² ¶ È � ¶ À ¹ · · û È ² ʼ » � ² ±  ² È ² ± Ê � ² ÿ È ²  � ² ± * � Ú È » � ² ± Ì ³ ³ Í �
Ì Ó Þ
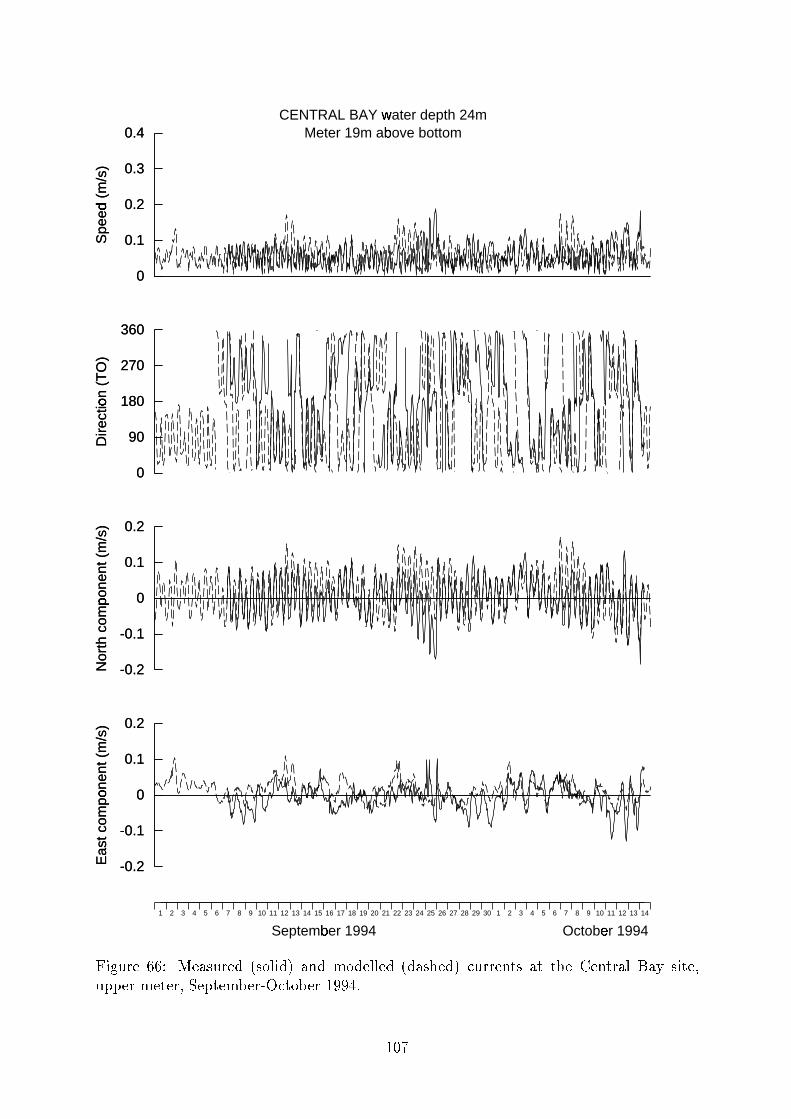
CENTRAL BAY water depth 24m ÊMeter 19m above bottom Á
September 1994Á October 1994Â1 2 3 4 5 6 7 8 9 10 11 12 13 14 15 16 17 18 19 20 21 22 23 24 25 26 27 28 29 30 1 2 3 4 5 6 7 8 9 10 11 12 13 14
-0.2
-0.1
0
0.1
0.2
Eas
t com
pone
nt (
m/s
)
Ã
-0.2
-0.1
0
0.1
0.2
Nor
th c
ompo
nent
(m
/s)
Ä
0
90
180
270
360
Dire
ctio
n (T
O)
Ã
0
0.1
0.2
0.3
0.4
Spe
ed (
m/s
)
Å
-0.2
-0.1
0
0.1
0.2
Eas
t com
pone
nt (
m/s
)
Ã
-0.2
-0.1
0
0.1
0.2
Nor
th c
ompo
nent
(m
/s)
Ä
0
90
180
270
360
Dire
ctio
n (T
O)
Ã
0
0.1
0.2
0.3
0.4
Spe
ed (
m/s
)
Å
ú û ® ° ± ² Þ Þ ´ µ ² ¶ · ° ± ² ¹ º · » ¼ û ¹ ¾ ¶ À ¹ Â » ¹ ² ¼ ¼ ² ¹ º ¹ ¶ · Å ² ¹ ¾ Ú ° ± ± ² À È · ¶ È È Å ² ô ² À È ± ¶ ¼ � ¶ Ë · û È ² Ê° ÿ ÿ ² ± Â ² È ² ± Ê � ² ÿ È ² Â � ² ± * � Ú È » � ² ± Ì ³ ³ Í �
Ì Ó ð

CENTRAL BAY water depth 24m ÊMeter 6m above bottom Á
September 1994Á October 1994Â1 2 3 4 5 6 7 8 9 10 11 12 13 14 15 16 17 18 19 20 21 22 23 24 25 26 27 28 29 30 1 2 3 4 5 6 7 8 9 10 11 12 13 14
-0.2
-0.1
0
0.1
0.2
Eas
t com
pone
nt (
m/s
)
Ã
-0.2
-0.1
0
0.1
0.2
Nor
th c
ompo
nent
(m
/s)
Ä
0
90
180
270
360
Dire
ctio
n (T
O)
Ã
0
0.1
0.2
0.3
0.4
Spe
ed (
m/s
)
Å
-0.2
-0.1
0
0.1
0.2
Eas
t com
pone
nt (
m/s
)
Ã
-0.2
-0.1
0
0.1
0.2
Nor
th c
ompo
nent
(m
/s)
Ä
0
90
180
270
360
Dire
ctio
n (T
O)
Ã
0
0.1
0.2
0.3
0.4
Spe
ed (
m/s
)
Å
ú û ® ° ± ² Þ ð ´ µ » ¹ ² ¼ ¼ ² ¹ Ú ° ± ± ² À È · ¶ È È Å ² ô ² À È ± ¶ ¼ � ¶ Ë · û È ² Ê ¼ » � ² ± Â ² È ² ± Ê � ² ÿ È ² Â � ² ± * � Ú È » � ² ±
Ì ³ ³ Í � » ¹ ¶ È ¶ � ¶ · ± ² Ú » Ç ² ± ² ¹ . ± » Â È Å ² Â ² È ² ± ¶ È È Å û · · û È ² �
Ì Ó õ

POINT COOK water depth 10m ÊMeter 6m above bottom Á
September 1994Á October 1994Â1 2 3 4 5 6 7 8 9 10 11 12 13 14 15 16 17 18 19 20 21 22 23 24 25 26 27 28 29 30 1 2 3 4 5 6 7 8 9 10 11 12 13 14
-0.2
-0.1
0
0.1
0.2
Eas
t com
pone
nt (
m/s
)
Ã
-0.2
-0.1
0
0.1
0.2
Nor
th c
ompo
nent
(m
/s)
Ä
0
90
180
270
360
Dire
ctio
n (T
O)
Ã
0
0.1
0.2
0.3
0.4
Spe
ed (
m/s
)
Å
-0.2
-0.1
0
0.1
0.2
Eas
t com
pone
nt (
m/s
)
Ã
-0.2
-0.1
0
0.1
0.2
Nor
th c
ompo
nent
(m
/s)
Ä
0
90
180
270
360
Dire
ctio
n (T
O)
Ã
0
0.1
0.2
0.3
0.4
Spe
ed (
m/s
)
Å
ú û ® ° ± ² Þ õ ´ µ ² ¶ · ° ± ² ¹ º · » ¼ û ¹ ¾ ¶ À ¹  » ¹ ² ¼ ¼ ² ¹ º ¹ ¶ · Å ² ¹ ¾ Ú ° ± ± ² À È · ¶ È È Å ² Ö » û À È ô » » í · û È ² Ê ° ÿ ÿ ² ±Â ² È ² ± Ê � ² ÿ È ²  � ² ± * � Ú È » � ² ± Ì ³ ³ Í �
Ì Ó ³

POINT COOK water depth 10m ÊMeter 2.5m above bottom È
September 1994Á October 1994Â1 2 3 4 5 6 7 8 9 10 11 12 13 14 15 16 17 18 19 20 21 22 23 24 25 26 27 28 29 30 1 2 3 4 5 6 7 8 9 10 11 12 13 14
-0.2
-0.1
0
0.1
0.2
Eas
t com
pone
nt (
m/s
)
Ã
-0.2
-0.1
0
0.1
0.2
Nor
th c
ompo
nent
(m
/s)
Ä
0
90
180
270
360
Dire
ctio
n (T
O)
Ã
0
0.1
0.2
0.3
0.4
Spe
ed (
m/s
)
Å
-0.2
-0.1
0
0.1
0.2
Eas
t com
pone
nt (
m/s
)
Ã
-0.2
-0.1
0
0.1
0.2
Nor
th c
ompo
nent
(m
/s)
Ä
0
90
180
270
360
Dire
ctio
n (T
O)
Ã
0
0.1
0.2
0.3
0.4
Spe
ed (
m/s
)
Å
ú û ® ° ± ² Þ ³ ´ µ ² ¶ · ° ± ² ¹ º · » ¼ û ¹ ¾ ¶ À ¹  » ¹ ² ¼ ¼ ² ¹ º ¹ ¶ · Å ² ¹ ¾ Ú ° ± ± ² À È · ¶ È È Å ² Ö » û À È ô » » í · û È ² Ê ¼ » � ² ±Â ² È ² ± Ê � ² ÿ È ²  � ² ± * � Ú È » � ² ± Ì ³ ³ Í �
Ì Ì Ó
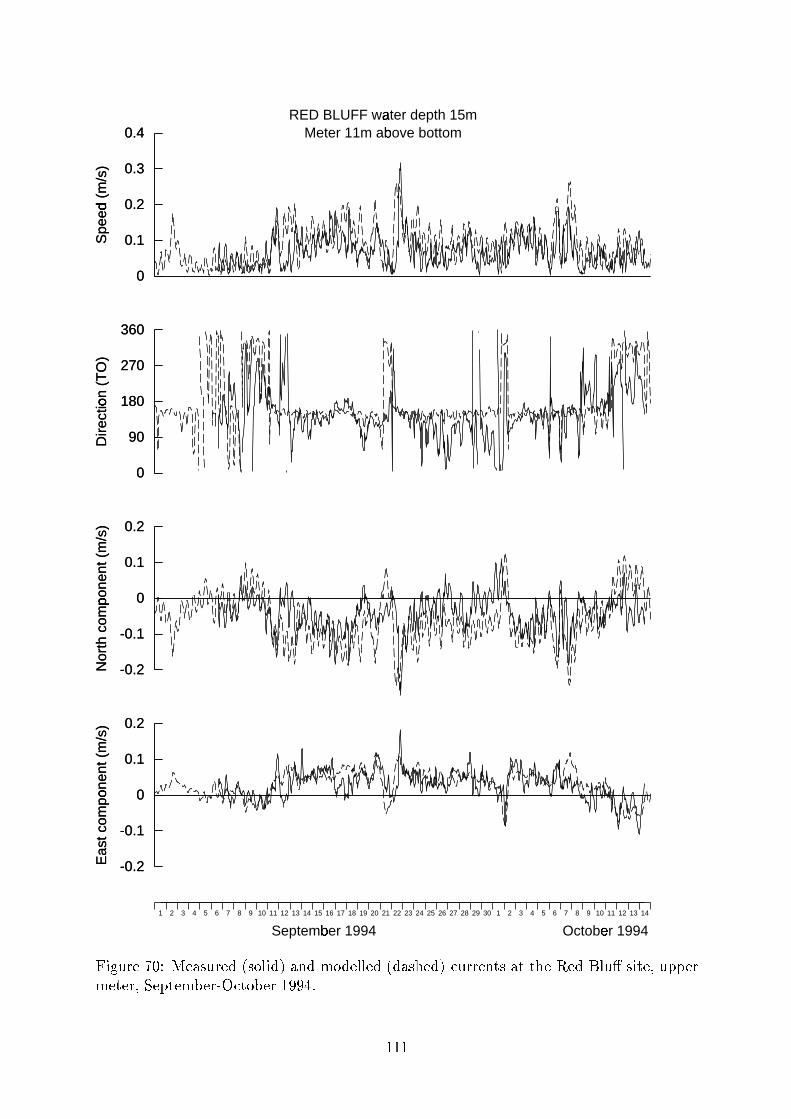
RED BLUFF water depth 15m ÈMeter 11m above bottom Á
September 1994Á October 1994Â1 2 3 4 5 6 7 8 9 10 11 12 13 14 15 16 17 18 19 20 21 22 23 24 25 26 27 28 29 30 1 2 3 4 5 6 7 8 9 10 11 12 13 14
-0.2
-0.1
0
0.1
0.2
Eas
t com
pone
nt (
m/s
)
Ã
-0.2
-0.1
0
0.1
0.2
Nor
th c
ompo
nent
(m
/s)
Ä
0
90
180
270
360
Dire
ctio
n (T
O)
Ã
0
0.1
0.2
0.3
0.4
Spe
ed (
m/s
)
Å
-0.2
-0.1
0
0.1
0.2
Eas
t com
pone
nt (
m/s
)
Ã
-0.2
-0.1
0
0.1
0.2
Nor
th c
ompo
nent
(m
/s)
Ä
0
90
180
270
360
Dire
ctio
n (T
O)
Ã
0
0.1
0.2
0.3
0.4
Spe
ed (
m/s
)
Å
ú û ® ° ± ² ð Ó ´ µ ² ¶ · ° ± ² ¹ º · » ¼ û ¹ ¾ ¶ À ¹  » ¹ ² ¼ ¼ ² ¹ º ¹ ¶ · Å ² ¹ ¾ Ú ° ± ± ² À È · ¶ È È Å ² � ² ¹ � ¼ ° Û · û È ² Ê ° ÿ ÿ ² ±Â ² È ² ± Ê � ² ÿ È ²  � ² ± * � Ú È » � ² ± Ì ³ ³ Í �
Ì Ì Ì

RED BLUFF water depth 15m ÈMeter 3.75m above bottom È
September 1994Á October 1994Â1 2 3 4 5 6 7 8 9 10 11 12 13 14 15 16 17 18 19 20 21 22 23 24 25 26 27 28 29 30 1 2 3 4 5 6 7 8 9 10 11 12 13 14
-0.2
-0.1
0
0.1
0.2
Eas
t com
pone
nt (
m/s
)
Ã
-0.2
-0.1
0
0.1
0.2
Nor
th c
ompo
nent
(m
/s)
Ä
0
90
180
270
360
Dire
ctio
n (T
O)
Ã
0
0.1
0.2
0.3
0.4
Spe
ed (
m/s
)
Å
-0.2
-0.1
0
0.1
0.2
Eas
t com
pone
nt (
m/s
)
Ã
-0.2
-0.1
0
0.1
0.2
Nor
th c
ompo
nent
(m
/s)
Ä
0
90
180
270
360
Dire
ctio
n (T
O)
Ã
0
0.1
0.2
0.3
0.4
Spe
ed (
m/s
)
Å
ú û ® ° ± ² ð Ì ´ µ » ¹ ² ¼ ¼ ² ¹ Ú ° ± ± ² À È · ¶ È È Å ² � ² ¹ � ¼ ° Û · û È ² Ê ¼ » � ² ± Â ² È ² ± Ê � ² ÿ È ² Â � ² ± * � Ú È » � ² ± Ì ³ ³ Í � » ¹ ¶ È ¶ � ¶ · ± ² Ú » Ç ² ± ² ¹ . ± » Â È Å ² Â ² È ² ± ¶ È È Å û · · û È ² �
Ì Ì é

MARTHA POINT water depth 17m Meter 13m above bottom Á
September 1994Á October 1994Â1 2 3 4 5 6 7 8 9 10 11 12 13 14 15 16 17 18 19 20 21 22 23 24 25 26 27 28 29 30 1 2 3 4 5 6 7 8 9 10 11 12 13 14
-0.2
-0.1
0
0.1
0.2
Eas
t com
pone
nt (
m/s
)
Ã
-0.2
-0.1
0
0.1
0.2
Nor
th c
ompo
nent
(m
/s)
Ä
0
90
180
270
360
Dire
ctio
n (T
O)
Ã
0
0.1
0.2
0.3
0.4
Spe
ed (
m/s
)
Å
-0.2
-0.1
0
0.1
0.2
Eas
t com
pone
nt (
m/s
)
Ã
-0.2
-0.1
0
0.1
0.2
Nor
th c
ompo
nent
(m
/s)
Ä
0
90
180
270
360
Dire
ctio
n (T
O)
Ã
0
0.1
0.2
0.3
0.4
Spe
ed (
m/s
)
Å
ú û ® ° ± ² ð é ´ µ ² ¶ · ° ± ² ¹ º · » ¼ û ¹ ¾ ¶ À ¹ Â » ¹ ² ¼ ¼ ² ¹ º ¹ ¶ · Å ² ¹ ¾ ¼ » � ÿ ¶ · · � ¼ È ² ± ² ¹ Ú ° ± ± ² À È · ¶ È È Å ²µ ¶ ± È Å ¶ Ö » û À È · û È ² Ê ° ÿ ÿ ² ± Â ² È ² ± Ê � ² ÿ È ² Â � ² ± * � Ú È » � ² ± Ì ³ ³ Í �
Ì Ì ò

MARTHA POINT water depth 17m Meter 4.25m above bottom È
September 1994Á October 1994Â1 2 3 4 5 6 7 8 9 10 11 12 13 14 15 16 17 18 19 20 21 22 23 24 25 26 27 28 29 30 1 2 3 4 5 6 7 8 9 10 11 12 13 14
-0.2
-0.1
0
0.1
0.2
Eas
t com
pone
nt (
m/s
)
Ã
-0.2
-0.1
0
0.1
0.2
Nor
th c
ompo
nent
(m
/s)
Ä
0
90
180
270
360
Dire
ctio
n (T
O)
Ã
0
0.1
0.2
0.3
0.4
Spe
ed (
m/s
)
Å
-0.2
-0.1
0
0.1
0.2
Eas
t com
pone
nt (
m/s
)
Ã
-0.2
-0.1
0
0.1
0.2
Nor
th c
ompo
nent
(m
/s)
Ä
0
90
180
270
360
Dire
ctio
n (T
O)
Ã
0
0.1
0.2
0.3
0.4
Spe
ed (
m/s
)
Å
ú û ® ° ± ² ð ò ´ µ ² ¶ · ° ± ² ¹ º · » ¼ û ¹ ¾ ¶ À ¹ Â » ¹ ² ¼ ¼ ² ¹ º ¹ ¶ · Å ² ¹ ¾ ¼ » � ÿ ¶ · · � ¼ È ² ± ² ¹ Ú ° ± ± ² À È · ¶ È È Å ²µ ¶ ± È Å ¶ Ö » û À È · û È ² Ê ¼ » � ² ± Â ² È ² ± Ê � ² ÿ È ² Â � ² ± * � Ú È » � ² ± Ì ³ ³ Í �
Ì Ì Í

−0.2 −0.1 0 0.1 0.2−0.2
−0.1
0
0.1
0.2
Mod
elle
d
Top meter, East Current
Martha Point (Sep 1994)
No.Pts = 863
Slope = 0.56Error = 0.03Intcpt = 0.028R = 0.537
−0.2 −0.1 0 0.1 0.2−0.2
−0.1
0
0.1
0.2Top meter, North Current
No.Pts = 863
Slope = 0.351Error = 0.028Intcpt = 0.003R = 0.389
−0.2 −0.1 0 0.1 0.2−0.2
−0.1
0
0.1
0.2
Observed
Mod
elle
d
Bottom meter, East Current
No.Pts = 864
Slope = 0.429Error = 0.017Intcpt = −0.0071R = 0.646
−0.2 −0.1 0 0.1 0.2−0.2
−0.1
0
0.1
0.2
Observed
Bottom meter, North Current
No.Pts = 864
Slope = 0.0966Error = 0.019Intcpt = 0.002R = 0.167
ú û ® ° ± ² ð Í ´ � � · ² ± Ç ² ¹ º ( * ¶ ( û · ¾ Ç ² ± · ° · Â » ¹ ² ¼ ¼ ² ¹ º Ë * ¶ ( û · ¾ ¼ » � ÿ ¶ · · � ¼ È ² ± ² ¹ Ú ° ± ± ² À È Ú » Â ÿ » À ² À È ·. » ± È Å ² µ ¶ ± È Å ¶ Ö » û À È Â » » ± û À ® Ê � ² ÿ È ² Â � ² ± * � Ú È » � ² ± Ì ³ ³ Í �
Ì Ì Î

SCHNAPPER POINT water depth 20m ÉMeter 16m above bottom Á
September 1994Á October 1994Â1 2 3 4 5 6 7 8 9 10 11 12 13 14 15 16 17 18 19 20 21 22 23 24 25 26 27 28 29 30 1 2 3 4 5 6 7 8 9 10 11 12 13 14
-0.2
-0.1
0
0.1
0.2
Eas
t com
pone
nt (
m/s
)
Ã
-0.2
-0.1
0
0.1
0.2
Nor
th c
ompo
nent
(m
/s)
Ä
0
90
180
270
360
Dire
ctio
n (T
O)
Ã
0
0.1
0.2
0.3
0.4
Spe
ed (
m/s
)
Å
-0.2
-0.1
0
0.1
0.2
Eas
t com
pone
nt (
m/s
)
Ã
-0.2
-0.1
0
0.1
0.2
Nor
th c
ompo
nent
(m
/s)
Ä
0
90
180
270
360
Dire
ctio
n (T
O)
Ã
0
0.1
0.2
0.3
0.4
Spe
ed (
m/s
)
Å
ú û ® ° ± ² ð Î ´ µ ² ¶ · ° ± ² ¹ º · » ¼ û ¹ ¾ ¶ À ¹  » ¹ ² ¼ ¼ ² ¹ º ¹ ¶ · Å ² ¹ ¾ ¼ » � ÿ ¶ · · � ¼ È ² ± ² ¹ Ú ° ± ± ² À È · ¶ È È Å ² É ± ² ¶ È� ¶ À ¹ · · û È ² Ê ° ÿ ÿ ² ±  ² È ² ± Ê � ² ÿ È ²  � ² ± * � Ú È » � ² ± Ì ³ ³ Í �
Ì Ì Þ

SCHNAPPER POINT water depth 20m ÉMeter 5m above bottom Á
September 1994Á October 1994Â1 2 3 4 5 6 7 8 9 10 11 12 13 14 15 16 17 18 19 20 21 22 23 24 25 26 27 28 29 30 1 2 3 4 5 6 7 8 9 10 11 12 13 14
-0.2
-0.1
0
0.1
0.2
Eas
t com
pone
nt (
m/s
)
Ã
-0.2
-0.1
0
0.1
0.2
Nor
th c
ompo
nent
(m
/s)
Ä
0
90
180
270
360
Dire
ctio
n (T
O)
Ã
0
0.1
0.2
0.3
0.4
Spe
ed (
m/s
)
Å
-0.2
-0.1
0
0.1
0.2
Eas
t com
pone
nt (
m/s
)
Ã
-0.2
-0.1
0
0.1
0.2
Nor
th c
ompo
nent
(m
/s)
Ä
0
90
180
270
360
Dire
ctio
n (T
O)
Ã
0
0.1
0.2
0.3
0.4
Spe
ed (
m/s
)
Å
ú û ® ° ± ² ð Þ ´ µ ² ¶ · ° ± ² ¹ º · » ¼ û ¹ ¾ ¶ À ¹  » ¹ ² ¼ ¼ ² ¹ º ¹ ¶ · Å ² ¹ ¾ ¼ » � ÿ ¶ · · � ¼ È ² ± ² ¹ Ú ° ± ± ² À È · ¶ È È Å ² É ± ² ¶ È� ¶ À ¹ · · û È ² Ê ¼ » � ² ±  ² È ² ± Ê � ² ÿ È ²  � ² ± * � Ú È » � ² ± Ì ³ ³ Í �
Ì Ì ð

−0.2 −0.1 0 0.1 0.2−0.2
−0.1
0
0.1
0.2
Mod
elle
d
Top meter, East Current
Schnapper Point (Sep 1994)
No.Pts = 865
Slope = 0.149Error = 0.018Intcpt = 0.0025R = 0.269
−0.2 −0.1 0 0.1 0.2−0.2
−0.1
0
0.1
0.2Top meter, North Current
No.Pts = 865
Slope = 0.434Error = 0.013Intcpt = 0.017R = 0.759
−0.2 −0.1 0 0.1 0.2−0.2
−0.1
0
0.1
0.2
Observed
Mod
elle
d
Bottom meter, East Current
No.Pts = 863
Slope = 0.139Error = 0.014Intcpt = 0.0024R = 0.331
−0.2 −0.1 0 0.1 0.2−0.2
−0.1
0
0.1
0.2
Observed
Bottom meter, North Current
No.Pts = 863
Slope = 0.359Error = 0.022Intcpt = 0.015R = 0.488
ú û ® ° ± ² ð ð ´ � � · ² ± Ç ² ¹ º ( * ¶ ( û · ¾ Ç ² ± · ° · Â » ¹ ² ¼ ¼ ² ¹ º Ë * ¶ ( û · ¾ ¼ » � ÿ ¶ · · � ¼ È ² ± ² ¹ Ú ° ± ± ² À È Ú » Â ÿ » À ² À È ·. » ± È Å ² � Ú Å À ¶ ÿ ÿ ² ± Ö » û À È Â » » ± û À ® Ê � ² ÿ È ² Â � ² ± * � Ú È » � ² ± Ì ³ ³ Í �
Ì Ì õ

CENTRAL BAY water depth 24m ÊMeter 19m above bottom Á
September 1994Á October 1994Â1 2 3 4 5 6 7 8 9 10 11 12 13 14 15 16 17 18 19 20 21 22 23 24 25 26 27 28 29 30 1 2 3 4 5 6 7 8 9 10 11 12 13 14
-0.2
-0.1
0
0.1
0.2
Eas
t com
pone
nt (
m/s
)
Ã
-0.2
-0.1
0
0.1
0.2
Nor
th c
ompo
nent
(m
/s)
Ä
0
90
180
270
360
Dire
ctio
n (T
O)
Ã
0
0.1
0.2
0.3
0.4
Spe
ed (
m/s
)
Å
-0.2
-0.1
0
0.1
0.2
Eas
t com
pone
nt (
m/s
)
Ã
-0.2
-0.1
0
0.1
0.2
Nor
th c
ompo
nent
(m
/s)
Ä
0
90
180
270
360
Dire
ctio
n (T
O)
Ã
0
0.1
0.2
0.3
0.4
Spe
ed (
m/s
)
Å
ú û ® ° ± ² ð õ ´ µ ² ¶ · ° ± ² ¹ º · » ¼ û ¹ ¾ ¶ À ¹ Â » ¹ ² ¼ ¼ ² ¹ º ¹ ¶ · Å ² ¹ ¾ ¼ » � ÿ ¶ · · � ¼ È ² ± ² ¹ Ú ° ± ± ² À È · ¶ È È Å ²ô ² À È ± ¶ ¼ � ¶ Ë · û È ² Ê ° ÿ ÿ ² ± Â ² È ² ± Ê � ² ÿ È ² Â � ² ± * � Ú È » � ² ± Ì ³ ³ Í �
Ì Ì ³

CENTRAL BAY water depth 24m ÊMeter 6m above bottom Á
September 1994Á October 1994Â1 2 3 4 5 6 7 8 9 10 11 12 13 14 15 16 17 18 19 20 21 22 23 24 25 26 27 28 29 30 1 2 3 4 5 6 7 8 9 10 11 12 13 14
-0.2
-0.1
0
0.1
0.2
Eas
t com
pone
nt (
m/s
)
Ã
-0.2
-0.1
0
0.1
0.2
Nor
th c
ompo
nent
(m
/s)
Ä
0
90
180
270
360
Dire
ctio
n (T
O)
Ã
0
0.1
0.2
0.3
0.4
Spe
ed (
m/s
)
Å
-0.2
-0.1
0
0.1
0.2
Eas
t com
pone
nt (
m/s
)
Ã
-0.2
-0.1
0
0.1
0.2
Nor
th c
ompo
nent
(m
/s)
Ä
0
90
180
270
360
Dire
ctio
n (T
O)
Ã
0
0.1
0.2
0.3
0.4
Spe
ed (
m/s
)
Å
ú û ® ° ± ² ð ³ ´ µ » ¹ ² ¼ ¼ ² ¹ ¼ » � ÿ ¶ · · � ¼ È ² ± ² ¹ Ú ° ± ± ² À È · ¶ È È Å ² ô ² À È ± ¶ ¼ � ¶ Ë · û È ² Ê ¼ » � ² ± Â ² È ² ± Ê
� ² ÿ È ² Â � ² ± * � Ú È » � ² ± Ì ³ ³ Í � » ¹ ¶ È ¶ � ¶ · ± ² Ú » Ç ² ± ² ¹ . ± » Â È Å ² Â ² È ² ± ¶ È È Å û · · û È ² �
Ì é Ó

−0.2 −0.1 0 0.1 0.2−0.2
−0.1
0
0.1
0.2
Mod
elle
d
Top meter, East Current
Central Bay (Sep 1994)
No.Pts = 842
Slope = 0.452Error = 0.026Intcpt = 0.015R = 0.516
−0.2 −0.1 0 0.1 0.2−0.2
−0.1
0
0.1
0.2Top meter, North Current
No.Pts = 842
Slope = 0.101Error = 0.039Intcpt = 0.018R = 0.0899
ú û ® ° ± ² õ Ó ´ � � · ² ± Ç ² ¹ º ( * ¶ ( û · ¾ Ç ² ± · ° · Â » ¹ ² ¼ ¼ ² ¹ º Ë * ¶ ( û · ¾ ¼ » � ÿ ¶ · · � ¼ È ² ± ² ¹ Ú ° ± ± ² À È Ú » Â ÿ » À ² À È ·. » ± È Å ² ô ² À È ± ¶ ¼ � ¶ Ë Â » » ± û À ® Ê � ² ÿ È ² Â � ² ± * � Ú È » � ² ± Ì ³ ³ Í �
Ì é Ì

POINT COOK water depth 10m ÊMeter 6m above bottom Á
September 1994Á October 1994Â1 2 3 4 5 6 7 8 9 10 11 12 13 14 15 16 17 18 19 20 21 22 23 24 25 26 27 28 29 30 1 2 3 4 5 6 7 8 9 10 11 12 13 14
-0.2
-0.1
0
0.1
0.2
Eas
t com
pone
nt (
m/s
)
Ã
-0.2
-0.1
0
0.1
0.2
Nor
th c
ompo
nent
(m
/s)
Ä
0
90
180
270
360
Dire
ctio
n (T
O)
Ã
0
0.1
0.2
0.3
0.4
Spe
ed (
m/s
)
Å
-0.2
-0.1
0
0.1
0.2
Eas
t com
pone
nt (
m/s
)
Ã
-0.2
-0.1
0
0.1
0.2
Nor
th c
ompo
nent
(m
/s)
Ä
0
90
180
270
360
Dire
ctio
n (T
O)
Ã
0
0.1
0.2
0.3
0.4
Spe
ed (
m/s
)
Å
ú û ® ° ± ² õ Ì ´ µ ² ¶ · ° ± ² ¹ º · » ¼ û ¹ ¾ ¶ À ¹ Â » ¹ ² ¼ ¼ ² ¹ º ¹ ¶ · Å ² ¹ ¾ ¼ » � ÿ ¶ · · � ¼ È ² ± ² ¹ Ú ° ± ± ² À È · ¶ È È Å ² Ö » û À Èô » » í · û È ² Ê ° ÿ ÿ ² ± Â ² È ² ± Ê � ² ÿ È ² Â � ² ± * � Ú È » � ² ± Ì ³ ³ Í �
Ì é é
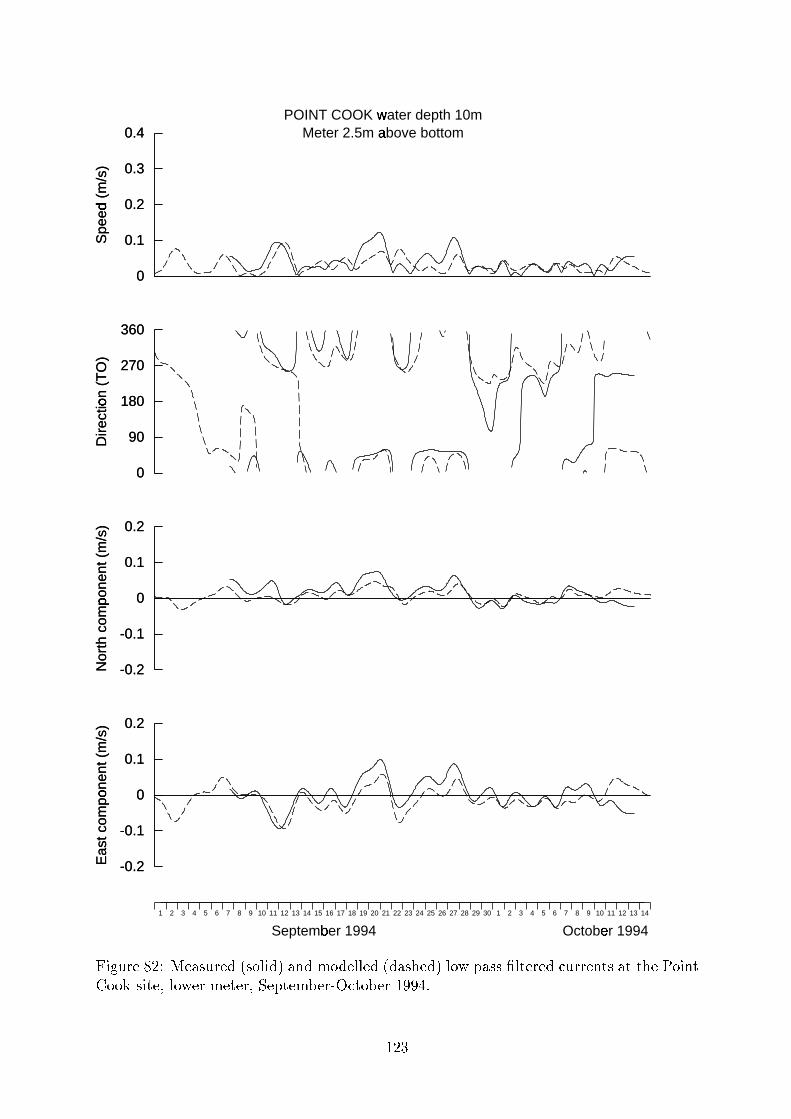
POINT COOK water depth 10m ÊMeter 2.5m above bottom È
September 1994Á October 1994Â1 2 3 4 5 6 7 8 9 10 11 12 13 14 15 16 17 18 19 20 21 22 23 24 25 26 27 28 29 30 1 2 3 4 5 6 7 8 9 10 11 12 13 14
-0.2
-0.1
0
0.1
0.2
Eas
t com
pone
nt (
m/s
)
Ã
-0.2
-0.1
0
0.1
0.2
Nor
th c
ompo
nent
(m
/s)
Ä
0
90
180
270
360
Dire
ctio
n (T
O)
Ã
0
0.1
0.2
0.3
0.4
Spe
ed (
m/s
)
Å
-0.2
-0.1
0
0.1
0.2
Eas
t com
pone
nt (
m/s
)
Ã
-0.2
-0.1
0
0.1
0.2
Nor
th c
ompo
nent
(m
/s)
Ä
0
90
180
270
360
Dire
ctio
n (T
O)
Ã
0
0.1
0.2
0.3
0.4
Spe
ed (
m/s
)
Å
ú û ® ° ± ² õ é ´ µ ² ¶ · ° ± ² ¹ º · » ¼ û ¹ ¾ ¶ À ¹ Â » ¹ ² ¼ ¼ ² ¹ º ¹ ¶ · Å ² ¹ ¾ ¼ » � ÿ ¶ · · � ¼ È ² ± ² ¹ Ú ° ± ± ² À È · ¶ È È Å ² Ö » û À Èô » » í · û È ² Ê ¼ » � ² ± Â ² È ² ± Ê � ² ÿ È ² Â � ² ± * � Ú È » � ² ± Ì ³ ³ Í �
Ì é ò

−0.2 −0.1 0 0.1 0.2−0.2
−0.1
0
0.1
0.2
Mod
elle
d
Top meter, East Current
Point Cook (Sep 1994)
No.Pts = 818
Slope = 0.545Error = 0.013Intcpt = 0.0049R = 0.824
−0.2 −0.1 0 0.1 0.2−0.2
−0.1
0
0.1
0.2Top meter, North Current
No.Pts = 818
Slope = 0.705Error = 0.017Intcpt = 0.0035R = 0.818
−0.2 −0.1 0 0.1 0.2−0.2
−0.1
0
0.1
0.2
Observed
Mod
elle
d
Bottom meter, East Current
No.Pts = 862
Slope = 0.529Error = 0.021Intcpt = −0.012R = 0.659
−0.2 −0.1 0 0.1 0.2−0.2
−0.1
0
0.1
0.2
Observed
Bottom meter, North Current
No.Pts = 862
Slope = 0.426Error = 0.015Intcpt = 0.0022R = 0.695
ú û ® ° ± ² õ ò ´ � � · ² ± Ç ² ¹ º ( * ¶ ( û · ¾ Ç ² ± · ° · Â » ¹ ² ¼ ¼ ² ¹ º Ë * ¶ ( û · ¾ ¼ » � ÿ ¶ · · � ¼ È ² ± ² ¹ Ú ° ± ± ² À È Ú » Â ÿ » À ² À È ·. » ± È Å ² Ö » û À È ô » » í Â » » ± û À ® Ê � ² ÿ È ² Â � ² ± * � Ú È » � ² ± Ì ³ ³ Í �
Ì é Í

RED BLUFF water depth 15m ÈMeter 11m above bottom Á
September 1994Á October 1994Â1 2 3 4 5 6 7 8 9 10 11 12 13 14 15 16 17 18 19 20 21 22 23 24 25 26 27 28 29 30 1 2 3 4 5 6 7 8 9 10 11 12 13 14
-0.2
-0.1
0
0.1
0.2
Eas
t com
pone
nt (
m/s
)
Ã
-0.2
-0.1
0
0.1
0.2
Nor
th c
ompo
nent
(m
/s)
Ä
0
90
180
270
360
Dire
ctio
n (T
O)
Ã
0
0.1
0.2
0.3
0.4
Spe
ed (
m/s
)
Å
-0.2
-0.1
0
0.1
0.2
Eas
t com
pone
nt (
m/s
)
Ã
-0.2
-0.1
0
0.1
0.2
Nor
th c
ompo
nent
(m
/s)
Ä
0
90
180
270
360
Dire
ctio
n (T
O)
Ã
0
0.1
0.2
0.3
0.4
Spe
ed (
m/s
)
Å
ú û ® ° ± ² õ Í ´ µ ² ¶ · ° ± ² ¹ º · » ¼ û ¹ ¾ ¶ À ¹  » ¹ ² ¼ ¼ ² ¹ º ¹ ¶ · Å ² ¹ ¾ ¼ » � ÿ ¶ · · � ¼ È ² ± ² ¹ Ú ° ± ± ² À È · ¶ È È Å ² � ² ¹� ¼ ° Û · û È ² Ê ° ÿ ÿ ² ±  ² È ² ± Ê � ² ÿ È ²  � ² ± * � Ú È » � ² ± Ì ³ ³ Í �
Ì é Î

RED BLUFF water depth 15m ÈMeter 3.75m above bottom È
September 1994Á October 1994Â1 2 3 4 5 6 7 8 9 10 11 12 13 14 15 16 17 18 19 20 21 22 23 24 25 26 27 28 29 30 1 2 3 4 5 6 7 8 9 10 11 12 13 14
-0.2
-0.1
0
0.1
0.2
Eas
t com
pone
nt (
m/s
)
Ã
-0.2
-0.1
0
0.1
0.2
Nor
th c
ompo
nent
(m
/s)
Ä
0
90
180
270
360
Dire
ctio
n (T
O)
Ã
0
0.1
0.2
0.3
0.4
Spe
ed (
m/s
)
Å
-0.2
-0.1
0
0.1
0.2
Eas
t com
pone
nt (
m/s
)
Ã
-0.2
-0.1
0
0.1
0.2
Nor
th c
ompo
nent
(m
/s)
Ä
0
90
180
270
360
Dire
ctio
n (T
O)
Ã
0
0.1
0.2
0.3
0.4
Spe
ed (
m/s
)
Å
ú û ® ° ± ² õ Î ´ µ » ¹ ² ¼ ¼ ² ¹ ¼ » � ÿ ¶ · · � ¼ È ² ± ² ¹ Ú ° ± ± ² À È · ¶ È È Å ² � ² ¹ � ¼ ° Û · û È ² Ê ¼ » � ² ± Â ² È ² ± Ê
� ² ÿ È ² Â � ² ± * � Ú È » � ² ± Ì ³ ³ Í � » ¹ ¶ È ¶ � ¶ · ± ² Ú » Ç ² ± ² ¹ . ± » Â È Å ² Â ² È ² ± ¶ È È Å û · · û È ² �
Ì é Þ

−0.2 −0.1 0 0.1 0.2−0.2
−0.1
0
0.1
0.2
Mod
elle
d
Top meter, East Current
Red Bluff (Sep 1994)
No.Pts = 862
Slope = 0.891Error = 0.025Intcpt = 0.0094R = 0.768
−0.2 −0.1 0 0.1 0.2−0.2
−0.1
0
0.1
0.2Top meter, North Current
No.Pts = 862
Slope = 0.963Error = 0.042Intcpt = −0.029R = 0.62
ú û ® ° ± ² õ Þ ´ � � · ² ± Ç ² ¹ º ( * ¶ ( û · ¾ Ç ² ± · ° · Â » ¹ ² ¼ ¼ ² ¹ º Ë * ¶ ( û · ¾ ¼ » � ÿ ¶ · · � ¼ È ² ± ² ¹ Ú ° ± ± ² À È Ú » Â ÿ » À ² À È ·. » ± È Å ² � ² ¹ � ¼ ° Û Â » » ± û À ® Ê � ² ÿ È ² Â � ² ± * � Ú È » � ² ± Ì ³ ³ Í �
Ì é ð
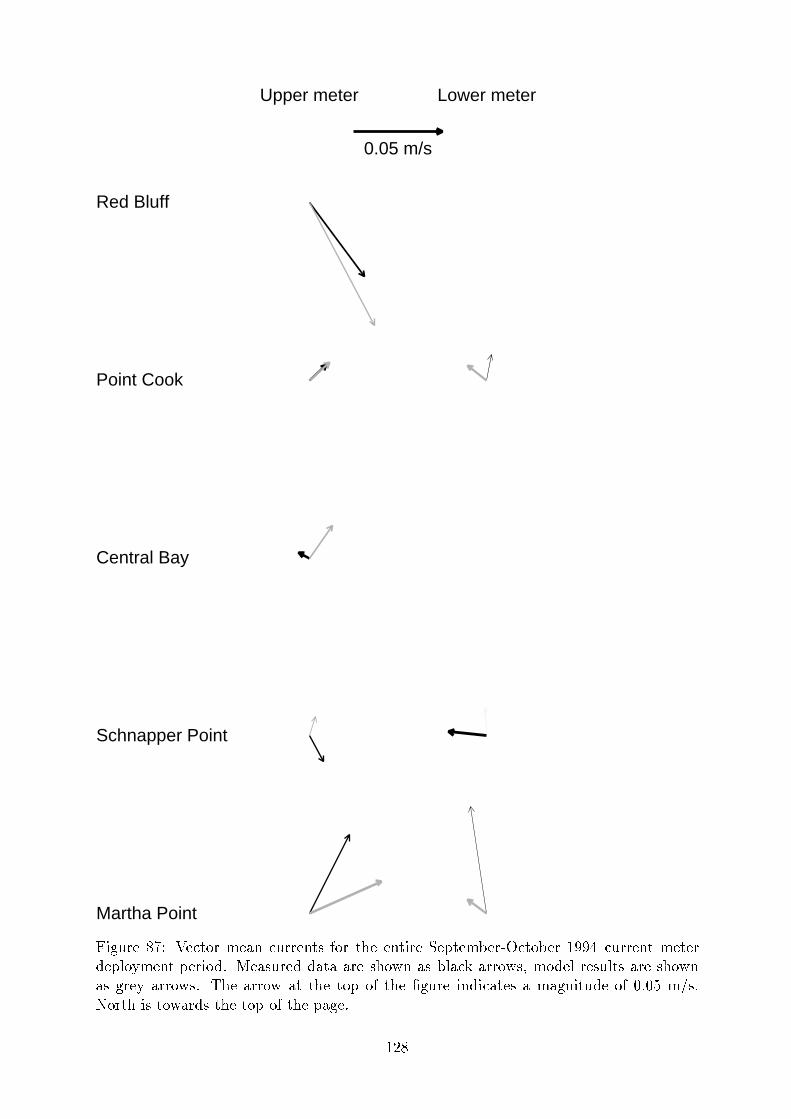
Upper meter Lower meter
0.05 m/s
Martha Point
Schnapper Point
Central Bay
Point Cook
Red Bluff
ú Õ Ö Ø Ù Ú Û Ü Ý Þ Ú à á â Ù ã Ú ä å à Ø Ù Ù Ú å á è ê â Ù á ì Ú Ú å á Õ Ù Ú í Ú î á Ú ã ï Ú Ù ð ñ à á â ï Ú Ù ò ó ó ô à Ø Ù Ù Ú å á ã Ú á Ú Ù
ø Ú î ù â û ã Ú å á î Ú Ù Õ â ø ü ý Ú ä è Ø Ù Ú ø ø ä á ä ä Ù Ú è ì â � å ä è ï ù ä à � ä Ù Ù â � è � ã â ø Ú ù Ù Ú è Ø ù á è ä Ù Ú è ì â � å
ä è Ö Ù Ú û ä Ù Ù â � è ü � ì Ú ä Ù Ù â � ä á á ì Ú á â î â ê á ì Ú Ö Ø Ù Ú Õ å ø Õ à ä á Ú è ä ã ä Ö å Õ á Ø ø Ú â ê � ü � ã � è ü
� â Ù á ì Õ è á â � ä Ù ø è á ì Ú á â î â ê á ì Ú î ä Ö Ú ü
ò � Û

34
� �
34
� �
34
34
34.5
�
265000 340000
265000 340000
5745000
5815000
5745000
5815000
ú Õ Ö Ø Ù Ú Û Û Ý í Ø Ù ê ä à Ú � � ð � ã � è ä ù Õ å Õ á û ã Ú ä è Ø Ù Ú ø ï û � � � � ò ô ð ò í Ú î á Ú ã ï Ú Ù ò ó ó ô ü
32" #32.5
$33% %33.5
&
34'
34.5
(34.5)
35* +
35, -
265000 340000
265000 340000
5745000
5815000
5745000
5815000
ú Õ Ö Ø Ù Ú Û ó Ý í Ø Ù ê ä à Ú � � ð � ã � è ä ù Õ å Õ á û ê Ù â ã ã â ø Ú ù � � � Ý � � ò í Ú î á Ú ã ï Ú Ù ò ó ó ô ü
ü
ò � ó
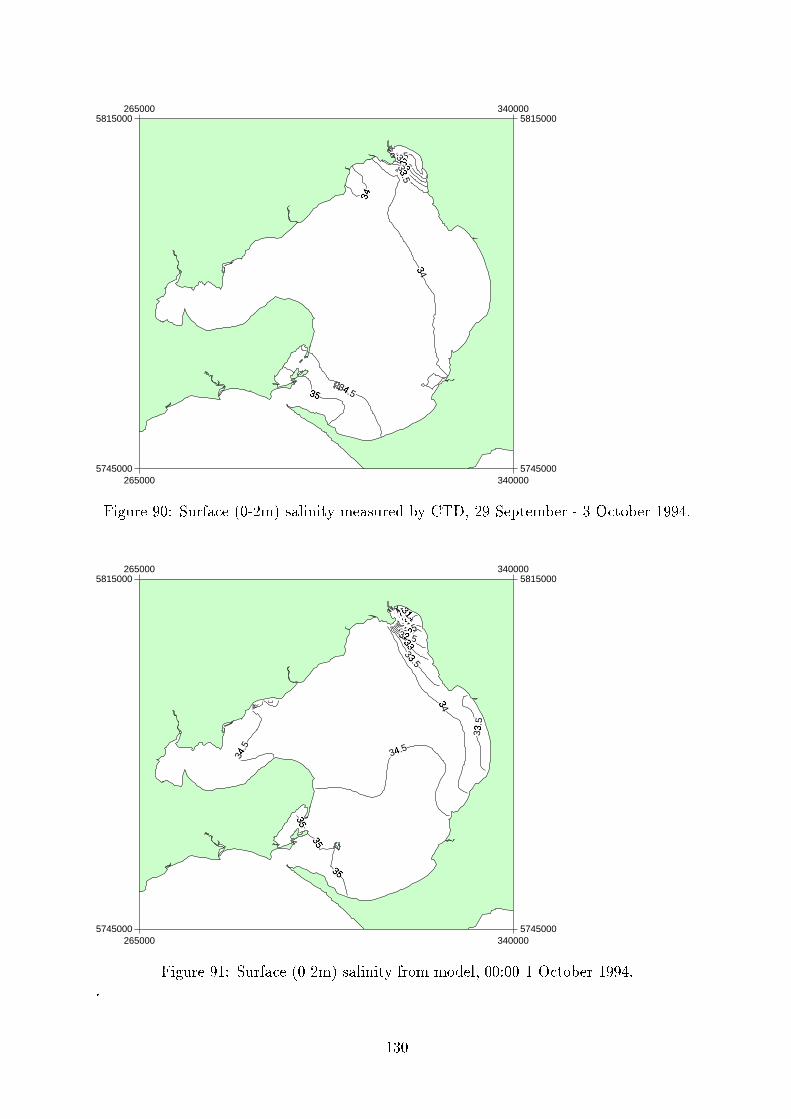
31.5323 432.55
336 633.5
7
348
34
9 :
34.5;
35< =
265000 340000
265000 340000
5745000
5815000
5745000
5815000
ú Õ Ö Ø Ù Ú ó � Ý í Ø Ù ê ä à Ú � � ð � ã � è ä ù Õ å Õ á û ã Ú ä è Ø Ù Ú ø ï û � � � � � ó í Ú î á Ú ã ï Ú Ù ð @ ñ à á â ï Ú Ù ò ó ó ô ü
25
B C25.5
D26E F26.5
G
27
H I27.528J K28.5L
2929.5
M30N O 30.5
P
31
Q
31R S31.5T32
U V32.5W
33X X
33.5Y
33.5
Z
34[
34.5\34.5]
35^ _
35` a
35b c
265000 340000
265000 340000
5745000
5815000
5745000
5815000
ú Õ Ö Ø Ù Ú ó ò Ý í Ø Ù ê ä à Ú � � ð � ã � è ä ù Õ å Õ á û ê Ù â ã ã â ø Ú ù � � � Ý � � ò ñ à á â ï Ú Ù ò ó ó ô ü
ü
ò @ �
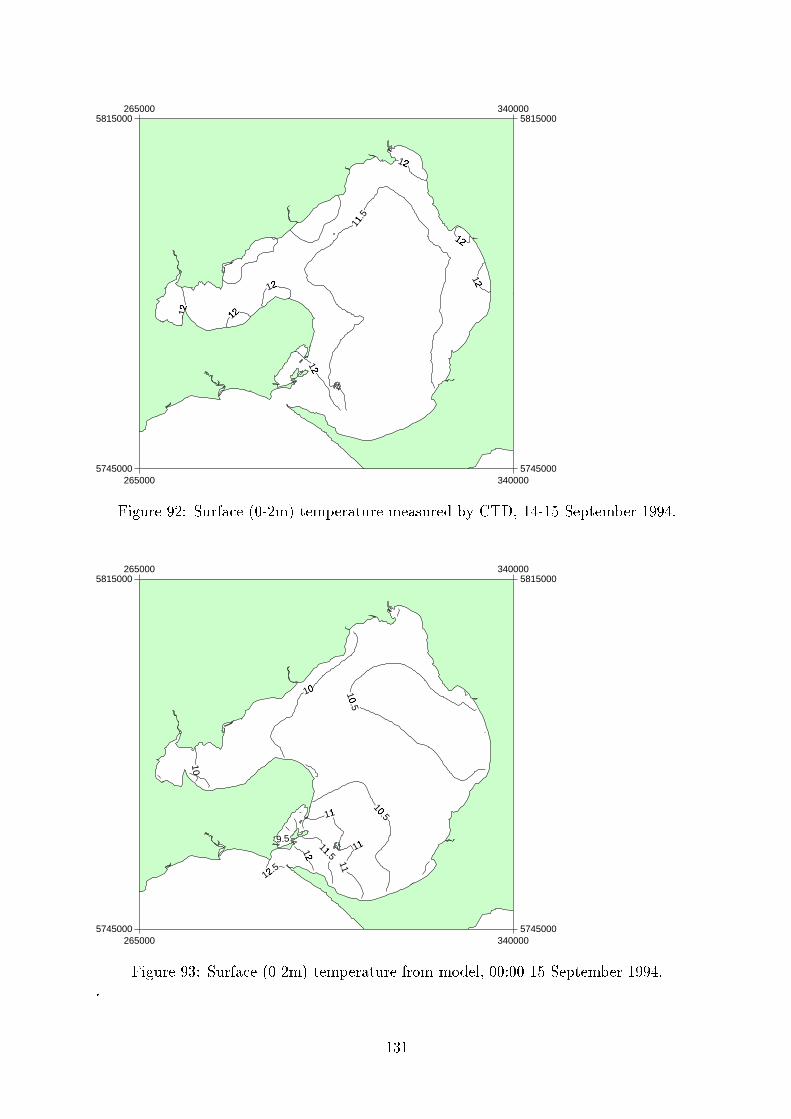
11.5e
12
12f
12g
12h12
i12j
12k l
12m n
265000 340000
265000 340000
5745000
5815000
5745000
5815000
ú Õ Ö Ø Ù Ú ó � Ý í Ø Ù ê ä à Ú � � ð � ã � á Ú ã î Ú Ù ä á Ø Ù Ú ã Ú ä è Ø Ù Ú ø ï û � � � � ò ô ð ò í Ú î á Ú ã ï Ú Ù ò ó ó ô ü
9.5
10p
10
10.5
q
10.5
r
11
11s
11t11.5
u12v12.5w
265000 340000
265000 340000
5745000
5815000
5745000
5815000
x Õ Ö Ø Ù Ú ó @ Ý í Ø Ù ê ä à Ú � � ð � ã � á Ú ã î Ú Ù ä á Ø Ù Ú ê Ù â ã ã â ø Ú ù � � � Ý � � ò í Ú î á Ú ã ï Ú Ù ò ó ó ô ü
ü
ò @ ò

11y
11z z
11.5
{
11.5
|
11.5}
11.5
~
12�12.5�12.5
�12.5� 12
.5�12.5�
265000 340000
265000 340000
5745000
5815000
5745000
5815000
x Õ Ö Ø Ù Ú ó ô Ý í Ø Ù ê ä à Ú � � ð � ã � á Ú ã î Ú Ù ä á Ø Ù Ú ã Ú ä è Ø Ù Ú ø ï û � � � � � ó í Ú î á Ú ã ï Ú Ù ð @ ñ à á â ï Ú Ù
ò ó ó ô ü
8.5
9�
9�
9
�
9.5
�
10� �
10.5
�
10.5
�11�11.5
�
12
�
12 5�265000 340000
265000 340000
5745000
5815000
5745000
5815000
x Õ Ö Ø Ù Ú ó Ý í Ø Ù ê ä à Ú � � ð � ã � á Ú ã î Ú Ù ä á Ø Ù Ú ê Ù â ã ã â ø Ú ù � � � Ý � � ò ñ à á â ï Ú Ù ò ó ó ô ü
ü
ò @ �

1994Jan
Feb
Mar
Apr
May
JunJul
Aug
Sep
Oct
Nov
Dec
32 33 34 35
Salinity
xÕÖ
ØÙÚ
ó�Ý
íØ
ÙêäàÚ
èäùÕåÕáû
Õåáì
Úã
äÕåï
âø
ûâê
áìÚ
�äû
áìÙâ
ØÖ
ìâ
Øá
òóó
ôü
ñï
èÚÙ�äáÕâ
åè
�ÚÙÚ
âï
áäÕå
Ú øä
îî
Ùâ�Õã
äáÚùûã
âå
áìùû
êÙâã
áìÚ
Þx
��
èÕáÚ� ý
���
åÚäÙ
áìÚ
àÚåáÙÚ
âê
áìÚ
�äû�
äå
øä
ÙÚèì
â�å
äè
øâ
áè�àâ
åå
ÚàáÚ øï
ûèâ
ùÕ øùÕå
Úè üý
âø
Úù�
äùØÚè
� øä
èìÚ ø
�äÙÚ
êÙâã
áìÚ
�Úå
áÙäù
�äû
èÕáÚü
1994Jan
Feb
Mar
Apr
May
JunJul
Aug
Sep
Oct
Nov
Dec
5 10 15 20 25
Temperature (degrees C)¥xÕÖ
ØÙÚ
óÜ
Ýí
ØÙêä
àÚáÚã
îÚÙä
áØÙÚ
Õåáì
Úã
äÕå
ïâ
øû
âêáì
Ú�
äûáì
ÙâØ
Öì
âØ
áòó
óô
üñ
ïèÚÙ�
äð
áÕâå
è�
ÚÙÚâ
ïáä
ÕåÚ ø
äî
îÙâ�
ÕãäáÚùû
ãâ
åáì
ùûêÙâ
ãáì
ÚÞ
x�
�èÕáÚ
� ý�
��å
ÚäÙáì
ÚàÚå
áÙÚ
âê
áìÚ
�äû�
äå
øä
ÙÚèì
â�å
äè
øâ
áè�àâ
åå
ÚàáÚ øï
ûèâ
ùÕ øùÕå
Úè üý
âø
Úù�
äùØÚè
� øä
èìÚ ø
�ä
ÙÚ
êÙâã
áìÚ
�Úå
áÙäù
�äû
èÕáÚü
ò@@