HYDRODYNAMIC LOADINGS OF BUILDINGS IN … faculteit...HYDRODYNAMIC LOADINGS OF BUILDINGS IN FLOODS...
13
HYDRODYNAMIC LOADINGS OF BUILDINGS IN FLOODS Giovanni Cuomo 1 , Gholamreza Shams 2 , Sebastian Jonkman 3 and Pieter van Gelder 4 Assessing the vulnerability of buildings in flood-prone areas is a key issue when evaluating the risk induced by flood events, particularly because of its proved direct influence on the loss of life during catastrophes. A comprehensive methodology for risk assessment of buildings subject to flooding is nevertheless still missing. Bearing this in mind, a new set of experiments have been performed at TU Delft with the aim of spreading more light on dynamics of flood-induced loads and their effects on buildings and to provide the CDF community with state of the art bench-marks. In this paper, a briefly overview is given of flood induced load on buildings; the new experimental work is then presented, together with results from preliminary analysis. Initial results suggest that use of existing prediction methods might be unsafe and that impulsive loading might be critical for both the assessment of the vulnerability of existing structures and the design of new flood-proof buildings. INTRODUCTION Recent catastrophic events like the Indian Ocean tsunami in 2004 (Kawata, 2005) and the New Orleans flood due to passage of hurricane Katrina in 2005 (FEMA 2006, Figure 1) have focused attention of politicians, economists and engineers worldwide on the need for the assessment of risk due to flooding of anthropized areas when estimating the potential life and economic losses of a catastrophic scenario. .A/LMiB'Wft* Figure 1. Percentage of building damage in the Lower Ninth Ward, New Orleans (main figure) and fatality rate (top-right). Senior Engineer, Engineering Hydraulic and Structures Group, HR Wallingford, Howbery Park, Wallingford, OX10 8BA, UK; q.cuomoO.hrwallinqford.co.uk; Post-Doc, Hydraulic Engineering Dept., TU Delft '• PhD candidate, Hydraulic Engineering Dept, TU Delft, R.Shams(5),tudelft.nl 1 PhD, Hydraulic Engineering Dept., TU Delft, S.N.JonkmanO.tudelft.nl 1 Ass. Professor, Hydraulic Engineering Dept, TU Delft P.H.A.J.M.vanGelder©.tudelft.nl 3744
Transcript of HYDRODYNAMIC LOADINGS OF BUILDINGS IN … faculteit...HYDRODYNAMIC LOADINGS OF BUILDINGS IN FLOODS...
HYDRODYNAMIC LOADINGS OF BUILDINGS IN FLOODS
Giovanni Cuomo1, Gholamreza Shams2, Sebastian Jonkman3 and Pieter van Gelder4
Assessing the vulnerability of buildings in flood-prone areas is a key issue when evaluating the risk induced by flood events, particularly because of its proved direct influence on the loss of life during catastrophes. A comprehensive methodology for risk assessment of buildings subject to flooding is nevertheless still missing. Bearing this in mind, a new set of experiments have been performed at TU Delft with the aim of spreading more light on dynamics of flood-induced loads and their effects on buildings and to provide the CDF community with state of the art bench-marks. In this paper, a briefly overview is given of flood induced load on buildings; the new experimental work is then presented, together with results from preliminary analysis. Initial results suggest that use of existing prediction methods might be unsafe and that impulsive loading might be critical for both the assessment of the vulnerability of existing structures and the design of new flood-proof buildings.
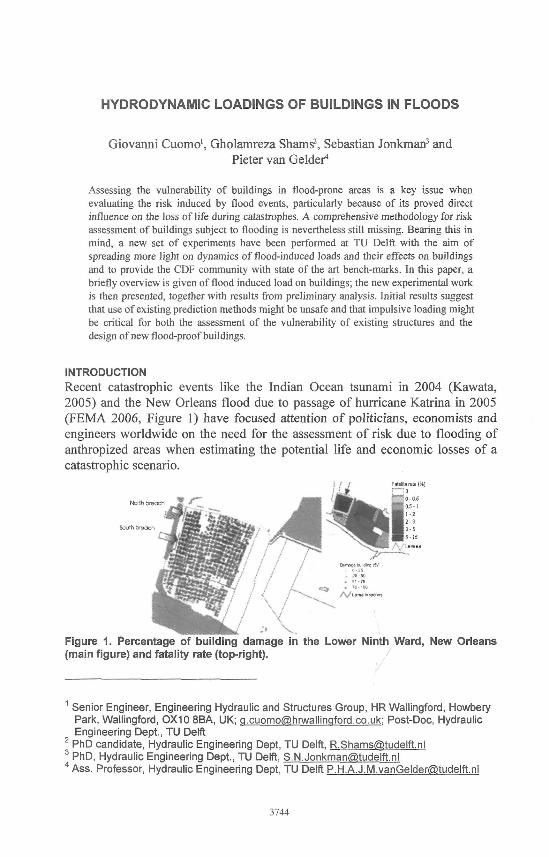
INTRODUCTION Recent catastrophic events like the Indian Ocean tsunami in 2004 (Kawata, 2005) and the New Orleans flood due to passage of hurricane Katrina in 2005 (FEMA 2006, Figure 1) have focused attention of politicians, economists and engineers worldwide on the need for the assessment of risk due to flooding of anthropized areas when estimating the potential life and economic losses of a catastrophic scenario.
.A/LMiB'Wft*
Figure 1. Percentage of building damage in the Lower Ninth Ward, New Orleans (main figure) and fatality rate (top-right).
Senior Engineer, Engineering Hydraulic and Structures Group, HR Wallingford, Howbery Park, Wallingford, OX10 8BA, UK; q.cuomoO.hrwallinqford.co.uk; Post-Doc, Hydraulic Engineering Dept., TU Delft
'• PhD candidate, Hydraulic Engineering Dept, TU Delft, R.Shams(5),tudelft.nl 1 PhD, Hydraulic Engineering Dept., TU Delft, S.N.JonkmanO.tudelft.nl 1 Ass. Professor, Hydraulic Engineering Dept, TU Delft P.H.A.J.M.vanGelder©.tudelft.nl
3744
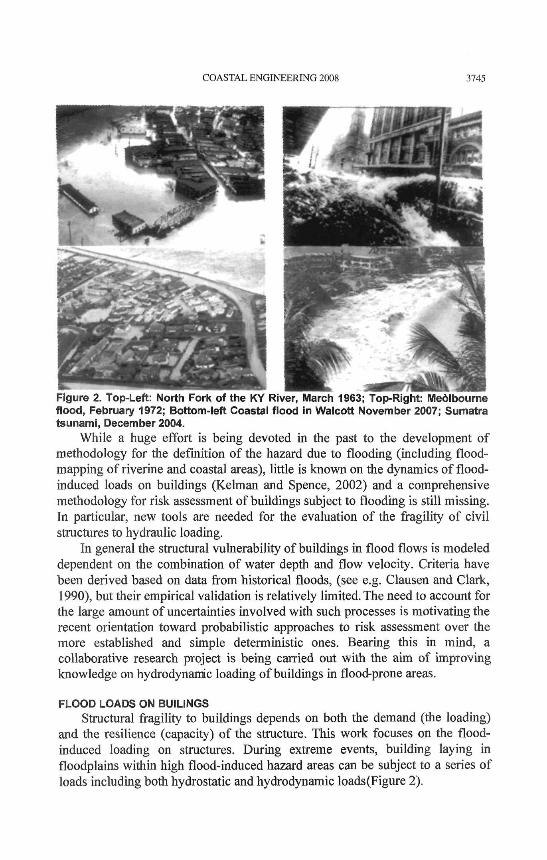
COASTAL ENGINEERING 2008 3745
While a huge effort is being devoted in the past to the development of methodology for the definition of the hazard due to flooding (including flood-mapping of riverine and coastal areas), little is known on the dynamics of flood-induced loads on buildings (Kelman and Spence, 2002) and a comprehensive methodology for risk assessment of buildings subject to flooding is still missing. In particular, new tools are needed for the evaluation of the fragility of civil structures to hydraulic loading.
In general the structural vulnerability of buildings in flood flows is modeled dependent on the combination of water depth and flow velocity. Criteria have been derived based on data from historical floods, (see e.g. Clausen and Clark, 1990), but their empirical validation is relatively limited. The need to account for the large amount of uncertainties involved with such processes is motivating the recent orientation toward probabilistic approaches to risk assessment over the more established and simple deterministic ones. Bearing this in mind, a collaborative research project is being carried out with the aim of improving knowledge on hydrodynanic loading of buildings in flood-prone areas.
FLOOD LOADS ON BUILINGS Structural fragility to buildings depends on both the demand (the loading)
and the resilience (capacity) of the structure. This work focuses on the flood-induced loading on structures. During extreme events, building laying in floodplains within high flood-induced hazard areas can be subject to a series of loads including both hydrostatic and hydrodynamic loads (Figure 2).
3746 COASTAL ENGINEERING 2008
Hydrostatic loads include: hydrostatic pressure on the vertical element of the structure; buoyancy on the horizontal element of the structure;
Hydrodynamic loads include: Drag/Velocity-dominated (quasi-static) loads, including:
o Flash floods (away from source banks/levee/breaches); o Debris-flows (away from source); o Storm surges (inland) o Tsunami (inland) o Non-breaking wave loads
Inertia/acceleration-dominated (impulsive) loads; o Dam break, close to source o Debris-flow, close to source o Flash floods in the vicinity of banks/levee/breaches; o Storm surges (along the coast) o Tsunami (along the cost and inland at the wave front) o Breaking wave loads
The above classes are described in detail in what that follows. Here, it is worth mentioning that in most cases, different loads types co-exist and act on the same structure at the same time, or at a different times during a single the flooding event.
Hydrostatic loads
The hydrostatic horizontal load ( Fh static) derives from the difference in
water level on the upstream and the downstream sides of the wall. Per unit length it is given by:
^static = PS12\hus-hjs) (1)
In which g is the acceleration due to gravity, hus and h& are the water depths respectively upstream and downstream the wall and p is the density of the fluid, which is a function of the amount of solid particles suspended within the flood.
When assessing the vulnerability of horizontal structural elements or the overall stability of a building, buoyancy should also taken into account as it applies a potentially unbalanced uplift force and affects the resistance of gravity-based structures against sliding and overturning. Buoyancy (per unit length) can be easily estimated using:
Fy Static = W * \PSKp ~ PSKown ) (2)
In which g is the acceleration due to gravity, pghup and pghdown are the hydrostatic heads acting respectively above and below the horizontal element considered and w is the structural element's width
COASTAL ENGINEERING 2008 3747
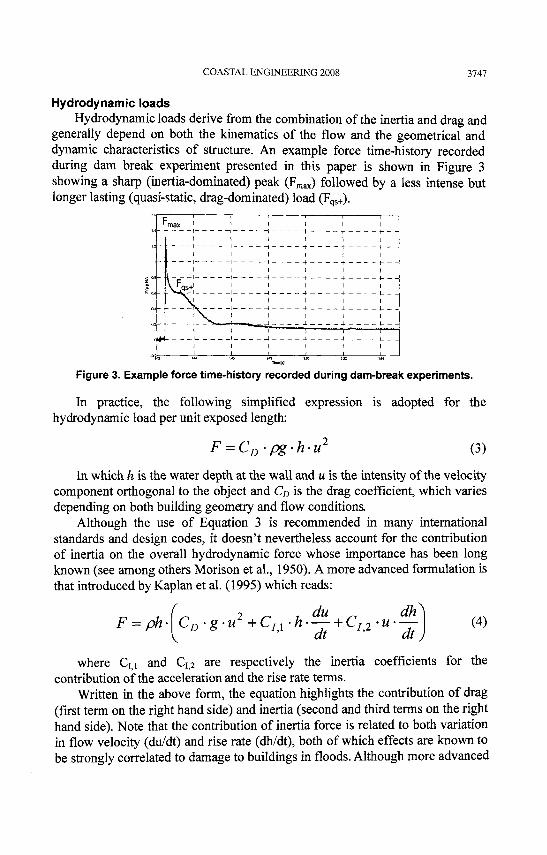
Hydrodynamic loads Hydrodynamic loads derive from the combination of the inertia and drag and
generally depend on both the kinematics of the flow and the geometrical and dynamic characteristics of structure. An example force time-history recorded during dam break experiment presented in this paper is shown in Figure 3 showing a sharp (inertia-dominated) peak (Fmax) followed by a less intense but longer lasting (quasi-static, drag-dominated) load (Fqs+).
' m a x i f i i i i
* <a
1 1 i \ \ \
1 I 1 1 1 1
1 1 ! 1 1 1
l , , ., _» + ^ _ _
_w ; j i i L__ \ i i i i i i
l \ . I I I ! !
, , , '-•( .... r - p — i i -i J. x i_ i i i i i i
Figure 3. Example force time-history recorded during dam-break experiments.
In practice, the following simplified expression is adopted for the hydrodynamic load per unit exposed length:
F = CD-pg-h-u' (3)
In which h is the water depth at the wall and u is the intensity of the velocity component orthogonal to the object and CD is the drag coefficient, which varies depending on both building geometry and flow conditions.
Although the use of Equation 3 is recommended in many international standards and design codes, it doesn't nevertheless account for the contribution of inertia on the overall hydrodynamic force whose importance has been long known (see among others Morison et al., 1950). A more advanced formulation is that introduced by Kaplan et al. (1995) which reads:
( du F = ph- CD-g-u2 +Cn-h- — + CK
V dt
dh_
dt (4)
/
where C u and CIi2 are respectively the inertia coefficients for the contribution of the acceleration and the rise rate terms.
Written in the above form, the equation highlights the contribution of drag (first term on the right hand side) and inertia (second and third terms on the right hand side). Note that the contribution of inertia force is related to both variation in flow velocity (du/dt) and rise rate (dh/dt), both of which effects are known to be strongly correlated to damage to buildings in floods. Although more advanced
3748 COASTAL ENGINEERING 2008
than Eq. 3, Eq. 4 has been shown to underestimate most violent impulsive loading events (Cuomo et al. 2003).
Dam-break and tsunami-induced loads on buildings. Recent catastrophic tsunami events have focused the attention of researchers
worldwide on the need to assess hydrodynamic loads exerted by tsunami on buildings. Among these, experiments by Arnarson (2005) represent rare examples of tests concentrated on measuring loads exerted by dam-break flow on isolated buildings. Results from the above experiments have been included in design standards including the recently published by FEMA (2008) in which the hydrodynamic force acting on an isolated building reached by a tsunami is given by:
Fh=0.5pCD-b-h-u2 (5)
The authors of the FEMA guidelines suggest using a drag coefficient CD = 2 when assessing the drag component of the load only but assuming CD = 3 to account for the impulsive component of the loading, which implies:
Fh,imp = ^^Fh,drag ( 6 )
Short wave-induced loads When assessing hydrodynamic loads for use in design, short wave loads
(period Is < T < 10s) on buildings are usually accounted for separately. In the common practice, they are usually subdivided into loads exerted by non breaking, breaking and broken waves, the transition among the above coditions being mainly a function of the local wave height (H) to water depth (h) ratio. It should nevertheless be borne in mind that for walls exposed to wave loading, both the incident wave condition and the water depth in front of the structure might vary during the flood and it is therefore uneasy to define boundaries for each loading condition.
A series of well established prediction methods for non-breaking wave loads are available to practitioners. Among these, Goda's (1974) prediction method for wave loads on caisson breakwaters represents a landmark in the evolution of physically rational approaches to the assessment of wave loads at walls. Takahashi et al. (1994) extended Goda's prediction method to include the effect of wave breaking. Within the PROVERBS research project, a new design methods was derived for the evaluation of wave forces on caisson breakwaters. described in details in Oumeraci et al. (2001).
Since breaking is highly dissipative, force exerted by broken waves are assumed to be significantly less intense then for the breaking wave case. It is commonly assumed that after breaking, the wave propagates like a bore inshore and in-land, eventually transferring their residual kinetic energy to the structure at time of impact (see Ramsden, 1993 and references therein).
COASTAL ENGINEERING 2008 3749
Debris-induced loads Debris-induced loads represent a kind of their own, both for their high level
of unpredictability and their extremely high dangerousness. Among the rare studies carried out in this field, we will mention the recent and accurate work carried out by Haehnel and Daly (2002).
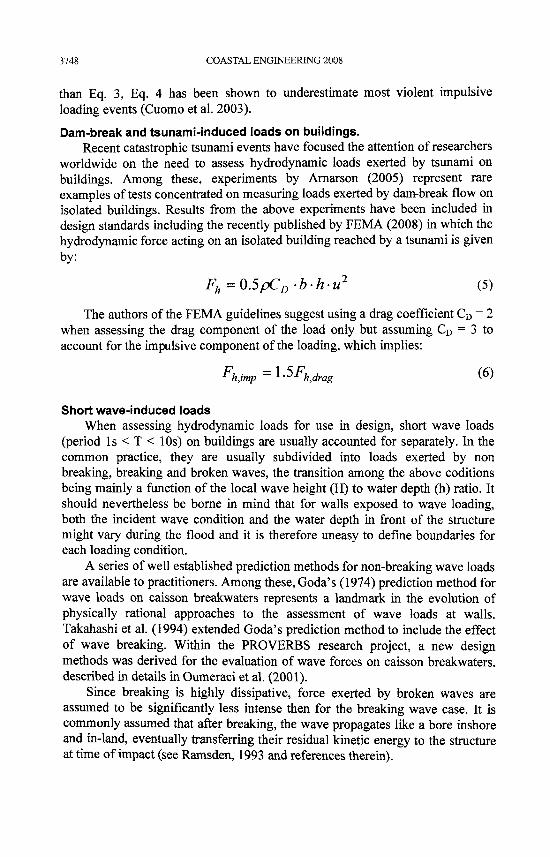
Load combination As already mentioned, in most cases a structure is subject to a combination
of the loadings described above. En example calculation showing different degree of load combination acting on a vertical wall is given in Figure 4, form left to right and from top to bottom:
hydrostatic pressure; hydrostatic pressure + drag; hydrostatic pressure + waves; hydrostatic pressure + drag + waves;
Figure 4. Example calculation showing the effect of the hydrostatic pressure (top-left) alone, and in combination with a steady current (top-right), waves (bottom-left), and both (bottom-riaht).
Note that during a single flood event, the load felt by the wall might vary significantly within the sketched areas in Figure 4. For example, as the water reaches the base of the wall and start rising, the wall will experience increasing hydrostatic pressure and drag force due to the current. If the structure is set in a coastal area, waves might as well reach the wall which will therefore experience loading from broken, breaking or pulsating waves as a function of the local wave high to water depth ratio, which can vary due to tide and storm surge variation during a single flood.
In other cases tsunamis, flash floods and dam break flows might drag along heavy objects as debris, with catastrophic effects on any structure laying along the path.
3750 COASTAL ENGINEERING 2008
NEW PHYSICAL MODEL TESTS A new set of dam-break physical model tests were carried out in one of the
wave-flumes of the Laboratory for Fluid Mechanics of the Delft University of Technology to study the dynamics of flood-induced loads and their effects on buildings and to provide the CDF community with state of the art benchmarks.
Experimental set-up and measurement instruments Experiments were carried out in a 42m long, 0.8m wide, 1.0m high wave
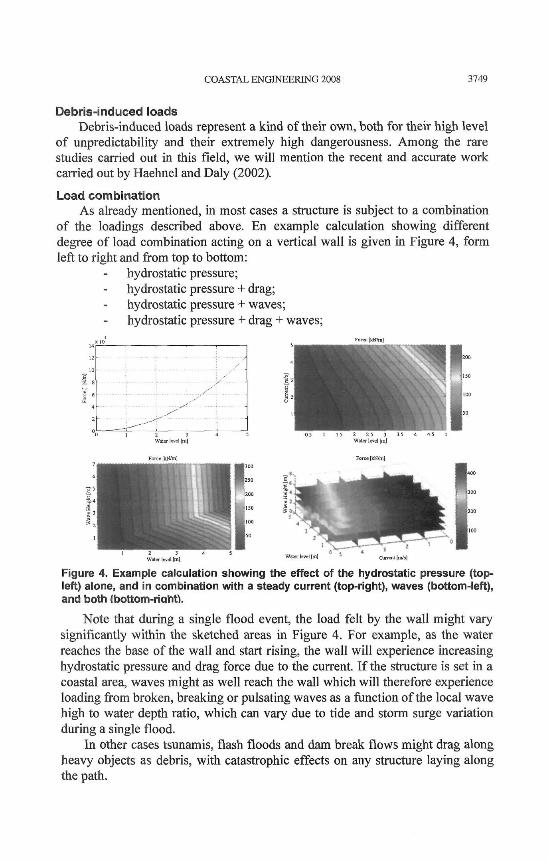
flume. A water column was stored in a 2.88m long, 0.67m wide and 1.26m high reservoir. To minimize the effect of the gate opening on the water tongue propagating downstream, the gate was operated by rotating a stiff metal plate around its top by pulling its bottom by means of a free-falling counterweight. The building was represented by a cubic structure (characteristic linear dimension of 18cm) and made out of thick aluminum to minimise its weight and maximise its stiffness (dynamics of model structure is discussed further in the following). The following sensors were housed in the model structure:
1 accelerator; I axial force transducer; II pressure sensors.
In order to be able to effectively capture the sharpest impulsive events, data were logged continuously at high frequency (50KHz), recording was initiated by monitoring the movement of the gate.
Figure 5. Sketch of model structure housing force transducer and acceleration (left) and pressure transducers (right).
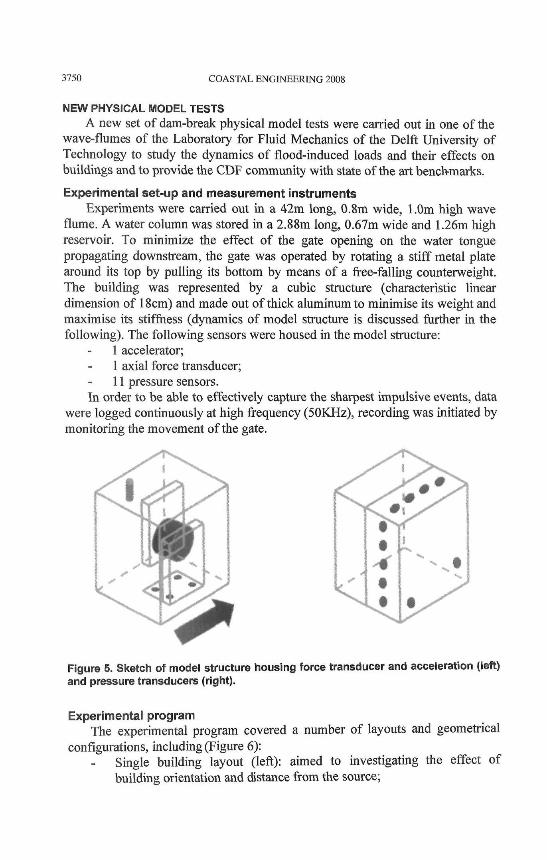
Experimental program The experimental program covered a number of layouts and geometrical
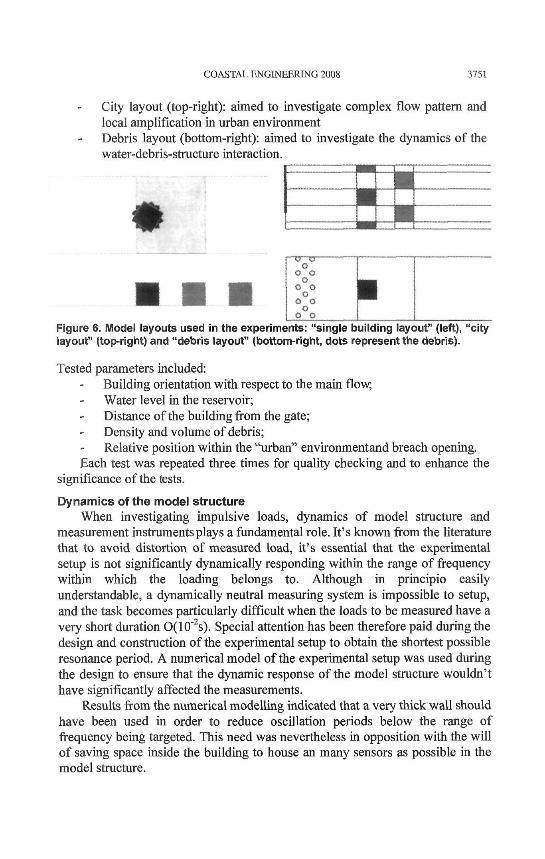
configurations, including (Figure 6): Single building layout (left): aimed to investigating the effect of building orientation and distance from the source;
COASTAL ENGINEERING 2008 3751
City layout (top-right): aimed to investigate complex flow pattern and local amplification in urban environment Debris layout (bottom-right): aimed to investigate the dynamics of the water-debris-structure interaction.
Figure 6. Model layouts used in the experiments: "single building layout" (left), layout" (top-right) and "debris layout" (bottom-right, dots represent the debris).
'city
Tested parameters included: Building orientation with respect to the main flow, Water level in the reservoir; Distance of the building from the gate; Density and volume of debris; Relative position within the "urban" environmentand breach opening.
Each test was repeated three times for quality checking and to enhance the significance of the tests.
Dynamics of the model structure When investigating impulsive loads, dynamics of model structure and
measurement instruments plays a fundamental role. It's known from the literature that to avoid distortion of measured load, it's essential that the experimental setup is not significantly dynamically responding within the range of frequency within which the loading belongs to. Although in principio easily understandable, a dynamically neutral measuring system is impossible to setup, and the task becomes particularly difficult when the loads to be measured have a very short duration O(10"2s). Special attention has been therefore paid during the design and construction of the experimental setup to obtain the shortest possible resonance period. A numerical model of the experimental setup was used during the design to ensure that the dynamic response of the model structure wouldn't have significantly affected the measurements.
Results from the numerical modelling indicated that a very thick wall should have been used in order to reduce oscillation periods below the range of frequency being targeted. This need was nevertheless in opposition with the will of saving space inside the building to house an many sensors as possible in the model structure.
3752 COASTAL ENGINEERING 2008
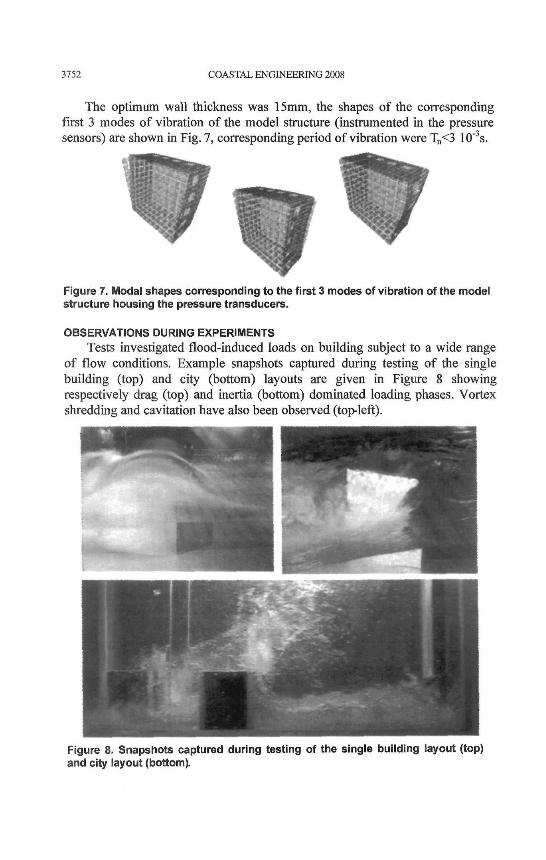
The optimum wall thickness was 15mm, the shapes of the corresponding first 3 modes of vibration of the model structure (instrumented in the pressure sensors) are shown in Fig. 7, corresponding period of vibration were Tn<3 10"3s.
Figure 7. Modal shapes corresponding to the first 3 modes of vibration of the model structure housing the pressure transducers.
OBSERVATIONS DURING EXPERIMENTS Tests investigated flood-induced loads on building subject to a wide range
of flow conditions. Example snapshots captured during testing of the single building (top) and city (bottom) layouts are given in Figure 8 showing respectively drag (top) and inertia (bottom) dominated loading phases. Vortex shredding and cavitation have also been observed (top-left).
Figure 8. Snapshots captured during testing of the single building layout (top) and city layout (bottom).
COASTAL ENGINEERING 2008 3753
INITIAL RESULTS In the following, initial results from preliminary analysis performed on time
histories recorded during the first set of the "single building layout" tests are presented. Data recorded during tests carried out with the structure located close to the gate (Fig. 6) only are presented in terms of effect of tested parameters and building orientation with respect to the direction of the main flow.
300
250
200
> I S 0
100
50
1 T I 1 T ~ > ^ l i l t \s^ I I I I ^C ^ ^ I T I I - ~~f \j^ ~ 1 , 1 1 S /A i j_ i y_ y_ T i i i ~/\'f ~ ~ i i i / / • i i l YJ^-- - - - =.
i i^cl l ^>~*— '
400
| 300
200
100
1 I 1 I ^1
1 1 I I / \ ^ - —
I I I 1/ yT\ i i i A / i 1 I 1 / rf \ l ' i / A ' i i i / / 1 i 1 i ~/~/~ I ~±^"^ l i / y ' ^ * ^ ^ ! l_ y M _^KT I
60 H[an]
60
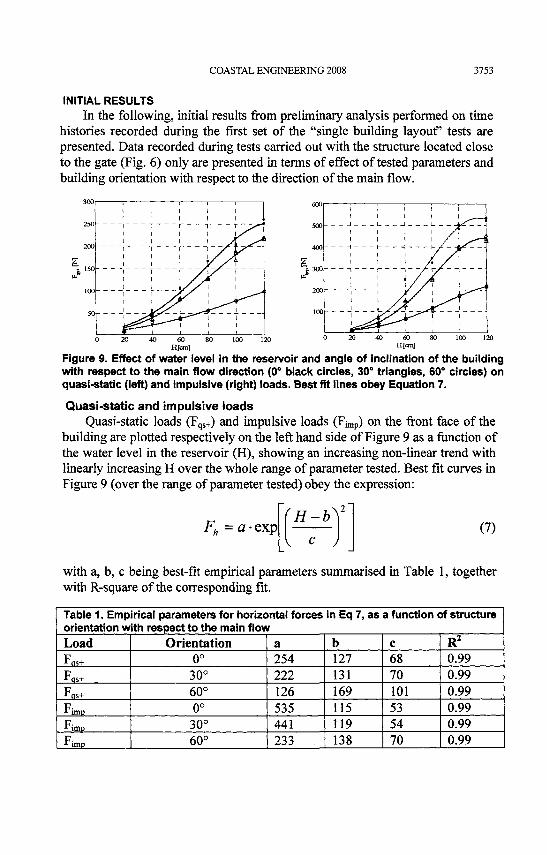
Figure 9. Effect of water level in the reservoir and angle of inclination of the building with respect to the main flow direction (0° black circles, 30° triangles, 60° circles) on quasi-static (left) and impulsive (right) loads. Best fit lines obey Equation 7.
Quasi-static and impulsive loads Quasi-static loads (Fqs+) and impulsive loads (F^) on the front face of the
building are plotted respectively on the left hand side of Figure 9 as a function of the water level in the reservoir (H), showing an increasing non-linear trend with linearly increasing H over the whole range of parameter tested. Best fit curves in Figure 9 (over the range of parameter tested) obey the expression:
Fh=a- exp (H-b^2
V c J (7)
with a, b, c being best-fit empirical parameters summarised in Table 1, together with R-square of the corresponding fit.
Table 1. Empirical parameters for horizontal forces in Eq 7, as a function of structure orientation with respect to the main flow Load Fas+
FQS+
FQS+
F 1 i m p F-1 imD F-1 imD
Orientation 0°
30° 60° 0°
30° 60°
a 254 222 126 535 441 233
b 127 131 169 115 119 138
c 68 70 101 53 54 70
R2
0.99 0.99 0.99 0.99 0.99 0.99
3754 COASTAL ENGINEERING 2008
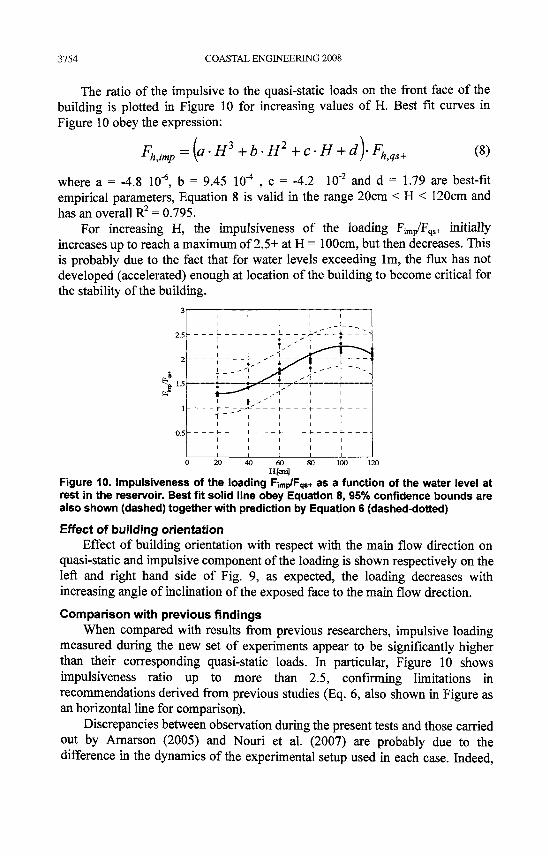
The ratio of the impulsive to the quasi-static loads on the front face of the building is plotted in Figure 10 for increasing values of H. Best fit curves in Figure 10 obey the expression:
FhMp={a-H'+b-H2+c-H + d)-Fh h,qs+ (8)
where a = -4.8 10'6, b = 9.45 10"4 , c = -4.2 10"2 and d = 1.79 are best-fit empirical parameters, Equation 8 is valid in the range 20cm < H < 120cm and has an overall R2 = 0.795.
For increasing H, the impulsiveness of the loading Fimp/Fqs+ initially increases up to reach a maximum of 2.5+ at H = 100cm, but then decreases. This is probably due to the fact that for water levels exceeding lm, the flux has not developed (accelerated) enough at location of the building to become critical for the stability of the building.
2.5
2
%. 1.5
a
l
0.5
! i
t
i
"" ~ 'I— i
T ~ 1
I
i
i
I I I !
I i X-" " " A- ~" " •>
| , ' , l l
J - - - - 1 t 1 i
i t l I
l i i I
l l I l
60 H[ori]
Figure 10. Impulsiveness of the loading Fimp/Fqs+ as a function of the water level at rest in the reservoir. Best fit solid line obey Equation 8, 95% confidence bounds are also shown (dashed) together with prediction by Equation 6 (dashed-dotted)
Effect of building orientation Effect of building orientation with respect with the main flow direction on
quasi-static and impulsive component of the loading is shown respectively on the left and right hand side of Fig. 9, as expected, the loading decreases with increasing angle of inclination of the exposed face to the main flow drection.
Comparison with previous findings When compared with results from previous researchers, impulsive loading
measured during the new set of experiments appear to be significantly higher than their corresponding quasi-static loads. In particular, Figure 10 shows impulsiveness ratio up to more than 2.5, confirming limitations in recommendations derived from previous studies (Eq. 6, also shown in Figure as an horizontal line for comparison).
Discrepancies between observation during the present tests and those carried out by Arnarson (2005) and Nouri et al. (2007) are probably due to the difference in the dynamics of the experimental setup used in each case. Indeed,
COASTAL ENGINEERING 2008 3755
looking at time-histories shown by previous authors, it appears likely that the experimental setup used in previous experimental work could have damped out most intense impacts as they were acting over a range of frequency higher than those corresponding to the natural frequency of vibration of the model structure. In the present experiments, since the model structure had very fast response, any recorded load was acting over a range of frequencies significantly lower than those corresponding to the natural frequencies of the model structure, resulting in the load being felt as "quasi-static" by the experimental setup-up and hence in a minimum distortion of recorded signal.
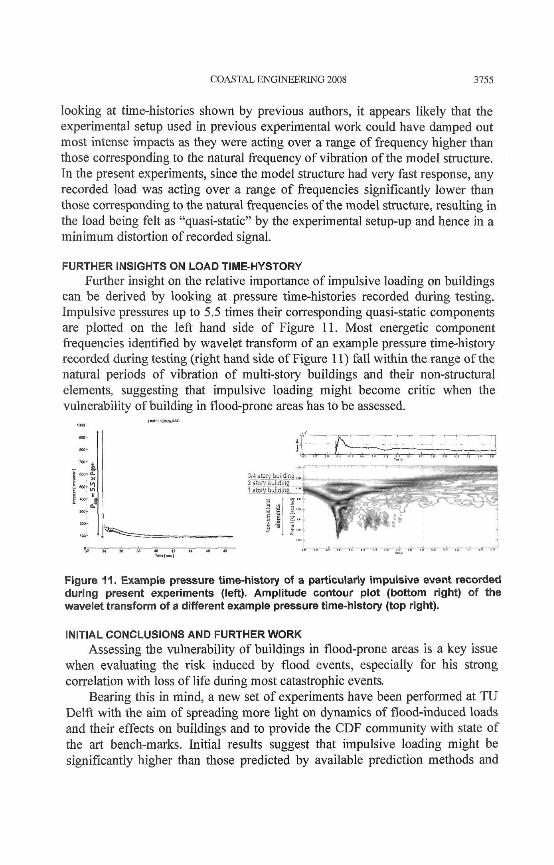
FURTHER INSIGHTS ON LOAD TIME-HYSTORY Further insight on the relative importance of impulsive loading on buildings
can be derived by looking at pressure time-histories recorded during testing. Impulsive pressures up to 5.5 times their corresponding quasi-static components are plotted on the left hand side of Figure 11. Most energetic component frequencies identified by wavelet transform of an example pressure time-history recorded during testing (right hand side of Figure 11) fall within the range of the natural periods of vibration of multi-story buildings and their non-structural elements, suggesting that impulsive loading might become critic when the vulnerability of building in flood-prone areas has to be assessed.
n u n iJtonASC
§-
Figure 11. Example pressure time-history of a particularly impulsive event recorded during present experiments (left). Amplitude contour plot (bottom right) of the wavelet transform of a different example pressure time-history (top right).
INITIAL CONCLUSIONS AND FURTHER WORK Assessing the vulnerability of buildings in flood-prone areas is a key issue
when evaluating the risk induced by flood events, especially for his strong correlation with loss of life during most catastrophic events.
Bearing this in mind, a new set of experiments have been performed at TU Delft with the aim of spreading more light on dynamics of flood-induced loads and their effects on buildings and to provide the CDF community with state of the art bench-marks. Initial results suggest that impulsive loading might be significantly higher than those predicted by available prediction methods and
3756 COASTAL ENGINEERING 2008
should be regarded as potentially critical when assessing the vutaerability of existing structure and designing flood-proof buildings.
ACKNOWLEDGMENTS This work is part of a research project funded by BC Hydro under contract
GOCE-CT-2004-505420 and FLOODsite under contract C71B44. Prof. W. Uijttewaal and Prof. H. Vrijling (TU Delft) are thanked for the many interesting discussion and suggestions. The authors are thankful to Aimilia Pistrika, S. de Vree and A. den Toom for their precious help during testing.
REFERENCES Arnason, H. (2005) "Interactions between an incident bore and a free-standing
coastal structure" PhD Thesis, University of Washington, 172 pages Clausen, L. and Clark, P.B. (1990) "The development of criteria for predicting
dambreak flood damages using modeling of historical dam failures" Int. Conf. on River Flood Hydraulics, pp. 369-380
Cuomo G., Allsop N.W.H. and McConnell K. (2003) "Dynamic Wave Loads on Coastal Structures: Analysis of Impulsive and Pulsating Wave Loads" Proc. of Coastal Structures 2003 Conference, Portland, Oregon, USA.
FEMA 549 (2006) "Hurricane Katrina in the Gulf Coast. Building Performance Observations, Recommendations, and Technical Guidance"
FEMA P646 (2008) "Guidelines for Design of Structures for Vertical Evacuation from Tsunamis"
Goda, Y. (1974) "New wave pressure formulae for composite breakwater" Proc. of 14th ICCE, Copenhagen, Denmark, ppl702-1720. ASCE New York,
Haehnel R. H. and Daly S. F. (2002) "Maximum Impact Force of Woody Debris on Floodplain Structures", US Army Corps of Engineers, Cold Regions Research and Engineering Laboratory, Report ERDC/CRREL TR-02-2
Kelman I. and Spence R. (2002) "An overview of flood actions on buildings" Engineering Geology 73, 297-309
Kawata Y. et al. (2005) "Comprehensive analysis of the damage and its impact on coastal zones by the Indian Ocean tsunami disaster"
Nouri Y., Nistor Y., Palermo D. and Saatcioglu M. (2007) "Structural analysis for tsunami-induced force and debris impact" Proc. of Coastal Structures 2007 Conference, Venice, Italy (in press).
Oumeraci, H., Kortenhaus, A., Allsop, N.W.H., De Groot, M.B., Crouch, R.S., Vrijling, J.K. & Voortman, H.G. (2001) "Probabilistic Design Tools for Vertical Breakwaters.",Balkema, Rotterdam (392 pp).
Ramsden, J.D. (1993) "Tsunamis: Forces on a vertical wall caused by long waves, bores and surges on a dry bed" PhD thesis, California Institute of Technology, Pasadena, California, Report No. KH-R-54
Takahashi, S., Tanimoto, K. and Shimosako, K. (1994) "A Proposal of Impulsive Pressure Coefficient for the Design of Composite Breakwaters" Proc. of Hydro-Port '94, Port and Harbour Research Institute, pp 489-504