Hydroclimatic Data Science Initiative Delaware Reservoirs’ Drought Risk Assessment A Paleo View...
23
Hydroclimatic Data Science Initiative Delaware Reservoirs’ Drought Risk Assessment A Paleo View NOAA-CREST – 8 th Annual Symposium – City College New York June 5 th and 6 th , 2013 Project Team Columbia Water Center : Naresh Devineni, Upmanu Lall Tree Ring Laboratory : Neil Pederson, Ed Cook
-
Upload
eva-heydon -
Category
Documents
-
view
216 -
download
0
Transcript of Hydroclimatic Data Science Initiative Delaware Reservoirs’ Drought Risk Assessment A Paleo View...
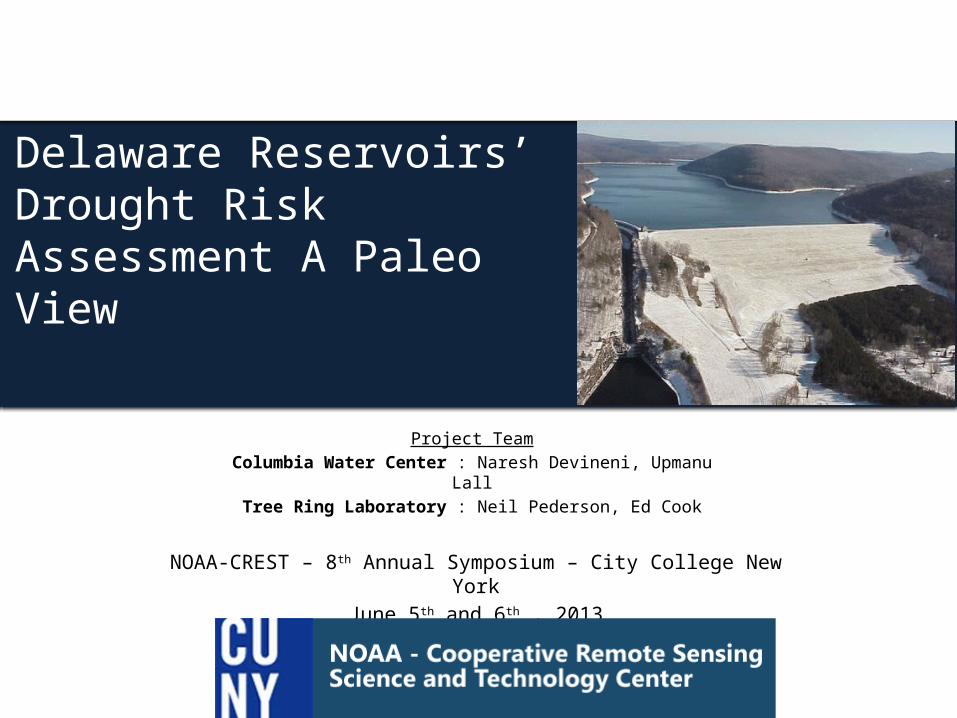
Hydroclimatic Data Science Initiative
Delaware Reservoirs’ Drought Risk Assessment A Paleo View
NOAA-CREST – 8th Annual Symposium – City College New York
June 5th and 6th , 2013
Project TeamColumbia Water Center : Naresh Devineni,
Upmanu LallTree Ring Laboratory : Neil Pederson, Ed Cook
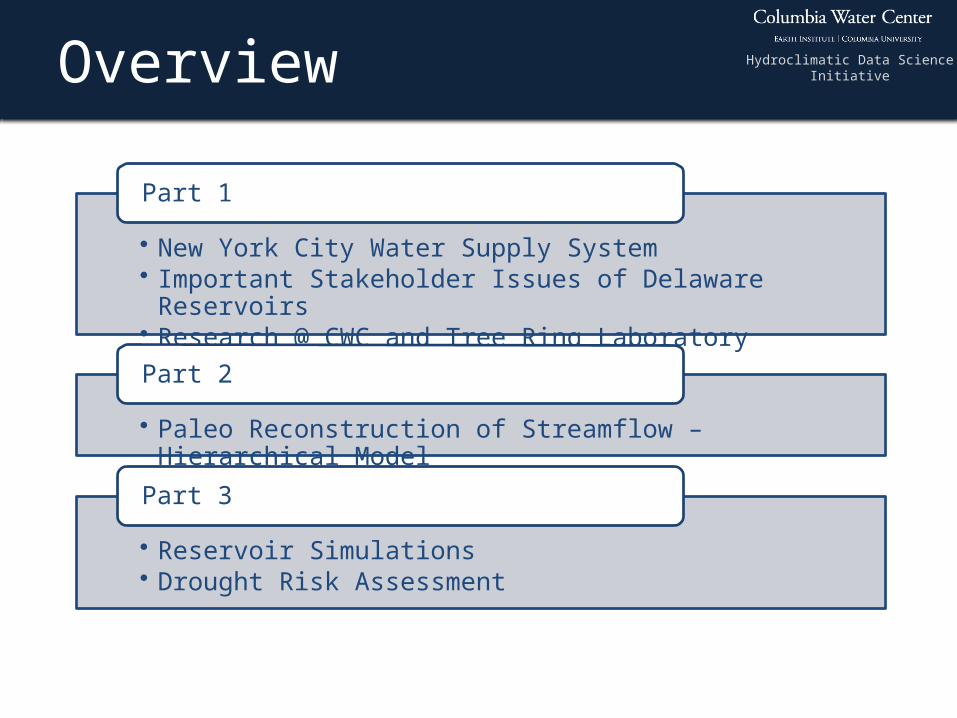
Hydroclimatic Data Science InitiativeOverview
• New York City Water Supply System• Important Stakeholder Issues of Delaware
Reservoirs• Research @ CWC and Tree Ring Laboratory
Part 1
• Paleo Reconstruction of Streamflow – Hierarchical Model
Part 2
• Reservoir Simulations• Drought Risk Assessment
Part 3
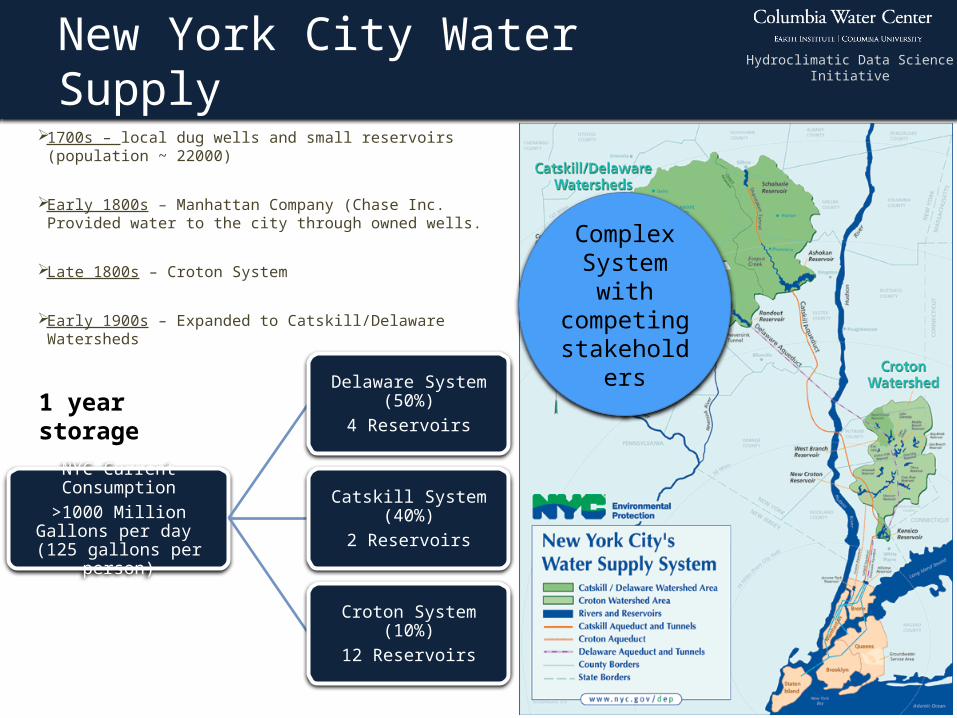
Hydroclimatic Data Science InitiativeNew York City Water Supply 1700s – local dug wells and small reservoirs
(population ~ 22000)
Early 1800s – Manhattan Company (Chase Inc. Provided water to the city through owned wells.
Late 1800s – Croton System
Early 1900s – Expanded to Catskill/Delaware Watersheds
NYC Current Consumption
>1000 Million Gallons per day (125 gallons
per person)
Delaware System (50%)
4 Reservoirs
Catskill System (40%)2 Reservoirs
Croton System (10%)12 Reservoirs
Complex System
with competing stakehold
ers1 year storage
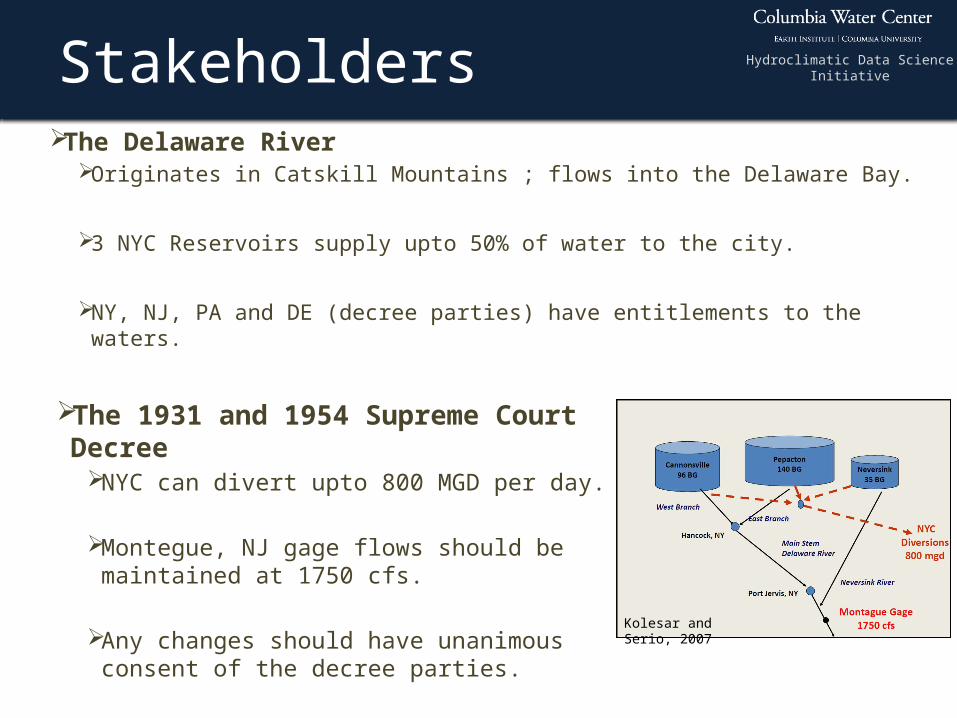
Hydroclimatic Data Science InitiativeStakeholders The Delaware River
Originates in Catskill Mountains ; flows into the Delaware Bay.
3 NYC Reservoirs supply upto 50% of water to the city.
NY, NJ, PA and DE (decree parties) have entitlements to the waters.
The 1931 and 1954 Supreme Court Decree
NYC can divert upto 800 MGD per day.
Montegue, NJ gage flows should be maintained at 1750 cfs.
Any changes should have unanimous consent of the decree parties.
Kolesar and Serio, 2007
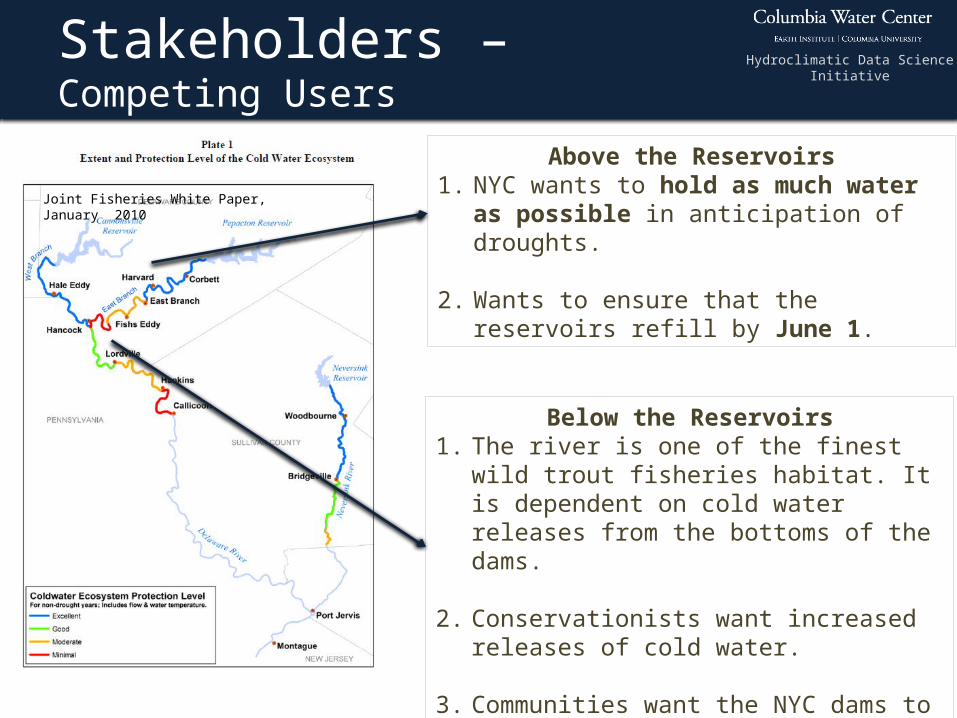
Hydroclimatic Data Science InitiativeStakeholders – Competing Users
Joint Fisheries White Paper, January 2010
Above the Reservoirs1. NYC wants to hold as much water
as possible in anticipation of droughts.
2. Wants to ensure that the reservoirs refill by June 1.
Below the Reservoirs1. The river is one of the finest wild trout
fisheries habitat. It is dependent on cold water releases from the bottoms of the dams.
2. Conservationists want increased releases of cold water.
3. Communities want the NYC dams to be used for increased flood protection.

Hydroclimatic Data Science InitiativeReservoir storage over the summer 2012 was ‘typical’
Chart courtesy of Hernan Quinodoz DRBC
Hydroclimatic Data Science InitiativeColumbia University Research
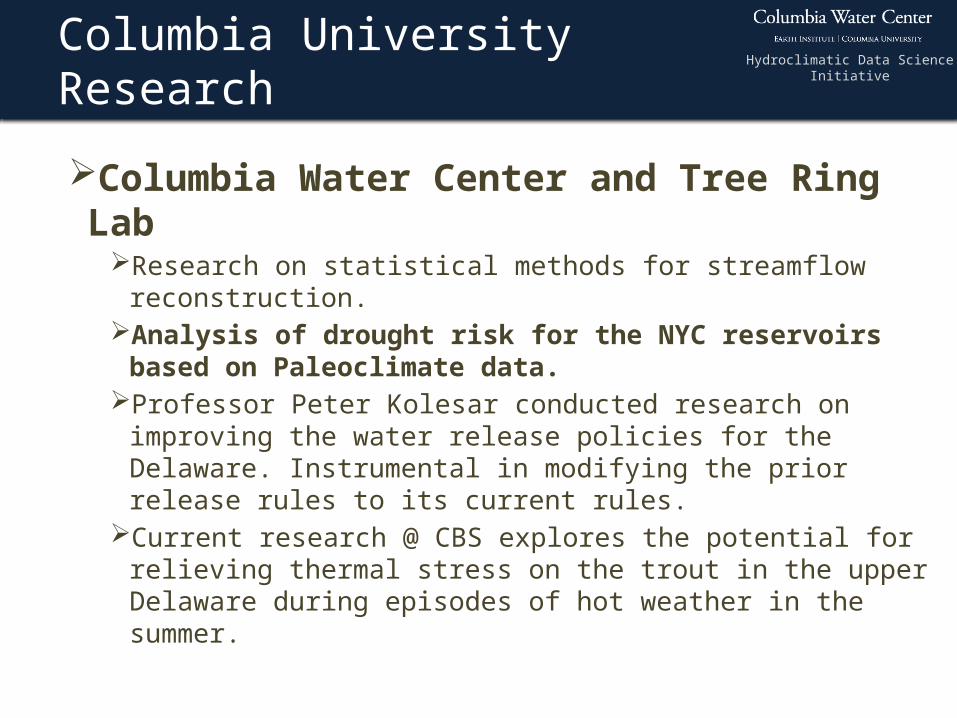
Columbia Water Center and Tree Ring Lab
Research on statistical methods for streamflow reconstruction.
Analysis of drought risk for the NYC reservoirs based on Paleoclimate data.
Professor Peter Kolesar conducted research on improving the water release policies for the Delaware. Instrumental in modifying the prior release rules to its current rules.
Current research @ CBS explores the potential for relieving thermal stress on the trout in the upper Delaware during episodes of hot weather in the summer.
Hydroclimatic Data Science InitiativePaleo Reconstruction
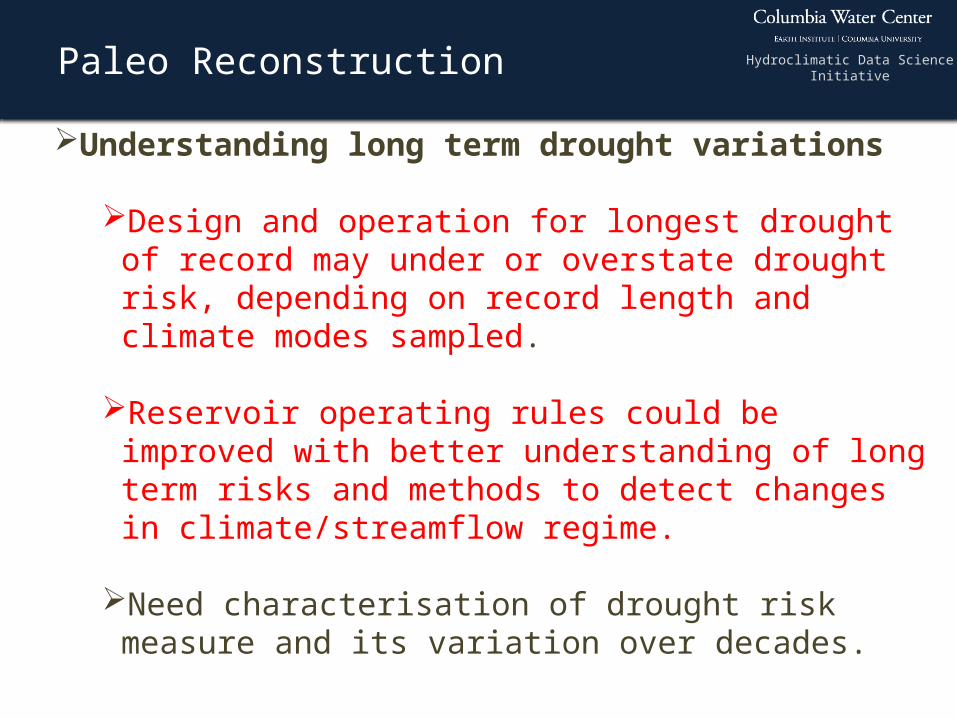
Understanding long term drought variations
Design and operation for longest drought of record may under or overstate drought risk, depending on record length and climate modes sampled.
Reservoir operating rules could be improved with better understanding of long term risks and methods to detect changes in climate/streamflow regime.
Need characterisation of drought risk measure and its variation over decades.
Hydroclimatic Data Science InitiativePaleo Reconstruction
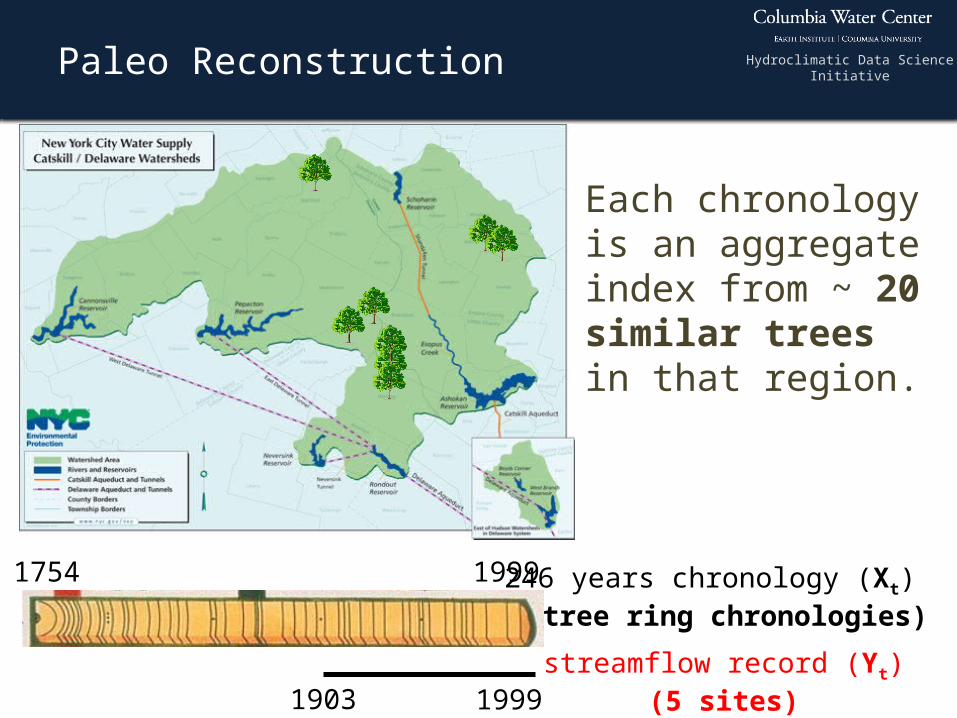
streamflow record (Yt)(5 sites)
246 years chronology (Xt)(8 tree ring chronologies)
1754
1903
1999
1999
Each chronology is an aggregate index from ~ 20 similar trees in that region.

Hydroclimatic Data Science InitiativeTree Ring ~ Streamflow
For this study, we developed reconstructed seasonal and total annual flows for reservoir inflows using the predictors.
Hydroclimatic Data Science Initiative
Bayesian Hierarchical Models
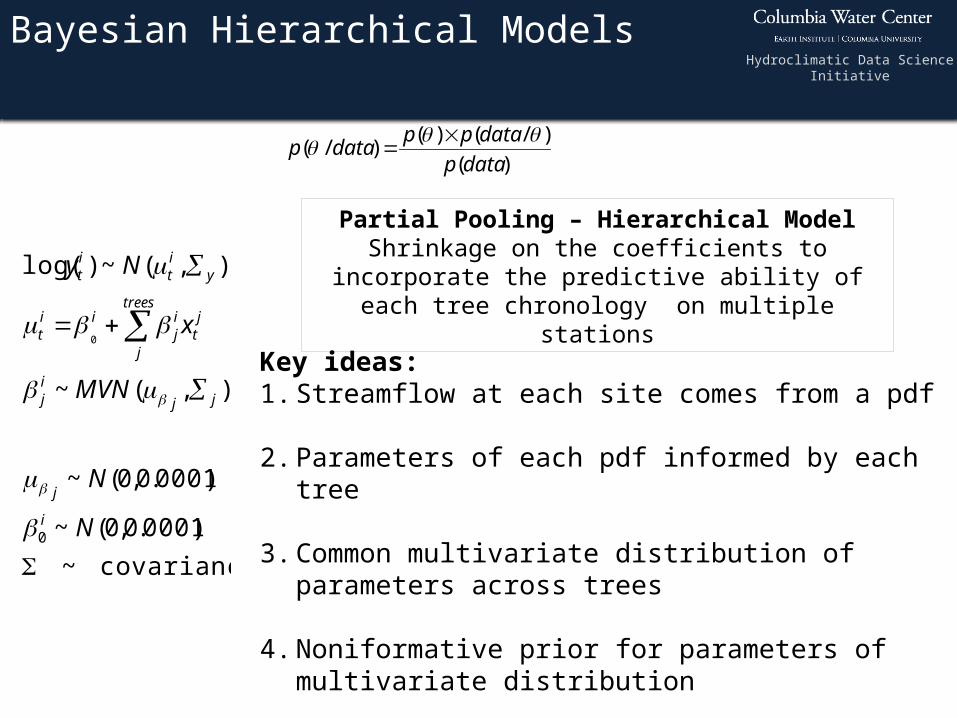
Partial Pooling – Hierarchical ModelShrinkage on the coefficients to incorporate the predictive
ability of each tree chronology on multiple stations
covariance~
)0001.0,0(~
)0001.0,0(~
),(~
),(~)log(
0
0
N
N
MVN
x
Ny
i
j
jj
ij
trees
j
jt
ij
iit
yit
it
)(
)/()()/(
datap
datappdatap
Key ideas:1. Streamflow at each site comes from a pdf
2. Parameters of each pdf informed by each tree
3. Common multivariate distribution of parameters across trees
4. Noniformative prior for parameters of multivariate distribution
5. MCMC for parameter estimation
Hydroclimatic Data Science Initiative
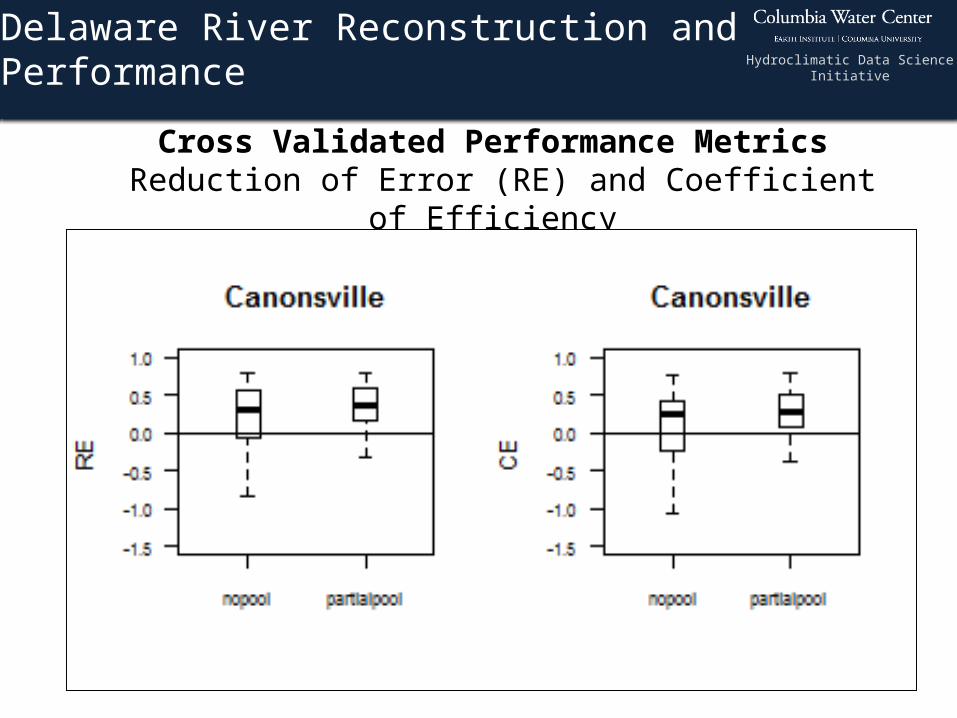
Delaware River Reconstruction and Performance
Cross Validated Performance Metrics Reduction of Error (RE) and Coefficient of
Efficiency

Hydroclimatic Data Science InitiativeReconstructed Flows
1. Posterior distribution of reconstructed streamflows are verified based on skill metrics such as Reduction of Error (RE), Coefficient of Efficiency (CE) and coverage rates.
2. Total annual flows are disaggregated into daily flows based on “k-nn” analog years.
3. Hence, we have 1000 simulations of 246 years of daily flows for the reservoir simulations and drought assessment.
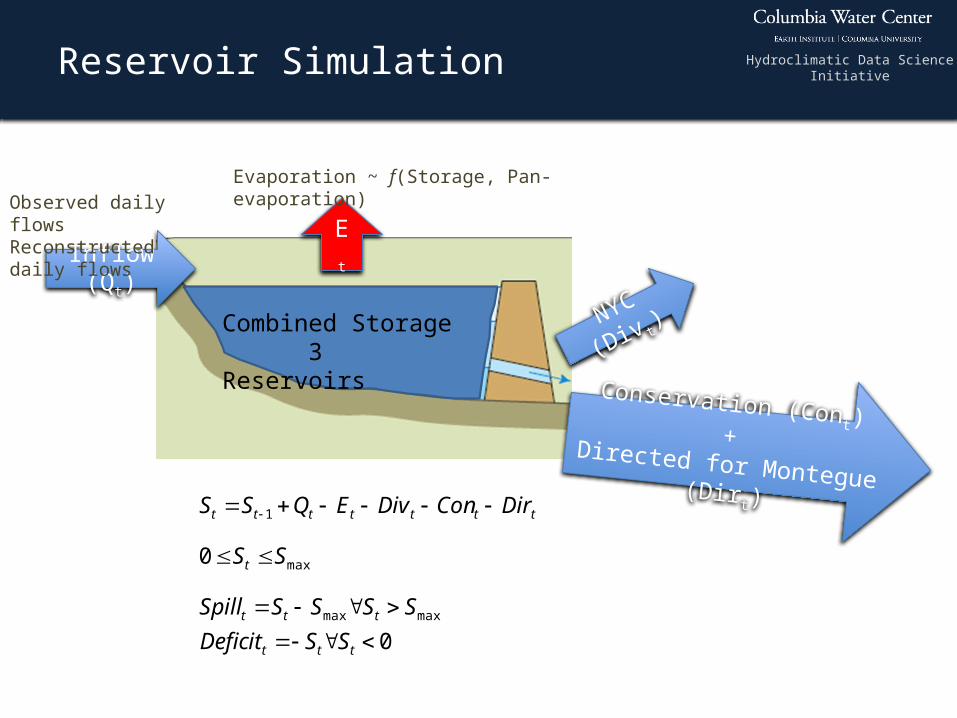
Hydroclimatic Data Science InitiativeReservoir Simulation
Mass Balanceand Storage Calculations
Where a finite tank/reservoir is considered– St needs to be >= 0– St needs to be <= K (the storage capacity) If St+1>K then Spillt+1= K-St+1and St+1=K If St+1<0 then Deficitt+1= -St+1and St+1=0
Go to mass balance spreadsheet
Spill
Deficit
Inflow (Qt)
Et
NYC
(Div t)
Conservation (Cont)+
Directed for Montegue (Dirt)
Combined Storage 3 Reservoirs
Observed daily flowsReconstructed daily flows
Evaporation ~ f(Storage, Pan-evaporation)
0
0
maxmax
max
1
ttt
ttt
t
ttttttt
SSDeficit
SSSSSpill
SS
DirConDivEQSS

Hydroclimatic Data Science InitiativeReservoir Simulation – Defining Drought
Drought Curves as % combined
storage
1. Daily releases are based on Flexible Flow Management Plan (FFMP) release matrix
2. Release based on daily storage levels…
Hydroclimatic Data Science Initiative
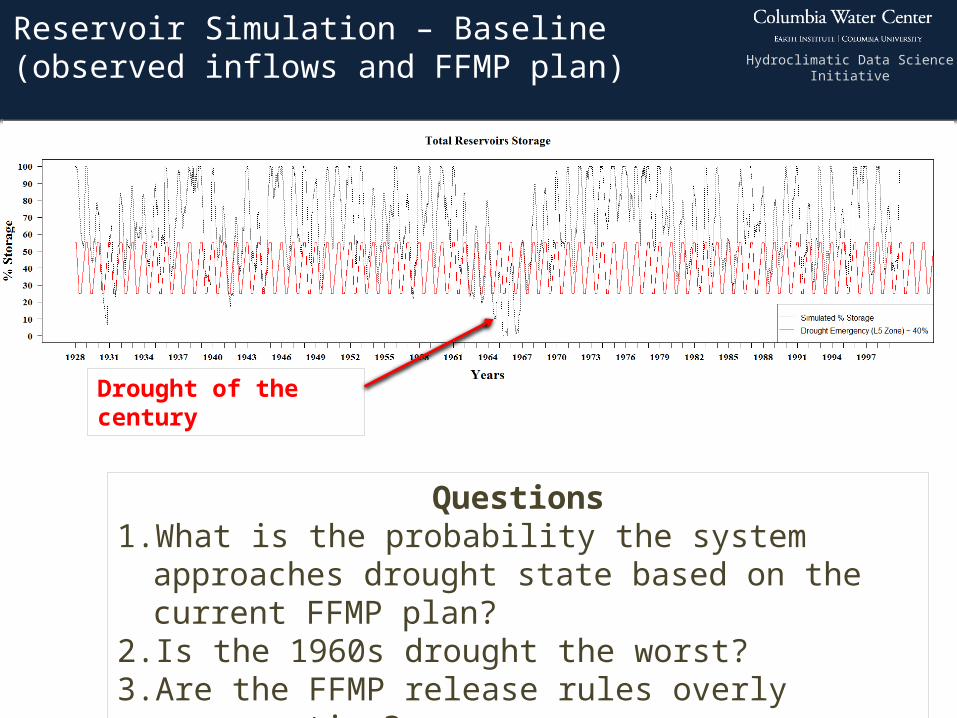
Reservoir Simulation – Baseline (observed inflows and FFMP plan)
Drought of the century
Questions1. What is the probability the system approaches
drought state based on the current FFMP plan?
2. Is the 1960s drought the worst?3. Are the FFMP release rules overly
conservative?

Hydroclimatic Data Science InitiativeReservoir Simulation
Questions1. What is the probability the system approaches drought state based on
the current FFMP plan?2. Is the 1960s drought the worst?3. Are the FFMP release rules overly conservative?
Analyses1. For each of the 1000 simulations, we estimated the reservoir storages
for 246 years (daily) based on reconstructed flows and current FFMP rules.
2. Based on these 1000 simulations of 246 years of daily storages, we compute the probability of the Storage being less than the Drought Curve for each day, i.e. 1. P (S < L3) 2. P (S < L4) 3. P (S < L5)
3. Based on these probabilities, the reservoir drought risk over 246 years can be visualized.
4. If a similar drought such as the 1960s drought were to occur in the past, we can detect it from the increased probability of being in drought during that regime.

Hydroclimatic Data Science InitiativeReservoir Simulation
1000
2#)2(
LssimulationLSP t
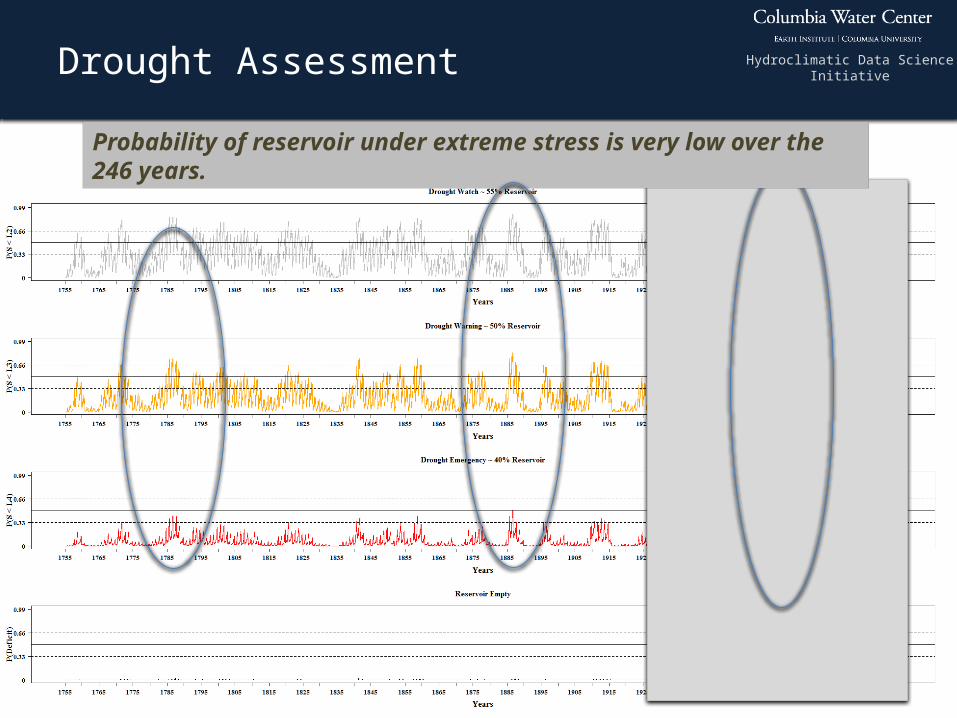
Hydroclimatic Data Science InitiativeDrought Assessment
Probability of reservoir under extreme stress is very low over the 246 years.
Hydroclimatic Data Science Initiative
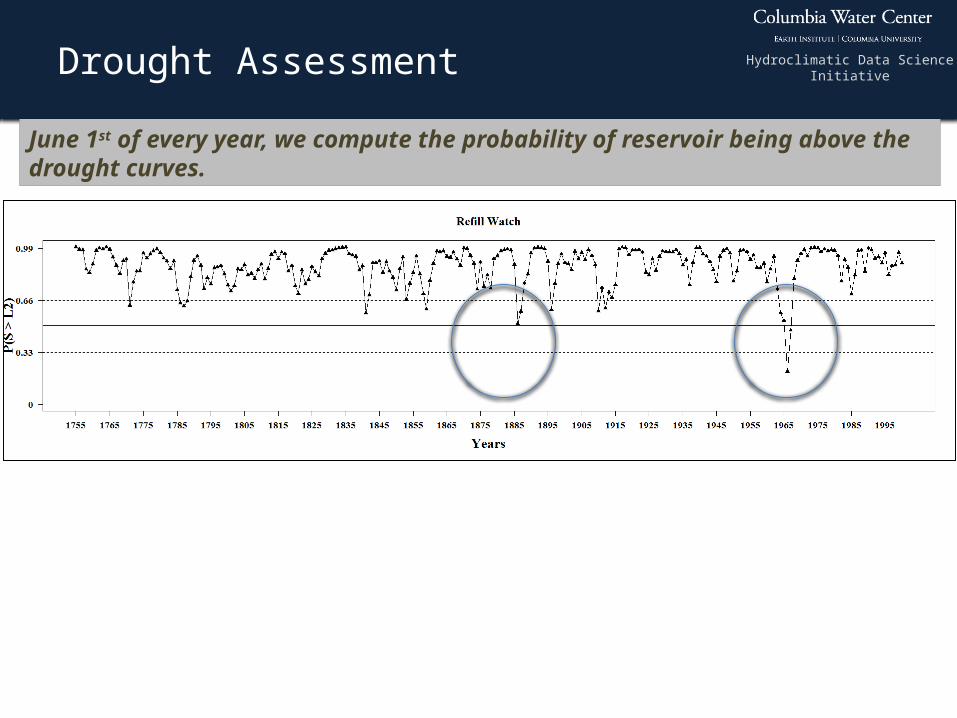
June 1st of every year, we compute the probability of reservoir being above the drought curves.
Drought Assessment

Hydroclimatic Data Science InitiativeDrought Assessment
0
50
100
150
0
1
2
3
4
5
6
Cu
mu
lati
ve S
ever
ity
(mill
ion
m3 )
Cu
mu
lati
ve D
ura
tion
(yea
rs)
Year
Duration
Severity
# of drought events (nd) = 14
# years (n)= 50
0
2
4
6
8
10
12
14
16
18
1950 1955 1960 1965 1970 1975 1980 1985 1990 1995
Flo
ws
(m3/
s)
Time
Summer Flows
Threshold
Duration
Cumulative Deficit - Severity

Hydroclimatic Data Science InitiativeSummary
The reconstructions allowed us insights in to the probability of moderate to severe sustained droughts in a region based on the current release plans.
We observe that the 1960s drought is by far the worst drought based on 246 years of simulations (since 1754).
There are intermediate drought warning periods; however, acute stress periods are rare. Proper adaptation would be sufficient during these periods.
There is a high probability of reservoirs refilling to normal zones by June 1 during most of the years.
Probability of spills over these periods reveal that the current FFMP releases can be understood as overly conservative.
Modified release rules that aid thermal relief to wild trout in the upper Delaware can be explored without much stress to the system during most periods.
Hydroclimatic Data Science InitiativeAcknowledgments NOAA, CCRUN NSF