HYDROCARBON SOURCE ROCK POTENTIAL AS ......HYDROCARBON SOURCE ROCK POTENTIAL AS DETERMINED BY...
12
HYDROCARBON SOURCE ROCK POTENTIAL AS DETERMINED BY ROCK-EVAL 6/TOC PYROLYSIS, NORTHEAST BRITISH COLUMBIA AND NORTHWEST ALBERTA By A. Ibrahimbas 1 and C. Riediger 1,2 KEYWORDS: Hydrocarbon source rocks, organic geochemistry, thermal maturity, petroleum systems. ABSTRACT The potential for conventional and/or unconventional hydrocarbon exploration requires the presence of organic- rich, thermally mature rock units containing oil or gas- prone kerogen. This potential is poorly known in large parts of northeastern B.C., and northern Alberta due to a paucity of organic geochemical studies. Here, we investigate Lower Triassic to Lower Cretaceous potential source rocks within a large area of northeastern British Columbia and northwestern Alberta (118°-124°W and 57°- 58°N). Hydrocarbon source rock parameters, including type and amount of kerogen, and thermal maturity of these formations, are assessed by analyzing 74 core samples from 23 wells using Rock-Eval 6/TOC pyrolysis. In general all units are immature in northwestern Alberta with increasing maturity to the west where they become overmature. The Lower Triassic Montney Formation contains Type II kerogen with TOC (Total Organic Carbon) values up to 4.2 wt.%, suggesting that this unit generated significant amount of hydrocarbons where it is mature. The base of the Doig Formation comprises a highly radioactive zone, the “Phosphate Zone” which contains Type II kerogen with TOC values up to 11 wt.%. This interval is an excellent hydrocarbon source rock. The Upper Triassic Baldonnel and Pardonet formations are late mature to overmature where sampled. The Baldonnel Formation contains up to 1.4 wt.% TOC indicating only poor to fair source rock potential. The Pardonet Formation is overmature, and contains residual TOC values up to 2.8 wt.%, which suggests this marine unit may have initially been a good source rock for hydrocarbons, but is now spent. The Lower Jurassic Gordondale Member comprises Type II kerogen with TOC values up to 10.45 wt.%, indicating that this unit is an excellent hydrocarbon source rock. The Lower Cretaceous Wilrich Shale is also of interest, as it has been suggested as a potential target for shale gas exploration. This unit is immature to mature within the study area. It contains Type III kerogen with TOC values up to 4.28 wt.%. Future investigation will involve 1D basin modeling in order to understand the amount and timing of hydrocarbon generation from these units with respect to timing of trap formation and accumulation of hydrocarbons. INTRODUCTION Hydrocarbon prospectivity in the Western Canada Sedimentary Basin (WCSB), or in any basin, hinges on the availability of oil and/or gas-prone rock units that have generated and expelled hydrocarbons. Potential and proven hydrocarbon source rock intervals of Mesozoic age are known throughout much of the WCSB, with most available data from the Alberta portion of the basin (e.g. Creaney and Allan, 1990; Creaney et al., 1994). Results of the previous works are summarized in Table 1. However, in the area of this study, bounded by 57°- 58°N latitude, and 118°-124°W longitude (Figure 1) there are few data available pertaining to hydrocarbon source rock potential. Furthermore, little is known of the thermal maturity of Paleozoic and Mesozoic strata in this area and such information is critical for predicting what type of hydrocarbons, if any, may have been generated. This paper reports the results of hydrocarbon source rock characterization of six formations of interest within the study area namely, the Montney Formation, the “Phosphate Zone” at the base of Doig Formation, the Baldonnel and the Pardonet formations, the Gordondale Member (for discussion of the Gordondale, formerly Nordegg, terminology see Asgar-Deen et al., in press) and Wilrich Formation (Figure 2). Samples were collected from cores in British Columbia and Alberta and were analyzed by Rock-Eval 6/TOC pyrolysis. Future investigation will involve 1D quantitative basin modeling in order to understand the amount and timing of hydrocarbon generation relative to trap formation and the accumulation of hydrocarbons. ______________________________ 1 University of Calgary 2 Corresponding author (e-mail: [email protected]) Resource Development and Geoscience Branch, Summary of Activities 2004 7
Transcript of HYDROCARBON SOURCE ROCK POTENTIAL AS ......HYDROCARBON SOURCE ROCK POTENTIAL AS DETERMINED BY...

HYDROCARBON SOURCE ROCK POTENTIAL AS DETERMINED BY ROCK-EVAL 6/TOC PYROLYSIS, NORTHEAST BRITISH COLUMBIA AND
NORTHWEST ALBERTA
By A. Ibrahimbas1 and C. Riediger1,2
KEYWORDS: Hydrocarbon source rocks, organic geochemistry, thermal maturity, petroleum systems.
ABSTRACT
The potential for conventional and/or unconventional hydrocarbon exploration requires the presence of organic-rich, thermally mature rock units containing oil or gas-prone kerogen. This potential is poorly known in large parts of northeastern B.C., and northern Alberta due to a paucity of organic geochemical studies.
Here, we investigate Lower Triassic to Lower Cretaceous potential source rocks within a large area of northeastern British Columbia and northwestern Alberta (118°-124°W and 57°- 58°N). Hydrocarbon source rock parameters, including type and amount of kerogen, and thermal maturity of these formations, are assessed by analyzing 74 core samples from 23 wells using Rock-Eval 6/TOC pyrolysis.
In general all units are immature in northwestern Alberta with increasing maturity to the west where they become overmature. The Lower Triassic Montney Formation contains Type II kerogen with TOC (Total Organic Carbon) values up to 4.2 wt.%, suggesting that this unit generated significant amount of hydrocarbons where it is mature.
The base of the Doig Formation comprises a highly radioactive zone, the “Phosphate Zone” which contains Type II kerogen with TOC values up to 11 wt.%. This interval is an excellent hydrocarbon source rock.
The Upper Triassic Baldonnel and Pardonet formations are late mature to overmature where sampled. The Baldonnel Formation contains up to 1.4 wt.% TOC indicating only poor to fair source rock potential. The Pardonet Formation is overmature, and contains residual TOC values up to 2.8 wt.%, which suggests this marine unit may have initially been a good source rock for hydrocarbons, but is now spent.
The Lower Jurassic Gordondale Member comprises Type II kerogen with TOC values up to 10.45 wt.%, indicating that this unit is an excellent hydrocarbon source rock. The Lower Cretaceous Wilrich Shale is also of interest, as it has been suggested as a potential target for shale gas exploration. This unit is immature to mature within the study area. It contains Type III kerogen with TOC values up to 4.28 wt.%.
Future investigation will involve 1D basin modeling in order to understand the amount and timing of hydrocarbon generation from these units with respect to timing of trap formation and accumulation of hydrocarbons.
INTRODUCTION
Hydrocarbon prospectivity in the Western Canada Sedimentary Basin (WCSB), or in any basin, hinges on the availability of oil and/or gas-prone rock units that have generated and expelled hydrocarbons. Potential and proven hydrocarbon source rock intervals of Mesozoic age are known throughout much of the WCSB, with most available data from the Alberta portion of the basin (e.g. Creaney and Allan, 1990; Creaney et al., 1994). Results of the previous works are summarized in Table 1.
However, in the area of this study, bounded by 57°-58°N latitude, and 118°-124°W longitude (Figure 1) there are few data available pertaining to hydrocarbon source rock potential. Furthermore, little is known of the thermal maturity of Paleozoic and Mesozoic strata in this area and such information is critical for predicting what type of hydrocarbons, if any, may have been generated.
This paper reports the results of hydrocarbon source rock characterization of six formations of interest within the study area namely, the Montney Formation, the “Phosphate Zone” at the base of Doig Formation, the Baldonnel and the Pardonet formations, the Gordondale Member (for discussion of the Gordondale, formerly Nordegg, terminology see Asgar-Deen et al., in press) and Wilrich Formation (Figure 2). Samples were collected from cores in British Columbia and Alberta and were analyzed by Rock-Eval 6/TOC pyrolysis.
Future investigation will involve 1D quantitative basin modeling in order to understand the amount and timing of hydrocarbon generation relative to trap formation and the accumulation of hydrocarbons.
______________________________ 1University of Calgary 2Corresponding author (e-mail: [email protected])
Resource Development and Geoscience Branch, Summary of Activities 2004 7

120°122°
124°
126°
118° 116° 114°W5
W6
T120
T110
T100
T90
T80
T70
T60
T50
T45
60°
59°
58°
57°
56°
55°
54°
53°
BC
AB
HRFZ
Nordegg
Baldonnel-Pardonet
Doig
Montney
Banff-Exshaw
HRFZ- Hay River Fault Zone
���
Subcrop Edges
���
•1
•5
•4
•2
•8
•6••11
•12•13
•19
•20
•21
•9
•
120°122°58°118°124°
57°
��
Edge of Deformed Belt
•1 Sampled well location
•3
•17
•16• ••
•
2322
1415
10
7
•18
Figure 1. Map showing the study area, core sample locations, and the subcrop edges of the formations of interest (Compiled from Richards et al., 1994; Edwards et al., 1994; Poulton et al., 1994).
STRATIGRAPHY
Devonian to Cretaceous stratigraphy in the study area is shown in Figure 2. Potential hydrocarbon source rock intervals are highlighted by shading. We use the new Gordondale Member terminology to refer to the organic-rich, fine-grained strata that are laterally equivalent of Nordegg Member. These relationships are described by Asgar-Deen (2003) and Asgar-Deen et al. (in press).
Although the Devonian-Mississippian Exshaw Formation is a well-known and proven source rock for hydrocarbons, the lack of core through this zone precluded acquisition of samples during this study. However, Rock-Eval/TOC analysis of drill cuttings samples are planned.
Details of the stratigraphy shown in Figure 2 are not given here but interested readers can find this information in the appropriate chapters of the Geological Atlas of the Western Canada Sedimentary Basin (Mossop and Shetson, 1994).
8 British Columbia Ministry of Energy and Mines

TABLE 1. PREVIOUS STUDIES OF ROCK-EVAL/TOC DATA SHOWING THE TOC’S AND THE KEROGEN TYPES OF THE UNITS OF INTEREST (*TOC VALUES WILL VARY, DEPENDING ON MATURITY)
METHODOLOGY
For this study 74 core samples were taken from 23 well locations (Figure 1). Samples were selected based on core availability within the zones of interest in the study area. Each sample was crushed to a fine powder prior to analysis. All samples were weighed to 100 mg and subjected to Rock-Eval 6/TOC analysis in order to determine the kerogen type, TOC content and thermal maturity, which are the main parameters for characterizing a hydrocarbon source rock. Analyses were conducted at the Organic Geochemistry Labs of the Geological Survey of Canada (Calgary). Measured parameters include S1 (mg HC/g rock), S2 (mg HC/g rock), S3 (mg CO2/g rock), Tmax (°C), and TOC (wt.%) (see Table 2). Several additional parameters including HI (Hydrogen Index, S2/TOCx100), OI(Oxygen Index, S3/TOCx100), and PI (Production Index, S1/(S1+S2)) are calculated from these measured values, and are shown in Table 2. Pyrolysis experiments were repeated for some samples at lower sample weight to ensure that the Rock-Eval/TOC detector was not overloaded by generated hydrocarbons during the original runs.
Details of the analytical procedure and discussion of Rock-Eval parameters are available in Espitalié et al. (1977), Peters (1986), and Snowdon et al. (1998). Peters (1986), and Peters and Cassa (1994) provide a summary of interpretive guidelines for Rock-Eval data.
RESULTS AND DISCUSSION
Rock-Eval 6/TOC results are summarized in Table 2. Of the 7 potential hydrocarbon source rocks shown in Figure 2, geochemical data from only the Montney, Phosphate Zone, Baldonnel/Pardonet, Gordondale, and Wilrich intervals are reported. As noted previously, no samples from the Exshaw Formation were collected for this study due to a lack of core through this zone.
Figure 2. Stratigraphic chart of the study area (compiled from Richards et al., 1994; Henderson et al., 1994; Edwards et al., 1994; Poulton et al., 1994; Hayes et al., 1994). Potential source rocks are highlighted by shading.
Unit *TOC range (average)(wt. %) Kerogen Type References
Wilrich 0.45-2.05 (1.4) Type III Faraj, 2003;Ibrahimbas, (Unpublished results)
Gordondale 0.55-28 (5) Type I/IIS Riediger et al., 1990b; Asgar-Deen, 2003; Faraj, 2003
Pardonet 0.26-6.5 (0.94) Type II Riediger, 1997; Carrelli, 2002
Baldonnel 0.14-2.08 (<1) Type II Riediger 1997; Carrelli 2002
Phosphate Zone
1.12-11 (3.6) Type II Riediger et al.,1990a; 1990b; Creaney and Allan, 1992; Faraj, 2003
Montney 0.8-4.7 (1.3) Type II Riediger et al., 1990a; 1990b; Hankel, 2001; Faraj, 2003
RU
ND
LE
PERIOD/ EPOCH
NE B.C. AND NW ALBERTA SUBSURFACE
BLUESKY L
OW
ER
FO
RT
ST
JO
HN
B
ullh
ead
CADOMIN
GETHING
WILRICH
FALHER
NOTIKEWIN
CR
ET
AC
EO
US
JURA
SSIC
NIKANASSIN
GREY BEDS
ROCK CREEK
GORDONDALE)(NORDEGG)
TR
IASS
IC
SCH
OO
LER
CRE
EK
CHARLIE LAKE
DA
IBE
R
DOIG
MONTNEY
PERMIAN
BELLOY
CA
RBO
NIF
ERO
US
U.
L.
UNNAMED SHALE
POKER CHIP
L.
M.
FE
RN
IE
L.
M.
U.
BALDONNEL/PARDONET
HALFWAY
JUR
ASS
IC
U. NIKANASSIN
TAYLOR FLAT
KISKATINAW
GOLATA
DEBOLT
SHUNDA
BANFF
EXSHAW DEVONIAN
SPIR
IT R
IVE
R
PEKISKO
CHARLIE LAKE
HALFWAY
STO
DD
AR
T
LOW
ER
U.
CA
RB
ON
IFE
RO
US
EXSHAW
U.
Resource Development and Geoscience Branch, Summary of Activities 2004 9

However, geochemical data from well cuttings will be incorporated in the second phase of the study.
In this section, the thermal maturity, and amount and type of organic matter are discussed. Interpretive guidelines from Peters (1986) and Peters and Cassa (1994) are used to evaluate the hydrocarbon source rock potential of each unit, and these guidelines are reproduced in Table 3. In Table 4 thermal maturity, TOC content, HI and kerogen type are summarized for each unit.
Thermal Maturity
Rock-Eval Tmax data given in Table 2 are used to assess thermal maturity in the study area. Each unit is mapped individually in Figure 3 because variations in kerogen type affect the Tmax values (Peters, 1986). The overall maturity trend in the study area shows that the maturity of the units increases from east to west towards the Cordilleran deformation front. All units are thermally mature throughout the central part of the study area, (Beatton River Map Area, 94H). Most of the studied units are immature in Alberta, and are overmature in the Trutch Map Area (94G).
TOC Content, Kerogen Type and Hydrocarbon Source Rock Potential
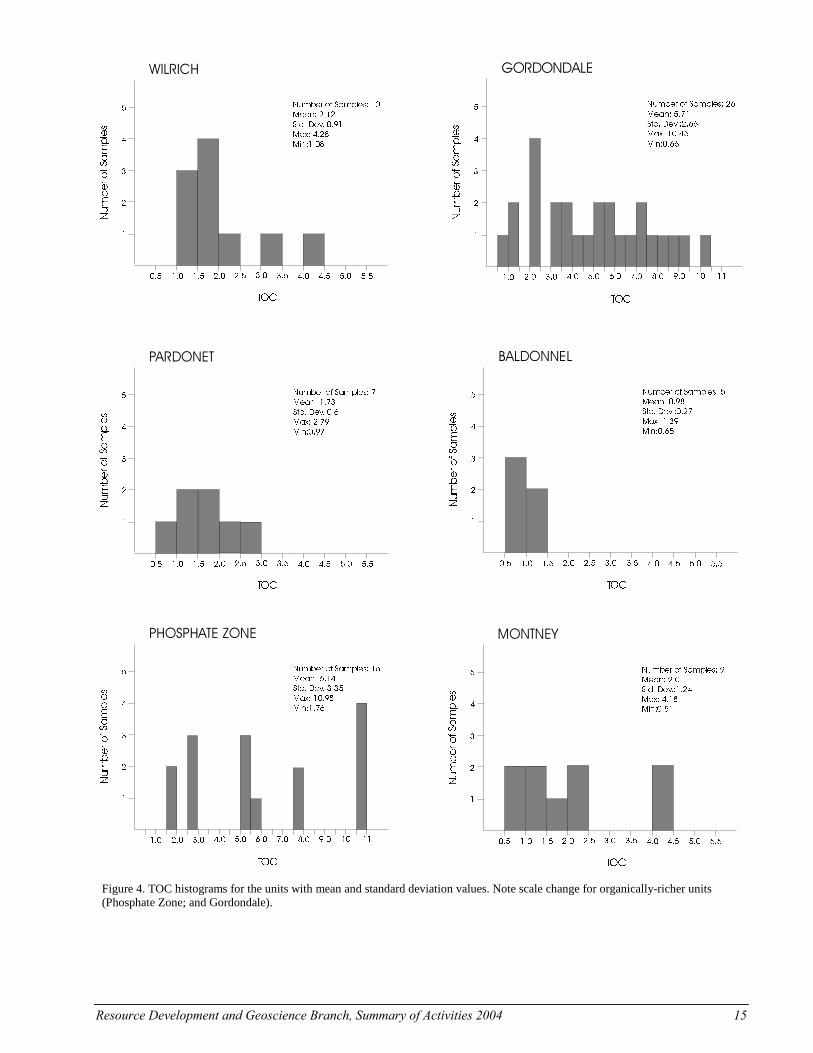
The ranges of TOC values for each unit are summarized in Table 4. Histograms showing the TOC variation for each unit with mean TOC values and standard deviations are also given in Figure 4. The plot of S2 against TOC for immature to early mature samples is used to determine the proportion of the inert carbon in the TOC measured by pyrolysis (Conford et al., 1998). During pyrolysis, only the labile kerogen will generate hydrocarbons to be recorded in S2 peak. Thus by discounting the proportion of inert carbon, it is possible to obtain a more accurate HI (S2/TOCx100) value from the slope of the best fitted lines of S2 vs. TOC data (Figure 5). A bivariate plot of HI vs. OI (Pseudo-Van Krevelen diagram) is also commonly used to assess the kerogen type (Figure 6).
In this section information on TOC and kerogen type for each unit are used to evaluate the hydrocarbon source rock potential based on criteria outlined in Table 3.
The TOC values for the Montney Formation range from 0.51 wt.% to 4.18 wt.% with a mean value of 2.01 wt.% (std. dev. =1.24) (Figure 4). It contains 0.35 wt.% inert carbon (Figure 5), hence the proportion of organic carbon content which has the capacity to generate hydrocarbons range from 0.16 to 3.83 wt.%, with a mean value of 1.66. The unit yields HI values of 43-450 mg HC/g TOC, which is typical for oil and gas-prone Type II kerogen (Figure 6). Considering only the immature samples, adjusted HI0 (original HI prior to maturation) is 571 mg HC/g TOC. These TOC and HI0
values indicate good to very good source rock potential in the Montney Formation.
The “Phosphate Zone” has high TOC values ranging from 1.76 to 10.98 wt.% (Table 4), with a mean value of 6.14 wt.% (std. dev.=3.35) (Figure 4). The amount of the inert carbon in the “Phosphate Zone” is also high with a value of 1.4 wt.% (Figure 5); therefore the true organic carbon content of the unit is than between 0.4 to 9.6 wt.%. The unit comprises Type II, oil and gas-prone kerogen with HI values ranging 189-489 mg HC/g TOC (263-645 mg HC/g TOC after discarding the effect of inert carbon (Figure 5)). The unit has excellent source rock potential.
The TOC values for Pardonet and Baldonnel formations are fair to moderate. The samples are all overmature, and hence original kerogen type cannot be determined from geochemical data. However, these are marine carbonate units, and thus likely contained Type II kerogen. This interpretation is also supported by the results of a previous study by Carrelli (2002) on these formations. The residual TOC values for Pardonet Formation range 0.97 to 2.79 wt.%, with a mean value of 1.73 wt.% (std. dev.=0.60). Bordenave et al. (1993) suggested that overmature Type II source rocks would have lost 50 % of their original TOC due to generation and expulsion of hydrocarbons. Hence, the original TOC values for Pardonet Formation were likely over 4 wt.%. The TOC values measured from the Baldonnel Formation range 0.65 to 1.39 wt.%, which by the same reasoning, were likely 1 to 2 wt.% originally. The Pardonet Formation had fair to good initial source rock potential, and the Baldonnel Formation had poor to fair initial source rock potential.
The Gordondale Member contains high TOC values ranging 0.66 to 10.45 wt.% (mean=5.71 wt.%, std. dev.=2.66) (Figure 4). The unit yields HI values of 26 to 273 mg HC/g TOC, and OI values of 3-23 mg CO2/g TOC (Figure 6), and the high degree of maturity precludes a precise assessment of the organic matter type. Riediger et al. (1990b), and Asgar-Deen (2003) proposed this unit having Type I/IIS kerogen, therefore, the unit most likely comprises Type II kerogen, considering its marine origin. This interval has excellent source rock potential where mature.
The TOC values of the Wilrich Shale ranges from 1.08 to 4.28 wt.% (mean=2.12 wt.%, std. dev.=0.91) (Figure 4). After considering the approximately 0.5 wt.% inert carbon (Figure 5), it will contain 0.58 to 3.78 wt.% TOC with a mean value of 1.62 wt.%. The unit contains Type III, gas-prone kerogen, with HI values ranging 138 to 393 mg HC/g TOC (Figure 6). The mean value of HI is 235 mg HC/g TOC after eliminating the effect of 0.5 wt.% inert carbon. The TOC and HI values indicate that the unit has good to very good source rock potential for gas generation.
10 British Columbia Ministry of Energy and Mines

TABLE 2. ROCK EVAL/TOC RESULTS FROM CORE SAMPLES IN THE STUDY AREA (+REPEAT RUN AT LOWER SAMPLE WEIGHT)
Unit Well # Well ID
Depth
(m) Tmax (°C)
S1
(mg HC/
g rock
S2
(mgHC/
g rock)
S3
(mg CO2/
g rock)
PI
S1/
(S1+S2)
TOC
(wt.%)
HI
(mgHC/
g TOC)
OI
(mgCO/
g TOC)
Wilrich 1 11-17-94-5W6 932.2 431 1.65 4.28 0.49 0.28 2.36 182 21
2 7-25-96-4W6 827 428 1.06 3.15 0.38 0.25 1.96 161 19
4 10-36-103-7W6 698.9 431 1.58 2.83 0.4 0.36 1.97 144 20 704.8 429 0.59 4.8 0.44 0.11 3.16 153 14 16 D-69-A/94-H-7 1100.5 441 0.22 2.69 0.16 0.08 1.83 148 9
1103.1 442 0.3 2.84 0.16 0.10 1.83 156 9 17 A-43-K/94-H-8 1194.5 438 0.14 1.49 0.27 0.09 1.08 139 25
1196 438 0.27 2.84 0.26 0.09 1.47 194 18 19 B-81-G/94-H-16 809.5 436 0.18 1.7 0.23 0.10 1.23 138 19
811.4 437 1.06 16.8 0.18 0.06 4.28 393 4
Gordondale 5 A-58-K/94-A-16 1010.9 439 1.08 6.27 0.09 0.15 3.03 208 3 1012.4 441 2.05 6.53 0.06 0.24 2.4 273 3
1013.5 438 1 4.3 0.06 0.19 2.05 210 3 11 A-43-A/94-H-4 1277.6 461 2.93 8.48 0.18 0.26 7.29 119 2
1277.6 461 2.71 8.34 0.2 0.25 7.35 116 3 1279.1 454 1.13 2.99 0.23 0.27 3.55 85 6
1281.1 464 1.85 6.02 0.23 0.24 4.14 74 3 12 D-93-A/94-H-4 1262.5 460 0.64 1.08 0.12 0.37 1.48 74 8 1264.1 456 1.46 6.82 0.3 0.18 6.32 109 5
1265.6 463 2.27 8.47 0.33 0.21 8.91 97 4 1267.1 446 3.8 8.19 0.26 0.32 5.94 139 4
1268.6 443 6.21 10.19 0.26 0.38 6.85 150 4 1270.1 448 6.77 12.77 0.2 0.35 7.84 165 3
1271.6 449 2.93 5.58 0.21 0.34 3.87 146 5
1273.1 448 1.78 3.3 0.15 0.35 2.35 142 6 13 D-65-D/94-H-4 1387.4 472 0.62 1.56 0.16 0.28 5.18 31 3
1388.4 481 0.52 2.93 0.31 0.15 8.12 37 4 1389.2 484 0.3 2.36 0.35 0.11 5.89 42 6 1389.9 484 0.25 2.05 0.38 0.11 5.25 41 7
1390.6 484 0.18 0.77 0.2 0.19 3.03 26 7 1391.8 484 0.32 1.37 0.37 0.19 4.98 29 7
1392.4 484 0.62 3.34 0.3 0.16 9.48 37 3 1393 480 0.68 3.35 0.29 0.17 10.45 33 3 14 A-5-E/94-H-6 1145.5 452 0.25 1.12 0.3 0.18 1.33 85 23
15 B-54-H/94-H-5 1218.7 443 0.49 2.23 0.12 0.18 2.19 102 5 22 C-86-C/94-G-8 1426.9 456 0.22 0.16 0.21 0.58 0.66 24 32
1429.1 453 0.19 0.18 0.18 0.51 0.58 31 31
Pardonet 6 A-77-K/94-B-15 1050.4 480 0.27 0.84 0.15 0.24 1.73 51 9
1055.8 461 0.36 0.42 0.19 0.46 1.83 23 10
1059.3 471 0.21 0.39 0.17 0.35 1.16 34 15
1061.8 468 0.33 0.34 0.21 0.49 1.34 26 16
23 D-99-F/94-G-8 1316.6 468 0.65 1.44 0.15 0.31 2.29 64 7
1317.6 464 0.53 0.92 0.11 0.37 0.97 96 11
1319.1 466 0.73 1.6 0.15 0.31 2.79 58 5
Baldonnel 6 A-77-K/94-B-15 1065.1 472 0.14 0.24 0.16 0.37 0.86 29 19
12 D-93-A/94-H-4 1274.1 452 0.52 0.56 0.13 0.48 0.98 57 13
Resource Development and Geoscience Branch, Summary of Activities 2004 11

TABLE 2. ROCK EVAL/TOC RESULTS CONTINUED.
Unit Well # Well ID
Depth
(m) Tmax (°C)
S1
(mg HC/
g rock
S2
(mgHC/
g rock)
S3
(mg CO2/
g rock)
PI
(S1/
(S1+S2))
TOC
(wt.%)
HI
(mgHC/
g TOC)
OI
(mgCO2/
g TOC)
22 C-86-C/94-G-8 1434.4 469 0.56 0.77 0.17 0.42 1.39 57 12
1439.8 464 0.69 0.63 0.2 0.52 1.02 63 20 1443.2 478 0.74 0.63 0.16 0.54 0.65 98 25
Phosphate 8 A-78-F/94-H-1 1069.2 447 0.99 10.21 0.22 0.09 2.95 346 7 Zone 1073.4 445 0.93 9.02 0.21 0.09 2.63 343 8
1075 443 0.76 5.9 0.19 0.11 1.9 311 10 1076.4 437 1.29 14.51 0.23 0.08 5.26 277 4 9 D-48-H/94-H-1 1051.3 425 0.01 0.05 0.31 0.17 0.12 42 258
1053.8 438 0.9 12.44 0.3 0.07 2.65 469 11 1056 433 1.78 28.61 0.33 0.06 5.86 489 6
10 D-72-E/94-H-2 1176.3 443 1.57 3.9 0.18 0.29 1.76 189 3 1180.6 443 1.62 9.93 0.18 0.14 5.27 189 3 +1180.6 441 1.59 9.79 0.21 0.14 5.02 196 4 1182.9 442 1.64 15.9 0.2 0.09 7.73 207 3 +1182.9 442 1.57 15.49 0.18 0.09 7.58 206 2
1186.1 445 2.01 25.17 0.22 0.07 10.98 231 2 +1186.1 445 2.08 24.62 0.21 0.08 10.79 230 2 1187.4 444 2.14 25.68 0.18 0.08 10.95 236 2
+1187.4 445 2.1 25.13 0.2 0.08 10.76 235 2
Montney 3 6-36-101-13W6 908.3 288 2.75 0.7 0.26 0.8 0.51 137 51 7 D-13-D/94-H-1 1133.2 447 1.19 8.8 0.17 0.12 4.03 219 4 1134.8 447 0.83 5.18 0.19 0.14 2.37 219 8 18 D-45-G/94-H-9 905.8 431 0.8 4.8 0.23 0.14 1.23 390 19 909.2 433 0.33 2.91 0.19 0.1 0.82 355 23 914.5 439 0.41 9.09 0.26 0.04 2.02 450 13
917.4 435 0.36 5.4 0.22 0.06 1.28 422 17 20 D-88-F/94-G-2 2130.8 490 0.02 0.02 0.11 0.5 0.87 2 13 2131.3 490 0 0.01 0.08 0 0.64 2 13 2132.4 -40 0 0 0.15 0 0.4 0 38 2133.1 500 0 0 0.1 0 0.43 0 23
21 C-80-L/94-G-7 869.9 477 0.67 2.02 0.26 0.25 4.18 50 6 873.4 466 0.48 0.69 0.18 0.41 1.63 43 11
TABLE 3. HYDROCARBON SOURCE ROCK EVALUATION PARAMETERS FOR ROCK-EVAL/TOC
PYROLYSIS DATA (MODIFIED FROM PETERS, 1986). (TABLE 3 (C) INCLUDES RANGES OF VITRINITE REFLECTANCE THAT ARE APPROXIMATELY EQUIVALENT TO ROCK-EVAL TMAX VALUES. VITRINITE REFLECTANCE
DATA ARE NOT USED IN THIS STUDY)
(A) Parameters for describing the Petroleum Potential of an Immature Source Rock.
Organic Matter
Petroleum TOC Rock-Eval Pyrolysis
Potential (wt. %) S1 S2
0-0.5 0-0.5 0-2.5
0.5-1 0.5-1 2.5-5
1-2 1-2 5-10
2-4 2-4 10-20
>4 >4 >20
12 British Columbia Ministry of Energy and Mines

TABLE 3. HYDROCARBON SOURCE ROCK EVALUATION PARAMETERS CONTINUED. (B) Parameters for describing Kerogen Type (Quality) of an Immature Source Rock. (C) Parameters for describing the level of Thermal Maturation.
TABLE 4. SUMMARY OF ROCK-EVAL/TOC DATA FROM CORE SAMPLES (RAW DATA)
HI
Kerogen Type (mg HC/g TOC) S2/S3
I >600 >15
II 300-600 10-15
II/III 200-300 5-10
III 50-200 1-5
IV <50 <1
Maturation
Stage of Thermal Vitrinite Reflectance Rock-Eval Tmax
Maturity for Oil Ro (%) (°C)
Immature 0.2-0.6 <435
Mature
Early 0.6-0.65 435-445
Peak 0.65-0.9 445-450
Late 0.9-1.35 450-470
Postmature >1.35 >470
UNIT (number of samples) DEPTH (m)
Tmax (°C)
range TOC (wt.%)
HI
(mg HC/g TOC)
Kerogen
Type
Source Rock
Potential
WILRICH (10) 809.5-1196 428-442 1.08-4.28 138-393 Type III Good to very good
(gas only)
GORDONDALE (27) 1010.9-1429.1 438-484 0.66-10.45 26-273 Type II Excellent
(oil+gas)
PARDONET (7) 1050.4-1319.1 461-480 0.97-2.79 23-96 Type II Fair to good
(oil+gas)
BALDONNEL (5) 1065.1-1443.2 452-478 0.65-1.39 29-98 Type II Poor to fair
(oil+gas)
PHOSPHATE ZONE (12) 1051.3-1187.4 433-447 1.76-10.98 189-489 Type II
Excellent
(oil+gas)
MONTNEY (13) 869.9-2133.1 431-500 0.51-4.18 43-450 Type II Good to very good
(oil+gas)
Resource Development and Geoscience Branch, Summary of Activities 2004 13

•431
•
•428
���������
*465 •
•
•
���
������ �����������������
������
Wilrich Shale (Type III) Gordondale Member (Type II)
Pardonet and Baldonnel Formations (Type II) Phosphate Zone (Type II)
Montney Formation (Type II)
•
438
441
436430
���124°W 118°W
58°N
57°N
•443•452
���
����
���
��
•452•481
•439•460
���
���������������
•471
*471•466
���
���
*456
• •435443443
���������
•434
•471
*457
*446
������������������
•447
*469
•495
124°W
124°W 124°W
124°W
118°W
118°W 118°W
118°W
58°N
58°N
58°N
58°N
57°N
57°N 57°N
57°N���
������
���������
•471
Figure 3. The thermal maturity distribution of each unit based on Rock-Eval Tmax values (ºC). * Tmax values from unpublished results (Dr. Larry Lane (GSC, Calgary), personal communication, 2003).
CONCLUSIONS
Six units of Early Triassic to Early Cretaceous age have been assessed for their hydrocarbon source potential in the study area. A total of 74 samples from 23 wells were analyzed by Rock-Eval 6/TOC pyrolysis.
The Montney Formation within the study area is thermally immature to overmature with increasing maturity from northeast to southwest. It contains Type II kerogen with TOC values up to 4.18 wt.%. This suggests that the Montney Formation may have generated significant amounts of hydrocarbons where it is mature in the B.C. part of the study area.
The highly radioactive “Phosphate Zone” at the base of Doig Formation contains Type II kerogen with TOC’s up to 10.98 wt.%. The maturity increases from east to west and it is mature in the Beatton River Map area (94H). The high TOC values suggest that this unit has excellent hydrocarbon source potential where mature.
The Baldonnel and Pardonet formations are overmature in the west part of the study area where sampled. Both likely comprise Type II kerogen, although the high degree of maturity precludes a direct assessment of kerogen type. The Baldonnel Formation
has TOC values up to 1.39 wt.% suggesting that it had poor to fair initial source rock potential. The Pardonet Formation has TOC values up to 2.8 wt.%, which suggests that it had fair to good initial hydrocarbon generation potential when mature.
The Gordondale Member samples vary from peak mature to overmature. It contains Type II kerogen with TOC’s up to 10.45 wt.% suggesting that it is an excellent source rock where mature.
The Wilrich Shale contains Type III kerogen with TOC’s up to 4.28 wt.%. Therefore, it has good to very good generation potential for gas. It is immature in the east part of the study area with increasing maturity to west.
The next step in this project is to apply 1D basin modeling to understand the amount and timing of hydrocarbons generated from these units, which will then be correlated with the timing of trap formation and accumulation of the hydrocarbons in the study area.
14 British Columbia Ministry of Energy and Mines
��� ��� ��� ��� ��� ��� ��� ��� ��� ��� ���
�
�
�
�
�
��������������
���
���� �� ������� ��
����� ����
���� ���������
���� ����
��������
�����
��� ��� ��� ��� ��� �� !�� ���
�
�
�
�
�
��������������
���
���� �� ������� �
����� ��!�
���� �������
���� �����
������
�� �� ��
��� �� ��
��� ��� ��� ��� ��� ��� ��� ��� ��� ��� ���
�
�
�
�
�
��������������
���
���� �� ������� !
����� ��!�
���� �������
���� ��!�
�������!
�� ����
��� ��� ��� ��� ��� ��� ��� ��� ��� ��� ���
�
�
�
�
�
��������������
���
���� �� ������� �
����� ����
���� ��������!
���� ����
������ �
�� ����
��� ��� ��� ��� ��� ��� ��� ��� ��� ��� ���
�
�
�
�
�
��������������
���
���� �� ������� �
����� ����
���� ���������
���� ����
��������
�������
��� ��� ��� ��� ��� �� !�� ���
�
�
�
�
�
��������������
���
���� �� ������� ��
����� ���
���� ���������
���� �����
������!
��������������
��� �� ��
Figure 4. TOC histograms for the units with mean and standard deviation values. Note scale change for organically-richer units (Phosphate Zone; and Gordondale).
Resource Development and Geoscience Branch, Summary of Activities 2004 15

Figure 5. Rock-Eval pyrolysis S2 versus TOC, showing Hydrogen Index and Inert Carbon content of the units which have immature to early mature samples.
Figure 6. Pseudo-Van Krevelen diagram, showing Rock-Eval Hydrogen Index vs. Oxygen Index for the sampled units.
ACKNOWLEDGEMENTS
We wish to acknowledge Mark Hayes and Kevin Pederson of the BC Ministry of Energy and Mines, and The B.C. Ministry of Energy and Mines, Geology Facility-Core Lab in Charlie Lake, for funding and logistical support for this project. Ross Stewart and the Organic Geochemistry Labs at GSC, Calgary, are gratefully acknowledged for providing the Rock-Eval VI/TOC pyrolysis data. Dr. Larry Lane is gratefully acknowledged for discussions of geology of the study area and access to his geochemical dataset.
REFERENCES
Asgar-Deen, M., 2003, Stratigraphy, Sedimentology and Paleogeography of the Lower Jurassic Nordegg Member (Gordondale Member), west-central Alberta, Canada. Unpublished M.Sc. Thesis, Department of Geology and Geophysics, University of Calgary, 206 pages.
Asgar-Deen, M., Hall, R., and Riediger, C.L., In press. The Gordondale Member: designation of a new member in the Fernie Formation to replace the informal “Nordegg Member” nomenclature of the subsurface of west-central Alberta. Canadian Bulletin of Petroleum Geology.
Bordenave, M.L., Espitalié, J., LePlat, P., Oudin, J.L., and Vandenbroucke, M., 1993. Screening techniques for source rock evaluation. Chapter II.2. In: Applied Petroleum Geochemistry. M.L. Bordenave (ed.). Éditions Technip, pages 217-278.
0
5
10
15
20
25
30
35
0 2 4 6 8 10 12TOC
S2
WILRICH
PHOSPHATE ZONE
MONTNEY
HIMont.=571
HIMont.=47
HIPhos..=645
HIPhos..=263
HIWilr..=235
0.35 0.5 1.4
Pseudo-Van K revelen P lot
0
200
400
600
800
1000
1200
0 50 100 150Oxygen Index (mg HC/g T OC)
Hyd
roge
n In
dex
(mg
HC
/g T
OC
)
WILRICH
NORDEGG
PARDONET
BALDONNEL
PHOS PHAT E ZONE
MONT NEY
Type I
Type II
Type III
16 British Columbia Ministry of Energy and Mines

Carrelli, G.G., 2002, Geology and source rock potential of the upper Triassic Baldonnel and Pardonet formations, northeastern British Columbia. Unpublished MSc. Thesis, University of Calgary, 2002, 335 pages. Cornford, C., Gardner, P., and Burgess, C, 1998, Geochemical truths in large data sets. I: Geochemical screening data. Organic Geochemistry, v.29, no.1-3, pages 519-530.
Creaney, S., and Allan, J., 1990, Hydrocarbon generation and migration in the Western Canada Sedimentary Basin. In: Classic Petroleum Provinces. J.Brooks (ed.) Geological Society Special Publication, No.50, pages 189-202.
Creaney, S., and Allan, J, 1992, Petroleum systems in the Foreland Basin of Western Canada. In: Foreland Basins and Foldbelts. R.W. Macqueen and D.A. Leckie (ed.). American Association of Petroleum Geologists, Memoir 55, pages 279-306.
Creaney, S., Allan, J., Cole, K., Brooks, P.W., Fowler, M.G., Osadetz, K.G., Snowdon, L.R., and Riediger C.L., 1994, Petroleum generation and migration in the Western Canada Sedimentary Basin. In: Geological Atlas of Western Canada Sedimentary Basin. G.D. Mossop and I. Shetsen (comps.), Calgary, Canadian Society of Petroleum Geologists and Alberta Research Council, pages 455-468.
Edwards, D.E., Barclay, J.E., Gibson, D.W., Kvill, G.E., Halton, E., 1994, Triassic strata of the Western Canada Sedimentary Basin. In: Geological Atlas of Western Canada Sedimentary Basin. G.D. Mossop and I. Shetsen (comps.), Calgary, Canadian Society of Petroleum Geologists and Alberta Research Council, pages 259-276.
Espitalié, J., Laporte, J.L., Madec, M., Marquis, F., Leplat, P., Paulet, J., and Boutefeu, A., 1977, Méthode rapide de caractérisation des roches de méres de leur potentiel pétrolier et de leur degré d’évolution. Institut Francais Pétrolier Revue, v.32, pages 23-42.
Faraj, B., 2003, Shale gas potential of selected formations from the WCSB of Western Canada. In: 5th Annual Unconventional Gas and Coalbed Methane Conference Proceedings, 2003, Calgary.
Handerson, C.M., Richards, B.C., Barclay, J.E., 1994, Permian strata of the Western Canada Sedimentary Basin. In: Geological Atlas of Western Canada Sedimentary Basin. G.D. Mossop and I. Shetsen (comps.), Calgary, Canadian Society of Petroleum Geologists and Alberta Research Council, pages 251-258.
Hankel R., 2001, Source rock and oil geochemistry and conodont biostratigraphy of the Triassic Lower Montney Formation in the Peace River Arch area, west-central Alberta. Unpublished MSc. Thesis, University of Calgary, 2001, 61 pages. Fennell, J.W., 1994, Cretaceous Mannville Group of the Western Canada Sedimentary Basin. In: Geological Atlas of Western Canada Sedimentary Basin. G.D. Mossop and I. Shetsen (comps.), Calgary, Canadian Society of Petroleum Society of Petroleum Geologists and Alberta Research Council, pages 317-334.
Hayes, B.J.R., Cristopher, J.E., Rosenthal, L., Los, G., McKercher, B., Minken, D.F., Tremblay, Y.M., Ibrahimbas, A., (Unpublished data), Hydrocarbon source rock potential of the Wilrich Shale. Unpublished
data for the 701 Course Project, University of Calgary, 2003, 50 pages.
Mossop G.D., and Shetsen, I., (compilers), 1994. Geological Atlas of Western Canada Sedimentary Basin. Calgary, Canadian Society of Petroleum Geologists and Alberta Research Council, 510 pages.
Peters, K.E., and Cassa, M.R., 1994, Applied Source Rock Geochemistry. In: The petroleum system- from source to trap; L.B. Magoon and W.G. Dow (ed.). American Association of Petroleum Geologists, Memoir 60, pages 93-117.
Peters, K.E., 1986, Guidelines for evaluating petroleum source rocks using programmed pyrolysis. American Association of Petroleum Geologists Bulletin, v.70, pages 318-329.
Poulton, T.P., Christopher, J.E., Hayes, B.J.R., Losert, J., Tittemore, J., Gilchrist, R.D., 1994, Jurassic and Lowermost Cretaceous strata of the Western Canada Sedimentary Basin. In: Geological Atlas of Western Canada Sedimentary Basin. G.D. Mossop and I. Shetsen (comps.), Calgary, Canadian Society of Petroleum Geologists and Alberta Research Council, pages 297-316.
Richards, B.C., Barclay, J.E., Bryan, D., Hartling, A., Henderson, C.M., Hinds, R.C., 1994, Carboniferous strata of the Western Canada Sedimentary Basin. In: Geological Atlas of Western Canada Sedimentary Basin. G.D. Mossop and I. Shetsen (comps.), Calgary, Canadian Society of Petroleum Geologists and Alberta Research Council, pages 221-250.
Riediger, C.L., 1997, Geochemistry of potential hydrocarbon source rocks of Triassic age in the Rocks Mountain Foothills of northeastern British Columbia and west-central Alberta. Bulletin of Canadian Petroleum Geology, v.45(4), pages 719-741.
Riediger, C.L., Fowler, M.G., Brooks, P.W., and Snowdon, L.R., 1990a, Triassic oils and potential Mesozoic source rocks, Peace River Arch area, Western Canada Basin. Organic Geochemistry, v.16, pages 295-305.
Riediger, C.L., Fowler, M.G., Snowdon, L.R., Goodarzi, F., and Brooks, P.W., 1990b, Source rock analysis of the Lower Jurassic “Nordegg Member” and oil-source rock correlations, northwestern Alberta and northeastern British Columbia. Bulletin of Canadian Petroleum Geology, v.38A, pages 236-249.
Snowdon, L.R., Fowler, M.G., and Riediger, C.L., 1998. Interpretation of organic geochemical data. CSPG Short Course Notes, November 5-6, 1998, Calgary, Alberta.
Resource Development and Geoscience Branch, Summary of Activities 2004 17

18 British Columbia Ministry of Energy and Mines