Hydro-Geomorphic Characteristics of the Stanislaus ... Characteristics of the Stanislaus, Tuolumne,...
1
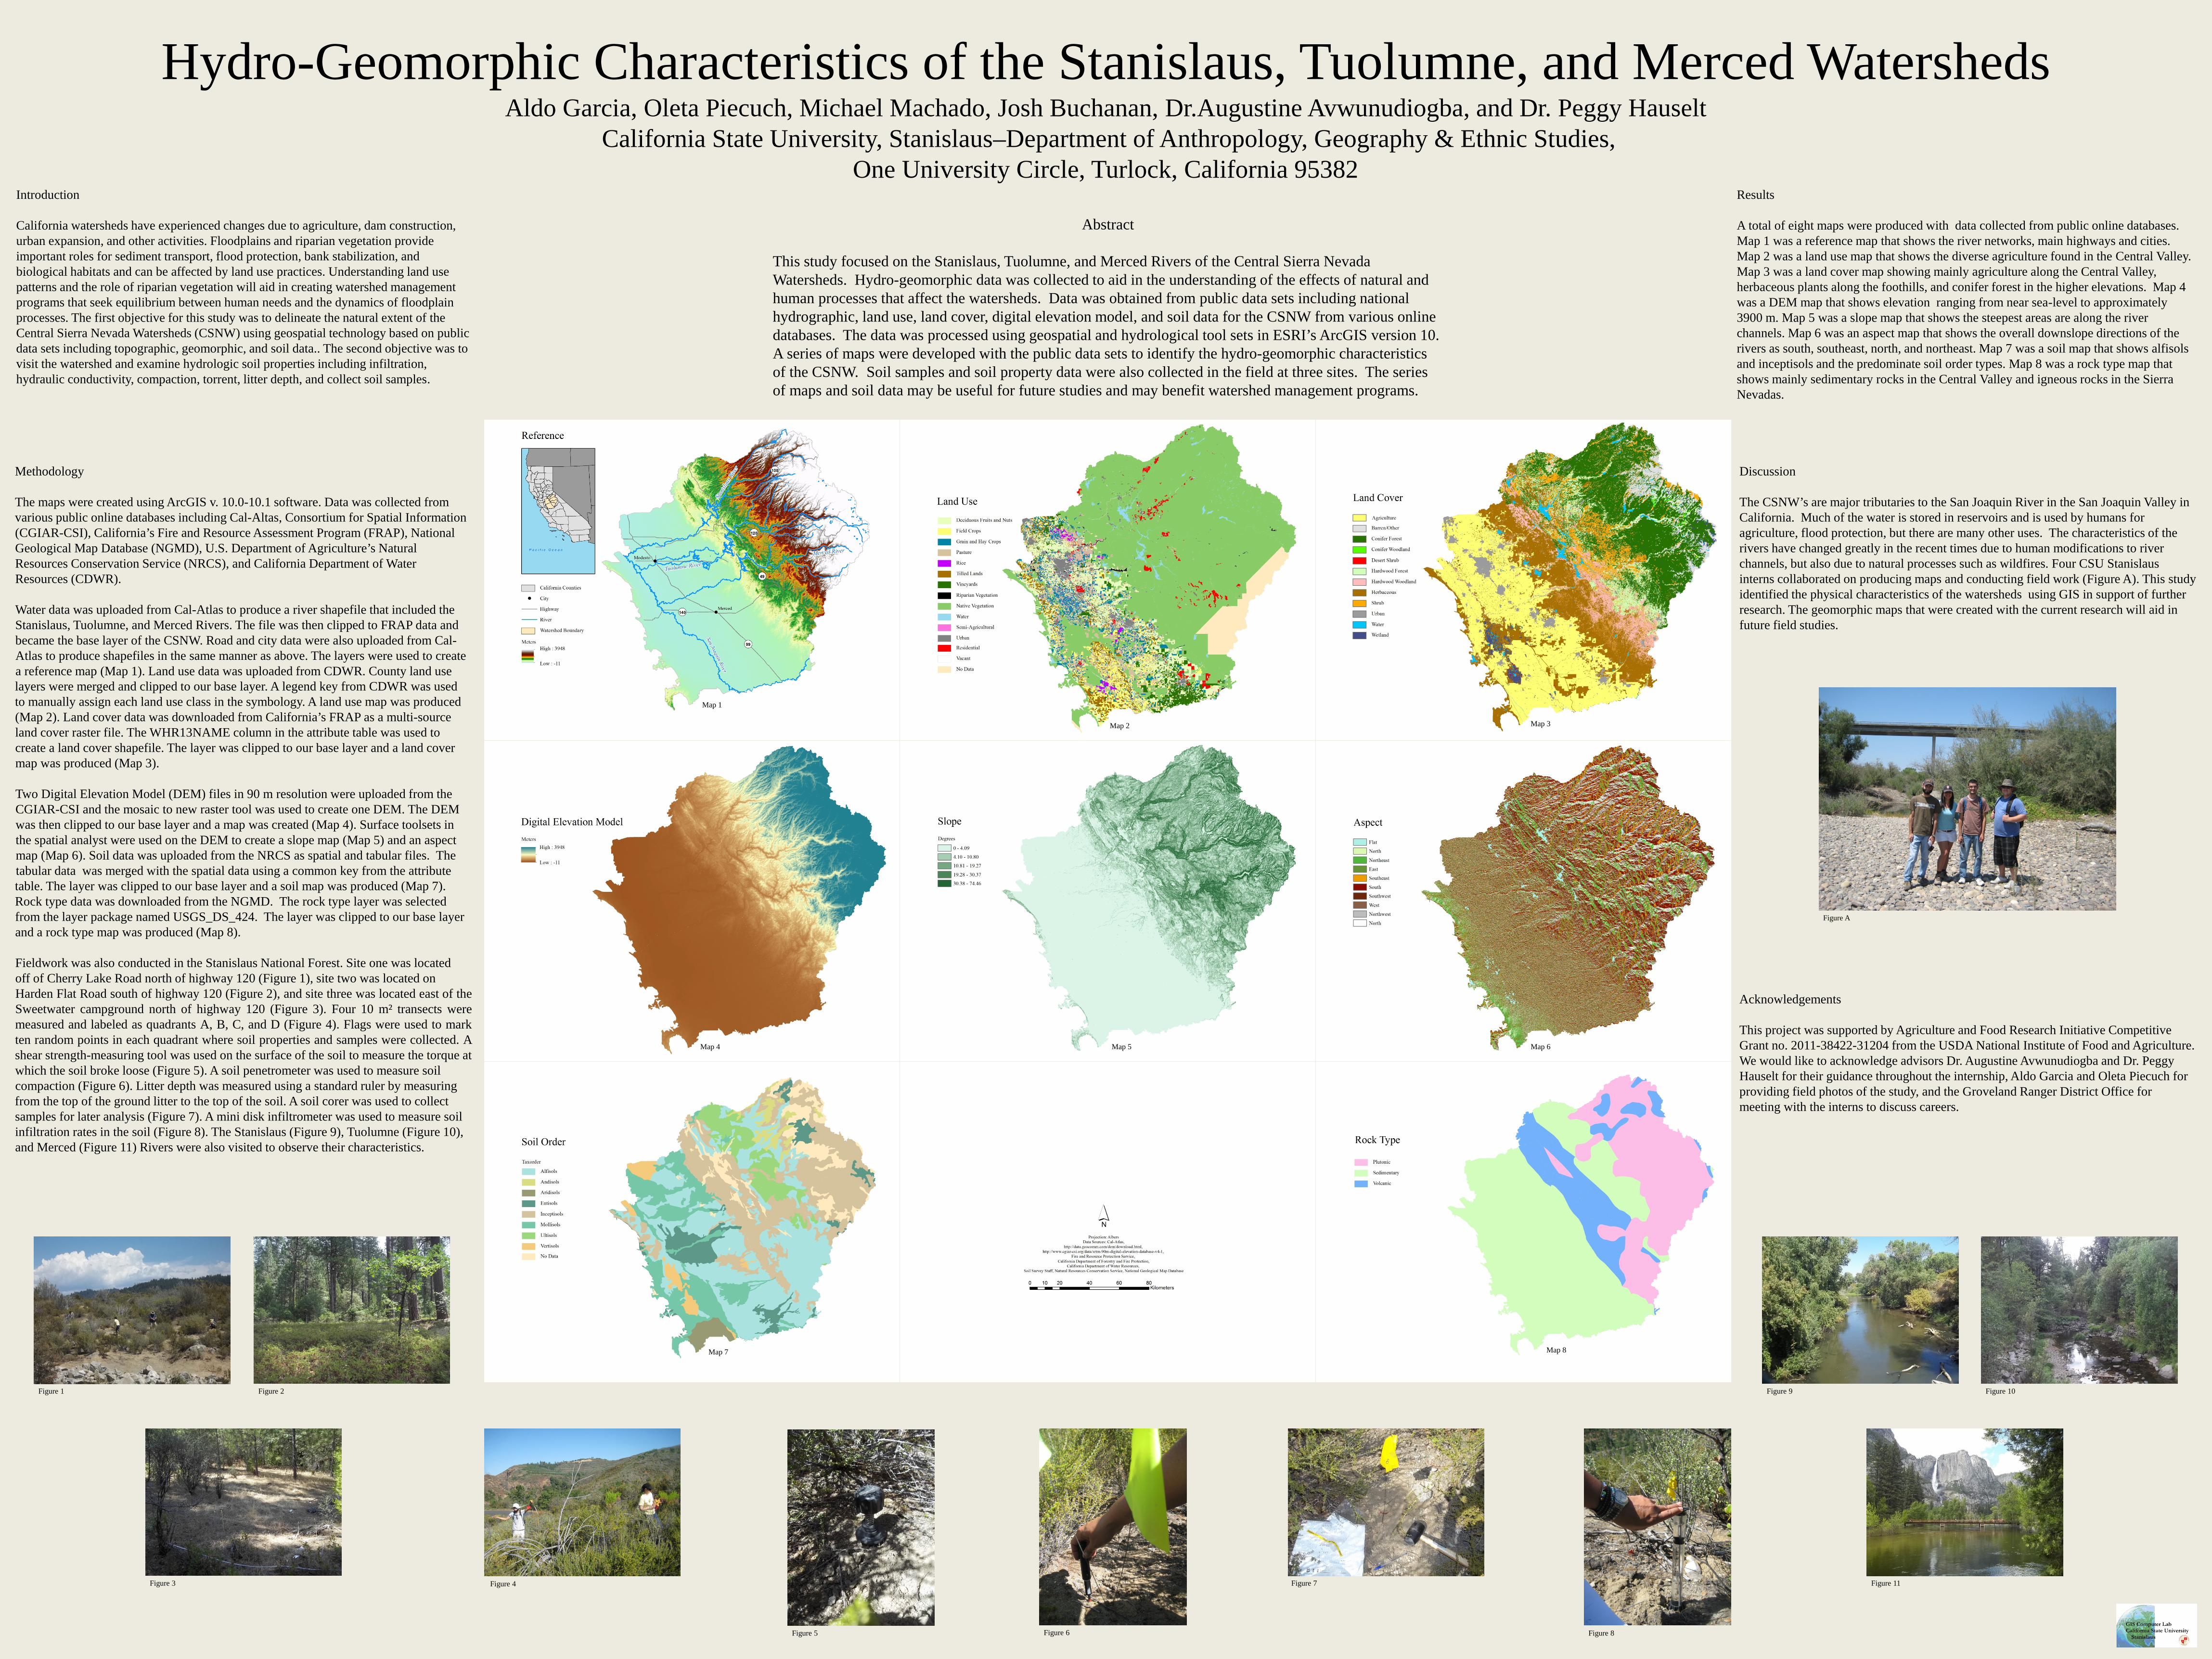
Hydro-Geomorphic Characteristics of the Stanislaus, Tuolumne, and Merced Watersheds Aldo Garcia, Oleta Piecuch, Michael Machado, Josh Buchanan, Dr.Augustine Avwunudiogba, and Dr. Peggy Hauselt California State University, Stanislaus–Department of Anthropology, Geography & Ethnic Studies, One University Circle, Turlock, California 95382 Abstract This study focused on the Stanislaus, Tuolumne, and Merced Rivers of the Central Sierra Nevada Watersheds. Hydro-geomorphic data was collected to aid in the understanding of the effects of natural and human processes that affect the watersheds. Data was obtained from public data sets including national hydrographic, land use, land cover, digital elevation model, and soil data for the CSNW from various online databases. The data was processed using geospatial and hydrological tool sets in ESRI’s ArcGIS version 10. A series of maps were developed with the public data sets to identify the hydro-geomorphic characteristics of the CSNW. Soil samples and soil property data were also collected in the field at three sites. The series of maps and soil data may be useful for future studies and may benefit watershed management programs. Introduction California watersheds have experienced changes due to agriculture, dam construction, urban expansion, and other activities. Floodplains and riparian vegetation provide important roles for sediment transport, flood protection, bank stabilization, and biological habitats and can be affected by land use practices. Understanding land use patterns and the role of riparian vegetation will aid in creating watershed management programs that seek equilibrium between human needs and the dynamics of floodplain processes. The first objective for this study was to delineate the natural extent of the Central Sierra Nevada Watersheds (CSNW) using geospatial technology based on public data sets including topographic, geomorphic, and soil data.. The second objective was to visit the watershed and examine hydrologic soil properties including infiltration, hydraulic conductivity, compaction, torrent, litter depth, and collect soil samples. Methodology The maps were created using ArcGIS v. 10.0-10.1 software. Data was collected from various public online databases including Cal-Altas, Consortium for Spatial Information (CGIAR-CSI), California’s Fire and Resource Assessment Program (FRAP), National Geological Map Database (NGMD), U.S. Department of Agriculture’s Natural Resources Conservation Service (NRCS), and California Department of Water Resources (CDWR). Water data was uploaded from Cal-Atlas to produce a river shapefile that included the Stanislaus, Tuolumne, and Merced Rivers. The file was then clipped to FRAP data and became the base layer of the CSNW. Road and city data were also uploaded from Cal- Atlas to produce shapefiles in the same manner as above. The layers were used to create a reference map (Map 1). Land use data was uploaded from CDWR. County land use layers were merged and clipped to our base layer. A legend key from CDWR was used to manually assign each land use class in the symbology. A land use map was produced (Map 2). Land cover data was downloaded from California’s FRAP as a multi-source land cover raster file. The WHR13NAME column in the attribute table was used to create a land cover shapefile. The layer was clipped to our base layer and a land cover map was produced (Map 3). Two Digital Elevation Model (DEM) files in 90 m resolution were uploaded from the CGIAR-CSI and the mosaic to new raster tool was used to create one DEM. The DEM was then clipped to our base layer and a map was created (Map 4). Surface toolsets in the spatial analyst were used on the DEM to create a slope map (Map 5) and an aspect map (Map 6). Soil data was uploaded from the NRCS as spatial and tabular files. The tabular data was merged with the spatial data using a common key from the attribute table. The layer was clipped to our base layer and a soil map was produced (Map 7). Rock type data was downloaded from the NGMD. The rock type layer was selected from the layer package named USGS_DS_424. The layer was clipped to our base layer and a rock type map was produced (Map 8). Fieldwork was also conducted in the Stanislaus National Forest. Site one was located off of Cherry Lake Road north of highway 120 (Figure 1), site two was located on Harden Flat Road south of highway 120 (Figure 2), and site three was located east of the Sweetwater campground north of highway 120 (Figure 3). Four 10 m² transects were measured and labeled as quadrants A, B, C, and D (Figure 4). Flags were used to mark ten random points in each quadrant where soil properties and samples were collected. A shear strength-measuring tool was used on the surface of the soil to measure the torque at which the soil broke loose (Figure 5). A soil penetrometer was used to measure soil compaction (Figure 6). Litter depth was measured using a standard ruler by measuring from the top of the ground litter to the top of the soil. A soil corer was used to collect samples for later analysis (Figure 7). A mini disk infiltrometer was used to measure soil infiltration rates in the soil (Figure 8). The Stanislaus (Figure 9), Tuolumne (Figure 10), and Merced (Figure 11) Rivers were also visited to observe their characteristics. Map 1 Map 2 Map 3 Map 4 Map 5 Map 6 Map 7 Map 8 Figure 1 Figure 2 Figure 3 Figure 4 Figure 5 Figure 6 Figure 7 Figure 8 Figure 10 Figure 9 Figure 11 Results A total of eight maps were produced with data collected from public online databases. Map 1 was a reference map that shows the river networks, main highways and cities. Map 2 was a land use map that shows the diverse agriculture found in the Central Valley. Map 3 was a land cover map showing mainly agriculture along the Central Valley, herbaceous plants along the foothills, and conifer forest in the higher elevations. Map 4 was a DEM map that shows elevation ranging from near sea-level to approximately 3900 m. Map 5 was a slope map that shows the steepest areas are along the river channels. Map 6 was an aspect map that shows the overall downslope directions of the rivers as south, southeast, north, and northeast. Map 7 was a soil map that shows alfisols and inceptisols and the predominate soil order types. Map 8 was a rock type map that shows mainly sedimentary rocks in the Central Valley and igneous rocks in the Sierra Nevadas. Discussion The CSNW’s are major tributaries to the San Joaquin River in the San Joaquin Valley in California. Much of the water is stored in reservoirs and is used by humans for agriculture, flood protection, but there are many other uses. The characteristics of the rivers have changed greatly in the recent times due to human modifications to river channels, but also due to natural processes such as wildfires. Four CSU Stanislaus interns collaborated on producing maps and conducting field work (Figure A). This study identified the physical characteristics of the watersheds using GIS in support of further research. The geomorphic maps that were created with the current research will aid in future field studies. Acknowledgements This project was supported by Agriculture and Food Research Initiative Competitive Grant no. 2011-38422-31204 from the USDA National Institute of Food and Agriculture. We would like to acknowledge advisors Dr. Augustine Avwunudiogba and Dr. Peggy Hauselt for their guidance throughout the internship, Aldo Garcia and Oleta Piecuch for providing field photos of the study, and the Groveland Ranger District Office for meeting with the interns to discuss careers. Figure A
-
Upload
nguyenthuan -
Category
Documents
-
view
230 -
download
0
Transcript of Hydro-Geomorphic Characteristics of the Stanislaus ... Characteristics of the Stanislaus, Tuolumne,...
Hydro-Geomorphic Characteristics of the Stanislaus, Tuolumne, and Merced Watersheds Aldo Garcia, Oleta Piecuch, Michael Machado, Josh Buchanan, Dr.Augustine Avwunudiogba, and Dr. Peggy Hauselt
California State University, Stanislaus–Department of Anthropology, Geography & Ethnic Studies, One University Circle, Turlock, California 95382
Abstract This study focused on the Stanislaus, Tuolumne, and Merced Rivers of the Central Sierra Nevada Watersheds. Hydro-geomorphic data was collected to aid in the understanding of the effects of natural and human processes that affect the watersheds. Data was obtained from public data sets including national hydrographic, land use, land cover, digital elevation model, and soil data for the CSNW from various online databases. The data was processed using geospatial and hydrological tool sets in ESRI’s ArcGIS version 10. A series of maps were developed with the public data sets to identify the hydro-geomorphic characteristics of the CSNW. Soil samples and soil property data were also collected in the field at three sites. The series of maps and soil data may be useful for future studies and may benefit watershed management programs.
Introduction California watersheds have experienced changes due to agriculture, dam construction, urban expansion, and other activities. Floodplains and riparian vegetation provide important roles for sediment transport, flood protection, bank stabilization, and biological habitats and can be affected by land use practices. Understanding land use patterns and the role of riparian vegetation will aid in creating watershed management programs that seek equilibrium between human needs and the dynamics of floodplain processes. The first objective for this study was to delineate the natural extent of the Central Sierra Nevada Watersheds (CSNW) using geospatial technology based on public data sets including topographic, geomorphic, and soil data.. The second objective was to visit the watershed and examine hydrologic soil properties including infiltration, hydraulic conductivity, compaction, torrent, litter depth, and collect soil samples.
Methodology The maps were created using ArcGIS v. 10.0-10.1 software. Data was collected from various public online databases including Cal-Altas, Consortium for Spatial Information (CGIAR-CSI), California’s Fire and Resource Assessment Program (FRAP), National Geological Map Database (NGMD), U.S. Department of Agriculture’s Natural Resources Conservation Service (NRCS), and California Department of Water Resources (CDWR). Water data was uploaded from Cal-Atlas to produce a river shapefile that included the Stanislaus, Tuolumne, and Merced Rivers. The file was then clipped to FRAP data and became the base layer of the CSNW. Road and city data were also uploaded from Cal- Atlas to produce shapefiles in the same manner as above. The layers were used to create a reference map (Map 1). Land use data was uploaded from CDWR. County land use layers were merged and clipped to our base layer. A legend key from CDWR was used to manually assign each land use class in the symbology. A land use map was produced (Map 2). Land cover data was downloaded from California’s FRAP as a multi-source land cover raster file. The WHR13NAME column in the attribute table was used to create a land cover shapefile. The layer was clipped to our base layer and a land cover map was produced (Map 3). Two Digital Elevation Model (DEM) files in 90 m resolution were uploaded from the CGIAR-CSI and the mosaic to new raster tool was used to create one DEM. The DEM was then clipped to our base layer and a map was created (Map 4). Surface toolsets in the spatial analyst were used on the DEM to create a slope map (Map 5) and an aspect map (Map 6). Soil data was uploaded from the NRCS as spatial and tabular files. The tabular data was merged with the spatial data using a common key from the attribute table. The layer was clipped to our base layer and a soil map was produced (Map 7). Rock type data was downloaded from the NGMD. The rock type layer was selected from the layer package named USGS_DS_424. The layer was clipped to our base layer and a rock type map was produced (Map 8). Fieldwork was also conducted in the Stanislaus National Forest. Site one was located off of Cherry Lake Road north of highway 120 (Figure 1), site two was located on Harden Flat Road south of highway 120 (Figure 2), and site three was located east of the Sweetwater campground north of highway 120 (Figure 3). Four 10 m² transects were measured and labeled as quadrants A, B, C, and D (Figure 4). Flags were used to mark ten random points in each quadrant where soil properties and samples were collected. A shear strength-measuring tool was used on the surface of the soil to measure the torque at which the soil broke loose (Figure 5). A soil penetrometer was used to measure soil compaction (Figure 6). Litter depth was measured using a standard ruler by measuring from the top of the ground litter to the top of the soil. A soil corer was used to collect samples for later analysis (Figure 7). A mini disk infiltrometer was used to measure soil infiltration rates in the soil (Figure 8). The Stanislaus (Figure 9), Tuolumne (Figure 10), and Merced (Figure 11) Rivers were also visited to observe their characteristics.
Map 1
Map 2 Map 3
Map 4 Map 5 Map 6
Map 7 Map 8
Figure 1 Figure 2
Figure 3 Figure 4
Figure 5 Figure 6
Figure 7
Figure 8
Figure 10 Figure 9
Figure 11
Results A total of eight maps were produced with data collected from public online databases. Map 1 was a reference map that shows the river networks, main highways and cities. Map 2 was a land use map that shows the diverse agriculture found in the Central Valley. Map 3 was a land cover map showing mainly agriculture along the Central Valley, herbaceous plants along the foothills, and conifer forest in the higher elevations. Map 4 was a DEM map that shows elevation ranging from near sea-level to approximately 3900 m. Map 5 was a slope map that shows the steepest areas are along the river channels. Map 6 was an aspect map that shows the overall downslope directions of the rivers as south, southeast, north, and northeast. Map 7 was a soil map that shows alfisols and inceptisols and the predominate soil order types. Map 8 was a rock type map that shows mainly sedimentary rocks in the Central Valley and igneous rocks in the Sierra Nevadas.
Discussion The CSNW’s are major tributaries to the San Joaquin River in the San Joaquin Valley in California. Much of the water is stored in reservoirs and is used by humans for agriculture, flood protection, but there are many other uses. The characteristics of the rivers have changed greatly in the recent times due to human modifications to river channels, but also due to natural processes such as wildfires. Four CSU Stanislaus interns collaborated on producing maps and conducting field work (Figure A). This study identified the physical characteristics of the watersheds using GIS in support of further research. The geomorphic maps that were created with the current research will aid in future field studies.
Acknowledgements This project was supported by Agriculture and Food Research Initiative Competitive Grant no. 2011-38422-31204 from the USDA National Institute of Food and Agriculture. We would like to acknowledge advisors Dr. Augustine Avwunudiogba and Dr. Peggy Hauselt for their guidance throughout the internship, Aldo Garcia and Oleta Piecuch for providing field photos of the study, and the Groveland Ranger District Office for meeting with the interns to discuss careers.
Figure A


![St. STANISLAUS MAGAZINEst-stanislaus-gy.com/Magazines/1971/1971-AssociationSection.pdf · A.M.D.G. St. STANISLAUS MAGAZINE VOL. [29] NOVEMBER 1971 Editor: Fr. C. Meerabux, S.J. Business](https://static.fdocuments.us/doc/165x107/5fd39a2748c2ef67f74b070b/st-stanislaus-magazinest-stanislaus-gycommagazines19711971-amdg-st.jpg)