What are you testing? Minimum Viable People, Minimum Viable Product or Minimum Viable Platform
50136_1 • Hydro Media • 06.2004 • 1
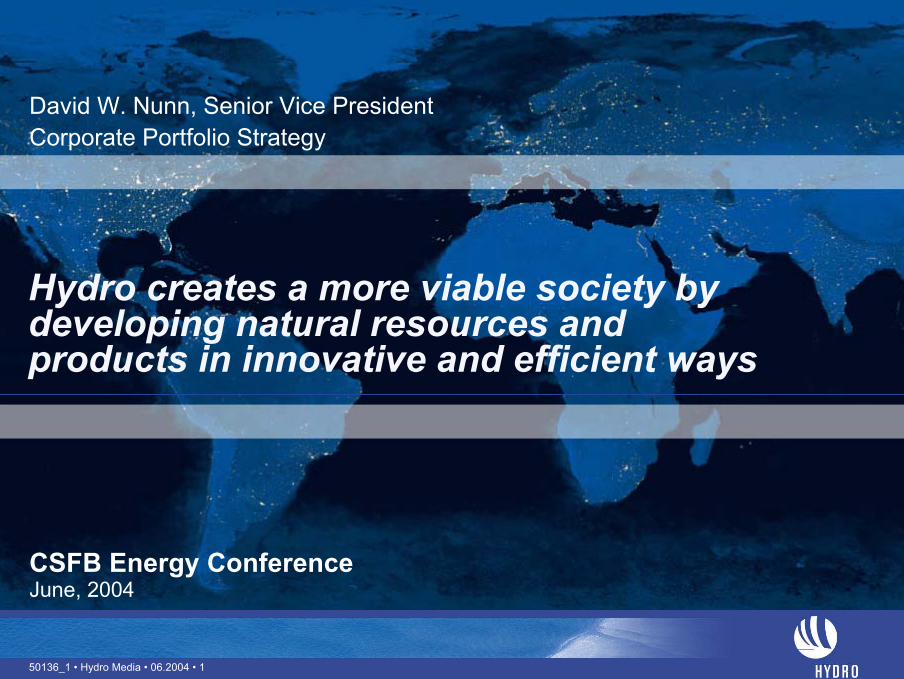
Hydro creates a more viable society by developing natural resources and products in innovative and efficient ways
50136_1 • Hydro Media • 06.2004 • 1
David W. Nunn, Senior Vice President Corporate Portfolio Strategy
June, 2004CSFB Energy Conference

50136_1 • Hydro Media • 06.2004 • 2
Hydro – A dynamic 99 year old!
Demerger and separate listingMarch 25th 2004
World’s leading producerof plant nutrients
Europe’s leading integratedaluminium company
Second largest oil and gasproducer in NorwayTechnologically advanced

50136_1 • Hydro Media • 06.2004 • 3
The energy portfolio
* 2003 (incl. Yara)** incl. NGL*** Normal range of annual production
Oil** production 394 000 boe/d
Oil
Power consumption*
22 TWh
Power sales*18 TWh
Power generation***
7-11 TWh
Power
Gas consumption*3.0 bcm
Gas production *7.8 bcm
(136 000 boe/d)
Gas
Gas sales*12 bcm
Production - Consumption - Trading
50136_1 • Hydro Media • 06.2004 • 4
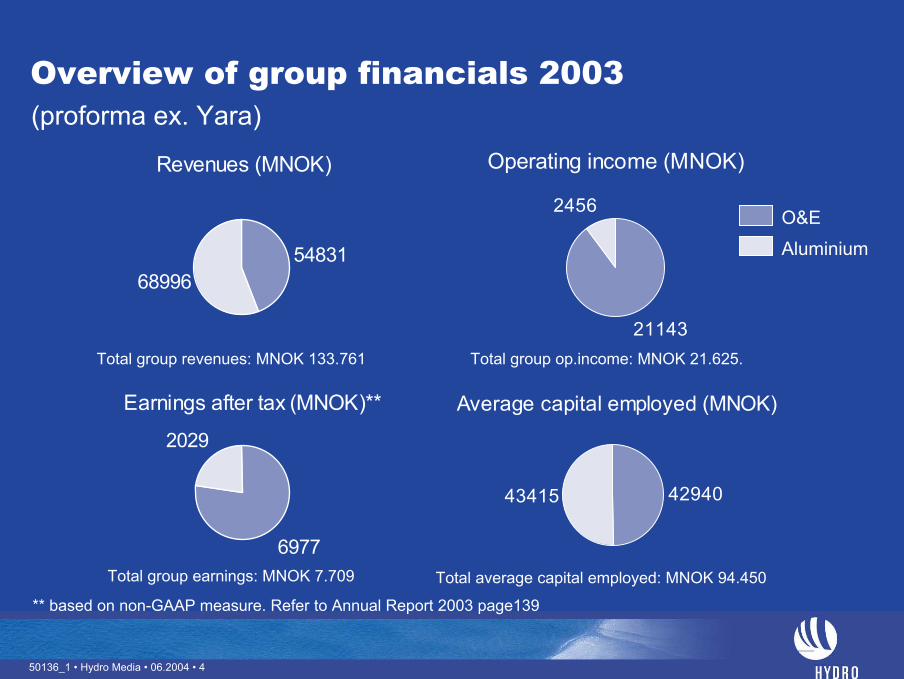
Overview of group financials 2003
Revenues (MNOK)
5483168996
Operating income (MNOK)
21143
2456
Earnings after tax (MNOK)**
6977
2029
Average capital employed (MNOK)
4294043415
Total group revenues: MNOK 133.761 Total group op.income: MNOK 21.625.
Total group earnings: MNOK 7.709 Total average capital employed: MNOK 94.450
O&E
(proforma ex. Yara)
** based on non-GAAP measure. Refer to Annual Report 2003 page139
Aluminium
50136_1 • Hydro Media • 06.2004 • 5
0
500
1 000
1 500
2 000
2 500
3 000
3 500
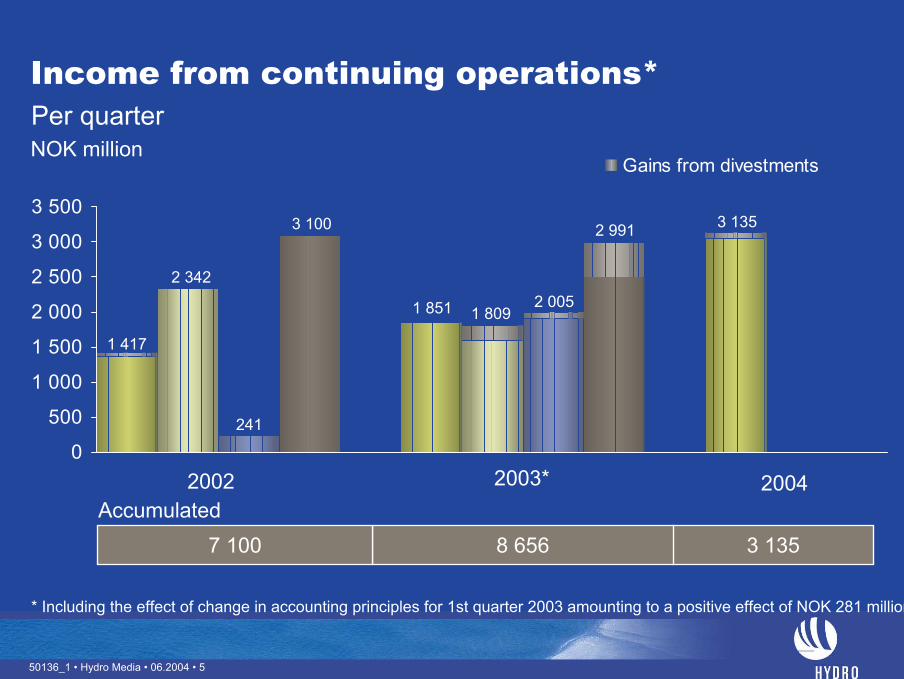
Gains from divestments
5
NOK million
* Including the effect of change in accounting principles for 1st quarter 2003 amounting to a positive effect of NOK 281 million
Accumulated3 1358 6567 100
2002 20042003*
1 417
2 342
241
3 100
1 851 1 8092 005
2 991 3 135
Income from continuing operations*Per quarter
50136_1 • Hydro Media • 06.2004 • 6
6
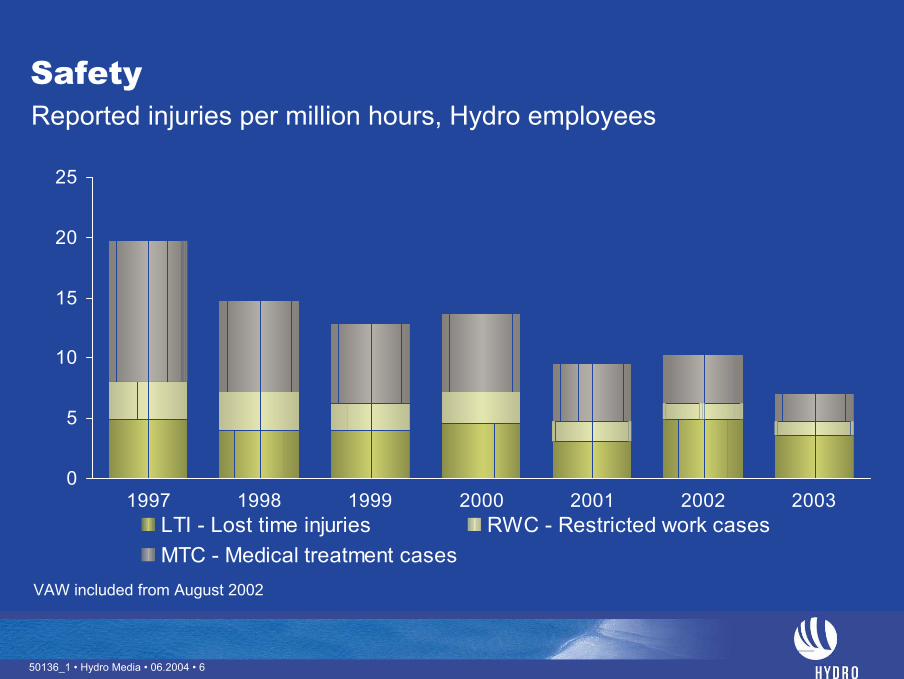
Safety
0
5
10
15
20
25
1997 1998 1999 2000 2001 2002 2003LTI - Lost time injuries RWC - Restricted work casesMTC - Medical treatment cases
VAW included from August 2002
Reported injuries per million hours, Hydro employees
50136_1 • Hydro Media • 06.2004 • 7
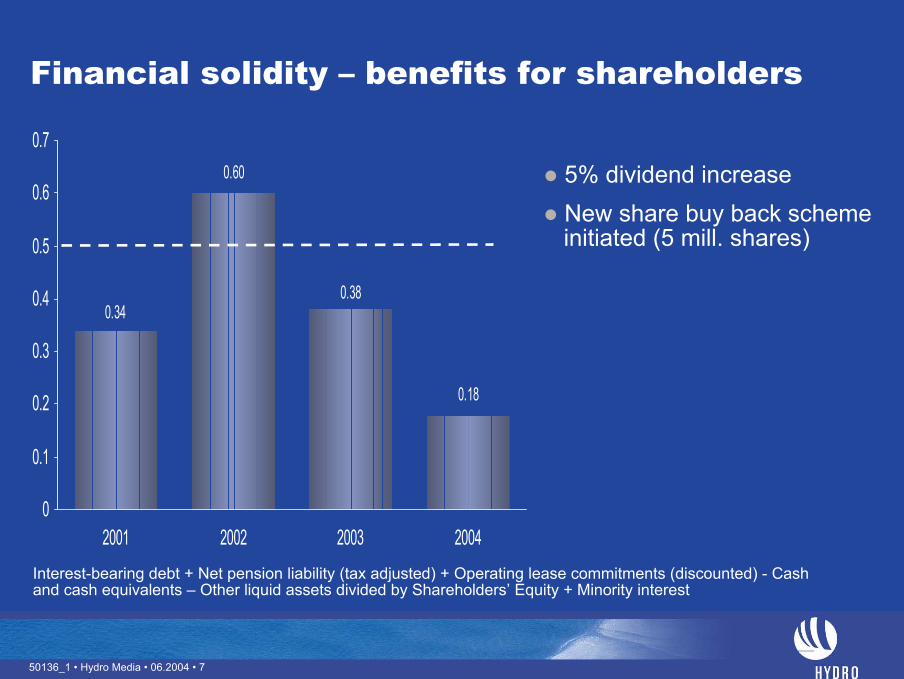
Financial solidity – benefits for shareholders
7
0.60
0.340.38
0.18
0
0.1
0.2
0.3
0.4
0.5
0.6
0.7
2001 2002 2003 2004Interest-bearing debt + Net pension liability (tax adjusted) + Operating lease commitments (discounted) - Cash and cash equivalents – Other liquid assets divided by Shareholders’ Equity + Minority interest
5% dividend increaseNew share buy back schemeinitiated (5 mill. shares)

50136_1 • Hydro Media • 06.2004 • 8
ROACE development
4.0
5.45.8
8.2
7.3 7.0
2001 2002 2003
Normalized Actual
Percent
8
Normalization assumptions:
Oil price: $18/bblAluminium LME: $1500/t
NOK/$: 8NOK/ €: 7,60 (8 from 2004)
(proforma continuing operations)

50136_1 • Hydro Media • 06.2004 • 9
Significant profitability improvements targeted
4.0
5.85.4
7.5
8.5
2001 2002 2003 2006
Higher volumesCost improvementsCapital discipline
Normalized ROACE, percent
9
50136_1 • Hydro Media • 06.2004 • 10
Aluminium

50136_1 • Hydro Media • 06.2004 • 11
Global Integrated Players 2003
6,9
3,1
0,7
3,5 3,3
1,51,80,9 0,90,8
0,2 0,6
0,1
0,1
2,3
0
1
2
3
4
5
6
7
8
Mill
. ton
ne a
lum
iniu
m e
quiv
.Alumina Primary Metal Rolled Products Extruded Products
Alcoa; Alumina figures include the 40% part owned by Alumina Limited, Australia.
Alcoa Alcan Hydro
Spin-offCore Alcan

50136_1 • Hydro Media • 06.2004 • 12
A unique portfolio composition
780
1470
1470
890
260
570
1600
60
690Alumina *)
Electrolysis metal
Metal products
Downstream
Equity 3rd partyprimary
alliances
Rolled **) Extrusion & Automotive
Castings
* Aluminium equivalents (2 tonnes alumina per tonne aluminium) ** Flat rolled products only
Remelt
Long term contractsEquity
1 000 tonnes
Equity

50136_1 • Hydro Media • 06.2004 • 13
0%
2%
4%
6%
8%
10%
12%
14%
1998 1999 2000 2001 2002 2003 2004 1 Q
AlcoaAlcanHydro Al.
CROGI proxy*
*EBITDA less reported tax/Gross investment, Hydro Aluminium are reported figuresSource: Annual and quarterly reports, Hydro-estimates
Profit level for the industry
13

50136_1 • Hydro Media • 06.2004 • 14
ExtrusionExtrusion
Revenue: NOK 12.4 bn
Above profit target
Selective growth
AutomotiveAutomotive
Revenue: NOK 7.6 bn
Below profit target
Gap to be closed through cost improvements, focused portfolio and selective growth
Downstream segmentsRollingRolling
Revenue: NOK 17.8 bn
Below profit target
Improve costposition and grow high margin segments
14
North AmericaNorth America
Revenue: NOK 4.5 bn
Below profit target
Gap to be closed through operational improvement, volume growth and improved product mix
Revenues are 2003 figures
50136_1 • Hydro Media • 06.2004 • 15
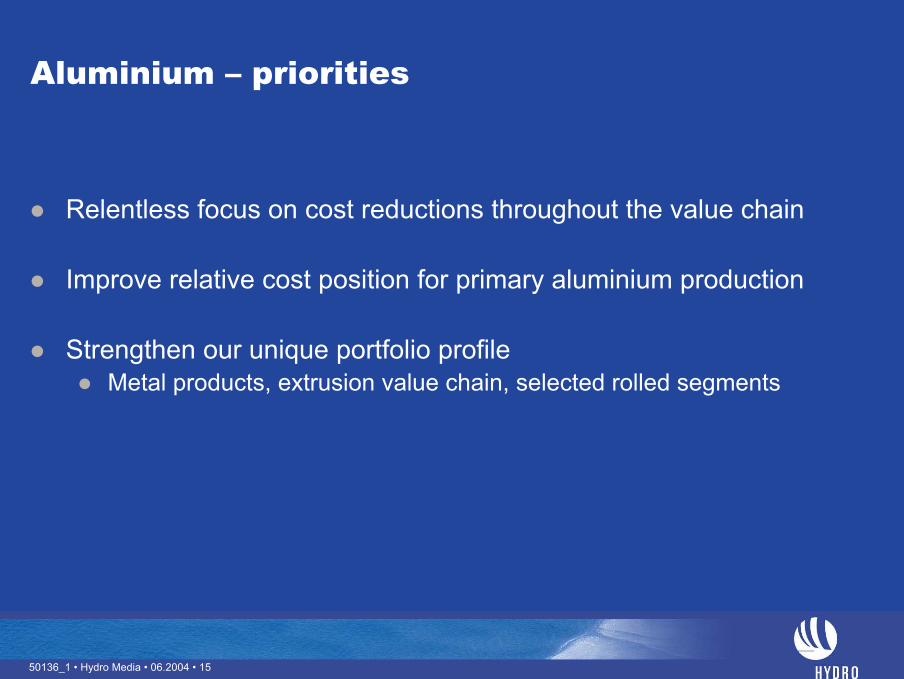
Aluminium – priorities
Relentless focus on cost reductions throughout the value chain
Improve relative cost position for primary aluminium production
Strengthen our unique portfolio profile Metal products, extrusion value chain, selected rolled segments
15

50136_1 • Hydro Media • 06.2004 • 16
Oil & Energy

50136_1 • Hydro Media • 06.2004 • 17
0
100
200
300
400
500
600
700
1998 1999 2000 2001 2002 2003 2004E 2005E 2006E 2007E
Norwegian fields Oil, international Gas 8% CAGR*
1 000 boe/day
Strong production growth
* Compound Annual Growth Rate, 2001 baseline
8% average annual growth
17

50136_1 • Hydro Media • 06.2004 • 18
New fields on stream 2004 – 2007
22 000Dalia
Kristin
Kvitebjørn
Visund gas phase
Oseberg Sør J
OsebergVestflanken
Ormen Lange
Rosa
Murzuq
Kharyaga 2+3
28 000
25 000
18 000
7 000
14 000
70 000
13 000
6 000 (A + D
field)
15 000 (phase 1-3)
200
1
NC
S no
n-op
erat
orN
CS
oper
ator
Inte
rnat
iona
l
200
2
200
3
200
4
200
5
200
6
200
7
Hydro share boe/day
Development PDO submittal Start production
18

50136_1 • Hydro Media • 06.2004 • 19
2524
2324 23 23
24
20 20
26
21
17 17
Improved efficiency in operations
NOK/boe
2002
22.6
2003
20.7
20042001
24.1Annual average:
Production costs per barrel
19
50136_1 • Hydro Media • 06.2004 • 20
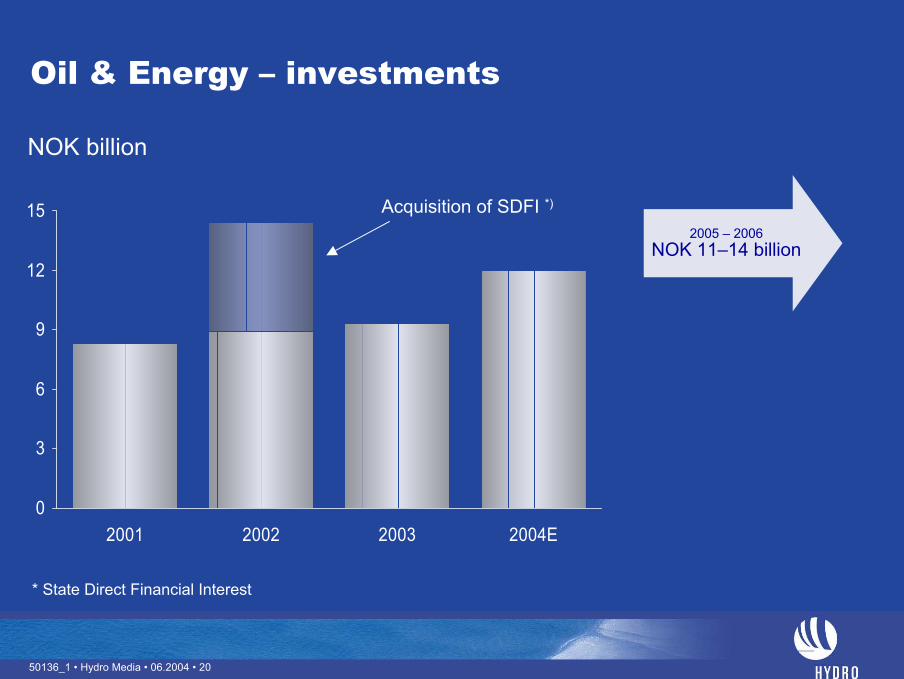
Oil & Energy – investments
NOK billion
0
3
6
9
12
15
2001 2002 2003 2004E
Acquisition of SDFI *)2005 – 2006
NOK 11–14 billion
* State Direct Financial Interest
50136_1 • Hydro Media • 06.2004 • 21
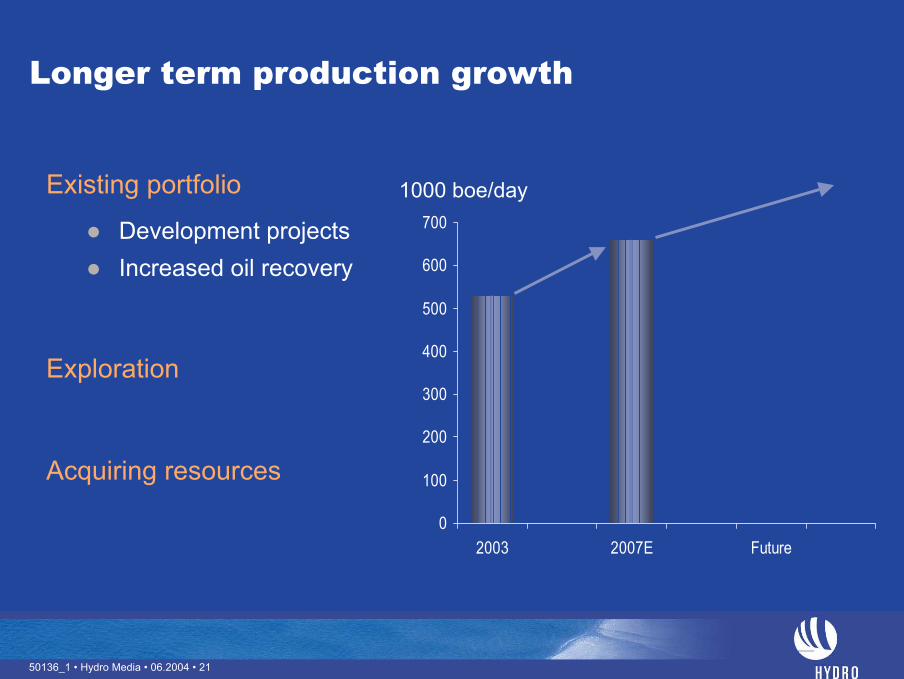
Longer term production growth
Existing portfolio
Development projectsIncreased oil recovery
Exploration
Acquiring resources
0
100
200
300
400
500
600
700
2003 2007E Future
1000 boe/day
21
50136_1 • Hydro Media • 06.2004 • 22
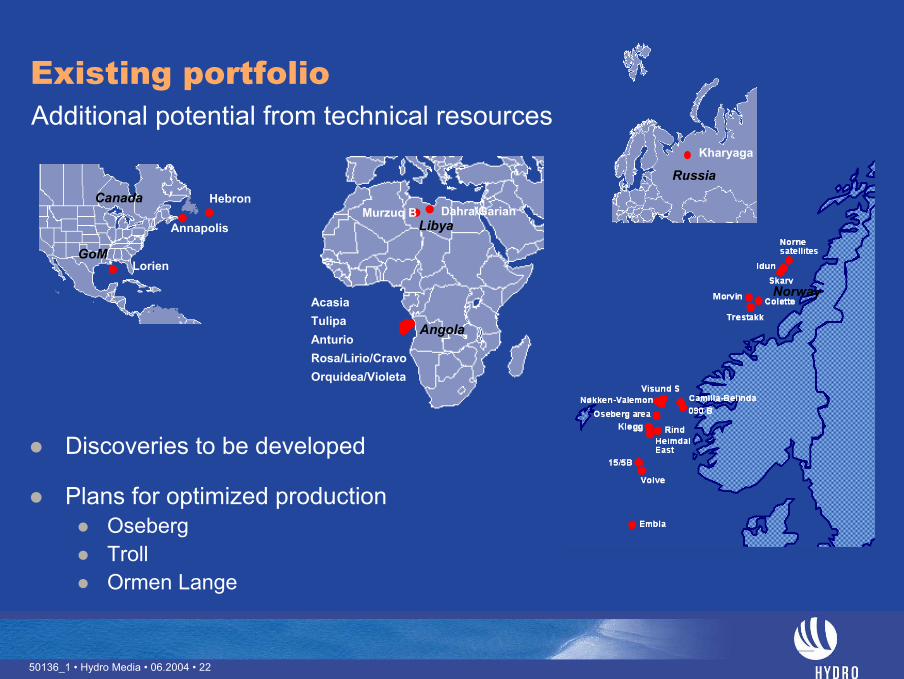
Existing portfolio
Dahra/GarianMurzuq BLibya
Angola
AcasiaTulipaAnturioRosa/Lirio/CravoOrquidea/Violeta
Norway
Discoveries to be developed
Plans for optimized productionOsebergTroll Ormen Lange
Additional potential from technical resources
22
Annapolis
LorienGoM
Canada Hebron
Russia
Kharyaga
50136_1 • Hydro Media • 06.2004 • 23
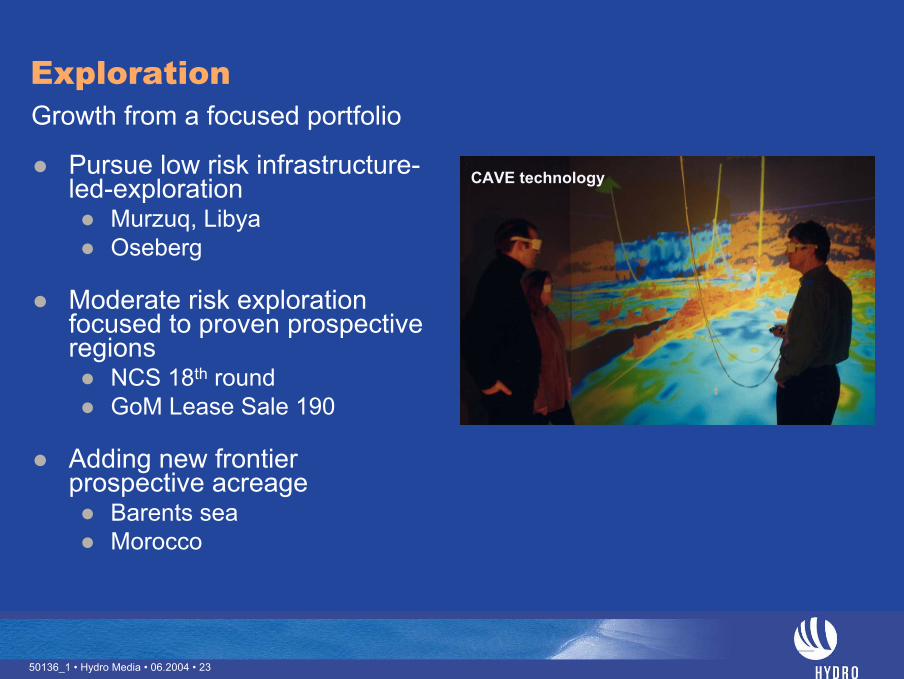
Exploration
Pursue low risk infrastructure-led-exploration
Murzuq, LibyaOseberg
Moderate risk exploration focused to proven prospective regions
NCS 18th roundGoM Lease Sale 190
Adding new frontier prospective acreage
Barents seaMorocco
CAVE technology
Growth from a focused portfolio
23
50136_1 • Hydro Media • 06.2004 • 24
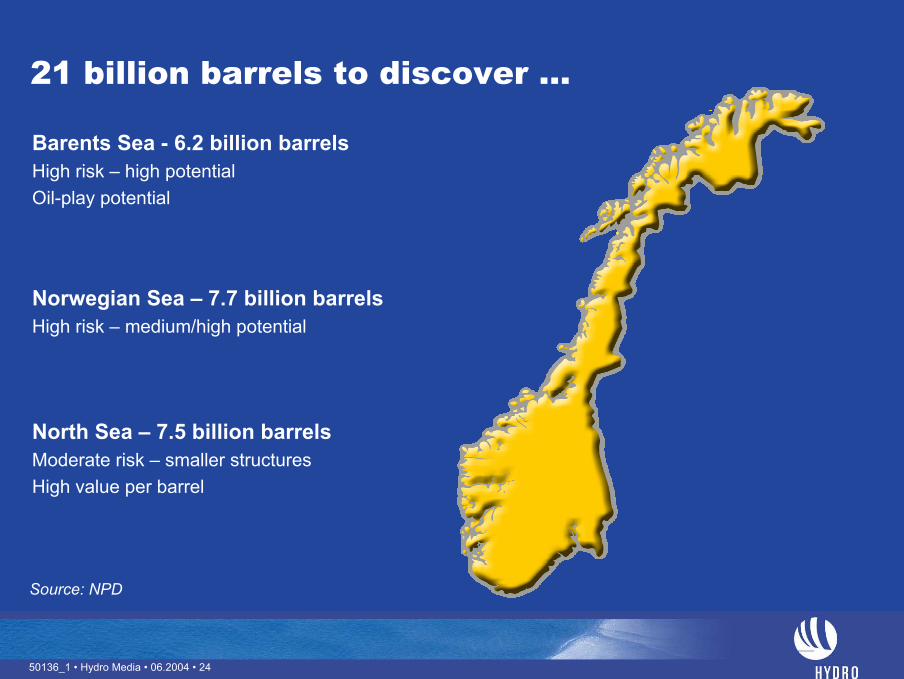
21 billion barrels to discover ...
Barents Sea - 6.2 billion barrelsHigh risk – high potentialOil-play potential
Norwegian Sea – 7.7 billion barrelsHigh risk – medium/high potential
North Sea – 7.5 billion barrelsModerate risk – smaller structuresHigh value per barrel
Source: NPD
50136_1 • Hydro Media • 06.2004 • 25
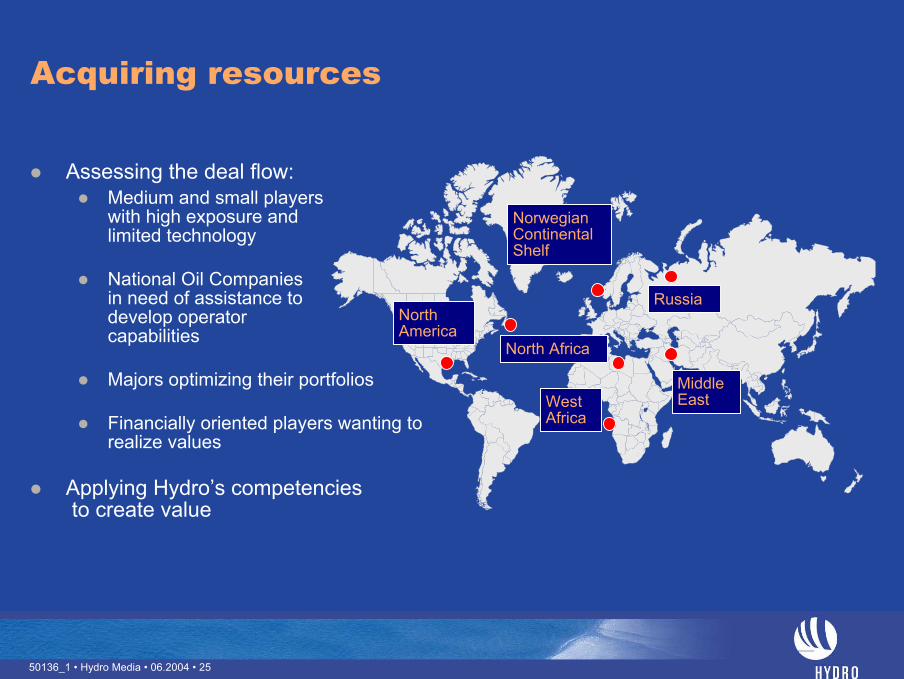
Acquiring resources
Assessing the deal flow:Medium and small players with high exposure and limited technology
National Oil Companies in need of assistance to develop operator capabilities
Majors optimizing their portfolios
Financially oriented players wanting to realize values
Applying Hydro’s competenciesto create value
NorthAmerica
WestAfrica
North Africa
MiddleEast
NorwegianContinentalShelf
Russia
25

50136_1 • Hydro Media • 06.2004 • 26
An experienced world-scale offshore producer
On & offshore: World-ranking (excl. national oil companies) Source: Infield; McKinsey
Offshore operator production oil and gas, boe/day *500 000 1 000 000 1 500 000 2 000 0000
BP
Statoil Shell
Petrobras
ExxonMobil Woodside
Chevron Texaco TotalFinaElf
Agip-Eni
Hydro
*Deeper than 100m0
100
200
300
400
500
600
700
800
900
1000Production 2003
Equi
ty
Ope
rato
r
22 14
1000 boe/day
ExploreExplore DesignDesign ExecuteExecute OperateOperate

50136_1 • Hydro Media • 06.2004 • 27
Core competencies
• Advanced wells
• Reservoir management
• Sub-sea development
• Flow assurance
• Floating production
• Large and complex projects
• Modifications
• Satellite tie-ins
• Commissioning and start-up
• Offshore operations
• Optimised production
• HES
E&P value chain
Explore Design Execute Operate
Cave 5 branch production well Ormen Lange Oseberg Field Centre
• Advanced seismic acquisition, processing and interpretation
27

50136_1 • Hydro Media • 06.2004 • 28
Mærsk supply agreement
Duke’s European portfolio
HydroWingas
Note: HUB, TTF and NBP are the marketplaces at Zeebrügge, in the Netherlands and in the UK, respectively
UK Supply Dutch Supply
TTF
HUB
Zeebrugge
BactonEmden
NBP
Danish Supply
Expanding gas activities in NW EuropeActions taken

50136_1 • Hydro Media • 06.2004 • 29
Growing equity gas production
Uncommitted volumesMainly directed to the UK
Continue to develop a strong and balanced customer portfolio
Illustrative production buildup
0
2
4
6
8
10
12
2003 2004 2005 2006 2007
bcm
Existing long term commitments(expected off-take)
Uncommitted volumes
29

50136_1 • Hydro Media • 06.2004 • 30
Oil & Energy – priorities
30
Continue to meet ambitious cost and production targets
Continue first-class project executionOrmen Lange
Pursue longer term growth opportunities where we can add valueCapital discipline
Enhance value of our gas in the European market

50136_1 • Hydro Media • 06.2004 • 31
Summary
Strong value creation for shareholdersNew share buy back scheme implemented
Strong balance sheet
Will continue to pursue value creatingopportunities in both our business areas
31

50136_1 • Hydro Media • 06.2004 • 32
Forward-Looking Statements/Use of Non-GAAP Financial Measures
In order to utilize the “safe harbour" provisions of the United States Private Securities Litigation Reform Act of 1995, Hydro is providing the following cautionary statement: This presentation contains certain forward-looking statements with respect to the financial condition, results of operations and business of the Company and certain of the plans and objectives of the Company with respect to these items. By their nature, forward-looking statements involve risk and uncertainty because they relate to events and depend on circumstances that will occur in the future. The actual results and developments may differ materially from those expressed or implied in the forward-looking statements due to any number of different factors. These factors include, but are not limited to, changes in costs and prices, changes in economic conditions, and changes in demand for the Company's products. Additional information, including information on factors which may affect Hydro's business, is contained in the Company's 2002 Annual Report on Form 20-F filed with the U.S. Securities and Exchange Commission.
With respect to each non-GAAP financial measure Hydro uses in connection with its financial reporting and other public communications, Hydro provides a presentation of what Hydro believes to be the most directly comparable GAAP financial measure and a reconciliation between the non-GAAP and GAAP measures. This information can be found in Hydro’s earnings press releases, quarterly reports and other written communications, all of which have been posted to Hydro’s website (www.hydro.com).
32