Hydraulic traits and their relevance for water use ...
129
Hydraulic traits and their relevance for water use strategies in five broad-leaved tree species of a temperate mixed forest Dissertation zur Erlangung des mathematisch-naturwissenschaftlichen Doktorgrades "Doctor rerum naturalium" der Georg-August-Universität Göttingen im Promotionsprogramm Biologie der Georg-August University School of Science (GAUSS) vorgelegt von Paul Köcher aus Braunschweig Göttingen, 2012
Transcript of Hydraulic traits and their relevance for water use ...

Hydraulic traits and their relevance for water use
strategies in five broad-leaved tree species of a
temperate mixed forest
Dissertation
zur Erlangung des mathematisch-naturwissenschaftlichen Doktorgrades
"Doctor rerum naturalium"
der Georg-August-Universität Göttingen
im Promotionsprogramm Biologie
der Georg-August University School of Science (GAUSS)
vorgelegt von
Paul Köcher
aus Braunschweig
Göttingen, 2012


Betreuungsausschuss
Prof. Dr. Christoph Leuschner, Abteilung Pflanzenökologie und Ökosystemforschung, Universität Göttingen
Dr. Viviana Horna, Abteilung Pflanzenökologie und Ökosystemforschung, Universität Göttingen
Mitglieder der Prüfungskommission
Referent: Prof. Dr. Christoph Leuschner, Abteilung Pflanzenökologie und Ökosystemforschung, Universität Göttingen
Korreferent: Prof. Dr. Markus Hauck, Abteilung Pflanzenökologie und Ökosystemforschung, Universität Göttingen
Weitere Mitglieder der Prüfungskommission
Prof. Dr. Dirk Hölscher, Tropical Silviculture and Forest Ecology, Universität Göttingen
Prof. Dr. Hermann Behling, Abteilung Palynologie und Klimadynamik, Universität Göttingen
Prof. Dr. Erwin Bergmeier, Abteilung Vegetationsanalyse und Phytodiversität, Universität Göttingen
Prof. Dr. Gerhard Gerold, Abteilung Landschaftsökologie, Universität Göttingen
Tag der mündlichen Prüfung: 21.11.12


Table of contents
Chapter 1 13
General Introduction
Effects of biodiversity and climate change on forest ecosystem functioning 14
Study objectives and chapter outline 16
Study area – The Hainich National Park 17
References 20
Chapter 2 25
Hydraulic properties and embolism in small-diameter roots of five temperate broad-leaved tree species with contrasting drought tolerance
Abstract 26
Introduction 27
Materials and methods 29
Study site and tree selection 29
Leaf water potential 30
Native root hydraulic conductivity and embolism 30
Root vascular anatomy 32
Soil water content and soil matrix potential 33
Statistical analyses 33
Results 34
Precipitation and soil water content 34
Leaf water potential 34
Root vascular anatomy 35
Hydraulic conductivity and embolism 37
Discussion 41
Relationship between root anatomy and hydraulic conductivity 41
Species differences in apparent root embolism 42
Evidence for the existence of high-conductivity roots 44
Conclusions 45
References 46

Chapter 3 51
Stem water storage in five coexisting temperate broad-leaved tree species: significance, temporal dynamics and dependence on tree functional traits
Summary 52
Introduction 53
Materials and methods 56
Study site and tree species 56
Hydrological and microclimatological measurements 57
Sap flux measurements 58
Recording of stem radius variation and calculation of tree water deficit 59
Calculation of stem water storage 60
Data analysis 61
Results 62
Microclimatic conditions and soil moisture status in the measuring period 62
Variation of sap flux density with species and along the root-to-branch flow
path 63
Daily water use and the contribution of stored stem water 67
Stem radius fluctuation, apparent SWDs and seasonal change in stem water
storage 70
Discussion 73
Water storage in temperate broad-leaved trees 73
Species differences in the use of stored water 74
The temporal coordination of branch, stem and root sap flux 75
Relationships between daily SRS and stem water storage 78
Conclusions 79
Appendix 81
References 82
Chapter 4 89
Environmental control of daily stem growth patterns in five temperate broad-leaved tree species
Summary 90
Introduction 91

Materials and methods 93
Study site and tree species 93
Microclimatological and hydrological measurements 93
Measurement of stem radial growth 94
Data analysis 95
Results 96
Microclimatic conditions and soil moisture status 96
Stem radius change in relation to environmental factors 98
Radial stem increment: temporal fluctuation and seasonal dynamics 102
Discussion 104
Extracting growth rate from daily stem radius variation 104
Seasonality of growth rate and growth control in the five species 105
Weather dependence of growth 106
Conclusion 108
References 110
Chapter 5 117
Synthesis
Chapter 6 125
Summary
Acknowledgments 129

Index of Figures
Figure 1.1 Map of the research area in the north-eastern part of the Hainich forest. Letters and numbers (e.g. DL 1a) indicate the locations of the 50 x 50 m study plots of the first phase of the RTG. The site of the present study is encircled with the gray ellipse. 19
Figure 2.1 Daily means of midday leaf water potential ΨL in relation to the soil matrix potential ΨS at 10 cm depth in the five examined tree species in summer 2008. Number of replicates: four to six trees per species with four samples per tree. For significant relationships, the coefficient of determination (r²) and the P value is given. 34
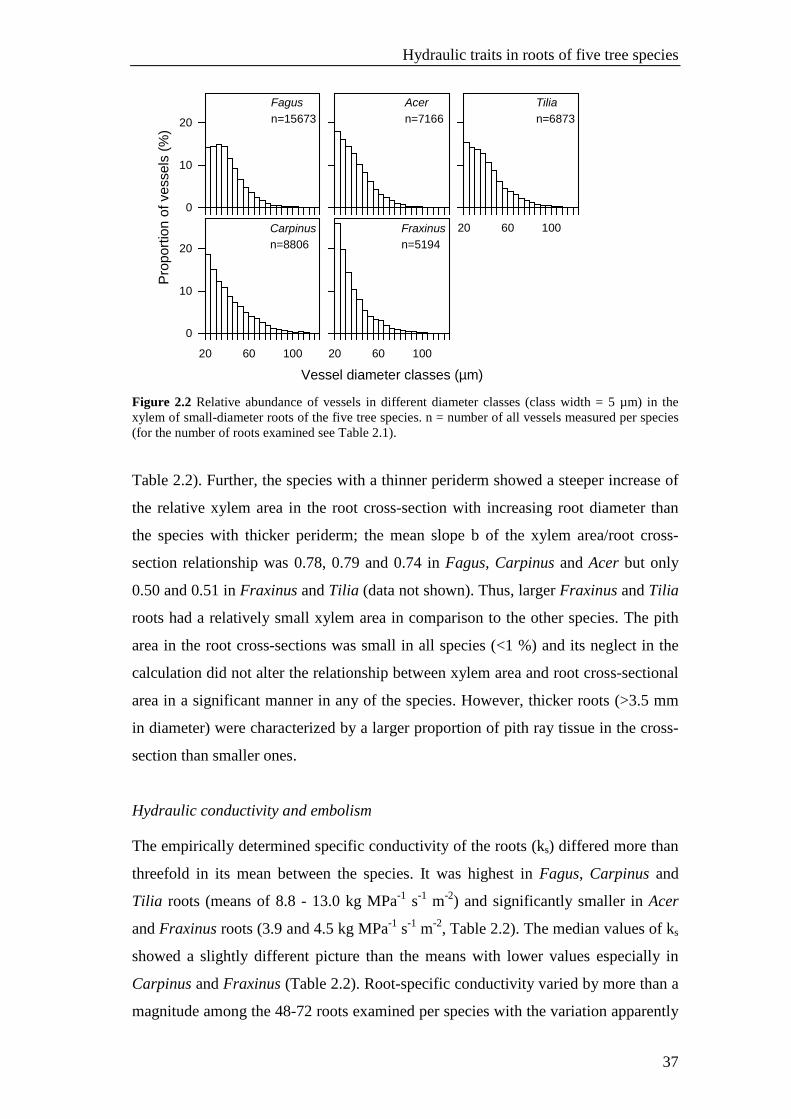
Figure 2.2 Relative abundance of vessels in different diameter classes (class width = 5 µm) in the xylem of small-diameter roots of the five tree species. n = number of all vessels measured per species (for the number of roots examined see Table 2.1). 37
Figure 2.3 Number of roots in classes of root-specific conductivity ks (class width = 5 kg MPa-1 s-1 m-1) in the five tree species. Gray bars indicate roots which were considered to be “high-conductivity roots”. n = number of roots examined per species. 38
Figure 2.4 Percental loss of conductivity (PLC) in the xylem of small-diameter roots in relation to the soil matrix potential ΨS at 10 cm depth in the five examined tree species in summer 2008. Number of replicates: four to six trees per species with six samples per tree. For significant relationships, the coefficient of determination (r²) and the P value are given. 38
Figure 2.5 Dependence of root-specific conductivity ks (left) and the percental loss of conductivity (PLC) (right) on mean vessel diameter in small-diameter roots of the five species. Number of replicates: four to six trees per species with each four samples per tree. For significant relationships, the coefficient of determination (r²) and the P value are given. 39
Figure 2.6 Empirically determined specific conductivity ks of the xylem of small-diameter roots in relation to the root area index RAI (a) and the fine root biomass FRB in 0-20 cm (b) of the species in monospecific patches. Data of root area index and fine root biomass are means of four monospecific plots per species, studied by Jacob et al. (submitted). 40
Figure 3.1 Seasonal course of (a) daily mean air temperature (Tmean) and half-hourly values of VPD, (b) mean daily relative air humidity (RHmean) and daily totals of global radiation (Itot) and (c) daily precipitation (P) and soil matrix potential (ΨS) at 10 cm soil depth from 15 August to 15 September 2009, in the Hainich forest. 62
Figure 3.2 Course of sap flux density (Js, g m−2 s−1) in tree organs over a period of 5 days (resolution 30 min) in September 2009. For every species one individual is shown. Note different scale of the y-axis in Fagus tree #1. 63
Figure 3.3 Sap flux density on 28 August 2009, normalized to daily peak flow (Jsn) in sun-canopy branches, stem top, stem base and roots of each one tree of the five species (2-min resolution). Data of branches and roots are means of two sensors each. The diurnal course of VPD at canopy height is depicted in the top panel. 64
Figure 3.4 Diurnal course of sap flow rate (Jr, kg h−1 tree−1) at stem top (grey line) and stem base (dotted line) and time course of water withdrawal and refilling of stem reservoir (filled black area) on 5 days in September 2009 calculated as the difference between the two flows for one tree of each of the five species. Negative values indicate withdrawal of stored water and positive refilling. The thin vertical lines mark 1200 h. Note different scale of the y-axis in F. excelsior #2. 68
Figure 3.5 Daily water use (Jrd, kg day−1) and daily use of stored stem water (Sd, kg day−1) for the studied trees as a function of mean daily VPD. For trees with a significant relationship (P < 0.05), logarithmic functions of the type y = a + b × ln(VPD) are drawn. Note different scales of the y-axes in the Fraxinus trees. 69
Figure 3.6 Mean daily use of stored water (Sd, kg day−1) per tree species in relation to the wood density of the five tree species. A linear regression line is drawn only across the four diffuse-porous species (excluding Fraxinus). (b) Mean time lag between sap flows at stem top and stem base as a function of mean daily use of stored water (Sd) across the five tree species. 69

Figure 3.7 Course of apparent SWD (in μm; i.e., the deviation of actual radius from the respective stem radius at full hydration) in the nine studied trees from 15 August to 15 September 2009. Arrows show days where the daily SWDmin reached high values in several trees. The vertical lines enclose a period with increasing SWD in several trees and a subsequent partial recovery of SWD around the 6 of September. The bottom panel shows the course of the VPD (half-hourly values). Note different scales of the y-axes. 71
Figure 3.8 Daily SWDmin (μm, morning values) of the study trees as a function of soil matrix potential (ΨS, MPa) in 10 cm soil depth. For trees with significant relationships (P < 0.05), exponential functions of the type y = a × exp(b×x) are drawn. Note different scales of the y-axes. 72
Figure 3.9 Ratio of the daily sap flow rate at the stem base and stem top (Jrd stembase 24-day/Jrd stemtop 24-day, calculated in the 24-day analysis, see the Materials and methods section) in its relation to mean daily VPD for seven of the nine study trees. Owing to the missing data, Acer #1 and Fraxinus #1 could not be shown. A ratio >1 indicates a net inflow of water into stem storage and a value below one net outflow. In case of significant relationships (P < 0.05), linear regression lines are drawn. 72
Figure 4.1 Typical diurnal cycle of stem radius variation over three exemplary days in 2009. SRCd is calculated as the difference between two consecutive stem radius maxima. MXSR, maximum stem radius; MNSR, minimum stem radius; SRS, stem radius shrinkage; SRE, stem radius expansion; SRCd, stem radius change (increase or decrease) per day. 95
Figure 4.2 (a) Seasonal course of mean daily relative air humidity (RHmean) and daily totals of global radiation (Itot), (b) daily mean air temperature (Tmean) and daily mean vapor pressure deficit (Dmean), (c) soil water content (Θ) at three soil depths (10, 30, 50 cm) and daily precipitation (P) and (d) soil matrix potential (ΨS) at 10 cm soil depth in summer 2009 in the Hainich forest. (e) Seasonal development of mean radial stem increment (cumulative SRCd) for the five tree species in summer 2009 (n = 4-6 individuals each). (f and g) Stem radius change (SRC) of the five investigated species during summer 2009 calculated as the running mean of daily stem radius change (SRCd) for time windows of (f) 21 days (SRC21) or (g) 7 days (SRC7) that were moved along the time axis. The running means were calculated for the respective mid-point of each window position (i.e. day 4 and day 11 of the windows for SRC7 and SRC21, respectively). 97
Figure 4.3 Mean daily stem radius change (SRCd) as a function of daily means of relative air humidity (RHmean) for the five studied species. Each of the 30 data points marks a day in June 2009 and represents the mean of 4-6 tree individuals. Note different scale of the y-axes. 102
Figure 4.4 Fluctuation of mean daily relative air humidity (RHmean) and mean daily stem radius change (SRCd) of the five species for a 30-day period in mid-summer (June 2009). Mean of 4-6 trees per species. 103
Figure 4.5 Seasonal change in the correlation coefficient (R) of the relationship between mean daily stem radius change (SRCd,) and mean daily relative humidity (RHmean) for the five studied species. Given are values of R calculated for the respective mid-point of a correlation analysis with a moving time window of 31 days. Mean of 4-6 trees per species. 103

Index of Tables
Table 2.1 Characteristics of the trees selected, mean periderm thickness of root segments, number of root segments used for the hydraulic conductivity measurements (Sperry method) and number of microtome cuts used in the anatomical analysis. 30
Table 2.2 Means of anatomical characteristics and specific axial conductivity (ks and kstheo) of small-
diameter roots of the five species studied. In addition to the means, the properties of one to three “high-conductivity roots” are also given in four of the five species. The first number identifies the tree individual, the second one after the hyphen the root segment. Different small letters indicate significant differences between the species (p < 0.05). In case of mean values, the standard error is also given. 36
Table 3.1 Morphological and functional traits of the five studied tree species according to the categorization of species properties in Bartels (1993), Hölscher et al. (2002), Gebauer et al. (2008), Köcher et al. (2009) and Ellenberg and Leuschner (2010). 57
Table 3.2 Time lags between normalized peak sap flux densities (Jsn) of sunlit canopy branches, stem top, stem base and roots of the nine study trees calculated for a time series of up to 24 measuring days in the period from 21 August to 13 September 2009. Sap flux data with a resolution of 2 min were used which were normalized to the daily flux peak before cross-correlation analysis. Positive time lags indicate a delay of sap flux at the lower location in the tree compared to the upper location and vice versa. 65
Table 3.3 Biometric data and parameters characterizing the use of stored water in the study trees. Sapwood area was calculated with power functions taken from Gebauer et al. (2008). The bole volume refers to the volume between the flux sensors at stem top and stem base and was calculated using Smalian’s equation for volume estimation of logs. Jrd—mean daily water use per tree (kg day−1), Sd—mean daily amount of stored stem water extracted, either expressed as daily total (kg day−1), in percent of total daily tree water use (%) or related to bole volume (kg m−3 day−1). Given are means ± SE. Jrd averages were calculated from daily values of the period from 15 August–13 September 2009 (n = 30 days). Owing to missing data in stem base or stem top sap flux, the number of days (n) used to calculate averages of Sd varies between tree individuals. 66
Table 3.4 Definition, symbols and units of the flux terms used. 81 Table 4.1 Number of measured tree individuals per species, range of diameter at breast height (DBH)
and tree height, and mean values (± 1 SD) of bark thickness and daily stem radius change (SRCd) in June in the five tree species. Significant differences between the species are indicated by different small letters. 94
Table 4.2 Pearson correlation coefficients (R) for the relationships between daily stem radius change as calculated by three different approaches and six climatological and hydrological factors in the five species (period: 15 May to 15 July 2009). The environmental variables were also calculated as running means in the case of SRC7 and SRC21 99
Table 4.3 Differentiation of the six environmental factors and daily stem radius change (SRCd) in the data set of the five species according to a PCA. Given are the loadings of the selected variables along the four most important axes. The eigenvalues of the axes are indicated by the numbers in brackets. Numbers in bold indicate a close relationship of that variable to the respective axis. 100
Table 4.4 Table of Pearson correlation coefficients for the inter-relationship between six climatological and hydrological variables used in the analysis of diameter growth-environment relationships (data refer to the period 15 May to 15 July 2009). 100
Table 4.5 Pearson correlation coefficients (R) for the relationship between daily stem radius change (SRCd) and either RHmean or Dmean while controlling for the effect of a third variable (partial correlation). The second column shows the correlation coefficients for single-factor correlations (SRCd vs. RHmean or Dmean), the following columns display the correlation coefficients for the same relation when the effect of the respective partial variable had been removed. 101
Table 5.1 Functional traits of the five studied tree species that are relevant for hydrological processes according to results and species categorizations of the present and additional studies. 122

List of abbreviations
ΨL Leaf water potential
ΨS Soil matrix potential
Θ Volumetric soil water content
Axylem Xylem area
d Vessel diameter
DBH Diameter at breast height
I Global radiation
Js Sap flux density
Jsd Daily sap flux density
Jsn Normalized sap flux density
Jr Sap flow rate
Jrd Daily sap flow rate/ daily water use
kh Initial hydraulic conductivity
kmax Maximum hydraulic conductivity
ktheo Theoretical hydraulic conductivity
ks Maximum specific conductivity
P Daily precipitation
PLC Percentage loss of conductivity
RH Relative air humidity
SWD Stem water deficit
SRS Daily stem radius shrinkage
Sd Daily use of stored stem water
SRCd Daily stem radius change
SRC7 and SRC21 Running mean of SRCd for time windows of 7 and 21 days that
were moved along the time axis
T Air temperature
VPD or D Vapor pressure deficit


Chapter 1
General Introduction

CHAPTER 1
14
Effects of biodiversity and climate change on forest ecosystem functioning
The Convention on Biological Diversity (1992) defined Biodiversity as ‘the
variability among living organisms from all sources including, inter alia, terrestrial,
marine, and other aquatic ecosystems and the ecological complexes of which they are
part: this includes diversity within species, between species, and of their habitats’. In
other words, biodiversity is the variety of life, including variation among genes,
species and functional traits (Cardinale et al. 2012). During the past 50 years, a loss
of biodiversity due to human activity has been observed at a rate more rapid than at
any time in human history (Millenium Ecosystem Assessment 2005). Important
drivers of biodiversity loss are habitat change and destruction, climate change,
invasive alien species, overexploitation and pollution. These drivers are either steady,
show no evidence of declining over time, or are increasing in intensity (Millenium
Ecosystem Assessment 2005). If global mean temperatures exceed a warming of 2 to
3 °C, approximately 20 to 30 % of plant and animal species are likely to be at high
risk of extinction (Fischlin et al. 2007).
Ambition to evaluate the role of biodiversity for ecosystem functions grew over
the last two decades and indeed there is evidence that biodiversity positively affects
ecosystem processes such as productivity, nutrient retention and ecosystem stability
(Hooper et al. 2005). Two potential mechanisms have been proposed to be
responsible for effects of biodiversity on ecosystem functioning (Loreau 1998,
Cardinale et al. 2011, Paquette and Messier 2011): (1) the complementarity
mechanism is related to niche partitioning and facilitation between species, thereby
enhancing the performance of mixed-species communities compared to
monocultures. (2) The selection mechanism results from a higher probability of
species-rich communities to include species that possess particularly important traits,
thereby having a dominant and disproportional influence on ecosystem processes.
Both, biodiversity loss and environmental change rank among the major drivers
of ecosystem change and discovering interactions between these variables is
important to understand net effects on ecosystem processes (Hooper et al. 2012).
Especially forest ecosystems play a central role for the global cycles of carbon, water
and nutrients and for wood production as well as air and water purification (Fischlin
et al. 2007). Forests cover more than 4 billion hectares of land corresponding to 31 %
of total terrestrial area (FAO 2010)

General Introduction
15
Without anthropogenic intervention, Central Europe would be covered by about
65 % by beech-dominated broad-leaved forests (Knoke et al. 2005, Ellenberg and
Leuschner 2010). However, large forest areas have been replaced by coniferous
monocultures since the early 19th century resulting in a reduction of tree species
diversity and a loss in structural forest diversity, thereby increasing the vulnerability
of forest stands to storms, snow, ice, drought and insect damage (Knoke et al. 2005).
In Germany, forests occupy an area of approximately 11.1 million hectare which
corresponds to almost one third of Germany’s total area. Thereof 57.6 % are
coniferous and 40.1 % are deciduous forests (Schmitz et al. 2004). Only recently,
forestry, in an effort to restore biodiversity, aims at a conversion of pure coniferous
forests into mixed stands. As a consequence the proportion of deciduous forests in
Germany increases at present (Schmitz et al. 2004).
The sensitivity of forest ecosystems to climate change differs, with temperature-
limited biomes being sensitive to global warming and drought-limited biomes being
sensitive to reduced water availability (Bates et al. 2008). As a consequence of
increased summer temperatures and precipitation declines, rising drought intensities
during the growing period have been projected for several regions (e.g. the Amazon
and parts of Europe) with potential effects on net primary productivity (Cox et al.
2004, Schaphoff et al. 2006, Scholze et al. 2006, Bates et al. 2008). Further, an
increase in the frequency and magnitude of summer heat waves is predicted for
Central Europe as a result of global warming (Bréda et al. 2006, Meehl and Tebaldi
2004, Schär et al. 2004). However, the consequences of changing atmospheric and
soil water conditions for the performance of mature temperate tree species, especially
in unmanaged forests, are still not sufficiently understood (Bovard et al. 2005).
If soil and atmospheric drought is intensified in the future, the vitality and
abundance of tree species will depend on their capability to ensure water uptake.
Trees have developed several mechanisms and strategies to overcome water shortage
which are closely linked to morphological and physiological traits and thus vary with
plant size, species and functional type. Short-term dynamic response to drought
includes for example a reduction in transpiration due to stomatal closure to maintain
a favorable water status (Sperry et al. 2000). Long-term plastic adjustment to water
shortage is achieved through reduction in leaf area, growing a deep and extensive
root system and developing a highly conductive xylem while keeping the cavitation
vulnerability of the xylem low (Sperry 2002). A combination of these elements

CHAPTER 1
16
determines the ability of tree species to resist, avoid or tolerate drought (Bréda et al.
2006). Forests in Europe and North America can harbor a remarkable functional
diversity of tree species that differ considerably with respect to hydraulic architecture
(variable vessel dimension, diffuse- vs. ring-porous trees, water storage capacity,
wood density), stomatal regulation, isohydric or anisohydric behavior and growth
sensitivity to drought. These traits may be essential when temperate forest
ecosystems experience increased summer drought and reduced rainfall, promoting
species that are able to avoid and/or tolerate water shortage. Alterations in natural
species composition towards more drought-tolerant species are therefore likely to
occur in European forests (Lasch et al. 2002).
Study objectives and chapter outline
This study was conducted within the framework of the Research Training Group
(RTG) 1086 “The role of biodiversity for biogeochemical cycles and biotic
interactions in temperate deciduous forests”. Over the course of nine years, three
generations of PhD-students from more than ten departments are engaged in studies
concerning possible effects of tree species diversity on various ecosystem processes
such as nutrient and water turnover, carbon sequestration and below- and
aboveground biotic interactions. The research of the RTG is focused on three main
topics which are (A) biodiversity analyses and biotic interactions, (B)
biogeochemical cycles and (C) synthesis, all comprising several sub-projects. A
detailed list of variables studied by the RTG 1086 is given in Leuschner et al. (2009).
This thesis is focused on the water relations and hydraulic traits of five co-
occurring temperate tree species (Fagus sylvatica L., Acer pseudoplatanus L.,
Fraxinus excelsior L., Carpinus betulus L., and Tilia cordata Mill.) in the Hainich
forest and was part of the second phase of the RTG 1086 (sub-project B4). During
the first phase, a completed PhD thesis dealt with water use and water turnover in
species-rich and species-poor deciduous forests stands (Gebauer 2008). As a main
result of this work it has been found that tree species identity and the related specific
functional traits are much more important for stand canopy transpiration and water
turnover than is species diversity (Gebauer et al. 2012). However, these traits are
poorly studied and consequently, we aimed in the present study at a characterization
of the five above mentioned tree species with respect to functional traits that are
relevant for hydrological processes. Own earlier research further produced evidence

General Introduction
17
that these tree species have different strategies to cope with drought (Köcher et al.
2009). A main goal of the present study therefore was to deepen our understanding
into the mechanisms that control tree water status and to improve the former
assessment of the tree species’ drought tolerance (Köcher et al. 2009).
We started off by looking at anatomical and hydraulic traits and embolism
degrees in small-diameter roots of the five tree species (chapter 2). Unfortunately,
very little is known about the hydraulic properties and anatomy of the root xylem in
mature trees which constricts a deeper understanding of the functional role of roots in
the flow path. We examined relationships between root anatomy, hydraulic
conductivity and embolism and discussed the relation of these traits to the assumed
drought tolerance of the species.
In the second part of this study, we investigated the role of stored stem water for
daily transpiration, its relation to diurnal changes in stem expansion and contraction
and the temporal coordination between branch, stem and root sap flow in the five tree
species (chapter 3). There is evidence that the daily transpired water is not only
extracted from soil sources but also from internal water stores. These water stores
may represent an important trait of trees to transiently replace transpirational water
losses under high evaporative demand, thereby preventing a drop in leaf water
potential which enables the plant to maintain stomatal opening and carbon
assimilation.
In the third part, we dealt with daily stem growth patterns of the five tree species
in response to environmental variables (chapter 4). Growth and water relations of
plants are tightly coupled as a limited water supply induces stomatal closure for
reducing transpiration and the risk of hydraulic failure, but also constrains CO2
assimilation and thus growth. The water status of the cambium is further playing an
essential role in controlling radial stem growth. The specific objectives of this study
were to test various environmental factors in their effect on stem radius changes, and
to compare radial growth rates and seasonal growth dynamics among the five tree
species.
Study area – The Hainich National Park
This study was carried out in an old-growth broad-leaved forest in Hainich National
Park, located in the centre of Germany (Thuringia). The Hainich is a forested plateau
range (350 m a.s.l.) that encompasses approx. 16000 ha near-natural deciduous forest

CHAPTER 1
18
which makes it the largest area of undissected beech-dominated woodlands on
calcareous soils in Germany (Hiekel et al. 2004). Since 1997, 7500 ha of this area
have a national park status and a natural development was ensured. Prior to this time,
parts of the Hainich forest were used as a military training ground and are therefore
essentially unmanaged for more than 40 years (Mölder et al 2008). Since June 2011,
part of Hainich National Park belongs to an UNESCO world natural heritage site.
Dominant forest communities in the Hainich are the Galio-Fagetum, the
Hordelymo-Fagetum and the Stellario-Carpinetum (Mölder et al. 2008). Small-scale
historic land-ownership has formed a mosaic of species-poor and species-rich stands
in close vicinity to each other as a result of different management practices
(Leuschner et al. 2009). As a consequence, the Hainich is one of the most diverse
forests in Central Europe, sheltering up to 14 tree species per hectare. European
beech (Fagus sylvatica L.) is the dominant tree species but other species like
European hornbeam (Carpinus betulus L.), European ash (Fraxinus excelsior L.) and
species of the genera maple (Acer pseudoplatanus L., A. platanoides L. and A.
campestre L.), linden (Tilia cordata Mill. and T. platyphyllos Scop.) and oak
(Quercus sp.) are also common. Less frequent are tree species like service tree
(Sorbus torminalis (L.) Crantz), elm (Ulmus glabra L.) and cherry (Prunus avium
L.).
Luvisol is the dominant soil type which developed from Triassic limestone as
bedrock with a loess cover varying from 60 to 120 cm (Guckland et al. 2009). Mean
annual temperature is 7.5 °C and mean annual precipitation is 590 mm, recorded at
the nearby Weberstedt meteorological station (1973-2004, Deutscher Wetterdienst,
Offenbach, Germany) The regional climate of the area can be characterized as sub-
continental (Klaus and Reisinger 1995).
In the first phase of the Research Training Group 1086, permanent plots of 50 x
50 m were established for comparative studies of tree diversity and ecosystem
function. The vegetation in the plots varies from pure beech stands to mixed stand
with five or more tree species. In the second phase, 100 plots were selected,
composed of three trees (“tree cluster”), comprising all possible one-, two- and three
species combinations of the five tree species Fagus sylvatica L., Acer
pseudoplatanus L., Fraxinus excelsior L., Carpinus betulus L., and Tilia cordata
Mill., which are of major interest for the RTG 1086 and represent the dominant tree
species in the study area (for details see Leuschner et al. 2009). For the present study,

General Introduction
19
we established an additional research site which is located in the Thiemsburg forest
area and lies next to the DL 2a, DL 2b and DL 3c plots of the first phase of the RTG
1086 (Figure 1.1). The reason for that was the use of a mobile canopy lift (model
DL30, Denka-Lift A/S, Holbaek, Denmark) to access the upper canopy layer of the
closed forest stand. This lift can be moved only over short distances. The main
selection criteria for the site therefore were the presence of at least five mature tree
individuals per species that reached the upper canopy layer, were comparable in stem
size and accessible with the canopy lift.
Figure 1.1 Map of the research area in the north-eastern part of the Hainich forest. Letters and numbers (e.g. DL 1a) indicate the locations of the 50 x 50 m study plots of the first phase of the RTG. The site of the present study is encircled with the gray ellipse.

CHAPTER 1
20
References
Bates, B.C., Z.W. Kundzewicz, S. Wu and J.P. Palutikof, Eds., 2008: Climate Change and Water. Technical Paper of the Intergovernmental Panel on Climate Change, IPCC Secretariat, Geneva, 210 pp.
Bovard BD, Curtis PS, Vogel CS, Su HB, Schmid HP (2005) Environmental controls on sap flow in a northern hardwood forest. Tree Physiol 25:31–38
Bréda N, Huc R, Granier A, Dreyer E (2006) Temperate forest trees and stands under severe drought: a review of ecophysiological responses, adaptation processes and long-term consequences. Ann For Sci 63:625–644
Cardinale BJ, Duffy JE, Gonzalez A, Hooper DU, Perrings C, Venail P, Narwani A, Mace GM, Tilman D, Wardle DA, Kinzig AP, Daily GC, Loreau M, Grace JB, Larigauderie A, Srivastava DS, Naeem S (2012) Biodiversity loss and its impact on humanity. Nature 486:59–67
Cardinale BJ, Matulich KL, Hooper DU, Byrnes JE, Duffy E, Gamfeldt L, Balvanera P, O’Connor MI, Gonzalez A (2011) The functional role of producer diversity in ecosystems. Am J Bot 98:572–592
Cox PM, Betts RA, Collins M, Harris PP, Huntingford C, Jones CD (2004) Amazonian forest dieback under climate-carbon cycle projections for the 21st century. Theor Appl Climatol 78:137–156
Ellenberg H, Leuschner C (2010) Vegetation Mitteleuropas mit den Alpen in ökologischer, dynamischer und historischer Sicht. 6th ed. Ulmer, Stuttgart
FAO, Food and Agricultural Organization (2010) Global Forest Resource Assessment, Main report. FAO Forestry Paper 163. Rome, Italy
Fischlin A, Midgley GF, Price JT, Leemans R, Gopal B, Turley C, Rounsevell MDA, Dube OP, Tarazona J, Velichko AA (2007) Ecosystems, their properties, goods, and services. Climate Change 2007: Impacts, Adaptation and Vulnerability. Contribution of Working Group II to the Fourth Assessment Report of the Intergovernmental Panel on Climate Change, Parry ML, Canziani OF, Palutikof JP, van der Linden PJ and Hanson CE, Eds., Cambridge University Press, Cambridge, 211-272.
Gebauer T (2010) Water turnover in species-rich and species-poor deciduous forests: xylem sap flow and canopy transpiration. PhD thesis, University of Göttingen, Germany.
Gebauer T, Horna V, Leuschner C (2012) Canopy transpiration of pure and mixed forest stands with variable abundance of European beech. J Hydrol 442–443:2–14
Guckland A, Jacob M, Flessa H, Thomas FM, Leuschner C (2009) Acidity, nutrient stocks, and organic-matter content in soils of a temperate deciduous forest with different abundance of European beech (Fagus sylvatica L.). J Plant Nutr Soil Sc 172:500–511

General Introduction
21
Hiekel W, Fritzlar F, Nöllert A, and Westhus W (2004) Die Naturräume Thüringens. Naturschutzreport 21: 1–383.
Hooper DU, Adair EC, Cardinale BJ, Byrnes JEK, Hungate BA, Matulich KL, Gonzalez A, Duffy JE, Gamfeldt L, O’Connor MI (2012) A global synthesis reveals biodiversity loss as a major driver of ecosystem change. Nature 486:105–108
Hooper DU, Chapin FS, Ewel JJ, Hector A, Inchausti P, Lavorel S, Lawton JH, Lodge DM, Loreau M, Naeem S, Schmid B, Setälä H, Symstad AJ, Vandermeer J, Wardle DA (2005) Effects of biodiversity on ecosystem functioning: a consensus of current knowledge. Ecol Monogr 75:3–35
Klaus S, Reisinger E (1995) Der Hainich - ein Weltnaturerbe. Landschaftspflege und Naturschutz in Thüringen - Sonderheft. Jena: Thüringer Landesanstalt für Umwelt.
Knoke T, Stimm B, Ammer C, Moog M (2005) Mixed forests reconsidered: a forest economics contribution on an ecological concept. Forest Ecology and Management 213:102–116
Köcher P, Gebauer T, Horna V, Leuschner C (2009) Leaf water status and stem xylem flux in relation to soil drought in five temperate broad-leaved tree species with contrasting water use strategies. Ann For Sci 66:101
Lasch P, Lindner M, Erhard M, Suckow F, Wenzel A (2002) Regional impact assessment on forest structure and functions under climate change–the Brandenburg case study. Forest Ecol Manag 162:73–86
Leuschner C, Jungkunst HF, Fleck S (2009) Functional role of forest diversity: pros and cons of synthetic stands and across-site comparisons in established forests. Basic Appl Ecol 10:1–9
Loreau M (1998) Biodiversity and ecosystem functioning: a mechanistic model. Proc Natl Acad Sci USA 95:5632–5636
Meehl GA, Tebaldi C (2004) More intense, more frequent, and longer lasting heat waves in the 21st century. Science 305:994–997
Millennium Ecosystem Assessment (2005) Ecosystems and Human Well-being: Biodiversity Synthesis. World Resources Institute, Washington, DC.
Mölder A, Bernhardt-Römermann M, Schmidt W (2008) Herb-layer diversity in deciduous forests: Raised by tree richness or beaten by beech? Forest Ecol Manag 256:272–281
Paquette A, Messier C (2011) The effect of biodiversity on tree productivity: from temperate to boreal forests. Global Ecol Biogeogr 20:170–180
Schaphoff S, Lucht W, Gerten D, Sitch S, Cramer W, Prentice IC (2006) Terrestrial biosphere carbon storage under alternative climate projections. Climatic Change 74:97–122
CHAPTER 1
22
Schär C, Vidale PL, Lüthi D, Frei C, Häberli C, Liniger MA, Appenzeller C (2004) The role of increasing temperature variability in European summer heatwaves. Nature 427:332–336
Schmitz F, Polley H, Hennig P, Schwitzgebel F, Kriebitzsch WU (2004) Die zweite Bundeswaldinventur – BWI2: Das Wichtigste in Kürze. Bundesministerium für Verbraucherschutz, Ernährung und Landwirtschaft, Bonn
Scholze M, Knorr W, Arnell NW, Prentice IC (2006) A climate-change risk analysis for world ecosystems. Proc Natl Acad Sci USA 103:13116–13120
Sperry JS (2000) Hydraulic constraints on plant gas exchange. Agric For Meteorol 104:13–23
Sperry JS, Hacke UG, Oren R, Comstock JP (2002) Water deficits and hydraulic limits to leaf water supply. Plant Cell Environ 25:251–263


Chapter 2
Hydraulic properties and embolism in small-diameter roots of five temperate broad-leaved tree species with contrasting drought tolerance
Paul Köcher · Viviana Horna · Ingo Beckmeyer · Christoph Leuschner
Published in
Annals of Forest Science 2012, 69:693–703
DOI: 10.1007/s13595-012-0189-0

CHAPTER 2
26
Abstract
Context It has been estimated that about half of a plant’s total hydraulic resistance is
located belowground, but it is not well known how temperate tree species differ in
root hydraulic properties and how these traits vary with the species’ drought
tolerance.
Aims We examined root anatomical and hydraulic traits in five broad-leaved tree
species with different drought tolerance, analyzed the relation between root anatomy
and hydraulic conductivity and root embolism, and investigated the relation of these
traits to the species’ drought tolerance.
Methods In small-diameter roots (2-6 mm), we measured vessel diameters and vessel
density, specific hydraulic conductivity, and the percental loss of conductivity
(“native” embolism) during summer in a mixed forest.
Results Specific conductivity was positively related to vessel diameter but not to
vessel density. Drought-tolerant Fraxinus showed the smallest mean vessel diameters
and drought-sensitive Fagus the largest. Specific conductivity was highly variable
among different similar-sized roots of the same species with a few roots apparently
functioning as “high-conductivity roots”.
Conclusion The results show that coexisting tree species can differ largely in root
hydraulic traits with more drought-sensitive trees apparently having larger mean
vessel diameters in their roots than tolerant species. However, this difference was not
related to the observed root conductivity losses due to embolism.
Keywords Acer pseudoplatanus, Carpinus betulus, Coarse roots, Drought tolerance,
Fagus sylvatica, Fraxinus excelsior, Root hydraulic conductivity, Root embolism,
Tilia cordata, Vessel diameter

Hydraulic traits in roots of five tree species
27
Introduction
A key direction of plant adaptation in terrestrial environments is to maximize carbon
gain while maintaining a favorable plant water status and avoiding hydraulic failure.
This requires adjustment of the plant’s conducting system to maximize water uptake
and to reduce water deficits (Sperry et al. 1998, 2002; Maseda and Fernández 2006).
Trees adapt to changes in water availability either with long-term plastic responses in
the size of the absorbing root system and in the evaporating leaf surfaces or by
modifications in the hydraulic system and adjustment of the cavitation risk along the
flow path (Sperry et al. 2002).
The hydraulic system of a tree is composed of a network of vessels that enables
the continuous supply of water from roots to shoots. The conductivity of this system
is mainly determined by the number, diameter, and length of the vessels along the
root-to-leaf flow path. A precise understanding of the hydraulic properties of these
conduits is essential for predicting the flow of water in the soil-plant-atmosphere
continuum because important functions such as the rate of water movement, the
maintenance of water potential gradients and the vulnerability to xylem cavitation all
are directly related to vessel anatomical characteristics and tree hydraulic
conductivity (e.g., Wheeler et al. 2005; Cai and Tyree 2010). The hydraulic traits
also have a large influence on how the leaf water status of trees is responding to
changes in soil water supply and atmospheric water demand (Eamus et al. 2006).
Xylem properties can differ largely among different tree species and also
between roots, stem and branches of the same tree (Martínez-Vilalta et al. 2002). It is
assumed that about half of a plant’s total hydraulic resistance is located
belowground, which emphasizes the crucial role played by the root system in water
flux control (Passioura 1988; Tyree and Ewers 1991). Surface roots may function
like valves in the soil-plant-atmosphere flow path by enabling rapid water transport
when the soil is wet, but disconnecting the plant from the driest soil patches through
the development of drought-induced embolism (Alder et al. 1996; Martinez-Vilalta et
al. 2002). In agreement with this idea, Sperry and Saliendra (1994) argued that xylem
embolism should be easier to reverse in roots than in stems because roots frequently
experience positive or near-positive pressures. Furthermore, roots are thought to be
cheaper in terms of carbon investment than stems or branches (e.g., Hacke et al.
2000). Unfortunately, we know only very little about the hydraulic properties and
anatomy of the xylem in the root systems of mature trees which hinders a better

CHAPTER 2
28
understanding of the functional role of roots in the flow path (Cinnirella et al. 2002;
Leuschner et al. 2004). Studies analyzing the within-community variation in the
hydraulic architecture of plants have mostly focused on the aboveground organs and
only few dealt with roots (e.g., Hacke et al. 2000; Martinez-Vilalta et al. 2002;
Domec et al. 2004) which makes it difficult to characterize different functional types
of roots with specific water absorption and water transport qualities.
We analyzed vessel anatomical properties and measured the axial hydraulic
conductivity and apparent embolism-induced reductions in conductivity in small-
diameter roots (2-6 mm in diameter) of five co-occurring temperate broad-leaved tree
species of the genera Fagus, Acer, Tilia, Carpinus and Fraxinus that differ in
drought tolerance and successional status. Four of the species have a diffuse-porous
xylem in the stem while one species (Fraxinus) is ring-porous. According to
Ellenberg and Leuschner (2010), Fraxinus excelsior, Carpinus betulus and Tilia
cordata can be classified as drought-tolerant while Fagus sylvatica and Acer
pseudoplatanus are more drought-sensitive species. Köcher et al. (2009) ranked the
five species in terms of their drought sensitivity in the order Fagus > Acer > Tilia >
Carpinus > Fraxinus with the less sensitive species maintaining higher values of pre-
dawn leaf water potential, leaf conductance and xylem flux density under restricted
water supply. This ranking was confirmed for Acer pseudoplatanus, Fagus sylvatica
and Fraxinius excelsior in a recent study (Scherrer et al. 2011) based on canopy
foliage temperature and sap flow data.
We tested the hypotheses that (a) the maximum specific conductivity (ks) of roots
is a function of conduit diameter, similar as it is in stems, (b) less drought-sensitive
tree species produce on average smaller vessels but higher vessel densities in the root
xylem than more sensitive species which reduces the risk of embolism in the roots,
and (c) the roots of more drought-sensitive species show higher losses of
conductivity in summer than those of less sensitive species. We further assumed that
the second hypothesis is not valid in the case of ring-porous Fraxinus whose
particularly large vessels in the stem were assumed to occur also in the roots, even
though the species is known to be rather insensitive to drought.

Hydraulic traits in roots of five tree species
29
Materials and methods
Study site and tree selection
The study was conducted between July and September 2008 in a species-rich
temperate broad-leaved forest stand in Hainich National Park in western Thuringia,
Central Germany at 350 m a.s.l. (51° 05’ 00’’ N, 10° 30’ 27’’ E). The national park
with a size of 7610 ha is part of one of the largest non-fragmented deciduous
woodlands in Central Europe. In the study region, a mixed forest of the Stellario-
Carpinetum community (oak-hornbeam forest) with F. sylvatica L. (European
beech), T. cordata Mill. (little-leaf linden), C. betulus L. (European hornbeam), F.
excelsior L. (European ash), A. pseudoplatanus L. (sycamore maple) and other
broad-leaved species is present (Leuschner et al. 2009). The soils are Luvisols
developed from loess that overlays Triassic limestone. The mean annual precipitation
in the study region is 590 mm and the mean annual temperature is 7.5 °C (1973-
2004, Weberstedt station, data provided by Deutscher Wetterdienst).
In the studied mixed forest, all five species are present with adult trees in close
vicinity to each other and the root systems of the species are broadly overlapping.
Thus, we assumed that the trees are exposed to similar edaphic and climatic
conditions providing an excellent basis for inter-specific comparison. According to
Gebauer et al. (2008), tree density varies from 392 to 614 stems ha–1 in the study area
with a higher mean tree height (32.9 m) in the less dense patches of the stand as
compared to the denser part (27.9 m).
We selected four to six individuals each of F. sylvatica, A. pseudoplatanus, T.
cordata, C. betulus and F. excelsior with all the sampled trees located within 100 m
from each other (Table 2.1). We chose trees with representative diameter and height
dimensions for the respective species in the stand, i.e., DBH values of 25 to 76 cm
and crowns reaching in the upper canopy layer (height 23-34 m). To access the sun
canopies, we used a mobile canopy lift (model DL30, Denka-Lift AS, Denmark).

CHAPTER 2
30
Table 2.1 Characteristics of the trees selected, mean periderm thickness of root segments, number of root segments used for the hydraulic conductivity measurements (Sperry method) and number of microtome cuts used in the anatomical analysis.
Species n (trees)
DBH (cm)
Tree height (m)
Periderm thickness (mm)
n (Sperry)
n (anatomy)
Fagus 6 40.4 - 60.6 28.2 - 33.1 0.31 ± 0.021 71 24
Acer 5 36.7 - 75.8 26.8 - 33.7 0.35 ± 0.013 59 20
Tilia 4 40.6 - 62.6 24.3 - 31.7 0.47 ± 0.030 48 16
Carpinus 5 31.7 - 59.7 24.7 - 29.2 0.28 ± 0.024 59 20
Fraxinus 6 23.6 - 40.3 23.0 - 32.8 0.60 ± 0.024 72 24
Leaf water potential
Daily minima of leaf water potential (ΨL) were measured with a Scholander pressure
chamber apparatus (M600, PMS Instrument Company, Albany, USA) on three
sampling dates between July and September 2008 for assessing indications of
drought stress. Four leaf (or shoot) samples per tree and sampling date were
investigated in the exposed sun crown of the five species (i.e., 16 to 24 samples per
species and occasion). The leaf or shoot samples were measured immediately after
sampling. All measurements were conducted between 11:00 and 14:00 when diurnal
minima of ΨL are typically occurring.
Native root hydraulic conductivity and embolism
Initial and maximum axial hydraulic conductivity of segments of small-diameter
roots (2-6 mm in diameter) were determined empirically following the protocol given
by Sperry et al. (1988). Twelve root segments per tree (48-72 per species) were
collected on different occasions between July and September 2008 in the topsoil (0-
10 cm depth). The species identity of the roots was detected by tracing the roots back
to the stem or a major root. The mean diameter of the more than 300 sampled roots
was 3.31 ± 0.052 (SE) mm. The number of samples per species and the size
characteristics of the sampled trees are given in Table 2.1. For avoiding embolism
caused by the cutting of the roots, we used only root samples with a minimum length
>15 cm which presumably exceeded maximum vessel length in the root segments.
Immediately after collection, the root samples were stored in polyethylene tubes
filled with water containing a sodium-silver chloride complex (Micropur, Katadyn,
Wallisellen, Switzerland) to prevent microbial growth and to avoid the development
of new emboli. The samples were taken to the laboratory and stored at 4oC until
measurement which took place within 7 days. We assumed that bubbles enclosed in

Hydraulic traits in roots of five tree species
31
the vessels and causing cavitation were not dissolved during the period between
cutting and measurement because ambient pressure was kept constant (Tyree and
Yang 1992). Prior to measurement, each segment was re-cut under water with a razor
blade; the length of the root segments used for measurement was at least 6 cm.
Measurements of hydraulic conductivity (kh) were consecutively conducted at least
three times in each root segment according to the specifications made by Sperry et al.
(1988). We used de-ionized water containing sodium-silver chloride for the flow
measurement. The solution was passed through a 0.2-µm-membrane filter (Maxi
Capsule, Pall, USA) to prevent blockage of vessels by microscopic particles. The
water flow through the root segments was driven by a pressure of about 0.007 MPa.
Water leaving the distal end of the segment was collected and weighed with an
accuracy of 0.1 mg. The hydraulic conductivity (kh) was then calculated as
×==
sMPamkg
ΔPl
ΔtΔV
ΔPlFkh
(1)
where F is the flow rate (in kilograms per second), l the length of the root segment
(in meters), ∆P the pressure difference applied to the segment (in megapascals), ∆V
the amount of water flowing out of the root segment (in kilograms), and ∆t the time
interval of measurement (in seconds). After measuring initial conductivity (kh), the
segments were flushed with a pressure of 0.12 MPa to remove existing native emboli
and to achieve maximum axial conductivity (kmax) in consecutive measurements. A
smaller value of kh than kmax was interpreted as evidence for the existence of emboli
in the flow path and the size of the difference between kh and kmax was taken as a
measure of the percental loss of conductivity (PLC) under in situ conditions
(“native” embolism, Alder et al 1996)
[ ]%100max
max ×−
=k
kkPLC h (2)
Sapwood area-specific conductivity (ks, in kg MPa−1 s−1 m−1) was obtained from
kmax or theoretical conductivity ktheo (see below) by scaling to the xylem cross-
sectional area (Axylem).
=
msMPakg
Ak
kxylem
s max (3)
The xylem cross-sectional area in the roots was either measured directly by
anatomical inspection under the microscope (see below) or, in a number of samples,
estimated with a regression equation that relates measured root xylem area to root
diameter.

CHAPTER 2
32
Root vascular anatomy
For analyzing root xylem anatomy, we selected by random a third of the root samples
used for hydraulic conductivity measurements, cut 5-10-mm-long segments from the
proximal end and immersed them in polyethylenglycol (Type 2000, Merck
Schuchardt, Hohenbrunn, Germany) for preparation. After hardening, 10-20-µm-
thick disks were cut with a sliding microtome (Hn 40, Reichert Jung, Nussloch,
Germany), mounted on microscope plates and submersed in Euparal (Chroma,
Muenster, Germany). Finally, the disks were oven-dried for a week at 50 °C.
Photographs of the cross-sectional cuts were taken with a digital camera
(PowerShot A620, Canon, Japan) mounted on a light microscope (Photomikroskop
III, Zeiss, Jena, Germany). An object micrometer with a resolution of 10 µm was
used as scale reference. If the area of the root sample was too large for a single
image, several pictures were taken and they were subsequently re-arranged using
Adobe Illustrator CS2 (Version 12.0.1, Adobe Systems Incorporated, USA) prior to
the digital analyses. The images were analyzed with the software Image J (v1.36b,
http://rsb.info.nih.gov/ij) using the particle analysis-function for estimating the
idealized radius (r) of the vessels by means of lumen area (A = π r2), vessel density
(in number per square millimeters) and cumulative cross-sectional area of all vessels
(in square meters). The xylem area (Axylem, in square meters) in the root cross-section
was determined by subtracting the bark and parenchymatic tissue from the total
cross-sectional area. Since the analysis of xylem anatomy and vessel dimensions is
very labor-intensive, we investigated only every third of the conductivity samples
(Table 2.1).
The movement of water in xylem vessels can be described in a first
approximation by Hagen-Poiseuille’s law. This equation can thus be used to
calculate the ideal theoretical hydraulic conductivity of a root segment from the radii
of its vessel elements,
= ∑
sMPamr
k theo44
8ηπ (4)
where r is the radius of a vessel and η the viscosity of pure water (1.002×10⁻³ Pa s at
20 °C). The theoretical conductivity ktheo was then multiplied with the density of
water (ρ) at 20°C (998.20 kg m-3) to achieve consistency of units.

Hydraulic traits in roots of five tree species
33
Soil water content and soil matrix potential
Volumetric soil water content (Θ, in cubic meters per cubic meter) was measured
with time domain reflectometry sensors (CS616 Water Content Reflectometer,
Campbell Scientific Ltd., Cambridge, UK) installed at three different depths (10, 30
and 50 cm) in close proximity to the studied trees. Two measurements were taken per
day (0:00h and 12:00h). We used the water content data from 10 cm soil depth for
analysis because the root samples originated from this depth (0-10 cm). The TDR
sensors at lower depths were used for monitoring the depletion of soil water in the
profile.
Soil matrix potential (ΨS) was estimated with the program Rosetta Version 1.2
(Schaap et al. 1998) from the soil water content data. This program implements
pedotransfer functions to predict water retention parameters after van Genuchten
(1980) based on soil bulk density and textural distribution. The calculated parameters
were used in the van Genuchten water retention function to derive soil matrix
potential (ΨS). The required soil physical parameters (e.g., clay content, bulk density)
were provided by Guckland et al. (2009).
Statistical analyses
Basic statistics (arithmetic mean or median, standard error) were calculated with
Microsoft Office Excel 2003 software. Regression analyses were conducted with the
program Xact 7.20g (SciLab GmbH, Hamburg, Germany). All other statistical
calculations were done with SAS software, version 9.1 (SAS Institute Inc., Cary, NC,
USA). To examine differences between tree species in anatomical properties and
hydraulic conductivity, the data sets were first tested for normal distribution with a
Shapiro and Wilk test. The assumption of normal distribution was not met in all
cases. In non-normally distributed data sets, we conducted pair-wise comparisons of
hydraulic trait means among the five species with the Wilcoxon U-test after Mann
and Whitney. Otherwise, we performed a one-way analysis of variance using the
general linear model procedure followed by Tukey’s test. The tests for comparing
means were chosen according to the structure (balanced/imbalanced) of the data sets
(see Table 2.1).
CHAPTER 2
34
Results
Precipitation and soil water content
The study region received in 2008 slightly more precipitation (652 mm) than the
long-term average (590 mm). Nevertheless, the vegetation period from May to
October was relatively dry. Especially in the study period between July and
September, the precipitation total was 44% lower than the average for these months
as derived from measurements in the years 2000-2007 (40 mm in 2008 vs. 72 mm in
2000-2007).
The volumetric soil water content (Θ) at 10 cm depth was significantly lower
than that at 30 and 50 cm throughout the summer. At all three depths, Θ decreased
progressively from May to mid-September. The lowest soil water content was
recorded in September at 10 cm depth (0.163 m3 m-3). The soil matrix potential (ΨS)
in 10 cm depth varied between -0.09 MPa (July) and -0.24 MPa (September) in the
study period.
Leaf water potential
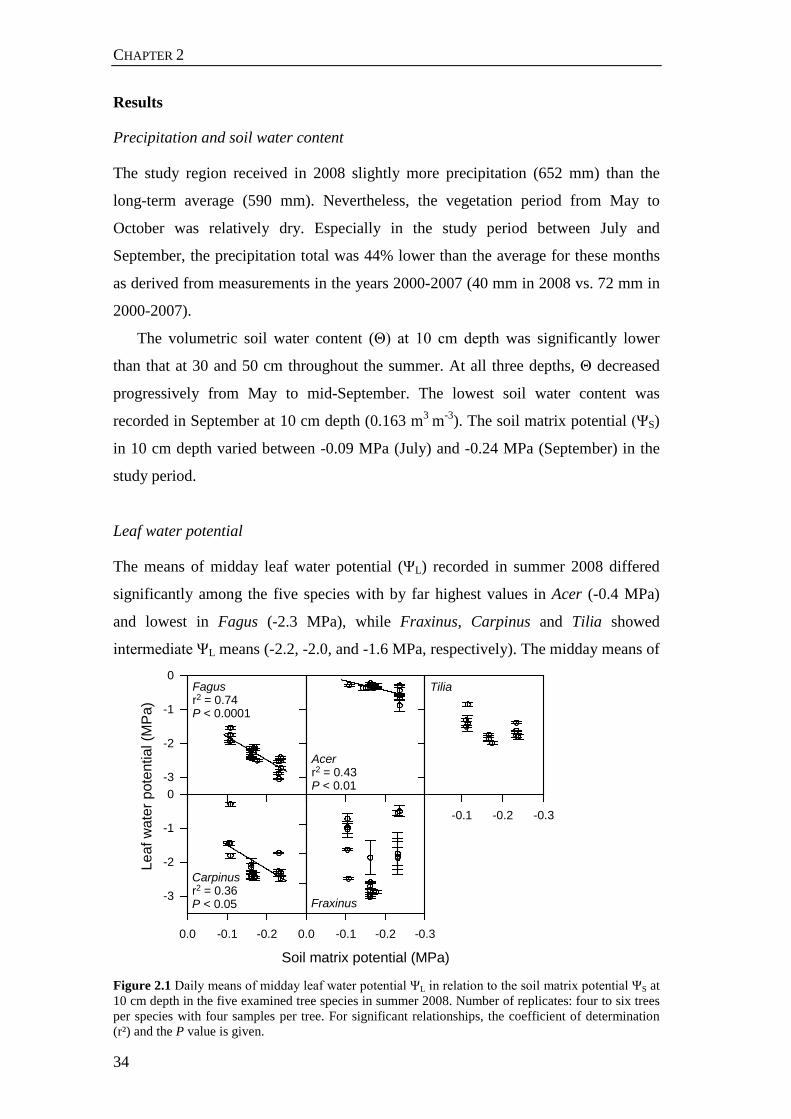
The means of midday leaf water potential (ΨL) recorded in summer 2008 differed
significantly among the five species with by far highest values in Acer (-0.4 MPa)
and lowest in Fagus (-2.3 MPa), while Fraxinus, Carpinus and Tilia showed
intermediate ΨL means (-2.2, -2.0, and -1.6 MPa, respectively). The midday means of
-3
-2
-1
0
0.0 -0.1 -0.2
Carpinusr = 0.362
P < 0.05
0.0 -0.1 -0.2 -0.3
Soil matrix potential (MPa)
Fraxinus
-3
-2
-1
0
Leaf
wat
erpo
tent
ial(
MP
a)
Fagusr = 0.742
P < 0.0001
Acerr = 0.432
P < 0.01
-0.1 -0.2 -0.3
Tilia
Figure 2.1 Daily means of midday leaf water potential ΨL in relation to the soil matrix potential ΨS at 10 cm depth in the five examined tree species in summer 2008. Number of replicates: four to six trees per species with four samples per tree. For significant relationships, the coefficient of determination (r²) and the P value is given.

Hydraulic traits in roots of five tree species
35
ΨL decreased significantly with a decline in soil matrix potential in Acer, Fagus and
Carpinus, while they were independent from soil matrix potential in Tilia and
Fraxinus (Fig. 2.1). In Tilia, however, a tendency for a decrease in ΨL with
decreasing ΨS was visible. In the only ring-porous species, Fraxinus, ΨL was highly
variable during mid-summer without a clear relationship to soil matrix potential.
Root vascular anatomy
The small-diameter roots of the five species with 2-6 mm in diameter showed
significant differences in the proportion of the root xylem cross-sectional area that
was occupied by vessel lumina (Table 2.2). Tilia and Fagus roots had significantly
larger relative vessel lumen areas in the xylem cross-section than Acer and Carpinus
(17-18 vs. 10-11 %); the smallest cumulative lumen area was detected in Fraxinus
roots (6 %). The same species sequence was observed for vessel density with highest
densities produced by Tilia roots (mean: 118 vessels mm-2) and lowest by Fraxinus
(53 mm-2, Table 2.2).
All five species showed a considerable variation in vessel diameters (d) in the
root xylem (<20 to >100 µm, Table 2.2 and Fig. 2.2). Small vessels with a mean d of
20-25 µm were the most frequent size class in the xylem of Fraxinus, Acer, Tilia and
Carpinus roots while in Fagus, the most frequent size class had a larger mean
diameter (30-35 µm). The species with largest mean vessel diameters (Fagus and
Tilia) differed significantly from the ring-porous species Fraxinus with smallest
mean d, while Fagus, Tilia, Carpinus and Acer differed not significantly from each
other (29-32 µm, Table 2.2). In all species, d showed a left-skewed distribution, but
the vessel number decrease toward larger diameter classes was steeper in the xylem
of Fraxinus roots (Fig. 2.2) with smallest mean d (Table 2.2). In this species, 26% of
all vessels referred to conduits with diameters of 20-25 µm. In all five species, we
observed a small number of very large vessels with d >80 µm and maxima even
exceeding 100 µm. The largest conduit was measured in a root segment of Carpinus
(115 µm).
The roots of the five species also differed in mean thickness of the root bark with
the thickest periderm observed in Fraxinus (mean: 0.60 mm) and Tilia (0.47 mm)
and the thinnest in Carpinus and Fagus (0.28 and 0.31 mm, Table 2.1).
Consequently, the xylem occupied a significantly smaller area of the root cross-
section in Fraxinus and Tilia (42 % and 48 %) than in the other species (58 - 66 %,

CHAPTER 2
36
Tabl
e 2.
2 M
eans
of a
nato
mic
al c
hara
cter
istic
s and
spec
ific
axia
l con
duct
ivity
(ks a
nd k
stheo
) of s
mal
l-dia
met
er ro
ots o
f the
five
spec
ies s
tudi
ed. I
n ad
ditio
n to
the
mea
ns,
the
prop
ertie
s of o
ne to
thre
e “h
igh-
cond
uctiv
ity ro
ots”
are
als
o gi
ven
in fo
ur o
f the
five
spec
ies.
The
first
num
ber i
dent
ifies
the
tree
indi
vidu
al, t
he se
cond
one
afte
r the
hy
phen
the
root
segm
ent.
Diff
eren
t sm
all l
ette
rs in
dica
te si
gnifi
cant
diff
eren
ces b
etw
een
the
spec
ies (
p <
0.05
). In
cas
e of
mea
n va
lues
, the
stan
dard
err
or is
als
o gi
ven.
Loss
of r
oot
cond
uctiv
ity
(%)
18.6
±2.5
a
4.1
9.6
16.3
±2.4
a
5.8
9.3
±2.5
b
4.5
8.0
18.4
16.2
±2.5
a
6.0
2.3
18.7
±2.2
a
a In p
erce
nt o
f roo
t cro
ss-s
ectio
nal a
rea;
b No
“hig
h-co
nduc
tivity
root
s” w
ere
subj
ecte
d to
ana
tom
ical
ana
lysi
s in
Frax
inus
k s th
eo
(kg
MPa
-1
s-1 m
-1)
17.8
0±2.
04 a
46.2
3
37.7
2
9.6
7±1.
19 b
23.1
7
19.8
1±3.
19 a
29.6
3
40.7
3
42.2
4
11.5
2±2.
84 b
47.8
8
39.9
2
5.1
1±0.
67 c
k s
(med
ian)
10.2
9
2.75
6.35
4.30
2.20
k s
(kg
MPa
-1
s-1 m
-1)
13.0
3±1.
40 a
46.6
7
43.7
0
3.9
1±0.
51 b
22.2
9
10.3
8±1.
66 a
28.0
7
20.9
1
19.9
0
8.8
2±1.
64 c
33.4
9
43.3
4
4.4
8±0.
77 b
Ves
sel
diam
eter
(μ
m)
42.3
±1.4
a
61.1
9
55.6
0
38.7
±1.7
ab
49.6
8
41.9
±1.9
a
44.1
3
50.9
7
53.1
6
38.7
±1.7
ab
51.1
5
57.7
3
35.0
±1.1
b
Ves
sel
dens
ity
(n m
m-2
)
114±
6 a
57
63
81±6
b
62
118±
6 a
143
124
114
78±7
b
139
65
53±2
c
Lum
en
area
(m
m2 )
0.91
±0.1
1 a
0.81
0.47
0.47
±0.0
5 b
0.41
0.66
±0.1
0 b
1.62
0.66
0.70
0.69
±0.1
6 b
1.60
3.02
0.26
±0.0
3 c
Lum
en
area
a
(%)
16.9
±0.8
a
19.7
18.2
10.3
±0.7
b
13.9
17.8
±1.4
a
24.8
28.2
27.6
10.8
±1.6
b
31.7
19.5
5.8±
0.4
c
Xyl
em
area
a
(%)
63.2
±2.1
ac
41.0
49.7
58.0
±1.5
a
54.9
47.5
±2.2
b
69.4
37.9
31.6
66.4
±2.0
c
60.7
72.7
42.2
±1.3
b
Roo
t di
amet
er
(mm
)
3.20
±0.1
7 a
3.58
2.57
3.12
±0.1
5 a
2.61
3.07
±0.1
4 a
3.47
2.81
3.21
3.28
±0.2
2 a
3.26
5.23
3.50
±0.1
4 a
Spec
ies/
R
oot
num
ber
Fagu
s
M
ean
3-
2
6-
11
Acer
M
ean
2-
7
Tilia
M
ean
4-
7
5-
8
5-
12
Car
pinu
s
M
ean
2-
3
4-
3
Frax
inus
b
M
ean
Hydraulic traits in roots of five tree species
37
0
10
20
Fagusn=15673
Acern=7166
20 60 100
Tilian=6873
0
10
20
Pro
porti
onof
vess
els
(%)
20 60 100
Carpinusn=8806
20 60 100
Vessel diameter classes (µm)
Fraxinusn=5194
Figure 2.2 Relative abundance of vessels in different diameter classes (class width = 5 µm) in the xylem of small-diameter roots of the five tree species. n = number of all vessels measured per species (for the number of roots examined see Table 2.1). Table 2.2). Further, the species with a thinner periderm showed a steeper increase of
the relative xylem area in the root cross-section with increasing root diameter than
the species with thicker periderm; the mean slope b of the xylem area/root cross-
section relationship was 0.78, 0.79 and 0.74 in Fagus, Carpinus and Acer but only
0.50 and 0.51 in Fraxinus and Tilia (data not shown). Thus, larger Fraxinus and Tilia
roots had a relatively small xylem area in comparison to the other species. The pith
area in the root cross-sections was small in all species (<1 %) and its neglect in the
calculation did not alter the relationship between xylem area and root cross-sectional
area in a significant manner in any of the species. However, thicker roots (>3.5 mm
in diameter) were characterized by a larger proportion of pith ray tissue in the cross-
section than smaller ones.
Hydraulic conductivity and embolism
The empirically determined specific conductivity of the roots (ks) differed more than
threefold in its mean between the species. It was highest in Fagus, Carpinus and
Tilia roots (means of 8.8 - 13.0 kg MPa-1 s-1 m-2) and significantly smaller in Acer
and Fraxinus roots (3.9 and 4.5 kg MPa-1 s-1 m-2, Table 2.2). The median values of ks
showed a slightly different picture than the means with lower values especially in
Carpinus and Fraxinus (Table 2.2). Root-specific conductivity varied by more than a
magnitude among the 48-72 roots examined per species with the variation apparently

CHAPTER 2
38
being larger in Fagus, Tilia and Carpinus roots than in Acer and Fraxinus roots (Fig.
2.3).
In all five species, a few roots had ks values that exceeded the specific
conductivity medians of the species four- to tenfold or even more; these roots were
termed “high-conductivity roots” (Table 2.2 and Fig. 2.3). While these roots did not
differ from the respective population mean in terms of root diameter and xylem area
0
10
20
30
40
50 Fagusn=71
Acern=59
0 10 20 30 40 50 60
Tilian=48
0
10
20
30
40
50
Num
bero
froo
ts
0 10 20 30 40 50 60
Carpinusn=59
0 10 20 30 40 50 60
Classes of specific conductivity (kg MPa-1 -1s-1 m )
Fraxinusn=72
Figure 2.3 Number of roots in classes of root-specific conductivity ks (class width = 5 kg MPa-1 s-1 m-1) in the five tree species. Gray bars indicate roots which were considered to be “high-conductivity roots”. n = number of roots examined per species.
0
20
40
Loss
ofro
otco
nduc
tivity
(%)
0.0 -0.1 -0.2
Carpinus
0.0 -0.1 -0.2 -0.3
Soil matrix potential (MPa)
Fraxinusr = 0.512
P < 0.01
0
20
40
60Fagusr = 0.332
P < 0.05
Acer
-0.1 -0.2 -0.3
Tilia
Figure 2.4 Percental loss of conductivity (PLC) in the xylem of small-diameter roots in relation to the soil matrix potential ΨS at 10 cm depth in the five examined tree species in summer 2008. Number of replicates: four to six trees per species with six samples per tree. For significant relationships, the coefficient of determination (r²) and the P value are given.

Hydraulic traits in roots of five tree species
39
in the cross-section, they were characterized by considerably larger mean vessel
diameters, in certain cases also by higher vessel densities (Table 2.2).
The theoretical specific conductivity as derived from the vessel diameters (kstheo)
was in all species except for Fraxinus significantly higher than the empirically
determined ks (difference not significant in Fraxinus). The mean ks values reached
only 40.4 % and 52.4 % of the respective kstheo means in Acer and Tilia, respectively,
compared to 73.2 %, 76.5 %, and 87.6 % in Fagus, Carpinus and Fraxinus (Table
2.2).
0
20
40
30 40 50 60
Fraxinusr = 0.642
P < 0.0001
0
20
40 Carpinusr = 0.692
P < 0.0001
0
20
40
Roo
tspe
cific
cond
uctiv
ityk
(kg
MP
as
m)
s-1
-1-1
Tilia, r = 0.592
P < 0.001
0
20
40 Acerr = 0.482
P < 0.001
0
20
40Fagusr = 0.822
P < 0.0001
0
10
20
30
30 40 50 60Mean vessel diameter (µm)
Fraxinusr = 0.132
P < 0.1
0
10
20
30Carpinusr = 0.322
P < 0.01
0
10
20
30
Loss
ofro
otco
nduc
tivity
(%)
Tilia0
10
20
30Acerr = 0.352
P < 0.01
0
10
20
30
40Fagusr = 0.282
P < 0.01
Figure 2.5 Dependence of root-specific conductivity ks (left) and the percental loss of conductivity (PLC) (right) on mean vessel diameter in small-diameter roots of the five species. Number of replicates: four to six trees per species with each four samples per tree. For significant relationships, the coefficient of determination (r²) and the P value are given.

CHAPTER 2
40
Repeated conductivity measurements after Sperry (1988) conducted in 48-72
roots per species in summer 2008 indicated that Fagus, Fraxinus, Acer and Carpinus
roots experienced conductivity losses (PLC) in the range of 16.2-17.8 % in this
period which were attributed to xylem embolism; the PLC mean of Tilia roots was
significantly smaller (9.3 %, Table 2.2). In Fagus and Fraxinus roots, the
conductivity loss increased with a seasonal decrease in soil matrix potential while no
dependence of PLC on ΨS was detected for the other three species (Fig. 2.4).
Surprisingly, roots with larger mean vessel diameters generally showed smaller
conductivity losses than roots with thinner vessels (Fig. 2.5: right). Such a negative
relationship was detected in Fagus, Acer, Carpinus and Fraxinus roots but was not
present in Tilia roots. We found no dependency of PLC on vessel density in the
species (data not shown).
As expected, all species showed a positive relation between mean vessel diameter
and ks, but the slope of the relation differed between the species (Fig. 2.5: left;
steepest slope in Fagus, lowest slope in Fraxinus). Vessel density had no influence
on ks in the five species (data not shown). A plot of the species means of root ks
against the cumulative surface area of the fine root system of the five species (root
area index, RAI, in square meters surface area per square meter ground area) showed
no relationship (Fig. 2.6a). Similarly, no dependence of ks on the fine root biomass of
the respective species in the soil profile to 40 cm depth was found (Fig. 2.6b).
0
5
10
15
Spec
ific
cond
uctiv
ityk
(kg
MPa
sm
)s
-1-1
-1
0 2 4
RAI (m m )2 -2
Fagus
Acer Fraxinus
TiliaCarpinus
0 100 200 300
FRB (g m )-2
Fagus
Acer Fraxinus
Tilia
Carpinus
a b
Figure 2.6 Empirically determined specific conductivity ks of the xylem of small-diameter roots in relation to the root area index RAI (a) and the fine root biomass FRB in 0-20 cm (b) of the species in monospecific patches. Data of root area index and fine root biomass are means of four monospecific plots per species, studied by Jacob et al. (submitted).

Hydraulic traits in roots of five tree species
41
Discussion
Relationship between root anatomy and hydraulic conductivity
The first hypothesis of our study regarding the positive relation between root axial
hydraulic conductivity and vessel diameter was confirmed for all five species. Mean
vessel diameter d was the main determinant of root-specific conductivity and ks
increased exponentially with increasing d, but the slope differed between the species.
We found no dependence of ks on vessel density in the root xylem which is contrary
to the results reported by Tyree and Ewers (1991), Cruiziat et al. (2002) and Tyree
and Zimmermann (2002) for the hydraulic system in trunk and branches. The lack of
a vessel density effect in our study can partly be explained by the negative relation
between mean vessel diameter and vessel density in the roots of three of the five
species (Fagus, Acer and Tilia, data not shown).
The five investigated species differed markedly in root-specific conductivity due
to species differences in mean vessel diameter and also in the relative size of the
xylem area in the root (Table 2.2). The small-diameter roots of Fagus had on average
a three times larger empirically determined ks than Fraxinus roots, even though they
were collected in the same soil volume. For theoretical specific conductivity (kstheo),
the species differences were even larger.
From earlier studies in the Hainich forest on leaf water status and stomatal
regulation in mature trees of the five species, we had expected that the more drought-
tolerant species should possess smaller mean vessel diameters in the roots than the
more sensitive ones in order to avoid root embolism. Tolerant Fraxinus indeed had
relatively small and sensitive Fagus large-vessel diameters, but the other three
species differed only little with respect to d and ks. This invariance in ks partly
matches with only relatively small differences in reported drought sensitivity of the
three species at the shoot level (Köcher et al. 2009).
Contrary to our expectation, we observed no ring-porous xylem anatomy in the
roots of Fraxinus which characterizes the stem xylem. This species with small
conduits in the root xylem and large vessels in the ring-porous stem xylem is
evidence for the fact that xylem anatomy can be highly variable along the flow path
within a tree. The small conduits in the roots may illustrate the functional role fine
roots probably are playing in reducing the embolism risk in proximity to the organs
of plant water uptake.

CHAPTER 2
42
Several factors should determine how much axial conductivity is developed in
the xylem of a root, including the water availability in the explored soil volume, the
water demand of the canopy and root biomass (or the total cross-sectional area of the
root system). A hint on inter-relationships between root hydraulic properties, total
root mass, and tree water consumption can be drawn from Figure 2.6. Fraxinus with
a relatively small leaf area index compared to the other co-occurring species
(Hölscher et al. 2004) produced roots with a small axial conductivity but maintained
a relatively large fine root biomass. In contrast, the fine root biomass of Fagus was
not different from that of Fraxinus but was linked to a much higher root conductivity
which meets a higher leaf area index and therefore an elevated demand for water in
the canopy. In this comparison, Carpinus and Tilia take an intermediate position,
while the low root axial conductivity of Acer in combination with a relatively small
fine root biomass was possibly balanced by a small variation in leaf water potential
and effective leaf conductance regulation.
However, the available data on root mass and water consumption are not
sufficient to conclude on the possible interplay of root morphology, physiology, and
whole-tree water use in this forest.
Species differences in apparent root embolism
We estimated the degree of native embolism in the root xylem on several dates in
late summer under a range of soil matrix potentials in the topsoil varying between -
0.09 and -0.24 MPa. From the c. 60-70 measurements per species, we obtained
several results that do not fit into the existing picture of xylem embolism in broad-
leaved trees and its assumed control by biotic and abiotic factors.
First, the observed soil moisture dependence of root embolism was remarkably
small. Only two of the five species (Fagus and Fraxinus) showed the expected
increase in the percental loss of conductivity with decreasing soil matrix potential
while the other three species developed conductivity losses up to 45 % in apparent
independence from soil moisture availability.
A possible explanation for the lacking relationship between apparent root
embolism and soil moisture in some species is rapid embolism repair under elevated
root water potentials during the night (Zwieniecki & Holbrook 1998) which might
decouple the embolism status from the soil moisture regime. In fact, measurements
in Fraxinus, Carpinus and Acer trees in summer 2006 showed that the pre-dawn leaf

Hydraulic traits in roots of five tree species
43
water potential (Ψpd) remained favorable in these species even in dry spells (Köcher
et al. 2009) indicating that the root water potential may have been high enough to
allow for continuous embolism reversal during the summer. However, embolism
repair should be more problematic in larger vessels since the minimum pressure
required for dissolving air bubbles in the xylem fluid increases with conduit diameter
according to Henry’s law (Tyree and Yang 1992). Fagus had not only the largest
mean vessel diameter in its roots but also showed a larger decrease in Ψpd and in the
daily leaf water potential minima during summer drought than the other species
(Köcher et al. 2009) which must further complicate embolism repair in the roots of
this species. These hydraulic characteristics may explain why the PLC values
increased with a decrease in soil matrix potential in Fagus. A possible alternative
explanation for the lacking PLC – soil moisture relation in three species could be the
rather mild drought stress experienced in summer 2008 (soil water potential minima
of only -0.24 MPa in the study period) which might have been too low to induce root
embolism. However, Rewald (2008) measured PLC50 values in small-diameter roots
(1-3 mm) of Fagus of -0.4 MPa (air pressure applied) which is much higher (less
negative) than PLC50 values reported in the shoots of Fagus (-2 MPa, Cochard et al.
1999) indicating a higher cavitation sensitivity of fine roots. Thus, it is likely that soil
water potentials of -0.24 MPa were low enough to induce a certain degree of
embolism in Fagus roots.
Second, the significant negative relationship between vessel size and embolism
observed in this study contradicts the findings reported in the literature that species
with wider vessels tend to be more vulnerable to cavitation (e.g., Hargrave et al.
1994; Cai and Tyree 2010). Fraxinus roots showed the largest measured conductivity
losses of all species (on average by 19 %) despite small vessel diameters. In this
species, the loss of root conductivity may have been compensated by the species’
relatively large fine root biomass enabling Fraxinus to tolerate large leaf water
potential amplitudes while maintaining constant sap flow rates even in dry summer
periods (Köcher et al. 2009). However, recent studies (e.g., Christman et al. 2009;
Lens et al. 2011) produced evidence that the xylem vulnerability to cavitation may be
more closely related to the inter-vessel pit structure than to vessel diameter. Already
Zimmermann (1983) assumed that the vulnerability to cavitation caused by air-
seeding is primarily dependent on the properties of the inter-vessel walls and their
pits and the resulting capability of restricting the mass flow from one cell to another.

CHAPTER 2
44
Accordingly, it has been estimated that half of the total flow resistance in the vessel
network is located along the path through the inter-vessel pits (Wheeler et al., 2005;
Choat et al., 2008). These results underpin the need of investigating the microscopic
pit structure of the vessels for fully understanding the physical basis of the hydraulic
architecture of trees.
Evidence for the existence of high-conductivity roots
The marked left-skewed frequency distribution of the roots in terms of their specific
conductivity with a few “high-conductivity roots” is a pattern that has already been
observed in other root hydraulic studies with broad-leaved trees. For example,
Rewald (2008) identified high-conductivity roots in mature F. sylvatica and Quercus
petraea trees with up to 10-times higher ks values than the mean. In agreement with
this observation, Leuschner et al. (2004) found for Fagus, Quercus and Picea trees a
very large variability in the simultaneously measured water flow rates in different
small-diameter roots of the same species. Our anatomical data show that trees can
achieve high conductivities either by producing a few very large vessels (as in Fagus
and Acer), by increasing vessel density (as in Tilia), or by combining both strategies
(as in Carpinus). The large root morphological and functional plasticity is, at least in
part, a response to the high heterogeneity of moisture in soils, in particular in those
exposed to periodic drought (Göttlein and Manderscheid 1998). Roots or root
branches are acting as physiologically autonomous units (Shani et al. 1993) that tend
to optimize the cost/benefit ratio of root operation under variable water availabilities.
In our study, all roots investigated for ks were sampled in the topsoil at 0-10 cm
depth and thus, the differences in ks cannot be attributed to contrasting moisture
regimes in different soil layers (see, for example, Pate et al. 1995). However, the
surprising negative relationship between vessel size and percental loss of
conductivity (Fig. 2.5) may perhaps indicate that the trees had produced roots with
particularly high conductivity mainly in topsoil patches with ample water
availability. If valid, the water uptake of the root system would be optimized at a low
risk of drought-induced cavitation. Further research on the location of high
conductivity roots in soil patches of different soil moisture will be needed to test this
hypothesis.
Hydraulic traits in roots of five tree species
45
Conclusions
The five broad-leaved tree species of this study showed significant anatomical
differences in their small-diameter roots that could partly be related to the assumed
drought tolerance of the species with more drought-sensitive trees generally having
larger mean vessel diameters in their roots than tolerant species. Ring-porous
Fraxinus as the probably most drought-tolerant species of the species sample
produced a root xylem with smallest mean d and relatively low vessel density. The
resulting low specific conductivity of the roots may perhaps be related to the
relatively low canopy transpiration of this species; while in Fagus with a relatively
high water consumption, large vessels were found. However, the small-vessel
diameters of Fraxinus were not found to be advantageous with respect to the risk of
root embolism, because the measured apparent “native” root embolism did not show
the expected dependence on mean d among the five species.
By investigating many roots of the same species, we found a large intraspecific
variability in axial conductivity of roots of similar diameter, and all species produced
“high-conductivity roots” with ks values exceeding the median by factors of four to
ten or more. We conclude that (1) the hydraulic properties of small-diameter roots
differ markedly between coexisting temperate broad-leaved tree species, (2) the
functional properties of the root xylem cannot be inferred from the properties of the
stem xylem, and (3) vessel diameter is the principal determinant of root axial specific
conductivity but apparently not a good predictor of cavitation risk.
Acknowledgments We would like to thank the Hainich National Park administration
for the good cooperation and the permit to work in the forest. We also thank Nicolai
Brock for giving advice in technical details of the measurement of hydraulic
conductivity in tree roots.
Funding This study was conducted within the framework of “Graduiertenkolleg
1086” with funding received by the German Research Foundation (DFG).

CHAPTER 2
46
References
Alder N, Sperry J, Pockman W (1996) Root and stem xylem embolism, stomatal conductance, and leaf turgor in Acer grandidentatum populations along a soil moisture gradient. Oecologia 105:293-301
Cai J, Tyree MT (2010) The impact of vessel size on vulnerability curves: data and models for within-species variability in saplings of aspen, Populus tremuloides Michx. Plant Cell Environ 33:1059-1069
Choat B, Cobb AR, Jansen S (2008) Structure and function of bordered pits: new discoveries and impacts on whole-plant hydraulic function. New Phytol 177:608-626
Christman MA, Sperry JS, Adler FR (2009) Testing the ‘rare pit’ hypothesis for xylem cavitation resistance in three species of Acer. New Phytol 182:664-674
Cinnirella S, Magnani F, Saracino A, Borghetti M (2002) Response of a mature Pinus laricio plantation to a three-year restriction of water supply: structural and functional acclimation to drought. Tree Physiol 22:21-30
Cochard H, Lemoine D, Dreyer E (1999) The effects of acclimation to sunlight on the xylem vulnerability to embolism in Fagus sylvatica L. Plant Cell Environ 2:101–108
Cruiziat P, Cochard H, Améglio T (2002) Hydraulic architecture of trees: main concepts and results. Ann For Sci 59:723-752
Domec JC, Warren JM, Meinzer FC, Brooks JR, Coulombe R (2004) Native root xylem embolism and stomatal closure in stands of Douglas-fir and ponderosa pine: mitigation by hydraulic redistribution. Oecologia 141:7-16
Eamus D, Hatton T, Cook P, Colvin C (2006) Ecohydrology: vegetation function, water and resource management. CSIRO, Collingwood
Ellenberg H, Leuschner C (2010) Vegetation Mitteleuropas mit den Alpen in ökologischer, dynamischer und historischer Sicht. 6th ed. Ulmer, Stuttgart.
Gebauer T, Horna V, Leuschner C (2008) Variability in radial sap flux density patterns and sapwood area among seven co-occurring temperate broad-leaved tree species. Tree Physiol 28:1821-1830
Göttlein A, Manderscheid B (1998) Spatial heterogeneity and temporal dynamics of soil water tension in a mature Norway spruce stand. Hydrol Process 12:417-428
Guckland A, Jacob M, Flessa H, Thomas FM, Leuschner C (2009) Acidity, nutrient stocks, and organic-matter content in soils of a temperate deciduous forest with different abundance of European beech (Fagus sylvatica L.). J Plant Nutr Soil Sci 172:500-511
Hacke UG, Sperry JS, Pittermann J (2000) Drought experience and cavitation resistance in six shrubs from the Great Basin, Utah. Basic Appl Ecol 1:31-41

Hydraulic traits in roots of five tree species
47
Hargrave K, Kolb K, Ewers F, Davis S (1994) Conduit diameter and drought-induced embolism in Salvia mellifera Greene (Labiatae). New Phytol 126:695-705
Hölscher D (2004) Leaf traits and photosynthetic parameters of saplings and adult trees of co-existing species in a temperate broad-leaved forest. Basic Appl Ecol 5:163-172
Köcher P, Gebauer T, Horna V, Leuschner C (2009) Leaf water status and stem xylem flux in relation to soil drought in five temperate broad-leaved tree species with contrasting water use strategies. Ann For Sci 66:101
Lens F, Sperry JS, Christman MA, Choat B, Rabaey D, Jansen S (2011) Testing hypotheses that link wood anatomy to cavitation resistance and hydraulic conductivity in the genus Acer. New Phytol 190:709-723
Leuschner C, Coners H, Icke R (2004) In situ measurement of water absorption by fine roots of three temperate trees: species differences and differential activity of superficial and deep roots. Tree Physiol 24:1359 -1367
Leuschner C, Jungkunst HF, Fleck S (2009) Functional role of forest diversity: pros and cons of synthetic stands and across-site comparisons in established forests. Basic Appl Ecol 10:1-9
Martínez-Vilalta J, Prat E, Oliveras I, Piñol J (2002) Xylem hydraulic properties of roots and stems of nine Mediterranean woody species. Oecologia 133:19-29
Maseda PH, Fernández RJ (2006) Stay wet or else: three ways in which plants can adjust hydraulically to their environment. J Exp Bot 57:3963-3977
Passioura J (1988) Water transport in and to roots. Annu Rev Plant Phys 39:245-265
Pate JS, Jeschke WD, Aylward MJ (1995) Hydraulic architecture and xylem structure of the dimorphic root systems of South-West Australian species of Proteaceae. J Exp Bot 46:907-915
Rewald B (2008) Impact of climate change-induced drought on tree root hydraulic properties and competition belowground. PhD thesis, University of Göttingen, Germany.
Schaap MG, Leij FJ, Genuchten MT van (1998) Neural network analysis for hierarchical prediction of soil hydraulic properties. Soil Sci Soc Am J 62:847-855
Scherrer D, Bader MKF, Körner C (2011) Drought-sensitivity ranking of deciduous tree species based on thermal imaging of forest canopies. Agr Forest Meteorol 151:1632-1640
Shani U, Waisel Y, Eshel A, Xue S, Ziv G (1993) Responses to salinity of grapevine plants with split root systems. New Phytol 124:695-701

CHAPTER 2
48
Sperry JS, Adler FR, Campbell GS, Comstock JP (1998) Limitation of plant water use by rhizosphere and xylem conductance: results from a model. Plant Cell Environ 21:347–359
Sperry JS, Donnelly JR., Tyree MT (1988) A method for measuring hydraulic conductivity and embolism in xylem. Plant Cell Environ 11:35-40
Sperry JS, Hacke UG, Oren R, Comstock JP (2002) Water deficits and hydraulic limits to leaf water supply. Plant Cell Environ 25:251-263
Sperry JS, Saliendra NZ (1994) Intra- and inter-plant variation in xylem cavitation in Betula occidentalis. Plant Cell Environ 17:1233-1241
Tyree MT, Ewers FW (1991) The hydraulic architecture of trees and other woody plants. New Phytol 119:345–360
Tyree MT, Yang S (1992) Hydraulic conductivity recovery versus water pressure in xylem of Acer saccharum. Plant Physiol 100:669-676
Tyree MT, Zimmermann MH (2002) Xylem structure and the ascent of sap. Springer, Berlin
van Genuchten MT (1980) A closed-form equation for predicting the hydraulic conductivity of unsaturated soils. Soil Sci Soc Am J 44:892–898
Wheeler JK, Sperry JS, Hacke UG, Hoang N (2005) Inter-vessel pitting and cavitation in woody Rosaceae and other vesselled plants: a basis for a safety versus efficiency trade-off in xylem transport. Plant Cell Environ 28:800-812
Zimmermann MH (1983) Xylem structure and the ascent of sap. Springer, Berlin
Zwieniecki MA, Holbrook NM (1998) Diurnal variation in xylem hydraulic conductivity in white ash (Fraxinus americana L.), red maple (Acer rubrum L.) and red spruce (Picea rubens Sarg.). Plant Cell Environ 21:1173-1180


Chapter 3
Stem water storage in five coexisting temperate broad-leaved tree species: significance, temporal
dynamics and dependence on tree functional traits
Paul Köcher · Viviana Horna · Christoph Leuschner
Published in
Tree Physiology 2013, 33:817–832
DOI: 10.1093/treephys/tpt055

CHAPTER 3
52
Summary
The functional role of internal water storage is increasingly well understood in
tropical trees and conifers, while temperate broad-leaved trees have only rarely been
studied. We examined the magnitude and dynamics of the use of stem water reserves
for transpiration in five coexisting temperate broad-leaved trees with largely different
morphology and physiology (genera Fagus, Fraxinus, Tilia, Carpinus and Acer). We
expected that differences in water storage patterns would mostly reflect species
differences in wood anatomy (ring vs. diffuse-porous) and wood density. Sap flux
density was recorded synchronously at five positions along the root-to-branch flow
path of mature trees (roots, three stem positions and branches) with high temporal
resolution (2 min) and related to stem radius changes recorded with electronic point
dendrometers. The daily amount of stored stem water withdrawn for transpiration
was estimated by comparing the integrated flow at stem base and stem top. The
temporal coincidence of flows at different positions and apparent time lags were
examined by cross-correlation analysis. Our results confirm that internal water stores
play an important role in the four diffuse-porous species with estimated 5–12 kg
day−1 being withdrawn on average in 25–28 m tall trees representing 10–22% of daily
transpiration; in contrast, only 0.5–2.0 kg day−1 was withdrawn in ring-porous
Fraxinus. Wood density had a large influence on storage; sapwood area (diffuse- vs.
ring-porous) may be another influential factor but its effect was not significant.
Across the five species, the length of the time lag in flow at stem top and stem base
was positively related to the size of stem storage. The stem stores were mostly
exhausted when the soil matrix potential dropped below −0.1 MPa and daily mean
vapor pressure deficit exceeded 3–5 hPa. We conclude that stem storage is an
important factor improving the water balance of diffuse-porous temperate broad-
leaved trees in moist periods, while it may be of low relevance in dry periods and in
ring-porous species.
Key words: Acer pseudoplatanus, Carpinus betulus, diffuse-porous, electronic
dendrometers, Fagus sylvatica, Fraxinus excelsior, ring-porous, sap flux
measurement, time lag of flow, Tilia cordata.

Stem water storage in five tree species
53
Introduction
The water status of plants is primarily determined by the water status of the soil and
the atmosphere. However, plants have developed several mechanisms of internal
water flux regulation that partially uncouple plant water status from atmospheric and
soil hydrological control. These mechanisms are closely linked to morphological and
physiological traits (Zweifel et al. 2002) and thus vary with plant size, species and
plant functional type. During the last three decades, much progress has been made in
our understanding of plant internal water storage and hydraulic capacitance and their
importance for daily and seasonal transpiration (e.g., Waring et al. 1979, Čermák et
al. 1982, 1984, 2007, Schulze et al. 1985, Holbrook 1995, Goldstein et al. 1998,
Phillips et al. 2003, Meinzer et al. 2004, Scholz et al. 2007, 2008). It becomes
increasingly evident that the water transpired by a tree during the day is not only
extracted from the soil but that water stored in the roots, trunks, branches and leaves
can also serve as transient or intermediate source for transpiration (Scholz et al.
2011). How important these internal sources are, depends on tree size, wood anatomy
and sapwood dimensions (Schulze et al. 1985), and also on environmental conditions
(Loustau et al. 1996). Despite this evidence, some authors concluded for a number of
woody plants that the amount of transpired water originating from internal stores is
not significant (Tyree and Yang 1990) or is only relevant in plants with inherently
low transpiration rates (Holbrook 1995). Apart from this discussion on the
quantitative importance of internal storage, it has been suggested that stored water in
woody plants may play an important role by temporarily replacing water lost by
transpiration, thereby transiently improving leaf water status which may enable the
plant to maintain stomatal opening and carbon assimilation (Waring et al. 1979,
Čermák et al. 1982, 1984, 2007, Goldstein et al. 1984, 1998, Borchert 1994, Phillips
et al. 2003, Scholz et al. 2008).
In trees, stems and branches, as well as roots and leaves, can store water.
Whether stored water may meet transpiration demands for considerable periods of
time depends not only on the size of the storing compartments but also on the flow
resistances between storage tissues and xylem (Waring and Running 1978). It is
assumed that at least the initial water transpired in the crown after dawn is supplied
in part from internal water stores. In large trees, withdrawal of stem water may cause
a considerable apparent lag period between the fluctuation of transpiration and that
of sap flow near the stem base (Andrade et al. 1998). Later in the afternoon, the

CHAPTER 3
54
storage will be replenished when stem sap flow typically exceeds water flow through
the crown (Goldstein et al. 1998, Phillips et al. 2003). Consequently, one approach of
estimating the amount of stored water in trees is to compare the integrated values of
stem base and crown sap flow on a 24-h basis (Goldstein et al. 1998, Phillips et al.
2003, Meinzer et al. 2004).
Stored water in plants can be expressed as water storage capacity (amount of
available water contained in a tissue or plant, with the unit kg) and hydraulic
capacitance (C, i.e., the ratio of change in tissue water volume to change in its water
potential, C = ΔW/ΔΨ, with the unit kg MPa−1, Phillips et al. 2009, Scholz et al.
2011). The focus of this paper is on water storage capacity and the daily use of stored
water. Estimates of tree water storage as percentage of total daily transpiration vary
over a broad range from <10 to over 50% (Waring et al. 1979, Goldstein et al. 1998,
Phillips et al. 2003, Meinzer et al. 2004, Betsch et al. 2011), but normally do not
exceed 30% of daily water use (Meinzer et al. 2008). It has been shown that the use
of stored water for daily transpiration scales with tree trunk length and sapwood
cross-sectional area, independent of species (Goldstein et al. 1998, Phillips et al.
2003, Meinzer et al. 2004). Because wood density is a major determinant of
hydraulic capacitance and both factors are inversely related, tree species with softer
wood can store and utilize more water when transpiration requirements are high, than
species with hard wood (Stratton et al. 2000, Meinzer et al. 2004, Pratt et al. 2007,
Scholz et al. 2007). This indicates that the functional significance of water storage
should differ not only between the major tree groups of conifers and broad-leaved
trees (hardwoods), but also among tree species within these groups when their wood
density, hydraulic architecture and strategies of water status regulation are markedly
different. Species-rich temperate broad-leaved forests in Europe and eastern North
America can harbor a remarkable functional diversity of tree species that differ with
respect to wood density (<0.3 to >1 g cm−3), wood anatomy (diffuse- vs. ring-porous
trees and variable vessel dimensions), drought tolerance and isohydric or anisohydric
behavior (Ewers et al. 2007, Taneda and Sperry 2008, Chave et al. 2009, Köcher et
al. 2009, 2012a). However, only few studies have searched for differences in plant
internal water storage among different temperate tree species (e.g., Čermák et al.
1982, Steppe and Lemeur 2007, Betsch et al. 2011); most studies on plant water
storage concentrated on tropical and coniferous trees.
Stem water storage in five tree species
55
Water storage in trees and its fluctuation over time is associated with the
reversible change in the radial dimensions of stems and branches, which reflect the
use and refilling of the internal stores (Garnier and Berger 1986, Irvine and Grace
1997, Zweifel et al. 2001, Perämäki et al. 2005). For example, Scholz et al. (2008)
could show the importance of outer parenchyma and sapwood tissues as storage
compartments in six woody species of the Brazilian savanna; both tissues accounted
for 16–31% of the transpired water during the day. These authors also demonstrated
the importance of seasonal change for internal water storage. During the wet season,
the store was regularly fully replenished and stem diameter recovered overnight. In
contrast, during the dry period, a gradual decline in the stem’s daily maximum
diameter occurred over several consecutive days, indicating incomplete overnight
rehydration. Thus, stem radial changes may serve as an indicator for diurnal and
seasonal dynamics of the utilization and recharge of stored water and also for current
plant water status.
The objective of this study was to examine the magnitude and dynamics of the
use of stem water reserves in five coexisting temperate broad-leaved trees with
largely different morphology and physiology (genera Fagus, Fraxinus, Tilia,
Carpinus and Acer). These tree species are common and widespread in Central
Europe and known to differ in drought sensitivity (insensitive to moderately
sensitive), xylem anatomy (diffuse-vs. ring-porous), type of mycorrhiza (ecto vs.
arbuscular) and successional status (early/mid- to late-successional) (Hölscheret al.
2002, Köcher et al. 2009, Ellenberg and Leuschner 2010). With wood densities
ranging from 0.43 (Tilia) to 0.67 g cm−3 (Carpinus), this species sample covers a
large part of the variation in wood density found in temperate broad-leaved trees
(Chave et al. 2009). Sap flux density was recorded synchronously at five positions
along the root-to-branch flow path of mature trees (roots, three stem positions and
branches) with high temporal resolution (2 min) and related to diurnal stem radius
fluctuations monitored with electronic point dendrometers. By selecting mature trees
of roughly similar size (25–28 m tall) and diameter at breast height (DBH, 35–50
cm) that grew in close neighborhood to each other in a mixed stand and occupied
similar positions in the canopy, we minimized the influence of tree size and of
variable environmental conditions on internal water storage (Scholz et al. 2011). We
thus expected that differences in water storage patterns should mostly reflect species
differences in wood anatomy, hydraulic architecture or other traits. We hypothesized

CHAPTER 3
56
that (i) in diffuse-porous species, the amount of stored water used for transpiration
decreases with increasing wood density, (ii) ring-porous Fraxinus uses smaller
amounts than all investigated diffuse-porous species due to its small sapwood area,
(iii) the amount of stored water used for daily transpiration decreases with decreasing
soil water availability and increasing stem water deficit (SWD), (iv) sap flux density
fluctuations observed in sunlit upper canopy branches are registered in the stem top,
stem base and finally the roots with increasing apparent time lags and (v) species
with a greater use of stored water show larger time lags between stem top and stem
base flow peaks.
Materials and methods
Study site and tree species
The study was conducted in summer 2009 in a species-rich temperate broad-leaved
forest in Hainich National Park in western Thuringia, Central Germany (51°04′N,
10°30′E), where five or more tree species of the genera Fagus, Tilia, Carpinus,
Fraxinus and Acer are co-occurring. The mixed forests are mostly belonging to the
Stellario-Carpinetum community (oak– hornbeam forests).
Luvisol is the dominant soil type, which developed from loess and which covers
Triassic limestone as bedrock (Guckland et al. 2009). The mean annual temperature
of the site is 7.5 °C, the mean annual precipitation is 590 mm (1973–2004,
DeutscherWetterdienst, 2005). Mean tree height varies between 27.9 m in the denser
part of the forest (614 stems ha−1) and 32.9 m in the less dense forest area (392 stems
ha−1) (Gebauer et al. 2008). The average stand age of the canopy trees varies between
90 and 120 years (Schmidt et al. 2009).
The present study was conducted with the five most abundant broad-leaved tree
species of the Hainich forest, i.e., sycamore maple (Acer pseudoplatanus L.),
European beech (Fagus sylvatica L.), European ash (Fraxinus excelsior L.),
European hornbeam (Carpinus betulus L.) and little-leaf linden (Tilia cordata Mill.)
that differ considerably in functional traits (Table 3.1). The species represent either
early- to mid-successional, or mid- to late- and late-successional trees with
contrasting light requirements and canopy transmissivity, and they vary in terms of
hydraulic properties, drought tolerance and type of mycorrhiza. Two individuals per
species (Acer: one) with stand-representative height and stem diameters were
selected for continuous xylem sap flux and stem radius monitoring. All trees were
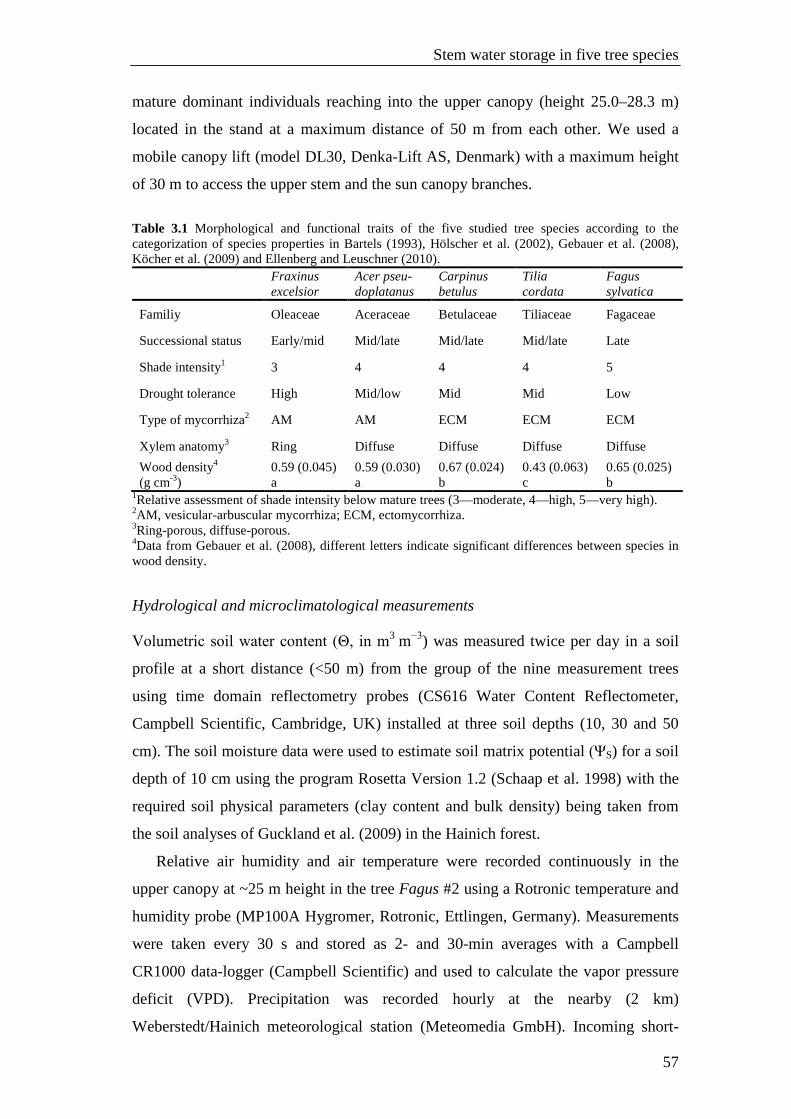
Stem water storage in five tree species
57
mature dominant individuals reaching into the upper canopy (height 25.0–28.3 m)
located in the stand at a maximum distance of 50 m from each other. We used a
mobile canopy lift (model DL30, Denka-Lift AS, Denmark) with a maximum height
of 30 m to access the upper stem and the sun canopy branches.
Table 3.1 Morphological and functional traits of the five studied tree species according to the categorization of species properties in Bartels (1993), Hölscher et al. (2002), Gebauer et al. (2008), Köcher et al. (2009) and Ellenberg and Leuschner (2010).
Fraxinus excelsior
Acer pseu- doplatanus
Carpinus betulus
Tilia cordata
Fagus sylvatica
Familiy Oleaceae Aceraceae Betulaceae Tiliaceae Fagaceae
Successional status Early/mid Mid/late Mid/late Mid/late Late
Shade intensity1 3 4 4 4 5
Drought tolerance High Mid/low Mid Mid Low
Type of mycorrhiza2 AM AM ECM ECM ECM
Xylem anatomy3 Ring Diffuse Diffuse Diffuse Diffuse Wood density4
(g cm-3) 0.59 (0.045) a
0.59 (0.030) a
0.67 (0.024) b
0.43 (0.063) c
0.65 (0.025) b
1Relative assessment of shade intensity below mature trees (3—moderate, 4—high, 5—very high). 2AM, vesicular-arbuscular mycorrhiza; ECM, ectomycorrhiza. 3Ring-porous, diffuse-porous. 4Data from Gebauer et al. (2008), different letters indicate significant differences between species in wood density.
Hydrological and microclimatological measurements
Volumetric soil water content (Θ, in m3 m−3) was measured twice per day in a soil
profile at a short distance (<50 m) from the group of the nine measurement trees
using time domain reflectometry probes (CS616 Water Content Reflectometer,
Campbell Scientific, Cambridge, UK) installed at three soil depths (10, 30 and 50
cm). The soil moisture data were used to estimate soil matrix potential (ΨS) for a soil
depth of 10 cm using the program Rosetta Version 1.2 (Schaap et al. 1998) with the
required soil physical parameters (clay content and bulk density) being taken from
the soil analyses of Guckland et al. (2009) in the Hainich forest.
Relative air humidity and air temperature were recorded continuously in the
upper canopy at ~25 m height in the tree Fagus #2 using a Rotronic temperature and
humidity probe (MP100A Hygromer, Rotronic, Ettlingen, Germany). Measurements
were taken every 30 s and stored as 2- and 30-min averages with a Campbell
CR1000 data-logger (Campbell Scientific) and used to calculate the vapor pressure
deficit (VPD). Precipitation was recorded hourly at the nearby (2 km)
Weberstedt/Hainich meteorological station (Meteomedia GmbH). Incoming short-

CHAPTER 3
58
wave radiation was recorded with a pyranometer (Campbell CS300, Campbell
Scientific) at 2- and 10-min resolution, installed on a 45-m-high tower about 2 km
distant to the study site. All diurnal measurements are based on solar time which is
80 min behind Central European Summer Time.
Sap flux measurements
In the nine trees from five species, sap flux density was measured simultaneously at
five different positions of the root-to-leaf flow path of the trees during the period 15
August to 13 September 2009, using two different flux measurement approaches.
Roots and sunlit upper canopy branches of ~10 mm in diameter (range: 9–14 mm)
were equipped with miniature sap flow gauges, which measure sap flow rates by
means of the constant power heat-balance method with external heating of root and
branch segments according to Sakuratani (1981), Senock and Leuschner (1999) and
Coners and Leuschner (2002). The sap flux density in stem xylem was recorded at
three positions on the stem with Granier-type heat-dissipation probes (Granier 1987),
i.e., at the stem base (ca. 10 cm above ground), at breast height (1.3 m height) and at
the stem top (ca. 1 m below the insertion of the main canopy branches). The height
of the sensor at the stem top (crown base) differed considerably between the trees
ranging from 5.5 to 16.2 m (Table 3.3).
The self-manufactured miniature sap flow gauges consisted of two pairs of
thermocouples and a thermopile embedded in a flexible cork-neoprene jacket that
ensured good contact to the root or branch surface. A Kapton film resistance heater
(Heater Designs Inc., Bloomington, CA, USA) was placed between the thermocouple
junctions and supplied with a constant power of 0.04–0.07 W to heat the segment.
The axial dissipation of heat was monitored by the thermocouples and the radial by
the thermopile. From these fluxes and the known energy input, the heat balance of
the system is solved for the amount of heat transported with flowing water in axial
direction (for details see Coners and Leuschner 2002). The heat flow (in J h−1 per
segment) is then converted with the gauge heat conductance (Kg) and the heat
capacity of water (4187 J kg−1 K−1) to mass flow rates (in g h−1). Kg was recalculated
daily at conditions of zero flow which was assumed to occur before dawn. These
calculations were performed with a graphical interactive software tool developed by
H. Coners (unpublished data).

Stem water storage in five tree species
59
Each tree was equipped with four miniature gauges, two mounted on roots and
two on canopy branches. The gauges were insulated with thick layers of
polyurethane foam that was fixed with a metal clip. For installing the root gauges, we
dug small soil pits in the stem vicinity to search for suitable 10-mm roots with
straight and non-branched morphology. By tracing the roots back to a major root, the
species identity was ensured. Roots suitable for measurement were found mostly in
5–20-cm soil depth. After gauge installation, the small soil pits were covered with
wooden plates to minimize thermal gradients and prevent disturbance. The gauges
were mounted in a similar manner on sunlit upper canopy branches using the lifter
for access, but the gauges were additionally insulated with polyurethane tubes,
wrapped around the gauge and branch and enclosed in a reflecting aluminum foil to
minimize thermal gradients across the measuring point.
Granier-type sensors were mounted at the stem base, breast height and stem top
(crown base) to monitor sap flux density in the outer 20 mm of the stem xylem. The
Granier system consisted of two probes inserted into the wood ca. 15 cm apart
axially. We used 20-mm-long probes for all trees except for the ring-porous Fraxinus
trees, which were equipped with shorter (10 mm long) probes to account for the
smaller sapwood depth in this species. The upper probe was constantly heated with a
power of 200 mW, while the lower one served for monitoring the reference
temperature of the stem. The temperature difference between the heated and the
reference probe was recorded continuously and related to the daily maximum
temperature difference observed at predawn when minimum or no flow occurred.
Sap flux density (Js, in g m−2 s−1, see Table 3.4 in the Appendix) was calculated
according to the empirical equation given by Granier (1987). All 27 stem sensors
were insulated with polystyrene mats to keep off stem runoff and to minimize
measuring errors due to external thermal gradients.
The sensor signals from the Granier-type sensors and the miniature gauges were
recorded every 30 s and stored as 2- and 30-min averages with a CR1000 data-logger
(Campbell Scientific). Owing to a technical problem, we were able to collect data
with a resolution of 2 min only for the period from 28 August to 13 September 2009.
Recording of stem radius variation and calculation of tree water deficit
All nine trees were equipped with spring-loaded linear displacement potentiometers
(model MMR 10_11 R5K, MEGATRON Elektronik, Munich, Germany) with a
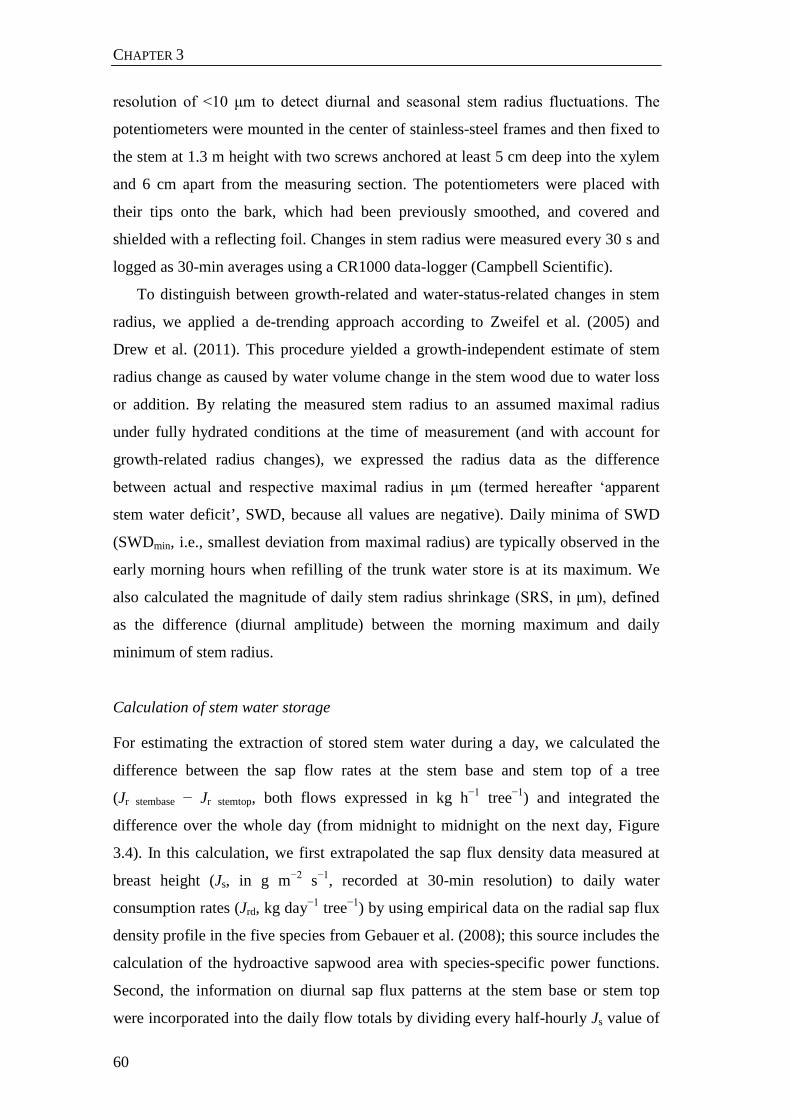
CHAPTER 3
60
resolution of <10 μm to detect diurnal and seasonal stem radius fluctuations. The
potentiometers were mounted in the center of stainless-steel frames and then fixed to
the stem at 1.3 m height with two screws anchored at least 5 cm deep into the xylem
and 6 cm apart from the measuring section. The potentiometers were placed with
their tips onto the bark, which had been previously smoothed, and covered and
shielded with a reflecting foil. Changes in stem radius were measured every 30 s and
logged as 30-min averages using a CR1000 data-logger (Campbell Scientific).
To distinguish between growth-related and water-status-related changes in stem
radius, we applied a de-trending approach according to Zweifel et al. (2005) and
Drew et al. (2011). This procedure yielded a growth-independent estimate of stem
radius change as caused by water volume change in the stem wood due to water loss
or addition. By relating the measured stem radius to an assumed maximal radius
under fully hydrated conditions at the time of measurement (and with account for
growth-related radius changes), we expressed the radius data as the difference
between actual and respective maximal radius in μm (termed hereafter ‘apparent
stem water deficit’, SWD, because all values are negative). Daily minima of SWD
(SWDmin, i.e., smallest deviation from maximal radius) are typically observed in the
early morning hours when refilling of the trunk water store is at its maximum. We
also calculated the magnitude of daily stem radius shrinkage (SRS, in μm), defined
as the difference (diurnal amplitude) between the morning maximum and daily
minimum of stem radius.
Calculation of stem water storage
For estimating the extraction of stored stem water during a day, we calculated the
difference between the sap flow rates at the stem base and stem top of a tree
(Jr stembase − Jr stemtop, both flows expressed in kg h−1 tree−1) and integrated the
difference over the whole day (from midnight to midnight on the next day, Figure
3.4). In this calculation, we first extrapolated the sap flux density data measured at
breast height (Js, in g m−2 s−1, recorded at 30-min resolution) to daily water
consumption rates (Jrd, kg day−1 tree−1) by using empirical data on the radial sap flux
density profile in the five species from Gebauer et al. (2008); this source includes the
calculation of the hydroactive sapwood area with species-specific power functions.
Second, the information on diurnal sap flux patterns at the stem base or stem top
were incorporated into the daily flow totals by dividing every half-hourly Js value of

Stem water storage in five tree species
61
a given day by the respective daily Js total at stem base or top, yielding half-hourly
flows as a fraction of daily flow. These fractional flow rates were subsequently
multiplied by the daily flow total calculated for the stem at breast height assuming
that the stem store is completely refilled overnight and total daily flow at base and
top are thus equal. Half-hourly flows into (positive values, refilling) or out of the
stem store (negative values, withdrawal) were then obtained by calculating the
difference in flow rate between stem base and top over the day. Adding up all
negative values over a day gives an estimate of the daily use of stored stem water (Sd,
in kg day−1 tree−1). The daily use of stored stem water was further expressed in
percent of the tree’s daily total water use (Sd relative) and in relation to bole volume
(as calculated from the stem dimensions between stem base and top, Sd bole, in kg
m−3 day−1).
The procedure described assumes complete refilling of the stem store by dawn
which, however, may not occur every night. Our dendrometer data indicate the
development of longer-lasting SWDs in most of the trees. In several cases, the
deficits persisted until the end of the study period when plenty of rain refilled the
store (see Figures 3.1c and 3.7). Therefore, we extended the daily approach to a
measuring period of 24 days (21 August–13 September 2009), assuming equality of
water inflow and outflow only at the end of this period. In this case, we multiplied
the half-hourly fractional flows (in this approach calculated in relation to the entire
24-day period) by the total water consumption in this period, thus taking possible lag
phases in the refilling of the stem water store into account. As a consequence, the
calculated daily flows into and out of the store did not necessarily match at the end of
a day, and the consecutive days showed either positive (refilling) or negative (loss)
daily totals of water exchange with the store. The ratio of the daily sap flow rate at
the stem base and the stem top (Jrd stembase 24-day/Jrd stemtop 24-day), calculated in the 24-
day analysis, expresses whether water is added to (ratio >1) or withdrawn from
(ratio <1) the store during a day.
Data analysis
Basic statistics (arithmetic means and standard errors) were calculated with
Microsoft Office Excel 2003 software. Regression analyses were conducted with the
program Xact 7.20g (SciLab GmbH, Hamburg, Germany). Cross-correlation
analyses for determining apparent time lags in sap flux density between different

CHAPTER 3
62
measuring points along the flow path (root-to-branch) were conducted with SAS
software, version 9.1 (SAS Institute Inc., Cary, NC, USA) using the arima procedure.
Sap flux density time series with 2-min resolution from the different measuring
positions for the period from 28 August to 13 September 2009, normalized by the
daily flux density maximum (Jsn), were shifted along the time axis until the highest
coefficient of determination with respect to congruency in temporal flux density
variation was found among the curves.
Results
Microclimatic conditions and soil moisture status in the measuring period
While the study year 2009 was relatively warm (8.7 °C) and wet (774 mm) compared
with the long-term averages (7.5 °C and 590 mm), the study period in the second half
of the growing season (15 August to 13 September) was the driest of the whole
0
5
10
15
20
Pre
cipi
tatio
n(m
m)
-0.20
-0.15
-0.10
-0.05
ΨS
(MPa
)
16/8 20/8 24/8 28/8 1/9 5/9 9/9 13/9
Date
(c)
(b)
0
10
20
30
40
Glo
balr
adia
tion
(MJ
md
)-2
-1
0
20
40
60
80
100
RH
(%)
mea
n
(b)RH
Global radiation
Soil matrix potential
0
5
10
15
20
25
30
VPD
(hPa
)
0
5
10
15
20
25
T mea
n(°
C)
VPD T(a)
Figure 3.1 Seasonal course of (a) daily mean air temperature (Tmean) and half-hourly values of VPD, (b) mean daily relative air humidity (RHmean) and daily totals of global radiation (Itot) and (c) daily precipitation (P) and soil matrix potential (ΨS) at 10 cm soil depth from 15 August to 15 September 2009, in the Hainich forest.

Stem water storage in five tree species
63
vegetation period with soil matrix potentials at 10 cm soil depth continuously
decreasing to a minimum of −0.14 MPa (Figure 3.1c). Daily mean air temperature
(Tmean) varied between 9.2 and 23.7 °C and the VPD reached values of almost 30 hPa
on the 20th of August, which was the warmest day of the year (Figure 3.1a). Mean
daily relative humidity (RHmean) ranged between 56 and 91% and total daily global
radiation (Itot) varied between 7 and 23 MJ m−2 day−1 (Figure 3.1b).
Variation of sap flux density with species and along the root-to-branch flow path
Xylem sap flux density (Js, g m−2 s−1) showed a considerable variation among the
five coexisting tree species for a given measuring position and also between the five
measuring positions (sunlit canopy branch, stem top, stem at breast height, stem base
0
50
100
150
Sap
flux
dens
ity(g
ms
)J s
-2-1
Carpinus 2#
0
50
100
150 Fraxinus #2
0
50
100
150 Acer #1branch
stem topstem at breast height
stem baseroot
0
50
100
150 Tilia #2
0
100
200
300
6/9 7/9 8/9 9/9 10/9
Date
Fagus #1
Figure 3.2 Course of sap flux density (Js, g m−2 s−1) in tree organs over a period of 5 days (resolution 30 min) in September 2009. For every species one individual is shown. Note different scale of the y-axis in Fagus tree #1.

CHAPTER 3
64
and root) of a tree (Figure 3.2).
Calculated as mean daily sap flux
density (Jsd, g cm−2 day−1), the Tilia
trees showed the highest mean Jsd
values at DBH (1.3 m) height (90 g
cm−2 day−1), the Acer and Fraxinus
trees the lowest figures (54 and 57 g
cm−2 day−1) and Fagus and Carpinus
had intermediate values (78 and 70 g
cm−2 day−1), even though tree height
and DBH were comparable among the
species. In general, the daily means of
sap flux density (Jsd) increased in all
species from the stem base to the top.
However, much higher sap flux
densities than in the stem were recorded
in roots (~10 mm in diameter) and
sunlit canopy branches (typically 2–4
times larger values) with peak flux
densities of 1707 g cm−2 day−1
measured in a Fagus root and of 894 g
cm−2 day−1 recorded in a branch of a
Carpinus tree. Except for Acer, the
mean Jsd values were generally higher
in the roots than in the branches of
similar diameter (Figure 3.2). The ratio
of root-to-branch flux density ranged
from 0.51 in Acer to 1.25, 1.67 and 1.83
in Carpinus, Fagus and Fraxinus,
respectively and peaked with 2.07 in
Tilia.
The temporal variation of flux
density showed very similar and mostly
congruent patterns in the branches,
0.0
0.2
0.4
0.6
0.8
1.0
03:00 06:00 09:00 12:00 15:00 18:00 21:00Time
Fagus #10.0
0.2
0.4
0.6
0.8
1.0 Tilia #20.0
0.2
0.4
0.6
0.8
1.0
Nor
mal
ized
sap
flux
dens
ityJ s
n
Carpinus #2
stem top
0.0
0.2
0.4
0.6
0.8
1.0 Acer #1
branchroot
stem base
0.0
0.2
0.4
0.6
0.8
1.0 Fraxinus 2#5
10
15
VPD
(hP
a)
August 28VPD
Figure 3.3 Sap flux density on 28 August 2009, normalized to daily peak flow (Jsn) in sun-canopy branches, stem top, stem base and roots of each one tree of the five species (2-min resolution). Data of branches and roots are means of two sensors each. The diurnal course of VPD at canopy height is depicted in the top panel.

Stem water storage in five tree species
65
stems and roots of the same tree as is visible in the normalized flux data (Jsn) with
high temporal resolution (2 min) (Figure 3.3), which showed a close correlation to
the fluctuation in VPD (correlation data not shown). However, we could detect
distinct time lags in flow patterns between branches, stem and roots in a tree as they
became visible when high-resolution flux density time series from different
measuring positions in the tree were shifted along the time axis until the highest
degree of correlation was achieved (Table 3.2). In nearly all investigated trees,
largest time lags between flux density patterns were observed between branch and
stem base (>1 h in four of the nine trees), followed by considerable time lags also
between stem top and stem base and between sunlit canopy branches and stem top
(often 20–50 min, Table 3.2). The largest single time lag was measured for the
branch–stem base difference in Acer tree #1 (116 min). Surprisingly, we found only
negligible time lags between branch and root sap flux densities in most of the trees
(except for Acer) and root sap flux preceded stem sap flux in nearly all cases. Our
results also indicate distinct species differences in the length of the time lag between
peak fluxes; the ring-porous Fraxinus trees exhibited only minor time lags between
different measuring positions (maximum delay of 4 min) and the time lags in Fagus
tree #2 were also small, while much larger time lags were found in the other Fagus
tree (#1) and in Acer tree #1. Table 3.2 Time lags between normalized peak sap flux densities (Jsn) of sunlit canopy branches, stem top, stem base and roots of the nine study trees calculated for a time series of up to 24 measuring days in the period from 21 August to 13 September 2009. Sap flux data with a resolution of 2 min were used which were normalized to the daily flux peak before cross-correlation analysis. Positive time lags indicate a delay of sap flux at the lower location in the tree compared to the upper location and vice versa.
Tree Time lag between sensor locations (min) br st br sb br ro st sb st ro sb ro
Fraxinus #1 – 2 0 – – -2
Fraxinus #2 2 4 0 4 2 -2
Acer #1 68 116 58 36 -20 -52
Carpinus #1 32 82 0 28 -12 -40
Carpinus #2 2 24 2 24 -2 -28
Tilia #1 -8 24 8 44 8 -18
Tilia #2 28 86 0 40 -72 -128
Fagus #1 26 84 0 48 -38 -96
Fagus #2 -8 -8 -2 4 2 0 br, branch; st, stem top; sb, stem base; ro, root; –, missing data.

CHAPTER 3
66
Tab
le 3
.3 B
iom
etric
dat
a an
d pa
ram
eter
s cha
ract
eriz
ing
the
use
of st
ored
wat
er in
the
stud
y tre
es. S
apw
ood
area
was
cal
cula
ted
with
pow
er fu
nctio
ns ta
ken
from
G
ebau
er e
t al.
(200
8). T
he b
ole
volu
me
refe
rs to
the
volu
me
betw
een
the
flux
sens
ors a
t ste
m to
p an
d st
em b
ase
and
was
cal
cula
ted
usin
g Sm
alia
n’s e
quat
ion
for
volu
me
estim
atio
n of
logs
. Jrd
—m
ean
daily
wat
er u
se p
er tr
ee (k
g da
y−1),
S d—
mea
n da
ily a
mou
nt o
f sto
red
stem
wat
er e
xtra
cted
, eith
er e
xpre
ssed
as d
aily
tota
l (k
g da
y−1),
in p
erce
nt o
f tot
al d
aily
tree
wat
er u
se (%
) or r
elat
ed to
bol
e vo
lum
e (k
g m
−3 d
ay−1
). G
iven
are
mea
ns ±
SE.
Jrd
ave
rage
s wer
e ca
lcul
ated
from
dai
ly
valu
es o
f the
per
iod
from
15
Aug
ust–
13 S
epte
mbe
r 200
9 (n
= 3
0 da
ys).
Ow
ing
to m
issi
ng d
ata
in st
em b
ase
or st
em to
p sa
p flu
x, th
e nu
mbe
r of d
ays (
n) u
sed
to
calc
ulat
e av
erag
es o
f Sd v
arie
s bet
wee
n tre
e in
divi
dual
s.
(n)
18
26
12
22
24
30
24
28
30
S d b
ole
(k
g m
-3 d
ay-1
)
0.38
±0.0
3
0.12
±0.0
1
1.57
±0.1
7
1.54
±0.1
6
3.09
±0.1
5
6.99
±0.4
9
4.18
±0.2
4
1.44
±0.0
8
1.50
±0.1
0
S d re
lativ
e
(%)
14.5
±0.7
5.3
±0.5
22.0
±3.7
13.0
±0.9
10.5
±1.1
18.8
±0.7
14.2
±0.8
16.6
±1.0
9.6
±0.5
S d
(kg
day-1
)
1.9
9±0.
14
0.4
7±0.
06
6.6
4±0.
72
4.9
4±0.
51
5.6
0±0.
28
11.9
1±0.
84
6.7
2±0.
38
5.0
9±0.
28
4.8
6±0.
34
J rd
(kg
day-1
)
13.3
±0.5
4
9.0
±0.4
4
45.4
±3.1
2
44.0
±3.3
8
70.5
±5.0
5
65.1
±4.4
9
55.5
±3.5
1
32.0
±1.6
5
54.1
±3.9
9
Bol
e vo
lum
e (m
3 )
5.20
4.00
4.22
3.20
1.82
1.70
1.61
3.53
3.25
Hei
ght o
f se
nsor
at
stem
top
(m)
16.2
2
14.1
5
13.8
8
11.7
3
5.7
2
6.0
7
5.5
2
11.3
5
8.8
3
Sapw
ood
area
(m
2 )
0.02
67
0.02
00
0.09
81
0.06
91
0.11
39
0.08
76
0.09
45
0.09
54
0.14
25
Tree
he
ight
(m
)
28.0
5
27.5
26.8
24.9
5
26.9
28.2
5
24.2
5
28.2
28.1
5
DB
H
(cm
)
41.1
6
36.9
6
38.3
0
36.4
1
45.9
5
41.2
5
43.3
1
40.8
4
50.3
6
Tree
Frax
inus
#1
Frax
inus
#2
Acer
#1
Carp
inus
#1
Carp
inus
#2
Tilia
#1
Tilia
#2
Fagu
s #1
Fagu
s #2

Stem water storage in five tree species
67
Daily water use and the contribution of stored stem water
The daily water use (Jrd, kg day−1) of the nine studied trees as extrapolated from sap
flux measurements at breast height and flux density depth profiles ranged from 9 to
70 kg day−1 in its daily average (Table 3.3) with particularly small Jrd means (9 and
13 kg day−1) being recorded in the ring-porous Fraxinus trees. Time series analysis
of the diurnal course of sap flow at stem base and top (Jr stembase and Jr stemtop) revealed
a dynamic shift between phases of discharge and refilling of the stem water
reservoirs (Figure 3.4). Water was usually withdrawn from stem storage during the
morning hours and subsequently replaced in the afternoon and into the night as one
would expect. However, in some species (e.g., tree #1 of Acer), we observed a more
variable diel flow pattern with only a short time of water withdrawal in the morning,
inflow of water into the storage around midday during maximum transpiration and
water withdrawal again in the evening (Figure 3.4: second row).
The average amount of stored stem water that was used per day for transpiration
(Sd) ranged from 0.5 kg day−1 in Fraxinus tree #2 to 11.9 kg day−1 in Tilia #1 (Table
3.3). Trees with a higher mean daily water consumption used a higher amount of
stored water (positive relation, R2 = 0.62, P = 0.011). The water withdrawn from
stem storage accounted on average for 5.3 (Fraxinus) to 22% (Acer) of the trees’
total daily transpiration. The species contrast was even more pronounced when the
daily use of stored water was related to the stem volume relevant for storage
(between stem base and stem top, Table 3.3), with highest values of withdrawal per
volume found in the Tilia trees (4.18 and 6.99 kg m−3 day−1) and lowest in the
Fraxinus trees (0.12 and 0.38 kg m−3 day−1), while Acer, Carpinus and Fagus
showed intermediate values in the range of 1.44–3.09 kg m−3 day−1.
As expected, both daily water use (Jrd) and the daily use of stored stem water (Sd)
were positively related to mean daily VPD, but the slope of the Jrd–VPD relationship
was much steeper than that of the Sd–VPD relationship (Figure 3.5). Thus, the Sd/Jrd
ratio tended to be higher on days with low evaporative demand.
When relating the mean daily use of stored water (Sd) of the four diffuse-porous
species to the species’ wood density, we found a significant negative relation (R2 =
0.98, P < 0.01, Figure 3.6a). Fraxinus was not included in this analysis owing to its
small sapwood area. The relationship between Sd and sapwood area across the five
species was not significant (R2 = 0.43, P < 0.23, data not shown).

CHAPTER 3
68
Species that used smaller daily amounts of stored water showed on average smaller
apparent time lags between stem top and stem base flows than species with a larger
Sd (significant positive relation across the five species, R2 = 0.95, P < 0.01, Figure
3.6b).
-4
0
4
8
12
6/9 7/9 8/9 9/9 10/9
Date
Fagus #1
-0.4
0.0
0.4
0.8
1.2Fraxinus #2
-4
0
4
8
12
Sap
flow
rate
(kg
h)
J r-1
Carpinus 2#
-4
0
4
8
12Tilia 2#
-4
0
4
8
12stem base- stem top
stem top
stem base Acer #1
Figure 3.4 Diurnal course of sap flow rate (Jr, kg h−1 tree−1) at stem top (grey line) and stem base (dotted line) and time course of water withdrawal and refilling of stem reservoir (filled black area) on 5 days in September 2009 calculated as the difference between the two flows for one tree of each of the five species. Negative values indicate withdrawal of stored water and positive refilling. The thin vertical lines mark 1200 h. Note different scale of the y-axis in F. excelsior #2.
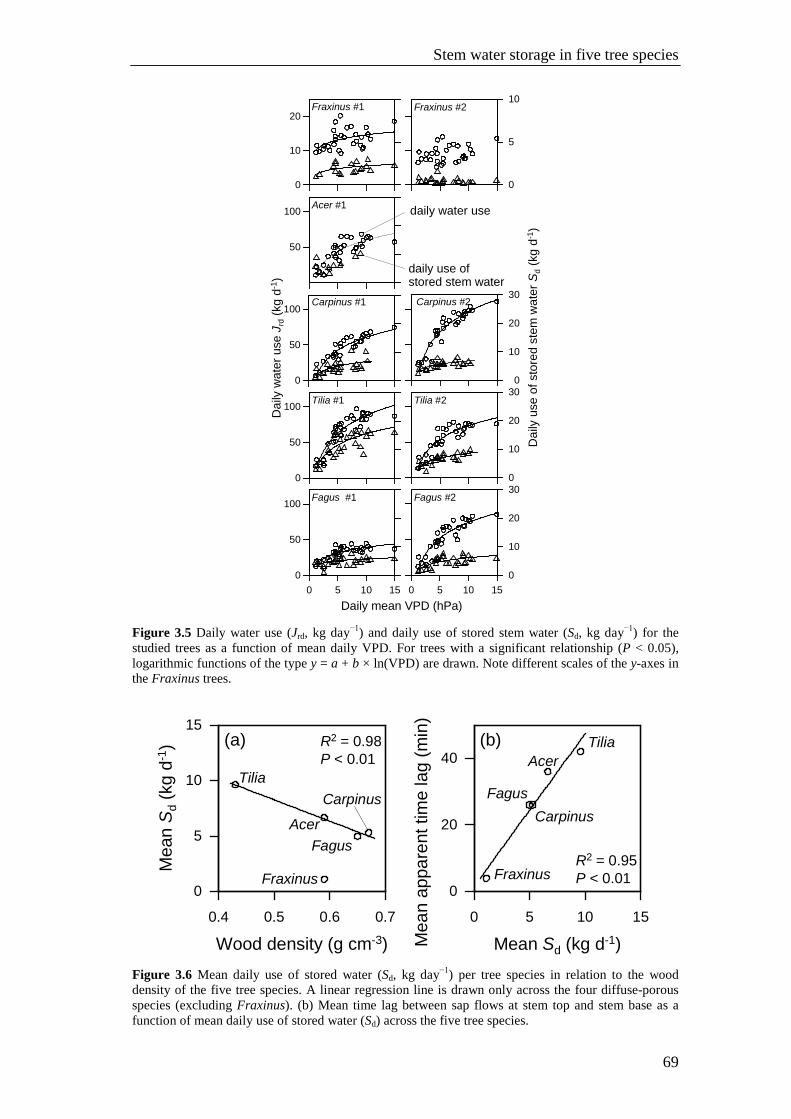
Stem water storage in five tree species
69
50
100
0
50
100
0 5 10 15Daily mean VPD (hPa)
0
10
20
30
0 5 10 15
0
10
20
0
5
10
0
50
100
Dai
lyw
ater
use
(kg
d)
J rd
-1
0
10
20
30
Dai
lyus
eof
stor
edst
emw
ater
(kg
d)
Sd
-1
0
50
100
0
10
20
30
Acer #1
Fagus #1 Fagus #2
Fraxinus #1 Fraxinus #2
Carpinus #1 Carpinus #2
Tilia #1 Tilia #2
daily water use
daily use ofstored stem water
Figure 3.5 Daily water use (Jrd, kg day−1) and daily use of stored stem water (Sd, kg day−1) for the studied trees as a function of mean daily VPD. For trees with a significant relationship (P < 0.05), logarithmic functions of the type y = a + b × ln(VPD) are drawn. Note different scales of the y-axes in the Fraxinus trees.
0
20
40
Mea
nap
pare
nttim
ela
g(m
in)
0 5 10 15
Mean (kg d )Sd-1
Fagus
Acer
Fraxinus
Tilia
Carpinus
R2 = 0.95P < 0.01
0
5
10
15
Mea
n(k
gd
)S
d-1
0.4 0.5 0.6 0.7
Wood density (g cm )-3
FagusAcer
Fraxinus
TiliaCarpinus
R2 = 0.98P < 0.01
(a) (b)
Figure 3.6 Mean daily use of stored water (Sd, kg day−1) per tree species in relation to the wood density of the five tree species. A linear regression line is drawn only across the four diffuse-porous species (excluding Fraxinus). (b) Mean time lag between sap flows at stem top and stem base as a function of mean daily use of stored water (Sd) across the five tree species.

CHAPTER 3
70
Stem radius fluctuation, apparent SWDs and seasonal change in stem water storage
During the 4-week study period in late summer 2009, we observed in all trees the
development of an apparent SWD, i.e., an increasing negative deviation of measured
stem radius from the radius at full water saturation (Figure 3.7). The negative radius
deviation was especially large in those trees which had stopped radial growth in this
period as was found for the trees Fraxinus#2, Acer #1, Carpinus#1 and Tilia#2
(growth data not shown). Stem water deficit reached values of −50 to −200 μm in
certain trees at the end of August 2009, when the soil was relatively dry, but rapidly
relaxed towards the zero line with the occurrence of rainfall around 5 September
(Figure 3.1c). The daily minimum deviation of actual stem radius from the radius at
fully hydrated conditions (SWDmin, typically measured in the early morning) showed
for all trees (except for Acer #1) a strong exponential increase with a drop in the soil
matrix potential (ΨS) at 10 cm soil depth (Figure 3.8). In the trees which showed
radial growth in this dry period (Fraxinus #1, Carpinus #2, Tilia #1 and both Fagus
trees), SWDmin started to rise rapidly beyond a ΨS threshold of approximately −0.1
MPa, whereas the other trees showed increasing SWDmin figures (negative values)
already at higher (less negative) soil matrix potentials (Figure 3.8).
Daily SRS (or the diurnal stem radius amplitude) was, in contrast to SWDmin,
more closely related to the evaporative demand showing an increase with increasing
daily mean VPD. The dependence of SRS on VPD was best described by logarithmic
functions (except for the Fraxinus trees: linear functions; data not shown).
Accordingly, the SRS maxima occurred on days with high evaporative demand (20
August 2009 and 1 September 2009) with radius amplitudes as large as 245 and 116
μm in the trees Fraxinus #1 and #2, respectively, and of 75 μm in the Tilia trees, 62
μm in Acer #1, 44 and 81 μm in Carpinus #1 and #2, respectively, and of about 45
μm in the Fagus trees (Figure 3.7). In contrast to the maxima, the average SRS
values for the study period differed only little between the tree species (range: 26.0–
36.5 μm); an exception were the Fraxinus trees with a larger mean radius amplitude
(80.6 μm).
Extraction (withdrawal and negative water flow) or addition of water to stem
storage (recharge and positive flows) on a given day depended partly on the daily
mean VPD. In five of the nine studied trees, the net daily recharge increased and the
withdrawal decreased proportionally with increasing mean VPD in the 24-day
analysis (21 August–13 September) due to higher sap flow rates at the stem base than

Stem water storage in five tree species
71
the stem top when VPD was high (see Jrd stembase 24-day/Jrd stemtop 24-day ratio, Figure 3.9);
in the other four trees, either no relationship existed or appropriate data were not
available.
0102030
VP
D(h
Pa)
16/8 20/8 24/8 28/8 1/9 5/9 9/9 13/9
Date
-50
0
Fagus #2
-50
0
Fagus #1
-100
0
Tilia #2
-100
0
Tilia #1
-50
0
Appa
rent
stem
wat
erde
ficit
SW
D(µ
m)
-50
0
Carpinus #1
Carpinus #2
-100
0
Acer #1
-200-100
0
Fraxinus #2
-200-100
0
Fraxinus #1
Figure 3.7 Course of apparent SWD (in μm; i.e., the deviation of actual radius from the respective stem radius at full hydration) in the nine studied trees from 15 August to 15 September 2009. Arrows show days where the daily SWDmin reached high values in several trees. The vertical lines enclose a period with increasing SWD in several trees and a subsequent partial recovery of SWD around the 6 of September. The bottom panel shows the course of the VPD (half-hourly values). Note different scales of the y-axes.

CHAPTER 3
72
-100
-75
-50
-25
0
-40
-20
0
-0.15 -0.1 -0.05 0
Soil matrix potential (MPa)Ψ-0.1 -0.05 0
-150
-100
-50
0
-40
-20
0
Dai
lym
inim
umst
emw
ater
defic
itSW
D(µ
m)
min
-150
-100
-50
0
Acer #1
Fagus #1R2 = 0.56P < 0.0001
Tilia #2
Fagus #2R2 = 0.25P < 0.01
Fraxinus #1R2 = 0.62P < 0.0001
Fraxinus #2R2 = 0.31P < 0.01
Carpinus #1R2 = 0.23P < 0.01
Carpinus #2R2 = 0.15P < 0.05
Tilia #1R2 = 0.60P < 0.0001
R2 = 0.26P < 0.01
Figure 3.8 Daily SWDmin (μm, morning values) of the study trees as a function of soil matrix potential (ΨS, MPa) in 10 cm soil depth. For trees with significant relationships (P < 0.05), exponential functions of the type y = a × exp(b×x) are drawn. Note different scales of the y-axes.
0
1
2
3
0 5 10 15
Daily mean VPD (hPa)0 5 10 15
0
1
2
3
Rat
ioof
J/J
rdst
emba
se24
-day
rdst
emto
p24
-day
0
1
2
3
Fagus #1
R2 = 0.71p < 0.0001
Fagus #2
Fraxinus #2
Carpinus #1 Carpinus #2
R2 = 0.75p < 0.0001
R2 = 0.86p < 0.0001
Tilia #1
R2 = 0.83p < 0.0001
Tilia #2
R2 = 0.17p < 0.05
Figure 3.9 Ratio of the daily sap flow rate at the stem base and stem top (Jrd stembase 24-day/Jrd
stemtop 24-day, calculated in the 24-day analysis, see the Materials and methods section) in its relation to mean daily VPD for seven of the nine study trees. Owing to the missing data, Acer #1 and Fraxinus #1 could not be shown. A ratio >1 indicates a net inflow of water into stem storage and a value below one net outflow. In case of significant relationships (P < 0.05), linear regression lines are drawn.

Stem water storage in five tree species
73
Discussion
Water storage in temperate broad-leaved trees
Apart from succulent plants, trees have the potential to store more water than most
other plants, because they are tall at maturity and their leaf area ratio (leaf area per
total biomass) is so small (Tyree and Yang 1990). However, for temperate broad-
leaved trees, not much is known about the relevance of internal water storage (Scholz
et al. 2011). Plants can extract internally stored water from three sources, the elastic
shrinkage of vascular tissues, capillary storage at the gas–water interface in xylem
conduits and the release via embolism resulting in the dynamic withdrawal of water
from conduits during the day (Tyree and Yang 1990, Sperry and Pockman 1993).
Trees can benefit from stored water in purely quantitative terms, i.e., by supplying
additional water to the transpiring leaves, but also qualitatively by improving the
water status of the canopy in periods of water deficits, thereby increasing carbon
assimilation and growth.
Based on synchronous sap flux measurements at the stem top and base, we
estimated for the nine trees from five species that 5–22% of daily water use was
contributed by withdrawal from stem reservoirs. These results are well within the
range given in the more extensive literature on tropical broad-leaved and coniferous
trees (<10 to over 50% of daily water use; e.g., Waring et al. 1979, Goldstein et al.
1998, Phillips et al. 2003, Meinzer et al. 2004, Čermák et al. 2007). Mature trees, 25–
28 m tall, extracted up to 12 kg water from the stem between stem base and stem top
as a daily average in a 30-day period that included both moist and moderately dry
time spans. Fagus, Acer, Tilia and Carpinus trees (but to a lesser degree Fraxinus
trees) accumulate large quantities of wood not only in the main trunk but also in the
larger branches of the canopy which may also store significant amounts of water, but
were not included in our calculation. The often low canopy base in the first four
species (Table 3.3) indicates that considerable water storage in stem and branch
wood was ignored in our study. This may also be true for roots as was found for
conifers and tropical trees (e.g., Domec et al. 2006, Scholz et al. 2008). Furthermore,
the foliage and perhaps even smaller roots may also act as intermediate water sources
that may be capable of reducing the water deficit resulting from daytime transpirative
losses (Hao et al. 2008, Scholz et al. 2011). However, in the present study, we
focused on the main trunk as it is expected to represent the largest reservoir of stored
water contributing to transpiration (Čermák et al. 2007, Betsch et al. 2011) and

CHAPTER 3
74
considered the influence of branches and roots only indirectly through their flux
dynamics in comparison with the flow in the stem.
Species differences in the use of stored water
The five species differed by about an order of magnitude in the use of stored water,
both with respect to the absolute amount extracted and the withdrawal per stem
volume. We found a decreasing use of stored water in the sequence Tilia > Carpinus,
Acer, Fagus > Fraxinus. The Tilia trees used large amounts of stored water despite a
short trunk length and thus relatively small bole volume and consequently reached
high volume-related withdrawal rates. The large stem storage in Tilia in comparison
with the other three diffuse-porous species may be a result of the about 25% lower
wood density of this species (0.43 vs. 0.59–0.67 g cm−3). According to Pratt et al.
(2007), hydraulic water capacitance increases with decreasing sapwood density. A
similar relationship is confirmed in the present study by a decrease in the use of
stored water with increasing wood density when considering only the four diffuse-
porous tree species (Figure 3.6a). Tilia with its particularly low canopy base height
(ca. 6–7 m) may store much additional water in its extensive branch system, thereby
further increasing the availability of stored water in this drought-tolerant species.
However, a greater hydraulic capacitance of the sapwood does not only increase the
amount of stored water but may also decrease cavitation resistance. Meinzer et al.
(2010) discussed a possible trade-off between hydraulic capacitance and cavitation
resistance which would allow tree species with a higher capacitance to have a less
safe, but more efficient, conducting system because stored water may help to avoid
the development of xylem water potentials that would induce cavitation.
The three diffuse-porous species Carpinus, Acer and Fagus used similar amounts
of stored water which matches with comparable wood densities, stem sapwood areas
and bole volumes in these trees (except for the Carpinus #2 tree with a low canopy
base height and smaller bole volume). Betsch et al. (2011) found the relative
contribution of stored water to vary between 1 and 50% of daily transpiration in
Fagus trees with ample water supply. Our estimates of the daily use of stored water
in Fagus are well below 20%, which probably is caused by the fact that we
investigated only the main trunk and not the whole aboveground biomass as Betsch
et al. (2011) did. These authors emphasize the importance of stored water in Fagus to
meet diurnal transpiration requirements and reduce water potential fluctuations

Stem water storage in five tree species
75
which is in accordance with our results. This should similarly be valid for Acer and
Carpinus.
The ring-porous Fraxinus trees showed a by far smaller use of stored water in
absolute terms which possibly can be attributed to the small sapwood area of this
species, since the daily use of stored water has been found to scale with sapwood
dimensions (Goldstein et al. 1998). However, this relationship was not significant in
the present study and it has to be considered that only two trees per species were
investigated. In contrast to the other species, the bole volume in Fraxinus, with a
great canopy base height, is relatively large. Fraxinus trees typically have lower
transpiration rates than the other species due to their relatively small canopy leaf area
(Hölscher 2004), and thus may require smaller amounts of stored water. The very
small amount of stored and withdrawn water per bole volume in Fraxinus is in
accordance with our low time lag estimate for this species (<4 min between branches
and stem base). Among the five studied species, Fraxinus can be classified as the
most drought-tolerant one with a distinct anisohydric strategy (Carlier et al. 1992,
Köcher et al. 2009). Fraxinus shows higher values of leaf conductance than most
other temperate trees (Besnard and Carlier 1990) and a low sensitivity of sap flow to
water shortage (Köcher et al. 2009), while it tolerates large leaf water potential
amplitudes without losing vitality (Carlier et al. 1992). Thus, large-sized highly
efficient conduits, that supply water to a relatively small leaf area, and a high
tolerance of water potential reductions, related to a small water storage capacity,
seem to combine in the anisohydric strategy of ring-porous Fraxinus.
The temporal coordination of branch, stem and root sap flux
The synchronous flow measurements showed apparent time lags in flow patterns
between the branches and stems of a tree in the range of tens of minutes to 1–2 h
(except for the Fraxinus trees and one Fagus tree). Such lags are well in the range of
values reported for a variety of woody species by Čermák et al. (1982, 1984),
Schulze et al. (1985), Loustau et al. (1996), Goldstein et al. (1998), Phillips et al.
(1999) and Zweifel and Häsler (2001). According to Čermák et al. (2007) three
factors appear to influence the length of the time lag between sap flow at different
measuring locations: first, the distance between the selected measuring points,
second, the resistance to flow within the conducting elements and third, the
dampening effect of the capacitive release of water from storage. A combination of

CHAPTER 3
76
these factors is thought to determine the apparent time lag in most plants (Čermák et
al. 2007). In our study, distance seems not to be an important factor for the observed
time lags between branches and stem base since it was similar across our trees of
comparable size, but the recorded time lags varied greatly between trees and species.
This agrees with the statement of Phillips et al. (1999) that the prediction of absolute
time lags between flows in trees as a function of tree size may be impractical in
mixed species forests. Rather, species differences in the hydraulic resistance of roots,
stems and branches and in capacitance should be more important in our sample. This
is also in accordance with the results of Verbeeck et al. (2007a), who found in Scots
pine trees strong relationships between the use of stored water and several tree traits
such as DBH, sapwood area and leaf area, but not with tree height.
Apparent time lags between the onset of transpiration in the morning and the
beginning of sap flow at the stem base and in belowground organs of a plant have
generally been attributed to the capacitive release of water from storage
compartments along the flow path (Schulze et al. 1985, Goldstein et al. 1998,
Zweifel and Häsler 2001, Perämäki et al. 2001, Steppe and Lemeur 2004). However,
there is a recent debate on the significance of absolute time lags in the onset of flows
and the consistency of measured lags with the cohesion theory of water transport in
plants (Burgess and Dawson 2008, Phillips et al. 2009). If the plant is seen as a
continuum with all parts being hydraulically connected to each other, any depletion
of a capacitor along the flow path will immediately cause a slipstream of water from
the soil or another source of water within the plant. Thus, the commencement of
flows at different points in the plant may be effectively simultaneous but hydraulic
capacitance acts to dampen the rate of the response flow. Consequently, Phillips et
al. (2009) argued that a lagged response revealed in cross-correlation analysis does
not necessarily mean that there was a time lag in the initial response between
different positions. Nevertheless, the capacitive release of stored water will lead the
stem base sap flow to peak later during the day and consequently there is a lag when
the time series are considered as a whole.
The calculated apparent time lags according to measurement at four positions
along the root-to-leaf flow path are only partly consistent as we found an increasing
sap flow phase shift with increasing path length from the tree top to the stem base,
but interestingly, the sap flow in branches and roots was nearly in phase in almost all
trees pointing to the instantaneous transfer of the transpiration signal along the flow

Stem water storage in five tree species
77
path to the roots. On the other hand, stem sap flow frequently appeared to lag
considerably behind root sap flow (Table 3.2). These apparent inconsistencies might
have several reasons.
The first explanation is related to the calculation of zero flow. Burgess and
Dawson (2008) concluded that absolute time lags between flows in different organs
have most often been registered when thermal dissipation sensors were used. In our
and most other studies, zero flow was not derived from cutting the xylem and thus it
could be erroneous. Given the small absolute flow during the onset of daily
transpiration, related measuring errors may have led to misinterpretations.
Second, we used two different types of sap flow sensors in the stem and in
branches and roots. We are aware of the limitations inherent to each type of sap flow
sensor. One may argue that the response time of the two systems could be different
(Burgess and Dawson 2008) and contrasting parts of the sap flow are measured in the
stem (only the outermost 2 cm) and in branches and roots (total flow in whole
sapwood cross-section). It is further possible that the flow in the outermost one or
two tree rings of the stem is responding more rapidly to VPD changes than can be
recorded by the Granier sensor which averages over all tree rings in the outermost 2
cm of the sapwood. Point measurements of sap flow with, for example, heat pulse
probes would be more appropriate to detect a direct response in sap flux density
within one or two annual rings (Gebauer et al. 2008). However, the root flow showed
only a minimal time lag to the branch flow (<2 min) and because both were
measured with miniature gauge systems, one must conclude that xylem tension
signals indeed seem to travel very fast from the leaf to the root in these trees as it was
also reported in tall redwood trees by Burgess and Dawson (2008). Furthermore, the
length of the negative time lag between stem flow and root flow varied greatly
among the trees and species and was zero in Fraxinus, which indicates that the
specific hydraulics, and not systematic measuring errors, must be the main cause of
the finding that root flow typically was 20 to >100 min ahead of stem flow. We
therefore assume that root- and branch-sap flow measurements conducted with
miniature sap flow gauges and stem sap flow monitored with Granier-type sensors
are not the main reason for the time lag patterns found in our trees.
Third, distal branches, the stem and small-diameter roots differ fundamentally in
the distribution of conductivity within the respective organ which may influence
capacitance and apparent time lags of flow. Upper canopy branches and shallow

CHAPTER 3
78
roots are the two parts of the tree hydraulic system that probably respond markedly
to early morning transpiration, while the stem is likely to show an integrated
response diluted by the flow in roots and branches in other parts of the canopy or the
soil and dampened by the relatively large stem capacitance. Important elements of
this complex hydraulic system were incorporated in the flow and storage model for
trees developed by Steppe et al. (2006) on the basis of an electrical analogue or a
hydraulic system approach. As an alternative, Chuang et al. (2006) attempted to
describe the hydraulic system of trees with a porous media model. Both approaches
may produce different results with respect to apparent lags in flow along the flow
path.
Relationships between daily SRS and stem water storage
All studied trees showed marked diurnal stem radius fluctuations with a continuous
radius decrease from a morning maximum (between 0600 and 0900 h) to a daily
minimum normally occurring in the late afternoon or evening (between 1500 and
2000 h). Subsequently, the stem expanded again to reach another morning maximum.
These diel changes mainly reflect variations in the water status of the stem (Daudet
et al. 2005) but may in part also be attributed to stem radial growth that primarily
occurs during night (Köcher et al. 2012b). A contrasting pattern was visible on
several rainless days of our measurement period, when VPD was high and soil water
supply progressively decreased. On these days, the recharge of stem storage
reservoirs during the night was incomplete and the stem radius remained below the
previous morning maximum.
How much water is withdrawn from the stores during the day is mainly
determined by VPD through its effect on transpiration (Verbeeck et al. 2007b).
Consequently, daily SRS was largest on days with high VPD. The refilling of the
water stores was primarily a function of soil water availability. We observed a
significant effect of a decrease in soil matrix potential (ΨS) on the extent of the daily
stem water deficit (SWDmin) in four of the five species (Figure 3.8). The ability of the
trees to refill water stores decreased rapidly below a ΨS threshold value of −0.1 MPa,
indicated by rapidly increasing (more negative) SWDmin values. Exactly the same ΨS
level was detected by Köcher et al. (2009) as a threshold for leaf water potential and
sap flux density to decline in these five species in the Hainich forest. This is evidence
in support of the physiological relevance of internal water storage in these trees.

Stem water storage in five tree species
79
For examining the immediate causes in terms of fluxes of the apparently
incomplete recharge of the stem storage as reflected in growing (more negative)
SWDmin values, we calculated in the 24-day analysis (see Materials and methods) a
rescaled stem base (Jrd stembase 24-day) and stem top (Jrd stemtop 24-day) sap flow. We
expected for days with high VPD and large SWDmin a net withdrawal of water from
the stem storage and a net recharge when VPD and SWDmin were low or decreased
from one day to another. However, no such relationship could be detected; in
contrast, the Jrd stembase 24-day/Jrd stemtop 24-day ratio rose with increasing mean daily VPD
in some of the trees or showed no relation to saturation deficit (Figure 3.9). This
finding matches with the model results of Verbeeck et al. (2007b), which show a
more complete recharge of internal storage reservoirs in Scots pine on days with high
VPD than low VPD. The increase in the Jrd stembase 24-day/Jrd stemtop 24-day ratio upon an
increase in VPD is most probably caused by stomatal closure in response to elevated
VPD; four of the five tree species show a sensitive stomatal response to VPD
according to the study of Köcher et al. (2009). If leaf conductance is reduced in
response to increasing evaporative demand in the first half of the day, transpiration is
reduced. Already existing xylem tensions at the tree top may persist and should then
result in the maintenance of flux rates at the stem base while sap flux in the canopy
already has decreased. This explanation is in accordance with the radius shrinkage
data which show largest diurnal radius reductions when VPD is high, indicating a
relatively low xylem water potential in the stem, implying a considerable flow of
water from the roots to the trunk.
Conclusions
Our results confirm that internal water stores played an important role across the five
functionally different temperate broad-leaved tree species. Given the predicted
increase in summer drought intensity in many regions of the temperate zone as a
result of climate change, it is likely that the functional importance of internal storage
in trees will increase in the future. However, considerable species differences in the
absolute and relative amounts of stored water used for transpiration seem to exist,
which are mainly determined by wood density but most probably also depend on
sapwood area (support of hypothesis #1 and 2) and probably also on wood anatomy.
The amount of stored water extracted from the stem across the five species was
positively correlated with the length of the time lag in flow at stem top and stem

CHAPTER 3
80
base. Ring-porous species may possess a smaller storage capacity in the trunk and
thus might lack significant time lags in flow along the flow path. However, the size
of the stem store has to be measured in additional ring-porous trees before more
general conclusions on the magnitude of this difference between ring- and diffuse-
porous species can be drawn. Canopy architecture and the relative size of the volume
of main trunk and canopy branches are largely different among temperate tree
species; these traits may also influence storage capacity and its distribution in the
tree.
The rapid exhaustion of the stem reservoir during periods with reduced soil
matrix potential shows that the assumed beneficial role of internal water storage is
restricted to periods with ample water supply in the diffuse-porous trees of our study
(support of hypothesis #3). In fact, a matrix potential decrease below −0.1 MPa
rapidly reduced the stem radius which indicates that the store was progressively
emptied. Moreover, the total daily withdrawal of stored water from the stem did not
increase with a VPD increase beyond ca. 3–5 hPa in all species, which implies that
the stem reservoir is rapidly exhausted already on days with a moderate evaporative
demand. It appears that internal storage plays a much weaker role during the frequent
summer drought periods in the sub-continental climate of the Hainich forest. This
suggests that internal storage should be an important trait in particular in tree species
that grow at mesic to moist sites, while other adaptations must be more decisive in
species colonizing xeric habitats. An example is Fraxinus with its low absolute
storage capacity but efficient morphological, anatomical and physiological
adaptations to drought (small leaf area, efficient conducting system and apparent
high drought tolerance at the cellular level).
The synchronous sap flux measurements in branches, stem and roots suggest that
transpiration-induced pressure signals are often instantly transferred from the leaf to
the root level despite the buffering capacity of the internal stores which partly
contradicts hypothesis #4. One possible explanation is that the youngest tree rings
may represent a direct and highly conductive signal pathway between canopy top
branches, stem and roots where the signal can travel rapidly without major
interference with older, less conductive conduits that probably play a more important
role in storage. We further speculate that this observation may in part be a result of
the two different sap flux measuring techniques employed, that register either total or
only the outermost flow in the respective xylem segments. Additional studies with

Stem water storage in five tree species
81
synchronous flux measurements in branches, stem and roots, preferably with the
same type of sensor, are needed to test if such direct connections along the hydraulic
pathway between branches and roots exist.
Acknowledgments
We would like to acknowledge good cooperation with the management of Hainich
National Park, Thuringia. We thank Heinz Coners for technical support and two
anonymous reviewers for their helpful suggestions on an earlier version of the
manuscript.
Funding
This study was conducted within the framework of the Research Training Group
1086 with funding from the German Research Foundation (DFG).
Appendix
Table 3.4 Definition, symbols and units of the flux terms used.
Flux Symbol Unit
Sap flux density Js g m-2 s-1
Daily sap flux density Jsd g cm-2 d-1
Daily sap flux density at the stem top Jsd stemtop g cm-2 d-1
Daily sap flux density at the stem base Jsd stembase g cm-2 d-1
Sap flow rate Jr kg h-1
Sap flow rate at the stem top Jr stemtop kg h-1
Sap flow rate at the stem base Jr stembase kg h-1
Daily water use Jrd kg d-1
Daily sap flow rate at the stem top (24-day analysis) Jrd stemtop 24-day kg d-1
Daily sap flow rate at the stem top (24-day analysis) Jrd stembase 24-day kg d-1
Daily use of stored stem water Sd kg d-1
Daily use of stored stem water in relation to total daily water use Sd relative %
Daily use of stored stem water in relation to bole volume Sd bole kg m-3 d-1

CHAPTER 3
82
References
Andrade JL, Meinzer FC, Goldstein G, Holbrook NM, Cavelier J, Jackson P, Silvera K (1998) Regulation of water flux through trunks, branches, and leaves in trees of a lowland tropical forest. Oecologia 115:463–471.
Bartels H (ed) (1993) Gehölzkunde: Einführung in die Dendrologie. Ulmer Verlag, Stuttgart.
Besnard G, Carlier G (1990) Potentielhydrique et conductancestomatique des feuilles de frêne (Fraxinus excelsiorL) dans une forêt alluviale du Haut-Rhône français. Ann Sci For 47:353–365.
Betsch P, Bonal D, Breda N, Montpied P, Peiffer M, Tuzet A, Granier A (2011) Drought effects on water relations in beech: the contribution of exchangeable water reservoirs. Agric For Meteorol 151:531–543.
Borchert R (1994) Soil and stem water storage determine phenology and distribution of tropical dry forest trees. Ecology 75:1437–1449.
Burgess SSO, Dawson TE (2008) Using branch and basal trunk sap flow measurements to estimate whole-plant water capacitance: a caution. Plant Soil 305:5–13.
Carlier G, Peltier J, Gielly L (1992) Water relations of ash (Fraxinus excelsior L) in a mesoxerophilic mountain stand. Ann Sci For 49:207–223.
Čermák J, Kučera J, Penka M, Ulehla J (1982) Sap flow rate and transpiration dynamics in the full-grown oak (Quercus robur) in floodplain forest exposed to seasonal floods as related to potential evapotranspiration and tree dimensions. Biol Plant 24:446–460.
Čermák J, Jeník J, Kučera J, Žídek V (1984) Xylem water flow in a crack willow tree (Salix fragilis L.) in relation to diurnal changes of environment. Oecologia 64:145–151.
Čermák J, Kučera J, Bauerle WL, Phillips N, Hinckley TM (2007) Tree water storage and its diurnal dynamics related to sap flow and changes in stem volume in old-growth Douglas-fir trees. Tree Physiol 27:181–198.
Chave J, Coomes D, Jansen S, Lewis SL, Swenson NG, Zanne AE (2009) Towards a worldwide wood economics spectrum. Ecol Lett 12:351–366.
Chuang Y-L, Oren R, Bertozzi AL, Phillips N, Katul GG (2006) The porous media model for the hydraulic system of a conifer tree: linking sap flux data to transpiration rate. Ecol Model 191:447–468.
Coners H, Leuschner C (2002) In situ water absorption by tree fine roots measured in real time using miniature sap-flow gauges. Funct Ecol 16:696–703.
Daudet FA, Améglio T, Cochard H, Archilla O, Lacointe A (2005) Experimental analysis of the role of water and carbon in tree stem diameter variations. J Exp Bot 56:135–144.

Stem water storage in five tree species
83
Domec J, Scholz F, Bucci S, Meinzer F, Goldstein G, Villabos-Vega R (2006) Diurnal and seasonal variation in root xylem embolism in neotropical savanna woody species: impact on stomatal control of plant water status. Plant Cell Environ 29:26–35.
Drew DM, Richards AE, Downes GM, Cook GD, Baker P (2011) The development of seasonal tree water deficit in Callitris intratropica. Tree Physiol 31:953–964.
Ellenberg H, Leuschner C (2010) Vegetation Mitteleuropas mit den Alpen in ökologischer, dynamischer und historischer Sicht. 6th edn. Ulmer Verlag, Stuttgart.
Ewers BE, Mackay DS, Samanta S (2007) Interannual consistency in canopy stomatal conductance control of leaf water potential across seven tree species. Tree Physiol 27:11–24.
Garnier E, Berger A (1986) Effect of water stress on stem diameter changes of peach trees growing in the field. J Appl Ecol 23:193–209.
Gebauer T, Horna V, Leuschner C (2008) Variability in radial sap flux density patterns and sapwood area among seven co-occurring temperate broad-leaved tree species. Tree Physiol 28:1821–1830.
Goldstein G, Meinzer F, Monasterio M (1984) The role of capacitance in the water balance of Andean giant rosette species. Plant Cell Environ 7:179–186.
Goldstein G, Andrade JL, Meinzer FC, Holbrook NM, Cavelier J, Jackson P, Celis A (1998) Stem water storage and diurnal patterns of water use in tropical forest canopy trees. Plant Cell Environ 21:397–406.
Granier A (1987) Evaluation of transpiration in a Douglas-fir stand by means of sap flow measurements. Tree Physiol 3:309–320.
Guckland A, Jacob M, Flessa H, Thomas FM, Leuschner C (2009) Acidity, nutrient stocks, and organic-matter content in soils of a temperate deciduous forest with different abundance of European beech (Fagus sylvatica L.). J Plant Nutr Soil Sci 172:500–511.
Hao GY, Hoffmann WA, Scholz FG, Bucci SJ, Meinzer FC, Franco AC, Cao KF, Goldstein G (2008) Stem and leaf hydraulics of congeneric tree species from adjacent tropical savanna and forest ecosystems. Oecologia 155:405–415.
Holbrook NM (1995) Stem water storage. In: Gartner BL (ed) Plant stems: physiology and functional morphology. Academic Press, San Diego, pp 151–174.
Hölscher D (2004) Leaf traits and photosynthetic parameters of saplings and adult trees of co-existing species in a temperate broad-leaved forest. Basic Appl Ecol 5:163–172.

CHAPTER 3
84
Hölscher D, Hertel D, Leuschner C, Hottkowitz M (2002) Tree species diversity and soil patchiness in a temperate broad-leaved forest with limited rooting space. Flora 197:118–125.
Irvine J, Grace J (1997) Continuous measurements of water tensions in the xylem of trees based on the elastic properties of wood. Planta 202:455–461.
Köcher P, Gebauer T, Horna V, Leuschner C (2009) Leaf water status and stem xylem flux in relation to soil drought in five temperate broad-leaved tree species with contrasting water use strategies. Ann For Sci 66:101.
Köcher P, Horna V, Beckmeyer I, Leuschner C (2012a) Hydraulic properties and embolism in small-diameter roots of five temperate broad-leaved tree species with contrasting drought tolerance. Ann For Sci 69:693–703.
Köcher P, Horna V, Leuschner C (2012b) Environmental control of daily stem growth patterns in five temperate broad-leaved tree species. Tree Physiol 32:1021–1032.
Loustau D, Berbigier P, Roumagnac P, Arruda-Pacheco C, David JS, Ferreira MI, Pereira JS, Tavares R (1996) Transpiration of a 64-year-old maritime pine stand in Portugal. Oecologia 107:33–42.
Meinzer FC, James SA, Goldstein G (2004) Dynamics of transpiration, sap flow and use of stored water in tropical forest canopy trees. Tree Physiol 24:901–909.
Meinzer FC, Woodruff DR, Domec J-C, Goldstein G, Campanello PI, Gatti MG, Villalobos-Vega R (2008) Coordination of leaf and stem water transport properties in tropical forest trees. Oecologia 156:31–41.
Meinzer FC, McCulloh KA, Lachenbruch B, Woodruff DR, Johnson DM (2010) The blind men and the elephant: the impact of context and scale in evaluating conflicts between plant hydraulic safety and efficiency. Oecologia 164:287–296.
Perämäki M, Nikinmaa E, Sevanto S, Ilvesniemi H, Siivola E, Hari P, Vesala T (2001) Tree stem diameter variations and transpiration in Scots pine: an analysis using a dynamic sap flow model. Tree Physiol 21:889–897.
Perämäki M, Vesala T, Nikinmaa E (2005) Modeling the dynamics of pressure propagation and diameter variation in tree sapwood. Tree Physiol 25:1091–1099.
Phillips N, Oren R, Zimmermann R, Wright SJ (1999) Temporal patterns of water flux in trees and lianas in a Panamanian moist forest. Trees Struct Funct 14:116–123.
Phillips N, Ryan M, Bond B, McDowell N, Hinckley T, Čermák J (2003) Reliance on stored water increases with tree size in three species in the Pacific Northwest. Tree Physiol 23:237–245.

Stem water storage in five tree species
85
Phillips N, Scholz FG, Bucci SJ, Goldstein G, Meinzer FC (2009) Using branch and basal trunk sap flow measurements to estimate whole-plant water capacitance: comment on Burgess and Dawson (2008). Plant Soil 315:315–324.
Pratt RB, Jacobsen AL, Ewers FW, Davis SD (2007) Relationships among xylem transport, biomechanics and storage in stems and roots of nine Rhamnaceae species of the California chaparral. New Phytol 174:787–798.
Sakuratani T (1981) A heat balance method for measuring water flux in the stem of intact plants. J Agric Meteorol 37:9–17.
Schaap MG, Leij FJ, van Genuchten MT (1998) Neural network analysis for hierarchical prediction of soil hydraulic properties. Soil Sci Soc Am J 62:847–855.
Schmidt I, Leuschner C, Mölder A, Schmidt W (2009) Structure and composition of the seed bank in monospecific and tree species-rich temperate broad-leaved forests. For Ecol Manage 257:695–702.
Scholz FG, Bucci SJ, Goldstein G, Meinzer FC, Franco AC, Miralles- Wielm F (2007) Biophysical properties and functional significance of stem water storage tissues in Neotropical savanna trees. Plant Cell Environ 30:236–248.
Scholz FC, Bucci SJ, Goldstein G, Meinzer FC, Franco AC, Miralles- Wilhelm F (2008) Temporal dynamics of stem expansion and contraction in savanna trees: withdrawal and recharge of stored water. Tree Physiol 28:469–480.
Scholz FG, Phillips NG, Bucci SJ, Meinzer FC, Goldstein G (2011) Hydraulic capacitance: biophysics and functional significance of internal water sources in relation to tree size. In: Meinzer FC, Lachenbruch B, Dawson TE (eds) Size- and age-related changes in tree structure and function. Springer, Dordrecht, pp 341–361.
Schulze ED, Čermák J, Matyssek M, Penka M, Zimmermann R, Vasicek F, Gries W, Kučera J (1985) Canopy transpiration and water fluxes in the xylem of the trunk of Larix and Picea trees—a comparison of xylem flow, porometer and cuvette measurements. Oecologia 66:475–483.
Senock RS, Leuschner C (1999) Axial water flux dynamics in small diameter roots of a fast growing tropical tree. Plant Soil 208:57–71.
Sperry JS, Pockman WT (1993) Limitation of transpiration by hydraulic conductance and xylem cavitation in Betula occidentalis. Plant Cell Environ 16:279–287.
Steppe K, Lemeur R (2004) An experimental system for analysis of the dynamic sap-flow characteristics in young trees: results of a beech tree. Funct Plant Biol 31:83–92.
Steppe K, Lemeur R (2007) Effects of ring-porous and diffuse-porous stem wood anatomy on the hydraulic parameters used in a water flow and storage model. Tree Physiol 27:43–52.

CHAPTER 3
86
Steppe K, De Pauw DJ, Lemeur R, Vanrolleghem PA (2006) A mathematical model linking tree sap flow dynamics to daily stem diameter fluctuations and radial stem growth. Tree Physiol 26:257–273.
Stratton L, Goldstein G, Meinzer FC (2000) Stem water storage capacity and efficiency of water transport: their functional significance in a Hawaiian dry forest. Plant Cell Environ 23:99–106.
Taneda H, Sperry JS (2008) A case-study of water transport in co-occurring ring-versus diffuse-porous trees: contrasts in water-status, conducting capacity, cavitation and vessel refilling. Tree Physiol 28:1641–1651.
Tyree MT, Yang S (1990) Water-storage capacity of Thuja, Tsuga and Acer stems measured by dehydration isotherms. Planta 182:420–426.
Verbeeck H, Steppe K, Nadezhdina N et al. (2007a) Stored water use and transpiration in Scots pine: a modeling analysis with ANAFORE. Tree Physiol 27:1671–1685.
Verbeeck H, Steppe K, Nadezhdina N, Op de Beeck M, Deckmyn G, Meiresonne L, Lemeur R, Ceulemans R, Janssens IA (2007b) Model analysis of the effects of atmospheric drivers on storage water use in Scots pine. Biogeosciences 4:657–671.
Waring RH, Running S (1978) Sapwood water storage: its contribution to transpiration and effect upon water conductance through the stems of old-growth Douglas-fir. Plant Cell Environ 1:131–140.
Waring RH, Whitehead D, Jarvis PG (1979) The contribution of stored water to transpiration in Scots pine. Plant Cell Environ 2:309–317.
Zweifel R, Häsler R (2001) Dynamics of water storage in mature subalpine Picea abies: temporal and spatial patterns of change in stem radius. Tree Physiol 21:561–569.
Zweifel R, Item H, Hasler R (2001) Link between diurnal stem radius changes and tree water relations. Tree Physiol 21:869.
Zweifel R, Böhm JP, Häsler R (2002) Midday stomatal closure in Norway spruce—reactions in the upper and lower crown. Tree Physiol 22:1125–1136.
Zweifel R, Zimmermann L, Newbery DM (2005) Modeling tree water deficit from microclimate: an approach to quantifying drought stress. Tree Physiol 25:147–156


Chapter 4
Environmental control of daily stem growth patterns in five temperate broad-leaved tree
species
Paul Köcher · Viviana Horna · Christoph Leuschner
Published in
Tree Physiology 2012, 32: 1021–1032
DOI: 10.1093/treephys/tps049

CHAPTER 4
90
Summary
Tree ring analysis investigates growth processes at time horizons of several weeks to
millennia, but lacks the detail of short-term fluctuation in cambial activity. This
study used electronic high-precision dendrometry for analyzing the environmental
factors controlling stem diameter variation and radial growth in daily resolution in
five co-existing temperate broad-leaved tree species (genera Fraxinus, Acer,
Carpinus, Tilia and Fagus) with different growth and survival strategies.
Daily stem radius change (SRCd) was primarily influenced by the atmospheric
demand for water vapor (expressed either as vapor pressure deficit (D) or relative air
humidity (RH)) while rainfall, soil matrix potential, temperature and radiation were
only secondary factors. SRCd increased linearly with increasing RH and decreasing
D in all species. The positive effect of a low atmospheric water vapor demand on
SRCd was largest in June during the period of maximal radial growth rate and
persisted when observation windows of 7 or 21 d instead of one day were used.
We found a high synchronicity in the day-to-day growth rate fluctuation among
the species with increment peaks corresponding to air humidity maxima, even though
the mean daily radial growth rate differed fivefold among the species. The five
species also differed in the positive slope of the growth/RH relationship with the
steepest increase found in Fraxinus and the lowest in Fagus.
We explain the strong positive effect of high RH and low D on radial stem
increment by lowered transpiration which reduces negative pressure in the
conducting system and increases turgor in the stem cambium cells, thereby favoring
cell division and expansion. The results suggest that mechanistic models of tree
growth need to consider the atmospheric water status in addition to the known
controlling environmental factors temperature, soil moisture and precipitation. The
results further have implications for sensitivity analyses of tree growth to climatic
changes.
Key words: air humidity, Fagus sylvatica, Fraxinus excelsior, point dendrometers,
radial stem growth, seasonality of growth, soil moisture, stem water status, water
vapor pressure deficit

Stem growth patterns in five tree species
91
Introduction
Radial stem growth in woody plants is controlled on the physiological level by the
turgor pressure in the cambial cells, the amount of carbohydrates supplied to the stem
cambium and its differentiating derivatives, and the duration of cambial activity
(Deslauriers and Morin 2005, Rossi et al. 2006, Lambers et al. 2008). Short-term and
seasonal variation in diameter growth is largely caused by fluctuations in the water
status of the cambial meristems and hormonal control (Kozlowski and Pallardy
1997). For decades, tree ring analysis has been the principal tool for analyzing inter-
annual and intra-annual variation in stem diameter growth of trees and for relating it
to climatic, biotic, age-related and management factors (Cook and Kairiūkštis 1990,
Hughes et al. 2011). While the two underlying processes of radial growth, cambial
cell division and cell expansion, proceed at time scales of hours to a few days,
dendrochronological analysis investigates growth processes at a time horizon of
several weeks to millennia depending on growth-ring structure, seasonality of
cambial activity and tree longevity, leaving in many species a gap in the causal chain
between growth at the cellular level and observed diameter increment as manifested
in the width of annual growth-rings. This has the consequence that climatic variables
identified as growth-controlling factors in dendrochronological analysis are not
necessarily those factors that determine instantaneous rates of cambial activity. In
fact, in temperate regions, inter-annual differences in the timing of summer rainfall
or in summer temperature can markedly alter the seasonal dynamics of cambial
activity while annual ring width may remain unchanged (Archambault and Bergeron
1992, Hofgaard et al. 1999). The temporal variation in stem radial growth has been
studied in depth in tracheid-based wood, especially conifers, using densitometry and
wood anatomical studies (Schweingruber 1996) and by radioactive marking in
various types of growth ring-forming evergreen trees (Liphschitz and Lev-Yadun
1986), but in much less detail in broad-leaved trees.
In most temperate forests examined by dendrochronological analysis, climate
sensitivity analysis has identified summer rainfall in the recent or in the preceding
year as a prominent factor, if not the most important, that explains variation in radial
growth rate (Hofgaard et al. 1999, Tardif et al. 2001a, Čufar et al. 2008). Soil
moisture, temperature and forest management activities (e.g. thinning) have also
been found to be influential in many stands (Aussenac and Granier 1988,
Archambault and Bergeron 1992, D’Arrigo et al. 1992, Schweingruber et al. 1993,

CHAPTER 4
92
Bréda et al. 1995, Tardif et al. 2001a). However, due to their coarse-grained temporal
resolution, it remains questionable whether tree ring data are qualified to draw
conclusions on climatic drivers of instantaneous cambial growth activity.
To study wood formation and radial growth processes at a resolution of days to
weeks, several methods have been applied. The production of new cell layers in the
xylem can be recorded at weekly time intervals by extracting micro-cores or by
pinning (e.g., Mäkinen et al. 2008). Mechanic and electronic high-resolution
dendrometers allow for the continuous recording of diurnal stem diameter
fluctuations, i.e. at temporal and spatial scales relevant for cambial cell division and
expansion (e.g. Kozlowski and Winget 1964, Braekke et al. 1978, Beedlow et al.
1986, Simonneau et al. 1993, Downes et al. 1999, Drew and Downes 2009). Thus,
these techniques allow to study environmental factors directly or indirectly
influencing instantaneous rates of cambial growth, instead of integrating over several
seasonal growth phases as is done in the analysis of annual tree rings.
A shortcoming of recording dendrometers with respect to growth detection is
that, in addition to irreversible growth processes, reversible stem shrinkage (day) and
swelling (night) are also contributing to diameter fluctuations (Deslauriers et al.
2007b) which requires adapted techniques to extract the growth signal from diurnal
diameter fluctuation. The problem of separating reversible and irreversible
components of stem diameter variation has been addressed in various studies and a
number of procedures applicable to tree growth records under a variety of climatic
conditions have been proposed (Braekke et al. 1978, Herzog et al. 1995, Downes et
al. 1999, Tardif et al. 2001b, Wimmer et al. 2002, Deslauriers et al. 2003, Bouriaud
et al. 2005, Zweifel et al. 2005). However, this approach has only rarely been used to
address the question whether the growth-controlling environmental factors differ
between tree species with different phylogeny, morphology and physiology.
This study uses electronic point dendrometers (resolution < 10 µm, recording
interval 30 min) to analyze the influence of rainfall, soil moisture, air humidity,
atmospheric vapor pressure deficit, air temperature and global radiation on stem
radius changes in five co-occurring temperate broad-leaved tree species. We
compared the growth dynamics of five wide-spread European species of the genera
Acer, Fagus, Fraxinus, Carpinus and Tilia in an old-growth mixed forest, species
that differ with respect to drought sensitivity (insensitive to moderately sensitive),
xylem anatomy (diffuse- vs. ring-porous) and successional status (early/mid- to late-

Stem growth patterns in five tree species
93
successional). The specific objectives of this study were (i) to test the environmental
factors rainfall, soil moisture, air humidity, vapor pressure deficit, air temperature
and global radiation in their effect on stem radius changes, and (ii) to compare mean
radial growth and seasonal growth dynamics among the five species.
Materials and methods
Study site and tree species
The study was conducted in a species-rich temperate deciduous forest in Hainich
National Park (7610 ha) in western Thuringia, Central Germany (51° 04’ N, 10° 30’
E). The national park is part of the Hainich plateau range (16 000 ha) which
encompasses one of the largest non-fragmented broad-leaved forest in Central
Europe. The study site is located in the northeastern part of the national park in the
Thiemsburg region. The mean annual precipitation of this site is 590 mm and the
mean annual temperature is 7.5°C (1973-2004, Deutscher Wetterdienst, 2005).
Luvisol is the dominant soil type which developed from loess that is underlain by
Triassic limestone (Guckland et al. 2009). Soils can dry strongly in summer and
show stagnant properties during spring and winter. Mean tree height varies between
27.9 m in the denser part of the forest (614 stems ha–1) to 32.9 m in the less dense
forest area (392 stems ha–1) (Gebauer et al. 2008). The average stand age of the
canopy trees ranges between 90 and 120 years (Schmidt et al. 2009).
Five abundant broad-leaved tree species from different families were selected for
study. From May to September 2009, stem radius variation was monitored with high
precision on four to six individuals of sycamore maple (Acer pseudoplatanus L.,
male and female individuals), European beech (Fagus sylvatica L.), European ash
(Fraxinus excelsior L.), European hornbeam (Carpinus betulus L.), and little-leaf
linden (Tilia cordata Mill.). All selected 25 trees were mature dominant individuals
reaching the upper canopy (23.0 - 33.7 m in height, see Table 4.1) and located within
a maximum distance of 100 m to each other.
Microclimatological and hydrological measurements
Air temperature and relative air humidity were recorded in the upper canopy of the
stand with a Rotronic temperature and humidity probe (MP100A Hygromer,
Rotronic, Ettlingen, Germany). Measurements were taken every 30 s and stored as

CHAPTER 4
94
Table 4.1 Number of measured tree individuals per species, range of diameter at breast height (DBH) and tree height, and mean values (± 1 SD) of bark thickness and daily stem radius change (SRCd) in June in the five tree species. Significant differences between the species are indicated by different small letters.
Species
Number of trees
DBH (cm)
Tree height (m)
Mean bark thickness (mm)
Mean SRCd (µm d-1)
A. pseudoplatanus 5 38.3 - 76.1 26.8 - 33.7 8.52 ± 1.71 a 22.6 ± 26.8 a F. sylvatica 6 40.8 - 61.0 28.2 - 33.1 5.78 ± 1.42 bc 22.4 ± 18.6 a F. excelsior 5 24.3 - 41.2 23.0 - 28.1 7.56 ± 2.26 ac 56.8 ± 48.2 b C. betulus 5 35.2 - 59.9 24.7 - 29.2 5.20 ± 1.84 b 13.1 ± 24.1 a T. cordata 4 41.3 - 62.9 24.3 - 31.7 14.18 ± 3.61 d 8.5 ± 26.8 a
half-hourly means with a Campbell CR1000 data-logger (Campbell Scientific Ltd.,
Cambridge, UK). These data were used to generate instantaneous values of vapor
pressure deficit (D, hPa).
Volumetric soil water content (Θ, m3 m-3) was measured with time domain
reflectometry probes (CS616 Water Content Reflectometer, Campbell Scientific Ltd.,
Cambridge, UK) installed at three different depths (10, 30 and 50 cm) in close
proximity to the studied trees. Data were logged two times a day (00:00h and
12:00h). The soil water content data at 10 cm depth were used to calculate soil
matrix potential (ΨS) using the program Rosetta Lite Version 1.0 (Schaap et al.
1998). The required soil physical parameters (e.g. clay content, bulk density) were
provided by Guckland et al. (2009). Hourly values of precipitation and global
radiation were obtained from the nearby (2 km) Weberstedt/Hainich meteorological
station (Meteomedia GmbH) for the whole year 2009.
Diurnal measurements refer to solar time which is 80 min behind Central
European Summer Time (CEST).
Measurement of stem radial growth
We used spring loaded linear displacement potentiometers (model MMR 10_11
R5K, MEGATRON Elektronik AG & Co., Munich, Germany) with an accuracy of
< 10 µm to measure diurnal radius variation and stem radial growth. The point
dendrometers were mounted on stainless steel frames which were fixed to the stem
with two screws placed at least 6 cm apart from the measuring point. The screws
were anchored at least 5 cm deep into the xylem as recommended by Herzog et al.
(1995) and Gall et al. (2002). The tips of the dendrometers were placed directly in
contact with the bark which was smoothed before. The dendrometers were mounted
at 1.3 m height and were covered with aluminum foil to protect them from direct

Stem growth patterns in five tree species
95
solar radiation and avoid contact with liquid water. Radial change values were
recorded every 30 min by averaging over 60 30-s readings using a CR1000 data-
logger (Campbell Scientific Ltd., Cambridge, UK).
Data analysis
Daily stem radius increment (SRI) was calculated after Downes et al. (1999) and
Deslauriers et al. (2003). These authors defined three distinct phases of stem radius
variation over a 24h-period (Figure 4.1). The first phase is characterized by
shrinkage of the stem radius from a maximum registered during early morning to a
daily minimum occurring after midday. During the second phase, the stem radius
expands to a new maximum. According to Deslauriers et al. (2003), the expansion
phase also includes the third phase (SRI). This phase is associated with the difference
between the maximum stem radii of two subsequent days (Figure 4.1). Negative
values of SRI due to a smaller radius maximum on the following day were included
in the analysis and not treated as missing values or set to zero as was done by other
authors. Therefore, we prefer to use the neutral term ‘daily stem radius change’
(SRCd) instead of ‘daily stem radius increment’ (SRI).
1340
1360
1380
1400
1420
1440
1460
Den
drom
eter
read
ing
(µm
)
12:00 12:00 12:00Time of day (h)
SRCd
SRESRS
MXSR
MXSR
MNSR
Figure 4.1 Typical diurnal cycle of stem radius variation over three exemplary days in 2009. SRCd is calculated as the difference between two consecutive stem radius maxima. MXSR, maximum stem radius; MNSR, minimum stem radius; SRS, stem radius shrinkage; SRE, stem radius expansion; SRCd, stem radius change (increase or decrease) per day.
Alternatively, SRC was calculated as the running mean of daily stem radius
change (SRCd) for time windows of 7 days (SRC7) and 21 days (SRC21) that were
moved along the time axis (Figure 4.2f and g) in order to obtain estimates of stem
diameter growth with an only negligible bias by putative stem shrinking and swelling
effects, an effect that cannot be excluded for the SRCd data. That the SRC7 and
SRC21 data mainly reflect diameter growth, is suggested by the fact that negative

CHAPTER 4
96
SRC values occurred occasionally in the SRCd time series, but were mostly absent in
the SRC7 series (exception: T. cordata) and did not occur at all in the SRC21 data set.
The SRC running means were calculated for the respective mid-point of each
window position (i.e. day 4 and day 11 for SRC7 and SRC21, respectively).
Statistical analyses were conducted with SAS software, version 9.1 (SAS
Institute Inc., Cary, NC, USA). For analyzing the relationship between SRCd, SRC7
and SRC21, and various environmental factors, single-factor correlation analyses were
calculated with daily precipitation (P), daily totals of global radiation (Itot), daily
mean relative humidity (RHmean), daily mean vapor pressure deficit (Dmean), soil
matrix potential (ΨS) at 10 cm depth and daily mean air temperature (Tmean) as
variables. In the case of SRC7 and SRC21, these variables were also calculated as
running means for time windows of 7 or 21 days before their inclusion in the
correlation analysis. Subsequently, partial correlation analyses were conducted in
order to explore the degree of correlation between SRCd and environmental variables
once the effect of other potentially controlling variables was removed (Table 4.5).
The partial correlation analyses were preceded by a Principal Components Analysis
(PCA) which helped to identify the most important environmental variables
controlling SRCd and their inter-relationships (Table 4.3). In addition, all considered
environmental variables were arranged in a correlation matrix (Table 4.4) and tested
for lag effects with cross-correlation analysis.
Results
Microclimatic conditions and soil moisture status
The year 2009 was relatively warm and wet in the study area. Mean annual air
temperature in 2009 (8.9 °C) exceeded the long-term mean (7.5°C). The daily means
of air temperature (Tmean) during the study period (May 1st to September 30th, 2009)
varied between 7.8 and 23.7 °C (Figure 4.2b). The vapor pressure deficit (D)
measured in canopy height reached its seasonal maximum in August (highest daily
mean: 15 hPa, Figure 4.2b); the mean daily relative air humidity (RHmean) varied in
summer 2009 between 60 and 100% (Figure 4.2a). The daily totals of global
radiation (Itot) reached highest values in June and July with up to 30 MJ m-2 d-1.
The annual precipitation in 2009 was higher (774 mm) than the long-term
average (590 mm). Similarly, June, July and September received more rain than the
average of these months (Figure 4.2c).

Stem growth patterns in five tree species
97
0123456
Rad
iali
ncre
men
t(m
m)
AcerFagus
Fraxinus
Carpinus
Tilia
(e)-0.15-0.10-0.050.00
ΨS
(MP
a)
0.0
0.2
0.4
0.6
Θ(m
m)
3-3
10
20
P(m
m)
50 cm
10 cm 30 cm
(c)0
10
20
T(°
C)
mea
n
0
10
20
30
Dm
ean
(hP
a)DTemperature(b)
0
20
40
I(M
Jm
d)
tot
-2-1
0
25
50
75
100
RH
(%)
Global radiation
Relative humidity
(a)
(d)
-200
20406080
1/5/2009 1/6/2009 1/7/2009 1/8/2009 1/9/2009 1/10/2009
Date
Acer
FagusFraxinus
Carpinus Tilia
(f)
-200
20406080
Ste
mra
dius
chan
geS
RC
(µm
d)
-1
1/5/2009 1/6/2009 1/7/2009 1/8/2009 1/9/2009 1/10/2009
Date
Acer
Fagus
Fraxinus
Carpinus Tilia
(g)
Figure 4.2 (a) Seasonal course of mean daily relative air humidity (RHmean) and daily totals of global radiation (Itot), (b) daily mean air temperature (Tmean) and daily mean vapor pressure deficit (Dmean), (c) soil water content (Θ) at three soil depths (10, 30, 50 cm) and daily precipitation (P) and (d) soil matrix potential (ΨS) at 10 cm soil depth in summer 2009 in the Hainich forest. (e) Seasonal development of mean radial stem increment (cumulative SRCd) for the five tree species in summer 2009 (n = 4-6 individuals each). (f and g) Stem radius change (SRC) of the five investigated species during summer 2009 calculated as the running mean of daily stem radius change (SRCd) for time windows of (f) 21 days (SRC21) or (g) 7 days (SRC7) that were moved along the time axis. The running means were calculated for the respective mid-point of each window position (i.e. day 4 and day 11 of the windows for SRC7 and SRC21, respectively).

CHAPTER 4
98
The volumetric soil water content (Θ) showed a rather smooth time course over
the vegetation period, in particular at soil depths of 30 and 50 cm. Rainfall events
resulted in marked increases in Θ only when daily precipitation exceeded 20 mm
(Figure 4.2c). Longer periods of soil drought did not occur in summer 2009. The soil
matrix potential (ΨS) at 10 cm depth remained continuously above -0.06 MPa until
July and passed -0.1 MPa only in August and early September (Figure 4.2d). A soil
matrix potential of -0.1 MPa was identified by Köcher et al. (2009) as a threshold for
continuous declines in leaf water potential and sap flux density to occur in the trees
of this site.
Stem radius change in relation to environmental factors
The daily change in stem radius (expressed by the SRCd, SRC7 or SRC21 values) was
analyzed in its relation to six microclimatological and soil hydrological parameters
(rainfall, solar radiation, air temperature, water vapor pressure deficit, relative air
humidity, soil matrix potential in 10 cm depth) with single-factor correlation
analyses (period May 15th - July 15th, 2009). In all five species, SRCd showed the
closest correlation to daily mean relative air humidity (RHmean, positive relation) and
mean vapor pressure deficit (Dmean, negative) (Table 4.2). Less tight relations were
found to daily radiation totals and daily precipitation. In contrast, the influence of
soil matrix potential was significant only in Fagus while air temperature was not
related to SRC in any of the species when analyzed on a daily basis (SRCd). As
expected, the importance of the influencing environmental factors changed when the
SRC7 and SRC21 values instead of SRCd were considered (Table 4.2). The dominant
and strong positive influence of air humidity on radius change persisted in three of
the five species when the longer integration periods of 7 and 21 d were analyzed. In
case of Fraxinus, the significance of all influential factors on diameter change
decreased with an increase in period length, while Fagus showed an increasing
importance of daily mean temperature and also of soil matrix potential when the
perspective shifted from 1 to 7 or 21 days.
The partial correlation analysis focused on SRCd and its relationship to either
RHmean or Dmean (Table 4.5) because these two variables showed the closest relation
to SRCd (Table 4.2) but themselves are partially dependent on other environmental
variables such as rainfall, solar radiation and air temperature. This web of
relationships is evidenced by the high loadings of nearly all environmental variables

Stem growth patterns in five tree species
99
Table 4.2 Pearson correlation coefficients (R) for the relationships between daily stem radius change as calculated by three different approaches and six climatological and hydrological factors in the five species (period: 15 May to 15 July 2009). The environmental variables were also calculated as running means in the case of SRC7 and SRC21
Species P Itot Tmean Dmean RHmean ΨS
Acer SRCd 0.30* -0.40** -0.15 -0.57*** 0.61*** 0.07
Fagus SRCd 0.27* -0.40** 0.13 -0.53*** 0.68*** -0.30*
Fraxinus SRCd 0.30* -0.38** -0.08 -0.53*** 0.60*** 0.05
Carpinus SRCd 0.29* -0.43*** -0.03 -0.59*** 0.70** -0.15
Tilia SRCd 0.35** -0.45*** -0.06 -0.60*** 0.71*** -0.10
P7 Itot7 Tmean7 Dmean7 RHmean7 ΨS7
Acer SRC7 0.01 -0.54*** -0.16 -0.56*** 0.51*** 0.27*
Fagus SRC7 0.14 -0.26 0.60*** -0.17 0.71*** -0.63***
Fraxinus SRC7 0.09 -0.35** -0.04 -0.34** 0.35** 0.11
Carpinus SRC7 0.27* -0.50*** 0.33* -0.44*** 0.84*** -0.51***
Tilia SRC7 0.50*** -0.59*** 0.13 -0.60*** 0.90*** -0.42**
P21 Itot21 Tmean21 Dmean21 RHmean21 ΨS21
Acer SRC21 0.43** -0.63*** 0.17 -0.61*** 0.67** 0.10
Fagus SRC21 0.29 -0.36* 0.90*** -0.03 0.88** -0.75***
Fraxinus SRC21 -0.14 0.16 0.29 0.20 0.09 -0.24
Carpinus SRC21 0.32* -0.47** 0.83*** -0.15 0.93*** -0.72***
Tilia SRC21 0.51*** -0.64*** 0.67*** -0.39** 0.97*** -0.57*** SRCd, difference between the radius maxima of two consecutive days; SRC7, apparent daily increment as calculated by a 7-day-running mean of SRC; SRC21, apparent daily increment as calculated by a 21-day-running mean of SRC; P, Precipitation; Itot, radiation; Tmean, air temperature; Dmean, vapor pressure deficit; RHmean, relative air humidity; ΨS, soil matrix potential. Significant correlations are in bold. Significance levels: *P ≤ 0.05; **P ≤ 0.01; ***P ≤ 0.001. (except soil matrix potential) on the first PCA axis (Table 4.3) and the correlative
relationships between several of the variables shown in Table 4.4. According to the
partial correlation analysis, the strength of the SRCd-RHmean relationship was in all
tree species slightly reduced when controlling for precipitation and global radiation
whereas temperature and soil matrix potential had almost no effect (Table 4.5). The
degree of correlation decreased greatly only when Dmean was included as a partial
variable. Similar patterns were observed for the SRCd-Dmean relationship; this
correlation became insignificant in all tree species when we included RHmean as
partial variable.
Cross-correlation analysis, conducted for identifying possible time shifts in the
effect of precipitation, radiation and temperature on relative air humidity and vapor
pressure deficit, did not reveal hidden lag effects among these variables. The
obtained correlation coefficients were always highest in the runs without
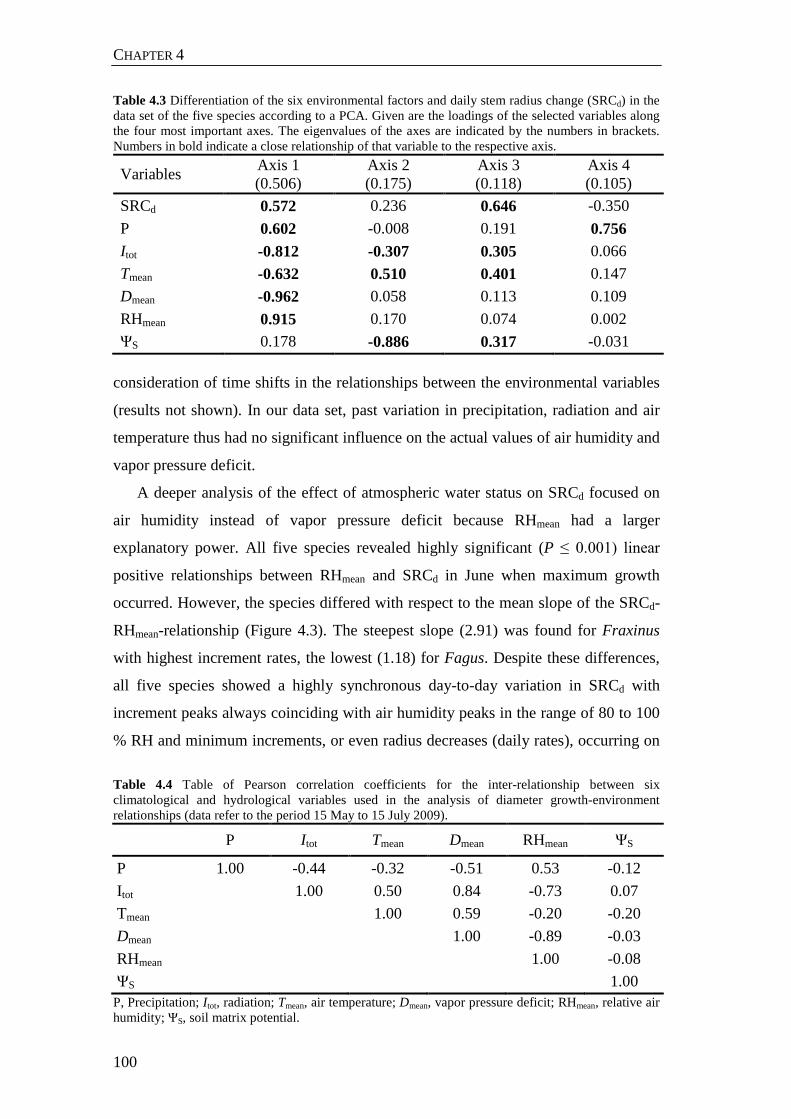
CHAPTER 4
100
Table 4.3 Differentiation of the six environmental factors and daily stem radius change (SRCd) in the data set of the five species according to a PCA. Given are the loadings of the selected variables along the four most important axes. The eigenvalues of the axes are indicated by the numbers in brackets. Numbers in bold indicate a close relationship of that variable to the respective axis.
Variables Axis 1 (0.506)
Axis 2 (0.175)
Axis 3 (0.118)
Axis 4 (0.105)
SRCd 0.572 0.236 0.646 -0.350 P 0.602 -0.008 0.191 0.756 Itot -0.812 -0.307 0.305 0.066 Tmean -0.632 0.510 0.401 0.147 Dmean -0.962 0.058 0.113 0.109 RHmean 0.915 0.170 0.074 0.002 ΨS 0.178 -0.886 0.317 -0.031
consideration of time shifts in the relationships between the environmental variables
(results not shown). In our data set, past variation in precipitation, radiation and air
temperature thus had no significant influence on the actual values of air humidity and
vapor pressure deficit.
A deeper analysis of the effect of atmospheric water status on SRCd focused on
air humidity instead of vapor pressure deficit because RHmean had a larger
explanatory power. All five species revealed highly significant (P ≤ 0.001) linear
positive relationships between RHmean and SRCd in June when maximum growth
occurred. However, the species differed with respect to the mean slope of the SRCd-
RHmean-relationship (Figure 4.3). The steepest slope (2.91) was found for Fraxinus
with highest increment rates, the lowest (1.18) for Fagus. Despite these differences,
all five species showed a highly synchronous day-to-day variation in SRCd with
increment peaks always coinciding with air humidity peaks in the range of 80 to 100
% RH and minimum increments, or even radius decreases (daily rates), occurring on
Table 4.4 Table of Pearson correlation coefficients for the inter-relationship between six climatological and hydrological variables used in the analysis of diameter growth-environment relationships (data refer to the period 15 May to 15 July 2009).
P Itot Tmean Dmean RHmean ΨS
P 1.00 -0.44 -0.32 -0.51 0.53 -0.12 Itot 1.00 0.50 0.84 -0.73 0.07 Tmean 1.00 0.59 -0.20 -0.20 Dmean 1.00 -0.89 -0.03 RHmean 1.00 -0.08 ΨS 1.00
P, Precipitation; Itot, radiation; Tmean, air temperature; Dmean, vapor pressure deficit; RHmean, relative air humidity; ΨS, soil matrix potential.

Stem growth patterns in five tree species
101
Table 4.5 Pearson correlation coefficients (R) for the relationship between daily stem radius change (SRCd) and either RHmean or Dmean while controlling for the effect of a third variable (partial correlation). The second column shows the correlation coefficients for single-factor correlations (SRCd vs. RHmean or Dmean), the following columns display the correlation coefficients for the same relation when the effect of the respective partial variable had been removed.
Species Partial variable
SRCd vs. RHmean P Itot Tmean Dmean ΨS
Acer 0.61*** 0.55*** 0.51*** 0.60*** 0.27* 0.62***
Fagus 0.68*** 0.66*** 0.62*** 0.73*** 0.54*** 0.69***
Fraxinus 0.60*** 0.54*** 0.51*** 0.60*** 0.31* 0.60***
Carpinus 0.70*** 0.67*** 0.63*** 0.71*** 0.47*** 0.70***
Tilia 0.71*** 0.66*** 0.62*** 0.71*** 0.47*** 0.70***
SRCd vs. Dmean P Itot Tmean RHmean ΨS
Acer -0.57*** -0.50*** -0.47*** -0.60*** -0.08 -0.57***
Fagus -0.53*** -0.47*** -0.37** -0.75*** 0.23 -0.56***
Fraxinus -0.53*** -0.47*** -0.43*** -0.61*** -0.01 -0.53***
Carpinus -0.59*** -0.54*** -0.47*** 0.71*** 0.09 -0.60***
Tilia -0.60*** -0.53*** -0.47*** -0.70*** 0.07 -0.61*** P, Precipitation; Itot, radiation; Tmean, air temperature; Dmean, vapor pressure deficit; RHmean, relative air humidity; ΨS, soil matrix potential. Significant correlations are in bold. Significance levels: *P ≤ 0.05; **P ≤ 0.01; ***P ≤ 0.001. days with reduced air humidity (typically < 75 %, Figure 4.4: data from June as
example). While Acer, Carpinus, Tilia and Fraxinus exhibited negative SRCd values
(i.e. a radius decrease on a daily basis) when the daily RHmean value fell below 75 %,
negative stem radius changes from day to day were the exception in Fagus (Figures
4.3 and 4.4)
The air humidity effect on daily stem radius change showed a distinct seasonality
in the growing season in all five species (Figure 4.5). The RHmean influence was
relatively small in May (correlation coefficients of 0.2 - 0.5) and increased rapidly at
the end of May to reach a peak of air humidity sensitivity in June (R = 0.6 - 0.8). In
July, August and September, the RHmean influence decreased continuously in all
species.
With a correlation analysis, we investigated the relationship between a species’
mean SRCd in June and its bark thickness (see Table 4.1). The two parameters were
not correlated across the five-species sample (all tree individuals: R = -0.20, P =
0.35; species means: R = -0.29, P = 0.64).

CHAPTER 4
102
-20
0
20
40
60
80AcerR2 = 0.61P < 0.001y = 1.65x-107.68
-20
0
20
40
60
80
Stem
radi
usch
ange
SRC
(µm
d)
d-1
FagusR2 = 0.65P < 0.001y = 1.18x-70.38
-200
20406080
100120140160
60 80 100
Mean daily relative humidity (%)
FraxinusR2 = 0.59P < 0.001y = 2.91x-172.17
-40
-20
0
20
40
60
80CarpinusR2 = 0.64P < 0.001y = 1.52x-106.27
-60
-40
-20
0
20
40
60
80
60 80 100
Mean daily relative humidity (%)
TiliaR2 = 0.60P < 0.001y = 1.63x-119.98
(a)
(b)
(c)
(d)
(e)
Figure 4.3 Mean daily stem radius change (SRCd) as a function of daily means of relative air humidity (RHmean) for the five studied species. Each of the 30 data points marks a day in June 2009 and represents the mean of 4-6 tree individuals. Note different scale of the y-axes.
Radial stem increment: temporal fluctuation and seasonal dynamics
The dendrometer readings at 30 min-intervals registered not only the diurnal stem
radius fluctuations due to wood and bark shrinking and swelling with high accuracy
(Figure 4.1), but also produced reliable data on irreversible stem increment when
observation periods of one to three weeks (SRC7 and SRC21 data) were considered
(Figure 4.2f and g). Accordingly, the five species differed largely in their cumulative
stem radius increment in the growing season 2009 with by far highest increment
totals in Fraxinus (approx. 5.8 mm), medium values in Fagus (approx. 2.8 mm) and
lowest values in Carpinus (approx. 1.7 mm), Acer (approx. 1.5 mm), and Tilia
(approx. 1.2 mm, means of 4-6 individuals). Radial growth rates (SRC7) exceeded
maxima of 70 µm d-1 in Fraxinus and reached peak rates of 20 - 40 µm d-1 in the
other four species (Figure 4.2g). We calculated diameter increment means during the
study period (May 1 to September 30) in the range of 8.5 - 22.6 µm d-1 for the Fagus,
Acer, Tilia and Carpinus trees (species differences not significant), while Fraxinus
exhibited a significantly higher mean value (56.8 µm d-1),

Stem growth patterns in five tree species
103
The five co-occurring species differed also with respect to seasonal growth
dynamics (SRC21 values) (Figure 4.2f). Fraxinus reached high growth rates already
in early May, while the other species increased their radial growth rate in May only
gradually. While Acer slowed down its diameter growth already at the end of June
and terminated it end of July, the other four species continued growth until early
September (Figure 4.2e and f).
When analyzing stem radius changes with a moving calculation window of 7
days (SRC7), a high synchronicity in the growth rate fluctuation among the five
species was visible. The peaks and lows of radial growth were mostly matching in
the period from early June until the end of the growing season in September (Figure
4.2g), while the absolute size of the stem radius change differed up to fivefold among
the species.
-50
0
50
100
150
200
Stem
radi
usch
ange
SRC
(µm
d)
d-1
0
20
40
60
80
100
Mea
nda
ilyre
lativ
ehu
mid
ity(%
)1/6 5/6 9/6 13/6 17/6 21/6 25/6 29/6
Date
RH Acer Fagus Fraxinus Carpinus Tilia
Figure 4.4 Fluctuation of mean daily relative air humidity (RHmean) and mean daily stem radius change (SRCd) of the five species for a 30-day period in mid-summer (June 2009). Mean of 4-6 trees per species.
0.0
0.2
0.4
0.6
0.8
1.0
Cor
rela
tion
coef
ficie
nt(R
)
1/5 1/6 1/7 1/8 1/9 1/10
Date
Fagus
Acer
Fraxinus
CarpinusTilia
Figure 4.5 Seasonal change in the correlation coefficient (R) of the relationship between mean daily stem radius change (SRCd,) and mean daily relative humidity (RHmean) for the five studied species. Given are values of R calculated for the respective mid-point of a correlation analysis with a moving time window of 31 days. Mean of 4-6 trees per species.

CHAPTER 4
104
Discussion
Extracting growth rate from daily stem radius variation
The following processes are contributing to circadian cycles in stem diameter:
expansion of dead conducting xylem elements due to the relaxation of internal
tensions (Irvine and Grace 1997, Cochard et al. 2001, Offenthaler et al. 2001,
Sevanto et al. 2002), reversible water status-related dehydration and rehydration of
living tissues (bark and phloem), thermal expansion and contraction, and irreversible
radial growth (Kozlowski and Winget 1964, Simonneau et al. 1993, Zweifel et al.
2000, Daudet et al. 2005). Dehydration/rehydration effects in bark and phloem and
radial growth typically explain more than 90 % of the stem radius fluctuations
(Dobbs and Scott 1971, Molz and Klepper 1973, Zweifel and Häsler 2000, Zweifel et
al. 2005), but the ratio between the two processes may change with climatic
conditions and both may be difficult to separate from each other. The fraction of
reversible stem shrinkage and re-expansion in total diameter change is higher when
trees are growing slowly as in cold climates or at the beginning and end of the
growing season (Zweifel and Häsler 2001).
Thus, a positive change in stem radius from one day to the other does not
necessarily reflect cambial growth but may partly be caused by stem swelling due to
alterations in the water status of xylem and bark. This is reflected by the occasional
occurrence of negative diameter changes in the SRCd data. Nevertheless, Rossi et al
(2006) proved for conifers that high-resolution dendrometers and repeated micro-
coring in the xylem led to similar results with respect to the recording of cambial
growth activity at the time of maximum growth. In any case, we have several reasons
to assume that the extracted daily positive stem radius changes in our data set are
mainly caused by cambial growth processes when longer integration periods of 7 or
21 d are used while water status-related stem volume changes might have a
significant influence on the day-to day diameter change only in the SRCd data. First,
we investigated the relation between bark thickness and calculated mean radial
increment across the 25 tree individuals from five species studied (Table 4.1). We
found no significant correlation which excludes the possibility that the calculated
apparent growth rates were in reality mostly expansion processes of bark tissue in
moist periods. Second, we found a large increase in the degree of atmospheric
coupling of the SRCd values from May to June which cannot be explained by
physical rehydration processes but which is most likely caused by seasonal growth

Stem growth patterns in five tree species
105
rhythms under endogenous control. Moreover, the prominent RH signal persisted in
most species when the observation window was extended from one to 7 or 21 days;
the risk of misinterpreting diameter increases due to swelling as growth processes
should be much smaller in these longer integration periods. Finally, we selected the
data from mid-summer (mid of May to mid of July) or June with maximum radial
increment for analyzing growth-climate relationships. In this period, diurnal stem
radius changes due to swelling and shrinking normally do not exceed daily radial
growth rates and the daily SRC7 and SRC21 figures were indeed always positive in
the five species in this period (except for a few negative SRC7 values in Tilia). Thus,
the conditions for the extraction of growth patterns from stem radius changes are
most promising during mid-summer (Deslauriers et al. 2007b).
Seasonality of growth rate and growth control in the five species
In the study year 2009 with a wet and warm summer without pronounced dry
periods, all five species showed maximum daily radial growth in June and July
which is in accordance with results from other studies on the growth dynamics of
temperate broad-leaved trees (e.g. Mund et al. 2010). Čufar et al. (2008) detected
highest stem growth rates in beech in June and concluded that the rainfall amount in
May prior to this peak growth period is of high importance for the annual growth-
ring width of Fagus. Our growth data for the five species with a resolution of one
day point to a particularly tight coupling of growth to the atmospheric water status in
June when peak increment occurred but indicate a remarkably small effect of
atmospheric moisture in May (Table 4.5, Figure 4.5). We assume that the marked
seasonality in radial increment and the climatic control of growth in the five species
are reflecting an endogenous control of cambial activity which is exerted through
bud and leaf phenology, the seasonal dynamics of photosynthetic capacity, and the
supply of photosynthates for stem growth (Čufar et al. 2008). A girdling experiment
with young Juglans plants showed that radial growth completely ceased three days
after the inhibition of photoassimilate transport to the cambium (Daudet et al. 2005)
which indicates the importance of carbohydrate supply and hormonal growth
regulators (Evert et al. 1972) for cambial activity over time spans of several days.
The pronounced species differences in the timing of growth cessation in late summer
may have been caused by species differences in the seasonal production of growth-
promoting hormones; the Acer trees reduced their stem increment already in July

CHAPTER 4
106
while the other four species continued radial growth until September. Nevertheless,
stem water status is assumed to be the principal growth-controlling factor on short
(hours, days) and medium time spans (weeks, months) in temperate broad-leaved
trees (Zweifel et al. 2006).
Weather dependence of growth
Among the six environmental factors examined for their influence on daily stem
radius change, we found the strongest effect by mean daily relative air humidity and
vapor pressure deficit. In all five species, the largest increase in stem radius was
found on days with highest RH and lowest D; the other hydrological variables soil
moisture and rainfall, and temperature and radiation had a much smaller or even
insignificant influence on a daily basis. These results confirm the frequently
recognized dominant effect of water availability on stem diameter growth in
temperate trees (e.g. Orwig and Abrams 1997, Lebourgeois et al. 2005). However,
these findings contrast with the results of tree ring studies in temperate broad-leaved
trees which, in most cases, evidence a dominant influence of the summer
precipitation amount of the recent year, or of the preceding year, on annual ring
width (Tardif et al. 2001a, Čufar et al. 2008). Dendrochronological studies typically
show largest rainfall effects in drier and warmer regions and a decrease in the
importance of this factor toward moister and colder climates (e.g. Bréda et al. 2006,
Vittoz et al. 2008). Air humidity and vapour pressure deficit have only rarely been
identified as dominant growth-influencing factors in dendrochronological climate
sensitivity analyses (e.g. McLaughlin et al. 2003) and the importance of these
atmospheric factors is usually secondary to the effects of seasonal and annual rainfall
totals and temperature.
The apparent discrepancy between our dendrometer study and
dendrochronological investigations with respect to the relative importance of
atmospheric moisture status, precipitation and temperature as controls of stem
diameter growth is possibly a consequence of different time scales of investigation.
Dendrochronological studies typically analyze growth in time periods of several
months to years, thus integrating over consecutive episodes of cambial cell division
and expansion growth. This is a time horizon which may cover distinct changes in
soil moisture as caused by fluctuating precipitation intensities. In contrast, precision
dendrometers with a resolution of minutes or hours may record cambial activity and

Stem growth patterns in five tree species
107
cell expansion quasi in situ, because a typical mitotic cycle lasts for about 24 hours.
Rainfall events with subsequent infiltration into the soil may take hours to reach the
absorbing roots and pronounced increases in soil moisture with physiological
significance may only manifest after larger events and sometimes with a delay, if soil
hydraulic conductivity is moderate to low. Thus, we assume that changes in
atmospheric moisture status and evaporative demand during a day and between
consecutive days are rapid enough to influence tree water status on a daily time scale,
while rainfall and resulting soil moisture variation exhibit a more coarse-grained
event structure which may, under certain edaphic conditions, be of secondary
importance for the actual tree water status and thus for cambial activity.
From the high significance of the air humidity and vapour pressure deficit effects
in our analysis, we hypothesize that both atmospheric moisture parameters are key
determinants of short-term fluctuation in cambial water status in the examined trees
as long as significant soil desiccation is absent. During the main period of stem
growth in 2009, soil matrix potential stayed well above -0.1 MPa in 10 cm soil depth
of the Hainich forest and thus did not expose the trees to significant drought stress.
We predict that the influence of atmospheric water status on radial stem growth
should be particularly large in comparison to soil water status and rainfall when the
climate is humid or semi-humid lacking long drought periods. Soil texture should
also influence the relative importance of soil vs. atmospheric water status on stem
radial growth, for example through a low hydraulic conductivity in clay-rich soils,
which may dampen the effect of rainfall events on tree water status, while we would
expect a particularly large effect of soil moisture on radial growth on coarse-grained
sandy soils with a small water storage capacity and a higher moisture fluctuation.
Several existing high-precision dendrometer studies examining weather effects
on stem growth obtained results which are in accordance with these predictions. For
example, in boreal forest trees in Quebec, Canada, the largest influence on daily
radial growth was exerted by rainfall while temperature and D were only secondary
factors (Tardif et al. 2001b, Deslauriers et al. 2003). In a dry subtropical Eucalyptus
forest in SE Australia, Downes et al. (1999) found soil moisture to be a major
determinant of daily radial stem growth, while Drew et al. (2008) identified
temperature together with rainfall in a nearby E. globulus plantation to be of primary
importance. In colder climates, the influence of temperature on radial growth is
expected to increase relative to the hydrological factors. At the temperate alpine tree
CHAPTER 4
108
line, temperature has been found to be a primary driver of daily radial growth
(Gruber et al. 2009). However, stem growth can also negatively be related to
temperature (Deslauriers et al. 2007a) because cold-adapted trees may suffer under
hot summer days (Zweifel et al. 2006).
Radial stem growth is driven by two processes, cell division and cell expansion
in the cambial zone, with the latter being particularly sensitive to turgor reductions
(Hsiao and Acevedo 1974). Several factors and processes are decisive during cell
expansion, the exceeding of a turgor threshold (Lockhart 1965), cell wall loosening
as mediated by expansins, the promotion of expansion by hormones, mainly auxin
(Lambers et al. 2008), and the postponed deposition of secondary cell-wall
components (Larson 1994). According to Domec and Gartner (2002), the formation
of early wood in conifers is triggered by high auxin concentrations. Thus,
environmental factors with an influence on cell water status and endogenous factors
(including carbohydrate availability) are interacting during cell expansion. However,
the bulk of empirical evidence indicates that the water status of the cambium is
playing a central role in controlling radial stem growth. Observational data and
modelling results suggest that radial growth in woody plants is occurring mainly
during the night hours when turgor is high (Dünisch and Bauch 1994, Steppe et al.
2006). Since the stem cambium is situated on the flow path from the soil through the
plant to the atmosphere, it seems logical that not only soil moisture (and
precipitation), but also the atmospheric moisture status at the opposite end of the
water flow path are influencing radial growth. It may well be that small amounts of
rainfall exert a positive effect on cambial activity not by increasing soil water
potential, but through a reduction in transpiration rate due to lowered D or leaf
wetting and a sudden release of negative pressure in the conducting system (Hsiao
and Acevedo 1974, Steppe et al. 2006, Zweifel et al. 2006).
Conclusion
From our analysis of stem radius change in five temperate broad-leaved tree species
at observation windows of 1, 7 or 21 days, we conclude that cambial growth during
mid-summer 2009 was primarily influenced by air humidity (and vapour pressure
deficit) in this mixed stand while rainfall, soil moisture status and air temperature
were playing only a secondary role. Radial increment linearly increased with relative
air humidity in all five species and showed a pronounced seasonality in its RH

Stem growth patterns in five tree species
109
dependence with highest sensitivity to air humidity in June during peak growth. We
explain the RH effect on radial growth mainly by a reduced transpiration rate and
thus a reduction in negative pressure in the conducting system which increases turgor
in the cambial cells and their differentiating derivatives and promotes cell division
and cell expansion. Whether the water status of the cambial cells in the stem xylem
of trees is mainly influenced by rainfall and soil moisture patterns or by the
atmospheric water status, might depend on the time scale considered and is likely to
vary with climate and soil physical conditions. We speculate that an assumed close
coupling of cambial growth with the variation in air humidity is only detectable when
growth is analysed on a daily basis; however, stem swelling and shrinking are often
confounding the analysis at this time scale. Supplementary analyses of stem diameter
change at longer temporal scales (several days to a few weeks) and direct observation
of cambial cell division may be needed to refine the analysis of environmental
control of radial growth processes in temperate trees. Our findings suggest that the
understanding of hydrologic effects on the stem water status and cambial activity of
trees needs to consider both, soil water status and atmospheric water status as
controlling factors.
Funding
This study was conducted within the framework of Graduiertenkolleg 1086 with
funding from the German Research Foundation (DFG).
Acknowledgements
We would like to acknowledge the good cooperation with the management of
Hainich National Park, Thuringia. We thank Ingo Beckmeyer for his help with the
installation of the equipment in the field and Heinz Coners for technical support.

CHAPTER 4
110
References
Archambault, S. and Y. Bergeron. 1992. An 802-year tree-ring chronology from the Quebec boreal forest. Can. J. For. Res. 22: 674-682.
Aussenac, G. and A. Granier. 1988. Effects of thinning on water stress and growth in Douglas-fir. Can. J. For. Res. 18: 100-105.
Beedlow, P.A., D.S. Daly and M.E. Thiede. 1986. A new device for measuring fluctuations in plant stem diameter: implications for monitoring plant responses. Environ. Monit. Assess. 6: 277-282.
Bouriaud, O., J.-M. Leban, D. Bert and C. Deleuze. 2005. Intra-annual variations in climate influence growth and wood density of Norway spruce. Tree Physiol. 25: 651-660.
Braekke, F.H., T.T. Kozlowski and T. Skröppa 1978. Effects of environmental factors on estimated daily radial growth of Pinus resinosa and Betula papyrifera. Plant Soil 49:491-504
Bréda, N., A. Granier and G. Aussenac. 1995. Effects of thinning on soil and tree water relations, transpiration and growth in an oak forest (Quercus petraea (Matt.) Liebl.). Tree Physiol. 15: 295-306.
Bréda, N., R. Huc, A. Granier and E. Dreyer. 2006. Temperate forest trees and stands under severe drought: a review of ecophysiological responses, adaptation processes and long-term consequences. Ann. For. Sci. 63: 625-644.
Cochard, H., S. Forestier and T. Améglio. 2001. A new validation of the Scholander pressure chamber technique based on stem diameter variations. J. Exp. Bot. 52: 1361-1365.
Cook, E. and L. Kairiūkštis. 1990. Methods of dendrochronology: applications in the environmental sciences. Kluwer, Dordrecht, 394p.
Čufar K, Prislan P, De Luis M, Gričar J. 2008. Tree-ring variation, wood formation and phenology of beech (Fagus sylvatica) from a representative site in Slovenia, SE Central Europe. Trees 22: 749-758.
D’Arrigo, R.D., G.C. Jacoby and R.M. Free. 1992. Tree-ring width and maximum latewood density at the North American tree line: parameters of climatic change. Can. J. For. Res. 22: 1290-1296.
Daudet, F.A., T. Améglio, H. Cochard, O. Archilla and A. Lacointe. 2005. Experimental analysis of the role of water and carbon in tree stem diameter variations. J. Exp. Bot. 56: 135-144.
Deslauriers, A., T. Anfodillo, S. Rossi and V. Carraro. 2007a. Using simple causal modeling to understand how water and temperature affect daily stem radial variation in trees. Tree Physiol. 27: 1125-1136.
Deslauriers, A. and H. Morin. 2005. Intra-annual tracheid production in balsam fir stems and the effect of meteorological variables. Trees 19: 402-408.

Stem growth patterns in five tree species
111
Deslauriers, A., H. Morin, C. Urbinati and M. Carrer. 2003. Daily weather response of balsam fir (Abies balsamea (L.) Mill.) stem radius increment from dendrometer analysis in the boreal forests of Quebec (Canada). Trees 17: 477-484.
Deslauriers, A., S. Rossi and T. Anfodillo. 2007b. Dendrometer and intra-annual tree growth: What kind of information can be inferred? Dendrochronologia 25: 113-124.
Dobbs, R.C. and D.R.M. Scott. 1971. Distribution of diurnal fluctuations in stem circumference of Douglas-fir. Can. J. For. Res. 1: 80-83.
Domec, J.C. and B.L. Gartner. 2002. How do water transport and water storage differ in coniferous earlywood and latewood? J. Exp. Bot. 53: 2369-2379.
Downes, G.M., C. Beadle and D. Worledge. 1999. Daily stem growth patterns in irrigated Eucalyptus globulus and E. nitens in relation to climate. Trees 14: 102-111.
Drew, D.M. and G.M. Downes. 2009. The use of precision dendrometers in research on daily stem size and wood property variation: a review. Dendrochronologia 27: 159-172.
Drew, D.M., A.P. O’Grady, G.M. Downes, J. Read and D. Worledge. 2008. Daily patterns of stem size variation in irrigated and unirrigated Eucalyptus globulus. Tree Physiol. 28: 1573-1581.
Dünisch, O. and J. Bauch. 1994. Influence of soil substrate and drought on wood formation of spruce (Picea abies [L.] Karst.) under controlled conditions. Holzforschung 48: 447-457.
Evert, R.F., T.T. Kozlowski and J.D. Davis. 1972. Influence of phloem blockage on cambial growth of sugar maple. Am. J. Bot. 59: 632-641
Gall, R., W. Landolt, P. Schleppi, V. Michellod and J.B. Bucher. 2002. Water content and bark thickness of Norway spruce (Picea abies) stems: phloem water capacitance and xylem sap flow. Tree Physiol. 22: 613-623.
Gebauer, T., V. Horna and C. Leuschner. 2008. Variability in radial sap flux density patterns and sapwood area among seven co-occurring temperate broad-leaved tree species. Tree Physiol. 28: 1821-1830.
Gruber, A., J. Zimmermann, G. Wieser and W. Oberhuber 2009. Effects of climate variables on intra-annual stem radial increment in Pinus cembra (L.) along the alpine treeline ecotone. Ann. For. Sci. 66: 503.
Guckland, A., M. Jacob, H. Flessa, F.M. Thomas and C. Leuschner. 2009. Acidity, nutrient stocks, and organic matter content in soils of a temperate deciduous forest with different abundance of European beech (Fagus sylvatica L.). J. Plant Nutr. Soil Sci. 172: 500-511.
CHAPTER 4
112
Herzog, K.M., R. Häsler and R. Thum. 1995. Diurnal changes in the radius of a subalpine Norway spruce stem: their relation to the sap flow and their use to estimate transpiration. Trees 10: 94–101.
Hofgaard, A., J. Tardif and Y. Bergeron. 1999. Dendroclimatic response of Picea mariana and Pinus banksiana along a latitudinal gradient in the eastern Canadian boreal forest. Can. J. For. Res. 29: 1333-1346.
Hsiao, T.C. and E. Acevedo. 1974. Plant responses to water deficits, water-use efficiency, and drought resistance. Agr. Meteorol. 14: 59-84.
Hughes, M.K., T.W. Swetnam and H.F. Diaz. 2011. Dendroclimatology. Progress and Prospects. Springer, Dordrecht, 365p.
Irvine, J. and J. Grace. 1997. Continuous measurements of water tensions in the xylem of trees based on the elastic properties of wood. Planta 202: 455-461.
Köcher, P., T. Gebauer, V. Horna and C. Leuschner. 2009. Leaf water status and stem xylem flux in relation to soil drought in five temperate broad-leaved tree species with contrasting water use strategies. Ann. For. Sci. 66: 101.
Kozlowski, T.T. and C.H. Winget. 1964. Diurnal and seasonal variation in radii of tree stems. Ecology 45: 149-155.
Kozlowski, T.T. and S.G. Pallardy. 1997. Growth Control in Woody Plants. Academic Press, San Diego, 641p.
Lambers, H., F.S. Chapin and T.L. Pons. 2008. Plant physiological ecology. Springer, New York, Berlin, Heidelberg, 604p.
Larson, P.R. 1994. The vascular cambium: development and structure. Springer, Berlin, 725p.
Lebourgeois, F., N. Bréda, E. Ulrich and E. Granier. 2005. Climate-tree-growth relationships of European beech (Fagus sylvatica L.) in the French Permanent Plot Network (RENECOFOR). Trees 19: 385-401.
Liphschitz, N. and S. Lev-Yadun. 1986. Cambial activity of evergreen and seasonal dimorphics around the Mediterranean. IAWA Bull. ns. 7:145-153.
Lockhart, J.A. 1965. An analysis of irreversible plant cell elongation. J. Theor. Biol. 8: 264-275.
Mäkinen, H., J.W. Seo, P. Nöjd, U. Schmitt and R. Jalkanen 2008. Seasonal dynamics of wood formation: a comparison between pinning, microcoring and dendrometer measurements. Eur. J. Forest Res. 127:235-245
McLaughlin, S.B., S.D. Wullschleger and M. Nosal. 2003. Diurnal and seasonal changes in stem increment and water use by yellow poplar trees in response to environmental stress. Tree Physiol. 23: 1125-1136.
Molz, F.J.K. and B. Klepper. 1973. On the mechanism of water-stress-induced stem deformation. Agron. J. 65: 304-306.

Stem growth patterns in five tree species
113
Mund, M., W.L. Kutsch, C. Wirth, T. Kahl, A. Knohl, M.V. Skomarkova and E.D. Schulze. 2010. The influence of climate and fructification on the inter-annual variability of stem growth and net primary productivity in an old-growth, mixed beech forest. Tree Physiol. 30: 689-704.
Offenthaler, I., P. Hietz and H. Richter. 2001. Wood diameter indicates diurnal and long-term patterns of xylem water potential in Norway spruce. Trees 15: 215-221.
Orwig, D.A. and M.D. Abrams. 1997. Variation in radial growth responses to drought among species, site, and canopy strata. Trees 11: 474-484.
Rossi, S., A. Deslauriers, T. Anfodillo, H. Morin, A. Saracino, R. Motta and M. Borghetti . 2006. Conifers in cold environments synchronize maximum growth rate of tree-ring formation with day length. New Phytol. 170: 301–310.
Schaap, M.G., F.J Leij and M.T. van Genuchten. 1998. Neural network analysis for hierarchical prediction of soil hydraulic properties. Soil Sci. Soc. Am. J. 62:847–855.
Schmidt, I., C. Leuschner, A. Mölder and W. Schmidt. 2009. Structure and composition of the seed bank in monospecific and tree species-rich temperate broad-leaved forests. For. Ecol. Manag. 257: 695-702.
Schweingruber, F.H. 1996. Tree rings and environment dendroecology. Paul Haupt, Berne, 609p.
Schweingruber, F.H., K.R. Briffa and P. Nogler. 1993. A tree-ring densitometric transect from Alaska to Labrador. Int. J. Biometeorol. 37: 151-169.
Sevanto, S., T. Vesala, M. Peramaki and E. Nikinmaa. 2002. Time lags for xylem and stem diameter variations in a Scots pine tree. Plant Cell Environ. 25: 1071-1077.
Simonneau, T., R. Habib, J.P. Goutouly and J.G. Huguet. 1993. Diurnal changes in stem diameter depend upon variations in water content: direct evidence in peach trees. J. Exp. Bot. 44: 615-621.
Steppe, K., D.J.W. De Pauw, R. Lemeur and P.A. Vanrolleghem. 2006. A mathematical model linking tree sap flow dynamics to daily stem diameter fluctuations and radial stem growth. Tree physiol. 26: 257-273.
Tardif, J., J. Brisson and Y. Bergeron. 2001a. Dendroclimatic analysis of Acer saccharum, Fagus grandifolia, and Tsuga canadensis from an old-growth forest, southwestern Quebec. Can. J. For. Res. 31: 1491-1501.
Tardif, J., M. Flannigan and Y. Bergeron. 2001b. An analysis of the daily radial activity of 7 boreal tree species, northwestern Quebec. Environ. Monit. Assess. 67: 141-160.

CHAPTER 4
114
Vittoz, P., B. Rulence, T. Largey and F. Freléchoux . 2008. Effects of climate and land-use change on the establishment and growth of cembran pine (Pinus cembra L.) over the altitudinal treeline ecotone in the central Swiss alps. Arct. Antarct. Alp. Res. 40: 225-232.
Wimmer, R., G.M. Downes and R. Evans. 2002. High-resolution analysis of radial growth and wood density in Eucalyptus nitens, grown under different irrigation regimes. Ann. For. Sci. 59: 519-524.
Zweifel, R. and R. Häsler. 2000. Frost-induced reversible shrinkage of bark of mature subalpine conifers. Agr. For. Meteorol. 102: 213-222.
Zweifel, R. and R. Häsler. 2001. Dynamics of water storage in mature subalpine Picea abies: temporal and spatial patterns of change in stem radius. Tree Physiol. 21: 561-569.
Zweifel, R., H. Item and R. Häsler. 2000. Stem radius changes and their relation to stored water in stems of young Norway spruce trees. Trees 15: 50-57.
Zweifel, R., L. Zimmermann and D.M. Newbery. 2005. Modeling tree water deficit from microclimate: an approach to quantifying drought stress. Tree Physiol. 25: 147-156.
Zweifel, R., L. Zimmermann, F. Zeugin and D.M. Newbery. 2006. Intra-annual radial growth and water relations of trees: implications towards a growth mechanism. J. Exp. Bot. 57: 1445-1459.


Chapter 5
Synthesis

CHAPTER 5
118
In chapter 1 we discuss the known effects of climate change and biodiversity on
ecosystem functioning, in particular on forest ecosystems. However, in our study
area, the Hainich forest, which shelters a remarkably high number of tree species, the
identity of tree species within a stand and their related functional properties seem to
be more important for biogeochemical cycles and biotic interactions than tree species
diversity per se (e.g. Gebauer 2010, Jacob 2010, Meinen 2008, Langenbruch 2012).
These results support the hypotheses that effects of tree species diversity, at least in
this forest, are due to a higher probability of species-rich communities to include
species with important functional traits, thereby having a disproportional influence
on ecosystem processes (selection mechanism, see chapter 1). Consequently, we
aimed at a characterization of five co-occurring broad-leaved tree species with
respect to functional traits that are relevant for hydrological processes. These traits
are summarized in Table 5.1.
The water status of trees is a crucial factor for their vitality and also forest
productivity and in the context of climate change scenarios and current forest
conversion, it is important to draw conclusions about the species’ ability to withstand
increasing drought exposure. In a previous study, we ranked the five investigated tree
species in terms of their drought sensitivity in the order Fagus > Acer > Tilia >
Carpinus > Fraxinus (Köcher et al. 2009). The capability of tree species to maintain
high values of predawn leaf water potential, leaf conductance and xylem flux density
upon soil drought were used as criteria for a low sensitivity of species to water
shortage.
In the second chapter of the present study, we focused on the traits of small-
diameter roots of the five selected tree species, as these play a key role for tree water
uptake. We hypothesized that drought-sensitive species generally have larger vessels
in their roots which are thought to be more susceptible to cavitation (e.g. Hargrave et
al. 1994, Cai and Tyree 2010). Our results showed that differences in the anatomy of
small-diameter roots can be partly related to the assumed drought tolerance of the
species. Fraxinus, as the probably most drought-tolerant species, showed smallest
vessel diameters and a comparatively low vessel density. In contrast, drought-
sensitive Fagus exhibited largest mean vessel diameters. However, small vessels
were not found to be advantageous with respect to cavitation resistance because the
degree of root xylem embolism (PLC) did not show the expected dependence on
mean vessel diameter among the five species and highest PLC values were measured

Synthesis
119
in Fraxinus trees with smallest vessel diameters. The low root-specific conductivity
of this species in combination with high PLC values is possibly compensated by a
relatively large fine root biomass, a small leaf area and thus a low canopy
transpiration which enables Fraxinus to maintain constant sap flow rates even during
dry summer spells (Köcher et al. 2009). We found a large intra-specific variability in
the axial conductivity of roots of similar diameters with several roots having a 4-8
fold higher conductivity and were apparently functioning as “high-conductivity
roots”. The large root morphological and functional plasticity in all studied species is
possibly a response to the high heterogeneity of moisture in soils, in particular in
those trees exposed to periodic drought as it is the case in the Hainich forest.
Another important hydraulic trait of tree species is their capability to transiently
replace transpirational losses using water withdrawn from storage tissues, whereby a
drop in leaf water potential is prevented. This enables the plant to maintain stomatal
opening and carbon assimilation in periods of water shortage. During the last three
decades, much progress has been made in our understanding of the functional
significance of internal plant water stores to support diurnal and seasonal
transpiration in tropical and coniferous tree species. In chapter 3 we could show that
water extracted from storage is a significant factor also in temperate deciduous tree
species. However, considerable species differences in the amount of stored water
used for transpiration do exist. These differences are mainly determined by sapwood
area size but depend also on wood density. Consequently, the use of stored water was
generally high in the four diffuse-porous species (larger sapwood area) and highest in
Tilia (lowest wood density). Ring-porous species may possess a much smaller
storage capacity in the trunk which is also indicated by a lack of significant time lags
between the onset of water flow along the flow path in Fraxinus. The low water
storage capacity and a highly efficient xylem in the stem (large conduits, minimum
time lags) that supplies water to a relatively small leaf area seem to combine in the
anisohydric strategy of ring-porous Fraxinus which further includes a high tolerance
of water potential reductions (Table 5.1). Thus, reliance on stored water appears to
be rather low in Fraxinus but the functional significance of stem water stores in
diffuse- porous tree species is likely to increase in the future. The size of the stem
store has to be measured in additional ring-porous trees species before more general
conclusions on these differences in ring- and diffuse-porous species can be drawn.
CHAPTER 5
120
In chapter 4, we dealt with radial stem growth in woody plants which is
principally controlled by the water status of the stem cambium and the interplay of
multiple microclimatic factors. The ability of tree species to maintain high growth
rates under a changing climate is not only important for the tree species vitality and
success in competition but also of major interest for forestry in terms of wood
production. From our study on stem radius change in the five tree species, we
concluded that cambial growth during mid-summer was primarily controlled by air
humidity and vapor pressure deficit, rather than soil moisture. Daily stem radius
increment linearly increased with decreasing evaporative demand in all tree species
and exhibited a pronounced seasonality in its dependence on relative air humidity
with highest sensitivity to air humidity during peak growth in June. We explain this
positive effect of high air humidity on radial stem increment by lowered transpiration
which reduces negative pressure in the conducting system and increases turgor in the
stem cambium cells, thereby favoring cell division and expansion. Our results
suggest that climate change will impact on the growth performance of plants not only
by reductions in soil water availability but also via increases in evaporative demand
as it is predicted worldwide with rising temperatures. Thus, to understand
hydrological effects on stem water status and cambial activity, both, soil water status
and atmospheric water status as controlling factors must be considered.
We could show that prominent differences in functional traits do exist between
the five studied tree species. As a consequence, these tree species differ in
transpiration rate, water use strategy and drought tolerance. Although this study does
not allow to draw conclusions about effects of tree diversity on the water use of
temperate mixed forests with respect to facilitation and complementarity
mechanisms, it clearly shows that species identity and the related functional traits are
a key determinant for stand water turnover in the Hainich forest.
In terms of root hydraulic architecture and the use of stored stem water, our
results fit into the ranking of the species’ drought tolerance developed in a previous
study (Köcher et al. 2009). Fraxinus as the most drought-tolerant species and Fagus
and Acer as relatively drought-sensitive species clearly possess contrasting water use
strategies (anisohydric/isohydric) whereas Carpinus and Tilia take an intermediate
position in this ranking. In terms of forest conversion, these results are important
since increasing summer temperatures and drought may change the competitive

Synthesis
121
abilities of the tree species inducing alterations in species composition in favor of
those species that are able to cope with drought.
Future studies should focus on the less studied belowground components of a
forest, for instance, on the adaptation capacity of root morphological traits within a
species under different environmental and site conditions in order to better predict
the effects of increasing drought intensitiy on the water relations of temperate broad-
leaved forests. Furthermore, we need to deepen our understanding of diurnal and
seasonal water use from storage tissues in temperate deciduous forest trees. This trait
may become even more important under future predicted climate change and
therefore represents a relevant study topic.

CHAPTER 5
122
Table 5.1 Functional traits of the five studied tree species that are relevant for hydrological processes according to results and species categorizations of the present and additional studies.
Species Fraxinus excelsior
Acer pseu-doplatanus
Carpinus betulus
Tilia cordata
Fagus sylvatica
Familiy Oleaceae Aceraceae Betulaceae Tiliaceae Fagaceae
Successional status early/mid mid/late mid/late mid/late late
Xylem anatomy ring diffuse diffuse diffuse diffuse Wood density1 (g cm-3)
0.59 (0.045) a
0.59 (0.030) a
0.67 (0.024) b
0.43 (0.063) c
0.65 (0.025) b
Stomatal conductance2 (max) (mmol m-2 s-1)
270 160 270 250 150
Predawn leaf water potential2 (min) (MPa)
-1.43 -0.85 -0.63 -1.16 -1.79
Midday leaf water potential2 (min) (MPa)
-3.10 -1.67 -2.46 -2.09 -2.63
P50 of saplings3
(MPa) no data
available -3.66 -4.90 -3.48 -3.32
P50 of mature trees4
(MPa) no data
available -3.42 -4.25 -2.99 -3.17
Drought tolerance high mid/low mid mid low
Water use strategy anisohydric isohydric (aniso-hydric)
(aniso-hydric) isohydric
Stem water storage (kg d-1) 1.23 (10%) 6.6 (22%) 5.3 (12%) 9.3 (17%) 5.0 (13%)
Branch-specific conductivity (mean) (kg MPa-1 s-1 m-1)
1.77 (0.15)
1.50 (0.10)
1.87 (0.12)
0.71 (0.05)
1.65 (0.08)
Root-specific conductivity (mean) (kg MPa-1 s-1 m-1)
4.48 (0.77)
3.91 (0.51)
8.82 (1.64)
10.38 (1.66)
13.03 (1.40)
Root vessel diameter (mean) (µm) 35.0 (1.1) 38.7 (1.7) 38.7 (1.7) 41.9 (1.9) 42.3 (1.4)
Root vessel density (mean) (n mm-2) 53 (2) 81 (6) 78 (7) 118 (6) 114 (6)
P50; Xylem water potential that induces 50% loss of hydraulic conductivity due to cavitation 1 Gebauer et al. 2008; 2 Köcher et al. 2009; 3 Luebbe unpublished; 4 Pfefferkorn unpublished

Synthesis
123
References
Cai J, Tyree MT (2010) The impact of vessel size on vulnerability curves: data and models for within-species variability in saplings of aspen, Populus tremuloides Michx. Plant Cell Environ 33:1059-1069
Gebauer T (2010) Water turnover in species-rich and species-poor deciduous forests: xylem sap flow and canopy transpiration. PhD thesis, University of Göttingen, Germany.
Hargrave K, Kolb K, Ewers F, Davis S (1994) Conduit diameter and drought-induced embolism in Salvia mellifera Greene (Labiatae). New Phytol 126:695-705
Langenbruch C (2012) Effects of nutrient cycling through litter of different broadleaved deciduous tree species on soil biochemical properties and the dynamics of carbon and nitrogen in soil. PhD thesis, University of Göttingen, Germany.
Jacob M (2010) Productivity and nutrient relations of trees in deciduous forests differing in tree species diversity. PhD thesis, University of Göttingen, Germany.
Köcher P, Gebauer T, Horna V, Leuschner C (2009) Leaf water status and stem xylem flux in relation to soil drought in five temperate broad-leaved tree species with contrasting water use strategies. Ann For Sci 66:101
Meinen C (2008) Fine root dynamics in broad-leaved deciduous forest stands differing in tree species diversity. PhD thesis, University of Göttingen, Germany.


Chapter 6
Summary

CHAPTER 6
126
Without anthropogenic intervention, Central Europe would be covered by about 65%
by beech-dominated broad-leaved forests. However, large forest areas have been
replaced by coniferous monocultures since the early 19th century resulting in a
reduction of tree species diversity and a loss in structural forest diversity, thereby
increasing the vulnerability of forest stands to storms, snow, ice, drought and insect
damage. Only recently, forestry, in an effort to restore biodiversity, aims at a
conversion of pure coniferous forests into mixed stands. If the intensity of soil and
atmospheric drought are increasing in the future, the abundance and vitality of tree
species will depend on their capability to ensure water uptake. Trees have developed
several mechanisms and strategies to overcome water shortage which are closely
linked to morphological and physiological traits and thus vary with plant size,
species and functional type.
This thesis is focused on water relations and hydraulic traits of five co-occurring
temperate tree species (Fagus sylvatica L., Acer pseudoplatanus L., Fraxinus
excelsior L., Carpinus betulus L., and Tilia cordata Mill.) in the Hainich forest and
took place within the framework of the Research Training Group (RTG) 1086 “The
role of biodiversity for biogeochemical cycles and biotic interactions in temperate
deciduous forests”. The studies were conducted on a research site in the Hainich
forest where all five tree species are present with at least five mature tree individuals
per species, reaching the upper canopy layer, are of comparable stem size and are
accessible with a canopy lift.
Starting in 2008, we examined root anatomical and hydraulic traits in the five
tree species, analyzed the relation between root anatomy and hydraulic conductivity
and investigated the relation of these traits to the species’ drought tolerance. In
small-diameter roots (2-6 mm), we measured vessel diameters and vessel density,
specific hydraulic conductivity, and the percental loss of conductivity (“native”
embolism) during summer. Specific conductivity was positively related to vessel
diameter but not to vessel density. Drought-tolerant Fraxinus showed the smallest
mean vessel diameters and drought-sensitive Fagus the largest. Specific conductivity
was highly variable among different similar-sized roots of the same species with a
few roots apparently functioning as “high-conductivity roots”. The results show that
coexisting tree species can differ largely in root hydraulic traits with more drought-
sensitive trees apparently having larger mean vessel diameters in their roots than

Summary
127
tolerant species. However, this difference was not related to the observed root
conductivity losses due to embolism.
In 2009, we concentrated on sap flux density and diurnal and seasonal stem radial
variations of the five tree species. Sap flux density was recorded synchronously at
five positions along the root-to-branch flow path of mature trees (roots, three stem
positions, branches) with high temporal resolution (2 min) and related to stem radius
measurements. The daily amount of stored stem water withdrawn for transpiration
was estimated by comparing the integrated flow at stem base and stem top. Our
results confirm that internal water stores are playing an important role in the four
diffuse-porous species with 5-12 kg d-1 being withdrawn on average in 25-28 m tall
trees representing 10-22 % of daily transpiration; in contrast, only 0.5 – 2.0 kg d-1
was withdrawn in ring-porous Fraxinus. Sapwood area size (diffuse- vs. ring-porous)
had the largest influence on storage but wood density was also influential. Across the
five species, the length of the time lag in flow at stem top and stem base was
positively related to the size of stem storage. The stem stores were mostly exhausted
when soil matrix potential dropped below -0.1 MPa and daily mean VPD exceeded
3-5 hPa. Different degrees of coupling seem to exist between branch, stem and root
flows. We conclude that stem storage is an important factor improving the water
balance of diffuse-porous temperate broad-leaved trees in moist periods while it is
most likely of low relevance in dry periods and in ring-porous species.
Measurements of stem radial variation were also used to generate radial stem
growth rates in daily resolution which were analyzed in its response to environmental
factors. Daily stem radius change (SRCd) was primarily influenced by the
atmospheric demand (RH and VPD) while rainfall, soil matrix potential, temperature
and radiation were only secondary factors. SRCd increased linearly with increasing
RH and decreasing VPD in all species. The positive effect of a low atmospheric
water vapor demand on SRCd was largest in June. We explain the strong positive
effect of high RH and low VPD on radial stem increment by lowered transpiration
which reduces negative pressure in the conducting system and increases turgor in the
stem cambium cells, thereby favoring cell division and expansion. Our results
suggest that climate change will impact on the growth performance of plants not only
by reductions in soil water availability but also via increases in evaporative demand
as it is predicted worldwide with increasing temperatures.


Acknowledgments
Zunächst möchte ich Prof. Dr. Christoph Leuschner danken, der mir die Möglichkeit
gegeben hat an diesem interessanten Forschungsthema zu arbeiten und mich mit
Ideen und Diskussionen immer unterstützt hat. Ganz besonders bedanke ich mich bei
Dr. Viviana Horna für die tolle und engagierte Betreuung während der langen Zeit
die meine Arbeit gebraucht hat. Danke, Danke, Danke. Prof. Dr. Markus Hauck
möchte ich für die Übernahme des Korreferats danken sowie allen weiteren
Mitgliedern der Prüfungskommission.
Weiterhin danke ich der Deutschen Forschungsgemeinschaft für die Finanzierung
dieses Projekts das im Rahmen des Graduiertenkollegs 1086 stattgefunden hat.
Ohne Ingo, der mit seiner Diplomarbeit viel zum Erkenntnisgewinn der
Wasserleitung in Wurzeln beigetragen hat, hätte ich im ersten Jahr im Hainich lange
nicht so viel Spaß gehabt. Es gab immer was zu lachen mit Dir auch wenn das
Buddeln im Dreck vielleicht nicht die angenehmste Arbeit war. Dafür hat das
Trecker fahren Spaß gemacht. Allen Kollegen aus dem Graduiertenkolleg möchte ich
für die schöne gemeinsame Zeit die wir im Hainich verbracht haben und für die gute
Zusammenarbeit danken. Andreas und Alex, mit euch habe ich mir ein Büro geteilt,
wir haben zusammen gelacht und gelitten und ich hab mich immer wohl gefühlt. Ich
hatte außerdem das Glück in einer sehr netten Arbeitsgruppe zu sein und es hat mir
viel Spaß gemacht mit euch Kaffee und Bier zu trinken, Tischtennis zu spielen,
Fußball zu gucken und zu diskutieren und zu arbeiten. Danke dafür. Besonders
möchte ich mich noch bei Dr. Heinz bedanken, der einfach unschlagbar ist wenn es
um die Lösung technischer Angelegenheiten geht.
Im letzten Jahr meiner Arbeit habe ich bei Hilmar, Kirstin, Malte und Schelle
übernachtet wenn ich in Göttingen war. Ohne diese entspannte Möglichkeit wäre ich
durchgedreht. Vielen Dank.
Meinen Eltern möchte ich danken, dass sie mich haben machen lassen, dass sie
für mich da sind und mich im Endspurt finanziell unterstützt haben.
Rhea, du bist vermutlich genauso froh wie ich, dass es endlich geschafft ist. Du
warst immer für mich da und hast mir beigestanden auch wenn ich manchmal
wahrscheinlich nicht leicht zu ertragen war. Jetzt freue ich mich sehr auf unsere
gemeinsame Zeit zu dritt.