HYDRAULIC DESIGN OF INTERLOCKING CONCRETE ...
165
HYDRAULIC DESIGN OF INTERLOCKING CONCRETE PERMEABLE PAVERS A THESIS IN Civil Engineering Presented to the faculty of the University of Missouri-Kansas City in partial fulfillment of the requirements of the degree MASTER OF SCIENCE By MONICA RENE STOCHL B.S. Saint Louis University, 2013 Kansas City, Missouri 2015
Transcript of HYDRAULIC DESIGN OF INTERLOCKING CONCRETE ...
HYDRAULIC DESIGN OF INTERLOCKING CONCRETE PERMEABLE PAVERS
A THESIS IN
Civil Engineering
Presented to the faculty of the University of
Missouri-Kansas City in partial fulfillment of
the requirements of the degree
MASTER OF SCIENCE
By
MONICA RENE STOCHL
B.S. Saint Louis University, 2013
Kansas City, Missouri
2015

© 2015
MONICA RENE STOCHL
ALL RIGHTS RESERVED
iii
HYDRAULIC DESIGN OF INTERLOCKING CONCRETE PERMEABLE PAVERS
Monica René Stochl, Candidate for the Master of Science Degree
University of Missouri at Kansas City, 2015
ABSTRACT
Stormwater management and design was developed to reduce the impacts of
runoff due to the increase in urbanization and impervious area in the hydrologic system.
Stormwater management takes many different forms, including Best Management
Practices (BMP). BMPs include both non-structural and structural practices (McCall III,
2014). The focus of this thesis is on the structural BMP, Permeable Interlocking
Concrete Pavement (PICP). PICP is a type of pervious pavement that will increase the
amount of water infiltrated through joint spacing filled with open graded aggregate above
an open-graded base and sub-base, creating a stormwater storage and infiltration
(Interlocking Concrete Pavement Institute, 2014). The reduction of runoff from
increasing storage and infiltration, also reduces the amount of pollution that would enter
nearby water bodies (Environmental Protection Agency, 1999).
Laboratory testing was conducted on a PICP section with at a variety of slopes
and spacing. The laboratory results are presented in Amanda Leipard’s 2015 Thesis,
“Hydraulic Characterization of Permeable Interlocking Concrete Pavement”. The results
found the horizontal infiltrate rate for each variation lower than the corresponding
vertical infiltration rate. A computational design tool was built for PICP based on
relative storm information and site information to determine the hydraulic characteristics
the site can attain.
iv
APPROVAL PAGE
The following faculty listed as appointed by the Dean of the School of Computing
and Engineering, have examined a thesis entitled “Hydraulic Design of Interlocking
Concrete Permeable Pavement,” present by Monica R. Stochl, a candidate for the Master
of Science Degree, and certify in their opinion it is worthy acceptance.
Supervisory Committee
John T. Kevern, Ph.D., Co-Committee Chair
Department of Civil Engineering
Jerry Richardson, Ph.D., Co-Committee Chair
Department of Civil Engineering
Megan Hart, Ph.D.
Department of Civil Engineering
v
CONTENTS
ABSTRACT ....................................................................................................................... iii
LIST OF ILLISTRATIONS ............................................................................................. vii
LIST OF TABLES ............................................................................................................. ix
LIST OF EQUATIONS .......................................................................................................x
ACKNOWLEDGEMENTS ............................................................................................... xi
Chapter
1. OVERVIEW ........................................................................................................................ 1
2. LITERATURE REVIEW .................................................................................................... 3
Introduction of Clean Water Act ..............................................................................3
Urbanization in the Hydrologic Cycle .....................................................................5
Best Management Practices .....................................................................................8
Permeable Pavements Designed as Best Management Practice ............................10
PICP Benefits and Concerns ..................................................................................12
Permeable Interlocking Concrete Paver Design ....................................................13
Hydraulic Development of PICP ...........................................................................20
3. PICP TESTING & HYDRAULIC DESIGN ..................................................................... 26
PICP Section Materials ..........................................................................................26
Flume Design .........................................................................................................28
Analyzing Flume Results .......................................................................................31
Adjusted Values for Design Model........................................................................38
4. CLOGGING ...................................................................................................................... 41
Soil Characteristics ................................................................................................41
Adjusted Clogging Data .........................................................................................42
vi
5. HYDRAULIC DESIGN TOOL OWNER’S MANUAL................................................... 47
Owner’s Manual.....................................................................................................47
Inputs......................................................................................................................47
Storm Information ..................................................................................................48
Site Area Information ............................................................................................50
Outputs ...................................................................................................................55
Site Analysis ..........................................................................................................56
Storm Analysis .......................................................................................................57
Design Considerations ...........................................................................................59
Clogging Considerations ........................................................................................64
6. DESIGN TOOL EXAMPLES ........................................................................................... 66
Example 1 ..................................................................................................66
Example 1A ...............................................................................................68
Example 1B ................................................................................................70
Example 2 ..................................................................................................72
7. CONCLUSION & RESEARCH OPPORTUNITIES........................................................ 76
Appendix
A. HYDRAULIC CALCULATIONS .................................................................................... 78
B. PERFORMANCE CURVES ............................................................................................. 79
C. STORM INTENSITY TABLES ....................................................................................... 96
REFERENCES ..................................................................................................................97
VITA ................................................................................................................................101
vii
LIST OF ILLUSTRATIONS
Figure Page
1. Six Minimum Control Measures (Cass County Government, 2014.) ........................... 5
2. Effect of Impervious Surface on Hydrologic Cycle (NEH-653, 1998) ........................ 6
3. Examples of Structural BMP – Rain Garden (SUNY-ESF, 2015) ............................... 9
4. Example of Structural BMP - Rain Barrel (Rutgers, 2014) .......................................... 9
5. Types of Permeable Pavement (ICPI, 2014)............................................................... 11
6. PICP Cross Section (ICPI, 2014) ................................................................................ 14
7. Detail Drawings of Full Exfiltration of PICP (ICPI, 2014) ........................................ 16
8. Detailed Drawings of Partial Exfiltration of PICP (ICPI, 2014) ................................ 17
9. Detailed Drawings of No-Exfiltration of PICP (ICPI, 2014) ..................................... 18
10. Permeable Pavement Design Flow Chart (Smith, 2010) ............................................ 19
11. Water Inflow and Outflow on Permeable Pavement (Collins, 2008) ......................... 20
12. Overflow Diagram (Richardson, 1989). ..................................................................... 21
13. Full and Partial Equilibrium Hydrograph (Richardson, 1989). .................................. 22
14. Pavement Top View and Cross Section for Insipient Overflow ................................. 25
15. 90 Degree Herringbone Patter .................................................................................... 27
16. 45 Degree Herringbone Pattern .................................................................................. 27
17. PICP Cross Section ..................................................................................................... 27
18. Laboratory Flume Used for Data Collection .............................................................. 28
19. Vertical Infiltration Test Setup ................................................................................... 29
20. Vertical infiltration vs Pavement Slope ...................................................................... 30
viii
21. Performance Curve ..................................................................................................... 31
22. Case I - Pavement Top View and Cross Section for Insipient Overflow ................... 33
23. Case II - Pavement Top View and Cross Section for 1/4in Head ............................... 33
24. Case III - Pavement Top View and Cross Section for 1/2in Head ............................. 34
25. 6 mm Average Max Overflow Unit Rate per Pavement Cross Slope......................... 35
26. 10mm Average Max Overflow Unit Rate per Pavement Cross Slope........................ 35
27. 12.5 Average Max Overflow Unit Rate per Pavement Cross Slope ........................... 36
28. Horizontal Infiltration vs Vertical Infiltration ............................................................ 38
29. Water Services Field Construction ............................................................................. 39
30. 6 mm Spacing Flow Rate vs. Application .................................................................. 48
31. 10 mm Spacing Flow Rate vs. Application ................................................................ 49
32. 12.5mm Spacing Flow Rate vs. Application .............................................................. 50
33. Input Interface ............................................................................................................. 54
34. SCS TR-55 Storm Map ............................................................................................... 55
35. Total Proposed Site Area ............................................................................................ 56
36. Case I Profile & Cross Section ................................................................................... 54
37. Case II Profile & Cross Section .................................................................................. 54
38. Case III Profile & Cross Section ................................................................................. 55
39. Output Interface .......................................................................................................... 56
40. Clogging Interface ...................................................................................................... 64
41. Typical Pollutant Loadings from Runoff by Urban
Land Use (lb. /acre-yr.) (EPA, 2006) .......................................................................... 64

ix
Example 1 Schematic and Cross Section .......................................................................... 66
Example 1 Input Interface ................................................................................................. 67
Example 1 Output Interface .............................................................................................. 68
Example IA & IB Schematic and Cross Section .............................................................. 69
Example 1A Input Interface .............................................................................................. 69
Example 1A Output Interface ........................................................................................... 70
Example 1B Input Interface .............................................................................................. 71
Example 1B Output Interface ........................................................................................... 71
Photo of Example 2 PICP Parking Lot in La Jolla, CA (ICPI, 2015)............................... 72
Example 2 Schematic and Cross Section .......................................................................... 73
Example 2 Plans for Construction .................................................................................... 74
Example 2 Input Interface ................................................................................................. 75
Example 2 Output Interface .............................................................................................. 75
x
LIST OF TABLES
Table Page
1. PICP Section Dimensions ............................................................................................. 26
2. ASTM C 1781 Average Vertical Infiltration Rates (in/hr.) .......................................... 30
3. Linear Regressed Overflow Equations ......................................................................... 32
4. Average Max Overflow Unit Rates per Pavement Cross Slope (cfs/ft.) ...................... 34
5. Average Horizontal Infiltration Rates (in/hr.) .............................................................. 37
6. C 1781 Experimental and Adjusted ASTM C1781 Vertical Infiltration (in/hr.) .......... 39
7.Experimental and Adjusted Horizontal Infiltration Rates (in/hr.) ................................. 40
8. Clogging Test Horizontal Loading Summary ............................................................... 41
9. Clogging Equation Parameters ..................................................................................... 43
10. 6mm Clogging Test Summary .................................................................................... 46
11. Land Category & Sub-type Relation ........................................................................... 52
12. Case Level Characteristics .......................................................................................... 53
13. Runoff Coefficients (American Public Works Association) ...................................... 57
xi
LIST OF EQUATIONS
Equation Page
1. Full Equilibrium (Richardson, 1989) ............................................................................ 23
2. Conservation of Mass (Richardson, 1989).................................................................... 23
3. Discharge at Equilibrium (Richardson, 1989) .............................................................. 23
4. Vertical Infiltration (ASTM, 2013)............................................................................... 29
5. Linear Regressed Overflow Equation ........................................................................... 31
6. Horizontal Infiltration Rate ........................................................................................... 36
7. Clogging Equation ........................................................................................................ 43
8. Composite Runoff Coefficient ...................................................................................... 58
9. Rational Method............................................................................................................ 59

xii
ACKNOWLEDGEMENTS
The author would thank Dr. John Kevern and Dr. Jerry Richardson without whom
none of the research of this thesis would have been accomplished. The author would,
also like to thank fellow research assistant, Amanda Leipard.
1
CHAPTER 1
OVERVIEW
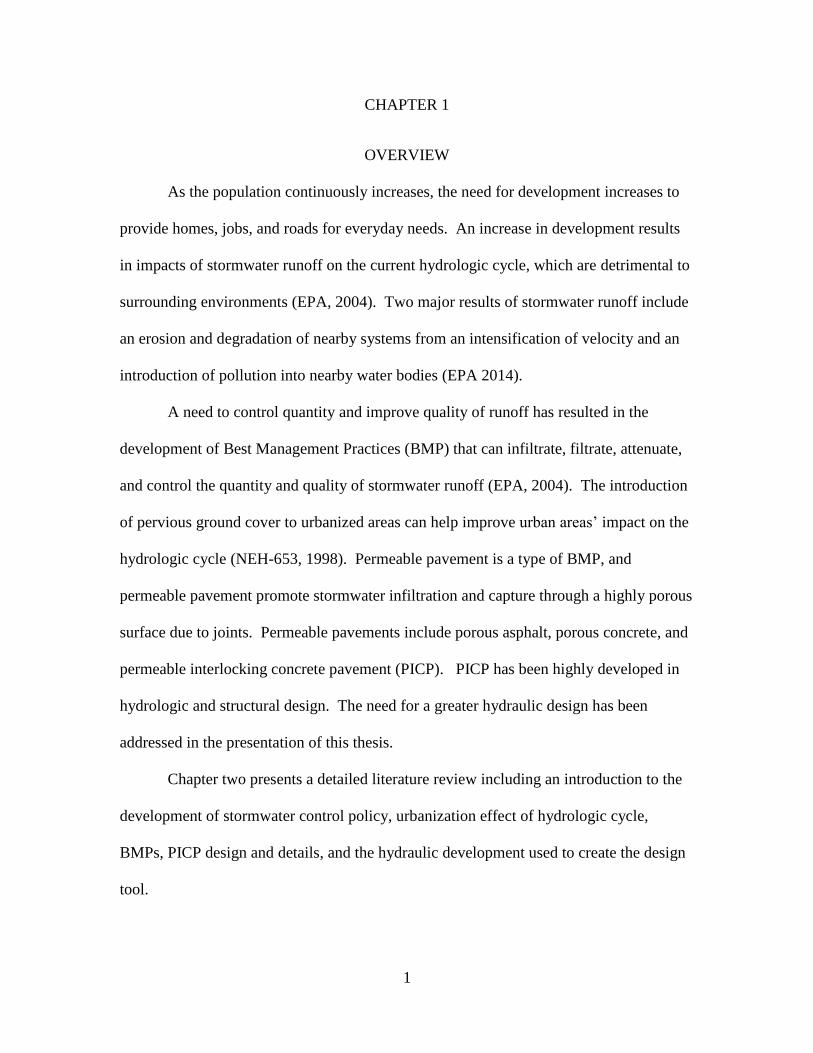
As the population continuously increases, the need for development increases to
provide homes, jobs, and roads for everyday needs. An increase in development results
in impacts of stormwater runoff on the current hydrologic cycle, which are detrimental to
surrounding environments (EPA, 2004). Two major results of stormwater runoff include
an erosion and degradation of nearby systems from an intensification of velocity and an
introduction of pollution into nearby water bodies (EPA 2014).
A need to control quantity and improve quality of runoff has resulted in the
development of Best Management Practices (BMP) that can infiltrate, filtrate, attenuate,
and control the quantity and quality of stormwater runoff (EPA, 2004). The introduction
of pervious ground cover to urbanized areas can help improve urban areas’ impact on the
hydrologic cycle (NEH-653, 1998). Permeable pavement is a type of BMP, and
permeable pavement promote stormwater infiltration and capture through a highly porous
surface due to joints. Permeable pavements include porous asphalt, porous concrete, and
permeable interlocking concrete pavement (PICP). PICP has been highly developed in
hydrologic and structural design. The need for a greater hydraulic design has been
addressed in the presentation of this thesis.
Chapter two presents a detailed literature review including an introduction to the
development of stormwater control policy, urbanization effect of hydrologic cycle,
BMPs, PICP design and details, and the hydraulic development used to create the design
tool.
2
Chapter three describes the test methods used for the data collection process: the
design of the flume, PICP section and materials, and an analysis of the resulting data.
Further information of the PICP testing and design is referenced in Amanda Leipard’s
2015 Thesis” Hydraulic Design of Permeable Interlocking Concrete Pavement.” Chapter
4 details the clogging methods including the characteristics of the synthetic stormwater,
procedure and application and the resulting data.
Chapter five details the methods used to create a design tool for PICP hydraulic
characteristics. This chapter is presented in the form of an owner’s manual. Chapter six
gives experimental and real world examples of the design tool.
Chapter seven concludes the thesis with a summary, discussion, and suggestion of
possibilities for future research.
3
CHAPTER 2
LITERATURE REVIEW
Introduction of Clean Water Act
The concept of stormwater management has recently become of greater
precedence due to compliance with Phase II of the National Pollutant Discharge
Elimination System (NPDES) Permit Program. This program was developed as part of
the Environmental Protection Agency’s (EPA) Clean Water Act (CWA). (White, 2007).
New technologies and improvements have been developed to improve stormwater quality
and control stormwater quantity. The foundations of the CWA can be found in the 1972
Federal Water Pollution Control Act (FWPCA) amendments. The amendments were the
first to create pollutant discharge limitations on a national level, set requirements for
water quality of the United States, and create the first permit program within the NPDES.
(McCall III, 2014). The first amendments were meant for prevention of point source
pollution discharge into U.S. waters. The EPA defines point source pollution as “any
discernible, confined, and discrete conveyance… from which pollutants may be
discharged. This term does not include return flows from irrigated agriculture or
agriculture stormwater runoff” (Environmental Protection Agency, 2011). In 1977,
another set of amendments were made to the FWPCA. The first set of amendments were
unable to reduce toxic water pollution. In the second set of amendments established
“priority pollutants” were established and more stringent guidelines and standards for
major industrial categories (McCall III, 2014).
After the determination of how and what types of pollution problems needed
remediation, Congress passed another amendment to the CWA addressed under NPDES.
4
Phase I of the NPDES, promulgated in 1990, focused on the stormwater runoff with three
distinct characteristics: (Barnard, 2002).
(1) ‘Medium’ and ‘large’ municipal separate storm sewer systems (MS4) generally
serving populations of 100,000 or greater
(2) Construction activity disturbing 5 acres or greater
(3) five categories of industrial activity
In 1996, the results of the National Water Quality Inventory found that
approximately 40% of the United States water bodies did not meet water quality
standards. The results of the inventory showed that 13 percent of polluted acres, 21
percent of polluted lakes, and 45 percent of polluted estuaries were impaired by
urban/suburban stormwater runoff. This inventory concluded that polluted runoff was a
leading source of the impairment of US water bodies. (Barnard, 2002).
In December 1999, the EPA promoted Phase II of the NPDES. Phase II included
the areas of investigation to affect small MS4s in “urbanized areas”, which were defined
by the Bureau of Census, construction areas from one to five acres, and non-point source
pollution (McCall III, 2014). Phase II extended the amount of municipalities affected by
NPDES from around 1,100 to nearly 5,000. (Barnard, 2002). The Maximum Extent
Practicable (MEP) became standard for water quality and quantity improvement. Best
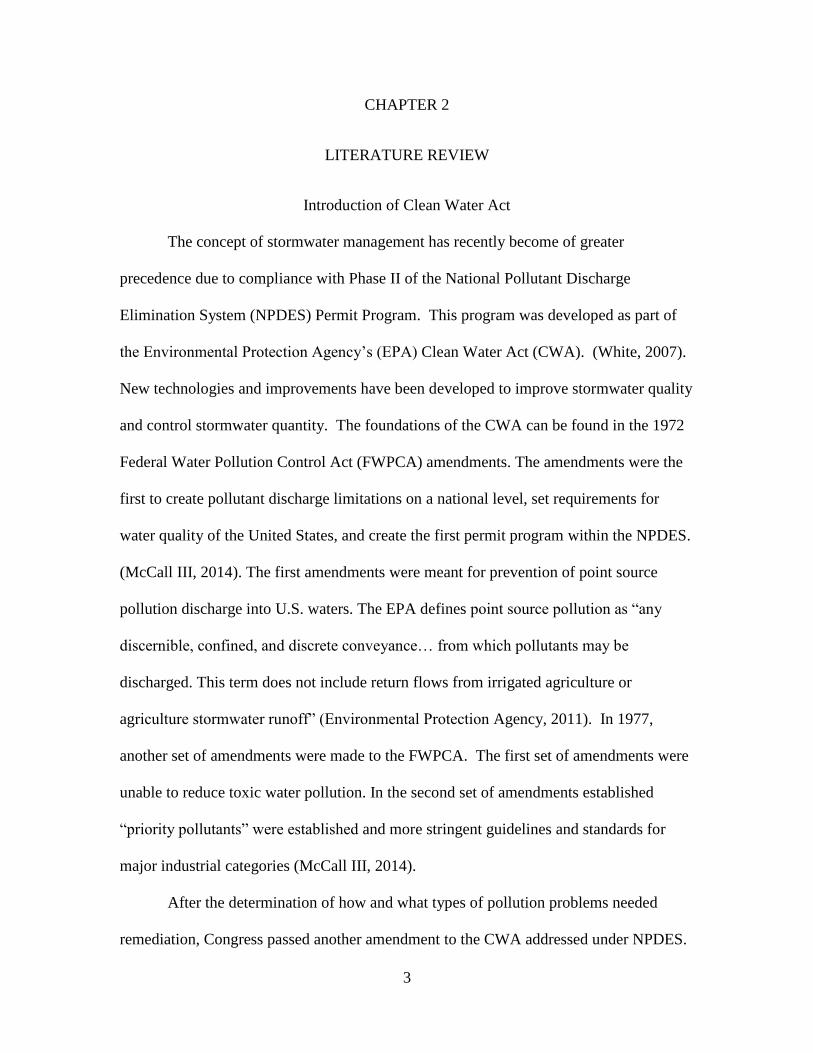
management practices (BMPs) were implemented to reach the MEP. Six minimum
control measures were defined to be the basis of a management plan for measurable goals
of reducing the amount of water pollution. Figure 1 summarizes the six minimum control
measures.

5
Figure 1. Six Minimum Control Measures (Cass County Government, 2014.)
The six minimum control measures are created for the operators of municipal
stormwater sewer and sanitary systems. The measures seen in Figure 1 are expected to
significant decrease the pollutants found in nearby water bodies (EPA, 2014). By
introducing the public to stormwater management through public education and
involvement, the public can better understand their impact on the environment and how
they can counteract urbanization. Illicit discharges are a main source of introduction of
pollution into nearby systems. Construction is also a large source of pollution (Barnard,
2002). By controlling discharge during and after development, the amount of sediment
pollution being introduced into the system will decrease. Finally, maintenance of
stormwater management systems will ensure that the systems continuing to be highly
functioning in reducing stormwater.
Urbanization in the Hydrologic Cycle
The use of BMPs in urban landscape began as flood and drainage controls,
because an increase in urbanization has caused a major increase in the amount of
6
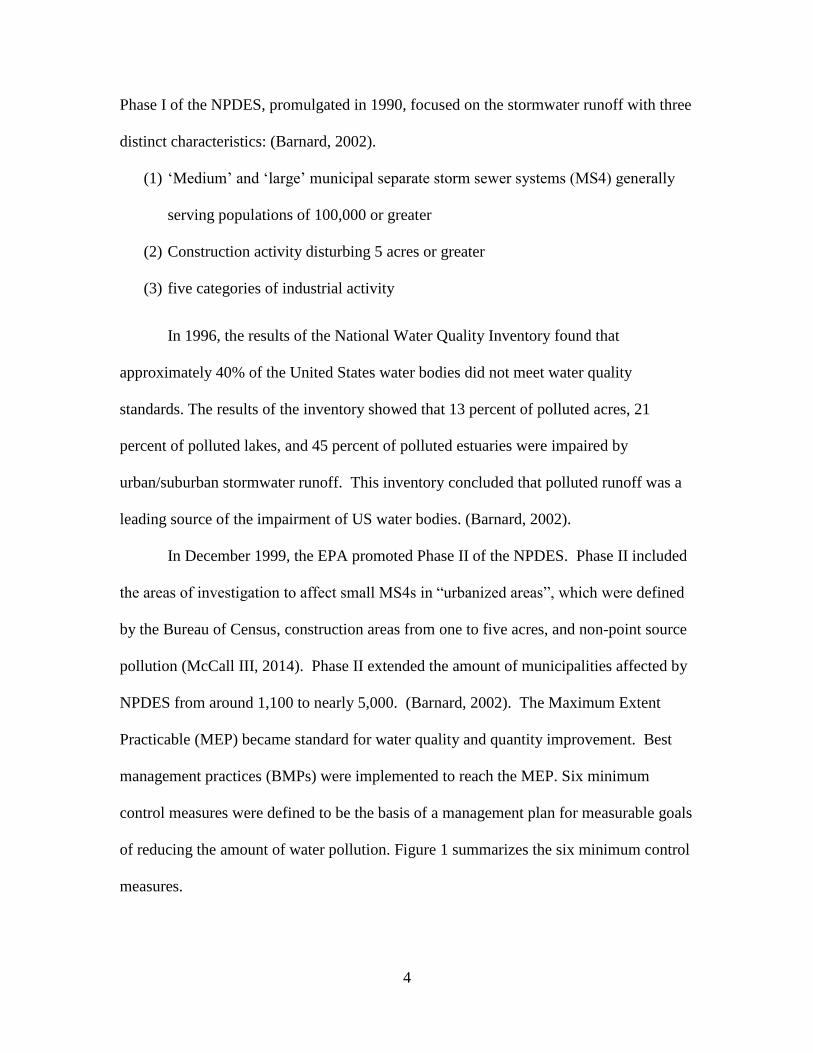
impervious area. In the hydrologic cycle, the impervious area results in surface runoff, as
previously stated, the greatest cause of pollution to U.S. water bodies. Urbanization can
increase the amount of surface runoff from 10% of the water cycle with natural ground
cover to as much as 55% of the water cycle when ground cover becomes 75-100%
impervious surface. The water that does not infiltrate the ground is classified in the water
cycle as runoff. Figure 2 from the Alliance of Crop, Soil, and Environmental Science
Societies depicts the effects of urbanization on the hydrologic cycle (NEH-653, 1998).
Figure 2. Effect of Impervious Surface on Hydrologic Cycle (NEH-653, 1998)
The removal of trees will decrease the amount of both shallow and deep
infiltration and reduce evapotranspiration, which would have otherwise occurred through
the plant leaves. Installation of impervious surfaces roofs and parking lots will decrease

7
the chance of precipitation infiltrating the earth and divert it to nearby water bodies and
stormwater sanitary and sewer systems (Mullaney, 2013). The slight decrease of all the
parts of the hydrologic cycle, evapotranspiration, shallow infiltration, and deep
infiltration, will result in an increase in surface runoff.
Surface runoff, which leads to stormwater pollution, causes destruction to many
habitats in nearby streams and water bodies (EPA, 2014). The two main components of
stormwater pollution are: the increased volume and rate of runoff from impermeable
surfaces and the actual amount of pollutant in runoff (EPA, 2014). Both should be taken
into consideration because of their effects on surrounding ecosystems and environments.
Urbanization also results in greater amounts of a larger variety of pollutants
entering the damaged water cycle. Sediments, pathogens, fertilizers/nutrients,
hydrocarbons, metals, and more have been identified in large quantities in United States
water bodies (EPA, 2005). The increase in velocity of runoff, because of reduced tree
canopy, results in greater surface erosion of sediment and causes erosion of sediment into
neighboring water bodies. The sediment is often carrying pesticides and herbicides from
lawns and gardens, as well as viruses, bacteria, and nutrients from pet waste and failing
septic systems. Fecal coliform is also a large contributing pollutant to water bodies
neighboring large cities. In suburban and urban areas, the increase in population will also
result in an increase in travel necessities and motor vehicles. The increase in
transportation will introduce oil, grease, and toxic chemicals. During severe weather it is
necessary to use methods, such as deicing, to make the roads travelable. Deicing road
salts chemically change the runoff and carry this pollutant to nearby water bodies (EPA,
2014). Lastly, but commonly overlooked, is thermal pollution. Thermal pollution will
8
cause a change in the dissolved oxygen levels of the small neighboring water bodies and
destroy the current state of the habitats in the surrounding ecosystems. The EPA suggest
the use of BMPs to reduce the damage these pollutants and many other the waters
surrounding of urban and suburban areas.
Best Management Practices
The EPA has stated “the primary method to control stormwater discharges is the
use of BMPs” (EPA, 2015). BMPs are used to mitigate the impacts on the environment
from polluted runoff. A BMP can be a technique, measure, and/or a structural practice
used as water pollution controls (EPA, 1999). BMPs were first created as a source of
flood control. The implementation of the CWA made BMPs appropriate for pollutant
removal. In the Stormwater Best Management Practice Design Guide, the EPA comments
on the progression of BMPs saying, “In response to a growing national awareness and
understanding of the wide range of environmental impacts associated with land use
changes, particularly urbanization, BMPs have begun to be designed for stream channel
protection and restoration, groundwater infiltration, and protection of riparian habitat and
biota” (EPA, 1999).
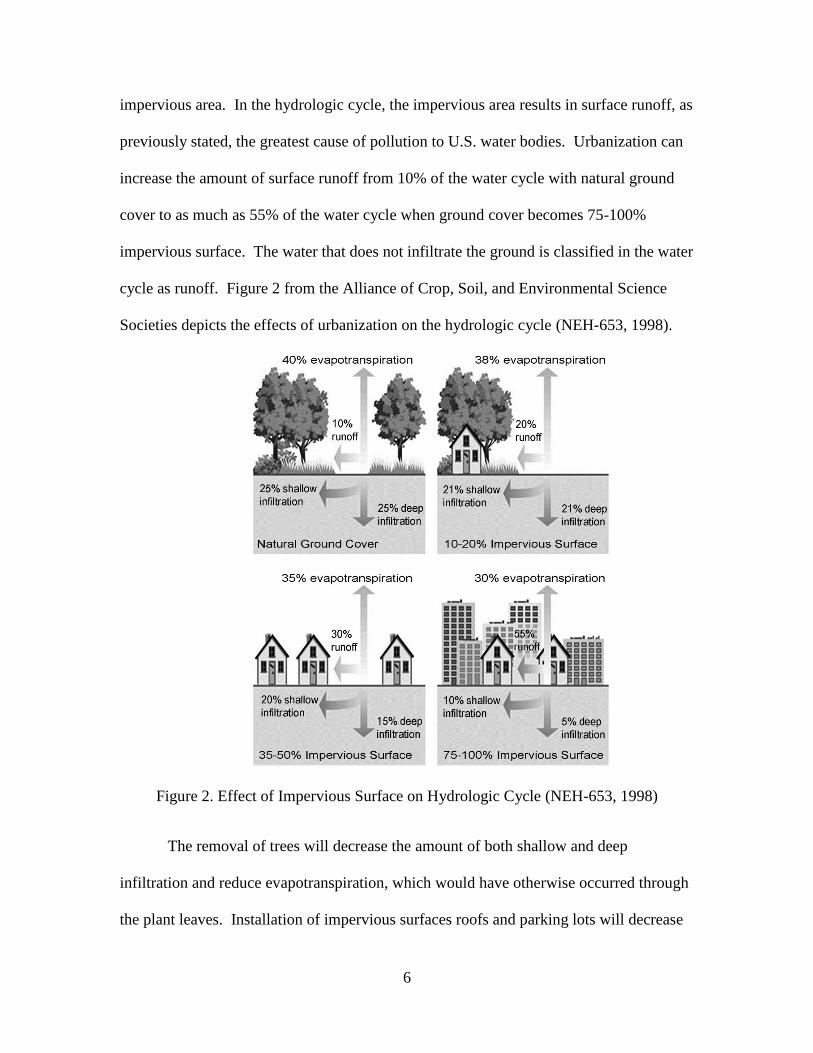
BMPs are within two categories: structural and non-structural. Structural BMPs
includes bioretention, bio swales, permeable pavement, rain gardens, and rain barrel.
Non-structural BMPs include zoning and permitting regulations put in action to measure
and audit of the amount of pollution and runoff being transported into the water cycle.
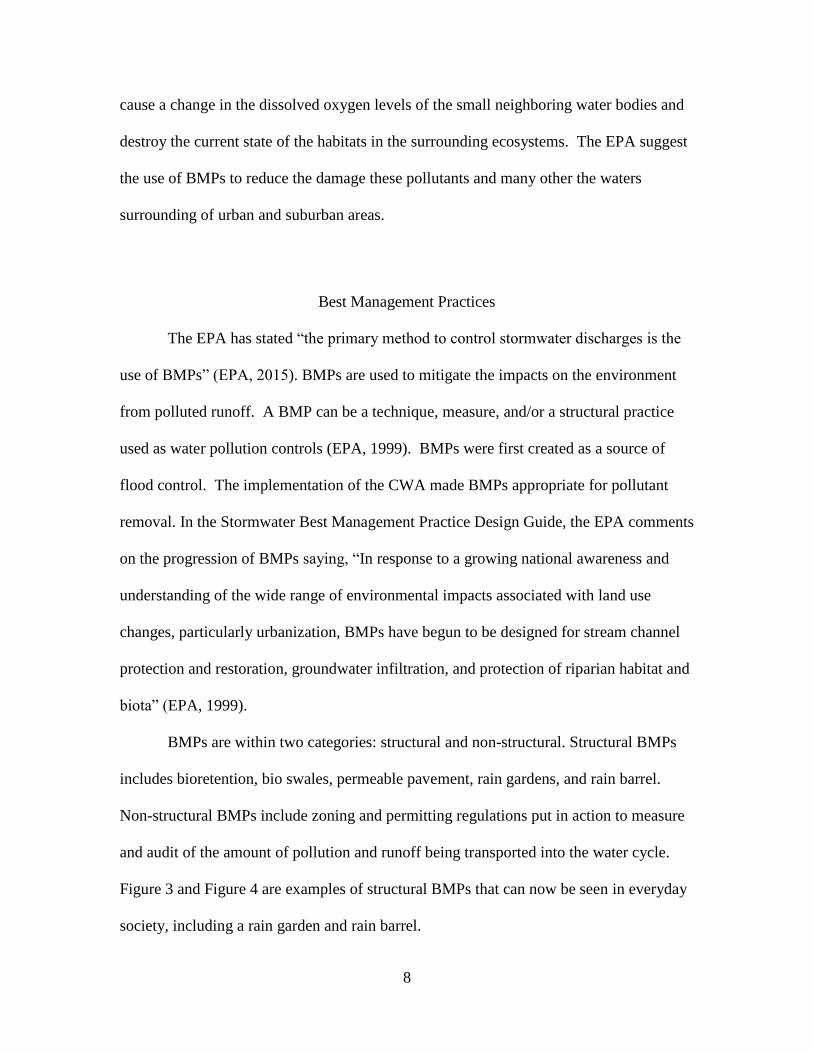
Figure 3 and Figure 4 are examples of structural BMPs that can now be seen in everyday
society, including a rain garden and rain barrel.

9
Figure 3. Examples of Structural BMP – Rain Garden (SUNY-ESF, 2015)
Figure 4. Example of Structural BMP - Rain Barrel (Rutgers, 2014)
10
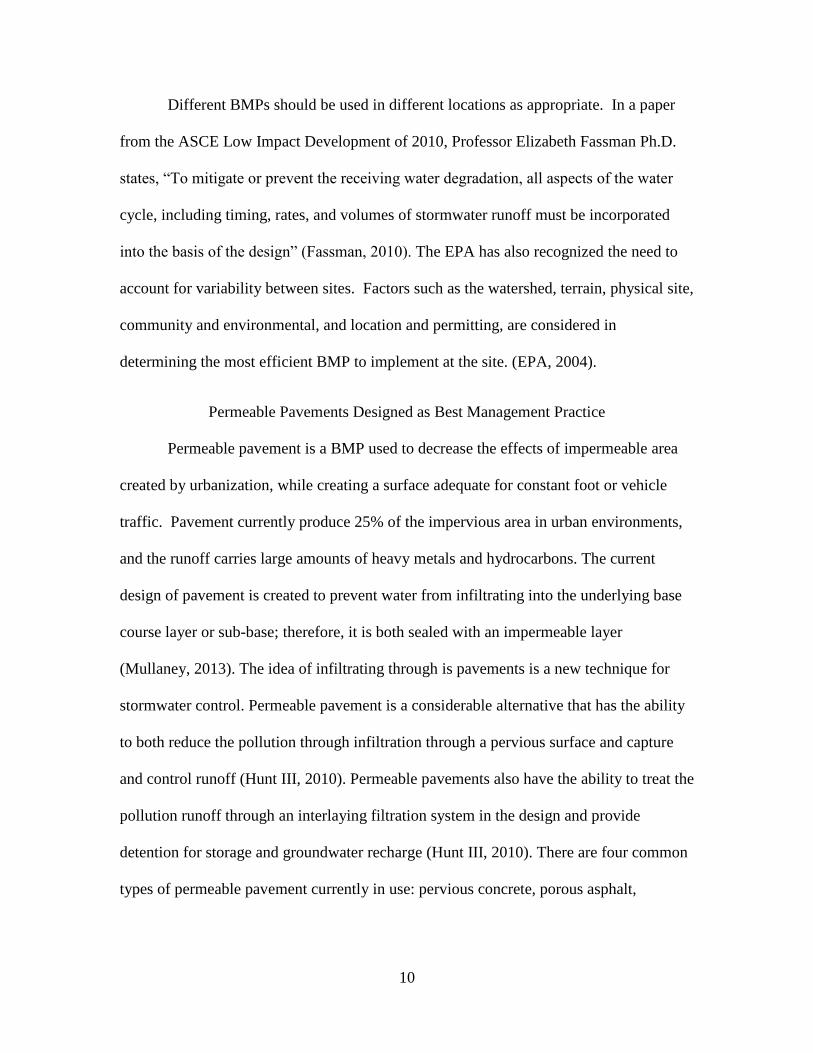
Different BMPs should be used in different locations as appropriate. In a paper
from the ASCE Low Impact Development of 2010, Professor Elizabeth Fassman Ph.D.
states, “To mitigate or prevent the receiving water degradation, all aspects of the water
cycle, including timing, rates, and volumes of stormwater runoff must be incorporated
into the basis of the design” (Fassman, 2010). The EPA has also recognized the need to
account for variability between sites. Factors such as the watershed, terrain, physical site,
community and environmental, and location and permitting, are considered in
determining the most efficient BMP to implement at the site. (EPA, 2004).
Permeable Pavements Designed as Best Management Practice
Permeable pavement is a BMP used to decrease the effects of impermeable area
created by urbanization, while creating a surface adequate for constant foot or vehicle
traffic. Pavement currently produce 25% of the impervious area in urban environments,
and the runoff carries large amounts of heavy metals and hydrocarbons. The current
design of pavement is created to prevent water from infiltrating into the underlying base
course layer or sub-base; therefore, it is both sealed with an impermeable layer
(Mullaney, 2013). The idea of infiltrating through is pavements is a new technique for
stormwater control. Permeable pavement is a considerable alternative that has the ability
to both reduce the pollution through infiltration through a pervious surface and capture
and control runoff (Hunt III, 2010). Permeable pavements also have the ability to treat the
pollution runoff through an interlaying filtration system in the design and provide
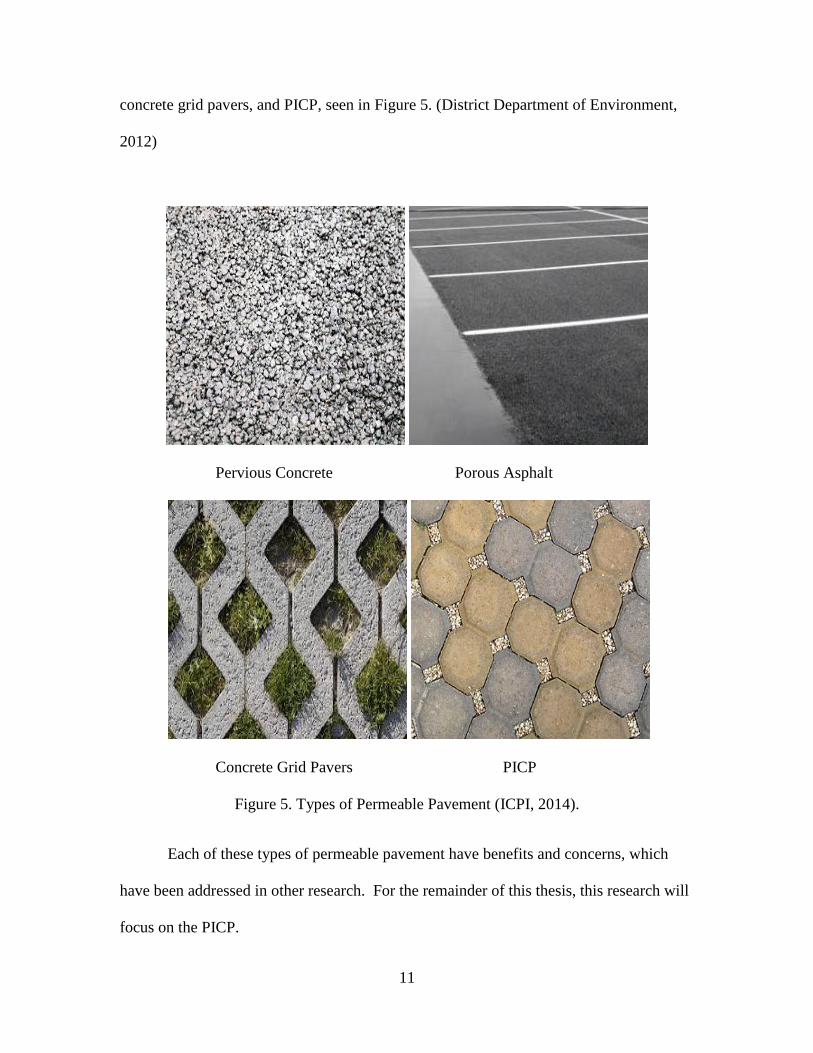
detention for storage and groundwater recharge (Hunt III, 2010). There are four common
types of permeable pavement currently in use: pervious concrete, porous asphalt,
11
concrete grid pavers, and PICP, seen in Figure 5. (District Department of Environment,
2012)
Pervious Concrete Porous Asphalt
Concrete Grid Pavers PICP
Figure 5. Types of Permeable Pavement (ICPI, 2014).
Each of these types of permeable pavement have benefits and concerns, which
have been addressed in other research. For the remainder of this thesis, this research will
focus on the PICP.

12
PICP Benefits and Concerns
There are many benefits to PICP that can be found in every stage of the design
from construction and the ease of maintenance to the already discussed runoff
improvements and pollution control. For example, PICP can be implemented at sites in
need of quick construction because there is no need for curing time or delays due to cold
weather during installation. PICP can promote foliage survival by providing air and water
to the root system that would have been impeded by construction of impermeable
pavements or other construction. (ICPI, 2014).
The Interlocking Concrete Pavement Institute has recorded surface runoff
reduction of 100% and, depending on subgrade soil, infiltration of 100%. (ICPI, 2014). A
study done by North Carolina State researched a combined system of impermeable
pavement and grassed area compared to permeable pavement, referred to in the study as a
grassed equivalent percentage. The SCS curve numbers (CN) were determined for events
larger than 5.0 cm. The results showed
“For the same rainfall depths based on SCS curve number method, a grassed
sandy soil (CN: 61) would produce runoff. For the storms monitored, pavement
reduced more runoff than a standard grass lawn. Therefore, the equivalent grass
percentage was 100% for each event” (Hunt III, 2010).
The conclusions of the NC State study also found information on the surface infiltration
rate of the permeable pavement in comparison to grass and impermeable surface results
stating, “a permeable pavement with surface infiltration rate of 5.3 cm/hr. behaves as if it
were 84% grass and 16% impermeable surface” (Hunt III, 201).
13
Ease of maintenance is considered a benefit because it only requires standard
vacuum equipment to remove build up in the permeable joint on the surface. The high
infiltration rates of the surface can be easily reestablished with the vacuuming (ICPI,
2014). This was proven in the NC State research, which also compared infiltration rates
around stable and disturbed sediment landscapes. The results proved that removing
clogging from the surface could greatly increase surface infiltration rates, up to nearly
99%. As seen, with the median surface infiltration rate of sites clogged with sediment to
be 8.1 cm/hr., while the median surface infiltration rate of sites without sediment
clogging was 2300 cm/hr. (Smith, 2010). This increase shows how extremely important
maintenance is and how it can improve the capability of a site to control stormwater.
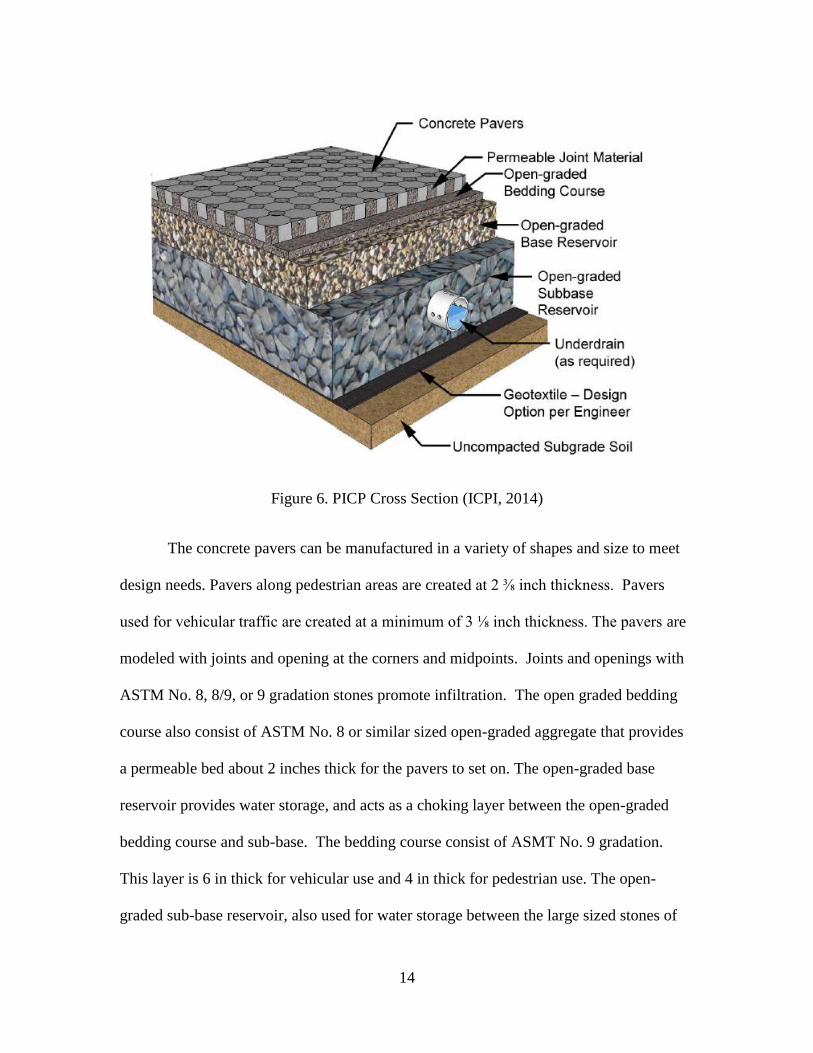
Permeable Interlocking Concrete Paver Design
Permeable Interlocking Concrete Pavement (PICP) is a type of permeable
pavement that uses filtration, infiltration, and detention while creating a surface that be
applied for both vehicular and foot traffic. PICP are concrete pavers that are installed
with voids that to promote infiltration through the pavers (Hunt, III, 2010). The voids will
help surface runoff return to pre-development standards by improving the ability of the
pavement system to transmit water to the soil. A typical cross section of PICP from the
Interlocking Concrete Pavement Institute is depicted in Figure 6.
14
Figure 6. PICP Cross Section (ICPI, 2014)
The concrete pavers can be manufactured in a variety of shapes and size to meet
design needs. Pavers along pedestrian areas are created at 2 ⅜ inch thickness. Pavers
used for vehicular traffic are created at a minimum of 3 ⅛ inch thickness. The pavers are
modeled with joints and opening at the corners and midpoints. Joints and openings with
ASTM No. 8, 8/9, or 9 gradation stones promote infiltration. The open graded bedding
course also consist of ASTM No. 8 or similar sized open-graded aggregate that provides
a permeable bed about 2 inches thick for the pavers to set on. The open-graded base
reservoir provides water storage, and acts as a choking layer between the open-graded
bedding course and sub-base. The bedding course consist of ASMT No. 9 gradation.
This layer is 6 in thick for vehicular use and 4 in thick for pedestrian use. The open-
graded sub-base reservoir, also used for water storage between the large sized stones of
15
ASTM No 2, 3, or 4. The size is site specific based on the amount of detention
necessary, and this layer can be omitted in pedestrian use because of the increase in the of
the base reservoir. (ICPI, 2014)
Both the underdrain and geotextile fabric are not necessary in every PICP
installation. An underdrain is not needed for sites with high exfiltration soils, as the soil
will not need extra help removing water from the base and sub-base. Sites with low
infiltration soils have a perforated pipe connected to some type of outlet structure or other
BMP, if the permeable pavement is part of a treatment train. Geotextile fabric is a
separation between sub-base and subgrade to prevent mitigation of fines and clogging of
effective pore space (ICPI, 2014).
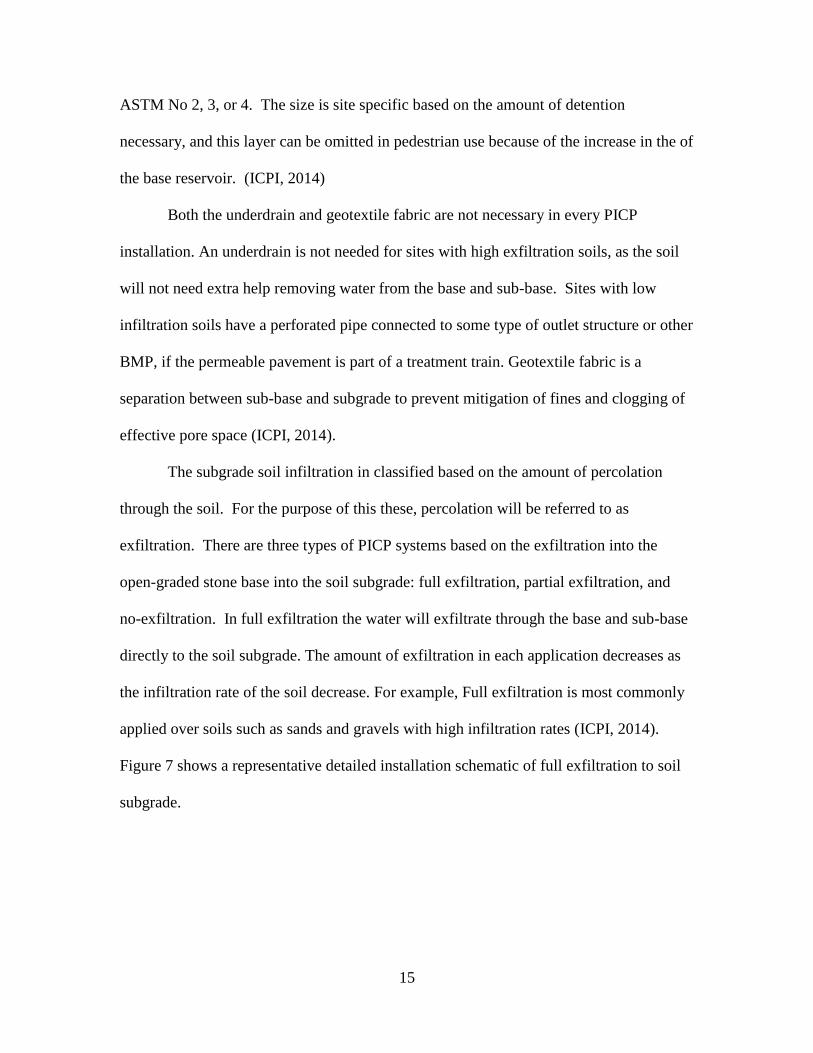
The subgrade soil infiltration in classified based on the amount of percolation
through the soil. For the purpose of this these, percolation will be referred to as
exfiltration. There are three types of PICP systems based on the exfiltration into the
open-graded stone base into the soil subgrade: full exfiltration, partial exfiltration, and
no-exfiltration. In full exfiltration the water will exfiltrate through the base and sub-base
directly to the soil subgrade. The amount of exfiltration in each application decreases as
the infiltration rate of the soil decrease. For example, Full exfiltration is most commonly
applied over soils such as sands and gravels with high infiltration rates (ICPI, 2014).
Figure 7 shows a representative detailed installation schematic of full exfiltration to soil
subgrade.
16
Figure 7. Detail Drawings of Full Exfiltration of PICP (ICPI, 2014)
While partial exfiltration is used over silts or clays and relies on the drainage of
into the subgrade soil and drainage pipes to rid of excess water in the system. Figure 8
shows a representative installation schematic of full exfiltration to soil subgrade.

17
Figure 8. Detailed Drawings of Partial Exfiltration of PICP (ICPI, 2014)
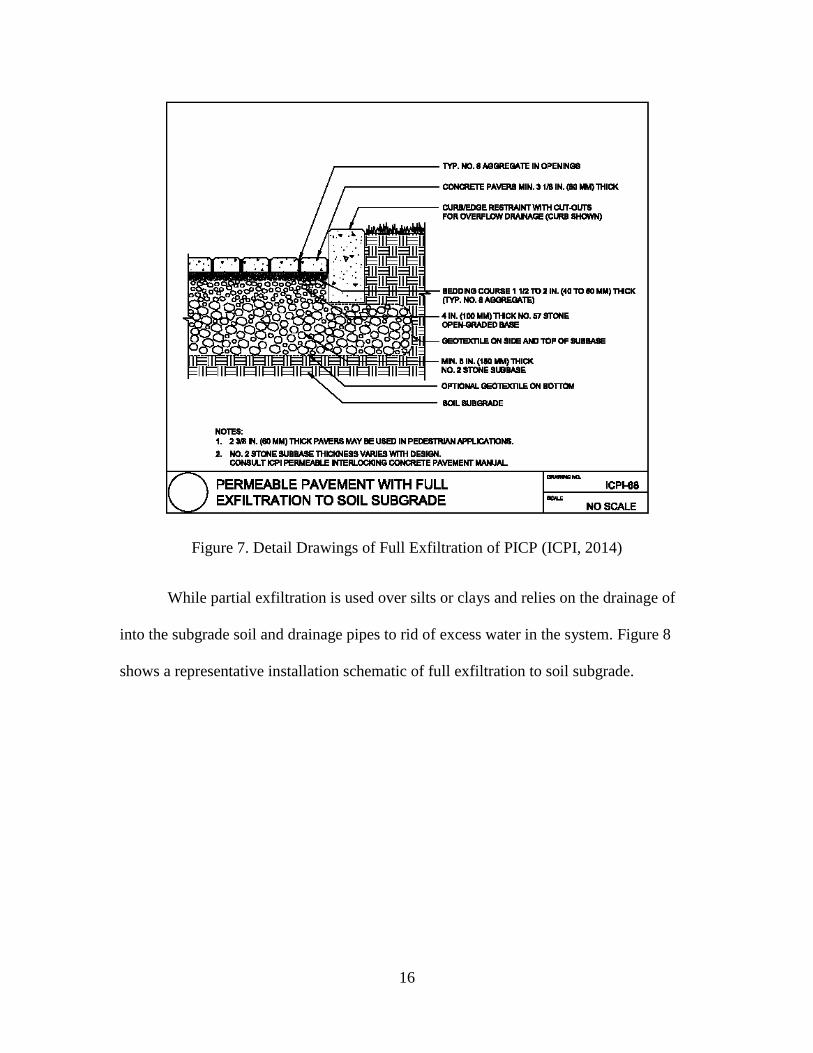
No-exfiltration is used when a low permeability is encountered at the site, such as
loess soils or other fills soils. Water will degrade strength of the soil (ICPI, 2014). Figure
9 shows detailed drawings of no-exfiltration to soil subgrade.
18
Figure 9. Detailed Drawings of No-Exfiltration of PICP (ICPI, 2014)
Overflows of each system are managed differently as well. Full exfiltration
overflows are controlled “via perimeter drains to swales, bioretention areas, storm sewer
outlets”. (ICPI, 2014). Partial exfiltration daylights excess water into a sewer or stream.
No-exfiltration systems are part of an assembly into a detention pond or can even be used
for a reservoir for water harvesting or horizontal ground source heat pumps. (ICPI, 2014).
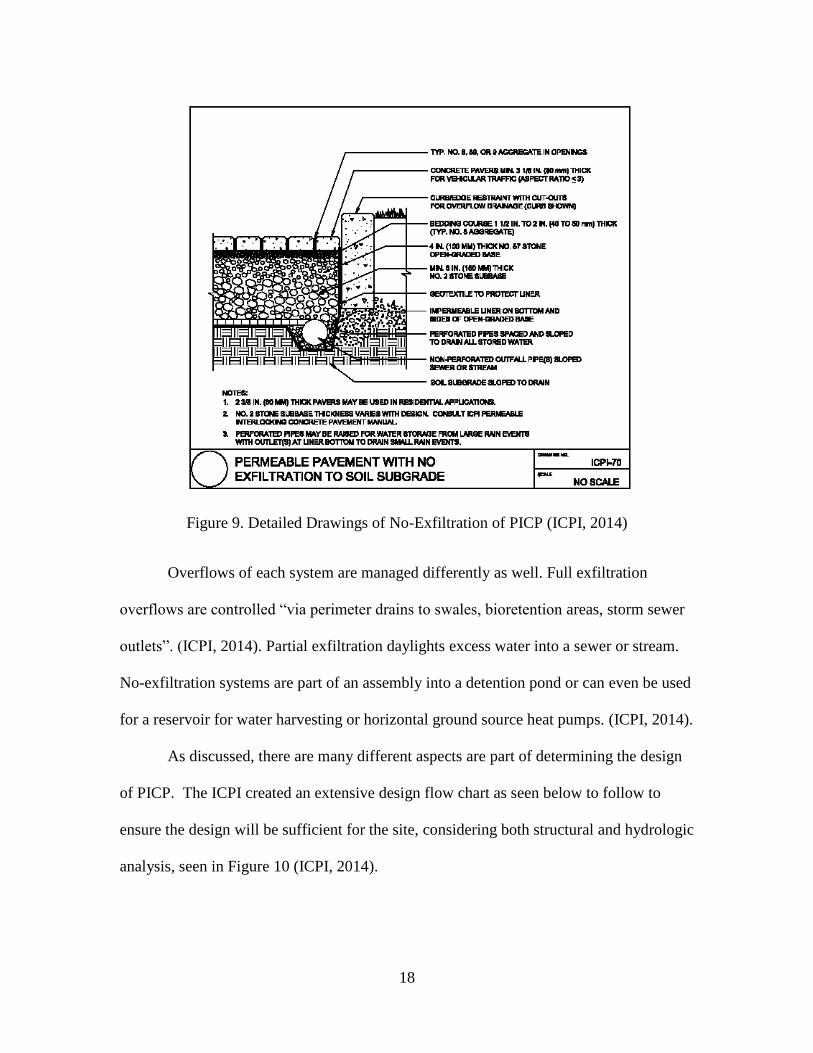
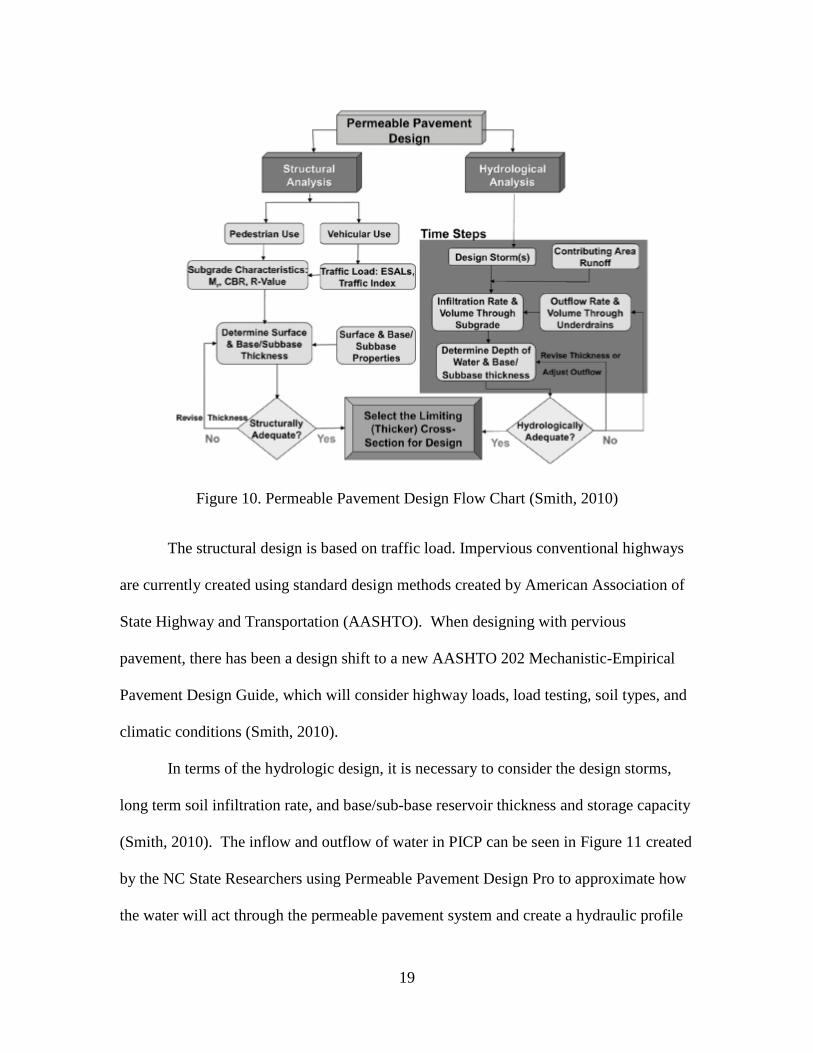
As discussed, there are many different aspects are part of determining the design
of PICP. The ICPI created an extensive design flow chart as seen below to follow to
ensure the design will be sufficient for the site, considering both structural and hydrologic
analysis, seen in Figure 10 (ICPI, 2014).
19
Figure 10. Permeable Pavement Design Flow Chart (Smith, 2010)
The structural design is based on traffic load. Impervious conventional highways
are currently created using standard design methods created by American Association of
State Highway and Transportation (AASHTO). When designing with pervious
pavement, there has been a design shift to a new AASHTO 202 Mechanistic-Empirical
Pavement Design Guide, which will consider highway loads, load testing, soil types, and
climatic conditions (Smith, 2010).
In terms of the hydrologic design, it is necessary to consider the design storms,
long term soil infiltration rate, and base/sub-base reservoir thickness and storage capacity
(Smith, 2010). The inflow and outflow of water in PICP can be seen in Figure 11 created
by the NC State Researchers using Permeable Pavement Design Pro to approximate how
the water will act through the permeable pavement system and create a hydraulic profile
20
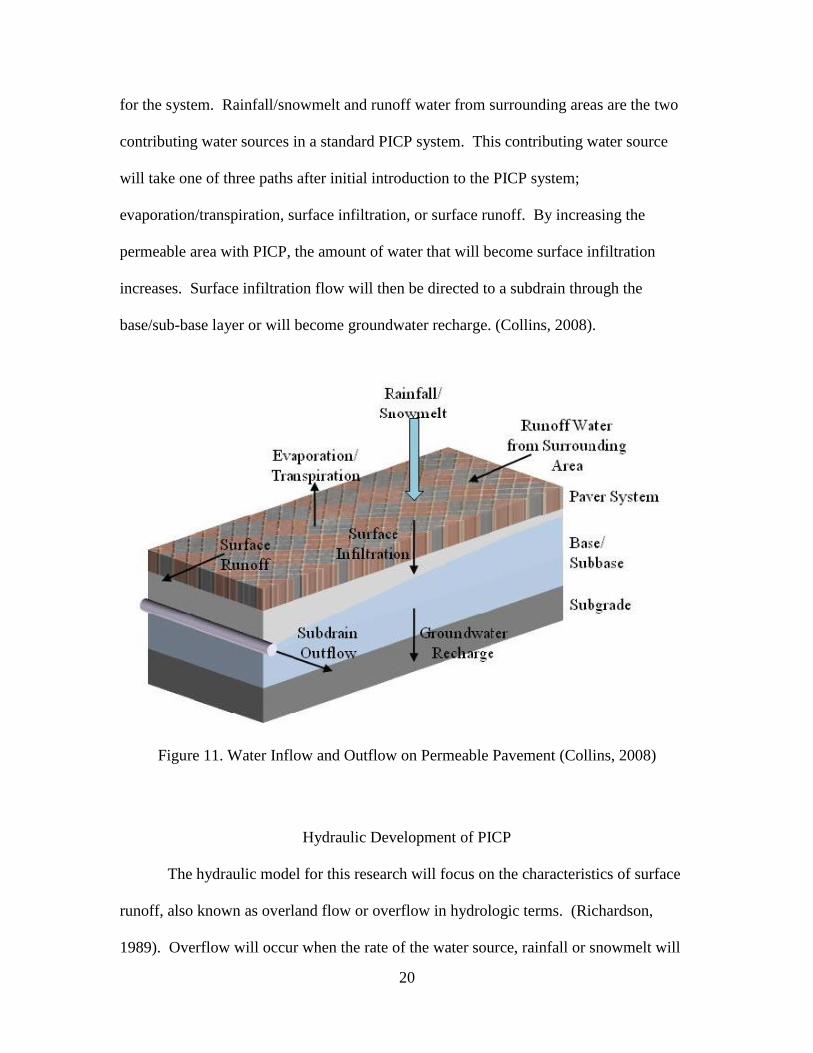
for the system. Rainfall/snowmelt and runoff water from surrounding areas are the two
contributing water sources in a standard PICP system. This contributing water source
will take one of three paths after initial introduction to the PICP system;
evaporation/transpiration, surface infiltration, or surface runoff. By increasing the
permeable area with PICP, the amount of water that will become surface infiltration
increases. Surface infiltration flow will then be directed to a subdrain through the
base/sub-base layer or will become groundwater recharge. (Collins, 2008).
Figure 11. Water Inflow and Outflow on Permeable Pavement (Collins, 2008)
Hydraulic Development of PICP
The hydraulic model for this research will focus on the characteristics of surface
runoff, also known as overland flow or overflow in hydrologic terms. (Richardson,
1989). Overflow will occur when the rate of the water source, rainfall or snowmelt will
21
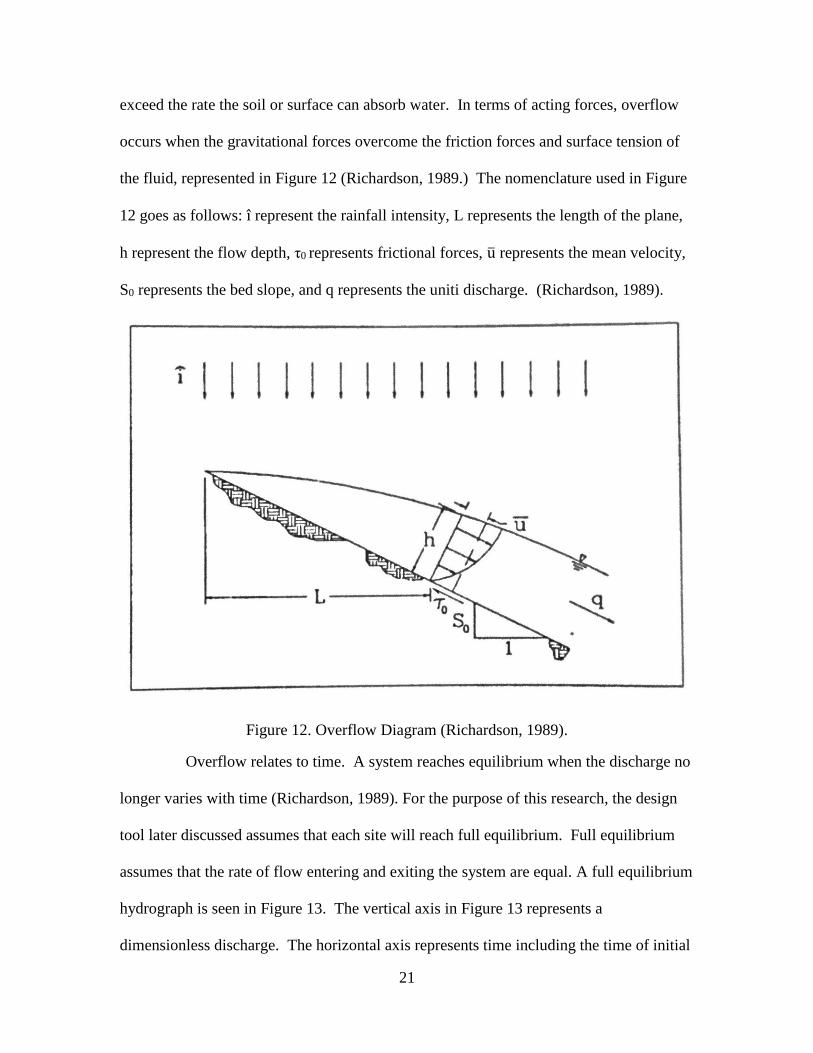
exceed the rate the soil or surface can absorb water. In terms of acting forces, overflow
occurs when the gravitational forces overcome the friction forces and surface tension of
the fluid, represented in Figure 12 (Richardson, 1989.) The nomenclature used in Figure
12 goes as follows: i represent the rainfall intensity, L represents the length of the plane,
h represent the flow depth, τ0 represents frictional forces, u represents the mean velocity,
S0 represents the bed slope, and q represents the uniti discharge. (Richardson, 1989).
Figure 12. Overflow Diagram (Richardson, 1989).
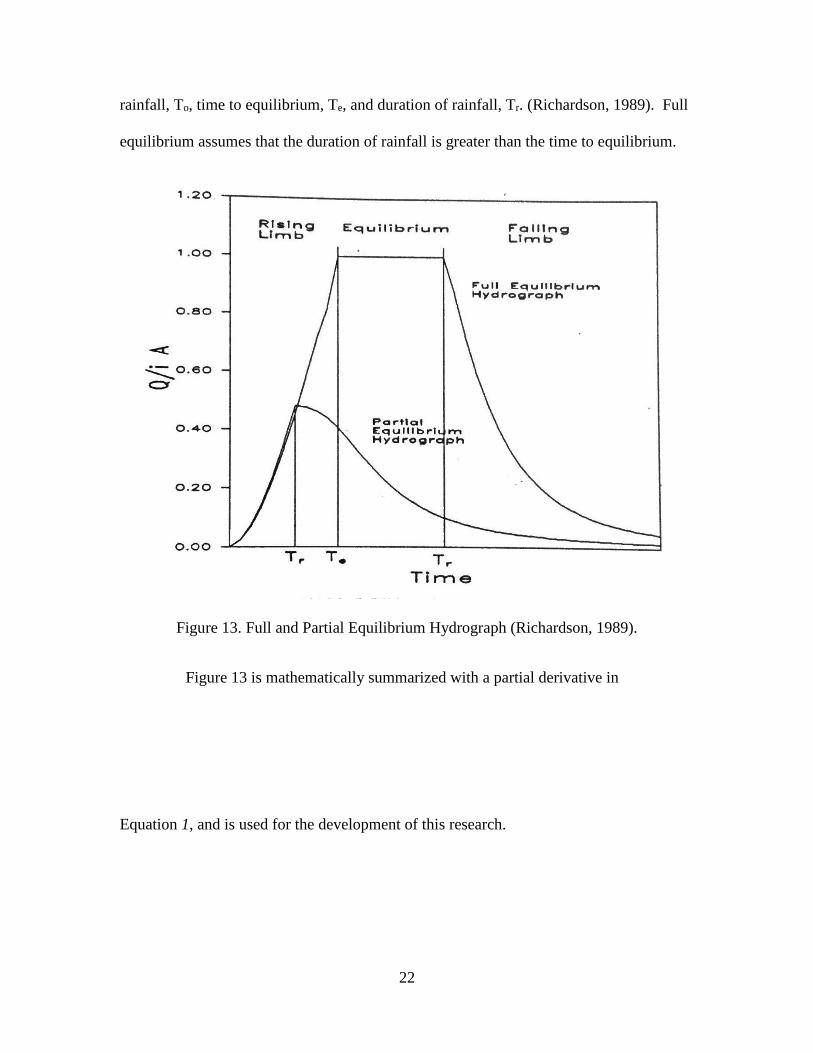
Overflow relates to time. A system reaches equilibrium when the discharge no
longer varies with time (Richardson, 1989). For the purpose of this research, the design
tool later discussed assumes that each site will reach full equilibrium. Full equilibrium
assumes that the rate of flow entering and exiting the system are equal. A full equilibrium
hydrograph is seen in Figure 13. The vertical axis in Figure 13 represents a
dimensionless discharge. The horizontal axis represents time including the time of initial
22
rainfall, To, time to equilibrium, Te, and duration of rainfall, Tr. (Richardson, 1989). Full
equilibrium assumes that the duration of rainfall is greater than the time to equilibrium.
Figure 13. Full and Partial Equilibrium Hydrograph (Richardson, 1989).
Figure 13 is mathematically summarized with a partial derivative in
Equation 1, and is used for the development of this research.

23
Equation 1 is substituted into the continuity equation, seen in Equation 2 . After
integrating, Equation 3 is used to determine discharge at equilibrium, which is the basis
of design for this research and the development of the design tool discussed further in
Chapter 5.
Equation 1. Full Equilibrium (Richardson, 1989)
δq
δt=δh
δt= 0
Where:
q = unit discharge
t = time
h = flow depth
Equation 2. Conservation of Mass (Richardson, 1989)
δh
δt+δq
δL− i = 0
Where:
q = unit discharge
t = time
h = flow depth
L = length of the overflow plane
i = rainfall intensity
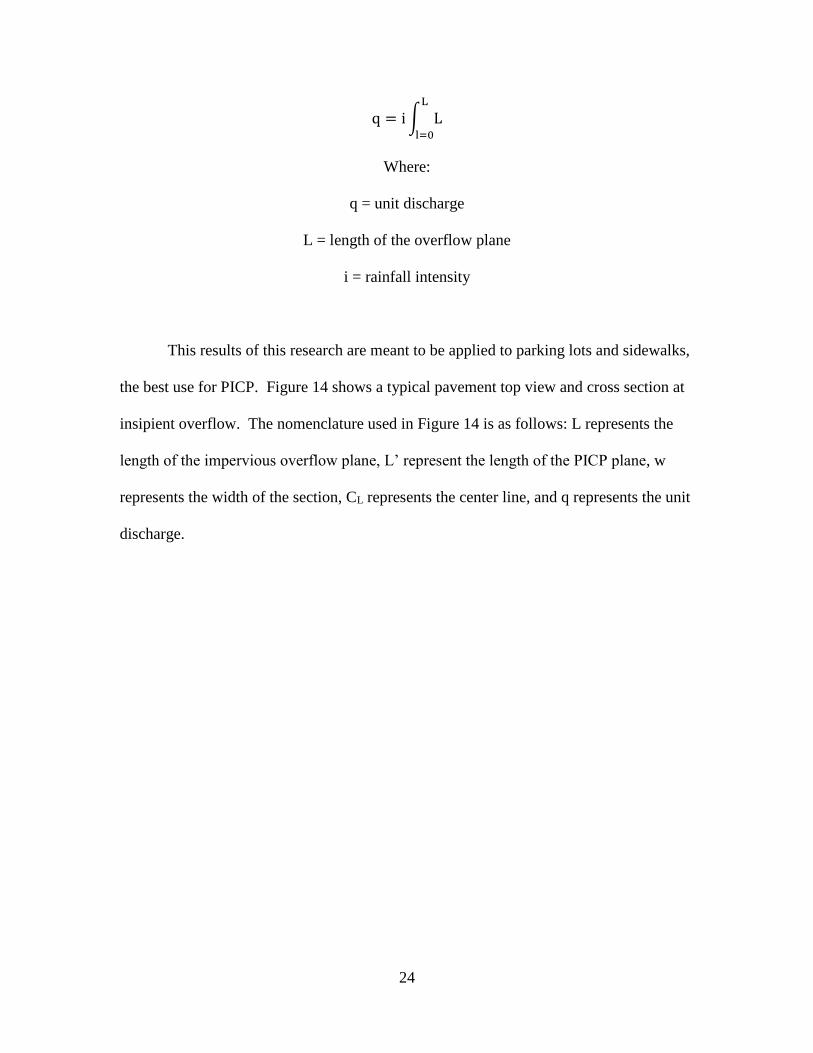
Equation 3. Discharge at Equilibrium (Richardson, 1989)
24
q = i∫ LL
l=0
Where:
q = unit discharge
L = length of the overflow plane
i = rainfall intensity
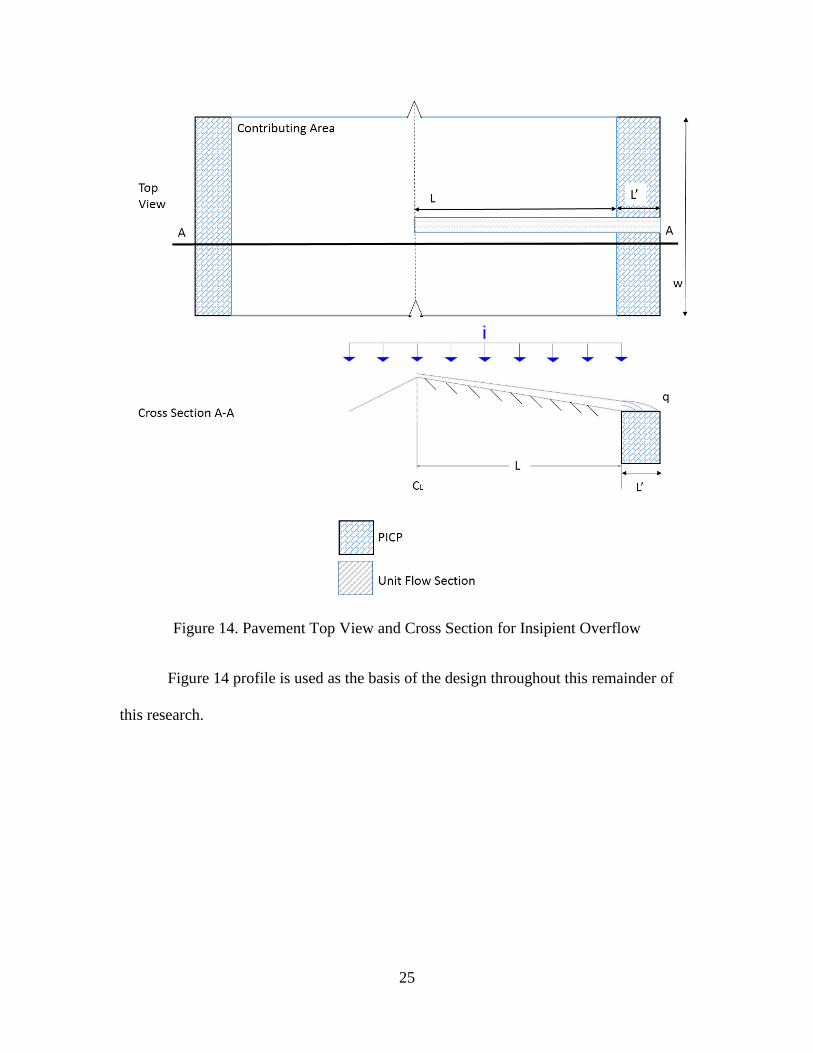
This results of this research are meant to be applied to parking lots and sidewalks,
the best use for PICP. Figure 14 shows a typical pavement top view and cross section at
insipient overflow. The nomenclature used in Figure 14 is as follows: L represents the
length of the impervious overflow plane, L’ represent the length of the PICP plane, w
represents the width of the section, CL represents the center line, and q represents the unit
discharge.
25
Figure 14. Pavement Top View and Cross Section for Insipient Overflow
Figure 14 profile is used as the basis of the design throughout this remainder of
this research.
26
CHAPTER 3
PICP TESTING & HYDRAULIC DESIGN
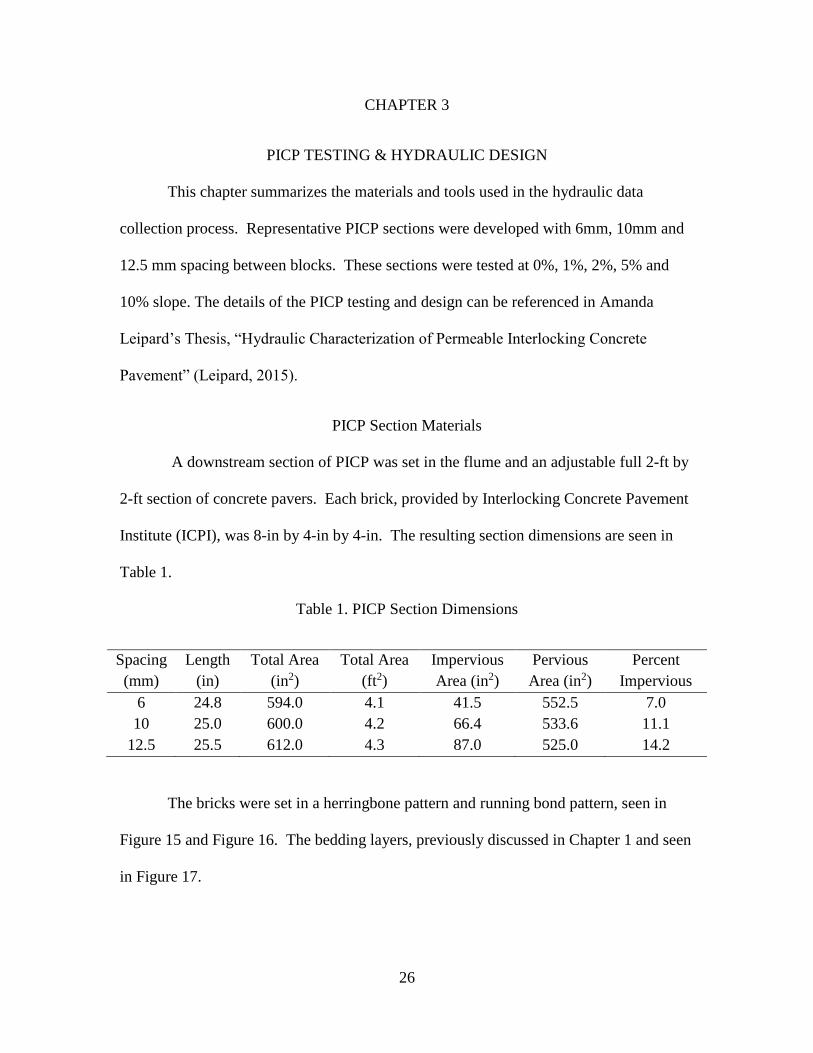
This chapter summarizes the materials and tools used in the hydraulic data
collection process. Representative PICP sections were developed with 6mm, 10mm and
12.5 mm spacing between blocks. These sections were tested at 0%, 1%, 2%, 5% and
10% slope. The details of the PICP testing and design can be referenced in Amanda
Leipard’s Thesis, “Hydraulic Characterization of Permeable Interlocking Concrete
Pavement” (Leipard, 2015).
PICP Section Materials
A downstream section of PICP was set in the flume and an adjustable full 2-ft by
2-ft section of concrete pavers. Each brick, provided by Interlocking Concrete Pavement
Institute (ICPI), was 8-in by 4-in by 4-in. The resulting section dimensions are seen in
Table 1.
Table 1. PICP Section Dimensions
Spacing
(mm)
Length
(in)
Total Area
(in2)
Total Area
(ft2)
Impervious
Area (in2)
Pervious
Area (in2)
Percent
Impervious
6 24.8 594.0 4.1 41.5 552.5 7.0
10 25.0 600.0 4.2 66.4 533.6 11.1
12.5 25.5 612.0 4.3 87.0 525.0 14.2
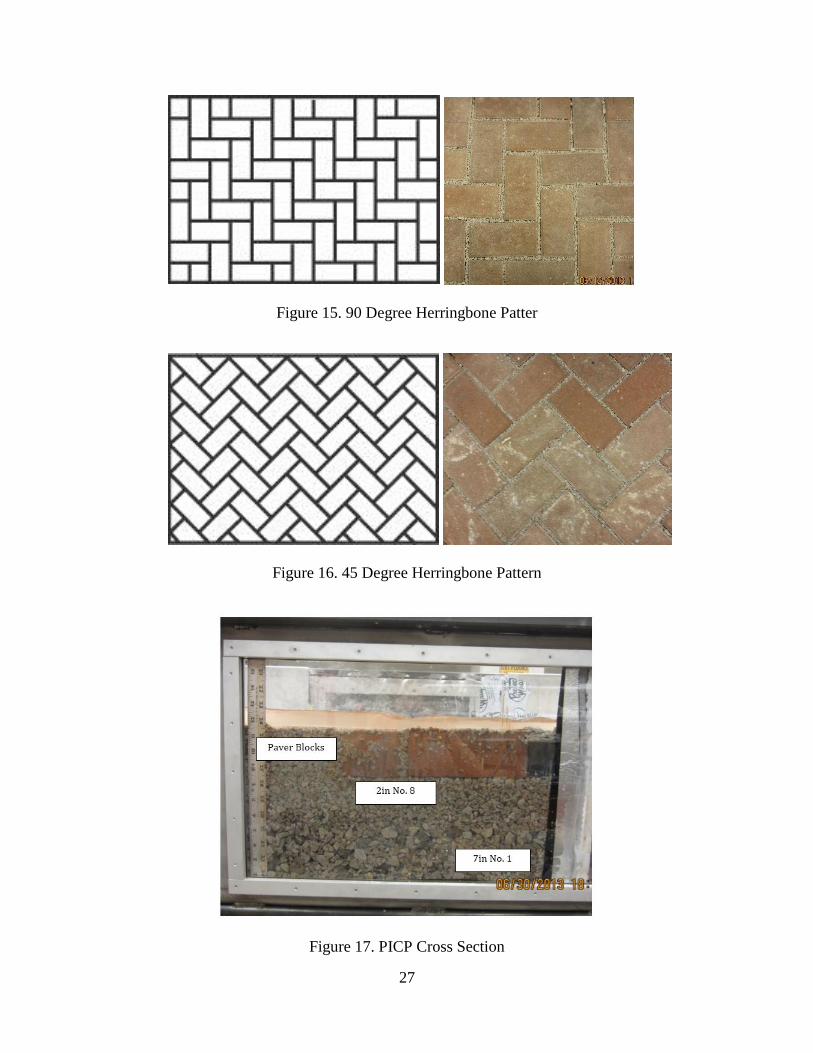
The bricks were set in a herringbone pattern and running bond pattern, seen in
Figure 15 and Figure 16. The bedding layers, previously discussed in Chapter 1 and seen
in Figure 17.
27
Figure 15. 90 Degree Herringbone Patter
Figure 16. 45 Degree Herringbone Pattern
Figure 17. PICP Cross Section

28
Flume Design
The flume, seen in Figure 18, was constructed with a 10-ft approach and
adjustable 2-ft by 2-ft section of PICP at the downstream end of flow. Dimensional
sketches and flume construction and design details are provided by Leipard, 2015.
Figure 18. Laboratory Flume Used for Data Collection
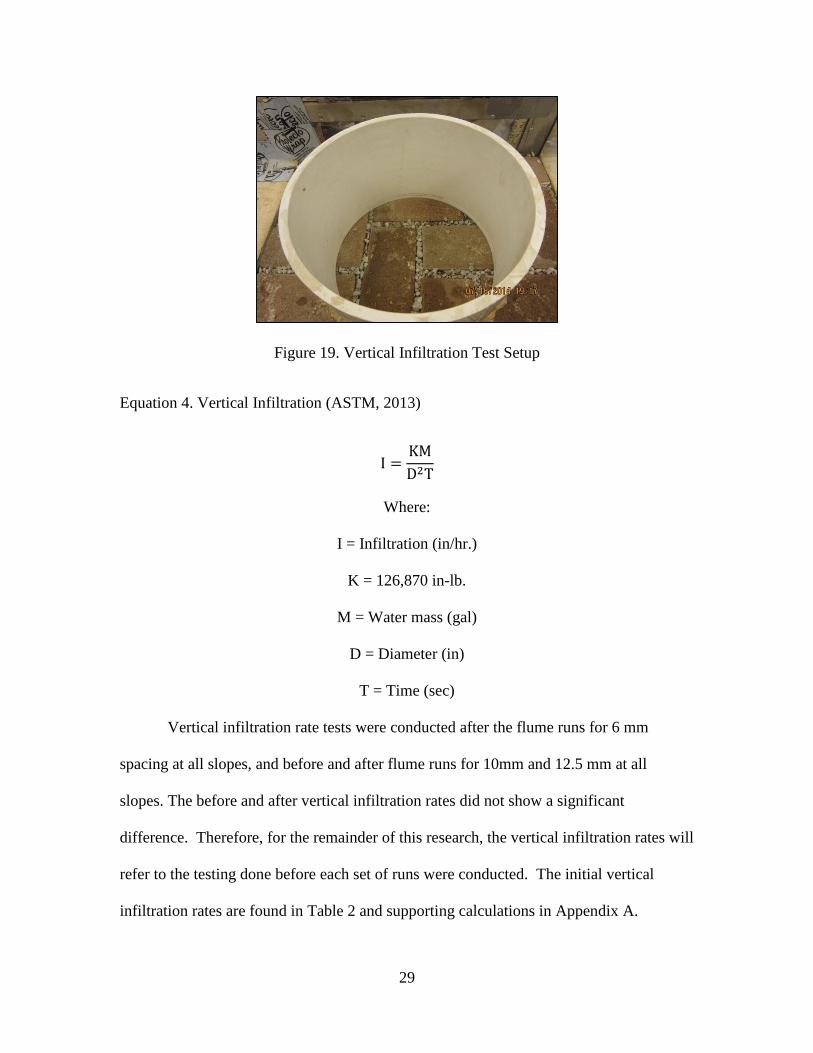
The vertical infiltration rate was tested for the PICP section using an adaption of
ASTM C1781 (ASTM, 2013), seen in Figure 19. Equation 4 was used to calculate the
vertical infiltration at each slope and spacing variation.
29
Figure 19. Vertical Infiltration Test Setup
Equation 4. Vertical Infiltration (ASTM, 2013)
I =KM
D2T
Where:
I = Infiltration (in/hr.)
K = 126,870 in-lb.
M = Water mass (gal)
D = Diameter (in)
T = Time (sec)
Vertical infiltration rate tests were conducted after the flume runs for 6 mm
spacing at all slopes, and before and after flume runs for 10mm and 12.5 mm at all
slopes. The before and after vertical infiltration rates did not show a significant
difference. Therefore, for the remainder of this research, the vertical infiltration rates will
refer to the testing done before each set of runs were conducted. The initial vertical
infiltration rates are found in Table 2 and supporting calculations in Appendix A.

30
Table 2. ASTM C 1781 Average Vertical Infiltration Rates (in/hr.)
*Note: Data not collected for vertical infiltration rate at this slope and spacing
The results make definite conclusions that the vertical infiltration increases as the
spacing between the pavers increases. The results are seen as vertical infiltration versus
pavement slope in Figure 20.
Figure 20. Vertical infiltration vs Pavement Slope
0
500
1000
1500
2000
2500
3000
0% 1% 2% 5% 10%
Ver
tica
l In
filt
ra
tio
n,
in/h
r
Pavement Slope
6 mm
10 mm
12.5 mm
Spacing After/Before 0% 1% 2% 5% 10%
6mm Before 1077 1088 1226 1140 1114
6mm After 1016 * * * *
10mm Before 1504 1558 1628 1514 1495
10mm After 1396 1409 1456 1413 1389
12.5mm Before 1897 2345 2532 2505 2439
12.5mm After 1935 2471 2455 2356 2430
31
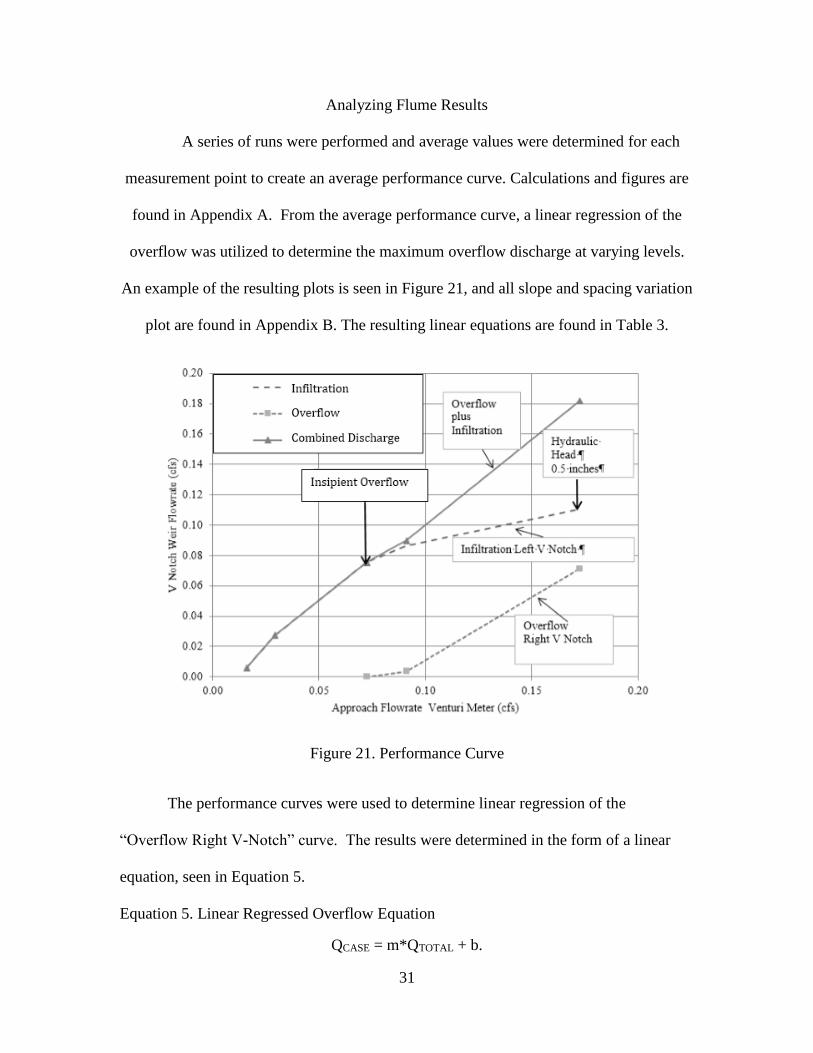
Analyzing Flume Results
A series of runs were performed and average values were determined for each
measurement point to create an average performance curve. Calculations and figures are
found in Appendix A. From the average performance curve, a linear regression of the
overflow was utilized to determine the maximum overflow discharge at varying levels.
An example of the resulting plots is seen in Figure 21, and all slope and spacing variation
plot are found in Appendix B. The resulting linear equations are found in Table 3.
Figure 21. Performance Curve
The performance curves were used to determine linear regression of the
“Overflow Right V-Notch” curve. The results were determined in the form of a linear
equation, seen in Equation 5.
Equation 5. Linear Regressed Overflow Equation
QCASE = m*QTOTAL + b.
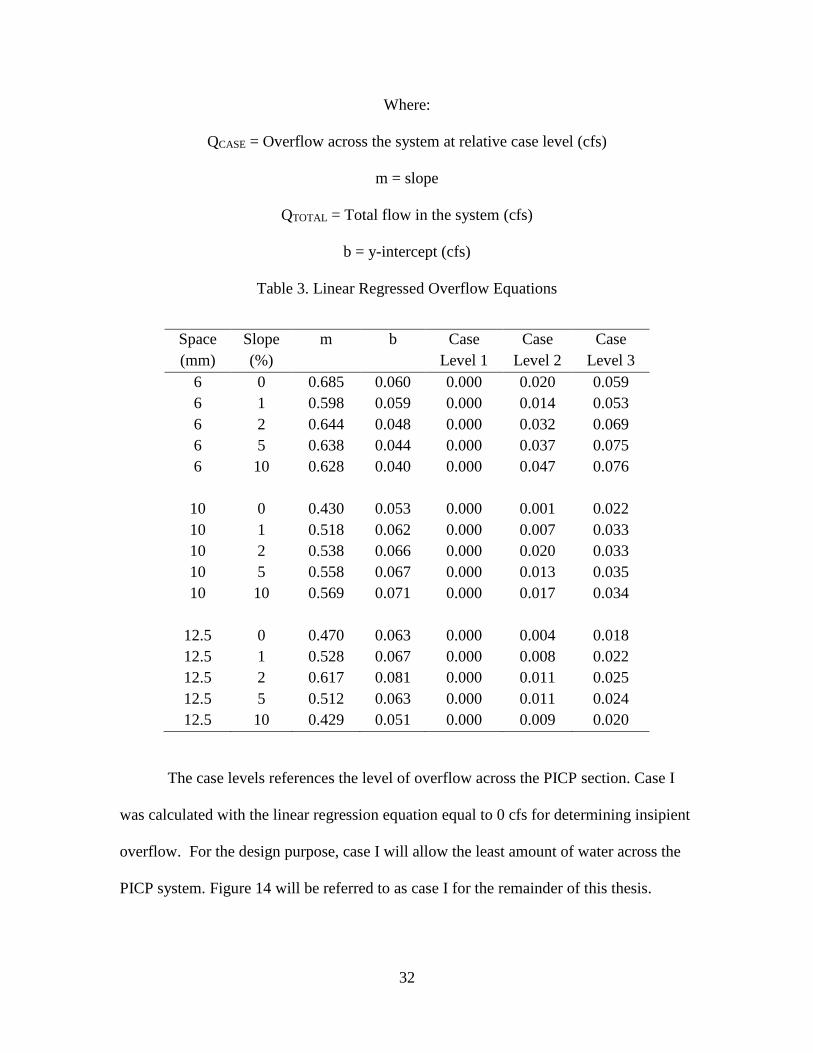
32
Where:
QCASE = Overflow across the system at relative case level (cfs)
m = slope
QTOTAL = Total flow in the system (cfs)
b = y-intercept (cfs)
Table 3. Linear Regressed Overflow Equations
Space
(mm)
Slope
(%)
m b Case
Level 1
Case
Level 2
Case
Level 3
6 0 0.685 0.060 0.000 0.020 0.059
6 1 0.598 0.059 0.000 0.014 0.053
6 2 0.644 0.048 0.000 0.032 0.069
6 5 0.638 0.044 0.000 0.037 0.075
6 10 0.628 0.040 0.000 0.047 0.076
10 0 0.430 0.053 0.000 0.001 0.022
10 1 0.518 0.062 0.000 0.007 0.033
10 2 0.538 0.066 0.000 0.020 0.033
10 5 0.558 0.067 0.000 0.013 0.035
10 10 0.569 0.071 0.000 0.017 0.034
12.5 0 0.470 0.063 0.000 0.004 0.018
12.5 1 0.528 0.067 0.000 0.008 0.022
12.5 2 0.617 0.081 0.000 0.011 0.025
12.5 5 0.512 0.063 0.000 0.011 0.024
12.5 10 0.429 0.051 0.000 0.009 0.020
The case levels references the level of overflow across the PICP section. Case I
was calculated with the linear regression equation equal to 0 cfs for determining insipient
overflow. For the design purpose, case I will allow the least amount of water across the
PICP system. Figure 14 will be referred to as case I for the remainder of this thesis.
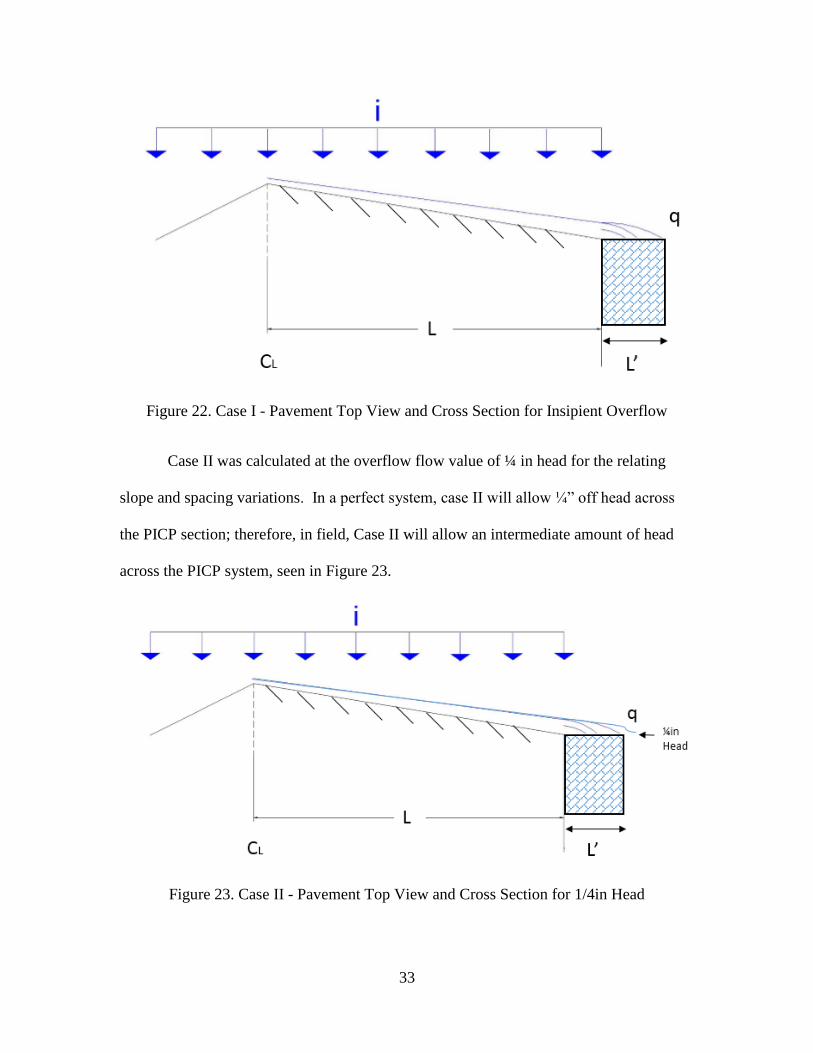
33
Figure 22. Case I - Pavement Top View and Cross Section for Insipient Overflow
Case II was calculated at the overflow flow value of ¼ in head for the relating
slope and spacing variations. In a perfect system, case II will allow ¼” off head across
the PICP section; therefore, in field, Case II will allow an intermediate amount of head
across the PICP system, seen in Figure 23.
Figure 23. Case II - Pavement Top View and Cross Section for 1/4in Head
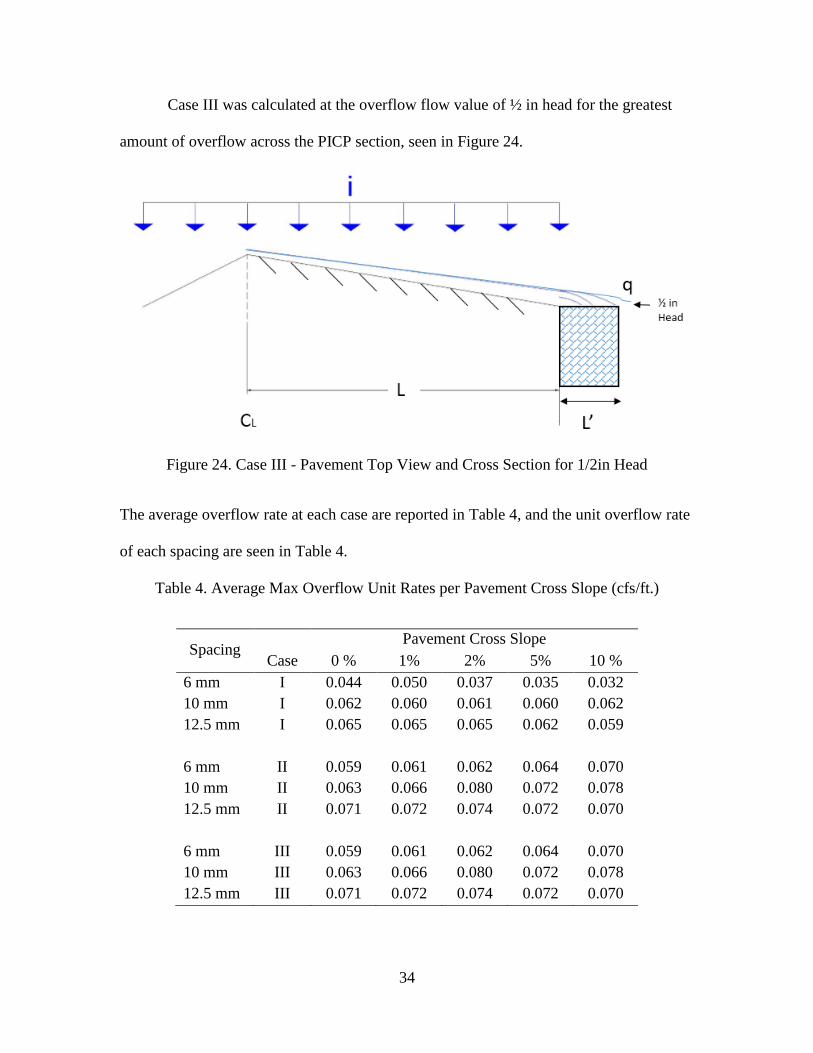
34
Case III was calculated at the overflow flow value of ½ in head for the greatest
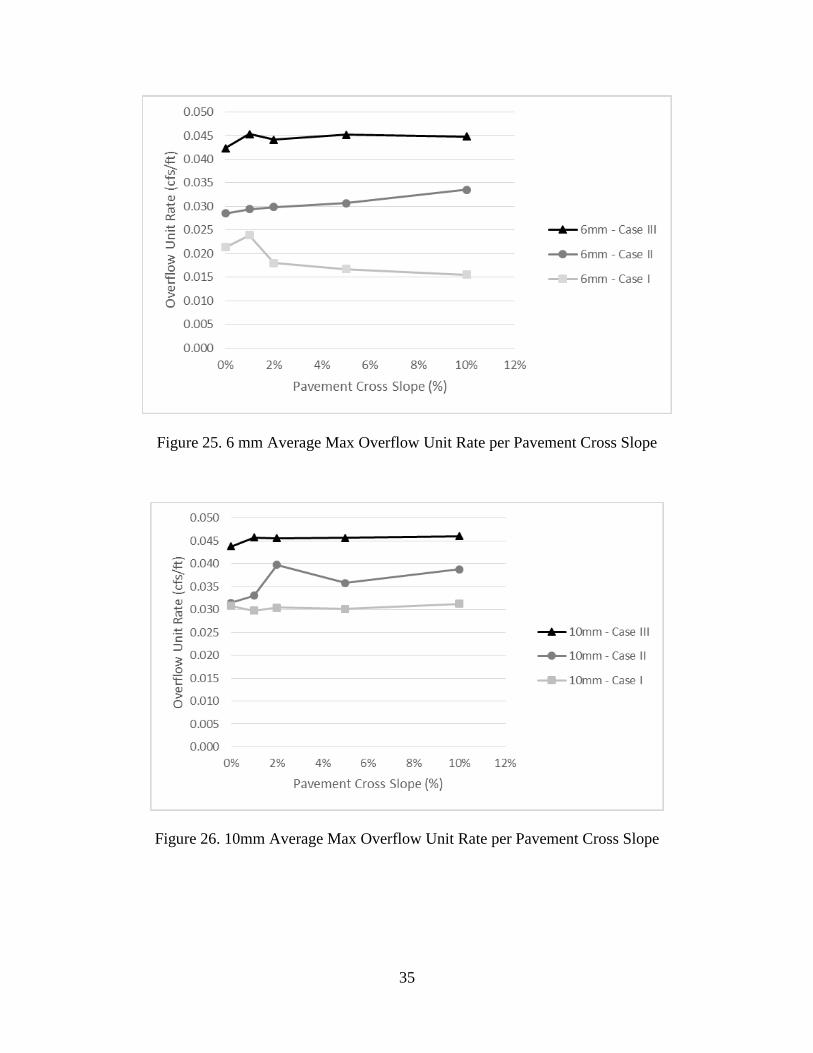
amount of overflow across the PICP section, seen in Figure 24.
Figure 24. Case III - Pavement Top View and Cross Section for 1/2in Head
The average overflow rate at each case are reported in Table 4, and the unit overflow rate
of each spacing are seen in Table 4.
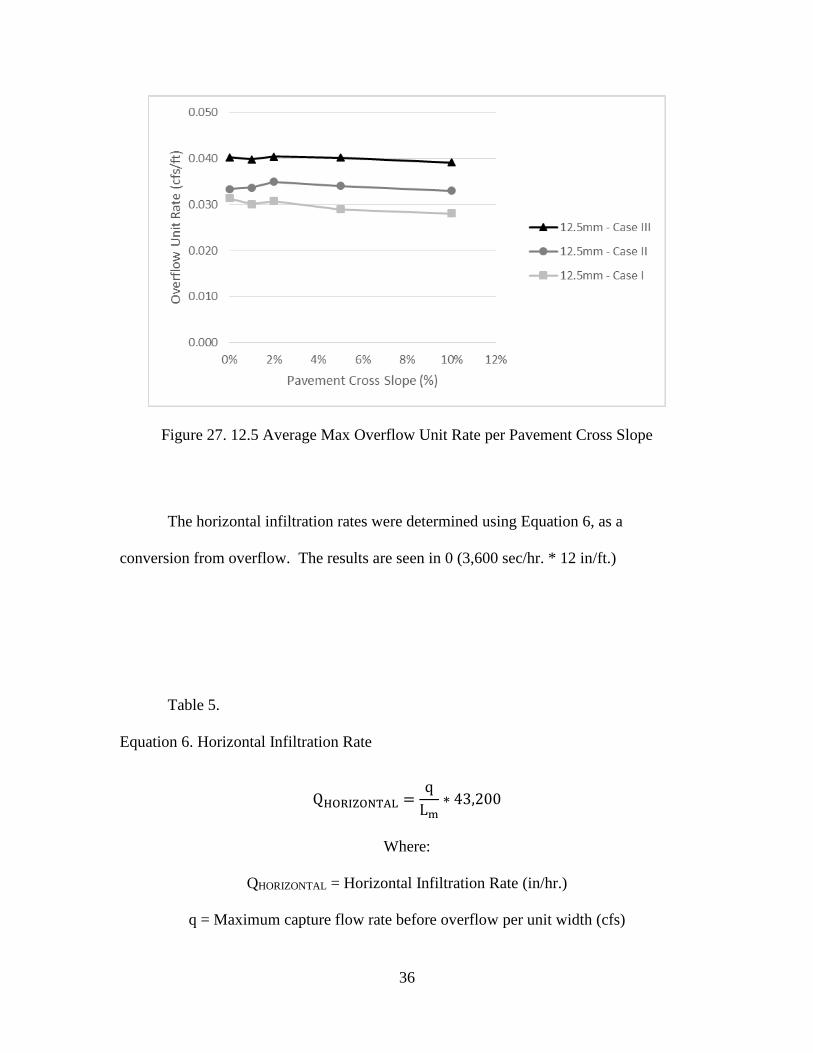
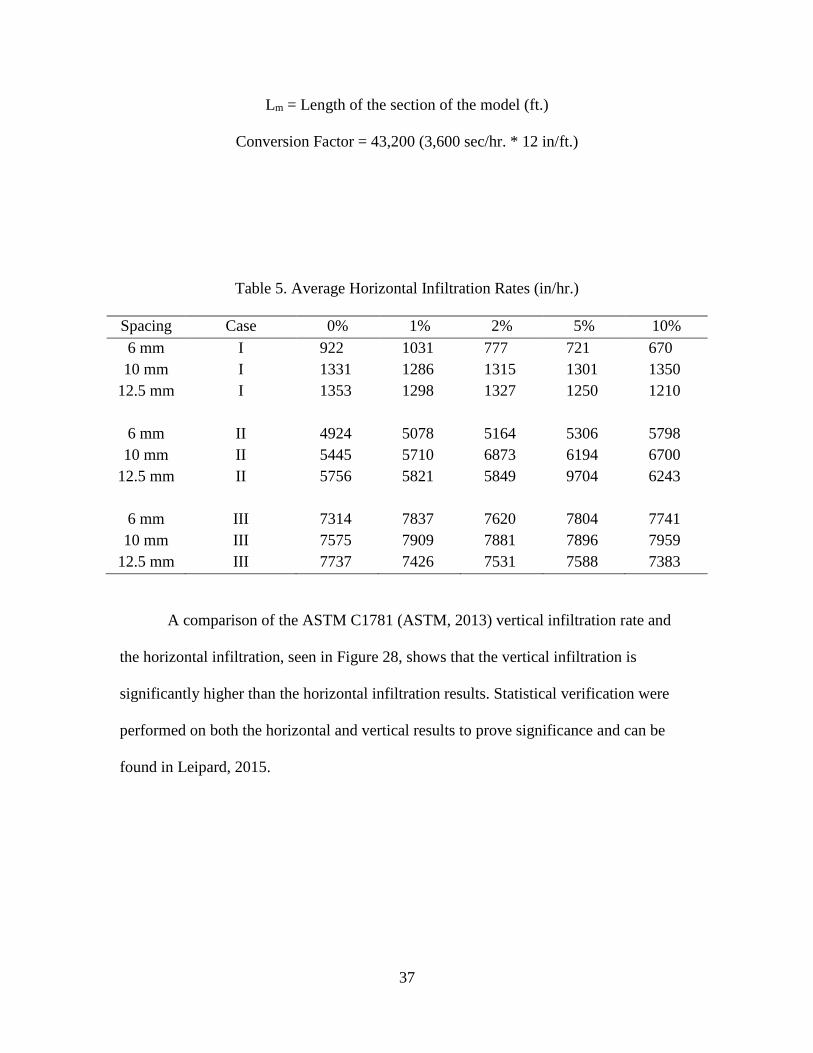
Table 4. Average Max Overflow Unit Rates per Pavement Cross Slope (cfs/ft.)
Spacing Pavement Cross Slope
Case 0 % 1% 2% 5% 10 %
6 mm I 0.044 0.050 0.037 0.035 0.032
10 mm I 0.062 0.060 0.061 0.060 0.062
12.5 mm I 0.065 0.065 0.065 0.062 0.059
6 mm II 0.059 0.061 0.062 0.064 0.070
10 mm II 0.063 0.066 0.080 0.072 0.078
12.5 mm II 0.071 0.072 0.074 0.072 0.070
6 mm III 0.059 0.061 0.062 0.064 0.070
10 mm III 0.063 0.066 0.080 0.072 0.078
12.5 mm III 0.071 0.072 0.074 0.072 0.070
35
Figure 25. 6 mm Average Max Overflow Unit Rate per Pavement Cross Slope
Figure 26. 10mm Average Max Overflow Unit Rate per Pavement Cross Slope
36
Figure 27. 12.5 Average Max Overflow Unit Rate per Pavement Cross Slope
The horizontal infiltration rates were determined using Equation 6, as a
conversion from overflow. The results are seen in 0 (3,600 sec/hr. * 12 in/ft.)
Table 5.
Equation 6. Horizontal Infiltration Rate
QHORIZONTAL =q
Lm∗ 43,200
Where:
QHORIZONTAL = Horizontal Infiltration Rate (in/hr.)
q = Maximum capture flow rate before overflow per unit width (cfs)
37
Lm = Length of the section of the model (ft.)
Conversion Factor = 43,200 (3,600 sec/hr. * 12 in/ft.)
Table 5. Average Horizontal Infiltration Rates (in/hr.)
Spacing Case 0% 1% 2% 5% 10%
6 mm I 922 1031 777 721 670
10 mm I 1331 1286 1315 1301 1350
12.5 mm I 1353 1298 1327 1250 1210
6 mm II 4924 5078 5164 5306 5798
10 mm II 5445 5710 6873 6194 6700
12.5 mm II 5756 5821 5849 9704 6243
6 mm III 7314 7837 7620 7804 7741
10 mm III 7575 7909 7881 7896 7959
12.5 mm III 7737 7426 7531 7588 7383
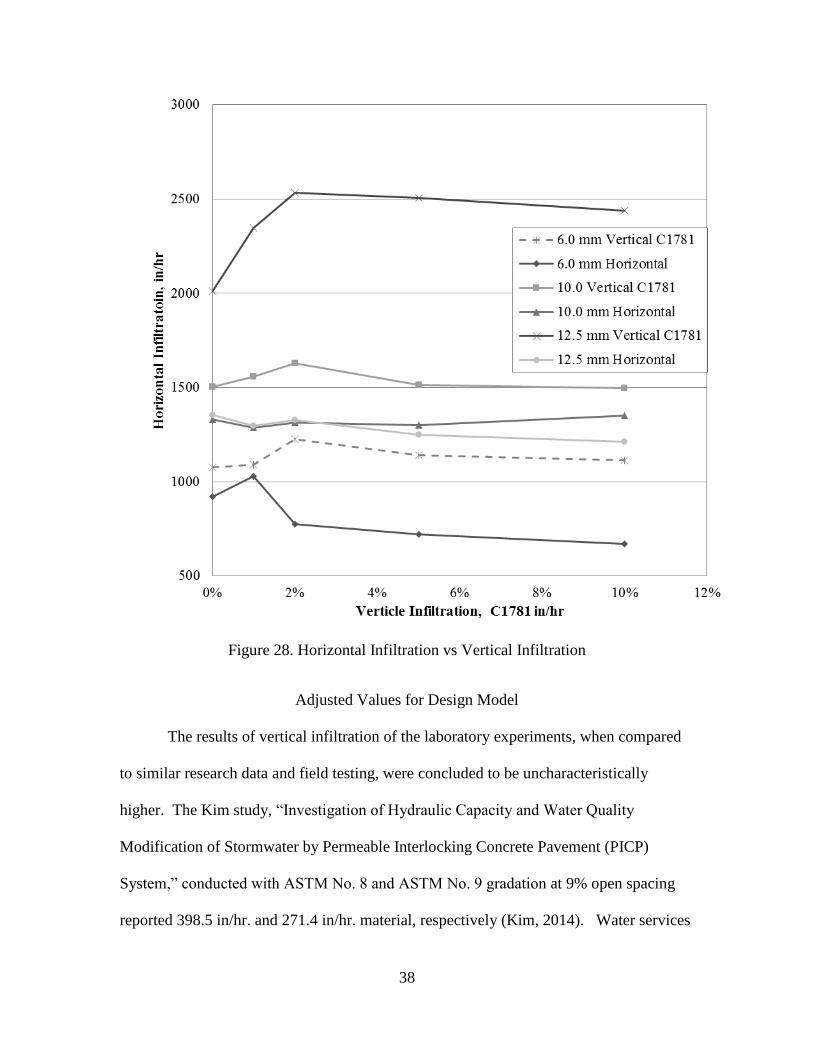
A comparison of the ASTM C1781 (ASTM, 2013) vertical infiltration rate and
the horizontal infiltration, seen in Figure 28, shows that the vertical infiltration is
significantly higher than the horizontal infiltration results. Statistical verification were
performed on both the horizontal and vertical results to prove significance and can be
found in Leipard, 2015.
38
Figure 28. Horizontal Infiltration vs Vertical Infiltration
Adjusted Values for Design Model
The results of vertical infiltration of the laboratory experiments, when compared
to similar research data and field testing, were concluded to be uncharacteristically
higher. The Kim study, “Investigation of Hydraulic Capacity and Water Quality
Modification of Stormwater by Permeable Interlocking Concrete Pavement (PICP)
System,” conducted with ASTM No. 8 and ASTM No. 9 gradation at 9% open spacing
reported 398.5 in/hr. and 271.4 in/hr. material, respectively (Kim, 2014). Water services
39
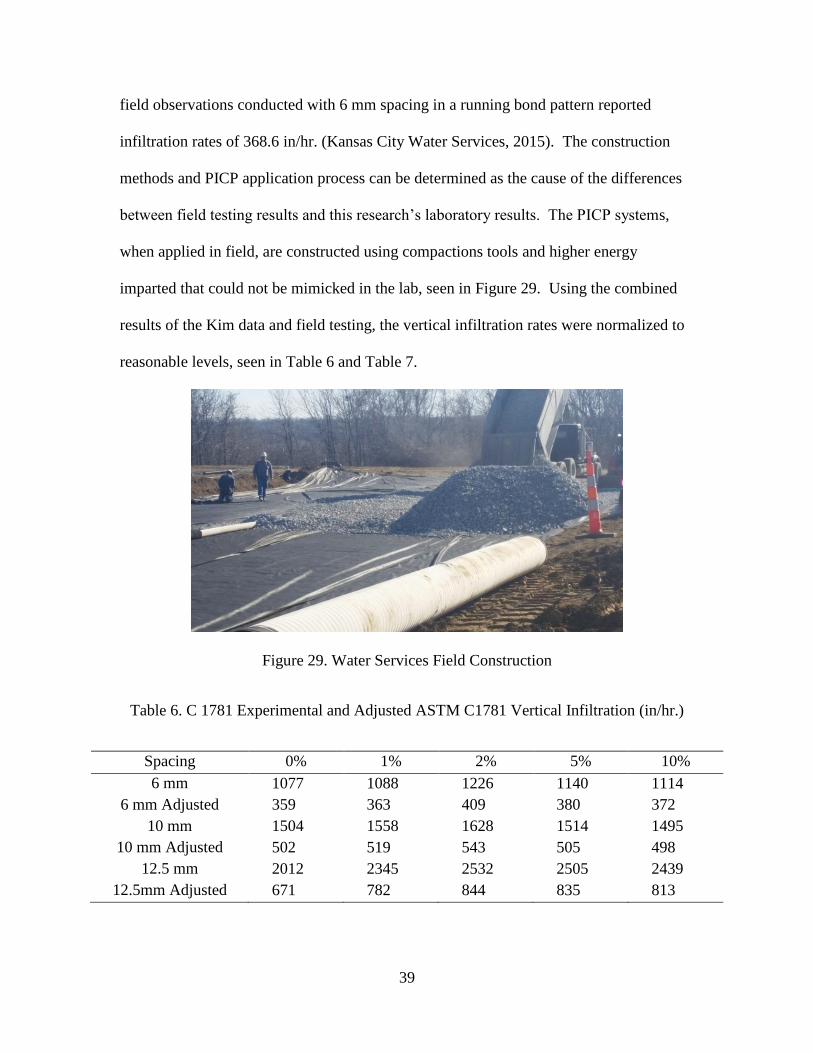
field observations conducted with 6 mm spacing in a running bond pattern reported
infiltration rates of 368.6 in/hr. (Kansas City Water Services, 2015). The construction
methods and PICP application process can be determined as the cause of the differences
between field testing results and this research’s laboratory results. The PICP systems,
when applied in field, are constructed using compactions tools and higher energy
imparted that could not be mimicked in the lab, seen in Figure 29. Using the combined
results of the Kim data and field testing, the vertical infiltration rates were normalized to
reasonable levels, seen in Table 6 and Table 7.
Figure 29. Water Services Field Construction
Table 6. C 1781 Experimental and Adjusted ASTM C1781 Vertical Infiltration (in/hr.)
Spacing 0% 1% 2% 5% 10%
6 mm 1077 1088 1226 1140 1114
6 mm Adjusted 359 363 409 380 372
10 mm 1504 1558 1628 1514 1495
10 mm Adjusted 502 519 543 505 498
12.5 mm 2012 2345 2532 2505 2439
12.5mm Adjusted 671 782 844 835 813
40
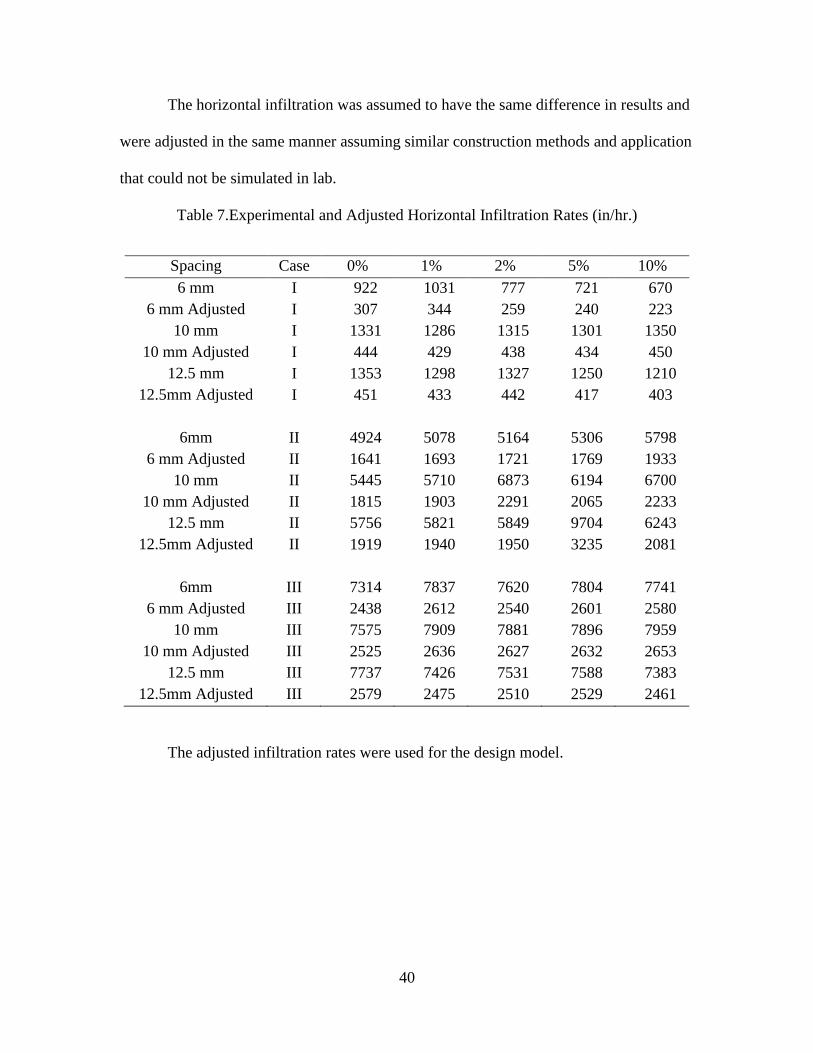
The horizontal infiltration was assumed to have the same difference in results and
were adjusted in the same manner assuming similar construction methods and application
that could not be simulated in lab.
Table 7.Experimental and Adjusted Horizontal Infiltration Rates (in/hr.)
Spacing Case 0% 1% 2% 5% 10%
6 mm I 922 1031 777 721 670
6 mm Adjusted I 307 344 259 240 223
10 mm I 1331 1286 1315 1301 1350
10 mm Adjusted I 444 429 438 434 450
12.5 mm I 1353 1298 1327 1250 1210
12.5mm Adjusted I 451 433 442 417 403
6mm II 4924 5078 5164 5306 5798
6 mm Adjusted II 1641 1693 1721 1769 1933
10 mm II 5445 5710 6873 6194 6700
10 mm Adjusted II 1815 1903 2291 2065 2233
12.5 mm II 5756 5821 5849 9704 6243
12.5mm Adjusted II 1919 1940 1950 3235 2081
6mm III 7314 7837 7620 7804 7741
6 mm Adjusted III 2438 2612 2540 2601 2580
10 mm III 7575 7909 7881 7896 7959
10 mm Adjusted III 2525 2636 2627 2632 2653
12.5 mm III 7737 7426 7531 7588 7383
12.5mm Adjusted III 2579 2475 2510 2529 2461
The adjusted infiltration rates were used for the design model.
41
CHAPTER 4.
CLOGGING
A large factor in the performance of PICP is the rate at which the PICP will clog,
and therefore, the length of time it will take before maintenance must occur. PCIP is
placed in many urban environments in many different types of locations. As discussed in
the literature review, one of the largest contributions to pollution is sediment. Placing
PICP locations are downstream of sand, dirt, sediment, or other small particles that will
restrict flow into the system, the amount of water the system can contain will drastically
decrease (Ostercamp, 1998). Therefore, it was necessary for this research to investigate
the effects of clogging on PICP section through hydraulic laboratory testing.
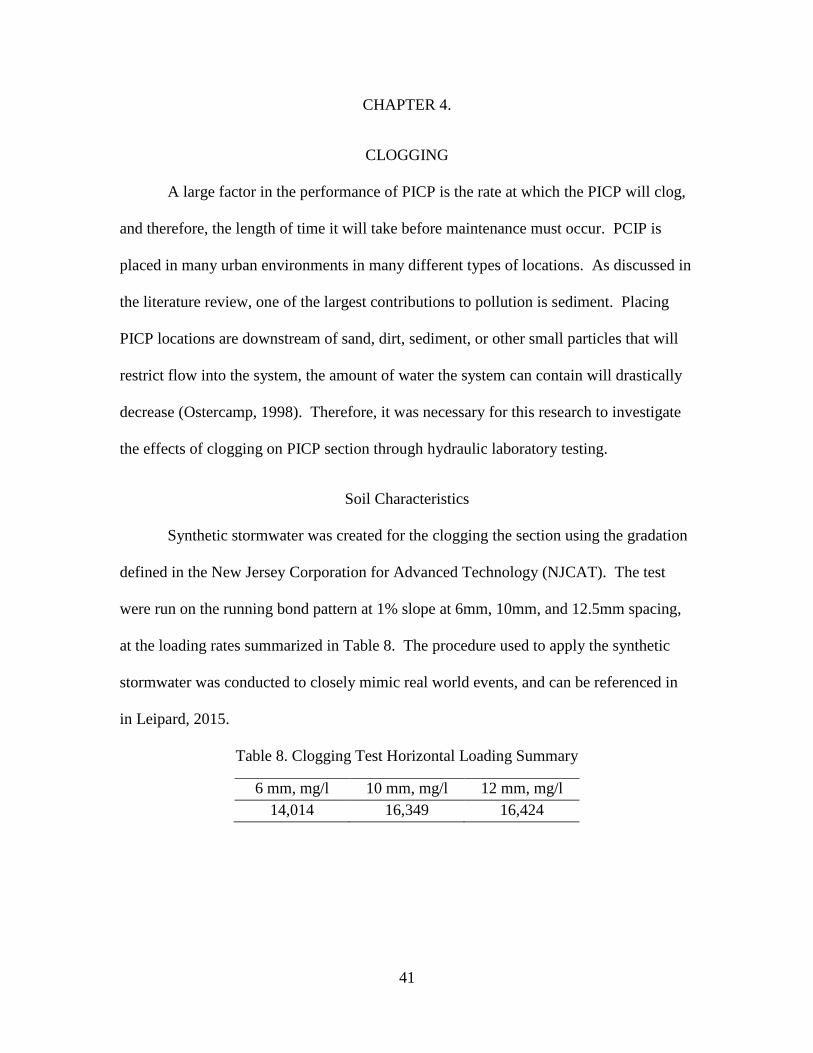
Soil Characteristics
Synthetic stormwater was created for the clogging the section using the gradation
defined in the New Jersey Corporation for Advanced Technology (NJCAT). The test
were run on the running bond pattern at 1% slope at 6mm, 10mm, and 12.5mm spacing,
at the loading rates summarized in Table 8. The procedure used to apply the synthetic
stormwater was conducted to closely mimic real world events, and can be referenced in
in Leipard, 2015.
Table 8. Clogging Test Horizontal Loading Summary
6 mm, mg/l 10 mm, mg/l 12 mm, mg/l
14,014 16,349 16,424
42
Adjusted Clogging Data
As previously seen for vertical infiltration, the magnitude of these results differed
from other clogging test done on permeable pavement. There were two large differences
between comparable PICP research to achieve clogging and this research’s results. The
first being the amount of sediment applied to the clog the system. In the Kim report, the
vertical application of 300 mg/l was used, while in this study’s testing required nearly
14,000 mg/l to complete clogging through the system. It can be suggested that the
apparatus used for this research was on a much larger scale; therefore, it was necessary to
dramatically increase the amount of sediment loading to reach clogged state.
As previously stated, the method of application should also be considered when
comparing these results between the Kim data and the results found in this research. The
synthetic stormwater was applied upstream to simulate polluted flow, similar to what
would be seen in the field. In having this flow combine with water, a greater amount of a
sediment is necessary due to some sediment in suspension overflowing the system,
instead of being applied directly onto the system. Although the magnitude of the data
differed, the results found the same trend. By normalizing the data based on a linear
regression compared to field studies, the following Error! Reference source not found.,
REF _Ref416301845 \h \* MERGEFORMAT Error! Reference source not found.,
and Error! Reference source not found. were created to represent clogged flow through
the system.
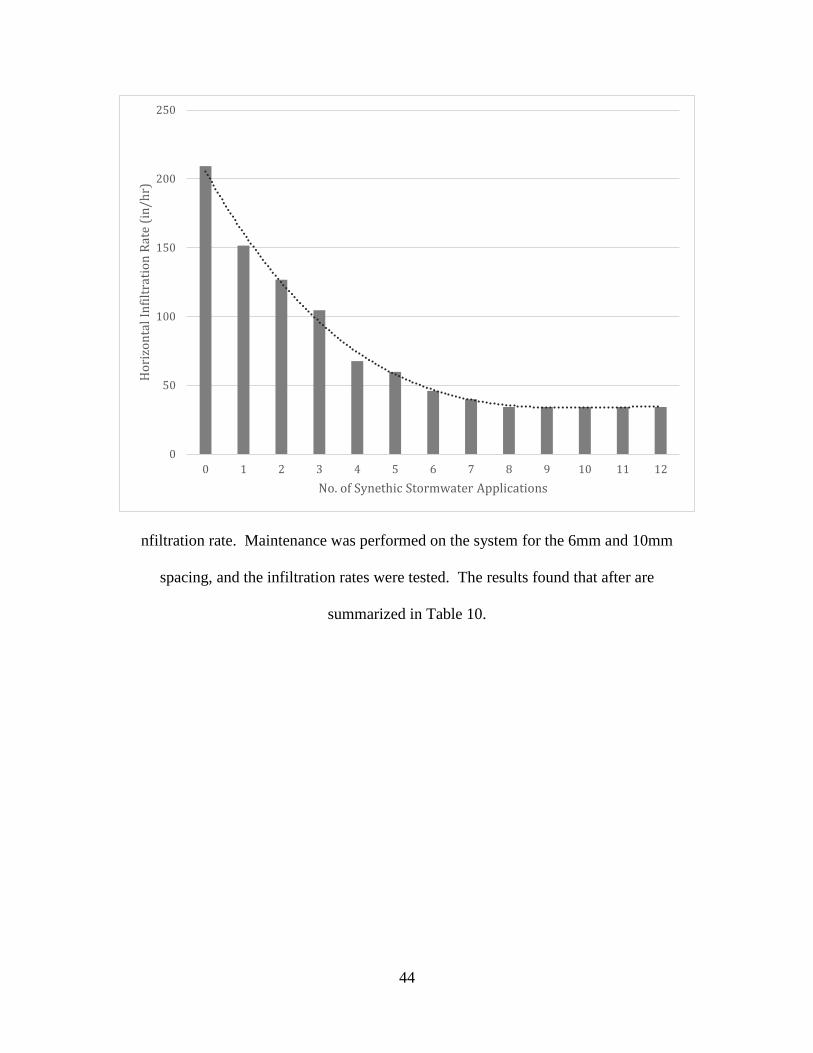
The results of these test show that infiltration rate decreases with
continuous application of synthetic stormwater. The resulting plots for each block
spacing variation are seen in Error! Reference source not found. through Error!
43
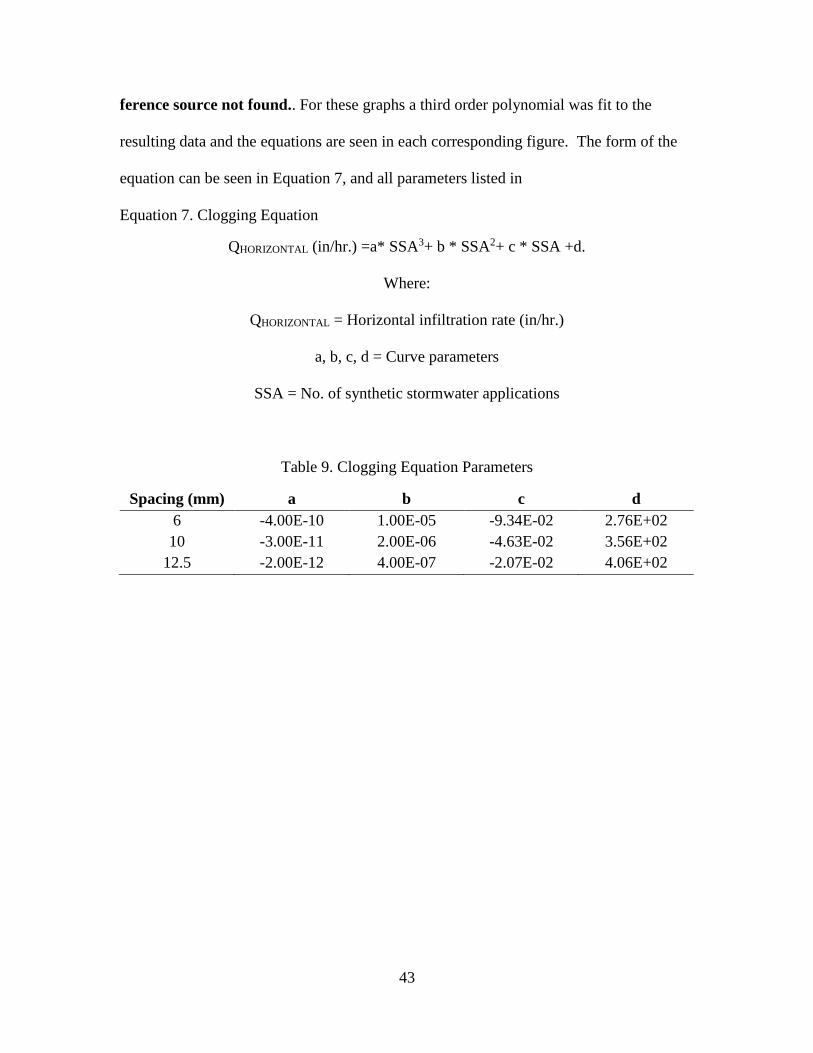
ference source not found.. For these graphs a third order polynomial was fit to the
resulting data and the equations are seen in each corresponding figure. The form of the
equation can be seen in Equation 7, and all parameters listed in
Equation 7. Clogging Equation
QHORIZONTAL (in/hr.) =a* SSA3+ b * SSA2+ c * SSA +d.
Where:
QHORIZONTAL = Horizontal infiltration rate (in/hr.)
a, b, c, d = Curve parameters
SSA = No. of synthetic stormwater applications
Table 9. Clogging Equation Parameters
Spacing (mm) a b c d
6 -4.00E-10 1.00E-05 -9.34E-02 2.76E+02
10 -3.00E-11 2.00E-06 -4.63E-02 3.56E+02
12.5 -2.00E-12 4.00E-07 -2.07E-02 4.06E+02
44
nfiltration rate. Maintenance was performed on the system for the 6mm and 10mm
spacing, and the infiltration rates were tested. The results found that after are
summarized in Table 10.
0
50
100
150
200
250
0 1 2 3 4 5 6 7 8 9 10 11 12
Ho
rizo
nta
l In
filt
rati
on
Rat
e (i
n/h
r)
No. of Synethic Stormwater Applications
45
Table 10The results of these tables verify the conclusion that the point of
complete clogging occurred at a much faster rate for smaller spacing and that post
clogging maintenance will increase the infiltration rate. Maintenance was performed on
the system for the 6mm and 10mm spacing, and the infiltration rates were tested. The
results found that after are summarized in Table 10.
46
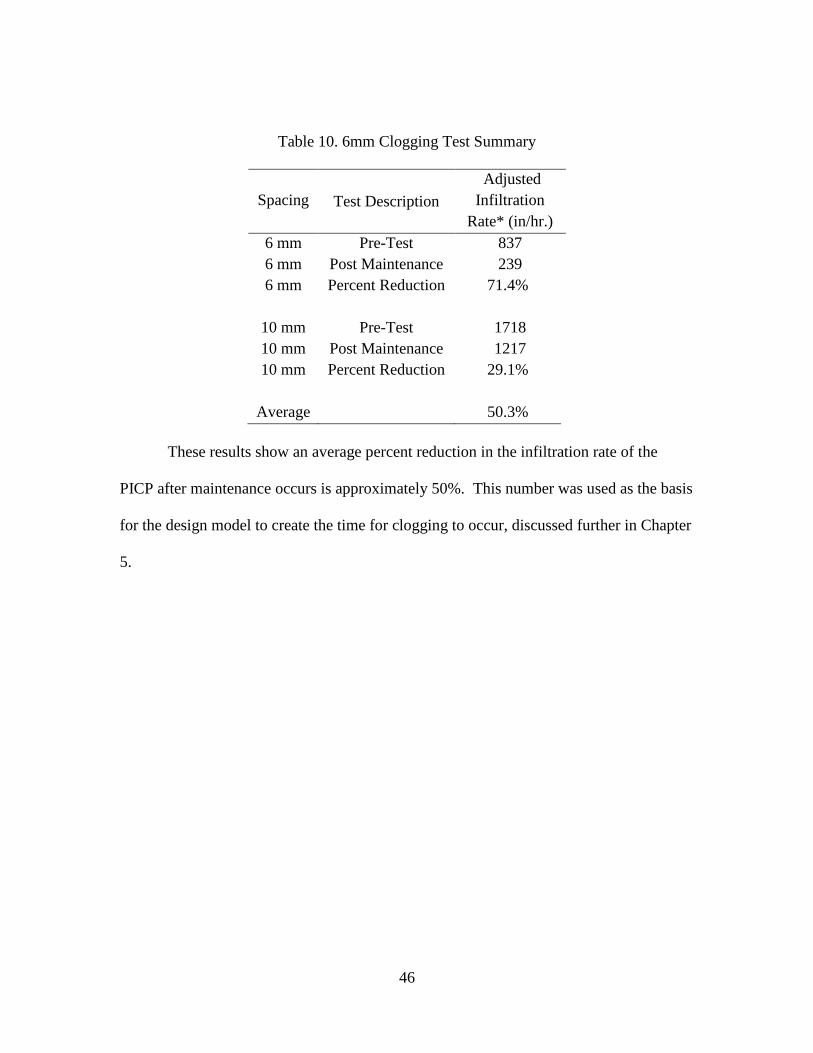
Table 10. 6mm Clogging Test Summary
Spacing Test Description
Adjusted
Infiltration
Rate* (in/hr.)
6 mm Pre-Test 837
6 mm Post Maintenance 239
6 mm Percent Reduction 71.4%
10 mm Pre-Test 1718
10 mm Post Maintenance 1217
10 mm Percent Reduction 29.1%
Average 50.3%
These results show an average percent reduction in the infiltration rate of the
PICP after maintenance occurs is approximately 50%. This number was used as the basis
for the design model to create the time for clogging to occur, discussed further in Chapter
5.
47
CHAPTER 5
HYDRAULIC DESIGN TOOL OWNER’S MANUAL
As previously stated in the literature review, the current design process of PICP
focuses on the hydrologic and structural components. The hydraulic components are not
as well developed. The main objective of the analysis of the flume results was to
determine the appropriate hydraulic response of each scenario of spacing and slope that
would be applicable to similar site areas. Chapter 4 summarizes the development of the
hydraulic design tool in the format of an owner’s manual used to determine the hydraulic
characteristics, including vertical infiltration, horizontal infiltration, and overflow
discharge based on gap size of a PICP site area.
Owner’s Manual
Inputs
This PICP design tool is used to determine design criteria necessary based specific
site input information. This manual is created to assist the engineer in the design phase to
conclude proper hydraulic parameters for the site.
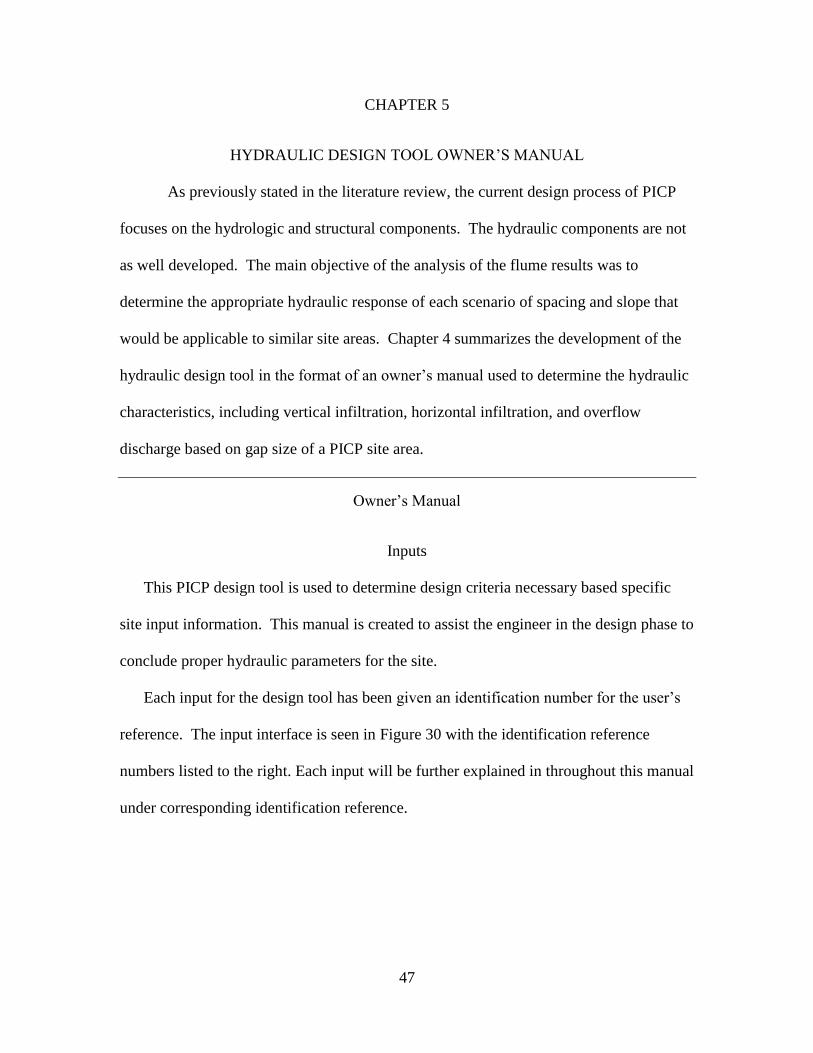
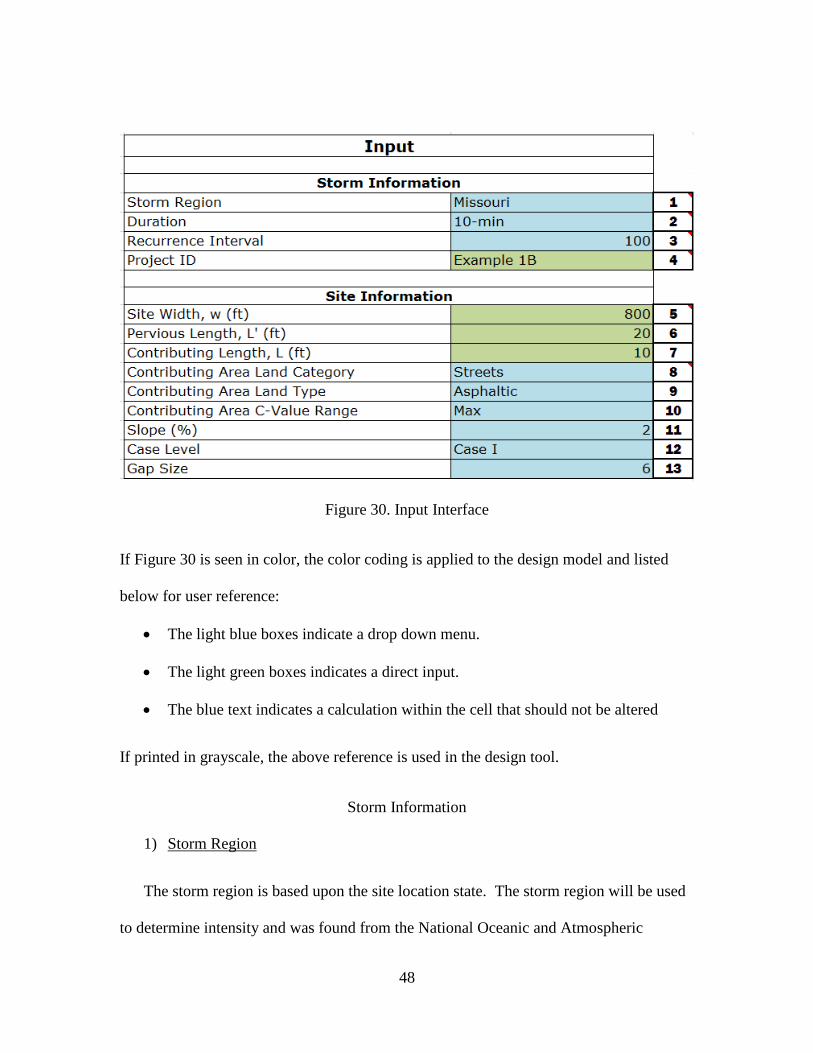
Each input for the design tool has been given an identification number for the user’s
reference. The input interface is seen in Figure 30 with the identification reference
numbers listed to the right. Each input will be further explained in throughout this manual
under corresponding identification reference.
48
Figure 30. Input Interface
If Figure 30 is seen in color, the color coding is applied to the design model and listed
below for user reference:
The light blue boxes indicate a drop down menu.
The light green boxes indicates a direct input.
The blue text indicates a calculation within the cell that should not be altered
If printed in grayscale, the above reference is used in the design tool.
Storm Information
1) Storm Region
The storm region is based upon the site location state. The storm region will be used
to determine intensity and was found from the National Oceanic and Atmospheric
49
Administration (NOAA)’s National Weather Service Precipitation Frequency Data
Server. Not all states are updated with accurate rainfall intensities. All 50 states are
included in the design tool with accurate rainfall intensities with the exception of
Connecticut, Idaho, Maine, Massachusetts, Montana, New Hampshire, New York,
Oregon, Rhode Island, Texas, Vermont, Washington, and Wyoming.
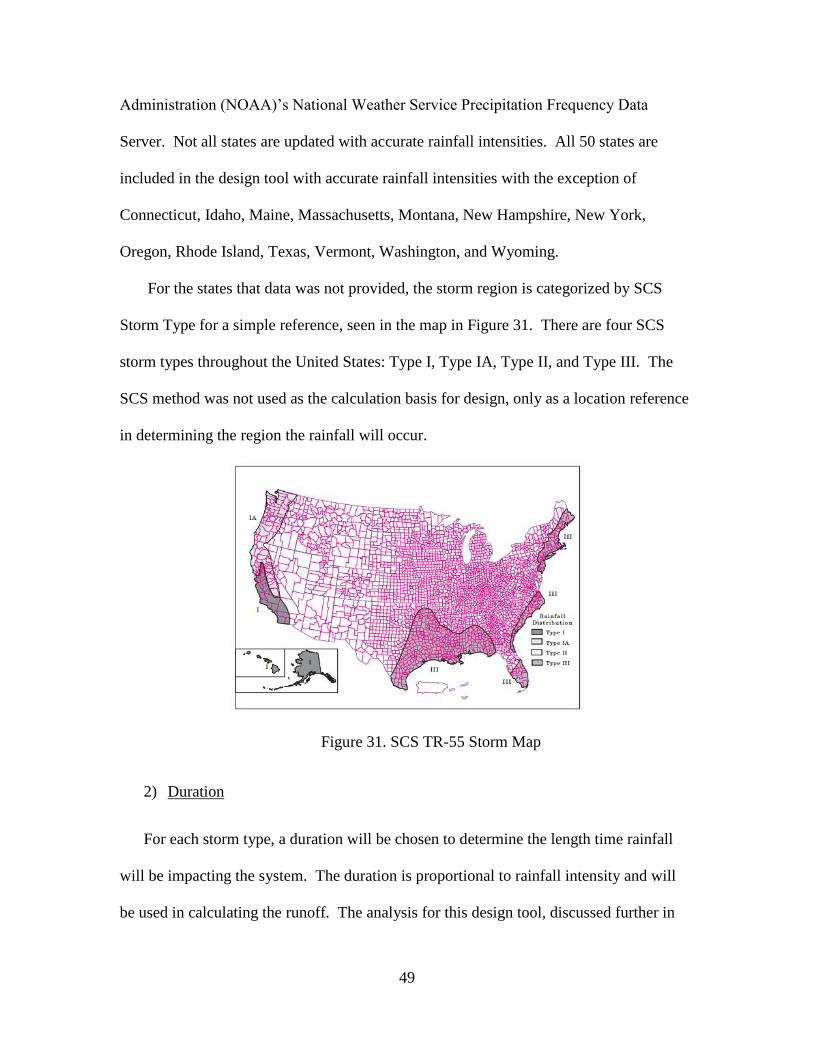
For the states that data was not provided, the storm region is categorized by SCS
Storm Type for a simple reference, seen in the map in Figure 31. There are four SCS
storm types throughout the United States: Type I, Type IA, Type II, and Type III. The
SCS method was not used as the calculation basis for design, only as a location reference
in determining the region the rainfall will occur.
Figure 31. SCS TR-55 Storm Map
2) Duration
For each storm type, a duration will be chosen to determine the length time rainfall
will be impacting the system. The duration is proportional to rainfall intensity and will
be used in calculating the runoff. The analysis for this design tool, discussed further in

50
this Chapter, is based on unit discharge rate. For a site of unit width, it can be assumed
that the intensity of the storm will not exceed a 10-min time of concentration. Therefore,
tool can calculate 5-min and 10-min duration.
3) Recurrence Interval
After the duration is chosen to properly anticipate recurrence interval are chosen.
Recurrence intervals give the probability of a storm event occurring. A 10 year storm
does not mean that a storm will occur every 10 years, but that the probability that a storm
of that depth will occur at the chosen location of the site. The following list gives all the
possible options included in the design tool: 2 yr., 5 yr., 10 yr., 25 yr., 50 yr., 100 yr., 200
yr., 500 yr. and 1000 yr.
4) Project ID
The project ID is a reference used for the design engineer to better identify their
project. This box is a direct input, and it will not impact the design.
Site Area Information
Figure 32. Total Proposed Site Area
51
5) Site Width, w (ft.)
The site width is determined in feet and is in reference to the width in Figure 32.
6) Pervious Length, L (sqft)
The pervious length represent the length of the unit strip of the pervious area in the
site area, seen in Figure 32.
7) Contributing Area, L’ (sqft)
The contributing length represents the length of the unit strip of the contributing area
in the site area, seen in Figure 32. For the purpose of this design tool, the contributing
area to pervious area ratio cannot exceed a 5:1 ratio.
8) Contributing Area Land Category
The contributing land category defines where the contributing runoff is descending
from. The contributing area is considered completely impervious unless specified
otherwise. The possible category options included are Business, Residential, Suburban,
Apartment Dwelling Areas, Industrial, Parks, Cemeteries, Playgrounds, Railroad Yard
Areas, Unimproved Areas, Lawns, Streets, and Roof.
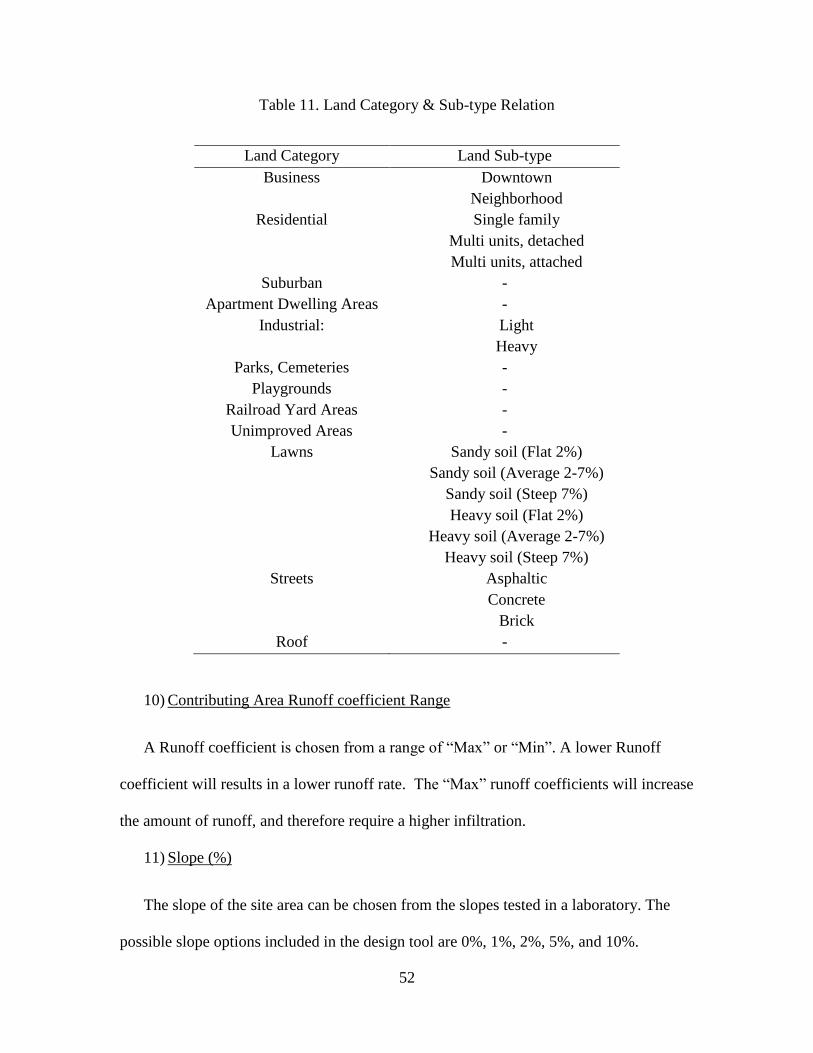
9) Contributing Land sub-Type
After choosing the contributing land category, a contributing land type will then be
available. The possible land sub-types are listed relative land category in Table 11.
Certain land categories can be described fully by category, and therefore, do not need a
sub-type to accurately estimate flow that would reach the PICP section.
52
Table 11. Land Category & Sub-type Relation
Land Category Land Sub-type
Business Downtown
Neighborhood
Residential Single family
Multi units, detached
Multi units, attached
Suburban -
Apartment Dwelling Areas -
Industrial: Light
Heavy
Parks, Cemeteries -
Playgrounds -
Railroad Yard Areas -
Unimproved Areas -
Lawns Sandy soil (Flat 2%)
Sandy soil (Average 2-7%)
Sandy soil (Steep 7%)
Heavy soil (Flat 2%)
Heavy soil (Average 2-7%)
Heavy soil (Steep 7%)
Streets Asphaltic
Concrete
Brick
Roof -
10) Contributing Area Runoff coefficient Range
A Runoff coefficient is chosen from a range of “Max” or “Min”. A lower Runoff
coefficient will results in a lower runoff rate. The “Max” runoff coefficients will increase
the amount of runoff, and therefore require a higher infiltration.
11) Slope (%)
The slope of the site area can be chosen from the slopes tested in a laboratory. The
possible slope options included in the design tool are 0%, 1%, 2%, 5%, and 10%.
53
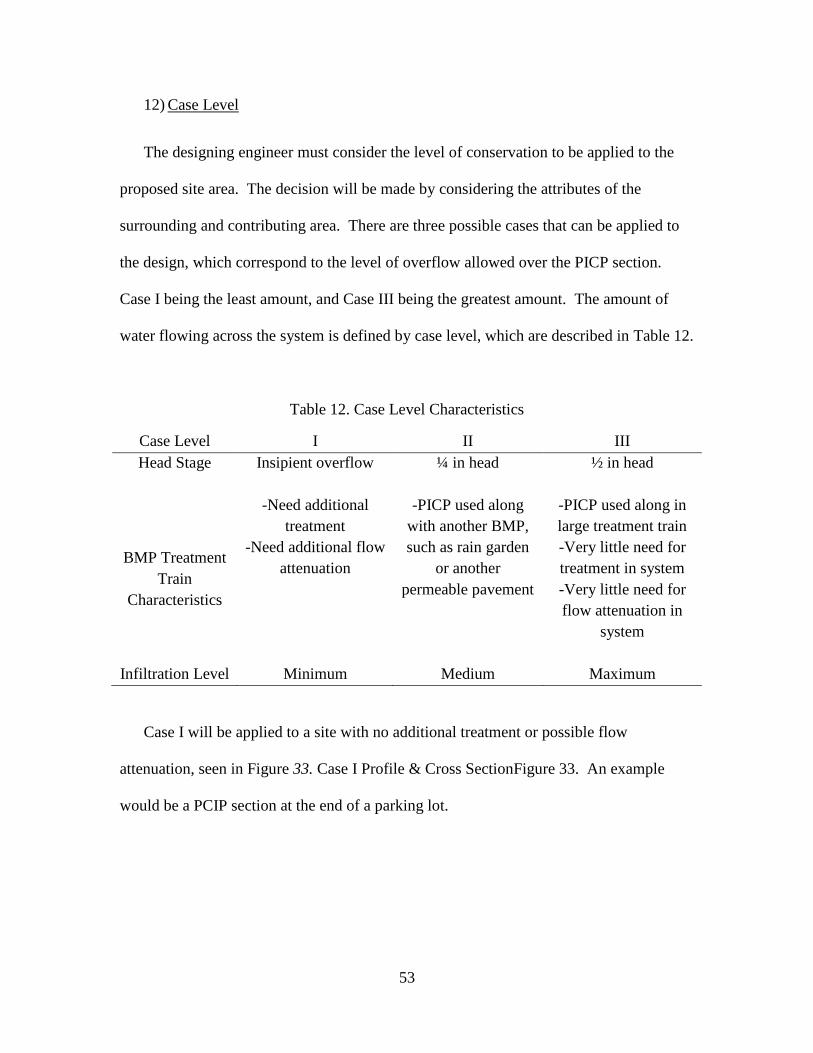
12) Case Level
The designing engineer must consider the level of conservation to be applied to the
proposed site area. The decision will be made by considering the attributes of the
surrounding and contributing area. There are three possible cases that can be applied to
the design, which correspond to the level of overflow allowed over the PICP section.
Case I being the least amount, and Case III being the greatest amount. The amount of
water flowing across the system is defined by case level, which are described in Table 12.
Table 12. Case Level Characteristics
Case Level I II III
Head Stage Insipient overflow ¼ in head ½ in head
BMP Treatment
Train
Characteristics
-Need additional
treatment
-Need additional flow
attenuation
-PICP used along
with another BMP,
such as rain garden
or another
permeable pavement
-PICP used along in
large treatment train
-Very little need for
treatment in system
-Very little need for
flow attenuation in
system
Infiltration Level Minimum Medium Maximum
Case I will be applied to a site with no additional treatment or possible flow
attenuation, seen in Figure 33. Case I Profile & Cross SectionFigure 33. An example
would be a PCIP section at the end of a parking lot.

54
Figure 33. Case I Profile & Cross Section
Case II will be applied when PICP was used along with another BMP. Profile seen in
Figure 34. For example, another permeable pavement or a rain barrel added to the site.
This addition of a BMP that is not meant for very large amounts of flow attenuation or
treatment, but will reduce the flow to the PICP section and decrease necessary amounts
of treatment within the system.
Figure 34. Case II Profile & Cross Section
Case III will be applied when the PICP section would be used at the end of the
treatment train of BMPs, such as a rain garden with rain barrels and PICP at the end of
the flow path. The flow ultimately reaching the PICP would be very low.
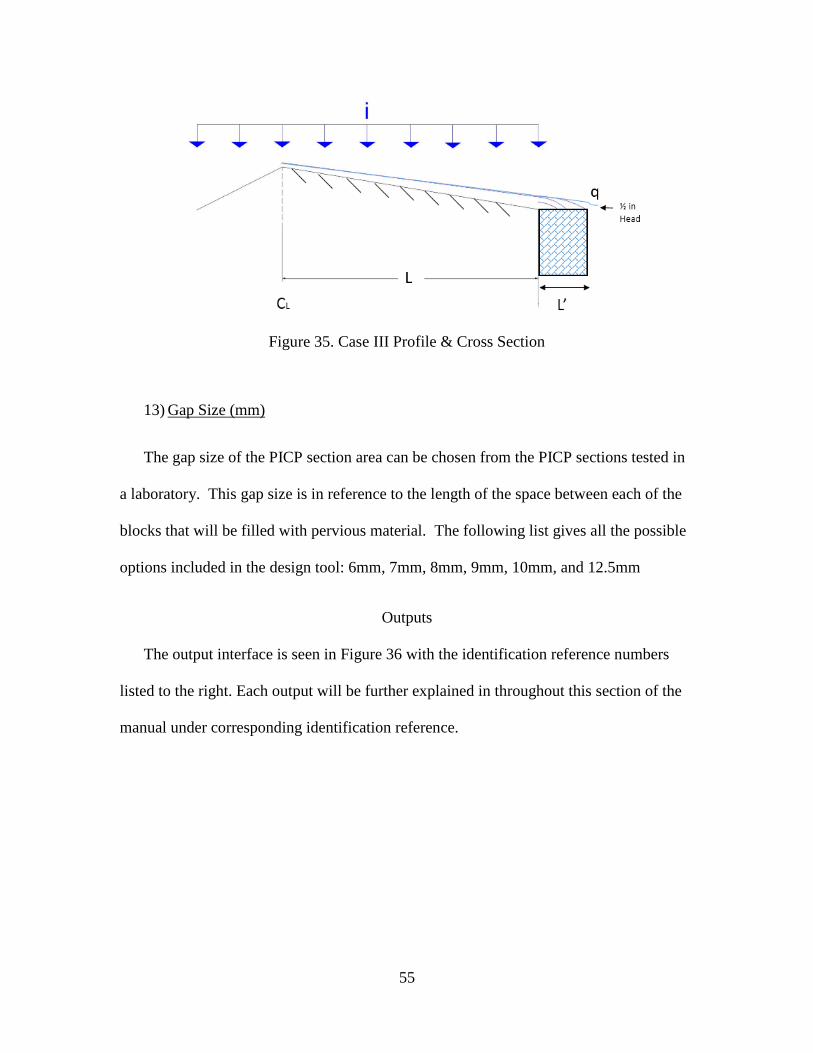
55
Figure 35. Case III Profile & Cross Section
13) Gap Size (mm)
The gap size of the PICP section area can be chosen from the PICP sections tested in
a laboratory. This gap size is in reference to the length of the space between each of the
blocks that will be filled with pervious material. The following list gives all the possible
options included in the design tool: 6mm, 7mm, 8mm, 9mm, 10mm, and 12.5mm
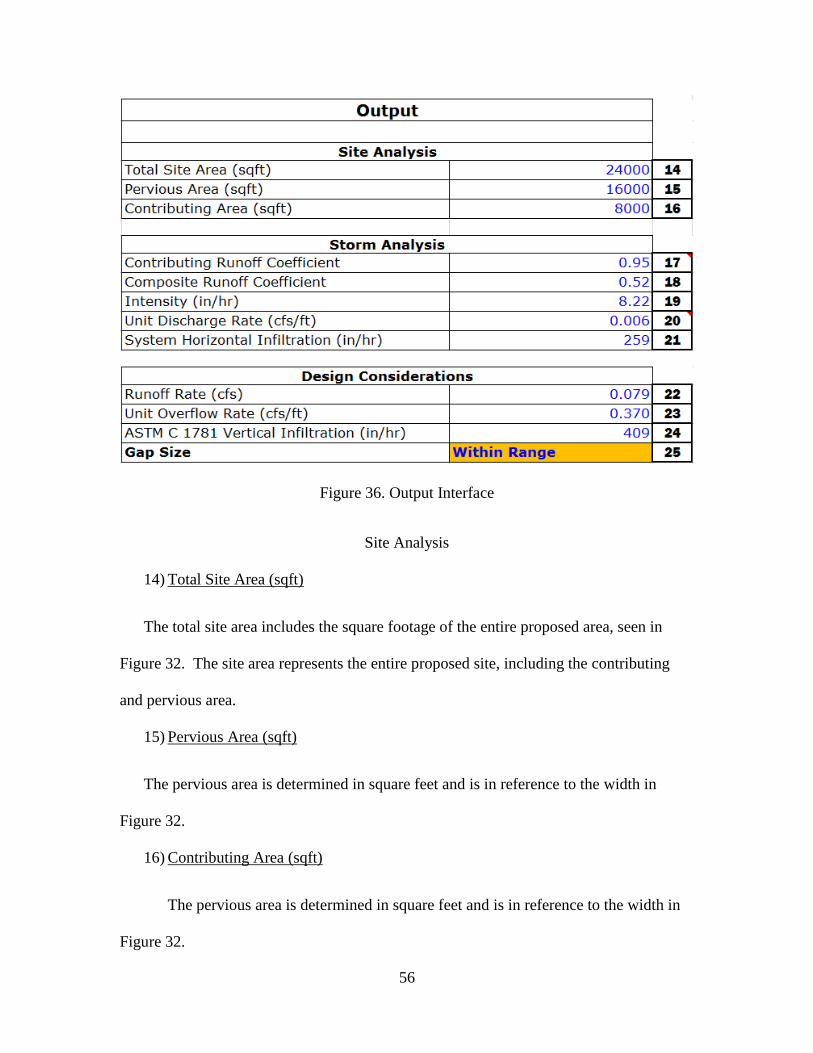
Outputs
The output interface is seen in Figure 36 with the identification reference numbers
listed to the right. Each output will be further explained in throughout this section of the
manual under corresponding identification reference.
56
Figure 36. Output Interface
Site Analysis
14) Total Site Area (sqft)
The total site area includes the square footage of the entire proposed area, seen in
Figure 32. The site area represents the entire proposed site, including the contributing
and pervious area.
15) Pervious Area (sqft)
The pervious area is determined in square feet and is in reference to the width in
Figure 32.
16) Contributing Area (sqft)
The pervious area is determined in square feet and is in reference to the width in
Figure 32.

57
Storm Analysis
17) Contributing Runoff Coefficient
Using the results of inputs Contributing Land Category, Contributing Land Sub-type,
and Contributing Runoff coefficient range, a contributing runoff coefficient is found
Table 13.
Table 13. Runoff Coefficients (American Public Works Association)
Type of Drainage Area Runoff Coefficient
Min - Max
Business:
Downtown areas 0.7 - 0.95
Neighborhood areas 0.5 - 0.7
Residential:
Single Family 0.3 - 0.5
Multi Units (Detached) 0.4 - 0.6
Multi Units (Attached) 0.6 - 0.75
Suburban 0.25 - 0.4
Apartment Dwelling Areas 0.5 - 0.7
Industrial:
Light 0.5 - 0.8
Heavy 0.6 - 0.9
Parks, Cemeteries 0.1 - 0.25
Playgrounds 0.2 - 0.4
Railroad Yard Areas 0.2 - 0.4
Unimproved Areas 0.1 - 0.3
Lawns:
Sandy soil (Flat 2%) 0.05 - 0.1
Sandy soil (Average 2-7%) 0.1 - 0.15
Sandy soil (Steep 7%) 0.15 - 0.2
Heavy soil (Flat 2%) 0.13 - 0.17
Heavy soil (Average 2-7%) 0.18 - 0.25
Heavy soil (Steep 7%) 0.25 - 0.35
Streets:
Asphaltic 0.7 - 0.95
Concrete 0.8 - 0.95
Brick 0.7 - 0.85
Drives and Walks 0.75 - 0.85
Roof 0.75 - 0.95
58
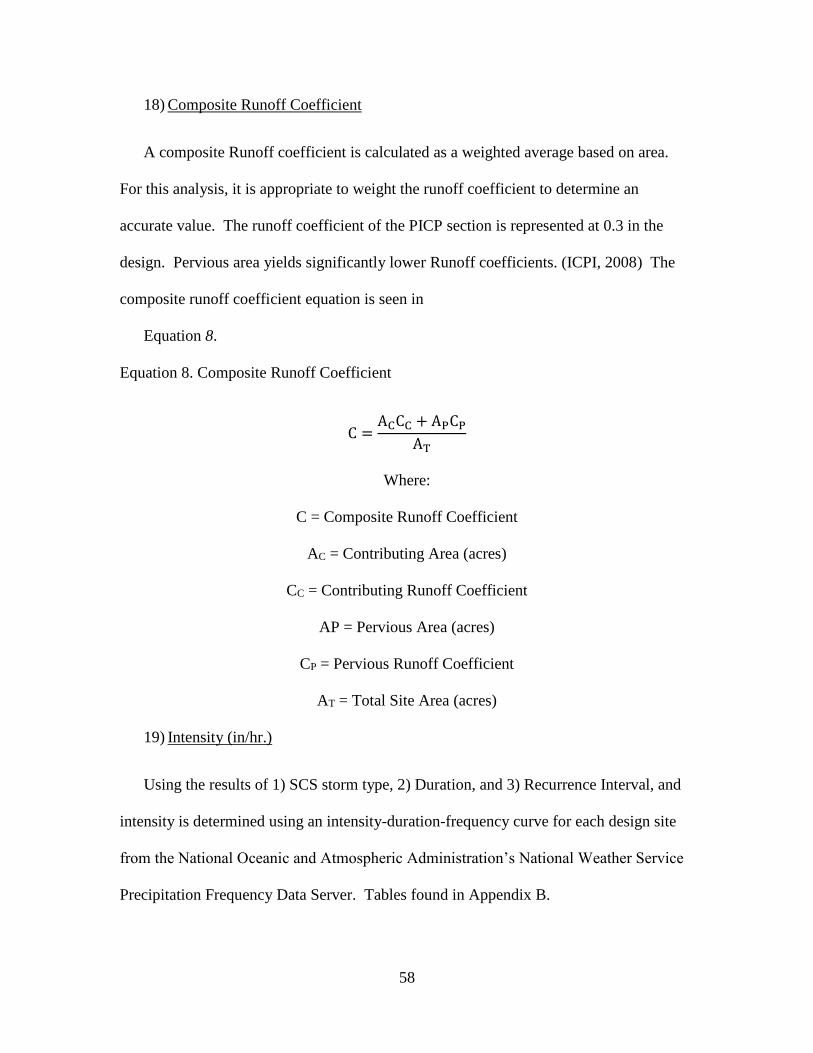
18) Composite Runoff Coefficient
A composite Runoff coefficient is calculated as a weighted average based on area.
For this analysis, it is appropriate to weight the runoff coefficient to determine an
accurate value. The runoff coefficient of the PICP section is represented at 0.3 in the
design. Pervious area yields significantly lower Runoff coefficients. (ICPI, 2008) The
composite runoff coefficient equation is seen in
Equation 8.
Equation 8. Composite Runoff Coefficient
C =ACCC + APCP
AT
Where:
C = Composite Runoff Coefficient
AC = Contributing Area (acres)
CC = Contributing Runoff Coefficient
AP = Pervious Area (acres)
CP = Pervious Runoff Coefficient
AT = Total Site Area (acres)
19) Intensity (in/hr.)
Using the results of 1) SCS storm type, 2) Duration, and 3) Recurrence Interval, and
intensity is determined using an intensity-duration-frequency curve for each design site
from the National Oceanic and Atmospheric Administration’s National Weather Service
Precipitation Frequency Data Server. Tables found in Appendix B.
59
20) Unit Discharge Rate (cfs/ft.)
The unit discharge rate is identified as q in Figure 32. The unit discharge is calculated
assuming that each system reaches full equilibrium and the concepts of conservation of
mass.
21) System Horizontal Infiltration (in/hr.)
Horizontal infiltration is calculated using the results of laboratory testing. The
horizontal infiltration represents the rate at which the rate at which water will flow across
the system.
Design Considerations
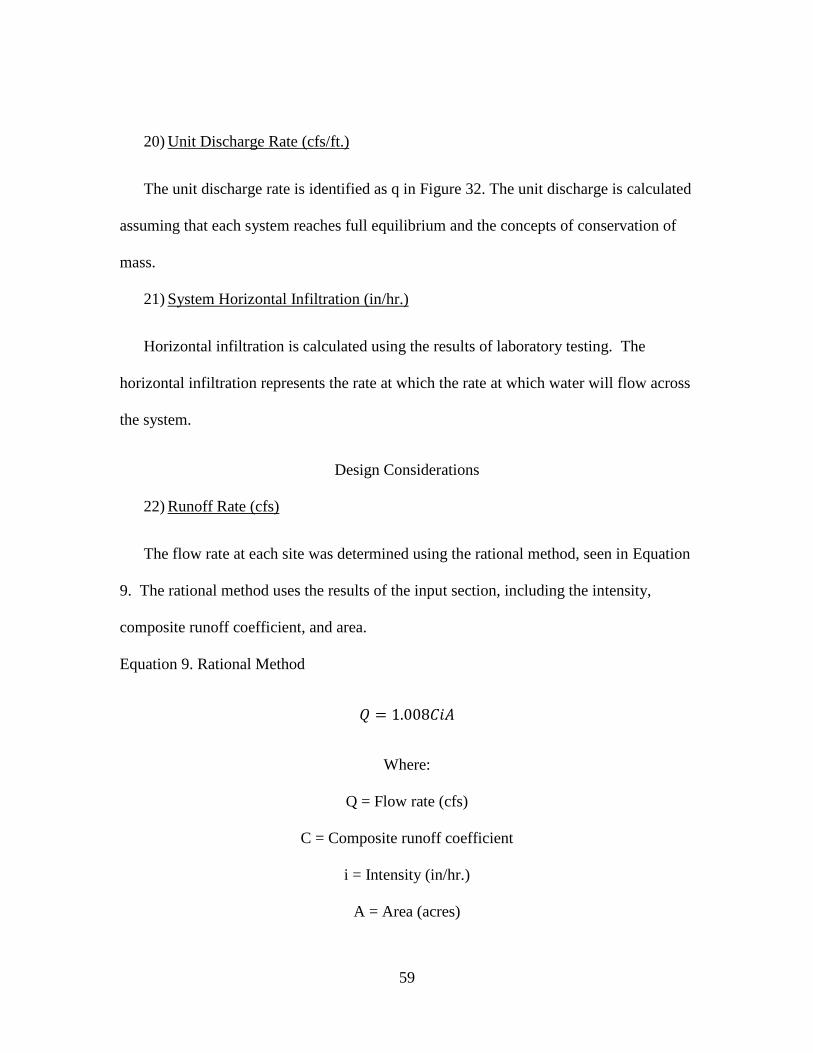
22) Runoff Rate (cfs)
The flow rate at each site was determined using the rational method, seen in Equation
9. The rational method uses the results of the input section, including the intensity,
composite runoff coefficient, and area.
Equation 9. Rational Method
𝑄 = 1.008𝐶𝑖𝐴
Where:
Q = Flow rate (cfs)
C = Composite runoff coefficient
i = Intensity (in/hr.)
A = Area (acres)
60
23) Unit Overflow Rate (cfs/ft.)
Overflow rate is calculated using the results of laboratory testing. The overflow rate
is converted to a unit rate by using the relative laboratory results per area of the PICP
section in the laboratory flume, 4 feet, multiplied by the length of the pervious length, L’.
This resulting unit overflow rate is compared to the unit discharge rates calculated for the
site.
24) ASTM C1781Vertical Infiltration (in/hr.)
Vertical infiltration is calculated using the results of laboratory testing ASTM C1781
(ASTM, 2013) testing procedure. The vertical infiltration represents the rate at which the
rate at which water will flow directly into the system.
25) Gap Size - Check
The check of the gap size will give the designing engineer a proclamation of “Within
Range” or “Out of Range”. This will conclude whether or not the chosen 13) Gap Size is
adequate for the PICP section to properly contain and handle the flow onto and through
the section.
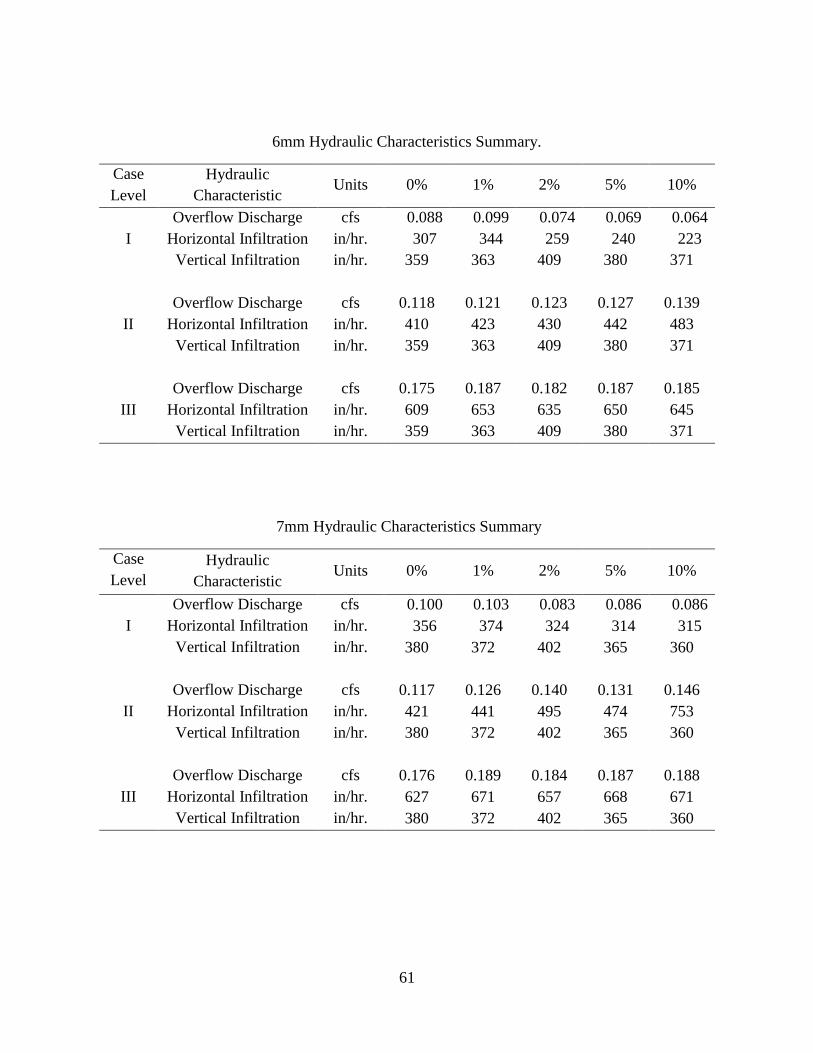
The hydraulic characteristics used as results are seen in Error! Reference source not
ound. through Error! Reference source not found..
61
6mm Hydraulic Characteristics Summary.
Case
Level
Hydraulic
Characteristic Units 0% 1% 2% 5% 10%
I
Overflow Discharge cfs 0.088 0.099 0.074 0.069 0.064
Horizontal Infiltration in/hr. 307 344 259 240 223
Vertical Infiltration in/hr. 359 363 409 380 371
II
Overflow Discharge cfs 0.118 0.121 0.123 0.127 0.139
Horizontal Infiltration in/hr. 410 423 430 442 483
Vertical Infiltration in/hr. 359 363 409 380 371
III
Overflow Discharge cfs 0.175 0.187 0.182 0.187 0.185
Horizontal Infiltration in/hr. 609 653 635 650 645
Vertical Infiltration in/hr. 359 363 409 380 371
7mm Hydraulic Characteristics Summary
Case
Level
Hydraulic
Characteristic Units 0% 1% 2% 5% 10%
I
Overflow Discharge cfs 0.100 0.103 0.083 0.086 0.086
Horizontal Infiltration in/hr. 356 374 324 314 315
Vertical Infiltration in/hr. 380 372 402 365 360
II
Overflow Discharge cfs 0.117 0.126 0.140 0.131 0.146
Horizontal Infiltration in/hr. 421 441 495 474 753
Vertical Infiltration in/hr. 380 372 402 365 360
III
Overflow Discharge cfs 0.176 0.189 0.184 0.187 0.188
Horizontal Infiltration in/hr. 627 671 657 668 671
Vertical Infiltration in/hr. 380 372 402 365 360
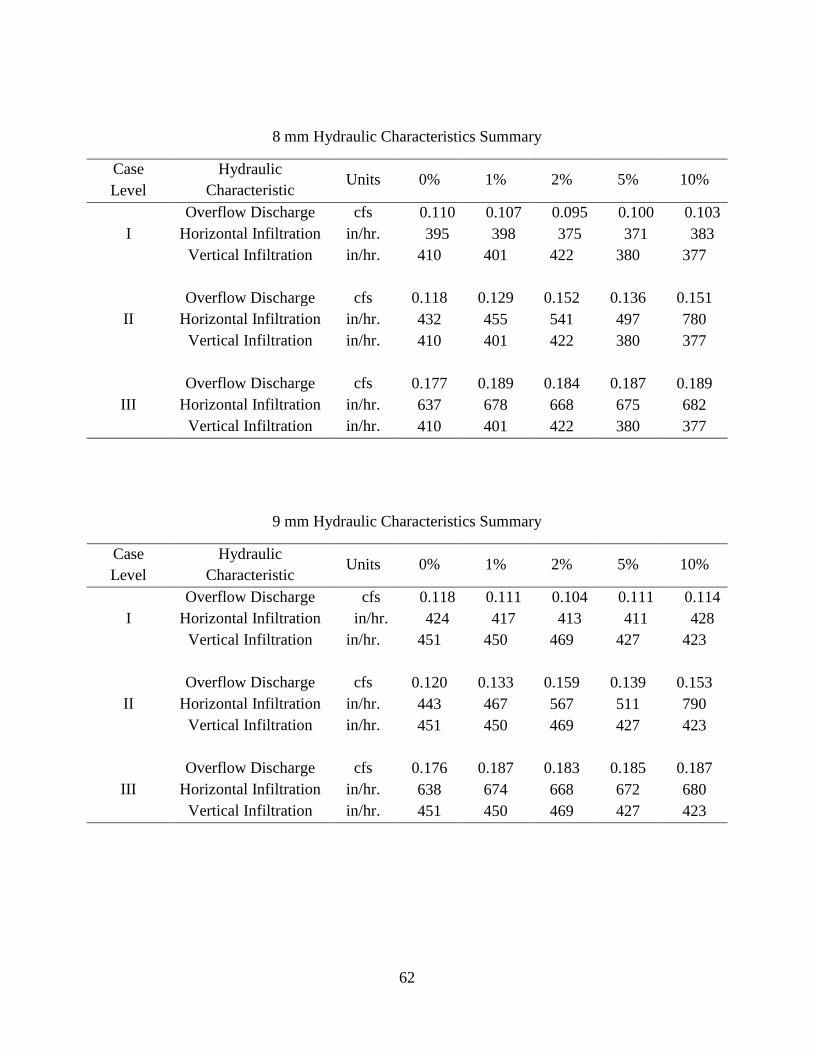
62
8 mm Hydraulic Characteristics Summary
Case
Level
Hydraulic
Characteristic Units 0% 1% 2% 5% 10%
I
Overflow Discharge cfs 0.110 0.107 0.095 0.100 0.103
Horizontal Infiltration in/hr. 395 398 375 371 383
Vertical Infiltration in/hr. 410 401 422 380 377
II
Overflow Discharge cfs 0.118 0.129 0.152 0.136 0.151
Horizontal Infiltration in/hr. 432 455 541 497 780
Vertical Infiltration in/hr. 410 401 422 380 377
III
Overflow Discharge cfs 0.177 0.189 0.184 0.187 0.189
Horizontal Infiltration in/hr. 637 678 668 675 682
Vertical Infiltration in/hr. 410 401 422 380 377
9 mm Hydraulic Characteristics Summary
Case
Level
Hydraulic
Characteristic Units 0% 1% 2% 5% 10%
I
Overflow Discharge cfs 0.118 0.111 0.104 0.111 0.114
Horizontal Infiltration in/hr. 424 417 413 411 428
Vertical Infiltration in/hr. 451 450 469 427 423
II
Overflow Discharge cfs 0.120 0.133 0.159 0.139 0.153
Horizontal Infiltration in/hr. 443 467 567 511 790
Vertical Infiltration in/hr. 451 450 469 427 423
III
Overflow Discharge cfs 0.176 0.187 0.183 0.185 0.187
Horizontal Infiltration in/hr. 638 674 668 672 680
Vertical Infiltration in/hr. 451 450 469 427 423
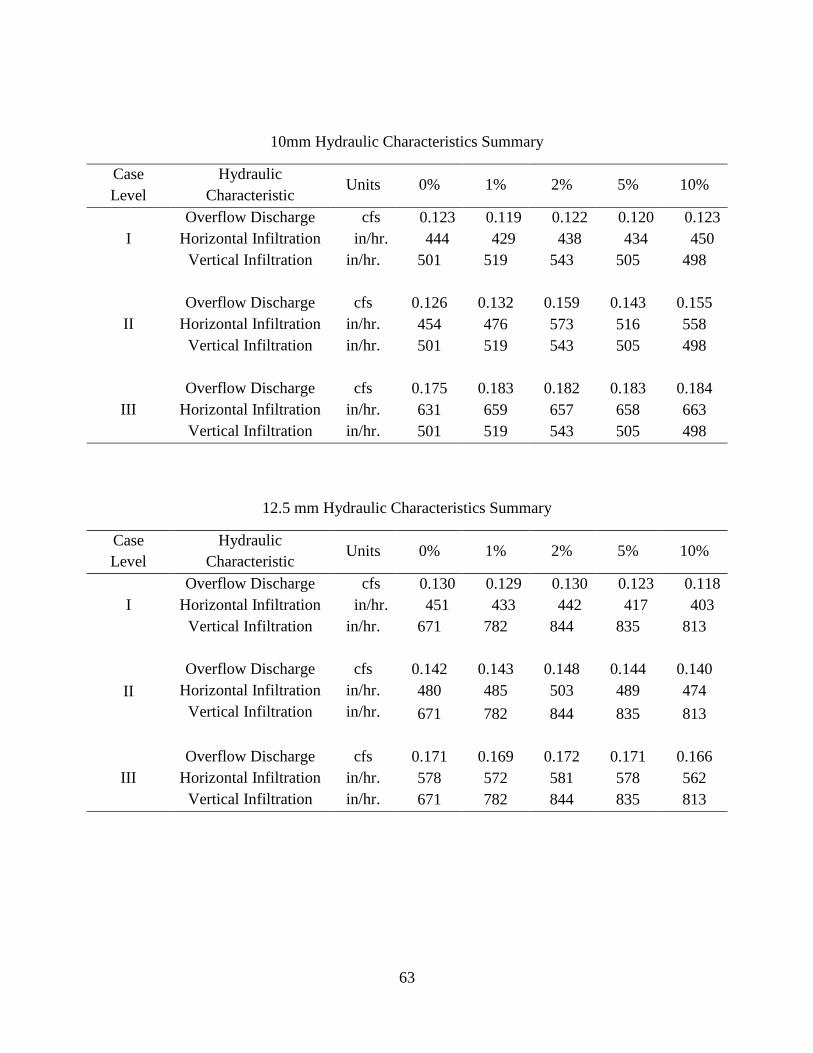
63
10mm Hydraulic Characteristics Summary
Case
Level
Hydraulic
Characteristic Units 0% 1% 2% 5% 10%
I
Overflow Discharge cfs 0.123 0.119 0.122 0.120 0.123
Horizontal Infiltration in/hr. 444 429 438 434 450
Vertical Infiltration in/hr. 501 519 543 505 498
II
Overflow Discharge cfs 0.126 0.132 0.159 0.143 0.155
Horizontal Infiltration in/hr. 454 476 573 516 558
Vertical Infiltration in/hr. 501 519 543 505 498
III
Overflow Discharge cfs 0.175 0.183 0.182 0.183 0.184
Horizontal Infiltration in/hr. 631 659 657 658 663
Vertical Infiltration in/hr. 501 519 543 505 498
12.5 mm Hydraulic Characteristics Summary
Case
Level
Hydraulic
Characteristic Units 0% 1% 2% 5% 10%
I
Overflow Discharge cfs 0.130 0.129 0.130 0.123 0.118
Horizontal Infiltration in/hr. 451 433 442 417 403
Vertical Infiltration in/hr. 671 782 844 835 813
II
Overflow Discharge cfs 0.142 0.143 0.148 0.144 0.140
Horizontal Infiltration in/hr. 480 485 503 489 474
Vertical Infiltration in/hr. 671 782 844 835 813
III
Overflow Discharge cfs 0.171 0.169 0.172 0.171 0.166
Horizontal Infiltration in/hr. 578 572 581 578 562
Vertical Infiltration in/hr. 671 782 844 835 813
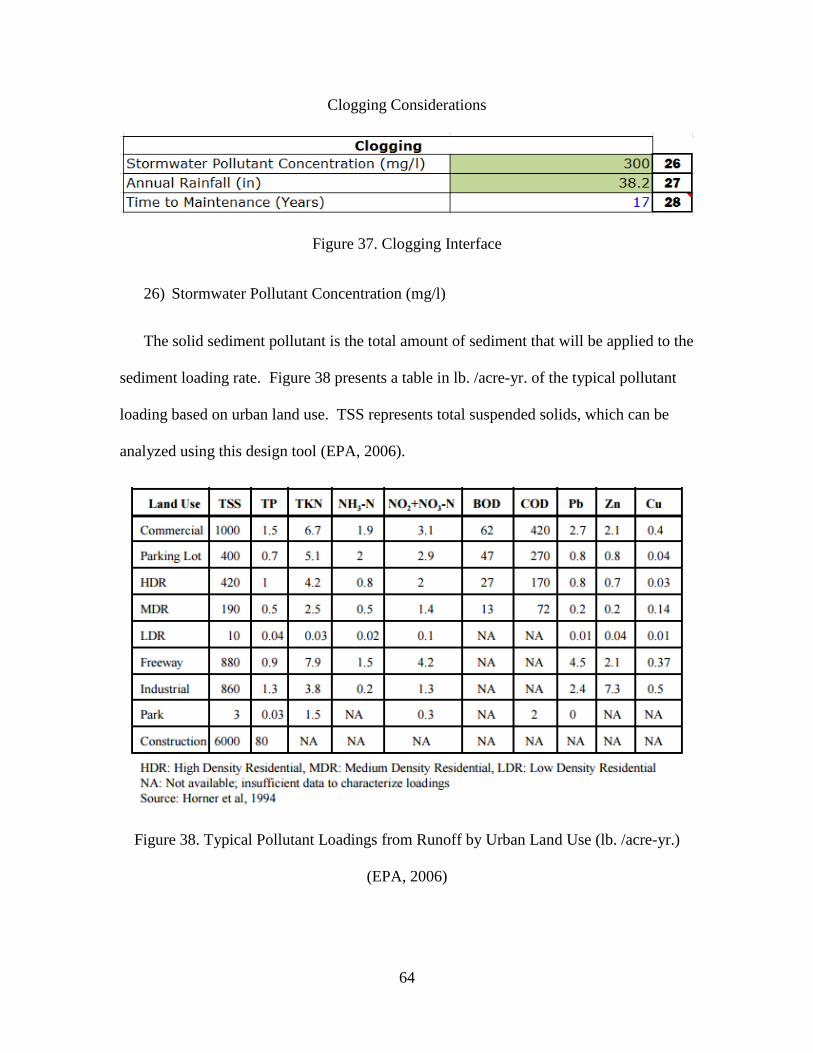
64
Clogging Considerations
Figure 37. Clogging Interface
26) Stormwater Pollutant Concentration (mg/l)
The solid sediment pollutant is the total amount of sediment that will be applied to the
sediment loading rate. Figure 38 presents a table in lb. /acre-yr. of the typical pollutant
loading based on urban land use. TSS represents total suspended solids, which can be
analyzed using this design tool (EPA, 2006).
Figure 38. Typical Pollutant Loadings from Runoff by Urban Land Use (lb. /acre-yr.)
(EPA, 2006)

65
27) Annual Rainfall (in)
The annual rainfall is the total amount of rainfall that is common to the geographic
region in inches. This information can be easily accessed through the National Weather
Service results.
28) Time to Maintenance (years)
The time to maintenance in the results years it will take for the system to become
clogged based on the loading rate applied by the solid sediment in the flow. This time is
based on the results of the clogging analysis, which show that full infiltration can be
reclaimed up to approximately 50% infiltration in the system.
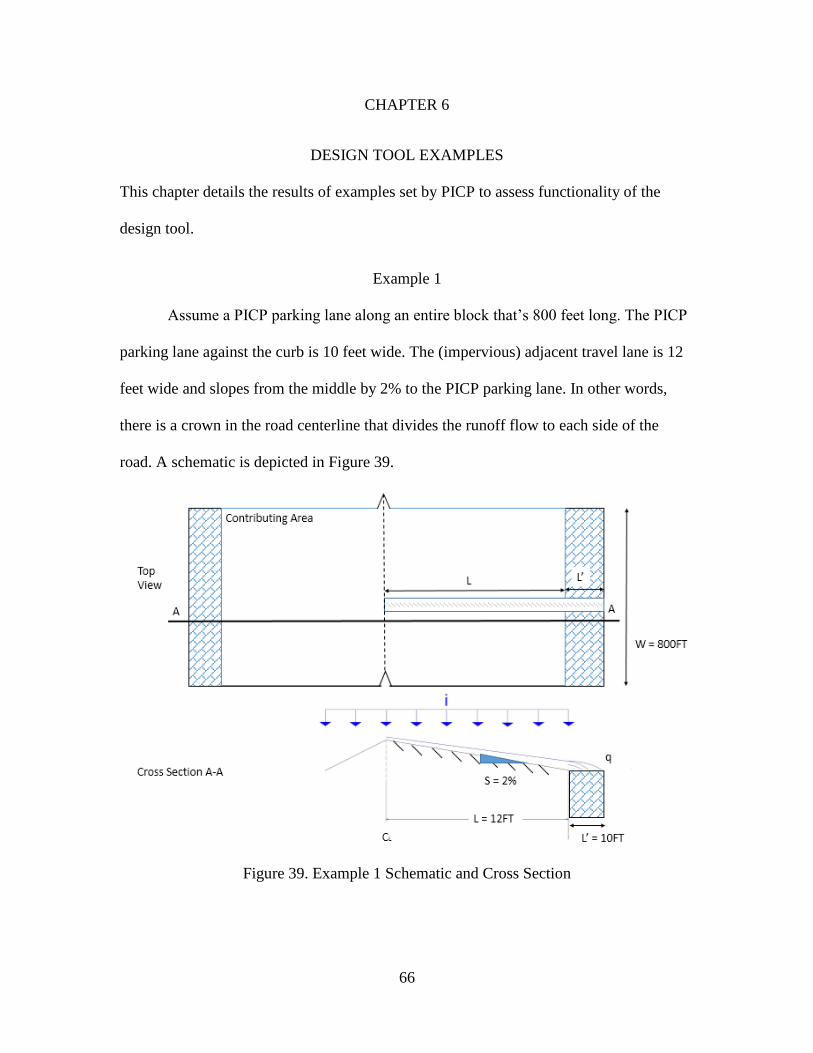
66
CHAPTER 6
DESIGN TOOL EXAMPLES
This chapter details the results of examples set by PICP to assess functionality of the
design tool.
Example 1
Assume a PICP parking lane along an entire block that’s 800 feet long. The PICP
parking lane against the curb is 10 feet wide. The (impervious) adjacent travel lane is 12
feet wide and slopes from the middle by 2% to the PICP parking lane. In other words,
there is a crown in the road centerline that divides the runoff flow to each side of the
road. A schematic is depicted in Figure 39.
Figure 39. Example 1 Schematic and Cross Section

67
At what point in time will it clog assuming an average runoff concentration of 300
mg/m3? Assume Kansas City, MO rainfall. Assume 10 mm wide joints with No. 8 stone
in them.
Figure 40. Example 1 Input Interface

68
Figure 41. Example 1 Output Interface
Example 1A
Run the same problem above except make the travel lane 24 feet wide, in other
words, double the runoff from this impervious area into the PICP parking lane. A
schematic is seen in Figure 42.
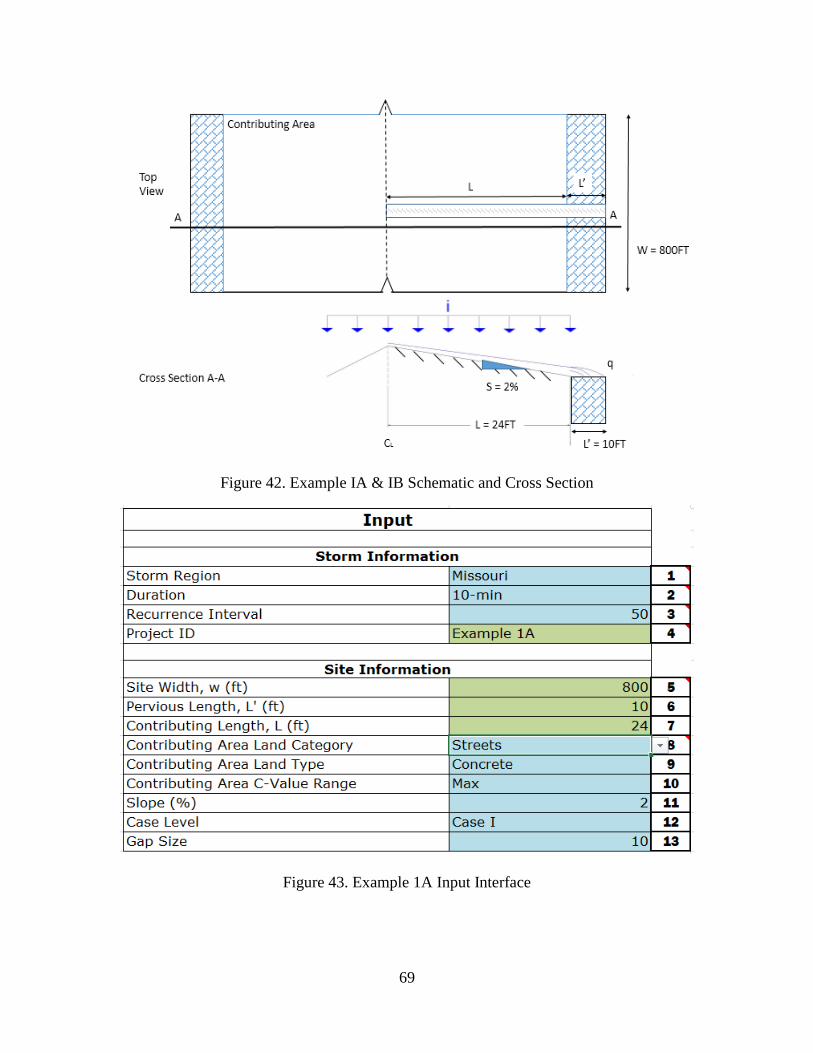
69
Figure 42. Example IA & IB Schematic and Cross Section
Figure 43. Example 1A Input Interface
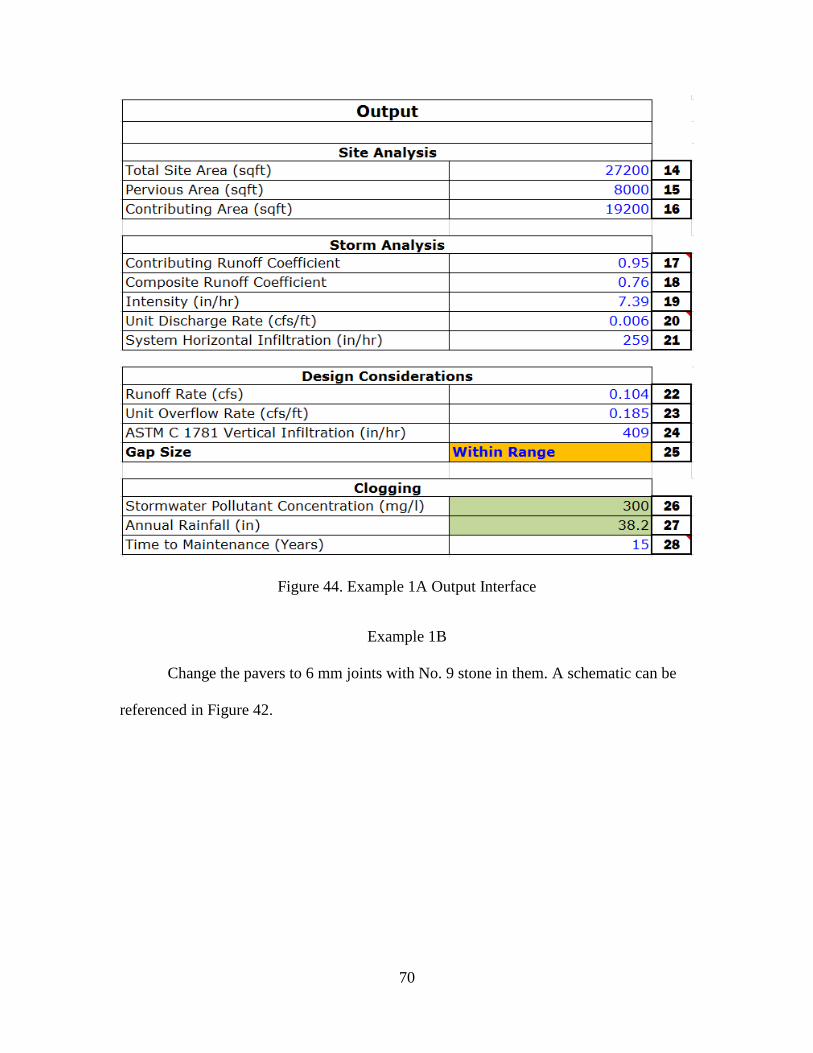
70
Figure 44. Example 1A Output Interface
Example 1B
Change the pavers to 6 mm joints with No. 9 stone in them. A schematic can be
referenced in Figure 42.
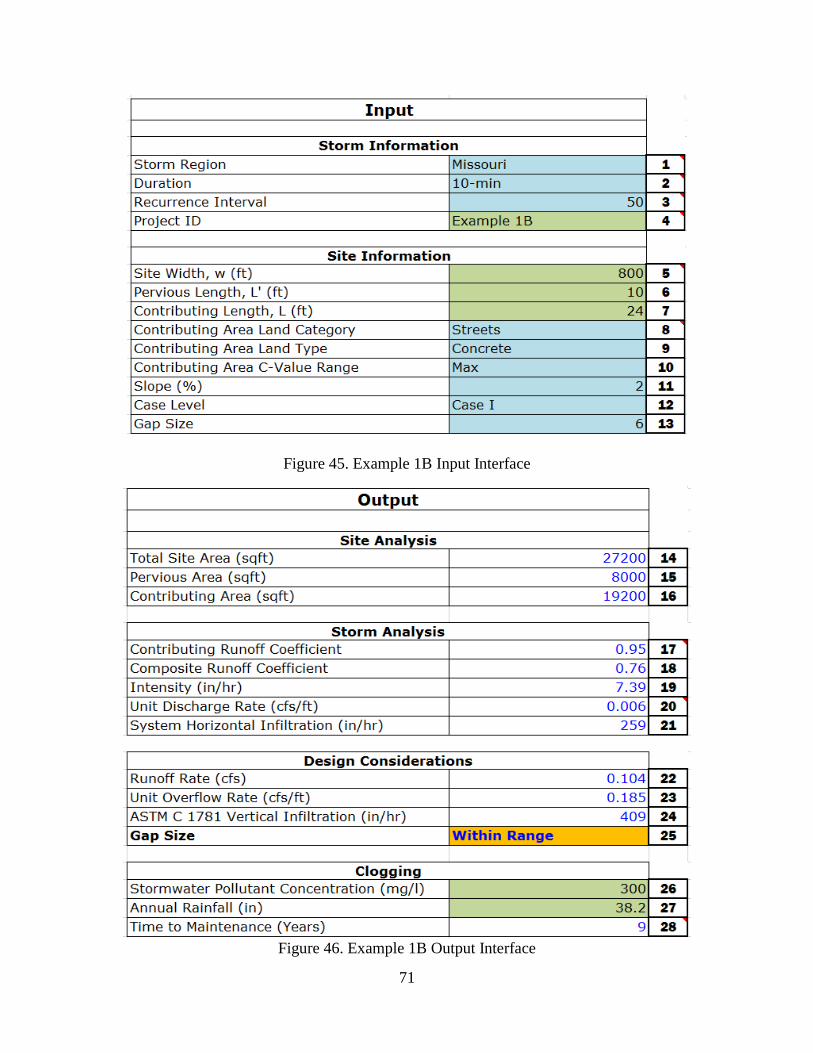
71
Figure 45. Example 1B Input Interface
Figure 46. Example 1B Output Interface
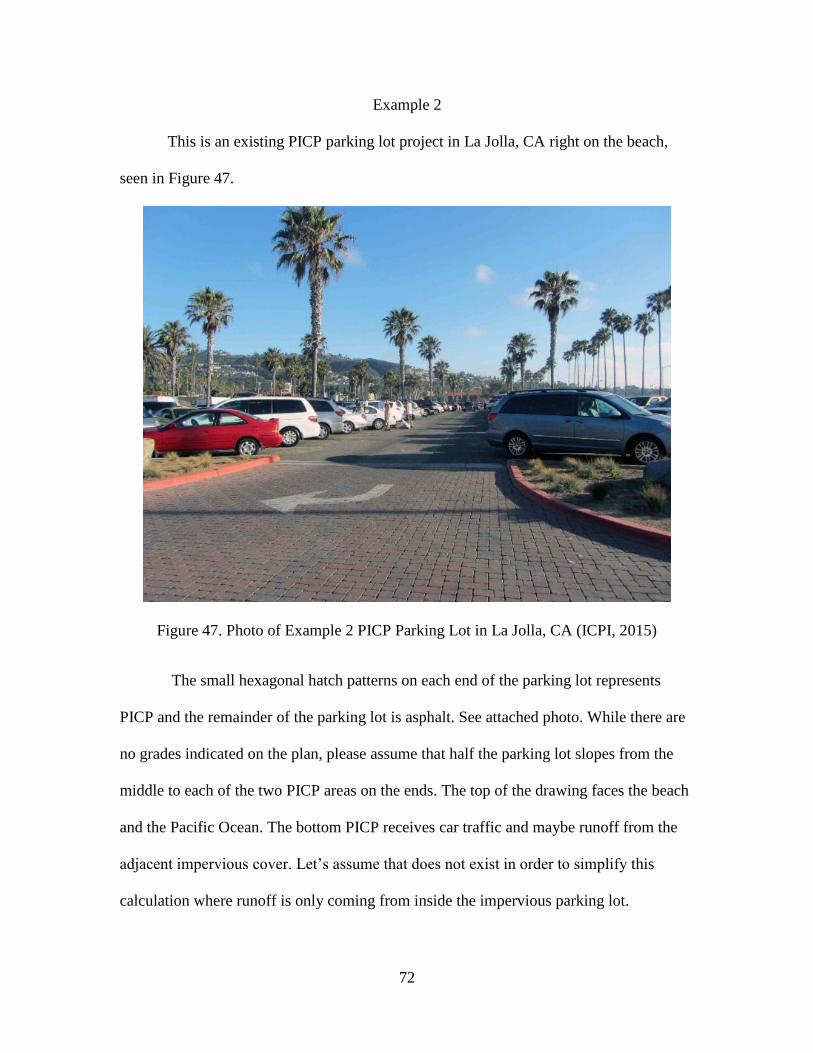
72
Example 2
This is an existing PICP parking lot project in La Jolla, CA right on the beach,
seen in Figure 47.
Figure 47. Photo of Example 2 PICP Parking Lot in La Jolla, CA (ICPI, 2015)
The small hexagonal hatch patterns on each end of the parking lot represents
PICP and the remainder of the parking lot is asphalt. See attached photo. While there are
no grades indicated on the plan, please assume that half the parking lot slopes from the
middle to each of the two PICP areas on the ends. The top of the drawing faces the beach
and the Pacific Ocean. The bottom PICP receives car traffic and maybe runoff from the
adjacent impervious cover. Let’s assume that does not exist in order to simplify this
calculation where runoff is only coming from inside the impervious parking lot.
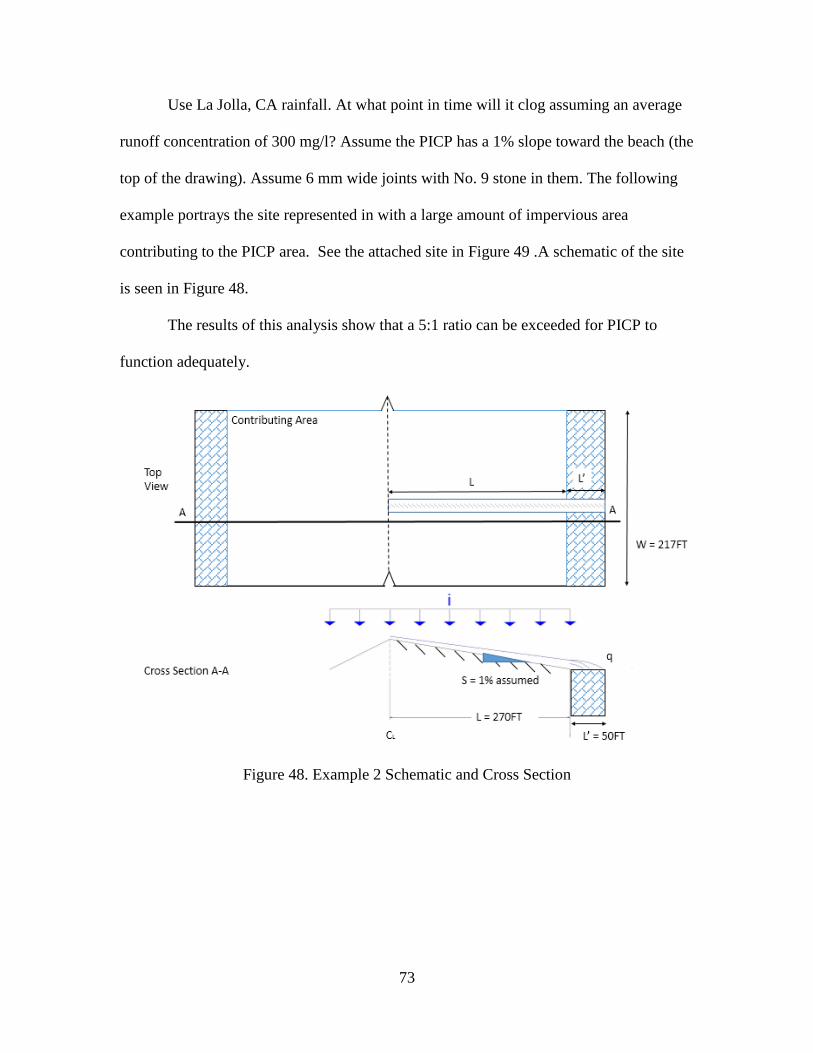
73
Use La Jolla, CA rainfall. At what point in time will it clog assuming an average
runoff concentration of 300 mg/l? Assume the PICP has a 1% slope toward the beach (the
top of the drawing). Assume 6 mm wide joints with No. 9 stone in them. The following
example portrays the site represented in with a large amount of impervious area
contributing to the PICP area. See the attached site in Figure 49 .A schematic of the site
is seen in Figure 48.
The results of this analysis show that a 5:1 ratio can be exceeded for PICP to
function adequately.
Figure 48. Example 2 Schematic and Cross Section
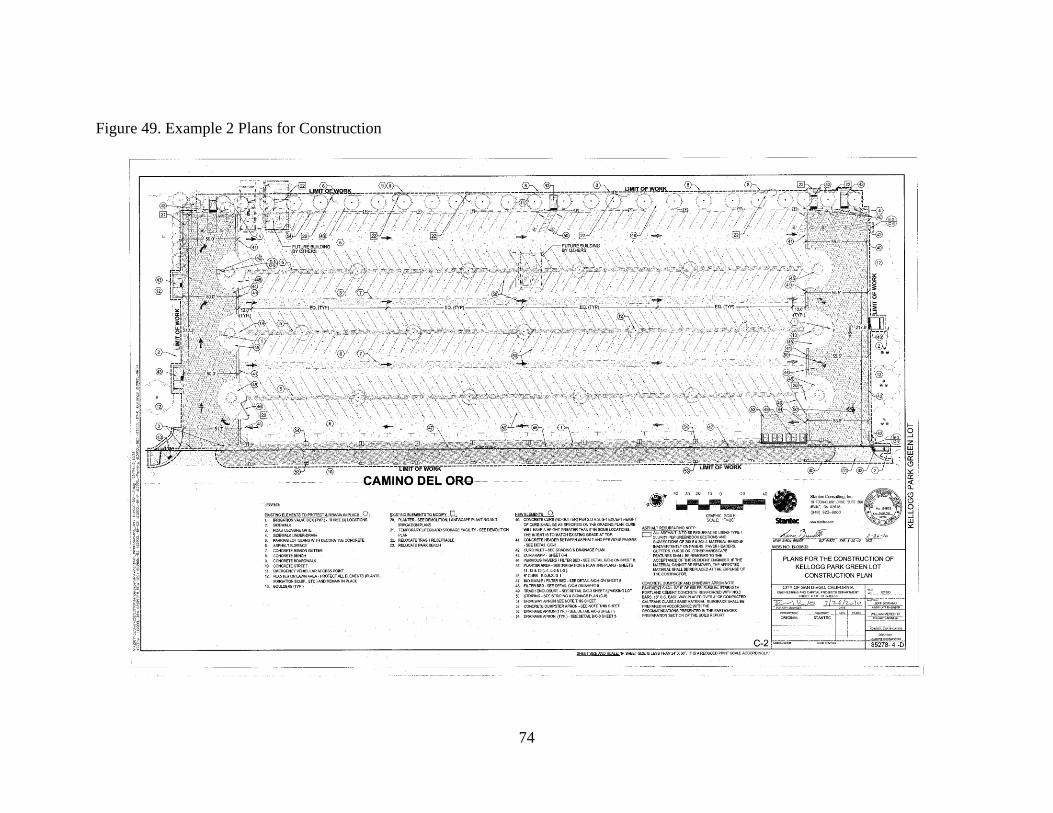
74
Figure 49. Example 2 Plans for Construction
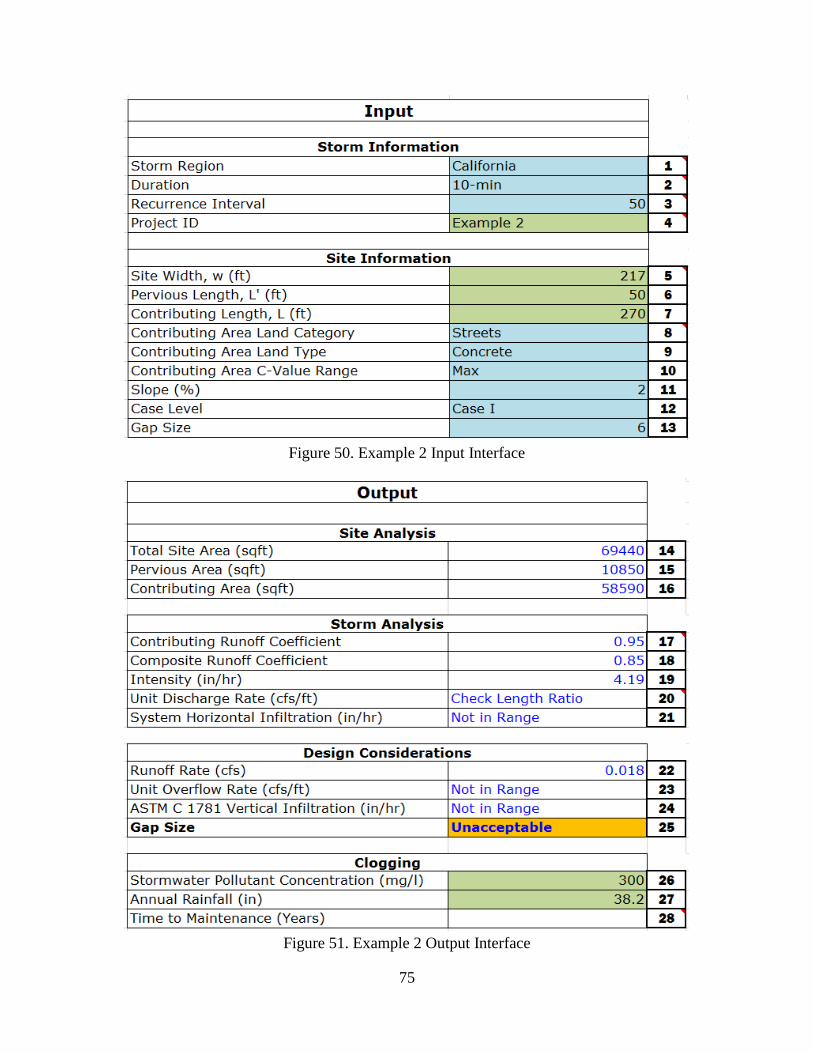
75
Figure 50. Example 2 Input Interface
Figure 51. Example 2 Output Interface

76
CHAPTER 7
CONCLUSION & RESEARCH OPPORTUNITIES
Due to an increase in urbanization resulting in an increase in surface runoff to nearby water
bodies and ecosystems, there has been a call for stormwater management practices and
technologies. Installing PICP as a BMP in design will provide stormwater management by
improving the quality and quantity of stormwater through infiltration, filtration, and attenuation
in the system. PICP has recently been realized as a highly effective BMP, therefore, the current
design process has room for improvement. Both the structural and hydrologic factors has been
properly assessed, and this research address the hydraulic factor.
Laboratory test were conducted to determine hydraulic characteristics of PICP, and the
results were used as the foundation of the PICP Design Tool. Detailed results are found in
Leipard, 2015. Using the results of the hydraulic flume, the design tool was created to determine
hydraulic characteristics of an individual site. Based on storm information, relative to the
geographic site of the PICP location, and site attributes including areas and development type,
the vertical infiltration, horizontal infiltration, and overflow rate for a variation of slope and
block spacing arrangements can be seen as adequate or inadequate for the site. The tool will
show that there is the horizontal infiltration rate is less than the vertical infiltration rate of the
PICP. The tool will also predict the time necessary to maintenance based on the stormwater
pollutant concentration.
Many opportunities for further research and development considerations have presented
themselves throughout the process of this research. Currently, the storm intensity is based on
one set of intensities for each SCS type storm. Variation from one state or city within SCS storm
type boundary could occur. The intensity calculation could be refined through importing more

77
SCS Storm Type precipitation frequency tables from NOAA to improve accuracy of correct
storm intensity. The current design tool also anticipates the contributing flow path is 1:1 width
of the pervious area. Further research into creating variability in this path could improve
accuracy of the design tool and create a more reliable time to maintenance. A model could be
utilized through current PICP stormwater modeling tools to reinforce design results. Test should
be conducted to verify the assumptions used to calculate adjusted values.

78
APPENDIX A
HYDRAULIC CALCULATIONS
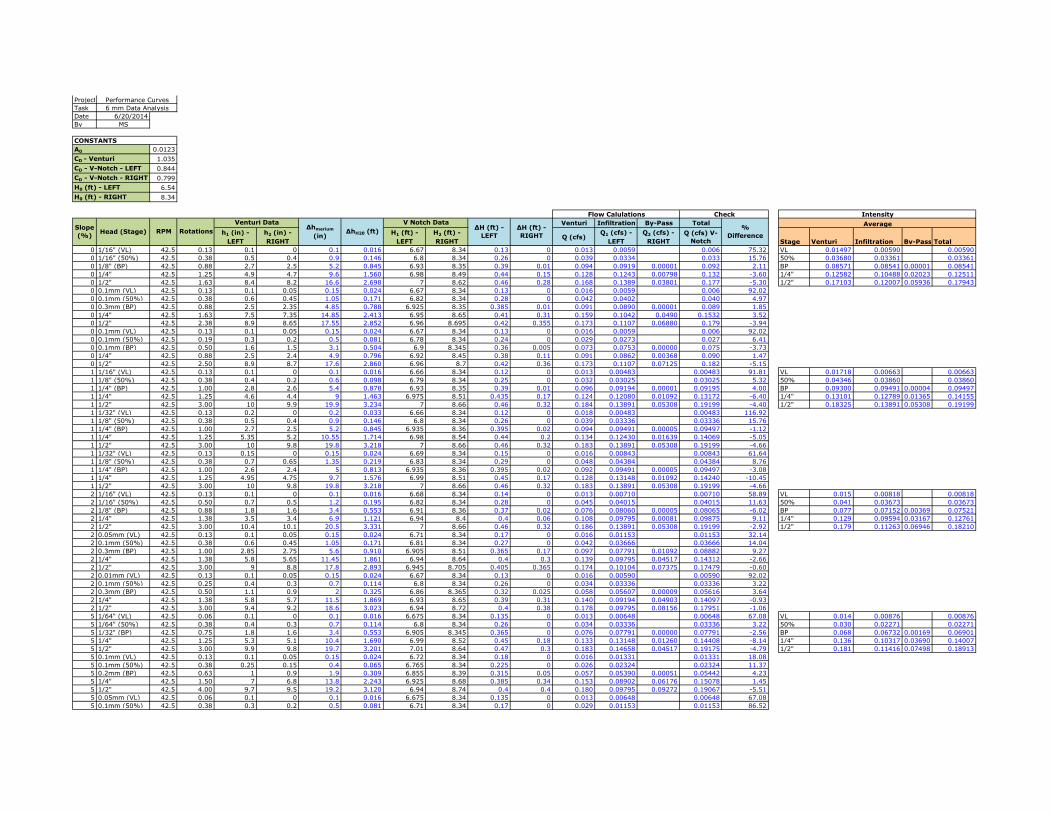
Project
Task
Date 6/20/2014
By MS
0.0123
CD - Venturi 1.035
CD - V-Notch - LEFT 0.844
CD - V-Notch - RIGHT 0.799
H0 (ft) - LEFT 6.54
H0 (ft) - RIGHT 8.34
Venturi Infiltration By-Pass Total
h1 (in) -
LEFT
h2 (in) -
RIGHT
H1 (ft) -
LEFT
H2 (ft) -
RIGHTQ (cfs)
Q1 (cfs) -
LEFT
Q2 (cfs) -
RIGHT
Q (cfs) V-
Notch Stage Venturi Infiltration By-Pass Total
0 1/16" (VL) 42.5 0.13 0.1 0 0.1 0.016 6.67 8.34 0.13 0 0.013 0.0059 0.006 75.32 VL 0.01497 0.00590 0.00590
0 1/16" (50%) 42.5 0.38 0.5 0.4 0.9 0.146 6.8 8.34 0.26 0 0.039 0.0334 0.033 15.76 50% 0.03680 0.03361 0.03361
0 1/8" (BP) 42.5 0.88 2.7 2.5 5.2 0.845 6.93 8.35 0.39 0.01 0.094 0.0919 0.00001 0.092 2.11 BP 0.08571 0.08541 0.00001 0.08541
0 1/4" 42.5 1.25 4.9 4.7 9.6 1.560 6.98 8.49 0.44 0.15 0.128 0.1243 0.00798 0.132 -3.60 1/4" 0.12582 0.10488 0.02023 0.12511
0 1/2" 42.5 1.63 8.4 8.2 16.6 2.698 7 8.62 0.46 0.28 0.168 0.1389 0.03801 0.177 -5.30 1/2" 0.17103 0.12007 0.05936 0.17943
0 0.1mm (VL) 42.5 0.13 0.1 0.05 0.15 0.024 6.67 8.34 0.13 0 0.016 0.0059 0.006 92.02
0 0.1mm (50%) 42.5 0.38 0.6 0.45 1.05 0.171 6.82 8.34 0.28 0 0.042 0.0402 0.040 4.97
0 0.3mm (BP) 42.5 0.88 2.5 2.35 4.85 0.788 6.925 8.35 0.385 0.01 0.091 0.0890 0.00001 0.089 1.85
0 1/4" 42.5 1.63 7.5 7.35 14.85 2.413 6.95 8.65 0.41 0.31 0.159 0.1042 0.0490 0.1532 3.52
0 1/2" 42.5 2.38 8.9 8.65 17.55 2.852 6.96 8.695 0.42 0.355 0.173 0.1107 0.06880 0.179 -3.94
0 0.1mm (VL) 42.5 0.13 0.1 0.05 0.15 0.024 6.67 8.34 0.13 0 0.016 0.0059 0.006 92.02
0 0.1mm (50%) 42.5 0.19 0.3 0.2 0.5 0.081 6.78 8.34 0.24 0 0.029 0.0273 0.027 6.41
0 0.1mm (BP) 42.5 0.50 1.6 1.5 3.1 0.504 6.9 8.345 0.36 0.005 0.073 0.0753 0.00000 0.075 -3.73
0 1/4" 42.5 0.88 2.5 2.4 4.9 0.796 6.92 8.45 0.38 0.11 0.091 0.0862 0.00368 0.090 1.47
0 1/2" 42.5 2.50 8.9 8.7 17.6 2.860 6.96 8.7 0.42 0.36 0.173 0.1107 0.07125 0.182 -5.15
1 1/16" (VL) 42.5 0.13 0.1 0 0.1 0.016 6.66 8.34 0.12 0 0.013 0.00483 0.00483 91.81 VL 0.01718 0.00663 0.00663
1 1/8" (50%) 42.5 0.38 0.4 0.2 0.6 0.098 6.79 8.34 0.25 0 0.032 0.03025 0.03025 5.32 50% 0.04346 0.03860 0.03860
1 1/4" (BP) 42.5 1.00 2.8 2.6 5.4 0.878 6.93 8.35 0.39 0.01 0.096 0.09194 0.00001 0.09195 4.00 BP 0.09300 0.09491 0.00004 0.09497
1 1/4" 42.5 1.25 4.6 4.4 9 1.463 6.975 8.51 0.435 0.17 0.124 0.12080 0.01092 0.13172 -6.40 1/4" 0.13101 0.12789 0.01365 0.14155
1 1/2" 42.5 3.00 10 9.9 19.9 3.234 7 8.66 0.46 0.32 0.184 0.13891 0.05308 0.19199 -4.40 1/2" 0.18325 0.13891 0.05308 0.19199
1 1/32" (VL) 42.5 0.13 0.2 0 0.2 0.033 6.66 8.34 0.12 0 0.018 0.00483 0.00483 116.92
1 1/8" (50%) 42.5 0.38 0.5 0.4 0.9 0.146 6.8 8.34 0.26 0 0.039 0.03336 0.03336 15.76
1 1/4" (BP) 42.5 1.00 2.7 2.5 5.2 0.845 6.935 8.36 0.395 0.02 0.094 0.09491 0.00005 0.09497 -1.12
1 1/4" 42.5 1.25 5.35 5.2 10.55 1.714 6.98 8.54 0.44 0.2 0.134 0.12430 0.01639 0.14069 -5.05
1 1/2" 42.5 3.00 10 9.8 19.8 3.218 7 8.66 0.46 0.32 0.183 0.13891 0.05308 0.19199 -4.66
1 1/32" (VL) 42.5 0.13 0.15 0 0.15 0.024 6.69 8.34 0.15 0 0.016 0.00843 0.00843 61.64
1 1/8" (50%) 42.5 0.38 0.7 0.65 1.35 0.219 6.83 8.34 0.29 0 0.048 0.04384 0.04384 8.76
1 1/4" (BP) 42.5 1.00 2.6 2.4 5 0.813 6.935 8.36 0.395 0.02 0.092 0.09491 0.00005 0.09497 -3.08
1 1/4" 42.5 1.25 4.95 4.75 9.7 1.576 6.99 8.51 0.45 0.17 0.128 0.13148 0.01092 0.14240 -10.45
1 1/2" 42.5 3.00 10 9.8 19.8 3.218 7 8.66 0.46 0.32 0.183 0.13891 0.05308 0.19199 -4.66
2 1/16" (VL) 42.5 0.13 0.1 0 0.1 0.016 6.68 8.34 0.14 0 0.013 0.00710 0.00710 58.89 VL 0.015 0.00818 0.00818
2 1/16" (50%) 42.5 0.50 0.7 0.5 1.2 0.195 6.82 8.34 0.28 0 0.045 0.04015 0.04015 11.63 50% 0.041 0.03673 0.03673
2 1/8" (BP) 42.5 0.88 1.8 1.6 3.4 0.553 6.91 8.36 0.37 0.02 0.076 0.08060 0.00005 0.08065 -6.02 BP 0.077 0.07152 0.00369 0.07521
2 1/4" 42.5 1.38 3.5 3.4 6.9 1.121 6.94 8.4 0.4 0.06 0.108 0.09795 0.00081 0.09875 9.11 1/4" 0.129 0.09594 0.03167 0.12761
2 1/2" 42.5 3.00 10.4 10.1 20.5 3.331 7 8.66 0.46 0.32 0.186 0.13891 0.05308 0.19199 -2.92 1/2" 0.179 0.11263 0.06946 0.18210
2 0.05mm (VL) 42.5 0.13 0.1 0.05 0.15 0.024 6.71 8.34 0.17 0 0.016 0.01153 0.01153 32.14
2 0.1mm (50%) 42.5 0.38 0.6 0.45 1.05 0.171 6.81 8.34 0.27 0 0.042 0.03666 0.03666 14.04
2 0.3mm (BP) 42.5 1.00 2.85 2.75 5.6 0.910 6.905 8.51 0.365 0.17 0.097 0.07791 0.01092 0.08882 9.27
2 1/4" 42.5 1.38 5.8 5.65 11.45 1.861 6.94 8.64 0.4 0.3 0.139 0.09795 0.04517 0.14312 -2.66
2 1/2" 42.5 3.00 9 8.8 17.8 2.893 6.945 8.705 0.405 0.365 0.174 0.10104 0.07375 0.17479 -0.60
2 0.01mm (VL) 42.5 0.13 0.1 0.05 0.15 0.024 6.67 8.34 0.13 0 0.016 0.00590 0.00590 92.02
2 0.1mm (50%) 42.5 0.25 0.4 0.3 0.7 0.114 6.8 8.34 0.26 0 0.034 0.03336 0.03336 3.22
2 0.3mm (BP) 42.5 0.50 1.1 0.9 2 0.325 6.86 8.365 0.32 0.025 0.058 0.05607 0.00009 0.05616 3.64
2 1/4" 42.5 1.38 5.8 5.7 11.5 1.869 6.93 8.65 0.39 0.31 0.140 0.09194 0.04903 0.14097 -0.93
2 1/2" 42.5 3.00 9.4 9.2 18.6 3.023 6.94 8.72 0.4 0.38 0.178 0.09795 0.08156 0.17951 -1.06
5 1/64" (VL) 42.5 0.06 0.1 0 0.1 0.016 6.675 8.34 0.135 0 0.013 0.00648 0.00648 67.08 VL 0.014 0.00876 0.00876
5 1/64" (50%) 42.5 0.38 0.4 0.3 0.7 0.114 6.8 8.34 0.26 0 0.034 0.03336 0.03336 3.22 50% 0.030 0.02271 0.02271
5 1/32" (BP) 42.5 0.75 1.8 1.6 3.4 0.553 6.905 8.345 0.365 0 0.076 0.07791 0.00000 0.07791 -2.56 BP 0.068 0.06732 0.00169 0.06901
5 1/4" 42.5 1.25 5.3 5.1 10.4 1.690 6.99 8.52 0.45 0.18 0.133 0.13148 0.01260 0.14408 -8.14 1/4" 0.136 0.10317 0.03690 0.14007
5 1/2" 42.5 3.00 9.9 9.8 19.7 3.201 7.01 8.64 0.47 0.3 0.183 0.14658 0.04517 0.19175 -4.79 1/2" 0.181 0.11416 0.07498 0.18913
5 0.1mm (VL) 42.5 0.13 0.1 0.05 0.15 0.024 6.72 8.34 0.18 0 0.016 0.01331 0.01331 18.08
5 0.1mm (50%) 42.5 0.38 0.25 0.15 0.4 0.065 6.765 8.34 0.225 0 0.026 0.02324 0.02324 11.37
5 0.2mm (BP) 42.5 0.63 1 0.9 1.9 0.309 6.855 8.39 0.315 0.05 0.057 0.05390 0.00051 0.05442 4.23
5 1/4" 42.5 1.50 7 6.8 13.8 2.243 6.925 8.68 0.385 0.34 0.153 0.08902 0.06176 0.15078 1.45
5 1/2" 42.5 4.00 9.7 9.5 19.2 3.120 6.94 8.74 0.4 0.4 0.180 0.09795 0.09272 0.19067 -5.51
5 0.05mm (VL) 42.5 0.06 0.1 0 0.1 0.016 6.675 8.34 0.135 0 0.013 0.00648 0.00648 67.08
5 0.1mm (50%) 42.5 0.38 0.3 0.2 0.5 0.081 6.71 8.34 0.17 0 0.029 0.01153 0.01153 86.52
Average
IntensityCheck
%
Difference
Flow Calulations
Slope
(%)Head (Stage) RPM Rotations
Venturi Data∆hmerium
(in)∆hH20 (ft)
V Notch Data∆H (ft) -
LEFT
∆H (ft) -
RIGHT
A0
Performance Curves
CONSTANTS
6 mm Data Analysis
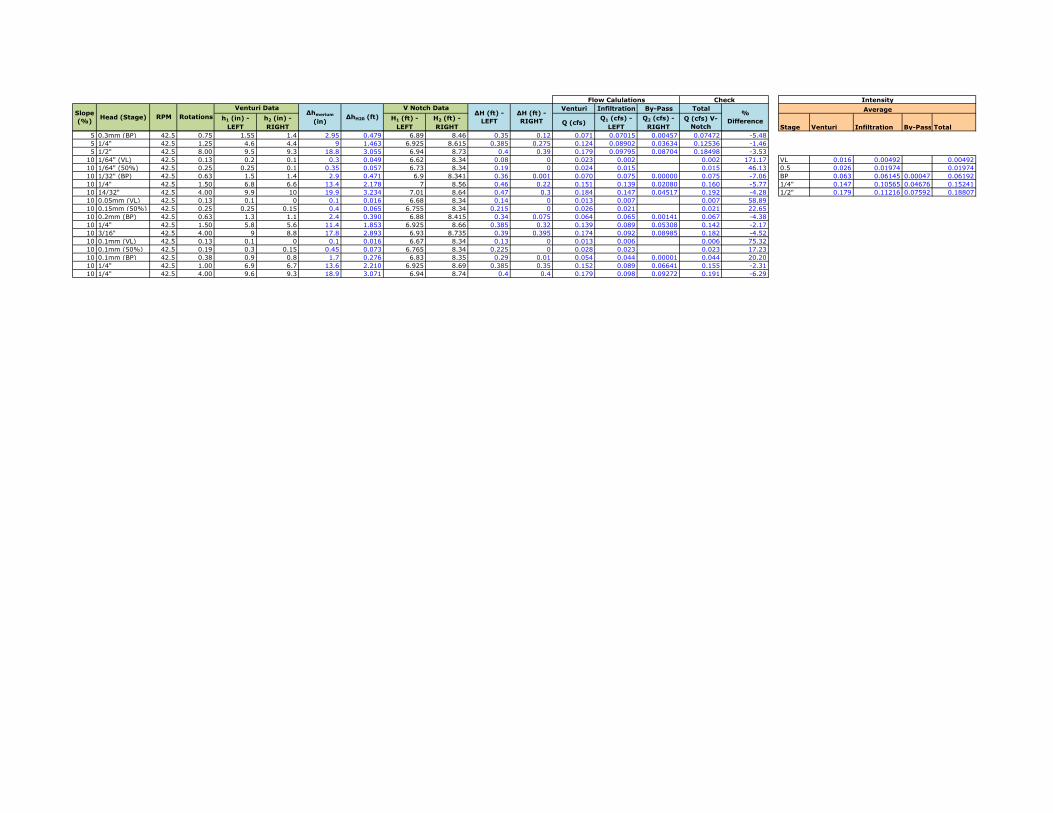
Venturi Infiltration By-Pass Total
h1 (in) -
LEFT
h2 (in) -
RIGHT
H1 (ft) -
LEFT
H2 (ft) -
RIGHTQ (cfs)
Q1 (cfs) -
LEFT
Q2 (cfs) -
RIGHT
Q (cfs) V-
Notch Stage Venturi Infiltration By-Pass Total
Average
IntensityCheck
%
Difference
Flow Calulations
Slope
(%)Head (Stage) RPM Rotations
Venturi Data∆hmerium
(in)∆hH20 (ft)
V Notch Data∆H (ft) -
LEFT
∆H (ft) -
RIGHT
5 0.3mm (BP) 42.5 0.75 1.55 1.4 2.95 0.479 6.89 8.46 0.35 0.12 0.071 0.07015 0.00457 0.07472 -5.48
5 1/4" 42.5 1.25 4.6 4.4 9 1.463 6.925 8.615 0.385 0.275 0.124 0.08902 0.03634 0.12536 -1.46
5 1/2" 42.5 8.00 9.5 9.3 18.8 3.055 6.94 8.73 0.4 0.39 0.179 0.09795 0.08704 0.18498 -3.53
10 1/64" (VL) 42.5 0.13 0.2 0.1 0.3 0.049 6.62 8.34 0.08 0 0.023 0.002 0.002 171.17 VL 0.016 0.00492 0.00492
10 1/64" (50%) 42.5 0.25 0.25 0.1 0.35 0.057 6.73 8.34 0.19 0 0.024 0.015 0.015 46.13 0.5 0.026 0.01974 0.01974
10 1/32" (BP) 42.5 0.63 1.5 1.4 2.9 0.471 6.9 8.341 0.36 0.001 0.070 0.075 0.00000 0.075 -7.06 BP 0.063 0.06145 0.00047 0.06192
10 1/4" 42.5 1.50 6.8 6.6 13.4 2.178 7 8.56 0.46 0.22 0.151 0.139 0.02080 0.160 -5.77 1/4" 0.147 0.10565 0.04676 0.15241
10 14/32" 42.5 4.00 9.9 10 19.9 3.234 7.01 8.64 0.47 0.3 0.184 0.147 0.04517 0.192 -4.28 1/2" 0.179 0.11216 0.07592 0.18807
10 0.05mm (VL) 42.5 0.13 0.1 0 0.1 0.016 6.68 8.34 0.14 0 0.013 0.007 0.007 58.89
10 0.15mm (50%) 42.5 0.25 0.25 0.15 0.4 0.065 6.755 8.34 0.215 0 0.026 0.021 0.021 22.65
10 0.2mm (BP) 42.5 0.63 1.3 1.1 2.4 0.390 6.88 8.415 0.34 0.075 0.064 0.065 0.00141 0.067 -4.38
10 1/4" 42.5 1.50 5.8 5.6 11.4 1.853 6.925 8.66 0.385 0.32 0.139 0.089 0.05308 0.142 -2.17
10 3/16" 42.5 4.00 9 8.8 17.8 2.893 6.93 8.735 0.39 0.395 0.174 0.092 0.08985 0.182 -4.52
10 0.1mm (VL) 42.5 0.13 0.1 0 0.1 0.016 6.67 8.34 0.13 0 0.013 0.006 0.006 75.32
10 0.1mm (50%) 42.5 0.19 0.3 0.15 0.45 0.073 6.765 8.34 0.225 0 0.028 0.023 0.023 17.23
10 0.1mm (BP) 42.5 0.38 0.9 0.8 1.7 0.276 6.83 8.35 0.29 0.01 0.054 0.044 0.00001 0.044 20.20
10 1/4" 42.5 1.00 6.9 6.7 13.6 2.210 6.925 8.69 0.385 0.35 0.152 0.089 0.06641 0.155 -2.31
10 1/4" 42.5 4.00 9.6 9.3 18.9 3.071 6.94 8.74 0.4 0.4 0.179 0.098 0.09272 0.191 -6.29
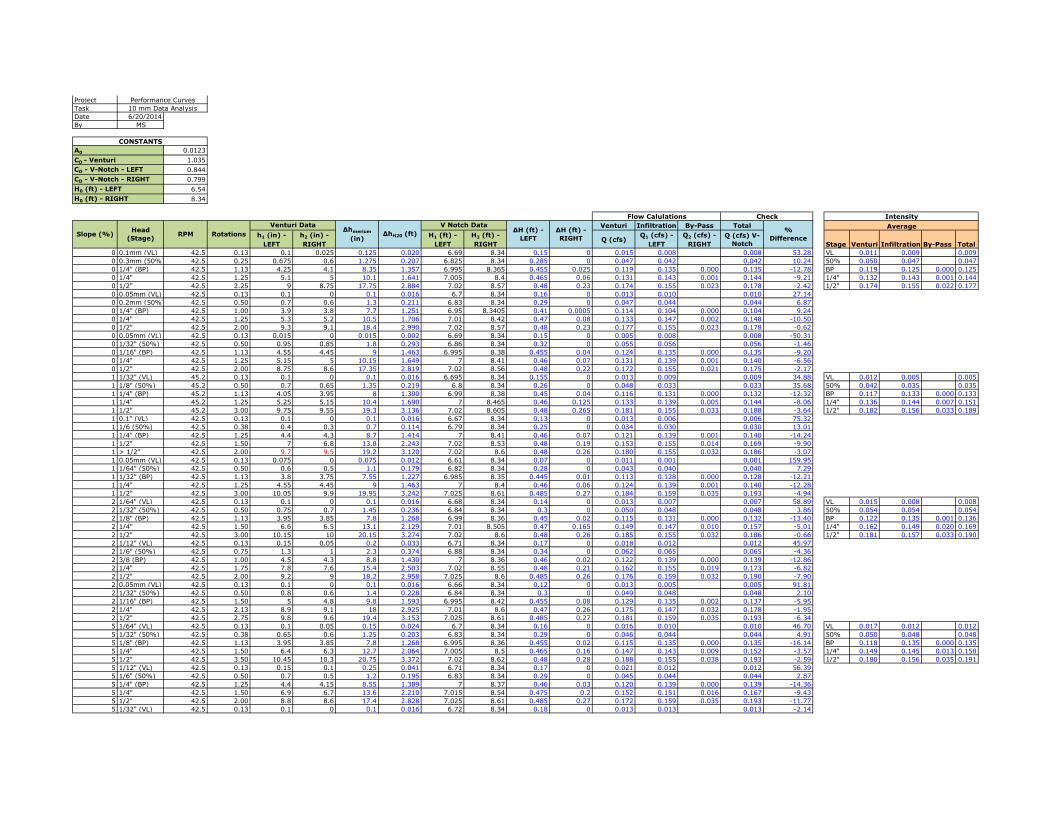
Project
Task
Date 6/20/2014
By MS
0.0123
1.035
CD - V-Notch - LEFT 0.844
CD - V-Notch - RIGHT 0.799
H0 (ft) - LEFT 6.54
H0 (ft) - RIGHT 8.34
Venturi Infiltration By-Pass Total
h1 (in) -
LEFT
h2 (in) -
RIGHT
H1 (ft) -
LEFT
H2 (ft) -
RIGHTQ (cfs)
Q1 (cfs) -
LEFT
Q2 (cfs) -
RIGHT
Q (cfs) V-
Notch Stage Venturi Infiltration By-Pass Total
0 0.1mm (VL) 42.5 0.13 0.1 0.025 0.125 0.020 6.69 8.34 0.15 0 0.015 0.008 0.008 53.28 VL 0.011 0.009 0.009
0 0.3mm (50%) 42.5 0.25 0.675 0.6 1.275 0.207 6.825 8.34 0.285 0 0.047 0.042 0.042 10.24 50% 0.050 0.047 0.047
0 1/4" (BP) 42.5 1.13 4.25 4.1 8.35 1.357 6.995 8.365 0.455 0.025 0.119 0.135 0.000 0.135 -12.78 BP 0.119 0.125 0.000 0.125
0 1/4" 42.5 1.25 5.1 5 10.1 1.641 7.005 8.4 0.465 0.06 0.131 0.143 0.001 0.144 -9.21 1/4" 0.132 0.143 0.001 0.144
0 1/2" 42.5 2.25 9 8.75 17.75 2.884 7.02 8.57 0.48 0.23 0.174 0.155 0.023 0.178 -2.42 1/2" 0.174 0.155 0.022 0.177
0 0.05mm (VL) 42.5 0.13 0.1 0 0.1 0.016 6.7 8.34 0.16 0 0.013 0.010 0.010 27.14
0 0.2mm (50%) 42.5 0.50 0.7 0.6 1.3 0.211 6.83 8.34 0.29 0 0.047 0.044 0.044 6.87
0 1/4" (BP) 42.5 1.00 3.9 3.8 7.7 1.251 6.95 8.3405 0.41 0.0005 0.114 0.104 0.000 0.104 9.24
0 1/4" 42.5 1.25 5.3 5.2 10.5 1.706 7.01 8.42 0.47 0.08 0.133 0.147 0.002 0.148 -10.50
0 1/2" 42.5 2.00 9.3 9.1 18.4 2.990 7.02 8.57 0.48 0.23 0.177 0.155 0.023 0.178 -0.62
0 0.05mm (VL) 42.5 0.13 0.015 0 0.015 0.002 6.69 8.34 0.15 0 0.005 0.008 0.008 -50.31
0 1/32" (50%) 42.5 0.50 0.95 0.85 1.8 0.293 6.86 8.34 0.32 0 0.055 0.056 0.056 -1.46
0 1/16" (BP) 42.5 1.13 4.55 4.45 9 1.463 6.995 8.38 0.455 0.04 0.124 0.135 0.000 0.135 -9.20
0 1/4" 42.5 1.25 5.15 5 10.15 1.649 7 8.41 0.46 0.07 0.131 0.139 0.001 0.140 -6.56
0 1/2" 42.5 2.00 8.75 8.6 17.35 2.819 7.02 8.56 0.48 0.22 0.172 0.155 0.021 0.175 -2.17
1 1/32" (VL) 45.2 0.13 0.1 0 0.1 0.016 6.695 8.34 0.155 0 0.013 0.009 0.009 34.88 VL 0.012 0.005 0.005
1 1/8" (50%) 45.2 0.50 0.7 0.65 1.35 0.219 6.8 8.34 0.26 0 0.048 0.033 0.033 35.68 50% 0.042 0.035 0.035
1 1/4" (BP) 45.2 1.13 4.05 3.95 8 1.300 6.99 8.38 0.45 0.04 0.116 0.131 0.000 0.132 -12.32 BP 0.117 0.133 0.000 0.133
1 1/4" 45.2 1.25 5.25 5.15 10.4 1.690 7 8.465 0.46 0.125 0.133 0.139 0.005 0.144 -8.06 1/4" 0.136 0.144 0.007 0.151
1 1/2" 45.2 3.00 9.75 9.55 19.3 3.136 7.02 8.605 0.48 0.265 0.181 0.155 0.033 0.188 -3.64 1/2" 0.182 0.156 0.033 0.189
1 0.1" (VL) 42.5 0.13 0.1 0 0.1 0.016 6.67 8.34 0.13 0 0.013 0.006 0.006 75.32
1 1/6 (50%) 42.5 0.38 0.4 0.3 0.7 0.114 6.79 8.34 0.25 0 0.034 0.030 0.030 13.01
1 1/4" (BP) 42.5 1.25 4.4 4.3 8.7 1.414 7 8.41 0.46 0.07 0.121 0.139 0.001 0.140 -14.24
1 1/2" 42.5 1.50 7 6.8 13.8 2.243 7.02 8.53 0.48 0.19 0.153 0.155 0.014 0.169 -9.90
1 > 1/2" 42.5 2.00 9.7 9.5 19.2 3.120 7.02 8.6 0.48 0.26 0.180 0.155 0.032 0.186 -3.07
1 0.05mm (VL) 42.5 0.13 0.075 0 0.075 0.012 6.61 8.34 0.07 0 0.011 0.001 0.001 159.95
1 1/64" (50%) 42.5 0.50 0.6 0.5 1.1 0.179 6.82 8.34 0.28 0 0.043 0.040 0.040 7.29
1 1/32" (BP) 42.5 1.13 3.8 3.75 7.55 1.227 6.985 8.35 0.445 0.01 0.113 0.128 0.000 0.128 -12.21
1 1/4" 42.5 1.25 4.55 4.45 9 1.463 7 8.4 0.46 0.06 0.124 0.139 0.001 0.140 -12.28
1 1/2" 42.5 3.00 10.05 9.9 19.95 3.242 7.025 8.61 0.485 0.27 0.184 0.159 0.035 0.193 -4.94
2 1/64" (VL) 42.5 0.13 0.1 0 0.1 0.016 6.68 8.34 0.14 0 0.013 0.007 0.007 58.89 VL 0.015 0.008 0.008
2 1/32" (50%) 42.5 0.50 0.75 0.7 1.45 0.236 6.84 8.34 0.3 0 0.050 0.048 0.048 3.86 50% 0.054 0.054 0.054
2 1/8" (BP) 42.5 1.13 3.95 3.85 7.8 1.268 6.99 8.36 0.45 0.02 0.115 0.131 0.000 0.132 -13.40 BP 0.122 0.135 0.001 0.136
2 1/4" 42.5 1.50 6.6 6.5 13.1 2.129 7.01 8.505 0.47 0.165 0.149 0.147 0.010 0.157 -5.01 1/4" 0.162 0.149 0.020 0.169
2 1/2" 42.5 3.00 10.15 10 20.15 3.274 7.02 8.6 0.48 0.26 0.185 0.155 0.032 0.186 -0.66 1/2" 0.181 0.157 0.033 0.190
2 1/12" (VL) 42.5 0.13 0.15 0.05 0.2 0.033 6.71 8.34 0.17 0 0.018 0.012 0.012 45.97
2 1/6" (50%) 42.5 0.75 1.3 1 2.3 0.374 6.88 8.34 0.34 0 0.062 0.065 0.065 -4.36
2 3/8 (BP) 42.5 1.00 4.5 4.3 8.8 1.430 7 8.36 0.46 0.02 0.122 0.139 0.000 0.139 -12.86
2 1/4" 42.5 1.75 7.8 7.6 15.4 2.503 7.02 8.55 0.48 0.21 0.162 0.155 0.019 0.173 -6.82
2 1/2" 42.5 2.00 9.2 9 18.2 2.958 7.025 8.6 0.485 0.26 0.176 0.159 0.032 0.190 -7.90
2 0.05mm (VL) 42.5 0.13 0.1 0 0.1 0.016 6.66 8.34 0.12 0 0.013 0.005 0.005 91.81
2 1/32" (50%) 42.5 0.50 0.8 0.6 1.4 0.228 6.84 8.34 0.3 0 0.049 0.048 0.048 2.10
2 1/16" (BP) 42.5 1.50 5 4.8 9.8 1.593 6.995 8.42 0.455 0.08 0.129 0.135 0.002 0.137 -5.95
2 1/4" 42.5 2.13 8.9 9.1 18 2.925 7.01 8.6 0.47 0.26 0.175 0.147 0.032 0.178 -1.95
2 1/2" 42.5 2.75 9.8 9.6 19.4 3.153 7.025 8.61 0.485 0.27 0.181 0.159 0.035 0.193 -6.34
5 1/64" (VL) 42.5 0.13 0.1 0.05 0.15 0.024 6.7 8.34 0.16 0 0.016 0.010 0.010 46.70 VL 0.017 0.012 0.012
5 1/32" (50%) 42.5 0.38 0.65 0.6 1.25 0.203 6.83 8.34 0.29 0 0.046 0.044 0.044 4.91 50% 0.050 0.048 0.048
5 1/8" (BP) 42.5 1.13 3.95 3.85 7.8 1.268 6.995 8.36 0.455 0.02 0.115 0.135 0.000 0.135 -16.14 BP 0.118 0.135 0.000 0.135
5 1/4" 42.5 1.50 6.4 6.3 12.7 2.064 7.005 8.5 0.465 0.16 0.147 0.143 0.009 0.152 -3.57 1/4" 0.149 0.145 0.013 0.158
5 1/2" 42.5 3.50 10.45 10.3 20.75 3.372 7.02 8.62 0.48 0.28 0.188 0.155 0.038 0.193 -2.59 1/2" 0.180 0.156 0.035 0.191
5 1/12" (VL) 42.5 0.13 0.15 0.1 0.25 0.041 6.71 8.34 0.17 0 0.021 0.012 0.012 56.39
5 1/6" (50%) 42.5 0.50 0.7 0.5 1.2 0.195 6.83 8.34 0.29 0 0.045 0.044 0.044 2.87
5 1/4" (BP) 42.5 1.25 4.4 4.15 8.55 1.389 7 8.37 0.46 0.03 0.120 0.139 0.000 0.139 -14.36
5 1/4" 42.5 1.50 6.9 6.7 13.6 2.210 7.015 8.54 0.475 0.2 0.152 0.151 0.016 0.167 -9.43
5 1/2" 42.5 2.00 8.8 8.6 17.4 2.828 7.025 8.61 0.485 0.27 0.172 0.159 0.035 0.193 -11.77
5 1/32" (VL) 42.5 0.13 0.1 0 0.1 0.016 6.72 8.34 0.18 0 0.013 0.013 0.013 -2.14
∆hmerium
(in)∆hH20 (ft)
V Notch Data∆H (ft) -
LEFT
∆H (ft) -
RIGHT
Average
IntensityFlow Calulations Check
%
Difference
Head
(Stage)RPM Rotations
Venturi Data
Slope (%)
Performance Curves
10 mm Data Analysis
A0
CD - Venturi
CONSTANTS
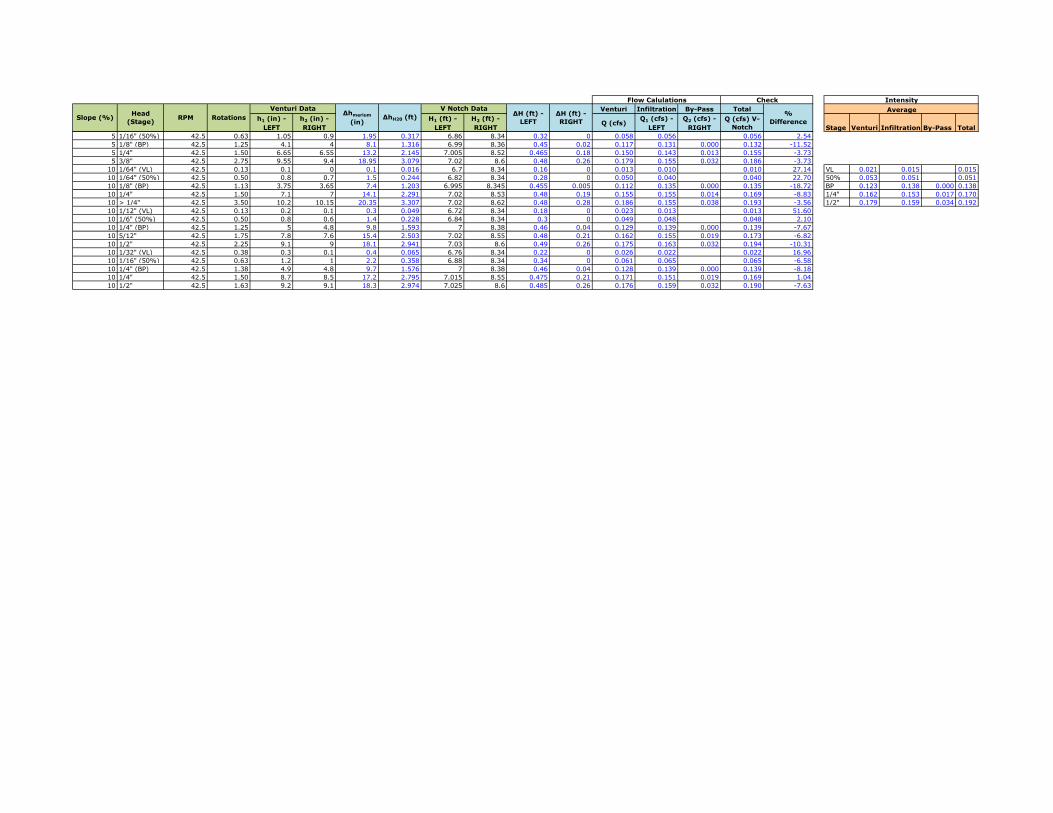
Venturi Infiltration By-Pass Total
h1 (in) -
LEFT
h2 (in) -
RIGHT
H1 (ft) -
LEFT
H2 (ft) -
RIGHTQ (cfs)
Q1 (cfs) -
LEFT
Q2 (cfs) -
RIGHT
Q (cfs) V-
Notch Stage Venturi Infiltration By-Pass Total
∆hmerium
(in)∆hH20 (ft)
V Notch Data∆H (ft) -
LEFT
∆H (ft) -
RIGHT
Average
IntensityFlow Calulations Check
%
Difference
Head
(Stage)RPM Rotations
Venturi Data
Slope (%)
5 1/16" (50%) 42.5 0.63 1.05 0.9 1.95 0.317 6.86 8.34 0.32 0 0.058 0.056 0.056 2.54
5 1/8" (BP) 42.5 1.25 4.1 4 8.1 1.316 6.99 8.36 0.45 0.02 0.117 0.131 0.000 0.132 -11.52
5 1/4" 42.5 1.50 6.65 6.55 13.2 2.145 7.005 8.52 0.465 0.18 0.150 0.143 0.013 0.155 -3.73
5 3/8" 42.5 2.75 9.55 9.4 18.95 3.079 7.02 8.6 0.48 0.26 0.179 0.155 0.032 0.186 -3.73
10 1/64" (VL) 42.5 0.13 0.1 0 0.1 0.016 6.7 8.34 0.16 0 0.013 0.010 0.010 27.14 VL 0.021 0.015 0.015
10 1/64" (50%) 42.5 0.50 0.8 0.7 1.5 0.244 6.82 8.34 0.28 0 0.050 0.040 0.040 22.70 50% 0.053 0.051 0.051
10 1/8" (BP) 42.5 1.13 3.75 3.65 7.4 1.203 6.995 8.345 0.455 0.005 0.112 0.135 0.000 0.135 -18.72 BP 0.123 0.138 0.000 0.138
10 1/4" 42.5 1.50 7.1 7 14.1 2.291 7.02 8.53 0.48 0.19 0.155 0.155 0.014 0.169 -8.83 1/4" 0.162 0.153 0.017 0.170
10 > 1/4" 42.5 3.50 10.2 10.15 20.35 3.307 7.02 8.62 0.48 0.28 0.186 0.155 0.038 0.193 -3.56 1/2" 0.179 0.159 0.034 0.192
10 1/12" (VL) 42.5 0.13 0.2 0.1 0.3 0.049 6.72 8.34 0.18 0 0.023 0.013 0.013 51.60
10 1/6" (50%) 42.5 0.50 0.8 0.6 1.4 0.228 6.84 8.34 0.3 0 0.049 0.048 0.048 2.10
10 1/4" (BP) 42.5 1.25 5 4.8 9.8 1.593 7 8.38 0.46 0.04 0.129 0.139 0.000 0.139 -7.67
10 5/12" 42.5 1.75 7.8 7.6 15.4 2.503 7.02 8.55 0.48 0.21 0.162 0.155 0.019 0.173 -6.82
10 1/2" 42.5 2.25 9.1 9 18.1 2.941 7.03 8.6 0.49 0.26 0.175 0.163 0.032 0.194 -10.31
10 1/32" (VL) 42.5 0.38 0.3 0.1 0.4 0.065 6.76 8.34 0.22 0 0.026 0.022 0.022 16.96
10 1/16" (50%) 42.5 0.63 1.2 1 2.2 0.358 6.88 8.34 0.34 0 0.061 0.065 0.065 -6.58
10 1/4" (BP) 42.5 1.38 4.9 4.8 9.7 1.576 7 8.38 0.46 0.04 0.128 0.139 0.000 0.139 -8.18
10 1/4" 42.5 1.50 8.7 8.5 17.2 2.795 7.015 8.55 0.475 0.21 0.171 0.151 0.019 0.169 1.04
10 1/2" 42.5 1.63 9.2 9.1 18.3 2.974 7.025 8.6 0.485 0.26 0.176 0.159 0.032 0.190 -7.63

Project
Task
Date 6/20/2014
By MS
0.0123
1.035
CD - V-Notch - LEFT 0.844
CD - V-Notch - RIGHT 0.799
H0 (ft) - LEFT 6.54
H0 (ft) - RIGHT 8.34
Venturi Infiltration By-Pass Total
h1 (in) -
LEFT
h2 (in) -
RIGHT
H1 (ft) -
LEFT
H2 (ft) -
RIGHT
Q (cfs) -
Venturi
Q1 (cfs) -
LEFT
Q2 (cfs) -
RIGHT
Q (cfs) V-
Notch Stage Venturi Infiltration By-Pass Total
0 0.05mm (VL) 45.2 0.13 0.05 0 0.05 0.008 6.645 8.34 0.105 0 0.009 0.003 0.003 90.80 VL 0.020 0.015 0.015
0 0.1mm (50%) 45.2 0.63 1.1 1 2.1 0.341 6.86 8.34 0.32 0 0.060 0.056 0.056 6.24 50% 0.055 0.055 0.055
0 0.5mm (BP) 45.2 1.13 4.8 4.7 9.5 1.544 7 8.345 0.46 0.005 0.127 0.139 0.000 0.139 -9.01 BP 0.126 0.139 0.000 0.139
0 1/4" 45.2 1.38 6.7 6.5 13.2 2.145 7.02 8.43 0.48 0.09 0.150 0.155 0.002 0.157 -4.64 1/4" 0.145 0.163 0.004 0.167
0 1/2" 45.2 1.88 9.5 9.3 18.8 3.055 7.04 8.55 0.5 0.21 0.179 0.171 0.019 0.190 -6.01 1/2" 0.169 0.185 0.018 0.203
0 0.2 mm (VL) 42.5 1.80 0.1 0.1 0.2 0.033 6.705 8.34 0.165 0 0.018 0.011 0.011 52.97
0 0.4 mm (50%) 42.5 1.40 0.75 0.7 1.45 0.236 6.84 8.34 0.3 0 0.050 0.048 0.048 3.86
0 0.6 mm (BP) 42.5 1.13 4.9 5.1 10 1.625 7 8.37 0.46 0.03 0.130 0.139 0.000 0.139 -6.55
0 1/4" 42.5 1.50 6.5 6.3 12.8 2.080 7.025 8.47 0.485 0.13 0.147 0.159 0.006 0.164 -10.79
0 1/2" 42.5 2.50 9.5 9.3 18.8 3.055 7.04 8.565 0.5 0.225 0.179 0.171 0.022 0.193 -7.83
0 5/36" (VL) 42.5 0.13 0.2 0.2 0.4 0.065 6.76 8.34 0.22 0 0.026 0.022 0.022 16.96
0 3/16" (50%) 42.5 0.13 0.8 0.7 1.5 0.244 6.85 8.34 0.31 0 0.050 0.052 0.052 -2.64
0 1/8" (BP) 42.5 0.25 4.1 4 8.1 1.316 7 8.35 0.46 0.01 0.117 0.139 0.000 0.139 -16.95
0 1/4" 42.5 1.75 4.8 4.7 9.5 1.544 7.05 8.36 0.51 0.02 0.127 0.180 0.000 0.180 -34.49
0 1/2" 42.5 2.50 5.4 5.3 10.7 1.739 7.1 8.4 0.56 0.06 0.135 0.227 0.001 0.228 -51.42
0 0.1 mm (VL) 42.5 0.38 0.25 0.2 0.45 0.073 6.76 8.34 0.22 0 0.028 0.022 0.022 22.79
0 1/64" (50%) 42.5 0.50 1.2 1 2.2 0.358 6.88 8.34 0.34 0 0.061 0.065 0.065 -6.58
0 1/8" (BP) 42.5 1.25 5.2 5 10.2 1.658 7 8.37 0.46 0.03 0.132 0.139 0.000 0.139 -5.56
0 1/4" 42.5 1.50 7.2 7 14.2 2.308 7.025 8.49 0.485 0.15 0.155 0.159 0.008 0.167 -7.06
0 1/2" 42.5 2.50 10.1 10 20.1 3.266 7.04 8.595 0.5 0.255 0.185 0.171 0.030 0.201 -8.58
1 0.1mm (VL) 45.2 0.13 0.1 0 0.1 0.016 6.71 8.34 0.17 0 0.013 0.012 0.012 12.13 VL 0.022 0.019 0.019
1 0.3mm (50%) 45.2 0.63 0.9 0.8 1.7 0.276 6.85 8.34 0.31 0 0.054 0.052 0.052 3.61 50% 0.059 0.059 0.059
1 0.5mm (BP) 45.2 1.13 4.4 4.25 8.65 1.406 7 8.341 0.46 0.001 0.121 0.139 0.000 0.139 -13.68 BP 0.127 0.140 0.000 0.140
1 1/4" 45.2 1.38 6.3 6.2 12.5 2.031 7.01 8.46 0.47 0.12 0.146 0.147 0.005 0.151 -3.74 1/4" 0.149 0.158 0.008 0.166
1 1/2" 45.2 3.00 8.7 8.5 17.2 2.795 7.03 8.56 0.49 0.22 0.171 0.163 0.021 0.183 -7.16 1/2" 0.169 0.181 0.022 0.203
1 0.2 mm (VL) 42.5 0.38 0.2 0.2 0.4 0.065 6.76 8.34 0.22 0 0.026 0.022 0.022 16.96
1 0.3 mm (50%) 42.5 0.75 1.5 1.4 2.9 0.471 6.9 8.34 0.36 0 0.070 0.075 0.075 -7.06
1 0.5 mm (BP) 42.5 1.19 4.5 4.4 8.9 1.446 7 8.36 0.46 0.02 0.123 0.139 0.000 0.139 -12.30
1 1/4" 42.5 1.50 6.7 6.5 13.2 2.145 7.015 8.5 0.475 0.16 0.150 0.151 0.009 0.160 -6.64
1 3/16" 42.5 3.13 9.8 9.65 19.45 3.161 7.035 8.6 0.495 0.26 0.182 0.167 0.032 0.198 -8.85
1 5/36" (VL) 42.5 0.13 0.2 0.2 0.4 0.065 6.75 8.34 0.21 0 0.026 0.020 0.020 28.44
1 3/16" (50%) 42.5 0.75 1.2 1.1 2.3 0.374 6.86 8.34 0.32 0 0.062 0.056 0.056 10.78
1 1/8" (BP) 42.5 1.75 5.1 4.9 10 1.625 7 8.35 0.46 0.01 0.130 0.139 0.000 0.139 -6.46
1 1/4" 42.5 2.50 5.5 5.3 10.8 1.755 7.05 8.38 0.51 0.04 0.135 0.180 0.000 0.180 -28.37
1 1/2" 42.5 3.00 5.6 5.5 11.1 1.804 7.1 8.42 0.56 0.08 0.137 0.227 0.002 0.229 -50.05
1 0.1mm (VL) 42.5 0.25 0.1 0.2 0.3 0.049 6.76 8.34 0.22 0 0.023 0.022 0.022 2.62
1 1/64" (50)% 42.5 0.50 0.8 0.7 1.5 0.244 6.85 8.34 0.31 0 0.050 0.052 0.052 -2.64
1 1/8" (BP) 42.5 1.25 5.3 5.1 10.4 1.690 7.005 8.4 0.465 0.06 0.133 0.143 0.001 0.144 -7.75
1 1/4" 42.5 1.75 8.1 7.9 16 2.600 7.02 8.55 0.48 0.21 0.165 0.155 0.019 0.173 -4.91
1 1/2" 42.5 2.50 10.4 10.3 20.7 3.364 7.035 8.61 0.495 0.27 0.187 0.167 0.035 0.202 -7.30
2 0.1mm (VL) 42.5 0.13 0.3 0.15 0.45 0.073 6.77 8.34 0.23 0 0.028 0.025 0.025 11.77 VL 0.020 0.015 0.020
2 0.2mm (50%) 42.5 0.63 1.3 1.2 2.5 0.406 6.88 8.34 0.34 0 0.065 0.065 0.065 -0.20 50% 0.060 0.061 0.060
2 0.5mm (BP) 42.5 1.38 5.2 5 10.2 1.658 7 8.38 0.46 0.04 0.132 0.139 0.000 0.139 -5.67 BP 0.129 0.139 0.000 0.129
2 1/4" 42.5 6.3 6.2 12.5 2.031 7.015 8.48 0.475 0.14 0.146 0.151 0.007 0.157 -7.68 1/4" 0.151 0.158 0.011 0.151
2 1/2" 42.5 10 9.7 19.7 3.201 7.04 8.6 0.5 0.26 0.183 0.171 0.032 0.203 -10.33 1/2" 0.172 0.181 0.026 0.172
2 0.005 mm (VL) 42.5 0.38 0.05 0 0.05 0.008 6.66 8.34 0.12 0 0.009 0.005 0.005 62.41
2 0.3 mm (50%) 42.5 0.63 1.3 1.3 2.6 0.423 6.895 8.34 0.355 0 0.066 0.073 0.073 -9.02
2 0.5 mm (BP) 42.5 1.25 4.7 4.6 9.3 1.511 7 8.37 0.46 0.03 0.126 0.139 0.000 0.139 -10.17
2 1/4" 42.5 1.75 7.8 7.7 15.5 2.519 7.01 8.55 0.47 0.21 0.162 0.147 0.019 0.165 -1.81
2 3/16" 42.5 3.38 9.8 9.6 19.4 3.153 7.03 8.6 0.49 0.26 0.181 0.163 0.032 0.194 -6.85
2 5/36" (VL) 42.5 0.33 0.30 0.2 0.5 0.081 6.77 8.34 0.23 0 0.029 0.025 0.025 17.01
2 1/12" (50%) 42.5 0.75 1.20 1.1 2.3 0.374 6.87 8.34 0.33 0 0.062 0.061 0.061 3.10
2 1/8" (BP) 42.5 1.75 4.80 4.6 9.4 1.528 7 8.35 0.46 0.01 0.126 0.139 0.000 0.139 -9.54
2 1/5" 42.5 2.25 5.20 5.1 10.3 1.674 7.05 8.38 0.51 0.04 0.132 0.180 0.000 0.180 -30.69
2 1/2" 42.5 3.00 5.60 5.4 11 1.788 7.1 8.41 0.56 0.07 0.137 0.227 0.001 0.228 -50.28
2 1/64" (VL) 42.5 0.13 0.1 0 0.1 0.016 6.67 8.34 0.13 0 0.013 0.006 0.006 75.32
2 1/64" (50%) 42.5 0.50 0.6 0.55 1.15 0.187 6.83 8.34 0.29 0 0.044 0.044 0.044 0.74
CD - Venturi
Slope
(%)Head (Stage) RPM Rotations
∆hmerium
(in)∆hH20 (ft)
∆H (ft) -
LEFT
∆H (ft) -
RIGHT
%
Difference
Flow Calculations Check
Venturi Data V Notch Data Average
Intensity
Performance Curves
12.5 mm Data Analysis
CONSTANTS
A0

Venturi Infiltration By-Pass Total
h1 (in) -
LEFT
h2 (in) -
RIGHT
H1 (ft) -
LEFT
H2 (ft) -
RIGHT
Q (cfs) -
Venturi
Q1 (cfs) -
LEFT
Q2 (cfs) -
RIGHT
Q (cfs) V-
Notch Stage Venturi Infiltration By-Pass Total
Slope
(%)Head (Stage) RPM Rotations
∆hmerium
(in)∆hH20 (ft)
∆H (ft) -
LEFT
∆H (ft) -
RIGHT
%
Difference
Flow Calculations Check
Venturi Data V Notch Data Average
Intensity
2 1/16" (BP) 42.5 1.38 5.2 5 10.2 1.658 7 8.37 0.46 0.03 0.132 0.139 0.000 0.139 -5.56
2 1/4" 42.5 1.75 7.9 7.8 15.7 2.551 7.02 8.55 0.48 0.21 0.163 0.155 0.019 0.173 -5.86
2 1/2" 42.5 3.00 10.4 10.3 20.7 3.364 7.03 8.62 0.49 0.28 0.187 0.163 0.038 0.201 -6.87
5 0.1mm (VL) 42.5 0.19 0.15 0.1 0.25 0.041 6.73 8.34 0.19 0 0.021 0.015 0.015 29.93 VL 0.022 0.016 0.016
5 0.2mm (50%) 42.5 0.63 0.8 0.8 1.6 0.260 6.855 8.34 0.315 0 0.052 0.054 0.054 -3.42 50% 0.053 0.053 0.053
5 0.5mm (BP) 42.5 1.38 4.75 4.6 9.35 1.519 7 8.4 0.46 0.06 0.126 0.139 0.001 0.140 -10.38 BP 0.122 0.148 0.000 0.149
5 1/4" 42.5 7.1 6.9 14 2.275 7.025 8.5 0.485 0.16 0.154 0.159 0.009 0.168 -8.60 1/4" 0.152 0.174 0.011 0.185
5 1/2" 42.5 4.00 10.3 10.1 20.4 3.315 7.03 8.6 0.49 0.26 0.186 0.163 0.032 0.194 -4.34 1/2" 0.171 0.192 0.025 0.217
5 0.1 mm (VL) 42.5 0.25 0.1 0.05 0.15 0.024 6.71 8.34 0.17 0 0.016 0.012 0.012 32.14
5 0.3 mm (50%) 42.5 0.50 0.8 0.7 1.5 0.244 6.83 8.34 0.29 0 0.050 0.044 0.044 14.01
5 0.6 mm (BP) 42.5 1.00 4.1 4 8.1 1.316 6.995 8.36 0.455 0.02 0.117 0.135 0.000 0.135 -14.27
5 1/4" 42.5 1.75 8.2 8.1 16.3 2.649 7.025 8.565 0.485 0.225 0.166 0.159 0.022 0.181 -8.24
5 > 1/4" 42.5 2.75 9.6 9.4 19 3.088 7.03 8.6 0.49 0.26 0.180 0.163 0.032 0.194 -7.89
5 5/36" (VL) 42.5 0.50 0.3 0.3 0.6 0.098 6.77 8.34 0.23 0 0.032 0.025 0.025 26.02
5 1/12" (50%) 42.5 0.88 1.05 1.3 2.35 0.382 6.89 8.34 0.35 0 0.063 0.070 0.070 -10.53
5 1/8" (BP) 42.5 1.75 4.6 4.4 9 1.463 7.05 8.34 0.51 0 0.124 0.180 0.000 0.180 -37.08
5 1/4" 42.5 2.50 5.4 5.2 10.6 1.723 7.1 8.37 0.56 0.03 0.134 0.227 0.000 0.227 -51.59
5 1/2" 42.5 3.25 5.5 5.4 10.9 1.771 7.15 8.4 0.61 0.06 0.136 0.281 0.001 0.282 -69.91
5 0.1 mm (VL) 42.5 0.25 0.15 0.1 0.25 0.041 6.72 8.34 0.18 0 0.021 0.013 0.013 42.99
5 1/32" (50%) 42.5 0.50 0.7 0.6 1.3 0.211 6.83 8.34 0.29 0 0.047 0.044 0.044 6.87
5 1/16" (BP) 42.5 1.13 4.35 4.2 8.55 1.389 7 8.39 0.46 0.05 0.120 0.139 0.001 0.139 -14.63
5 1/4" 42.5 1.63 7 6.8 13.8 2.243 7.015 8.52 0.475 0.18 0.153 0.151 0.013 0.163 -6.40
5 3/16" 42.5 3.00 9.9 9.8 19.7 3.201 7.03 8.61 0.49 0.27 0.183 0.163 0.035 0.197 -7.68
10 0.1mm (VL) 42.5 0.06 0.05 0 0.05 0.008 6.69 8.34 0.15 0 0.009 0.008 0.008 8.78 VL 0.014 0.013 0.013
10 0.3mm (50%) 42.5 0.38 0.7 0.6 1.3 0.211 6.83 8.34 0.29 0 0.047 0.044 0.044 6.87 50% 0.051 0.048 0.048
10 0.5mm (BP) 42.5 0.50 4.1 4 8.1 1.316 6.995 8.3405 0.455 0.0005 0.117 0.135 0.000 0.135 -14.23 BP 0.117 0.138 0.000 0.138
10 1/4" 42.5 8.3 8.2 16.5 2.681 7.03 8.54 0.49 0.2 0.167 0.163 0.016 0.179 -6.80 1/4" 0.148 0.174 0.015 0.189
10 1/2" 42.5 10 9.8 19.8 3.218 7.04 8.59 0.5 0.25 0.183 0.171 0.029 0.200 -8.61 1/2" 0.165 0.184 0.028 0.212
10 0.1 mm (VL) 42.5 0.13 0.1 0.05 0.15 0.024 6.71 8.34 0.17 0 0.016 0.012 0.012 32.14
10 0.15 mm (50%) 42.5 0.50 0.9 0.8 1.7 0.276 6.845 8.34 0.305 0 0.054 0.050 0.050 7.68
10 0.5 mm (BP) 42.5 1.00 4 3.8 7.8 1.268 7 8.35 0.46 0.01 0.115 0.139 0.000 0.139 -18.82
10 1/4" 42.5 1.50 6.45 6.3 12.75 2.072 7.015 8.495 0.475 0.155 0.147 0.151 0.009 0.159 -7.92
10 > 1/4" 42.5 2.50 8.5 8.3 16.8 2.730 7.04 8.57 0.5 0.23 0.169 0.171 0.023 0.194 -14.07
10 0.05 mm (VL) 42.5 0.13 0.1 0 0.1 0.016 6.69 8.34 0.15 0 0.013 0.008 0.008 42.77
10 1/32" (50%) 42.5 0.50 0.65 0.55 1.2 0.195 6.825 8.34 0.285 0 0.045 0.042 0.042 7.22
10 1/16" (BP) 42.5 1.06 4.1 3.9 8 1.300 7 8.35 0.46 0.01 0.116 0.139 0.000 0.139 -17.57
10 1/4" 42.5 1.50 6.7 6.6 13.3 2.161 7.02 8.51 0.48 0.17 0.150 0.155 0.011 0.165 -9.65
10 1/2" 42.5 3.00 9.4 9.2 18.6 3.023 7.035 8.59 0.495 0.25 0.178 0.167 0.029 0.195 -9.59
10 1/12" (VL) 42.5 0.33 0.2 0 0.2 0.033 6.76 8.34 0.22 0 0.018 0.022 0.022 -17.61
10 1/9" (50%) 42.5 0.63 1 0.9 1.9 0.309 6.86 8.34 0.32 0 0.057 0.056 0.056 1.24
10 1/8" (BP) 42.5 1.75 4.2 4.1 8.3 1.349 7 8.34 0.46 0 0.119 0.139 0.000 0.139 -15.73
10 1/4" 42.5 2.50 4.9 4.8 9.7 1.576 7.1 8.57 0.56 0.23 0.128 0.227 0.023 0.250 -64.51
10 1/2" 42.5 3.50 5.3 5 10.3 1.674 7.1 8.6 0.56 0.26 0.132 0.227 0.032 0.259 -64.75

79
APPENDIX B
PERFORMANCE CURVES
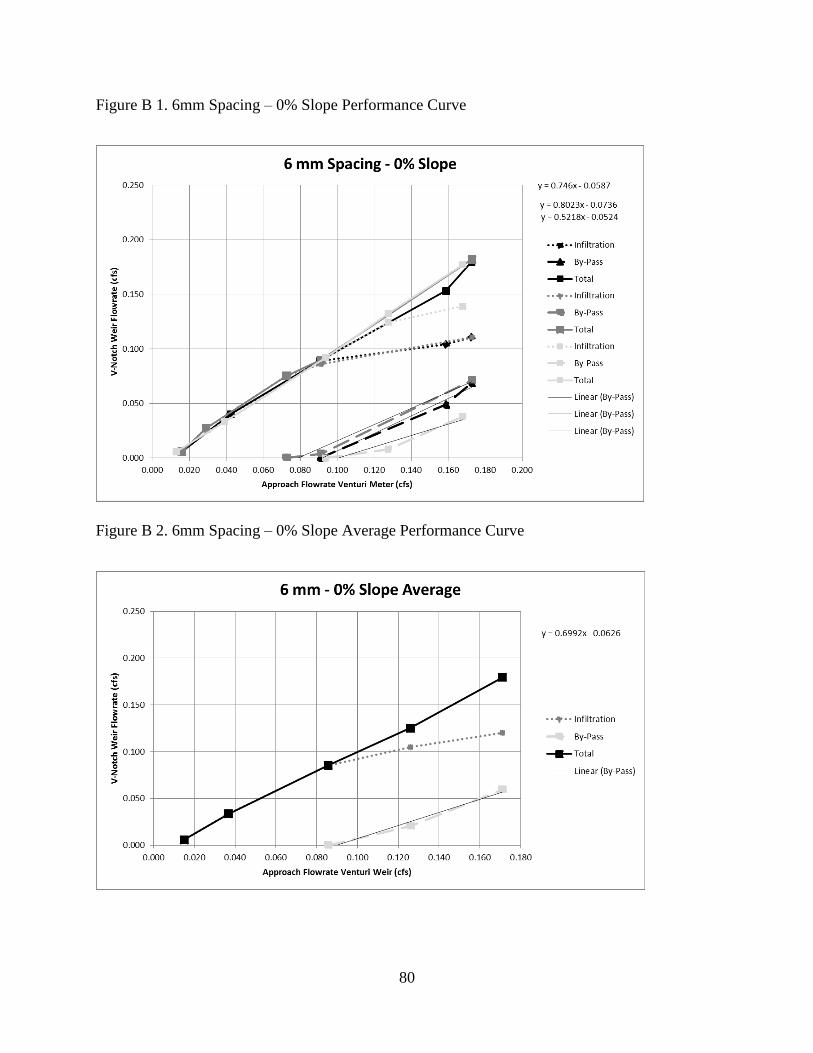
80
Figure B 1. 6mm Spacing – 0% Slope Performance Curve
Figure B 2. 6mm Spacing – 0% Slope Average Performance Curve
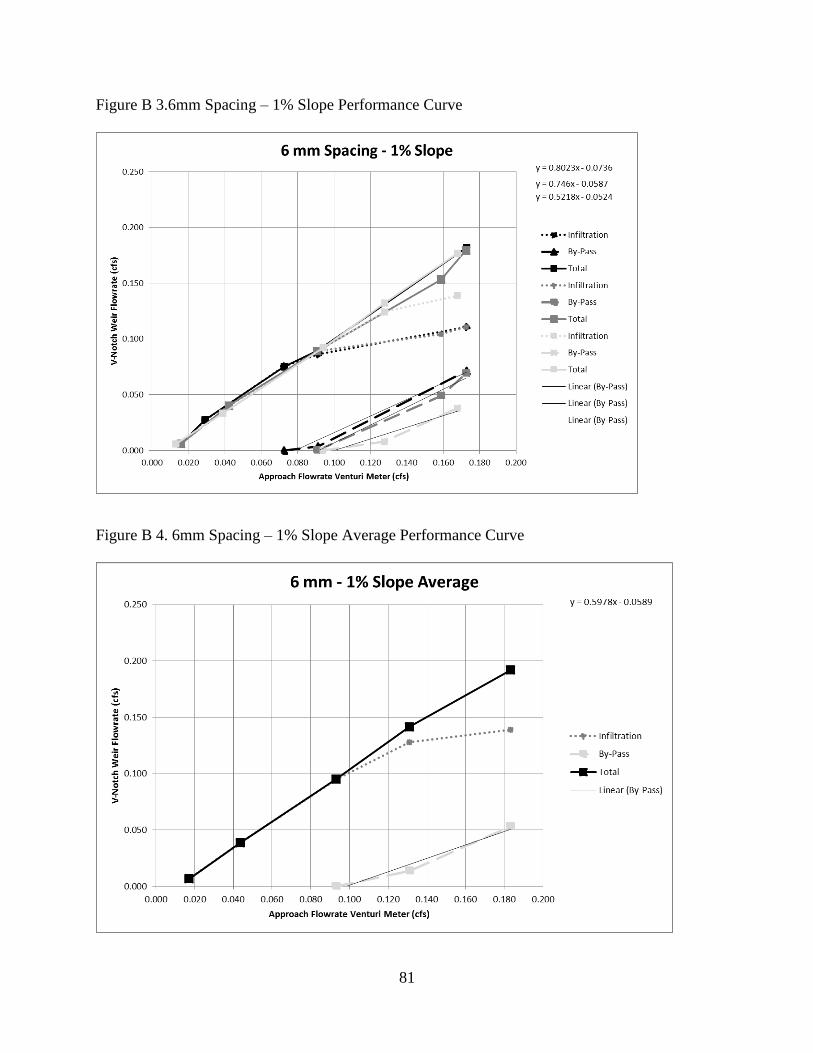
81
Figure B 3.6mm Spacing – 1% Slope Performance Curve
Figure B 4. 6mm Spacing – 1% Slope Average Performance Curve

82
Figure B 5. 6mm Spacing – 2% Slope Performance Curve
Figure B 6. 6mm Spacing – 2% Slope Average Performance Curve

83
Figure B 7. 6mm Spacing – 5% Slope Performance Curve
Figure B 8. 6mm Spacing – 5% Slope Average Performance Curve
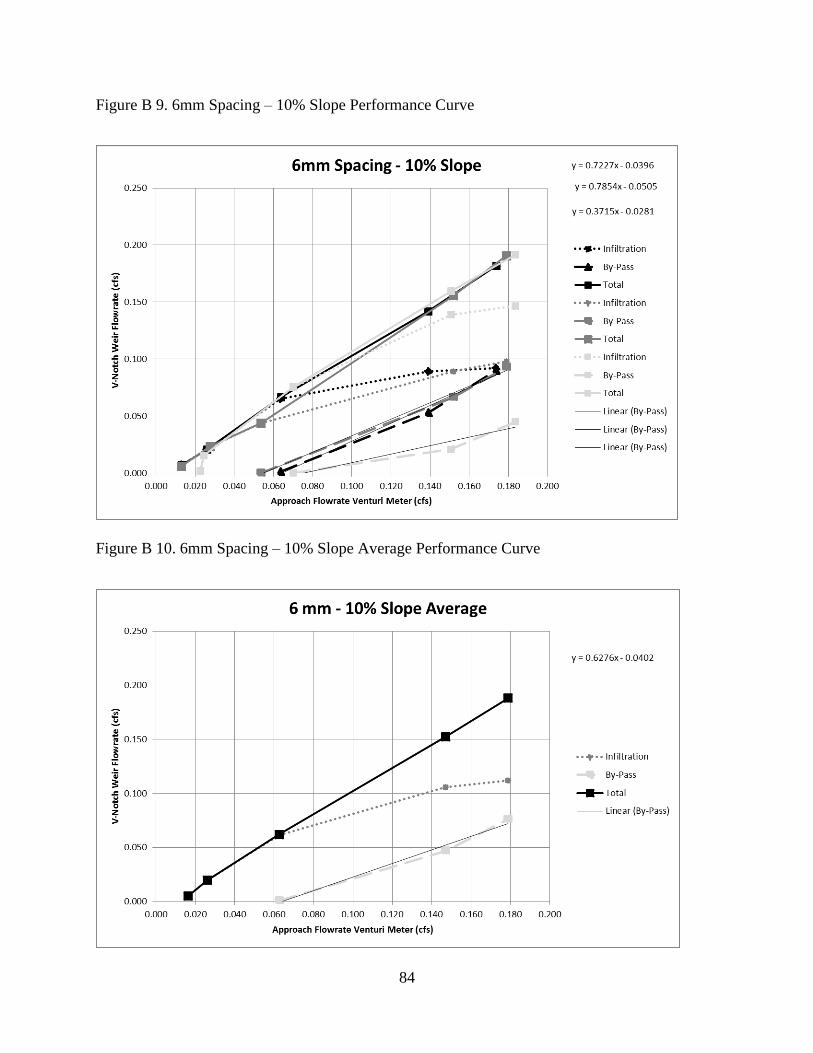
84
Figure B 9. 6mm Spacing – 10% Slope Performance Curve
Figure B 10. 6mm Spacing – 10% Slope Average Performance Curve
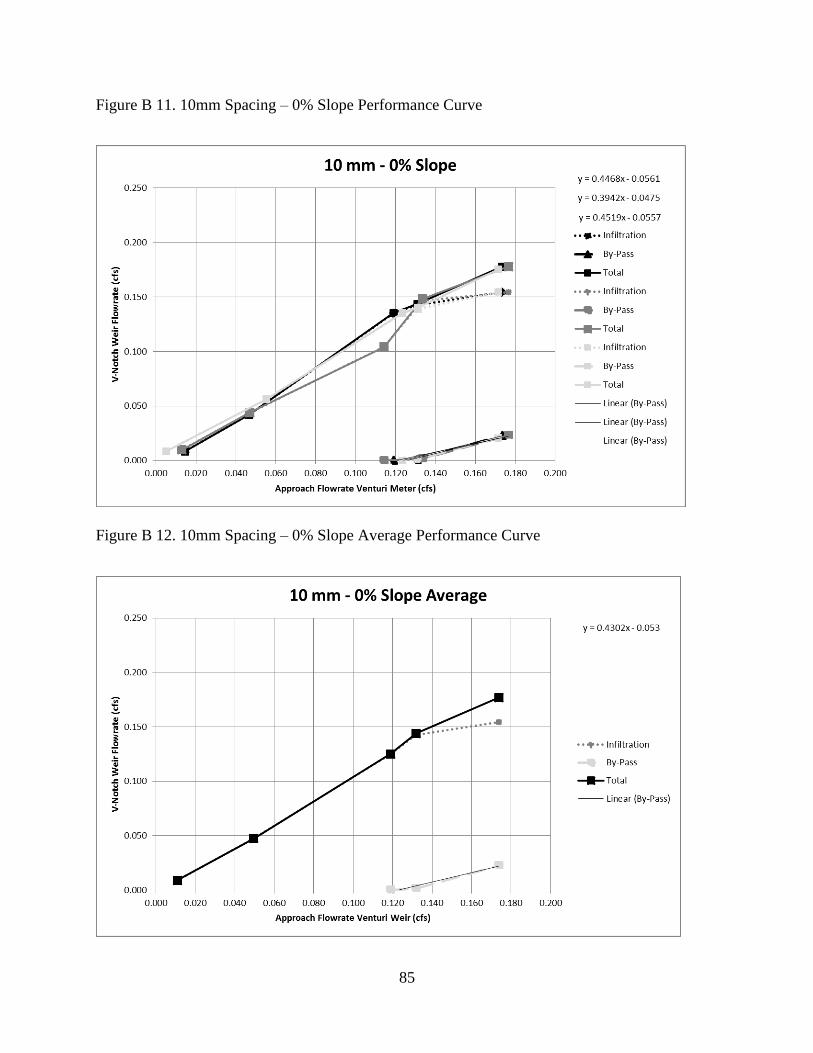
85
Figure B 11. 10mm Spacing – 0% Slope Performance Curve
Figure B 12. 10mm Spacing – 0% Slope Average Performance Curve
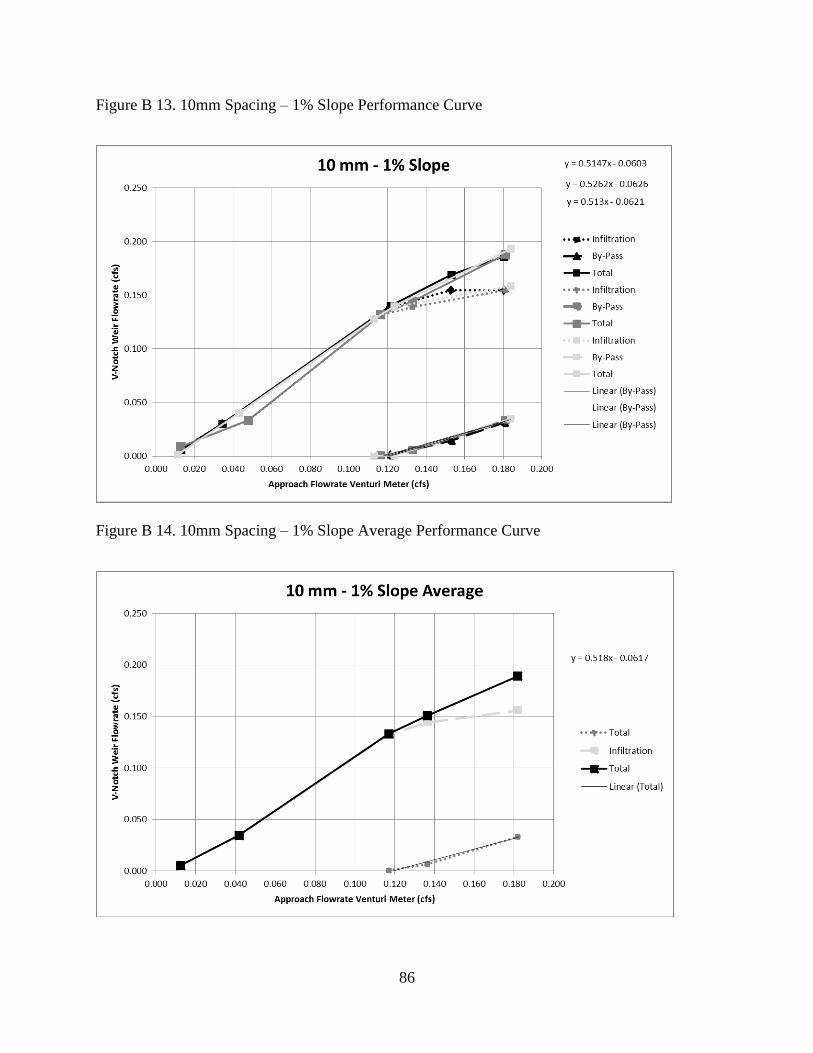
86
Figure B 13. 10mm Spacing – 1% Slope Performance Curve
Figure B 14. 10mm Spacing – 1% Slope Average Performance Curve

87
Figure B 15. 10mm Spacing – 2% Slope Performance Curve
Figure B 16. 10mm Spacing – 2% Slope Average Performance Curve
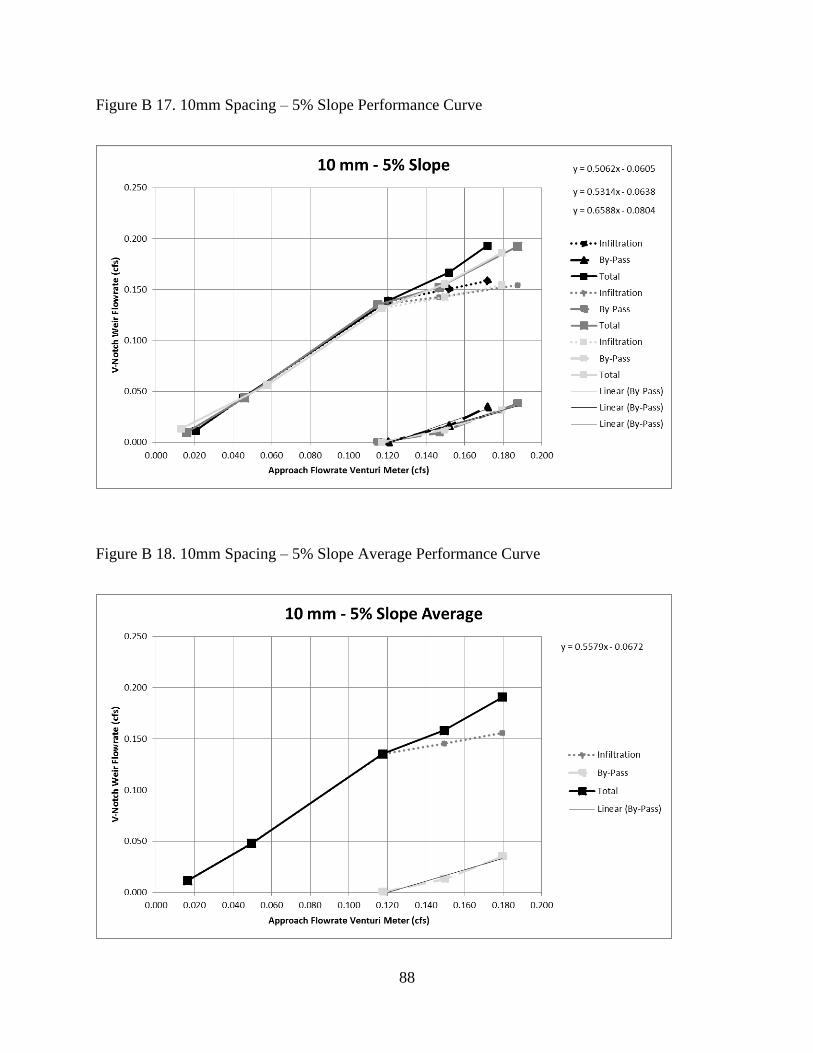
88
Figure B 17. 10mm Spacing – 5% Slope Performance Curve
Figure B 18. 10mm Spacing – 5% Slope Average Performance Curve
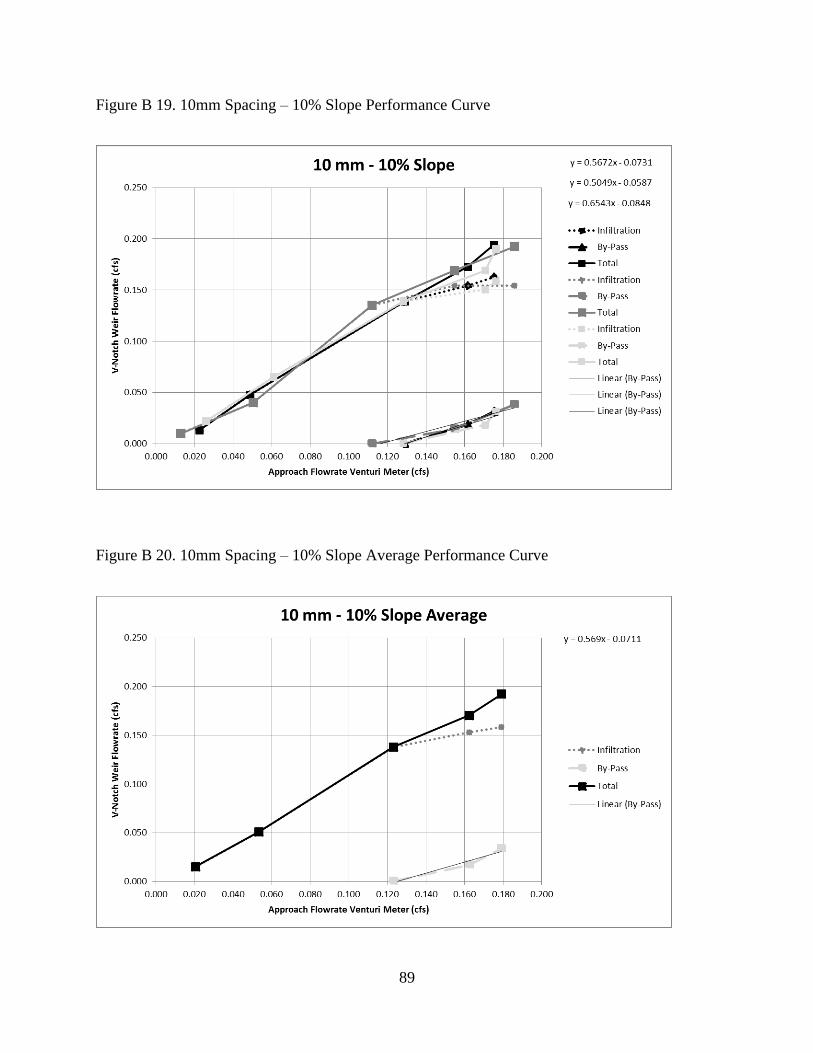
89
Figure B 19. 10mm Spacing – 10% Slope Performance Curve
Figure B 20. 10mm Spacing – 10% Slope Average Performance Curve
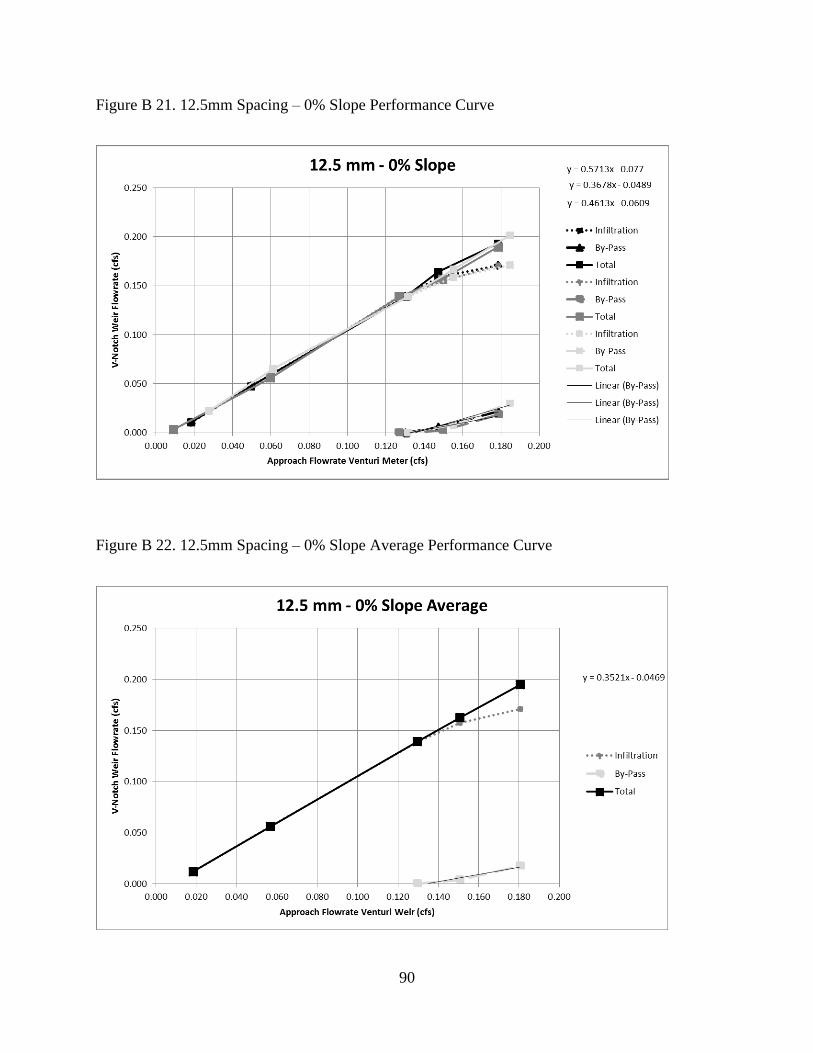
90
Figure B 21. 12.5mm Spacing – 0% Slope Performance Curve
Figure B 22. 12.5mm Spacing – 0% Slope Average Performance Curve
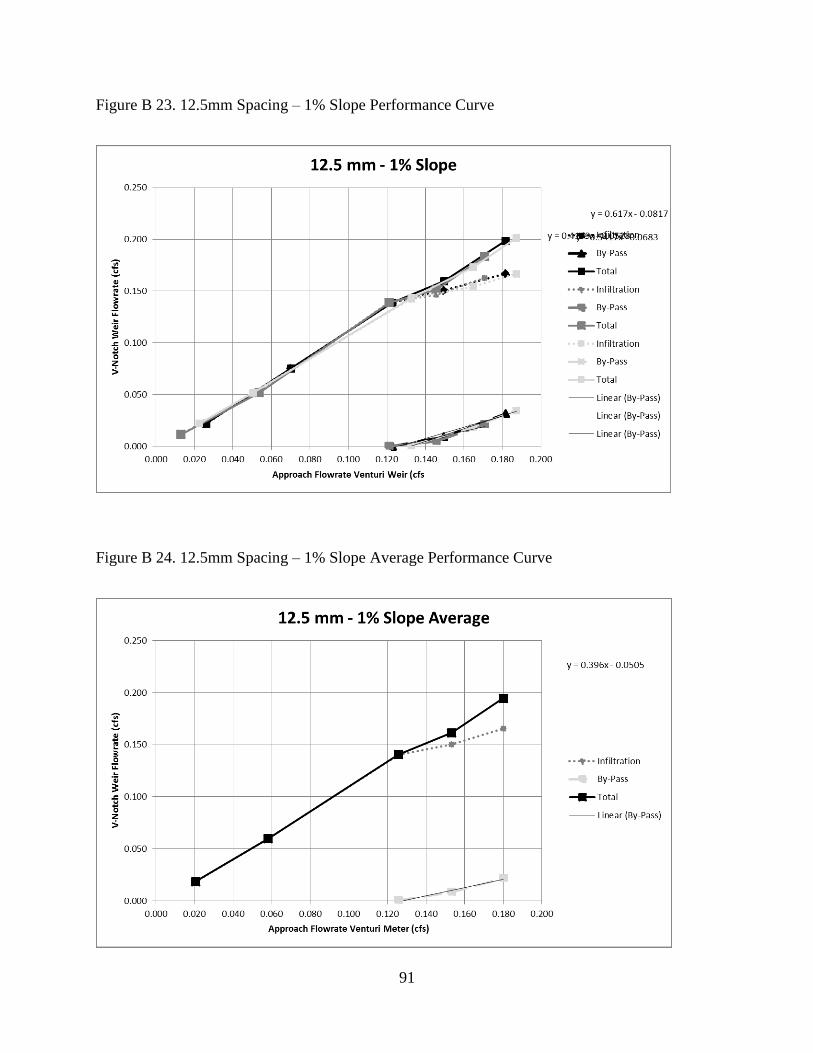
91
Figure B 23. 12.5mm Spacing – 1% Slope Performance Curve
Figure B 24. 12.5mm Spacing – 1% Slope Average Performance Curve
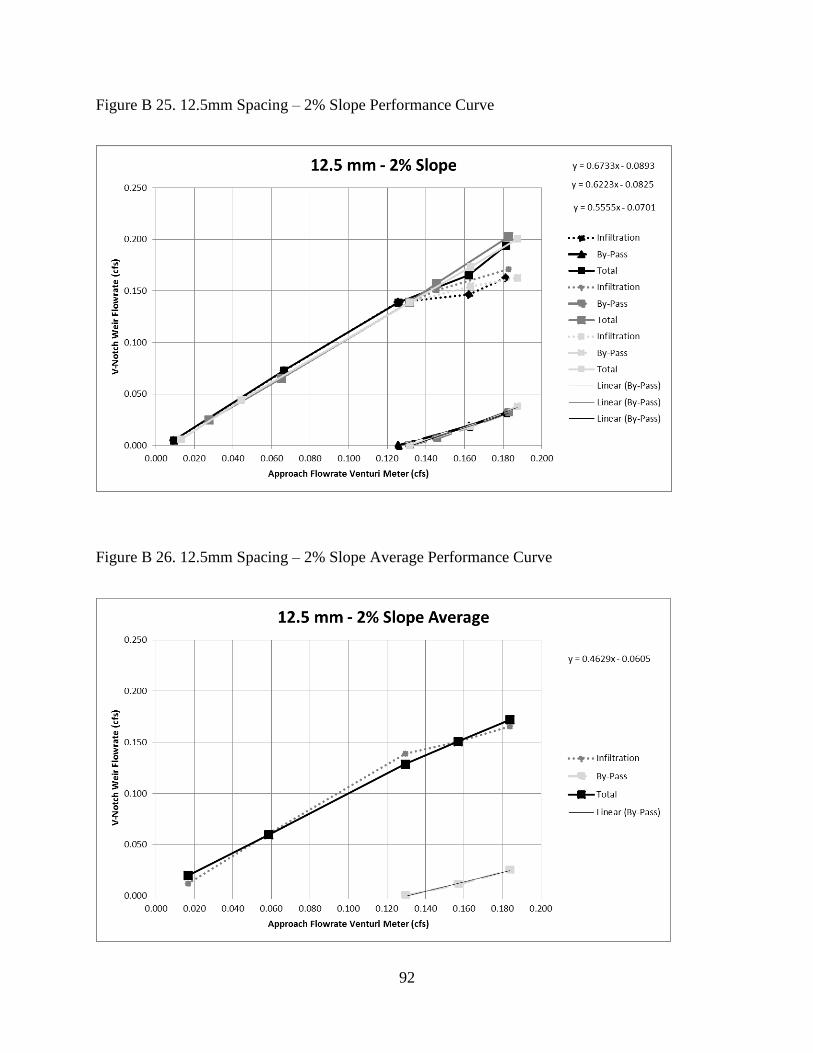
92
Figure B 25. 12.5mm Spacing – 2% Slope Performance Curve
Figure B 26. 12.5mm Spacing – 2% Slope Average Performance Curve

93
Figure B 27. 12.5mm Spacing – 5% Slope Performance Curve
Figure B 28. 12.5mm Spacing – 5% Slope Average Performance Curve
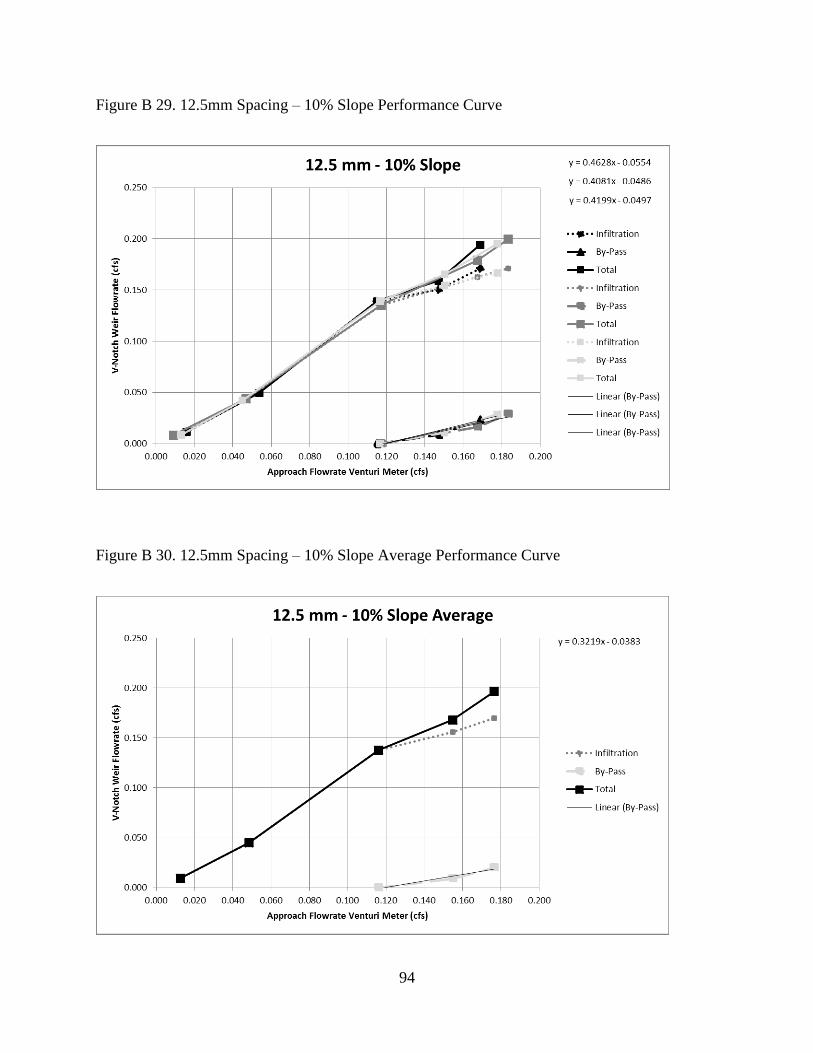
94
Figure B 29. 12.5mm Spacing – 10% Slope Performance Curve
Figure B 30. 12.5mm Spacing – 10% Slope Average Performance Curve
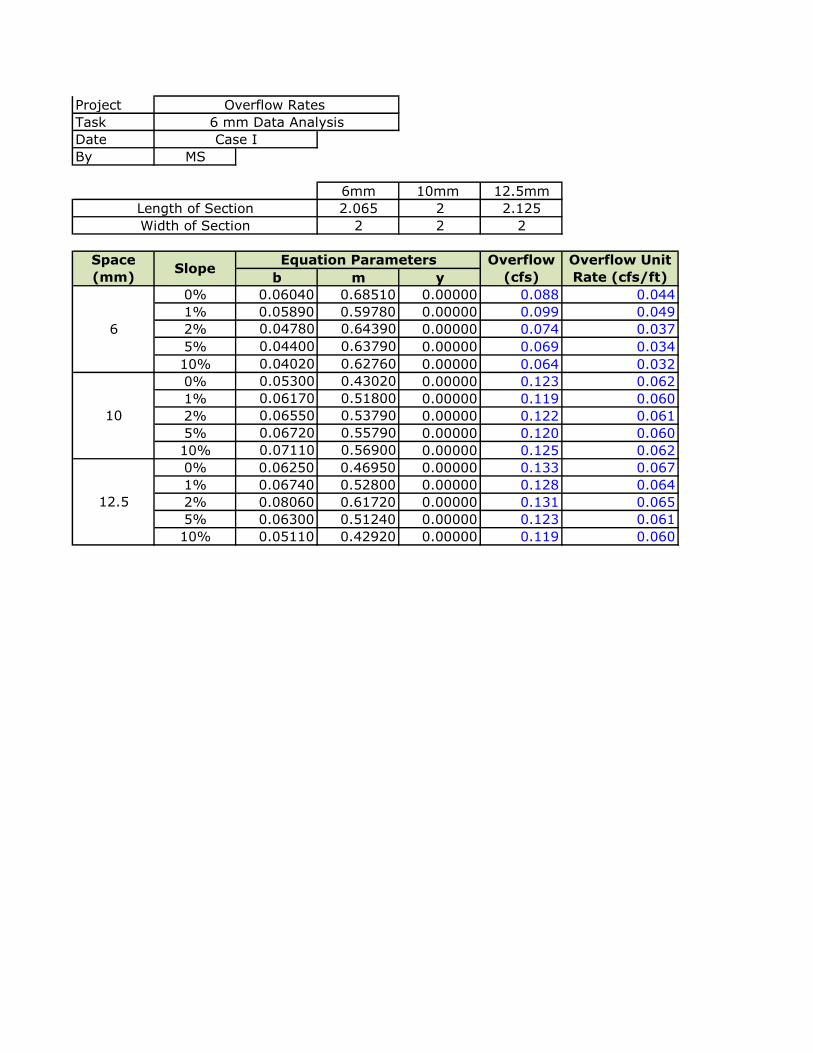
Project
Task
Date
By MS
6mm 10mm 12.5mm
2.065 2 2.125
2 2 2
b m y
0% 0.06040 0.68510 0.00000 0.088 0.044
1% 0.05890 0.59780 0.00000 0.099 0.049
2% 0.04780 0.64390 0.00000 0.074 0.037
5% 0.04400 0.63790 0.00000 0.069 0.034
10% 0.04020 0.62760 0.00000 0.064 0.032
0% 0.05300 0.43020 0.00000 0.123 0.062
1% 0.06170 0.51800 0.00000 0.119 0.060
2% 0.06550 0.53790 0.00000 0.122 0.061
5% 0.06720 0.55790 0.00000 0.120 0.060
10% 0.07110 0.56900 0.00000 0.125 0.062
0% 0.06250 0.46950 0.00000 0.133 0.067
1% 0.06740 0.52800 0.00000 0.128 0.064
2% 0.08060 0.61720 0.00000 0.131 0.065
5% 0.06300 0.51240 0.00000 0.123 0.061
10% 0.05110 0.42920 0.00000 0.119 0.060
Width of Section
Space
(mm)Slope
Overflow Unit
Rate (cfs/ft)
Overflow Rates
6 mm Data Analysis
Case I
Length of Section
12.5
Equation Parameters Overflow
(cfs)
6
10
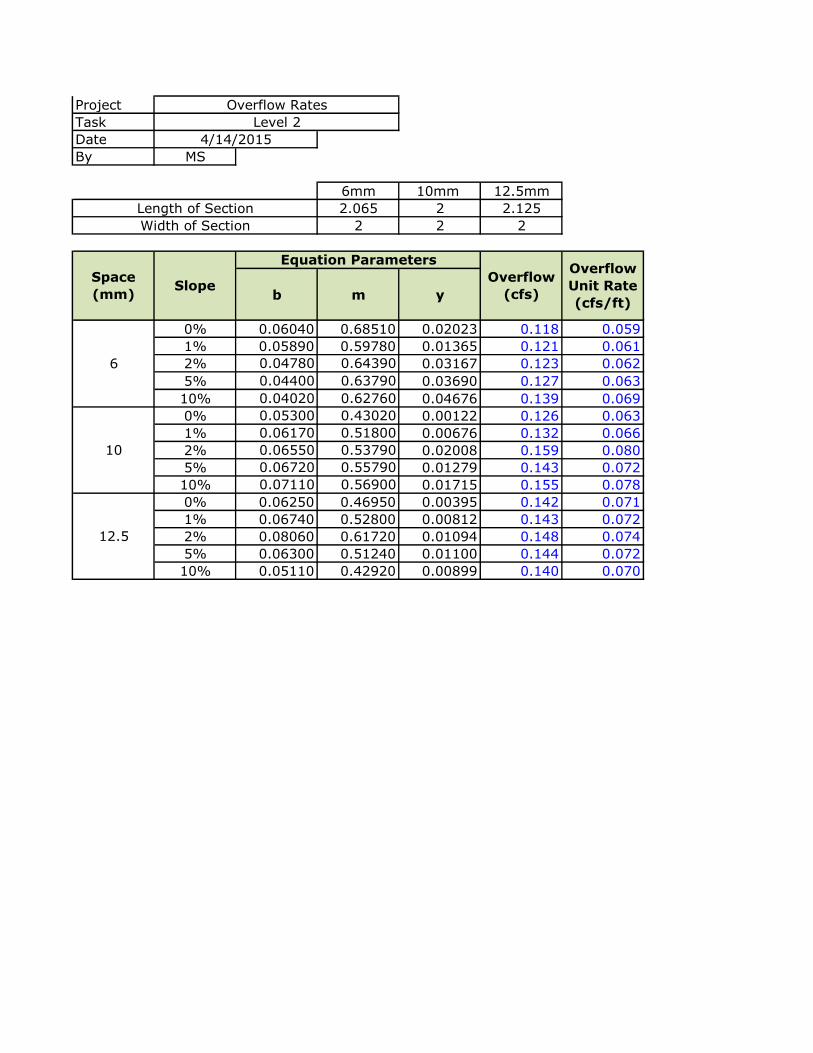
Project
Task
Date
By MS
6mm 10mm 12.5mm
2.065 2 2.125
2 2 2
b m y
0% 0.06040 0.68510 0.02023 0.118 0.059
1% 0.05890 0.59780 0.01365 0.121 0.061
2% 0.04780 0.64390 0.03167 0.123 0.062
5% 0.04400 0.63790 0.03690 0.127 0.063
10% 0.04020 0.62760 0.04676 0.139 0.069
0% 0.05300 0.43020 0.00122 0.126 0.063
1% 0.06170 0.51800 0.00676 0.132 0.066
2% 0.06550 0.53790 0.02008 0.159 0.080
5% 0.06720 0.55790 0.01279 0.143 0.072
10% 0.07110 0.56900 0.01715 0.155 0.078
0% 0.06250 0.46950 0.00395 0.142 0.071
1% 0.06740 0.52800 0.00812 0.143 0.072
2% 0.08060 0.61720 0.01094 0.148 0.074
5% 0.06300 0.51240 0.01100 0.144 0.072
10% 0.05110 0.42920 0.00899 0.140 0.070
Width of Section
Space
(mm)Slope
Overflow Rates
Level 2
4/14/2015
Length of Section
12.5
Equation Parameters
Overflow
(cfs)
Overflow
Unit Rate
(cfs/ft)
6
10
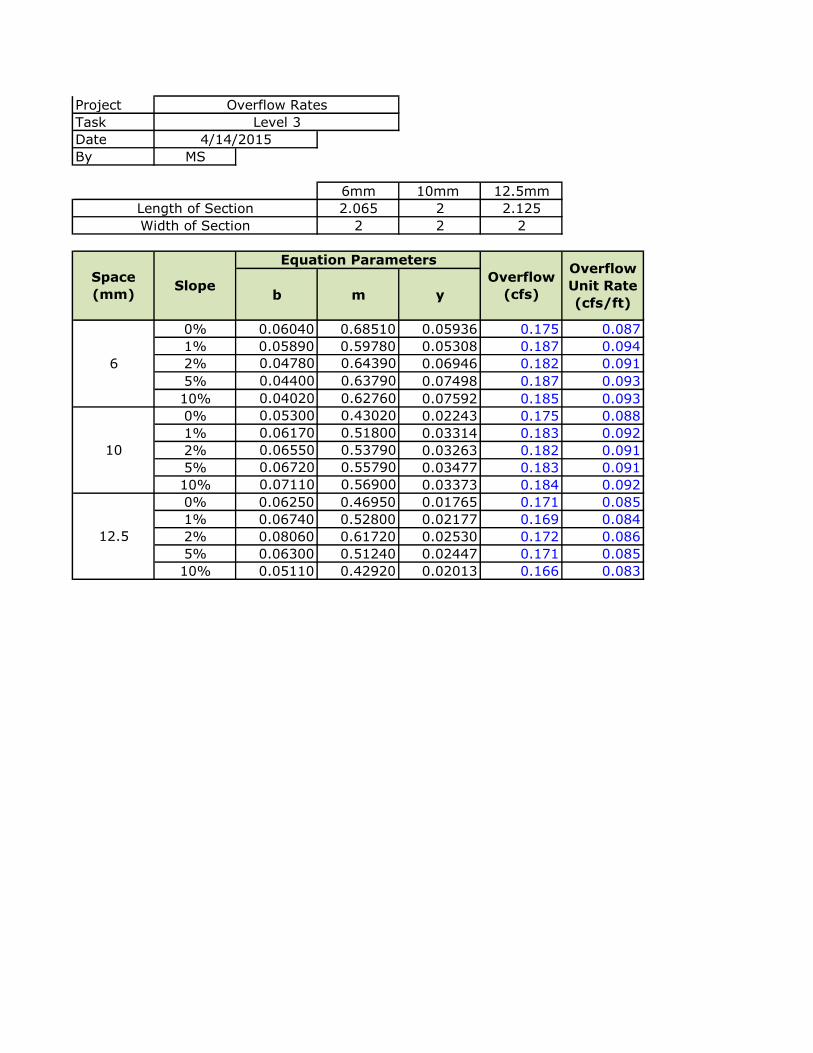
Project
Task
Date
By MS
6mm 10mm 12.5mm
2.065 2 2.125
2 2 2
b m y
0% 0.06040 0.68510 0.05936 0.175 0.087
1% 0.05890 0.59780 0.05308 0.187 0.094
2% 0.04780 0.64390 0.06946 0.182 0.091
5% 0.04400 0.63790 0.07498 0.187 0.093
10% 0.04020 0.62760 0.07592 0.185 0.093
0% 0.05300 0.43020 0.02243 0.175 0.088
1% 0.06170 0.51800 0.03314 0.183 0.092
2% 0.06550 0.53790 0.03263 0.182 0.091
5% 0.06720 0.55790 0.03477 0.183 0.091
10% 0.07110 0.56900 0.03373 0.184 0.092
0% 0.06250 0.46950 0.01765 0.171 0.085
1% 0.06740 0.52800 0.02177 0.169 0.084
2% 0.08060 0.61720 0.02530 0.172 0.086
5% 0.06300 0.51240 0.02447 0.171 0.085
10% 0.05110 0.42920 0.02013 0.166 0.083
Overflow Rates
Level 3
4/14/2015
6
Length of Section
12.5
Equation Parameters
SlopeSpace
(mm)
Width of Section
Overflow
Unit Rate
(cfs/ft)
Overflow
(cfs)
10
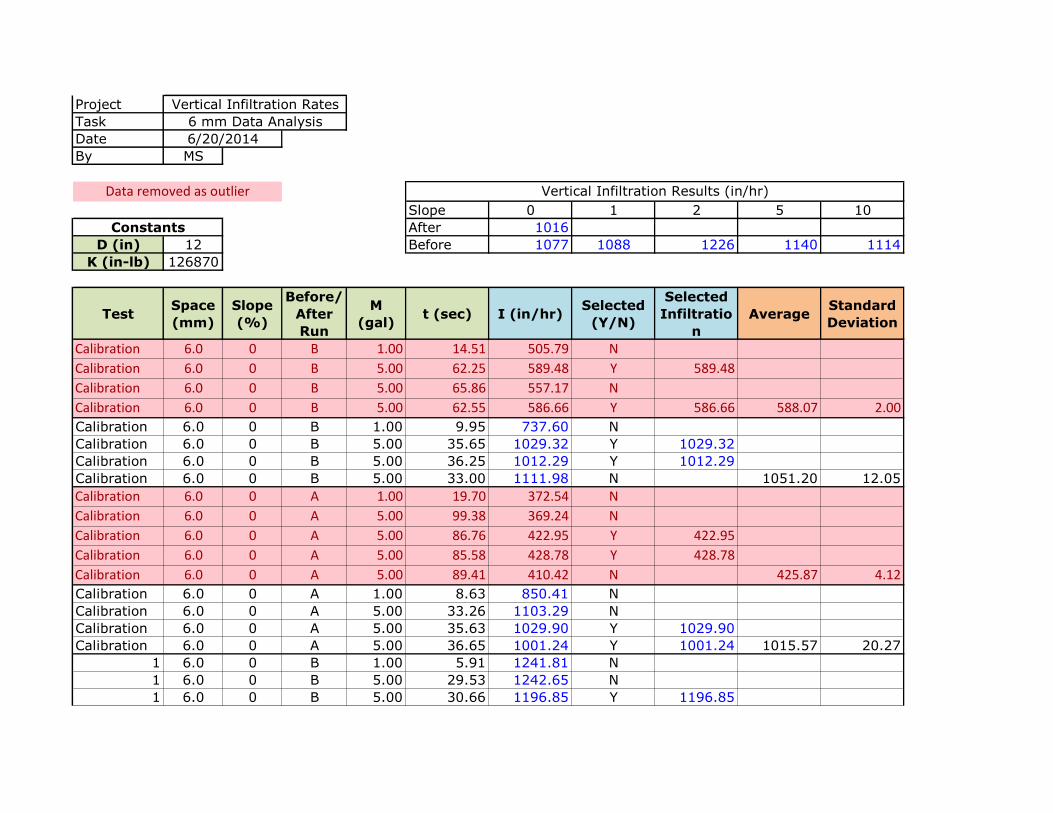
Project
Task
Date
By MS
Slope 0 1 2 5 10
After 1016
D (in) 12 Before 1077 1088 1226 1140 1114
K (in-lb) 126870
TestSpace
(mm)
Slope
(%)
Before/
After
Run
M
(gal)t (sec) I (in/hr)
Selected
(Y/N)
Selected
Infiltratio
n
AverageStandard
Deviation
Calibration 6.0 0 B 1.00 14.51 505.79 N
Calibration 6.0 0 B 5.00 62.25 589.48 Y 589.48
Calibration 6.0 0 B 5.00 65.86 557.17 N
Calibration 6.0 0 B 5.00 62.55 586.66 Y 586.66 588.07 2.00
Calibration 6.0 0 B 1.00 9.95 737.60 N
Calibration 6.0 0 B 5.00 35.65 1029.32 Y 1029.32
Calibration 6.0 0 B 5.00 36.25 1012.29 Y 1012.29
Calibration 6.0 0 B 5.00 33.00 1111.98 N 1051.20 12.05
Calibration 6.0 0 A 1.00 19.70 372.54 N
Calibration 6.0 0 A 5.00 99.38 369.24 N
Calibration 6.0 0 A 5.00 86.76 422.95 Y 422.95
Calibration 6.0 0 A 5.00 85.58 428.78 Y 428.78
Calibration 6.0 0 A 5.00 89.41 410.42 N 425.87 4.12
Calibration 6.0 0 A 1.00 8.63 850.41 N
Calibration 6.0 0 A 5.00 33.26 1103.29 N
Calibration 6.0 0 A 5.00 35.63 1029.90 Y 1029.90
Calibration 6.0 0 A 5.00 36.65 1001.24 Y 1001.24 1015.57 20.27
1 6.0 0 B 1.00 5.91 1241.81 N
1 6.0 0 B 5.00 29.53 1242.65 N
1 6.0 0 B 5.00 30.66 1196.85 Y 1196.85
Constants
Vertical Infiltration Results (in/hr)
6/20/2014
Vertical Infiltration Rates
6 mm Data Analysis
Data removed as outlier
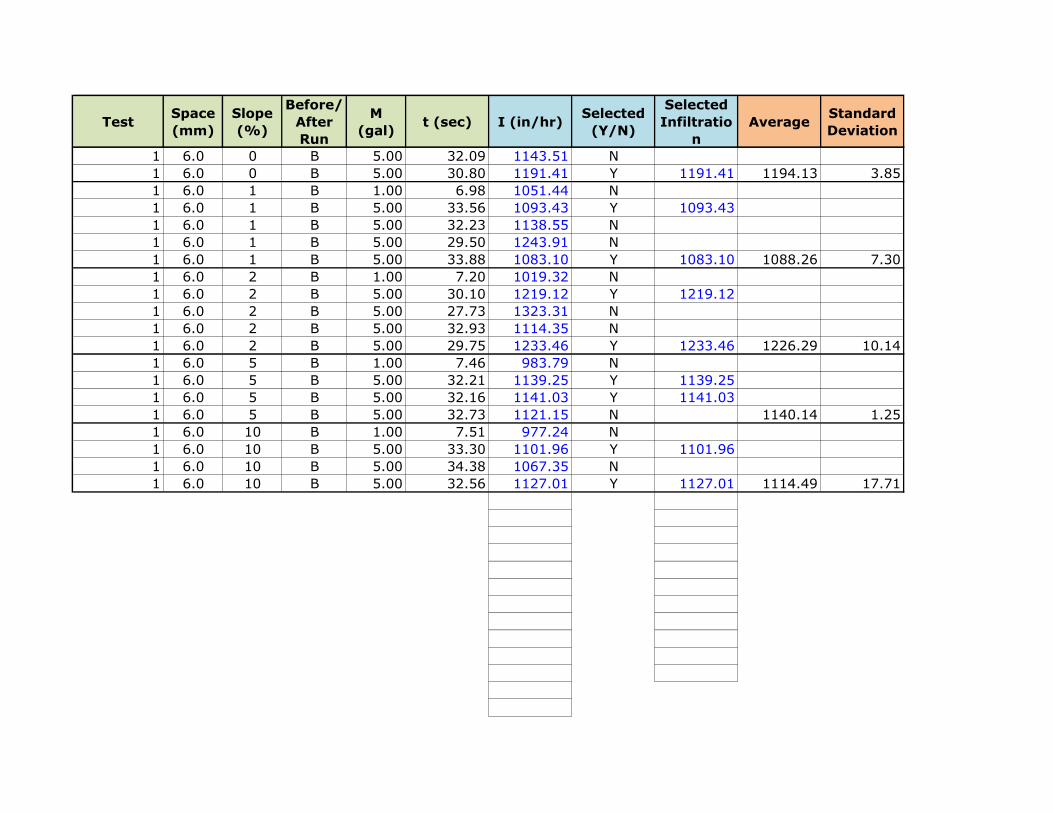
TestSpace
(mm)
Slope
(%)
Before/
After
Run
M
(gal)t (sec) I (in/hr)
Selected
(Y/N)
Selected
Infiltratio
n
AverageStandard
Deviation
1 6.0 0 B 5.00 32.09 1143.51 N
1 6.0 0 B 5.00 30.80 1191.41 Y 1191.41 1194.13 3.85
1 6.0 1 B 1.00 6.98 1051.44 N
1 6.0 1 B 5.00 33.56 1093.43 Y 1093.43
1 6.0 1 B 5.00 32.23 1138.55 N
1 6.0 1 B 5.00 29.50 1243.91 N
1 6.0 1 B 5.00 33.88 1083.10 Y 1083.10 1088.26 7.30
1 6.0 2 B 1.00 7.20 1019.32 N
1 6.0 2 B 5.00 30.10 1219.12 Y 1219.12
1 6.0 2 B 5.00 27.73 1323.31 N
1 6.0 2 B 5.00 32.93 1114.35 N
1 6.0 2 B 5.00 29.75 1233.46 Y 1233.46 1226.29 10.14
1 6.0 5 B 1.00 7.46 983.79 N
1 6.0 5 B 5.00 32.21 1139.25 Y 1139.25
1 6.0 5 B 5.00 32.16 1141.03 Y 1141.03
1 6.0 5 B 5.00 32.73 1121.15 N 1140.14 1.25
1 6.0 10 B 1.00 7.51 977.24 N
1 6.0 10 B 5.00 33.30 1101.96 Y 1101.96
1 6.0 10 B 5.00 34.38 1067.35 N
1 6.0 10 B 5.00 32.56 1127.01 Y 1127.01 1114.49 17.71
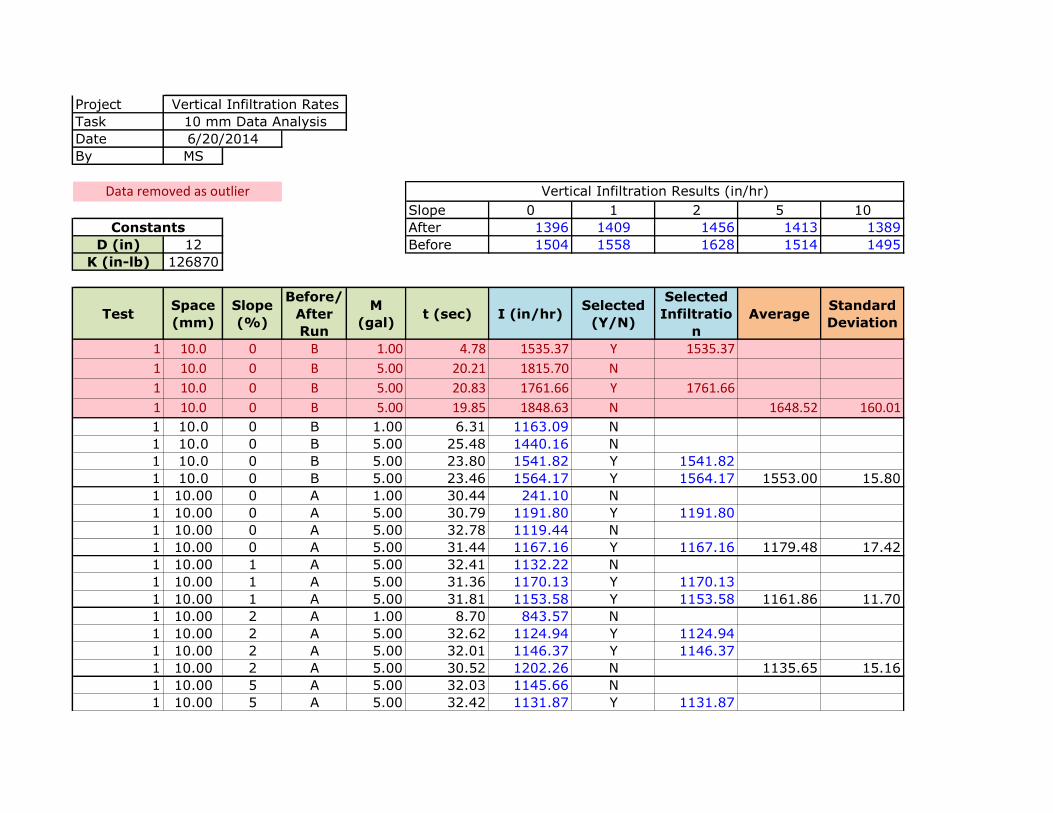
Project
Task
Date
By MS
Slope 0 1 2 5 10
After 1396 1409 1456 1413 1389
D (in) 12 Before 1504 1558 1628 1514 1495
K (in-lb) 126870
TestSpace
(mm)
Slope
(%)
Before/
After
Run
M
(gal)t (sec) I (in/hr)
Selected
(Y/N)
Selected
Infiltratio
n
AverageStandard
Deviation
1 10.0 0 B 1.00 4.78 1535.37 Y 1535.37
1 10.0 0 B 5.00 20.21 1815.70 N
1 10.0 0 B 5.00 20.83 1761.66 Y 1761.66
1 10.0 0 B 5.00 19.85 1848.63 N 1648.52 160.01
1 10.0 0 B 1.00 6.31 1163.09 N
1 10.0 0 B 5.00 25.48 1440.16 N
1 10.0 0 B 5.00 23.80 1541.82 Y 1541.82
1 10.0 0 B 5.00 23.46 1564.17 Y 1564.17 1553.00 15.80
1 10.00 0 A 1.00 30.44 241.10 N
1 10.00 0 A 5.00 30.79 1191.80 Y 1191.80
1 10.00 0 A 5.00 32.78 1119.44 N
1 10.00 0 A 5.00 31.44 1167.16 Y 1167.16 1179.48 17.42
1 10.00 1 A 5.00 32.41 1132.22 N
1 10.00 1 A 5.00 31.36 1170.13 Y 1170.13
1 10.00 1 A 5.00 31.81 1153.58 Y 1153.58 1161.86 11.70
1 10.00 2 A 1.00 8.70 843.57 N
1 10.00 2 A 5.00 32.62 1124.94 Y 1124.94
1 10.00 2 A 5.00 32.01 1146.37 Y 1146.37
1 10.00 2 A 5.00 30.52 1202.26 N 1135.65 15.16
1 10.00 5 A 5.00 32.03 1145.66 N
1 10.00 5 A 5.00 32.42 1131.87 Y 1131.87
Vertical Infiltration Rates
10 mm Data Analysis
6/20/2014
Data removed as outlier Vertical Infiltration Results (in/hr)
Constants
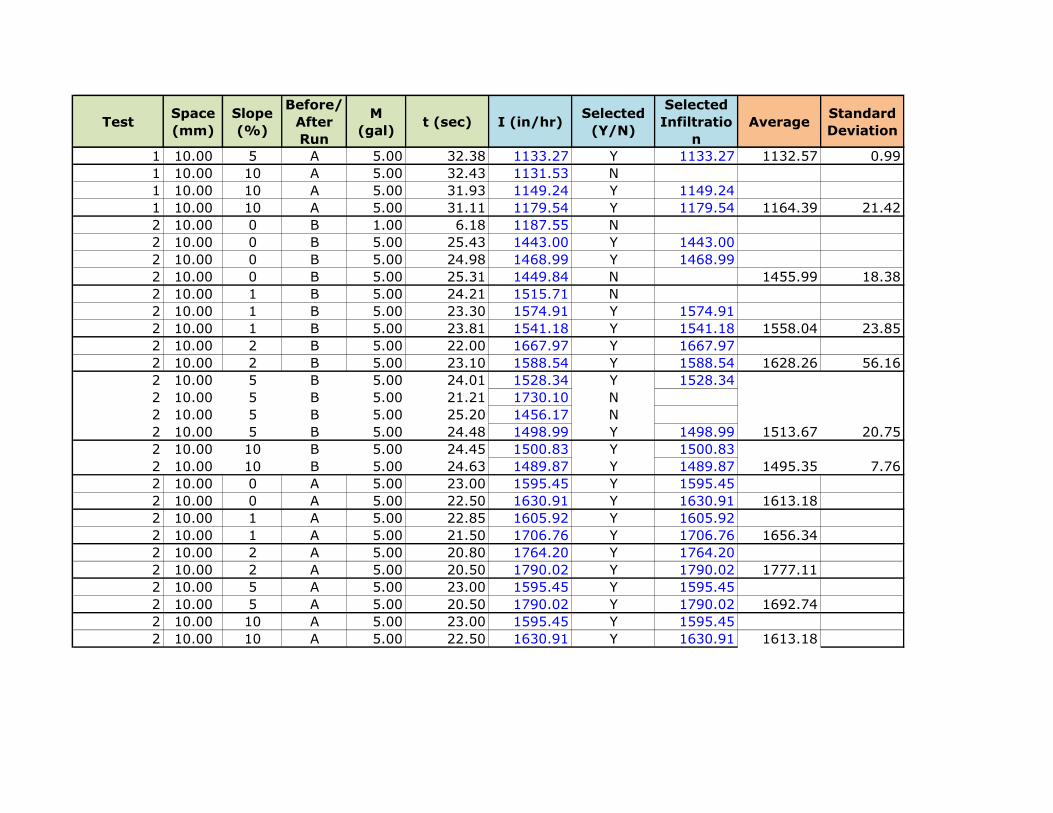
TestSpace
(mm)
Slope
(%)
Before/
After
Run
M
(gal)t (sec) I (in/hr)
Selected
(Y/N)
Selected
Infiltratio
n
AverageStandard
Deviation
1 10.00 5 A 5.00 32.38 1133.27 Y 1133.27 1132.57 0.99
1 10.00 10 A 5.00 32.43 1131.53 N
1 10.00 10 A 5.00 31.93 1149.24 Y 1149.24
1 10.00 10 A 5.00 31.11 1179.54 Y 1179.54 1164.39 21.42
2 10.00 0 B 1.00 6.18 1187.55 N
2 10.00 0 B 5.00 25.43 1443.00 Y 1443.00
2 10.00 0 B 5.00 24.98 1468.99 Y 1468.99
2 10.00 0 B 5.00 25.31 1449.84 N 1455.99 18.38
2 10.00 1 B 5.00 24.21 1515.71 N
2 10.00 1 B 5.00 23.30 1574.91 Y 1574.91
2 10.00 1 B 5.00 23.81 1541.18 Y 1541.18 1558.04 23.85
2 10.00 2 B 5.00 22.00 1667.97 Y 1667.97
2 10.00 2 B 5.00 23.10 1588.54 Y 1588.54 1628.26 56.16
2 10.00 5 B 5.00 24.01 1528.34 Y 1528.34
2 10.00 5 B 5.00 21.21 1730.10 N
2 10.00 5 B 5.00 25.20 1456.17 N
2 10.00 5 B 5.00 24.48 1498.99 Y 1498.99 1513.67 20.75
2 10.00 10 B 5.00 24.45 1500.83 Y 1500.83
2 10.00 10 B 5.00 24.63 1489.87 Y 1489.87 1495.35 7.76
2 10.00 0 A 5.00 23.00 1595.45 Y 1595.45
2 10.00 0 A 5.00 22.50 1630.91 Y 1630.91 1613.18
2 10.00 1 A 5.00 22.85 1605.92 Y 1605.92
2 10.00 1 A 5.00 21.50 1706.76 Y 1706.76 1656.34
2 10.00 2 A 5.00 20.80 1764.20 Y 1764.20
2 10.00 2 A 5.00 20.50 1790.02 Y 1790.02 1777.11
2 10.00 5 A 5.00 23.00 1595.45 Y 1595.45
2 10.00 5 A 5.00 20.50 1790.02 Y 1790.02 1692.74
2 10.00 10 A 5.00 23.00 1595.45 Y 1595.45
2 10.00 10 A 5.00 22.50 1630.91 Y 1630.91 1613.18
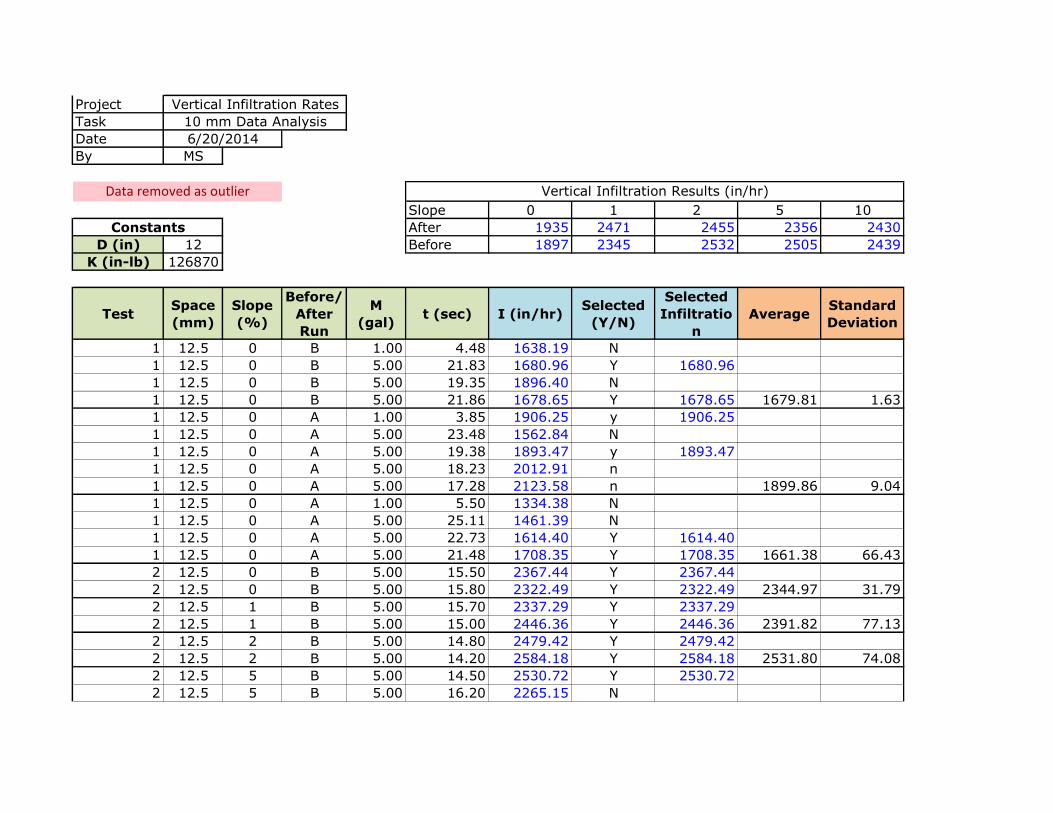
Project
Task
Date
By MS
Slope 0 1 2 5 10
After 1935 2471 2455 2356 2430
D (in) 12 Before 1897 2345 2532 2505 2439
K (in-lb) 126870
TestSpace
(mm)
Slope
(%)
Before/
After
Run
M
(gal)t (sec) I (in/hr)
Selected
(Y/N)
Selected
Infiltratio
n
AverageStandard
Deviation
1 12.5 0 B 1.00 4.48 1638.19 N
1 12.5 0 B 5.00 21.83 1680.96 Y 1680.96
1 12.5 0 B 5.00 19.35 1896.40 N
1 12.5 0 B 5.00 21.86 1678.65 Y 1678.65 1679.81 1.63
1 12.5 0 A 1.00 3.85 1906.25 y 1906.25
1 12.5 0 A 5.00 23.48 1562.84 N
1 12.5 0 A 5.00 19.38 1893.47 y 1893.47
1 12.5 0 A 5.00 18.23 2012.91 n
1 12.5 0 A 5.00 17.28 2123.58 n 1899.86 9.04
1 12.5 0 A 1.00 5.50 1334.38 N
1 12.5 0 A 5.00 25.11 1461.39 N
1 12.5 0 A 5.00 22.73 1614.40 Y 1614.40
1 12.5 0 A 5.00 21.48 1708.35 Y 1708.35 1661.38 66.43
2 12.5 0 B 5.00 15.50 2367.44 Y 2367.44
2 12.5 0 B 5.00 15.80 2322.49 Y 2322.49 2344.97 31.79
2 12.5 1 B 5.00 15.70 2337.29 Y 2337.29
2 12.5 1 B 5.00 15.00 2446.36 Y 2446.36 2391.82 77.13
2 12.5 2 B 5.00 14.80 2479.42 Y 2479.42
2 12.5 2 B 5.00 14.20 2584.18 Y 2584.18 2531.80 74.08
2 12.5 5 B 5.00 14.50 2530.72 Y 2530.72
2 12.5 5 B 5.00 16.20 2265.15 N
Vertical Infiltration Rates
10 mm Data Analysis
6/20/2014
Data removed as outlier Vertical Infiltration Results (in/hr)
Constants
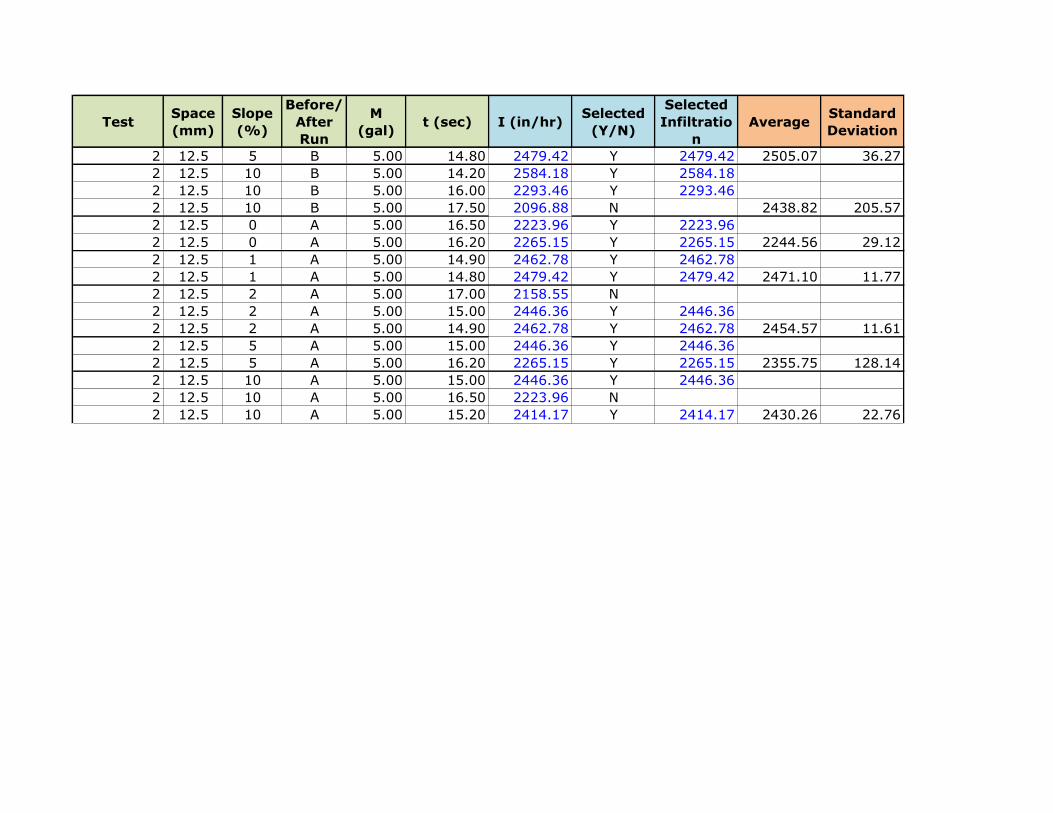
TestSpace
(mm)
Slope
(%)
Before/
After
Run
M
(gal)t (sec) I (in/hr)
Selected
(Y/N)
Selected
Infiltratio
n
AverageStandard
Deviation
2 12.5 5 B 5.00 14.80 2479.42 Y 2479.42 2505.07 36.27
2 12.5 10 B 5.00 14.20 2584.18 Y 2584.18
2 12.5 10 B 5.00 16.00 2293.46 Y 2293.46
2 12.5 10 B 5.00 17.50 2096.88 N 2438.82 205.57
2 12.5 0 A 5.00 16.50 2223.96 Y 2223.96
2 12.5 0 A 5.00 16.20 2265.15 Y 2265.15 2244.56 29.12
2 12.5 1 A 5.00 14.90 2462.78 Y 2462.78
2 12.5 1 A 5.00 14.80 2479.42 Y 2479.42 2471.10 11.77
2 12.5 2 A 5.00 17.00 2158.55 N
2 12.5 2 A 5.00 15.00 2446.36 Y 2446.36
2 12.5 2 A 5.00 14.90 2462.78 Y 2462.78 2454.57 11.61
2 12.5 5 A 5.00 15.00 2446.36 Y 2446.36
2 12.5 5 A 5.00 16.20 2265.15 Y 2265.15 2355.75 128.14
2 12.5 10 A 5.00 15.00 2446.36 Y 2446.36
2 12.5 10 A 5.00 16.50 2223.96 N
2 12.5 10 A 5.00 15.20 2414.17 Y 2414.17 2430.26 22.76

96
APPENDIX C
STORM INTENSITY TABLES
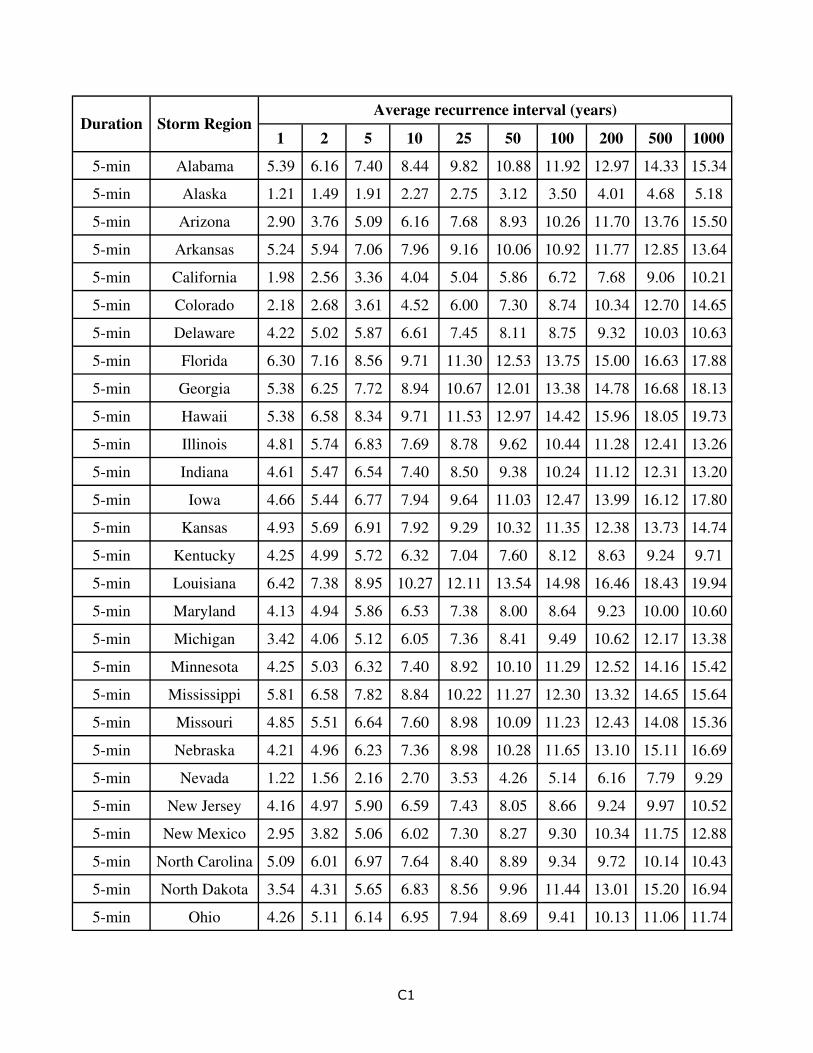
1 2 5 10 25 50 100 200 500 1000
5-min Alabama 5.39 6.16 7.40 8.44 9.82 10.88 11.92 12.97 14.33 15.34
5-min Alaska 1.21 1.49 1.91 2.27 2.75 3.12 3.50 4.01 4.68 5.18
5-min Arizona 2.90 3.76 5.09 6.16 7.68 8.93 10.26 11.70 13.76 15.50
5-min Arkansas 5.24 5.94 7.06 7.96 9.16 10.06 10.92 11.77 12.85 13.64
5-min California 1.98 2.56 3.36 4.04 5.04 5.86 6.72 7.68 9.06 10.21
5-min Colorado 2.18 2.68 3.61 4.52 6.00 7.30 8.74 10.34 12.70 14.65
5-min Delaware 4.22 5.02 5.87 6.61 7.45 8.11 8.75 9.32 10.03 10.63
5-min Florida 6.30 7.16 8.56 9.71 11.30 12.53 13.75 15.00 16.63 17.88
5-min Georgia 5.38 6.25 7.72 8.94 10.67 12.01 13.38 14.78 16.68 18.13
5-min Hawaii 5.38 6.58 8.34 9.71 11.53 12.97 14.42 15.96 18.05 19.73
5-min Illinois 4.81 5.74 6.83 7.69 8.78 9.62 10.44 11.28 12.41 13.26
5-min Indiana 4.61 5.47 6.54 7.40 8.50 9.38 10.24 11.12 12.31 13.20
5-min Iowa 4.66 5.44 6.77 7.94 9.64 11.03 12.47 13.99 16.12 17.80
5-min Kansas 4.93 5.69 6.91 7.92 9.29 10.32 11.35 12.38 13.73 14.74
5-min Kentucky 4.25 4.99 5.72 6.32 7.04 7.60 8.12 8.63 9.24 9.71
5-min Louisiana 6.42 7.38 8.95 10.27 12.11 13.54 14.98 16.46 18.43 19.94
5-min Maryland 4.13 4.94 5.86 6.53 7.38 8.00 8.64 9.23 10.00 10.60
5-min Michigan 3.42 4.06 5.12 6.05 7.36 8.41 9.49 10.62 12.17 13.38
5-min Minnesota 4.25 5.03 6.32 7.40 8.92 10.10 11.29 12.52 14.16 15.42
5-min Mississippi 5.81 6.58 7.82 8.84 10.22 11.27 12.30 13.32 14.65 15.64
5-min Missouri 4.85 5.51 6.64 7.60 8.98 10.09 11.23 12.43 14.08 15.36
5-min Nebraska 4.21 4.96 6.23 7.36 8.98 10.28 11.65 13.10 15.11 16.69
5-min Nevada 1.22 1.56 2.16 2.70 3.53 4.26 5.14 6.16 7.79 9.29
5-min New Jersey 4.16 4.97 5.90 6.59 7.43 8.05 8.66 9.24 9.97 10.52
5-min New Mexico 2.95 3.82 5.06 6.02 7.30 8.27 9.30 10.34 11.75 12.88
5-min North Carolina 5.09 6.01 6.97 7.64 8.40 8.89 9.34 9.72 10.14 10.43
5-min North Dakota 3.54 4.31 5.65 6.83 8.56 9.96 11.44 13.01 15.20 16.94
5-min Ohio 4.26 5.11 6.14 6.95 7.94 8.69 9.41 10.13 11.06 11.74
Duration Storm RegionAverage recurrence interval (years)
C1
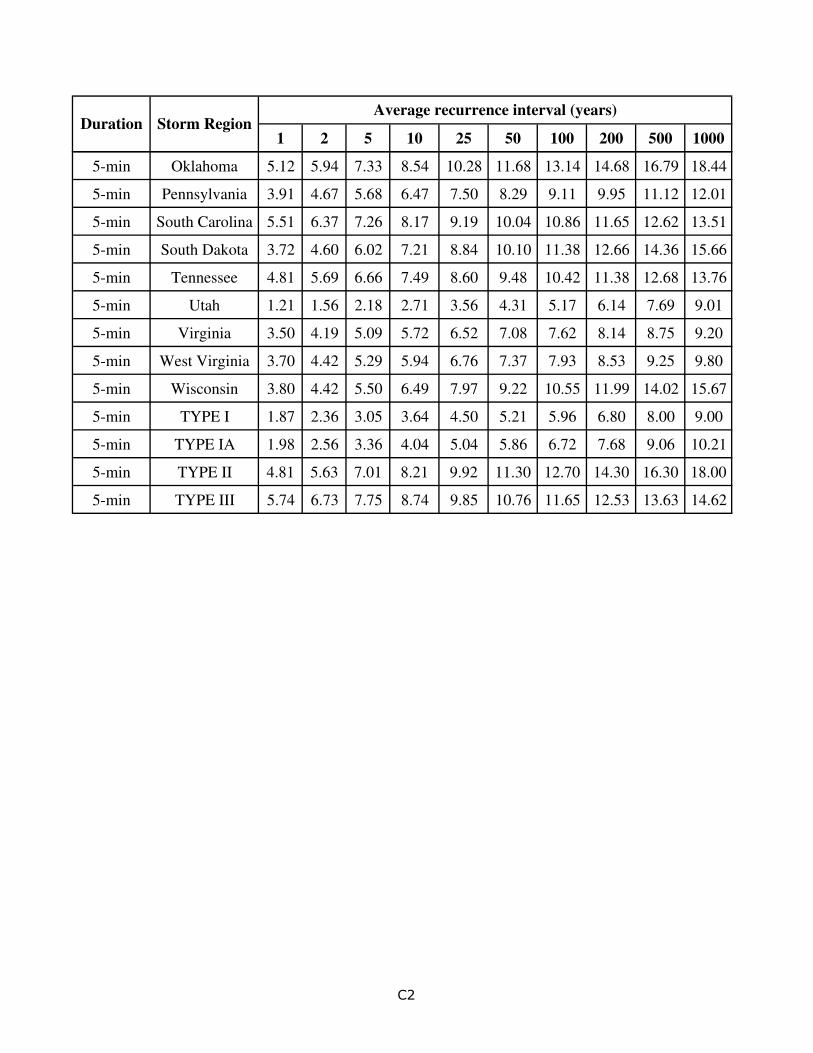
1 2 5 10 25 50 100 200 500 1000Duration Storm Region
Average recurrence interval (years)
5-min Oklahoma 5.12 5.94 7.33 8.54 10.28 11.68 13.14 14.68 16.79 18.44
5-min Pennsylvania 3.91 4.67 5.68 6.47 7.50 8.29 9.11 9.95 11.12 12.01
5-min South Carolina 5.51 6.37 7.26 8.17 9.19 10.04 10.86 11.65 12.62 13.51
5-min South Dakota 3.72 4.60 6.02 7.21 8.84 10.10 11.38 12.66 14.36 15.66
5-min Tennessee 4.81 5.69 6.66 7.49 8.60 9.48 10.42 11.38 12.68 13.76
5-min Utah 1.21 1.56 2.18 2.71 3.56 4.31 5.17 6.14 7.69 9.01
5-min Virginia 3.50 4.19 5.09 5.72 6.52 7.08 7.62 8.14 8.75 9.20
5-min West Virginia 3.70 4.42 5.29 5.94 6.76 7.37 7.93 8.53 9.25 9.80
5-min Wisconsin 3.80 4.42 5.50 6.49 7.97 9.22 10.55 11.99 14.02 15.67
5-min TYPE I 1.87 2.36 3.05 3.64 4.50 5.21 5.96 6.80 8.00 9.00
5-min TYPE IA 1.98 2.56 3.36 4.04 5.04 5.86 6.72 7.68 9.06 10.21
5-min TYPE II 4.81 5.63 7.01 8.21 9.92 11.30 12.70 14.30 16.30 18.00
5-min TYPE III 5.74 6.73 7.75 8.74 9.85 10.76 11.65 12.53 13.63 14.62
C2
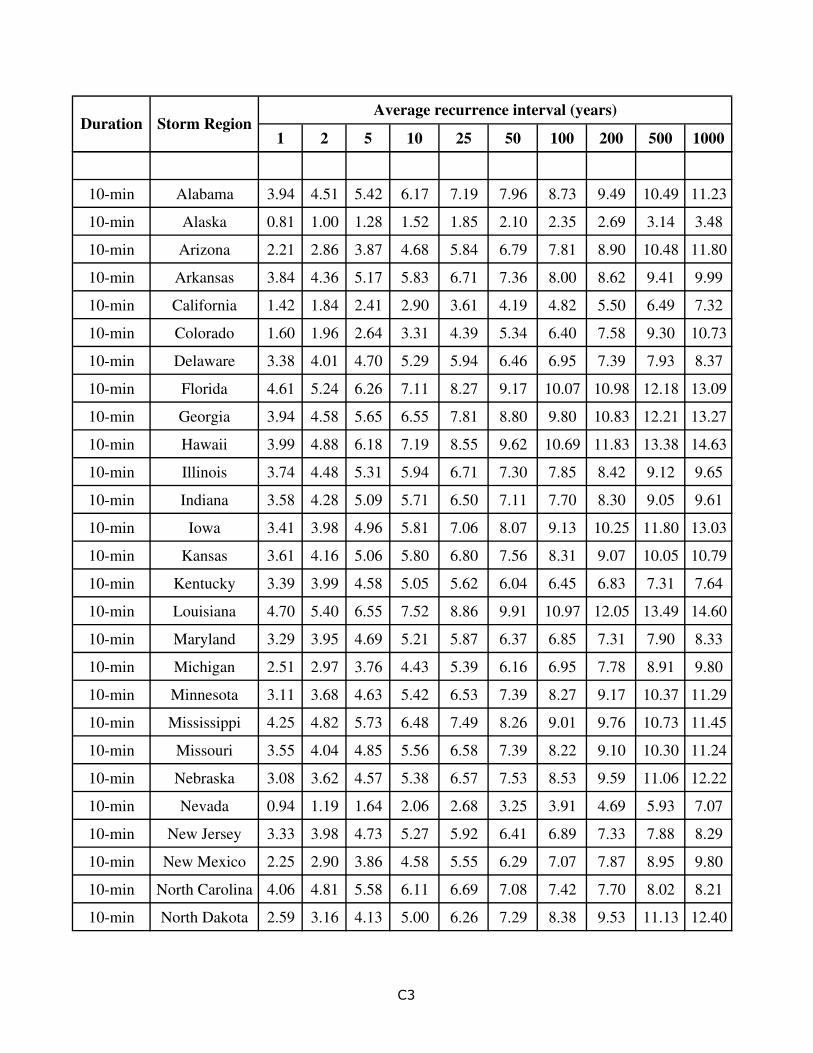
1 2 5 10 25 50 100 200 500 1000Duration Storm Region
Average recurrence interval (years)
10-min Alabama 3.94 4.51 5.42 6.17 7.19 7.96 8.73 9.49 10.49 11.23
10-min Alaska 0.81 1.00 1.28 1.52 1.85 2.10 2.35 2.69 3.14 3.48
10-min Arizona 2.21 2.86 3.87 4.68 5.84 6.79 7.81 8.90 10.48 11.80
10-min Arkansas 3.84 4.36 5.17 5.83 6.71 7.36 8.00 8.62 9.41 9.99
10-min California 1.42 1.84 2.41 2.90 3.61 4.19 4.82 5.50 6.49 7.32
10-min Colorado 1.60 1.96 2.64 3.31 4.39 5.34 6.40 7.58 9.30 10.73
10-min Delaware 3.38 4.01 4.70 5.29 5.94 6.46 6.95 7.39 7.93 8.37
10-min Florida 4.61 5.24 6.26 7.11 8.27 9.17 10.07 10.98 12.18 13.09
10-min Georgia 3.94 4.58 5.65 6.55 7.81 8.80 9.80 10.83 12.21 13.27
10-min Hawaii 3.99 4.88 6.18 7.19 8.55 9.62 10.69 11.83 13.38 14.63
10-min Illinois 3.74 4.48 5.31 5.94 6.71 7.30 7.85 8.42 9.12 9.65
10-min Indiana 3.58 4.28 5.09 5.71 6.50 7.11 7.70 8.30 9.05 9.61
10-min Iowa 3.41 3.98 4.96 5.81 7.06 8.07 9.13 10.25 11.80 13.03
10-min Kansas 3.61 4.16 5.06 5.80 6.80 7.56 8.31 9.07 10.05 10.79
10-min Kentucky 3.39 3.99 4.58 5.05 5.62 6.04 6.45 6.83 7.31 7.64
10-min Louisiana 4.70 5.40 6.55 7.52 8.86 9.91 10.97 12.05 13.49 14.60
10-min Maryland 3.29 3.95 4.69 5.21 5.87 6.37 6.85 7.31 7.90 8.33
10-min Michigan 2.51 2.97 3.76 4.43 5.39 6.16 6.95 7.78 8.91 9.80
10-min Minnesota 3.11 3.68 4.63 5.42 6.53 7.39 8.27 9.17 10.37 11.29
10-min Mississippi 4.25 4.82 5.73 6.48 7.49 8.26 9.01 9.76 10.73 11.45
10-min Missouri 3.55 4.04 4.85 5.56 6.58 7.39 8.22 9.10 10.30 11.24
10-min Nebraska 3.08 3.62 4.57 5.38 6.57 7.53 8.53 9.59 11.06 12.22
10-min Nevada 0.94 1.19 1.64 2.06 2.68 3.25 3.91 4.69 5.93 7.07
10-min New Jersey 3.33 3.98 4.73 5.27 5.92 6.41 6.89 7.33 7.88 8.29
10-min New Mexico 2.25 2.90 3.86 4.58 5.55 6.29 7.07 7.87 8.95 9.80
10-min North Carolina 4.06 4.81 5.58 6.11 6.69 7.08 7.42 7.70 8.02 8.21
10-min North Dakota 2.59 3.16 4.13 5.00 6.26 7.29 8.38 9.53 11.13 12.40
C3
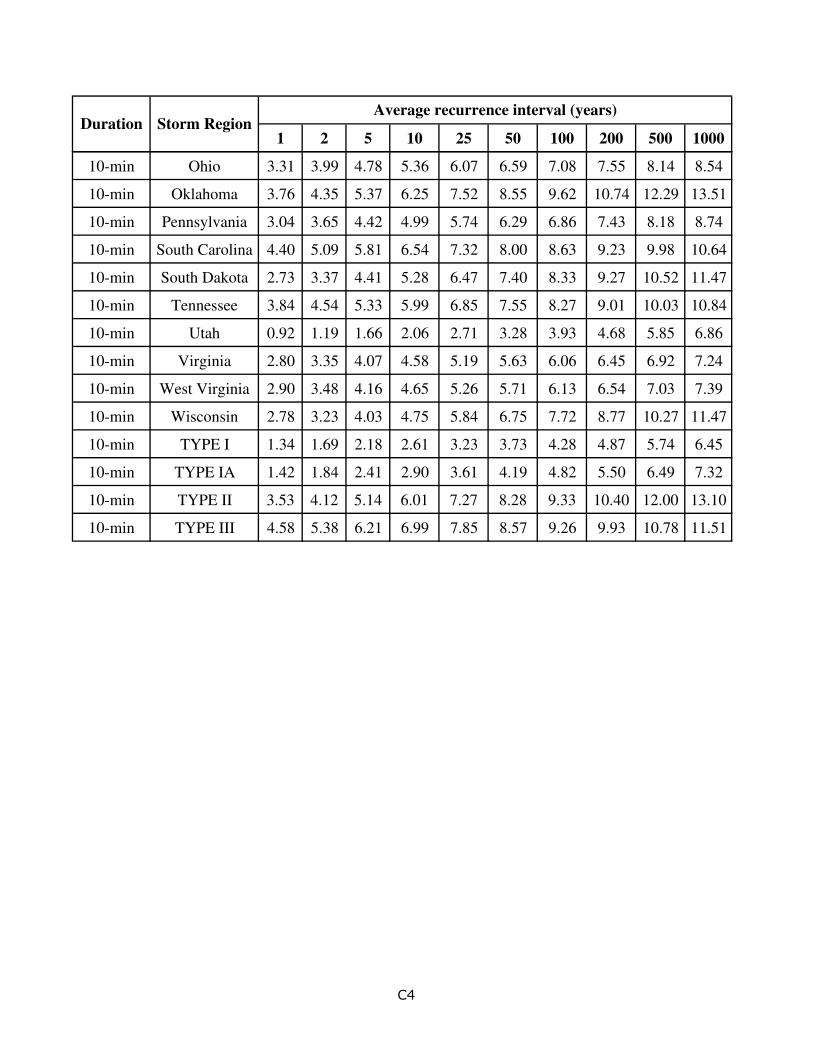
1 2 5 10 25 50 100 200 500 1000Duration Storm Region
Average recurrence interval (years)
10-min Ohio 3.31 3.99 4.78 5.36 6.07 6.59 7.08 7.55 8.14 8.54
10-min Oklahoma 3.76 4.35 5.37 6.25 7.52 8.55 9.62 10.74 12.29 13.51
10-min Pennsylvania 3.04 3.65 4.42 4.99 5.74 6.29 6.86 7.43 8.18 8.74
10-min South Carolina 4.40 5.09 5.81 6.54 7.32 8.00 8.63 9.23 9.98 10.64
10-min South Dakota 2.73 3.37 4.41 5.28 6.47 7.40 8.33 9.27 10.52 11.47
10-min Tennessee 3.84 4.54 5.33 5.99 6.85 7.55 8.27 9.01 10.03 10.84
10-min Utah 0.92 1.19 1.66 2.06 2.71 3.28 3.93 4.68 5.85 6.86
10-min Virginia 2.80 3.35 4.07 4.58 5.19 5.63 6.06 6.45 6.92 7.24
10-min West Virginia 2.90 3.48 4.16 4.65 5.26 5.71 6.13 6.54 7.03 7.39
10-min Wisconsin 2.78 3.23 4.03 4.75 5.84 6.75 7.72 8.77 10.27 11.47
10-min TYPE I 1.34 1.69 2.18 2.61 3.23 3.73 4.28 4.87 5.74 6.45
10-min TYPE IA 1.42 1.84 2.41 2.90 3.61 4.19 4.82 5.50 6.49 7.32
10-min TYPE II 3.53 4.12 5.14 6.01 7.27 8.28 9.33 10.40 12.00 13.10
10-min TYPE III 4.58 5.38 6.21 6.99 7.85 8.57 9.26 9.93 10.78 11.51
C4
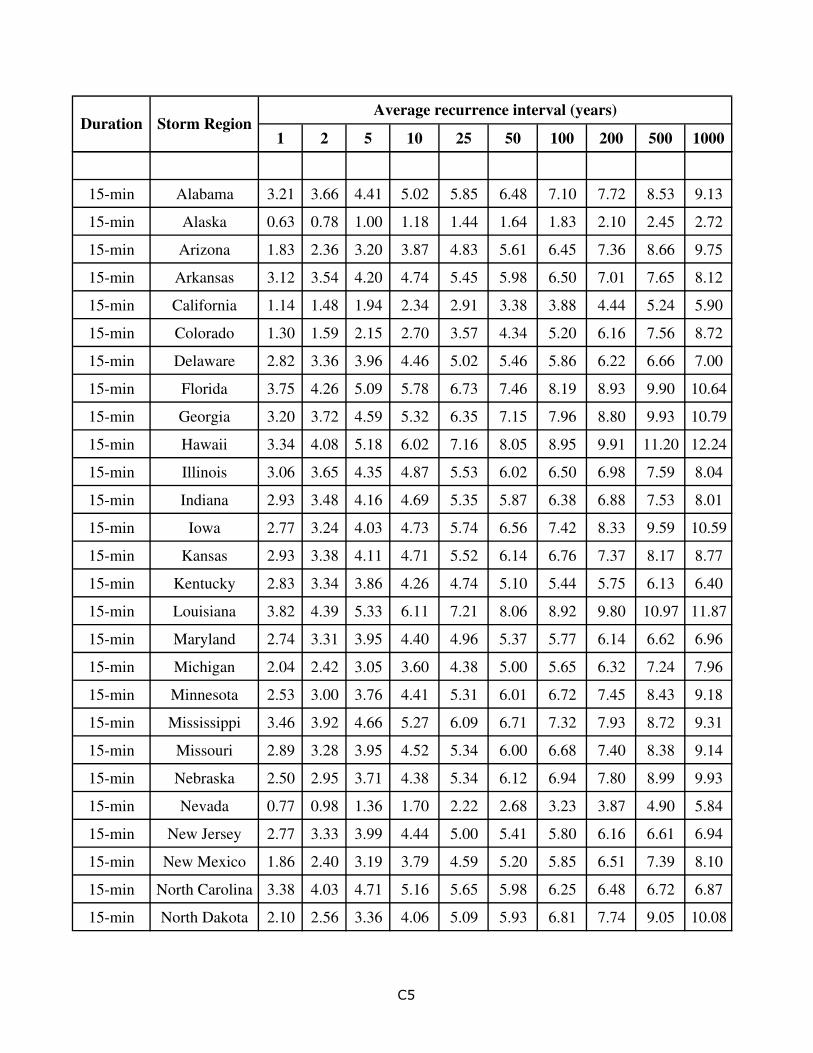
1 2 5 10 25 50 100 200 500 1000Duration Storm Region
Average recurrence interval (years)
15-min Alabama 3.21 3.66 4.41 5.02 5.85 6.48 7.10 7.72 8.53 9.13
15-min Alaska 0.63 0.78 1.00 1.18 1.44 1.64 1.83 2.10 2.45 2.72
15-min Arizona 1.83 2.36 3.20 3.87 4.83 5.61 6.45 7.36 8.66 9.75
15-min Arkansas 3.12 3.54 4.20 4.74 5.45 5.98 6.50 7.01 7.65 8.12
15-min California 1.14 1.48 1.94 2.34 2.91 3.38 3.88 4.44 5.24 5.90
15-min Colorado 1.30 1.59 2.15 2.70 3.57 4.34 5.20 6.16 7.56 8.72
15-min Delaware 2.82 3.36 3.96 4.46 5.02 5.46 5.86 6.22 6.66 7.00
15-min Florida 3.75 4.26 5.09 5.78 6.73 7.46 8.19 8.93 9.90 10.64
15-min Georgia 3.20 3.72 4.59 5.32 6.35 7.15 7.96 8.80 9.93 10.79
15-min Hawaii 3.34 4.08 5.18 6.02 7.16 8.05 8.95 9.91 11.20 12.24
15-min Illinois 3.06 3.65 4.35 4.87 5.53 6.02 6.50 6.98 7.59 8.04
15-min Indiana 2.93 3.48 4.16 4.69 5.35 5.87 6.38 6.88 7.53 8.01
15-min Iowa 2.77 3.24 4.03 4.73 5.74 6.56 7.42 8.33 9.59 10.59
15-min Kansas 2.93 3.38 4.11 4.71 5.52 6.14 6.76 7.37 8.17 8.77
15-min Kentucky 2.83 3.34 3.86 4.26 4.74 5.10 5.44 5.75 6.13 6.40
15-min Louisiana 3.82 4.39 5.33 6.11 7.21 8.06 8.92 9.80 10.97 11.87
15-min Maryland 2.74 3.31 3.95 4.40 4.96 5.37 5.77 6.14 6.62 6.96
15-min Michigan 2.04 2.42 3.05 3.60 4.38 5.00 5.65 6.32 7.24 7.96
15-min Minnesota 2.53 3.00 3.76 4.41 5.31 6.01 6.72 7.45 8.43 9.18
15-min Mississippi 3.46 3.92 4.66 5.27 6.09 6.71 7.32 7.93 8.72 9.31
15-min Missouri 2.89 3.28 3.95 4.52 5.34 6.00 6.68 7.40 8.38 9.14
15-min Nebraska 2.50 2.95 3.71 4.38 5.34 6.12 6.94 7.80 8.99 9.93
15-min Nevada 0.77 0.98 1.36 1.70 2.22 2.68 3.23 3.87 4.90 5.84
15-min New Jersey 2.77 3.33 3.99 4.44 5.00 5.41 5.80 6.16 6.61 6.94
15-min New Mexico 1.86 2.40 3.19 3.79 4.59 5.20 5.85 6.51 7.39 8.10
15-min North Carolina 3.38 4.03 4.71 5.16 5.65 5.98 6.25 6.48 6.72 6.87
15-min North Dakota 2.10 2.56 3.36 4.06 5.09 5.93 6.81 7.74 9.05 10.08
C5
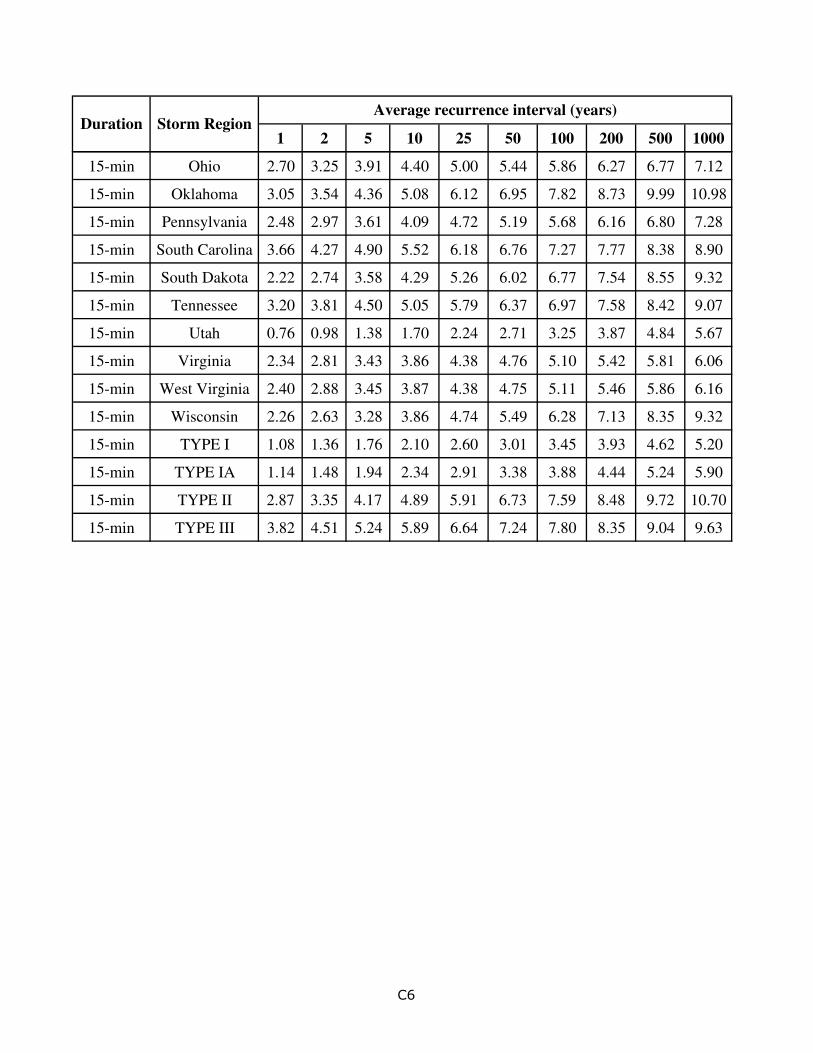
1 2 5 10 25 50 100 200 500 1000Duration Storm Region
Average recurrence interval (years)
15-min Ohio 2.70 3.25 3.91 4.40 5.00 5.44 5.86 6.27 6.77 7.12
15-min Oklahoma 3.05 3.54 4.36 5.08 6.12 6.95 7.82 8.73 9.99 10.98
15-min Pennsylvania 2.48 2.97 3.61 4.09 4.72 5.19 5.68 6.16 6.80 7.28
15-min South Carolina 3.66 4.27 4.90 5.52 6.18 6.76 7.27 7.77 8.38 8.90
15-min South Dakota 2.22 2.74 3.58 4.29 5.26 6.02 6.77 7.54 8.55 9.32
15-min Tennessee 3.20 3.81 4.50 5.05 5.79 6.37 6.97 7.58 8.42 9.07
15-min Utah 0.76 0.98 1.38 1.70 2.24 2.71 3.25 3.87 4.84 5.67
15-min Virginia 2.34 2.81 3.43 3.86 4.38 4.76 5.10 5.42 5.81 6.06
15-min West Virginia 2.40 2.88 3.45 3.87 4.38 4.75 5.11 5.46 5.86 6.16
15-min Wisconsin 2.26 2.63 3.28 3.86 4.74 5.49 6.28 7.13 8.35 9.32
15-min TYPE I 1.08 1.36 1.76 2.10 2.60 3.01 3.45 3.93 4.62 5.20
15-min TYPE IA 1.14 1.48 1.94 2.34 2.91 3.38 3.88 4.44 5.24 5.90
15-min TYPE II 2.87 3.35 4.17 4.89 5.91 6.73 7.59 8.48 9.72 10.70
15-min TYPE III 3.82 4.51 5.24 5.89 6.64 7.24 7.80 8.35 9.04 9.63
C6
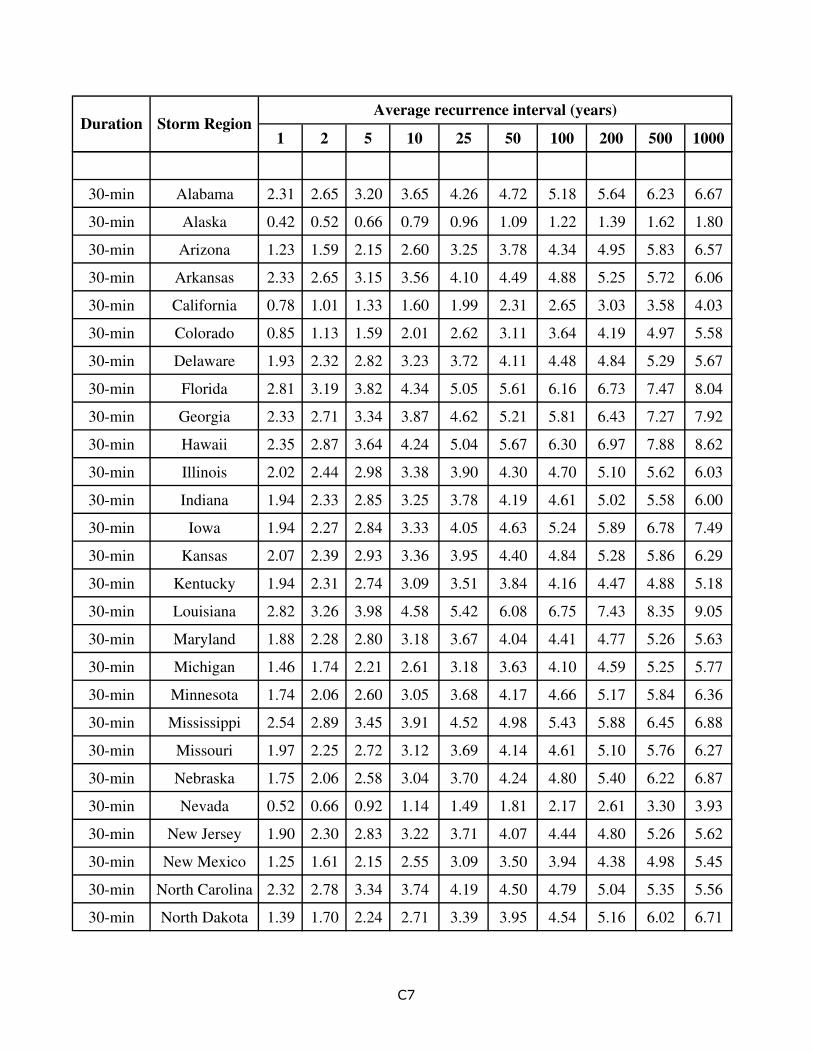
1 2 5 10 25 50 100 200 500 1000Duration Storm Region
Average recurrence interval (years)
30-min Alabama 2.31 2.65 3.20 3.65 4.26 4.72 5.18 5.64 6.23 6.67
30-min Alaska 0.42 0.52 0.66 0.79 0.96 1.09 1.22 1.39 1.62 1.80
30-min Arizona 1.23 1.59 2.15 2.60 3.25 3.78 4.34 4.95 5.83 6.57
30-min Arkansas 2.33 2.65 3.15 3.56 4.10 4.49 4.88 5.25 5.72 6.06
30-min California 0.78 1.01 1.33 1.60 1.99 2.31 2.65 3.03 3.58 4.03
30-min Colorado 0.85 1.13 1.59 2.01 2.62 3.11 3.64 4.19 4.97 5.58
30-min Delaware 1.93 2.32 2.82 3.23 3.72 4.11 4.48 4.84 5.29 5.67
30-min Florida 2.81 3.19 3.82 4.34 5.05 5.61 6.16 6.73 7.47 8.04
30-min Georgia 2.33 2.71 3.34 3.87 4.62 5.21 5.81 6.43 7.27 7.92
30-min Hawaii 2.35 2.87 3.64 4.24 5.04 5.67 6.30 6.97 7.88 8.62
30-min Illinois 2.02 2.44 2.98 3.38 3.90 4.30 4.70 5.10 5.62 6.03
30-min Indiana 1.94 2.33 2.85 3.25 3.78 4.19 4.61 5.02 5.58 6.00
30-min Iowa 1.94 2.27 2.84 3.33 4.05 4.63 5.24 5.89 6.78 7.49
30-min Kansas 2.07 2.39 2.93 3.36 3.95 4.40 4.84 5.28 5.86 6.29
30-min Kentucky 1.94 2.31 2.74 3.09 3.51 3.84 4.16 4.47 4.88 5.18
30-min Louisiana 2.82 3.26 3.98 4.58 5.42 6.08 6.75 7.43 8.35 9.05
30-min Maryland 1.88 2.28 2.80 3.18 3.67 4.04 4.41 4.77 5.26 5.63
30-min Michigan 1.46 1.74 2.21 2.61 3.18 3.63 4.10 4.59 5.25 5.77
30-min Minnesota 1.74 2.06 2.60 3.05 3.68 4.17 4.66 5.17 5.84 6.36
30-min Mississippi 2.54 2.89 3.45 3.91 4.52 4.98 5.43 5.88 6.45 6.88
30-min Missouri 1.97 2.25 2.72 3.12 3.69 4.14 4.61 5.10 5.76 6.27
30-min Nebraska 1.75 2.06 2.58 3.04 3.70 4.24 4.80 5.40 6.22 6.87
30-min Nevada 0.52 0.66 0.92 1.14 1.49 1.81 2.17 2.61 3.30 3.93
30-min New Jersey 1.90 2.30 2.83 3.22 3.71 4.07 4.44 4.80 5.26 5.62
30-min New Mexico 1.25 1.61 2.15 2.55 3.09 3.50 3.94 4.38 4.98 5.45
30-min North Carolina 2.32 2.78 3.34 3.74 4.19 4.50 4.79 5.04 5.35 5.56
30-min North Dakota 1.39 1.70 2.24 2.71 3.39 3.95 4.54 5.16 6.02 6.71
C7
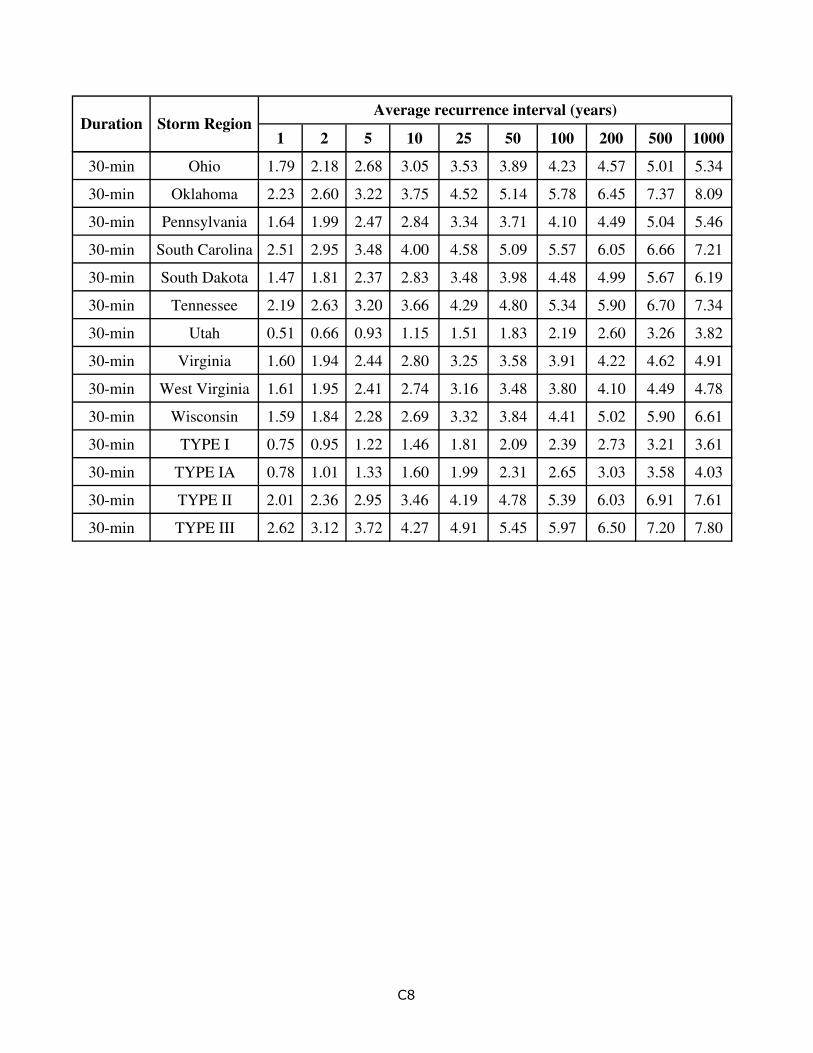
1 2 5 10 25 50 100 200 500 1000Duration Storm Region
Average recurrence interval (years)
30-min Ohio 1.79 2.18 2.68 3.05 3.53 3.89 4.23 4.57 5.01 5.34
30-min Oklahoma 2.23 2.60 3.22 3.75 4.52 5.14 5.78 6.45 7.37 8.09
30-min Pennsylvania 1.64 1.99 2.47 2.84 3.34 3.71 4.10 4.49 5.04 5.46
30-min South Carolina 2.51 2.95 3.48 4.00 4.58 5.09 5.57 6.05 6.66 7.21
30-min South Dakota 1.47 1.81 2.37 2.83 3.48 3.98 4.48 4.99 5.67 6.19
30-min Tennessee 2.19 2.63 3.20 3.66 4.29 4.80 5.34 5.90 6.70 7.34
30-min Utah 0.51 0.66 0.93 1.15 1.51 1.83 2.19 2.60 3.26 3.82
30-min Virginia 1.60 1.94 2.44 2.80 3.25 3.58 3.91 4.22 4.62 4.91
30-min West Virginia 1.61 1.95 2.41 2.74 3.16 3.48 3.80 4.10 4.49 4.78
30-min Wisconsin 1.59 1.84 2.28 2.69 3.32 3.84 4.41 5.02 5.90 6.61
30-min TYPE I 0.75 0.95 1.22 1.46 1.81 2.09 2.39 2.73 3.21 3.61
30-min TYPE IA 0.78 1.01 1.33 1.60 1.99 2.31 2.65 3.03 3.58 4.03
30-min TYPE II 2.01 2.36 2.95 3.46 4.19 4.78 5.39 6.03 6.91 7.61
30-min TYPE III 2.62 3.12 3.72 4.27 4.91 5.45 5.97 6.50 7.20 7.80
C8
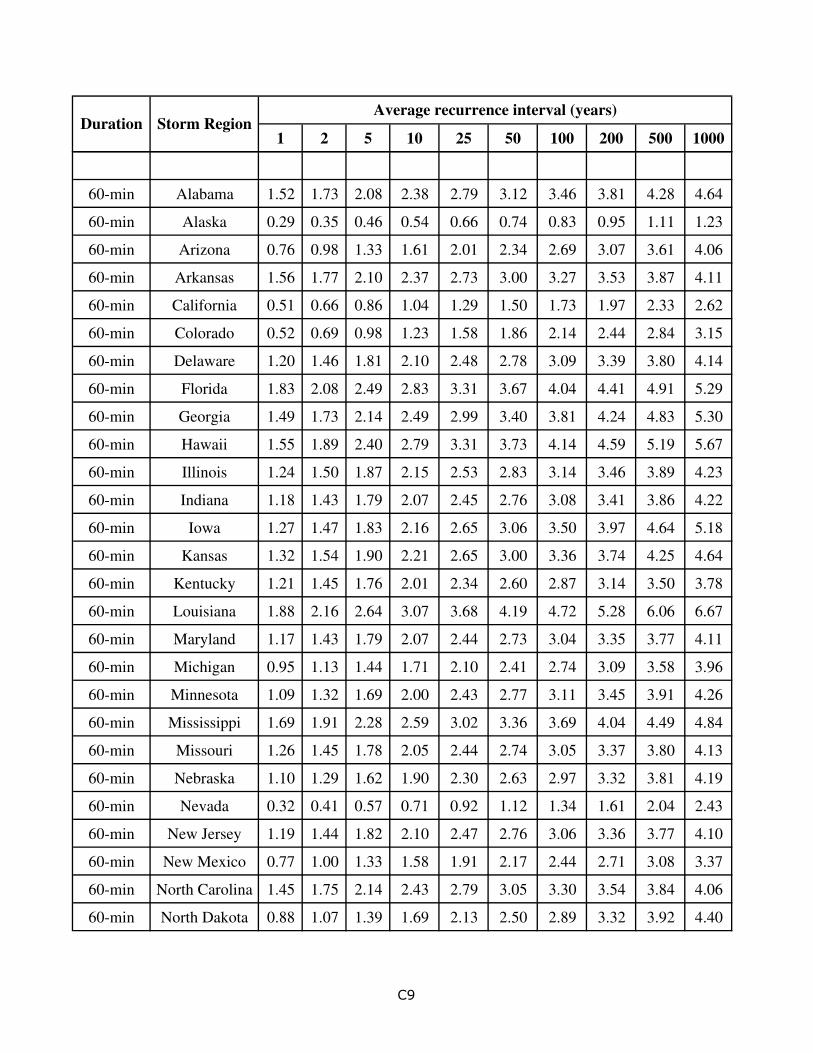
1 2 5 10 25 50 100 200 500 1000Duration Storm Region
Average recurrence interval (years)
60-min Alabama 1.52 1.73 2.08 2.38 2.79 3.12 3.46 3.81 4.28 4.64
60-min Alaska 0.29 0.35 0.46 0.54 0.66 0.74 0.83 0.95 1.11 1.23
60-min Arizona 0.76 0.98 1.33 1.61 2.01 2.34 2.69 3.07 3.61 4.06
60-min Arkansas 1.56 1.77 2.10 2.37 2.73 3.00 3.27 3.53 3.87 4.11
60-min California 0.51 0.66 0.86 1.04 1.29 1.50 1.73 1.97 2.33 2.62
60-min Colorado 0.52 0.69 0.98 1.23 1.58 1.86 2.14 2.44 2.84 3.15
60-min Delaware 1.20 1.46 1.81 2.10 2.48 2.78 3.09 3.39 3.80 4.14
60-min Florida 1.83 2.08 2.49 2.83 3.31 3.67 4.04 4.41 4.91 5.29
60-min Georgia 1.49 1.73 2.14 2.49 2.99 3.40 3.81 4.24 4.83 5.30
60-min Hawaii 1.55 1.89 2.40 2.79 3.31 3.73 4.14 4.59 5.19 5.67
60-min Illinois 1.24 1.50 1.87 2.15 2.53 2.83 3.14 3.46 3.89 4.23
60-min Indiana 1.18 1.43 1.79 2.07 2.45 2.76 3.08 3.41 3.86 4.22
60-min Iowa 1.27 1.47 1.83 2.16 2.65 3.06 3.50 3.97 4.64 5.18
60-min Kansas 1.32 1.54 1.90 2.21 2.65 3.00 3.36 3.74 4.25 4.64
60-min Kentucky 1.21 1.45 1.76 2.01 2.34 2.60 2.87 3.14 3.50 3.78
60-min Louisiana 1.88 2.16 2.64 3.07 3.68 4.19 4.72 5.28 6.06 6.67
60-min Maryland 1.17 1.43 1.79 2.07 2.44 2.73 3.04 3.35 3.77 4.11
60-min Michigan 0.95 1.13 1.44 1.71 2.10 2.41 2.74 3.09 3.58 3.96
60-min Minnesota 1.09 1.32 1.69 2.00 2.43 2.77 3.11 3.45 3.91 4.26
60-min Mississippi 1.69 1.91 2.28 2.59 3.02 3.36 3.69 4.04 4.49 4.84
60-min Missouri 1.26 1.45 1.78 2.05 2.44 2.74 3.05 3.37 3.80 4.13
60-min Nebraska 1.10 1.29 1.62 1.90 2.30 2.63 2.97 3.32 3.81 4.19
60-min Nevada 0.32 0.41 0.57 0.71 0.92 1.12 1.34 1.61 2.04 2.43
60-min New Jersey 1.19 1.44 1.82 2.10 2.47 2.76 3.06 3.36 3.77 4.10
60-min New Mexico 0.77 1.00 1.33 1.58 1.91 2.17 2.44 2.71 3.08 3.37
60-min North Carolina 1.45 1.75 2.14 2.43 2.79 3.05 3.30 3.54 3.84 4.06
60-min North Dakota 0.88 1.07 1.39 1.69 2.13 2.50 2.89 3.32 3.92 4.40
C9
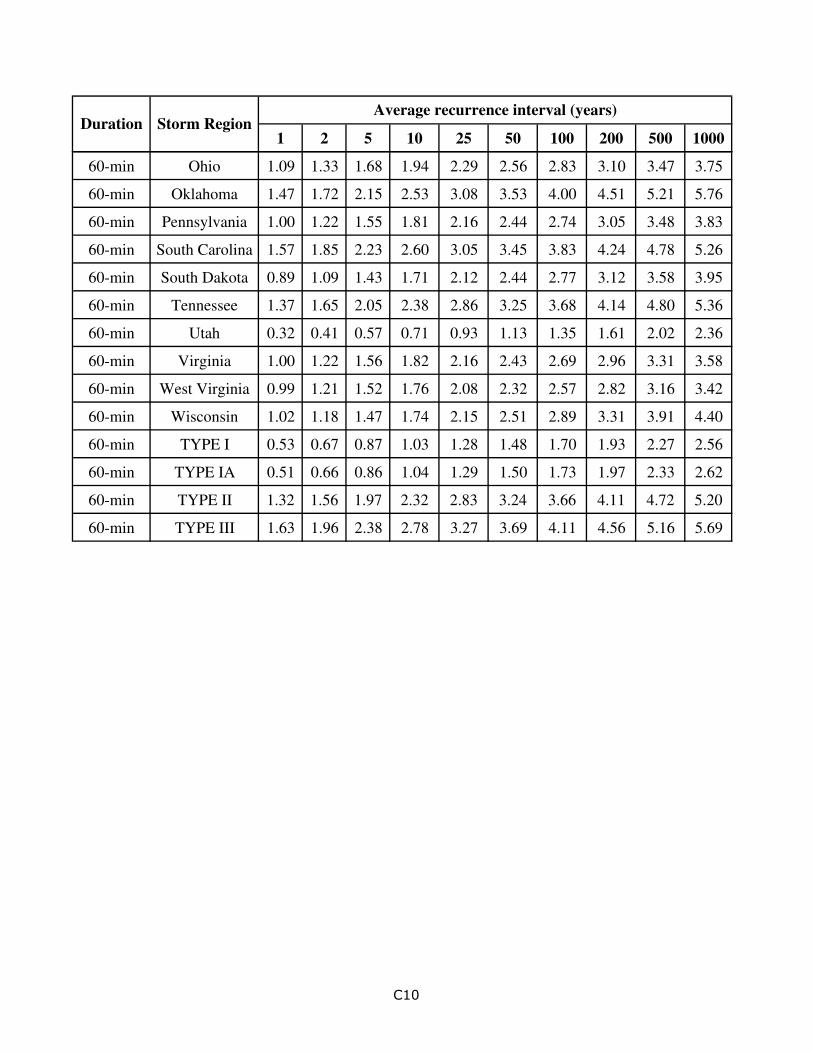
1 2 5 10 25 50 100 200 500 1000Duration Storm Region
Average recurrence interval (years)
60-min Ohio 1.09 1.33 1.68 1.94 2.29 2.56 2.83 3.10 3.47 3.75
60-min Oklahoma 1.47 1.72 2.15 2.53 3.08 3.53 4.00 4.51 5.21 5.76
60-min Pennsylvania 1.00 1.22 1.55 1.81 2.16 2.44 2.74 3.05 3.48 3.83
60-min South Carolina 1.57 1.85 2.23 2.60 3.05 3.45 3.83 4.24 4.78 5.26
60-min South Dakota 0.89 1.09 1.43 1.71 2.12 2.44 2.77 3.12 3.58 3.95
60-min Tennessee 1.37 1.65 2.05 2.38 2.86 3.25 3.68 4.14 4.80 5.36
60-min Utah 0.32 0.41 0.57 0.71 0.93 1.13 1.35 1.61 2.02 2.36
60-min Virginia 1.00 1.22 1.56 1.82 2.16 2.43 2.69 2.96 3.31 3.58
60-min West Virginia 0.99 1.21 1.52 1.76 2.08 2.32 2.57 2.82 3.16 3.42
60-min Wisconsin 1.02 1.18 1.47 1.74 2.15 2.51 2.89 3.31 3.91 4.40
60-min TYPE I 0.53 0.67 0.87 1.03 1.28 1.48 1.70 1.93 2.27 2.56
60-min TYPE IA 0.51 0.66 0.86 1.04 1.29 1.50 1.73 1.97 2.33 2.62
60-min TYPE II 1.32 1.56 1.97 2.32 2.83 3.24 3.66 4.11 4.72 5.20
60-min TYPE III 1.63 1.96 2.38 2.78 3.27 3.69 4.11 4.56 5.16 5.69
C10
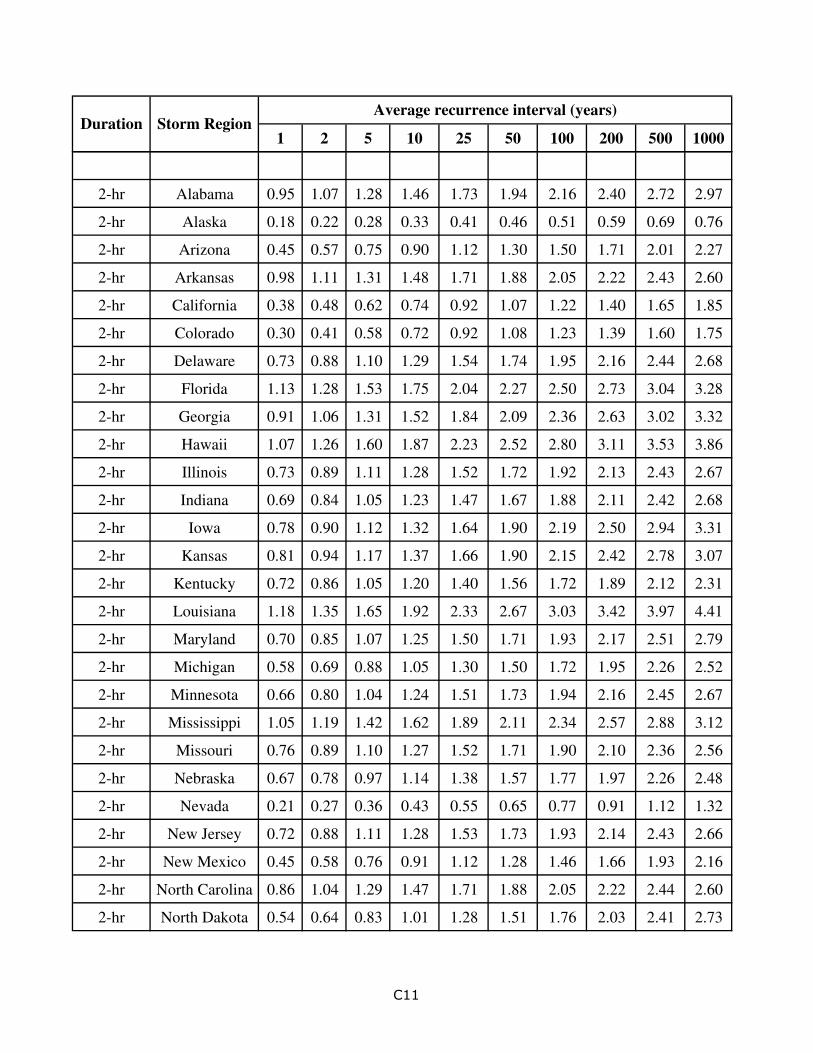
1 2 5 10 25 50 100 200 500 1000Duration Storm Region
Average recurrence interval (years)
2-hr Alabama 0.95 1.07 1.28 1.46 1.73 1.94 2.16 2.40 2.72 2.97
2-hr Alaska 0.18 0.22 0.28 0.33 0.41 0.46 0.51 0.59 0.69 0.76
2-hr Arizona 0.45 0.57 0.75 0.90 1.12 1.30 1.50 1.71 2.01 2.27
2-hr Arkansas 0.98 1.11 1.31 1.48 1.71 1.88 2.05 2.22 2.43 2.60
2-hr California 0.38 0.48 0.62 0.74 0.92 1.07 1.22 1.40 1.65 1.85
2-hr Colorado 0.30 0.41 0.58 0.72 0.92 1.08 1.23 1.39 1.60 1.75
2-hr Delaware 0.73 0.88 1.10 1.29 1.54 1.74 1.95 2.16 2.44 2.68
2-hr Florida 1.13 1.28 1.53 1.75 2.04 2.27 2.50 2.73 3.04 3.28
2-hr Georgia 0.91 1.06 1.31 1.52 1.84 2.09 2.36 2.63 3.02 3.32
2-hr Hawaii 1.07 1.26 1.60 1.87 2.23 2.52 2.80 3.11 3.53 3.86
2-hr Illinois 0.73 0.89 1.11 1.28 1.52 1.72 1.92 2.13 2.43 2.67
2-hr Indiana 0.69 0.84 1.05 1.23 1.47 1.67 1.88 2.11 2.42 2.68
2-hr Iowa 0.78 0.90 1.12 1.32 1.64 1.90 2.19 2.50 2.94 3.31
2-hr Kansas 0.81 0.94 1.17 1.37 1.66 1.90 2.15 2.42 2.78 3.07
2-hr Kentucky 0.72 0.86 1.05 1.20 1.40 1.56 1.72 1.89 2.12 2.31
2-hr Louisiana 1.18 1.35 1.65 1.92 2.33 2.67 3.03 3.42 3.97 4.41
2-hr Maryland 0.70 0.85 1.07 1.25 1.50 1.71 1.93 2.17 2.51 2.79
2-hr Michigan 0.58 0.69 0.88 1.05 1.30 1.50 1.72 1.95 2.26 2.52
2-hr Minnesota 0.66 0.80 1.04 1.24 1.51 1.73 1.94 2.16 2.45 2.67
2-hr Mississippi 1.05 1.19 1.42 1.62 1.89 2.11 2.34 2.57 2.88 3.12
2-hr Missouri 0.76 0.89 1.10 1.27 1.52 1.71 1.90 2.10 2.36 2.56
2-hr Nebraska 0.67 0.78 0.97 1.14 1.38 1.57 1.77 1.97 2.26 2.48
2-hr Nevada 0.21 0.27 0.36 0.43 0.55 0.65 0.77 0.91 1.12 1.32
2-hr New Jersey 0.72 0.88 1.11 1.28 1.53 1.73 1.93 2.14 2.43 2.66
2-hr New Mexico 0.45 0.58 0.76 0.91 1.12 1.28 1.46 1.66 1.93 2.16
2-hr North Carolina 0.86 1.04 1.29 1.47 1.71 1.88 2.05 2.22 2.44 2.60
2-hr North Dakota 0.54 0.64 0.83 1.01 1.28 1.51 1.76 2.03 2.41 2.73
C11
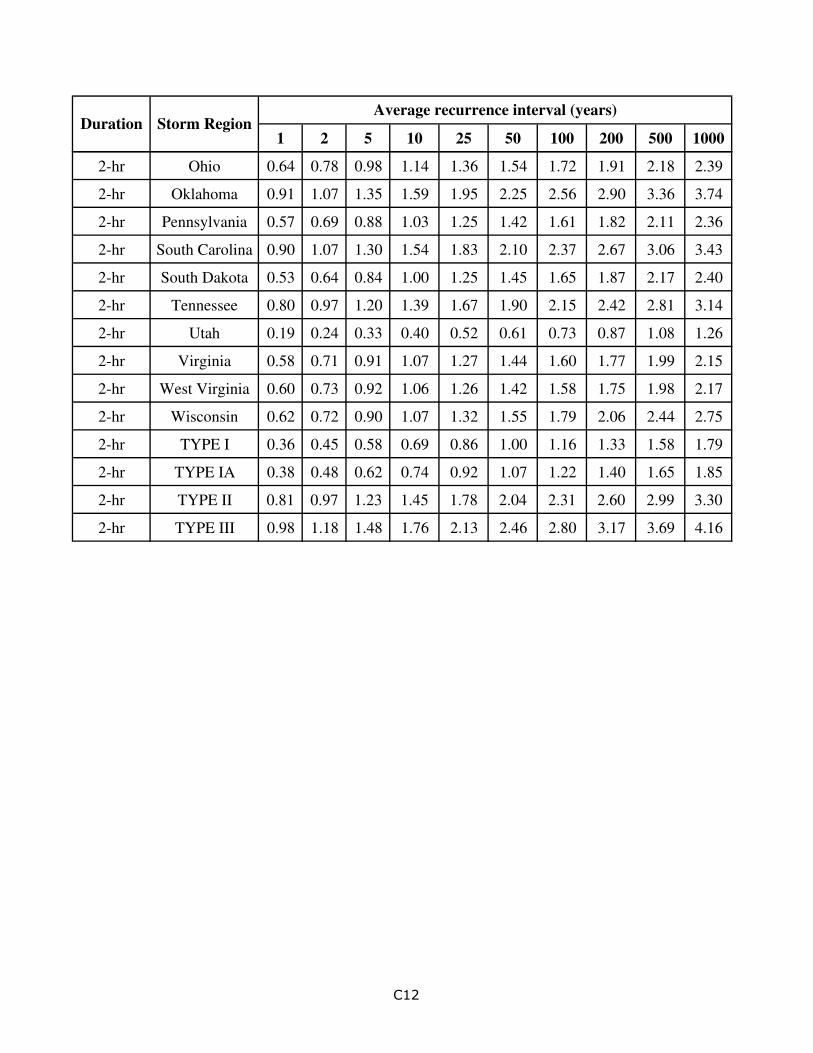
1 2 5 10 25 50 100 200 500 1000Duration Storm Region
Average recurrence interval (years)
2-hr Ohio 0.64 0.78 0.98 1.14 1.36 1.54 1.72 1.91 2.18 2.39
2-hr Oklahoma 0.91 1.07 1.35 1.59 1.95 2.25 2.56 2.90 3.36 3.74
2-hr Pennsylvania 0.57 0.69 0.88 1.03 1.25 1.42 1.61 1.82 2.11 2.36
2-hr South Carolina 0.90 1.07 1.30 1.54 1.83 2.10 2.37 2.67 3.06 3.43
2-hr South Dakota 0.53 0.64 0.84 1.00 1.25 1.45 1.65 1.87 2.17 2.40
2-hr Tennessee 0.80 0.97 1.20 1.39 1.67 1.90 2.15 2.42 2.81 3.14
2-hr Utah 0.19 0.24 0.33 0.40 0.52 0.61 0.73 0.87 1.08 1.26
2-hr Virginia 0.58 0.71 0.91 1.07 1.27 1.44 1.60 1.77 1.99 2.15
2-hr West Virginia 0.60 0.73 0.92 1.06 1.26 1.42 1.58 1.75 1.98 2.17
2-hr Wisconsin 0.62 0.72 0.90 1.07 1.32 1.55 1.79 2.06 2.44 2.75
2-hr TYPE I 0.36 0.45 0.58 0.69 0.86 1.00 1.16 1.33 1.58 1.79
2-hr TYPE IA 0.38 0.48 0.62 0.74 0.92 1.07 1.22 1.40 1.65 1.85
2-hr TYPE II 0.81 0.97 1.23 1.45 1.78 2.04 2.31 2.60 2.99 3.30
2-hr TYPE III 0.98 1.18 1.48 1.76 2.13 2.46 2.80 3.17 3.69 4.16
C12
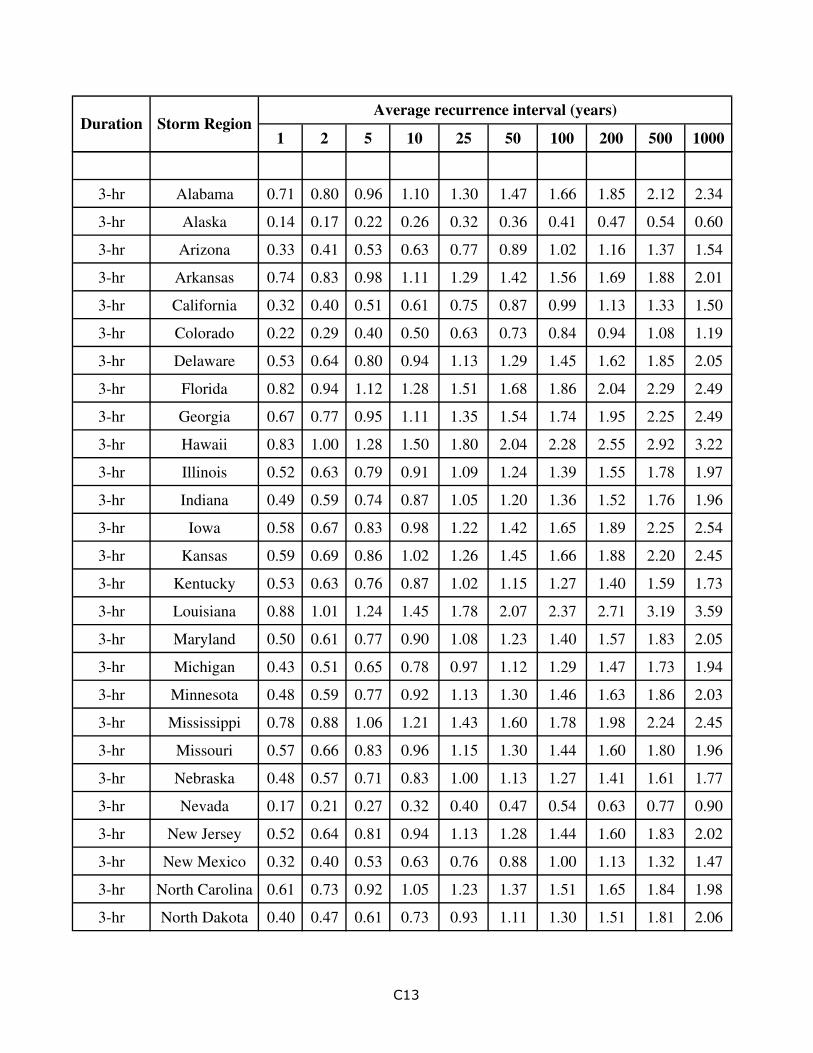
1 2 5 10 25 50 100 200 500 1000Duration Storm Region
Average recurrence interval (years)
3-hr Alabama 0.71 0.80 0.96 1.10 1.30 1.47 1.66 1.85 2.12 2.34
3-hr Alaska 0.14 0.17 0.22 0.26 0.32 0.36 0.41 0.47 0.54 0.60
3-hr Arizona 0.33 0.41 0.53 0.63 0.77 0.89 1.02 1.16 1.37 1.54
3-hr Arkansas 0.74 0.83 0.98 1.11 1.29 1.42 1.56 1.69 1.88 2.01
3-hr California 0.32 0.40 0.51 0.61 0.75 0.87 0.99 1.13 1.33 1.50
3-hr Colorado 0.22 0.29 0.40 0.50 0.63 0.73 0.84 0.94 1.08 1.19
3-hr Delaware 0.53 0.64 0.80 0.94 1.13 1.29 1.45 1.62 1.85 2.05
3-hr Florida 0.82 0.94 1.12 1.28 1.51 1.68 1.86 2.04 2.29 2.49
3-hr Georgia 0.67 0.77 0.95 1.11 1.35 1.54 1.74 1.95 2.25 2.49
3-hr Hawaii 0.83 1.00 1.28 1.50 1.80 2.04 2.28 2.55 2.92 3.22
3-hr Illinois 0.52 0.63 0.79 0.91 1.09 1.24 1.39 1.55 1.78 1.97
3-hr Indiana 0.49 0.59 0.74 0.87 1.05 1.20 1.36 1.52 1.76 1.96
3-hr Iowa 0.58 0.67 0.83 0.98 1.22 1.42 1.65 1.89 2.25 2.54
3-hr Kansas 0.59 0.69 0.86 1.02 1.26 1.45 1.66 1.88 2.20 2.45
3-hr Kentucky 0.53 0.63 0.76 0.87 1.02 1.15 1.27 1.40 1.59 1.73
3-hr Louisiana 0.88 1.01 1.24 1.45 1.78 2.07 2.37 2.71 3.19 3.59
3-hr Maryland 0.50 0.61 0.77 0.90 1.08 1.23 1.40 1.57 1.83 2.05
3-hr Michigan 0.43 0.51 0.65 0.78 0.97 1.12 1.29 1.47 1.73 1.94
3-hr Minnesota 0.48 0.59 0.77 0.92 1.13 1.30 1.46 1.63 1.86 2.03
3-hr Mississippi 0.78 0.88 1.06 1.21 1.43 1.60 1.78 1.98 2.24 2.45
3-hr Missouri 0.57 0.66 0.83 0.96 1.15 1.30 1.44 1.60 1.80 1.96
3-hr Nebraska 0.48 0.57 0.71 0.83 1.00 1.13 1.27 1.41 1.61 1.77
3-hr Nevada 0.17 0.21 0.27 0.32 0.40 0.47 0.54 0.63 0.77 0.90
3-hr New Jersey 0.52 0.64 0.81 0.94 1.13 1.28 1.44 1.60 1.83 2.02
3-hr New Mexico 0.32 0.40 0.53 0.63 0.76 0.88 1.00 1.13 1.32 1.47
3-hr North Carolina 0.61 0.73 0.92 1.05 1.23 1.37 1.51 1.65 1.84 1.98
3-hr North Dakota 0.40 0.47 0.61 0.73 0.93 1.11 1.30 1.51 1.81 2.06
C13
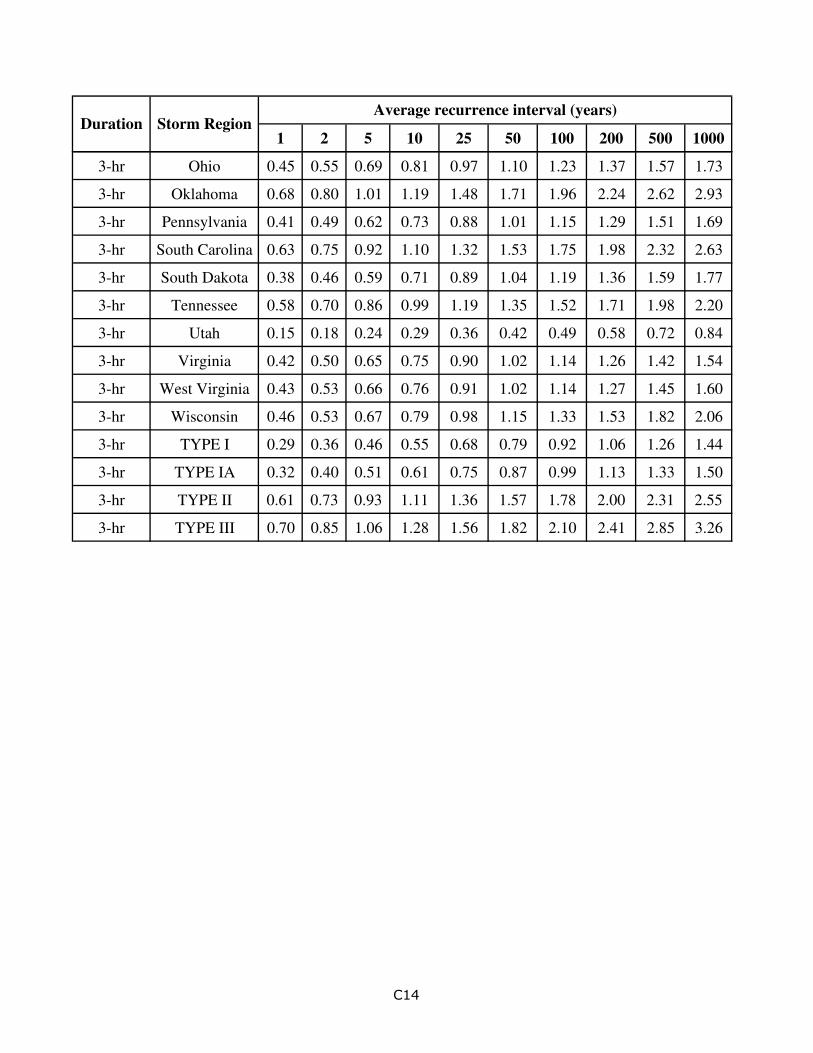
1 2 5 10 25 50 100 200 500 1000Duration Storm Region
Average recurrence interval (years)
3-hr Ohio 0.45 0.55 0.69 0.81 0.97 1.10 1.23 1.37 1.57 1.73
3-hr Oklahoma 0.68 0.80 1.01 1.19 1.48 1.71 1.96 2.24 2.62 2.93
3-hr Pennsylvania 0.41 0.49 0.62 0.73 0.88 1.01 1.15 1.29 1.51 1.69
3-hr South Carolina 0.63 0.75 0.92 1.10 1.32 1.53 1.75 1.98 2.32 2.63
3-hr South Dakota 0.38 0.46 0.59 0.71 0.89 1.04 1.19 1.36 1.59 1.77
3-hr Tennessee 0.58 0.70 0.86 0.99 1.19 1.35 1.52 1.71 1.98 2.20
3-hr Utah 0.15 0.18 0.24 0.29 0.36 0.42 0.49 0.58 0.72 0.84
3-hr Virginia 0.42 0.50 0.65 0.75 0.90 1.02 1.14 1.26 1.42 1.54
3-hr West Virginia 0.43 0.53 0.66 0.76 0.91 1.02 1.14 1.27 1.45 1.60
3-hr Wisconsin 0.46 0.53 0.67 0.79 0.98 1.15 1.33 1.53 1.82 2.06
3-hr TYPE I 0.29 0.36 0.46 0.55 0.68 0.79 0.92 1.06 1.26 1.44
3-hr TYPE IA 0.32 0.40 0.51 0.61 0.75 0.87 0.99 1.13 1.33 1.50
3-hr TYPE II 0.61 0.73 0.93 1.11 1.36 1.57 1.78 2.00 2.31 2.55
3-hr TYPE III 0.70 0.85 1.06 1.28 1.56 1.82 2.10 2.41 2.85 3.26
C14
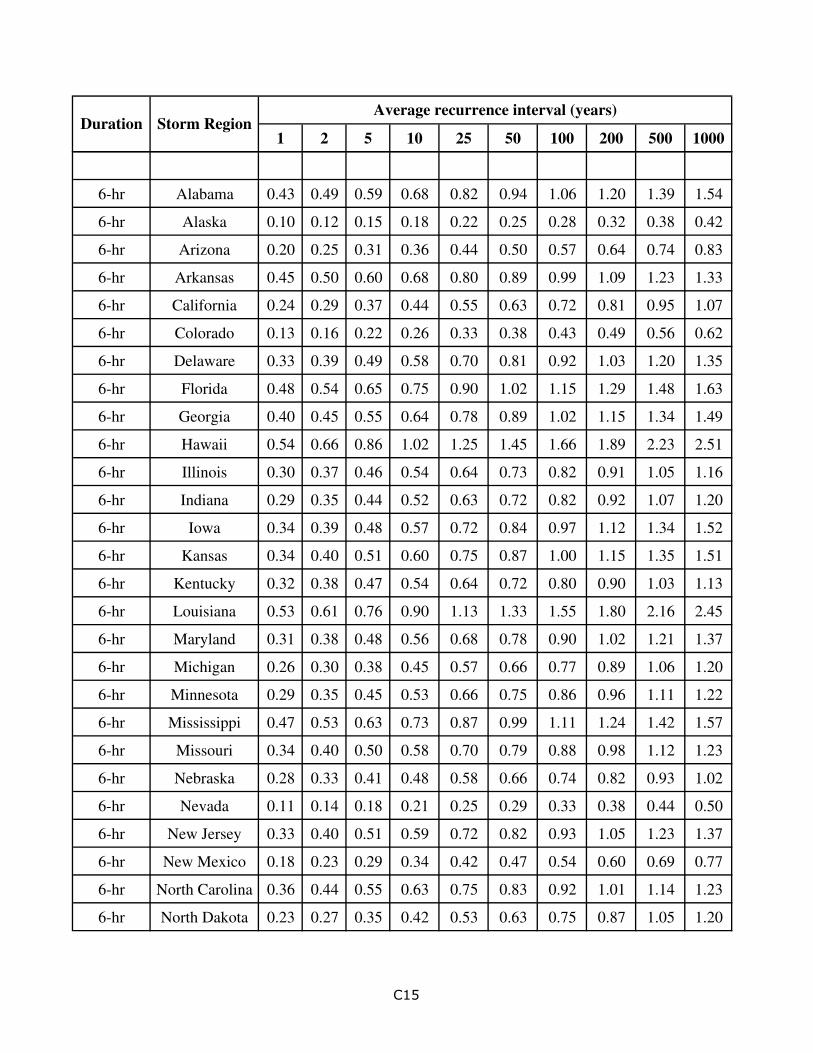
1 2 5 10 25 50 100 200 500 1000Duration Storm Region
Average recurrence interval (years)
6-hr Alabama 0.43 0.49 0.59 0.68 0.82 0.94 1.06 1.20 1.39 1.54
6-hr Alaska 0.10 0.12 0.15 0.18 0.22 0.25 0.28 0.32 0.38 0.42
6-hr Arizona 0.20 0.25 0.31 0.36 0.44 0.50 0.57 0.64 0.74 0.83
6-hr Arkansas 0.45 0.50 0.60 0.68 0.80 0.89 0.99 1.09 1.23 1.33
6-hr California 0.24 0.29 0.37 0.44 0.55 0.63 0.72 0.81 0.95 1.07
6-hr Colorado 0.13 0.16 0.22 0.26 0.33 0.38 0.43 0.49 0.56 0.62
6-hr Delaware 0.33 0.39 0.49 0.58 0.70 0.81 0.92 1.03 1.20 1.35
6-hr Florida 0.48 0.54 0.65 0.75 0.90 1.02 1.15 1.29 1.48 1.63
6-hr Georgia 0.40 0.45 0.55 0.64 0.78 0.89 1.02 1.15 1.34 1.49
6-hr Hawaii 0.54 0.66 0.86 1.02 1.25 1.45 1.66 1.89 2.23 2.51
6-hr Illinois 0.30 0.37 0.46 0.54 0.64 0.73 0.82 0.91 1.05 1.16
6-hr Indiana 0.29 0.35 0.44 0.52 0.63 0.72 0.82 0.92 1.07 1.20
6-hr Iowa 0.34 0.39 0.48 0.57 0.72 0.84 0.97 1.12 1.34 1.52
6-hr Kansas 0.34 0.40 0.51 0.60 0.75 0.87 1.00 1.15 1.35 1.51
6-hr Kentucky 0.32 0.38 0.47 0.54 0.64 0.72 0.80 0.90 1.03 1.13
6-hr Louisiana 0.53 0.61 0.76 0.90 1.13 1.33 1.55 1.80 2.16 2.45
6-hr Maryland 0.31 0.38 0.48 0.56 0.68 0.78 0.90 1.02 1.21 1.37
6-hr Michigan 0.26 0.30 0.38 0.45 0.57 0.66 0.77 0.89 1.06 1.20
6-hr Minnesota 0.29 0.35 0.45 0.53 0.66 0.75 0.86 0.96 1.11 1.22
6-hr Mississippi 0.47 0.53 0.63 0.73 0.87 0.99 1.11 1.24 1.42 1.57
6-hr Missouri 0.34 0.40 0.50 0.58 0.70 0.79 0.88 0.98 1.12 1.23
6-hr Nebraska 0.28 0.33 0.41 0.48 0.58 0.66 0.74 0.82 0.93 1.02
6-hr Nevada 0.11 0.14 0.18 0.21 0.25 0.29 0.33 0.38 0.44 0.50
6-hr New Jersey 0.33 0.40 0.51 0.59 0.72 0.82 0.93 1.05 1.23 1.37
6-hr New Mexico 0.18 0.23 0.29 0.34 0.42 0.47 0.54 0.60 0.69 0.77
6-hr North Carolina 0.36 0.44 0.55 0.63 0.75 0.83 0.92 1.01 1.14 1.23
6-hr North Dakota 0.23 0.27 0.35 0.42 0.53 0.63 0.75 0.87 1.05 1.20
C15
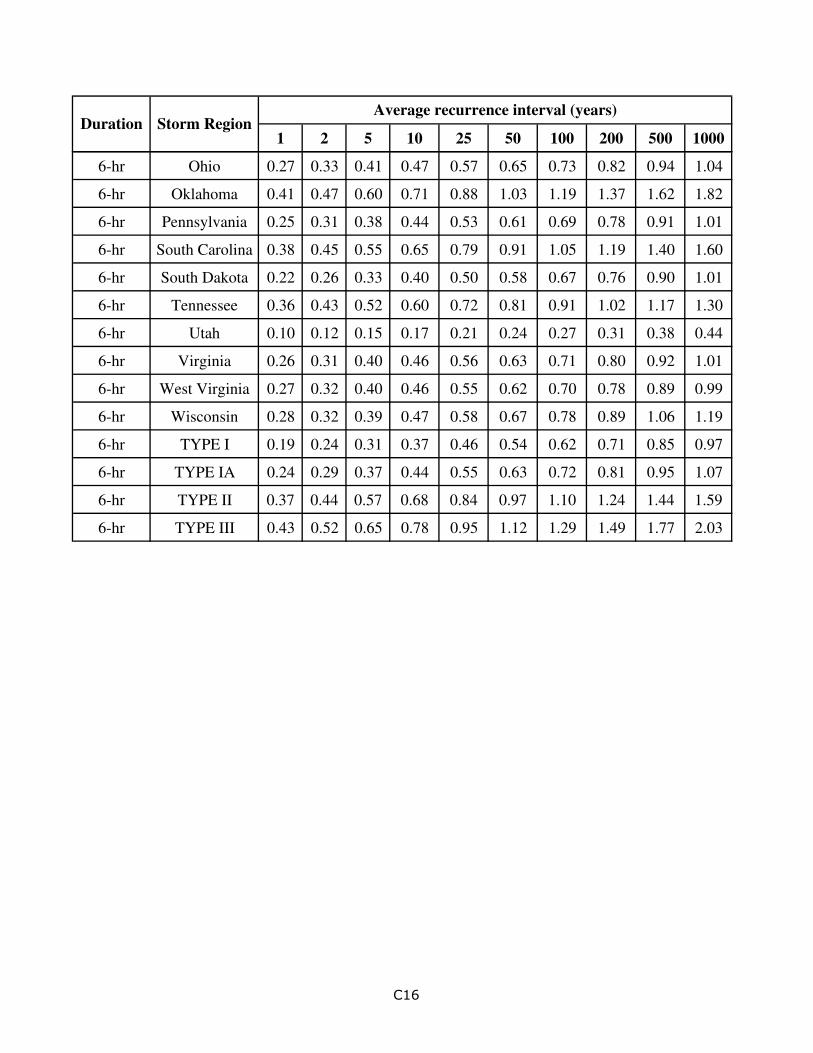
1 2 5 10 25 50 100 200 500 1000Duration Storm Region
Average recurrence interval (years)
6-hr Ohio 0.27 0.33 0.41 0.47 0.57 0.65 0.73 0.82 0.94 1.04
6-hr Oklahoma 0.41 0.47 0.60 0.71 0.88 1.03 1.19 1.37 1.62 1.82
6-hr Pennsylvania 0.25 0.31 0.38 0.44 0.53 0.61 0.69 0.78 0.91 1.01
6-hr South Carolina 0.38 0.45 0.55 0.65 0.79 0.91 1.05 1.19 1.40 1.60
6-hr South Dakota 0.22 0.26 0.33 0.40 0.50 0.58 0.67 0.76 0.90 1.01
6-hr Tennessee 0.36 0.43 0.52 0.60 0.72 0.81 0.91 1.02 1.17 1.30
6-hr Utah 0.10 0.12 0.15 0.17 0.21 0.24 0.27 0.31 0.38 0.44
6-hr Virginia 0.26 0.31 0.40 0.46 0.56 0.63 0.71 0.80 0.92 1.01
6-hr West Virginia 0.27 0.32 0.40 0.46 0.55 0.62 0.70 0.78 0.89 0.99
6-hr Wisconsin 0.28 0.32 0.39 0.47 0.58 0.67 0.78 0.89 1.06 1.19
6-hr TYPE I 0.19 0.24 0.31 0.37 0.46 0.54 0.62 0.71 0.85 0.97
6-hr TYPE IA 0.24 0.29 0.37 0.44 0.55 0.63 0.72 0.81 0.95 1.07
6-hr TYPE II 0.37 0.44 0.57 0.68 0.84 0.97 1.10 1.24 1.44 1.59
6-hr TYPE III 0.43 0.52 0.65 0.78 0.95 1.12 1.29 1.49 1.77 2.03
C16

1 2 5 10 25 50 100 200 500 1000Duration Storm Region
Average recurrence interval (years)
12-hr Alabama 0.25 0.29 0.36 0.42 0.52 0.59 0.67 0.76 0.88 0.98
12-hr Alaska 0.06 0.08 0.10 0.12 0.14 0.17 0.19 0.21 0.25 0.28
12-hr Arizona 0.12 0.15 0.19 0.22 0.26 0.29 0.32 0.35 0.40 0.44
12-hr Arkansas 0.26 0.30 0.36 0.41 0.49 0.56 0.63 0.70 0.80 0.87
12-hr California 0.17 0.22 0.28 0.34 0.42 0.48 0.55 0.62 0.72 0.80
12-hr Colorado 0.08 0.09 0.12 0.14 0.17 0.20 0.22 0.25 0.29 0.32
12-hr Delaware 0.20 0.23 0.29 0.35 0.43 0.50 0.58 0.67 0.79 0.91
12-hr Florida 0.27 0.31 0.38 0.44 0.54 0.63 0.72 0.82 0.98 1.10
12-hr Georgia 0.24 0.27 0.32 0.37 0.44 0.51 0.58 0.66 0.77 0.86
12-hr Hawaii 0.34 0.43 0.56 0.68 0.85 0.99 1.15 1.33 1.60 1.82
12-hr Illinois 0.18 0.21 0.26 0.31 0.36 0.41 0.46 0.51 0.59 0.65
12-hr Indiana 0.17 0.21 0.26 0.30 0.36 0.41 0.46 0.51 0.58 0.64
12-hr Iowa 0.19 0.22 0.28 0.33 0.40 0.47 0.54 0.62 0.74 0.83
12-hr Kansas 0.20 0.23 0.29 0.34 0.42 0.49 0.56 0.64 0.74 0.83
12-hr Kentucky 0.19 0.23 0.28 0.32 0.38 0.43 0.48 0.53 0.61 0.68
12-hr Louisiana 0.31 0.36 0.46 0.56 0.71 0.84 0.99 1.15 1.39 1.59
12-hr Maryland 0.19 0.23 0.29 0.35 0.43 0.50 0.58 0.67 0.81 0.94
12-hr Michigan 0.15 0.17 0.21 0.25 0.32 0.38 0.44 0.51 0.62 0.71
12-hr Minnesota 0.17 0.20 0.24 0.29 0.36 0.41 0.47 0.53 0.62 0.69
12-hr Mississippi 0.27 0.31 0.37 0.43 0.52 0.59 0.67 0.75 0.86 0.95
12-hr Missouri 0.21 0.24 0.29 0.34 0.40 0.46 0.52 0.59 0.68 0.75
12-hr Nebraska 0.16 0.19 0.24 0.28 0.34 0.38 0.43 0.48 0.55 0.60
12-hr Nevada 0.07 0.09 0.12 0.14 0.17 0.19 0.22 0.25 0.28 0.31
12-hr New Jersey 0.20 0.24 0.31 0.36 0.44 0.52 0.60 0.68 0.82 0.93
12-hr New Mexico 0.10 0.13 0.16 0.19 0.23 0.26 0.29 0.33 0.37 0.41
12-hr North Carolina 0.22 0.26 0.33 0.38 0.45 0.51 0.57 0.63 0.71 0.78
12-hr North Dakota 0.13 0.15 0.19 0.23 0.29 0.35 0.41 0.47 0.57 0.64
C17

1 2 5 10 25 50 100 200 500 1000Duration Storm Region
Average recurrence interval (years)
12-hr Ohio 0.16 0.19 0.24 0.27 0.33 0.37 0.42 0.47 0.54 0.60
12-hr Oklahoma 0.24 0.27 0.34 0.40 0.50 0.59 0.68 0.79 0.94 1.06
12-hr Pennsylvania 0.16 0.19 0.23 0.27 0.33 0.38 0.43 0.48 0.57 0.64
12-hr South Carolina 0.22 0.26 0.32 0.38 0.46 0.54 0.62 0.72 0.85 0.97
12-hr South Dakota 0.13 0.15 0.19 0.22 0.27 0.32 0.36 0.41 0.48 0.54
12-hr Tennessee 0.22 0.26 0.31 0.36 0.43 0.48 0.54 0.60 0.68 0.75
12-hr Utah 0.06 0.07 0.09 0.10 0.12 0.14 0.15 0.17 0.19 0.22
12-hr Virginia 0.16 0.19 0.24 0.28 0.34 0.39 0.45 0.51 0.59 0.66
12-hr West Virginia 0.16 0.19 0.24 0.27 0.32 0.37 0.42 0.47 0.54 0.60
12-hr Wisconsin 0.16 0.19 0.23 0.27 0.33 0.38 0.43 0.49 0.57 0.64
12-hr TYPE I 0.13 0.16 0.21 0.25 0.31 0.36 0.41 0.47 0.56 0.64
12-hr TYPE IA 0.17 0.22 0.28 0.34 0.42 0.48 0.55 0.62 0.72 0.80
12-hr TYPE II 0.22 0.26 0.34 0.40 0.50 0.57 0.65 0.73 0.85 0.94
12-hr TYPE III 0.25 0.30 0.38 0.46 0.57 0.67 0.78 0.90 1.08 1.25
C18
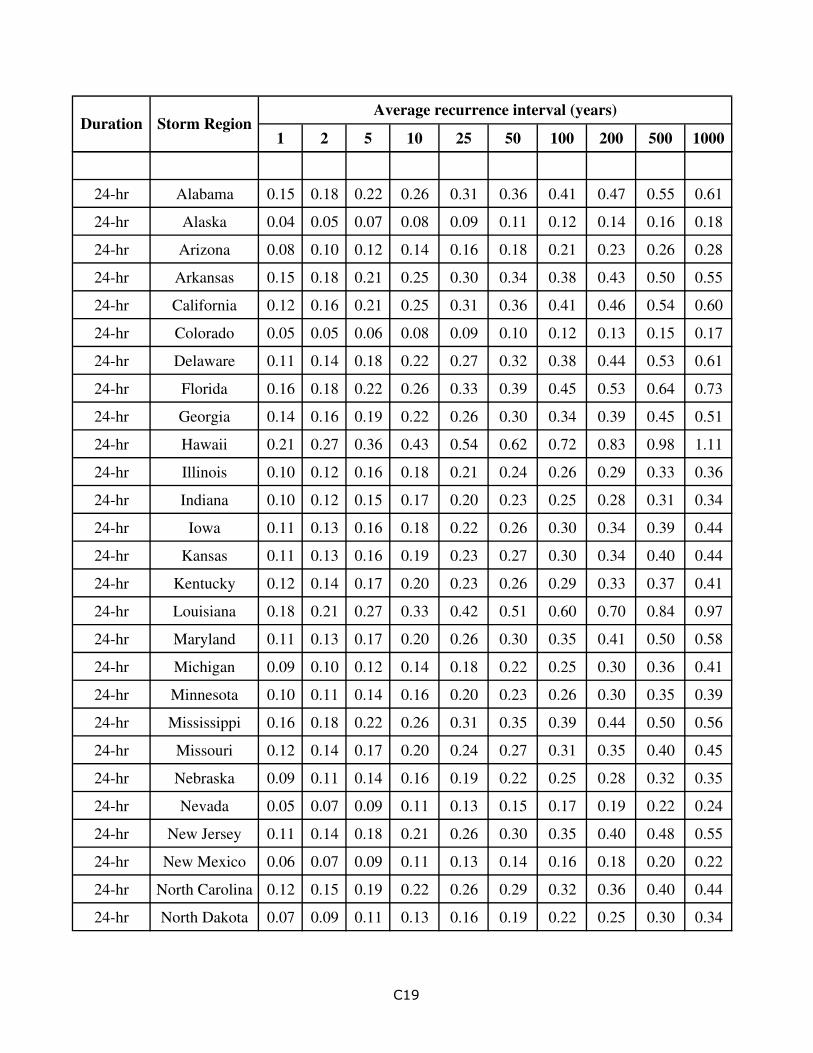
1 2 5 10 25 50 100 200 500 1000Duration Storm Region
Average recurrence interval (years)
24-hr Alabama 0.15 0.18 0.22 0.26 0.31 0.36 0.41 0.47 0.55 0.61
24-hr Alaska 0.04 0.05 0.07 0.08 0.09 0.11 0.12 0.14 0.16 0.18
24-hr Arizona 0.08 0.10 0.12 0.14 0.16 0.18 0.21 0.23 0.26 0.28
24-hr Arkansas 0.15 0.18 0.21 0.25 0.30 0.34 0.38 0.43 0.50 0.55
24-hr California 0.12 0.16 0.21 0.25 0.31 0.36 0.41 0.46 0.54 0.60
24-hr Colorado 0.05 0.05 0.06 0.08 0.09 0.10 0.12 0.13 0.15 0.17
24-hr Delaware 0.11 0.14 0.18 0.22 0.27 0.32 0.38 0.44 0.53 0.61
24-hr Florida 0.16 0.18 0.22 0.26 0.33 0.39 0.45 0.53 0.64 0.73
24-hr Georgia 0.14 0.16 0.19 0.22 0.26 0.30 0.34 0.39 0.45 0.51
24-hr Hawaii 0.21 0.27 0.36 0.43 0.54 0.62 0.72 0.83 0.98 1.11
24-hr Illinois 0.10 0.12 0.16 0.18 0.21 0.24 0.26 0.29 0.33 0.36
24-hr Indiana 0.10 0.12 0.15 0.17 0.20 0.23 0.25 0.28 0.31 0.34
24-hr Iowa 0.11 0.13 0.16 0.18 0.22 0.26 0.30 0.34 0.39 0.44
24-hr Kansas 0.11 0.13 0.16 0.19 0.23 0.27 0.30 0.34 0.40 0.44
24-hr Kentucky 0.12 0.14 0.17 0.20 0.23 0.26 0.29 0.33 0.37 0.41
24-hr Louisiana 0.18 0.21 0.27 0.33 0.42 0.51 0.60 0.70 0.84 0.97
24-hr Maryland 0.11 0.13 0.17 0.20 0.26 0.30 0.35 0.41 0.50 0.58
24-hr Michigan 0.09 0.10 0.12 0.14 0.18 0.22 0.25 0.30 0.36 0.41
24-hr Minnesota 0.10 0.11 0.14 0.16 0.20 0.23 0.26 0.30 0.35 0.39
24-hr Mississippi 0.16 0.18 0.22 0.26 0.31 0.35 0.39 0.44 0.50 0.56
24-hr Missouri 0.12 0.14 0.17 0.20 0.24 0.27 0.31 0.35 0.40 0.45
24-hr Nebraska 0.09 0.11 0.14 0.16 0.19 0.22 0.25 0.28 0.32 0.35
24-hr Nevada 0.05 0.07 0.09 0.11 0.13 0.15 0.17 0.19 0.22 0.24
24-hr New Jersey 0.11 0.14 0.18 0.21 0.26 0.30 0.35 0.40 0.48 0.55
24-hr New Mexico 0.06 0.07 0.09 0.11 0.13 0.14 0.16 0.18 0.20 0.22
24-hr North Carolina 0.12 0.15 0.19 0.22 0.26 0.29 0.32 0.36 0.40 0.44
24-hr North Dakota 0.07 0.09 0.11 0.13 0.16 0.19 0.22 0.25 0.30 0.34
C19
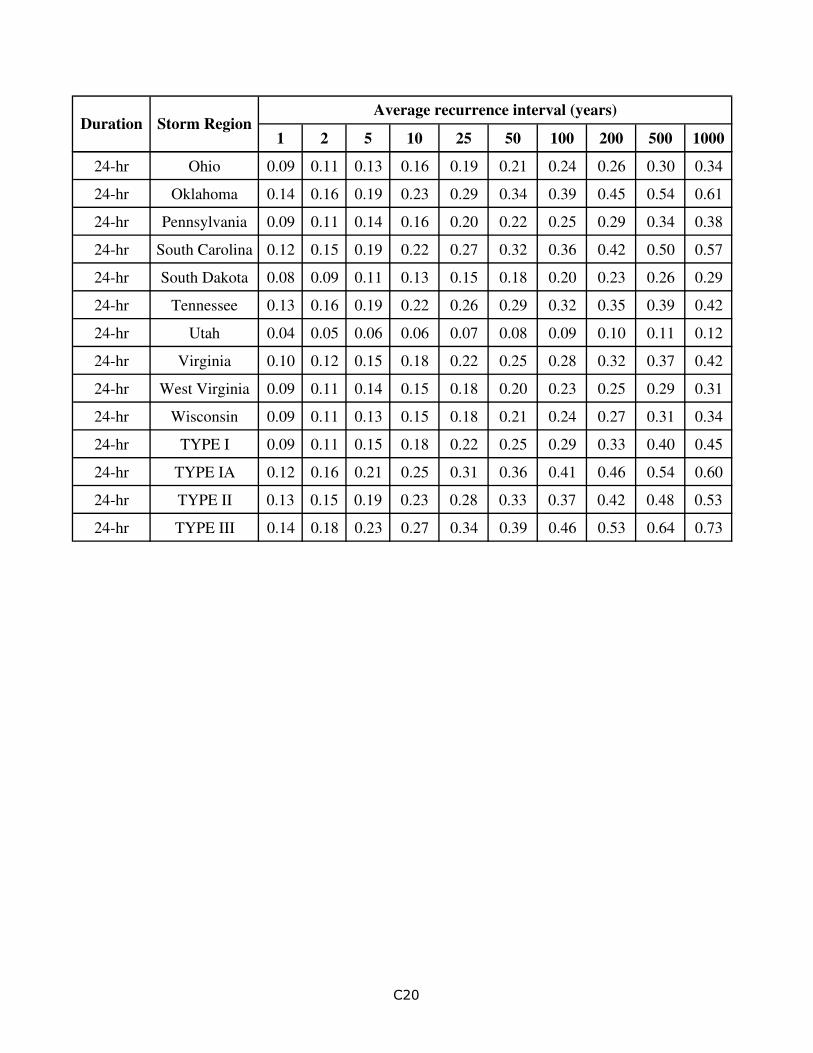
1 2 5 10 25 50 100 200 500 1000Duration Storm Region
Average recurrence interval (years)
24-hr Ohio 0.09 0.11 0.13 0.16 0.19 0.21 0.24 0.26 0.30 0.34
24-hr Oklahoma 0.14 0.16 0.19 0.23 0.29 0.34 0.39 0.45 0.54 0.61
24-hr Pennsylvania 0.09 0.11 0.14 0.16 0.20 0.22 0.25 0.29 0.34 0.38
24-hr South Carolina 0.12 0.15 0.19 0.22 0.27 0.32 0.36 0.42 0.50 0.57
24-hr South Dakota 0.08 0.09 0.11 0.13 0.15 0.18 0.20 0.23 0.26 0.29
24-hr Tennessee 0.13 0.16 0.19 0.22 0.26 0.29 0.32 0.35 0.39 0.42
24-hr Utah 0.04 0.05 0.06 0.06 0.07 0.08 0.09 0.10 0.11 0.12
24-hr Virginia 0.10 0.12 0.15 0.18 0.22 0.25 0.28 0.32 0.37 0.42
24-hr West Virginia 0.09 0.11 0.14 0.15 0.18 0.20 0.23 0.25 0.29 0.31
24-hr Wisconsin 0.09 0.11 0.13 0.15 0.18 0.21 0.24 0.27 0.31 0.34
24-hr TYPE I 0.09 0.11 0.15 0.18 0.22 0.25 0.29 0.33 0.40 0.45
24-hr TYPE IA 0.12 0.16 0.21 0.25 0.31 0.36 0.41 0.46 0.54 0.60
24-hr TYPE II 0.13 0.15 0.19 0.23 0.28 0.33 0.37 0.42 0.48 0.53
24-hr TYPE III 0.14 0.18 0.23 0.27 0.34 0.39 0.46 0.53 0.64 0.73
C20
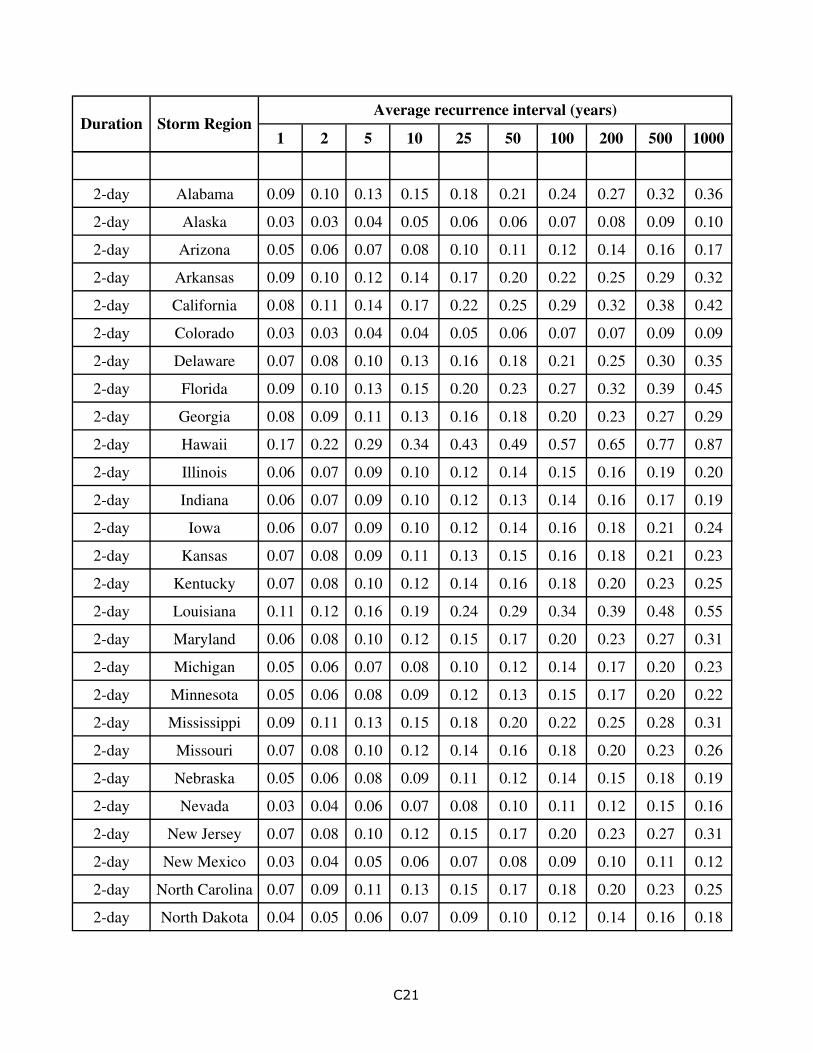
1 2 5 10 25 50 100 200 500 1000Duration Storm Region
Average recurrence interval (years)
2-day Alabama 0.09 0.10 0.13 0.15 0.18 0.21 0.24 0.27 0.32 0.36
2-day Alaska 0.03 0.03 0.04 0.05 0.06 0.06 0.07 0.08 0.09 0.10
2-day Arizona 0.05 0.06 0.07 0.08 0.10 0.11 0.12 0.14 0.16 0.17
2-day Arkansas 0.09 0.10 0.12 0.14 0.17 0.20 0.22 0.25 0.29 0.32
2-day California 0.08 0.11 0.14 0.17 0.22 0.25 0.29 0.32 0.38 0.42
2-day Colorado 0.03 0.03 0.04 0.04 0.05 0.06 0.07 0.07 0.09 0.09
2-day Delaware 0.07 0.08 0.10 0.13 0.16 0.18 0.21 0.25 0.30 0.35
2-day Florida 0.09 0.10 0.13 0.15 0.20 0.23 0.27 0.32 0.39 0.45
2-day Georgia 0.08 0.09 0.11 0.13 0.16 0.18 0.20 0.23 0.27 0.29
2-day Hawaii 0.17 0.22 0.29 0.34 0.43 0.49 0.57 0.65 0.77 0.87
2-day Illinois 0.06 0.07 0.09 0.10 0.12 0.14 0.15 0.16 0.19 0.20
2-day Indiana 0.06 0.07 0.09 0.10 0.12 0.13 0.14 0.16 0.17 0.19
2-day Iowa 0.06 0.07 0.09 0.10 0.12 0.14 0.16 0.18 0.21 0.24
2-day Kansas 0.07 0.08 0.09 0.11 0.13 0.15 0.16 0.18 0.21 0.23
2-day Kentucky 0.07 0.08 0.10 0.12 0.14 0.16 0.18 0.20 0.23 0.25
2-day Louisiana 0.11 0.12 0.16 0.19 0.24 0.29 0.34 0.39 0.48 0.55
2-day Maryland 0.06 0.08 0.10 0.12 0.15 0.17 0.20 0.23 0.27 0.31
2-day Michigan 0.05 0.06 0.07 0.08 0.10 0.12 0.14 0.17 0.20 0.23
2-day Minnesota 0.05 0.06 0.08 0.09 0.12 0.13 0.15 0.17 0.20 0.22
2-day Mississippi 0.09 0.11 0.13 0.15 0.18 0.20 0.22 0.25 0.28 0.31
2-day Missouri 0.07 0.08 0.10 0.12 0.14 0.16 0.18 0.20 0.23 0.26
2-day Nebraska 0.05 0.06 0.08 0.09 0.11 0.12 0.14 0.15 0.18 0.19
2-day Nevada 0.03 0.04 0.06 0.07 0.08 0.10 0.11 0.12 0.15 0.16
2-day New Jersey 0.07 0.08 0.10 0.12 0.15 0.17 0.20 0.23 0.27 0.31
2-day New Mexico 0.03 0.04 0.05 0.06 0.07 0.08 0.09 0.10 0.11 0.12
2-day North Carolina 0.07 0.09 0.11 0.13 0.15 0.17 0.18 0.20 0.23 0.25
2-day North Dakota 0.04 0.05 0.06 0.07 0.09 0.10 0.12 0.14 0.16 0.18
C21
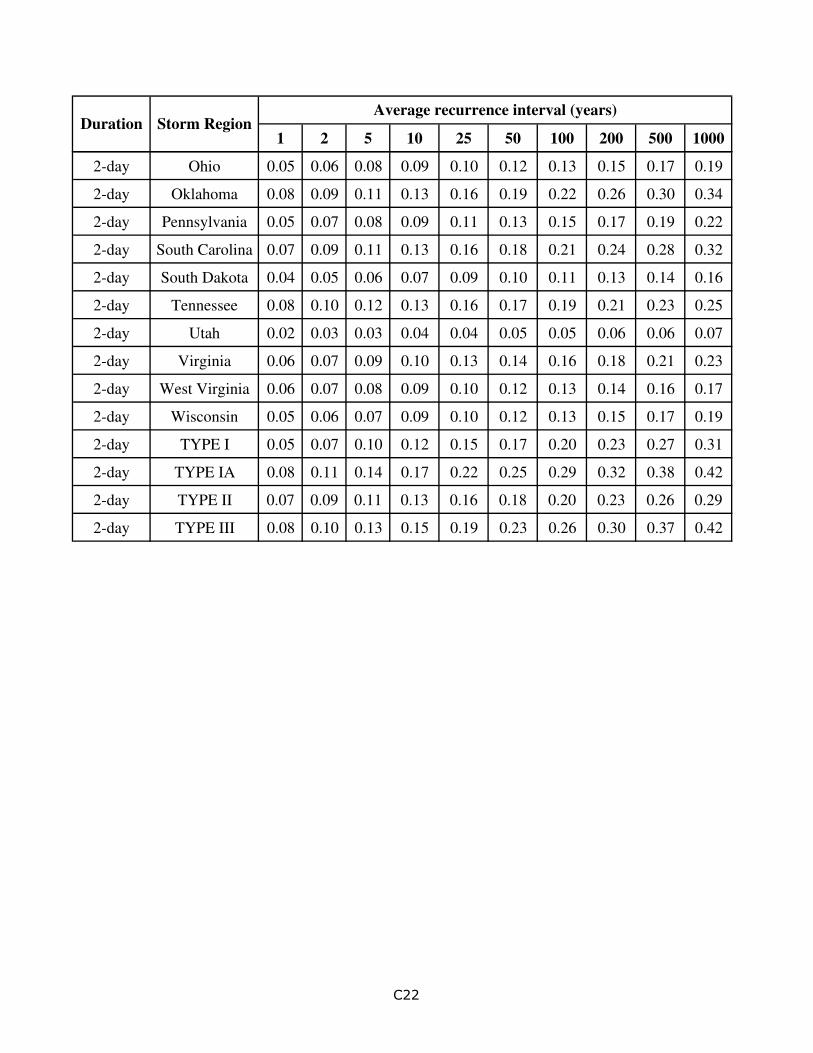
1 2 5 10 25 50 100 200 500 1000Duration Storm Region
Average recurrence interval (years)
2-day Ohio 0.05 0.06 0.08 0.09 0.10 0.12 0.13 0.15 0.17 0.19
2-day Oklahoma 0.08 0.09 0.11 0.13 0.16 0.19 0.22 0.26 0.30 0.34
2-day Pennsylvania 0.05 0.07 0.08 0.09 0.11 0.13 0.15 0.17 0.19 0.22
2-day South Carolina 0.07 0.09 0.11 0.13 0.16 0.18 0.21 0.24 0.28 0.32
2-day South Dakota 0.04 0.05 0.06 0.07 0.09 0.10 0.11 0.13 0.14 0.16
2-day Tennessee 0.08 0.10 0.12 0.13 0.16 0.17 0.19 0.21 0.23 0.25
2-day Utah 0.02 0.03 0.03 0.04 0.04 0.05 0.05 0.06 0.06 0.07
2-day Virginia 0.06 0.07 0.09 0.10 0.13 0.14 0.16 0.18 0.21 0.23
2-day West Virginia 0.06 0.07 0.08 0.09 0.10 0.12 0.13 0.14 0.16 0.17
2-day Wisconsin 0.05 0.06 0.07 0.09 0.10 0.12 0.13 0.15 0.17 0.19
2-day TYPE I 0.05 0.07 0.10 0.12 0.15 0.17 0.20 0.23 0.27 0.31
2-day TYPE IA 0.08 0.11 0.14 0.17 0.22 0.25 0.29 0.32 0.38 0.42
2-day TYPE II 0.07 0.09 0.11 0.13 0.16 0.18 0.20 0.23 0.26 0.29
2-day TYPE III 0.08 0.10 0.13 0.15 0.19 0.23 0.26 0.30 0.37 0.42
C22

1 2 5 10 25 50 100 200 500 1000Duration Storm Region
Average recurrence interval (years)
3-day Alabama 0.07 0.07 0.09 0.11 0.13 0.15 0.18 0.20 0.24 0.27
3-day Alaska 0.02 0.02 0.03 0.04 0.04 0.05 0.05 0.06 0.07 0.07
3-day Arizona 0.03 0.04 0.05 0.06 0.07 0.08 0.09 0.10 0.11 0.12
3-day Arkansas 0.06 0.07 0.09 0.10 0.12 0.14 0.16 0.18 0.20 0.22
3-day California 0.06 0.08 0.11 0.14 0.17 0.20 0.23 0.26 0.30 0.33
3-day Colorado 0.02 0.02 0.03 0.03 0.04 0.04 0.05 0.05 0.06 0.07
3-day Delaware 0.05 0.06 0.07 0.09 0.11 0.13 0.15 0.17 0.21 0.24
3-day Florida 0.07 0.08 0.09 0.11 0.14 0.17 0.20 0.24 0.29 0.33
3-day Georgia 0.06 0.07 0.08 0.09 0.11 0.13 0.15 0.16 0.19 0.21
3-day Hawaii 0.13 0.16 0.21 0.25 0.32 0.37 0.43 0.49 0.58 0.67
3-day Illinois 0.04 0.05 0.06 0.07 0.09 0.10 0.11 0.12 0.13 0.14
3-day Indiana 0.04 0.05 0.06 0.07 0.08 0.09 0.10 0.11 0.12 0.13
3-day Iowa 0.05 0.05 0.06 0.07 0.09 0.10 0.12 0.13 0.15 0.17
3-day Kansas 0.05 0.05 0.07 0.08 0.09 0.10 0.12 0.13 0.15 0.16
3-day Kentucky 0.05 0.06 0.07 0.08 0.10 0.11 0.12 0.14 0.16 0.17
3-day Louisiana 0.08 0.09 0.11 0.13 0.17 0.20 0.24 0.28 0.33 0.38
3-day Maryland 0.04 0.05 0.07 0.08 0.10 0.12 0.14 0.16 0.19 0.22
3-day Michigan 0.04 0.04 0.05 0.06 0.07 0.09 0.10 0.12 0.14 0.16
3-day Minnesota 0.04 0.05 0.06 0.07 0.08 0.10 0.11 0.12 0.14 0.16
3-day Mississippi 0.07 0.08 0.09 0.11 0.12 0.14 0.16 0.17 0.20 0.22
3-day Missouri 0.05 0.06 0.07 0.08 0.10 0.12 0.13 0.15 0.17 0.18
3-day Nebraska 0.04 0.05 0.06 0.06 0.08 0.09 0.10 0.11 0.12 0.13
3-day Nevada 0.02 0.03 0.04 0.05 0.06 0.07 0.08 0.09 0.11 0.12
3-day New Jersey 0.05 0.06 0.07 0.08 0.10 0.12 0.14 0.16 0.18 0.21
3-day New Mexico 0.02 0.03 0.04 0.04 0.05 0.06 0.06 0.07 0.08 0.09
3-day North Carolina 0.05 0.06 0.08 0.09 0.10 0.12 0.13 0.14 0.16 0.17
3-day North Dakota 0.03 0.04 0.04 0.05 0.06 0.07 0.09 0.10 0.11 0.13
C23

1 2 5 10 25 50 100 200 500 1000Duration Storm Region
Average recurrence interval (years)
3-day Ohio 0.04 0.05 0.05 0.06 0.07 0.08 0.09 0.10 0.12 0.13
3-day Oklahoma 0.06 0.06 0.08 0.10 0.12 0.14 0.16 0.18 0.21 0.24
3-day Pennsylvania 0.04 0.05 0.06 0.07 0.08 0.09 0.10 0.12 0.14 0.15
3-day South Carolina 0.05 0.06 0.08 0.09 0.11 0.13 0.14 0.16 0.19 0.22
3-day South Dakota 0.03 0.04 0.04 0.05 0.06 0.07 0.08 0.09 0.10 0.11
3-day Tennessee 0.06 0.07 0.08 0.09 0.11 0.12 0.13 0.14 0.16 0.17
3-day Utah 0.01 0.02 0.02 0.03 0.03 0.03 0.04 0.04 0.05 0.05
3-day Virginia 0.04 0.05 0.06 0.07 0.09 0.10 0.11 0.13 0.15 0.16
3-day West Virginia 0.04 0.05 0.06 0.07 0.08 0.08 0.09 0.10 0.11 0.12
3-day Wisconsin 0.04 0.04 0.05 0.06 0.07 0.09 0.10 0.11 0.12 0.14
3-day TYPE I 0.04 0.05 0.07 0.09 0.11 0.13 0.15 0.18 0.21 0.24
3-day TYPE IA 0.06 0.08 0.11 0.14 0.17 0.20 0.23 0.26 0.30 0.33
3-day TYPE II 0.06 0.06 0.08 0.09 0.11 0.12 0.14 0.16 0.18 0.20
3-day TYPE III 0.06 0.07 0.09 0.11 0.13 0.16 0.18 0.21 0.25 0.28
C24

1 2 5 10 25 50 100 200 500 1000Duration Storm Region
Average recurrence interval (years)
4-day Alabama 0.05 0.06 0.07 0.09 0.11 0.12 0.14 0.16 0.19 0.21
4-day Alaska 0.02 0.02 0.02 0.03 0.03 0.04 0.04 0.05 0.05 0.06
4-day Arizona 0.03 0.03 0.04 0.05 0.06 0.06 0.07 0.08 0.09 0.10
4-day Arkansas 0.05 0.06 0.07 0.08 0.10 0.11 0.12 0.14 0.16 0.17
4-day California 0.05 0.07 0.09 0.11 0.14 0.16 0.19 0.21 0.25 0.27
4-day Colorado 0.02 0.02 0.02 0.03 0.03 0.04 0.04 0.04 0.05 0.05
4-day Delaware 0.04 0.04 0.06 0.07 0.08 0.10 0.11 0.13 0.16 0.18
4-day Florida 0.05 0.06 0.07 0.09 0.11 0.13 0.16 0.19 0.23 0.26
4-day Georgia 0.05 0.05 0.06 0.07 0.09 0.10 0.11 0.13 0.15 0.16
4-day Hawaii 0.10 0.13 0.17 0.21 0.26 0.30 0.35 0.41 0.49 0.56
4-day Illinois 0.03 0.04 0.05 0.06 0.07 0.08 0.08 0.09 0.10 0.11
4-day Indiana 0.03 0.04 0.05 0.06 0.06 0.07 0.08 0.09 0.09 0.10
4-day Iowa 0.04 0.04 0.05 0.06 0.07 0.08 0.09 0.10 0.12 0.13
4-day Kansas 0.04 0.04 0.05 0.06 0.07 0.08 0.09 0.10 0.12 0.13
4-day Kentucky 0.04 0.05 0.06 0.07 0.08 0.09 0.10 0.11 0.12 0.13
4-day Louisiana 0.06 0.07 0.09 0.11 0.13 0.16 0.19 0.22 0.26 0.30
4-day Maryland 0.04 0.04 0.05 0.06 0.08 0.09 0.11 0.13 0.15 0.17
4-day Michigan 0.03 0.03 0.04 0.05 0.06 0.07 0.08 0.09 0.11 0.12
4-day Minnesota 0.03 0.04 0.05 0.05 0.07 0.07 0.08 0.10 0.11 0.12
4-day Mississippi 0.06 0.06 0.07 0.08 0.10 0.11 0.12 0.13 0.15 0.17
4-day Missouri 0.04 0.05 0.06 0.07 0.08 0.09 0.10 0.11 0.13 0.14
4-day Nebraska 0.03 0.04 0.04 0.05 0.06 0.07 0.08 0.08 0.10 0.10
4-day Nevada 0.02 0.03 0.03 0.04 0.05 0.06 0.06 0.07 0.08 0.09
4-day New Jersey 0.04 0.04 0.06 0.07 0.08 0.09 0.11 0.12 0.14 0.16
4-day New Mexico 0.02 0.02 0.03 0.03 0.04 0.05 0.05 0.06 0.06 0.07
4-day North Carolina 0.04 0.05 0.06 0.07 0.08 0.09 0.10 0.11 0.13 0.14
4-day North Dakota 0.02 0.03 0.04 0.04 0.05 0.06 0.07 0.08 0.09 0.10
C25
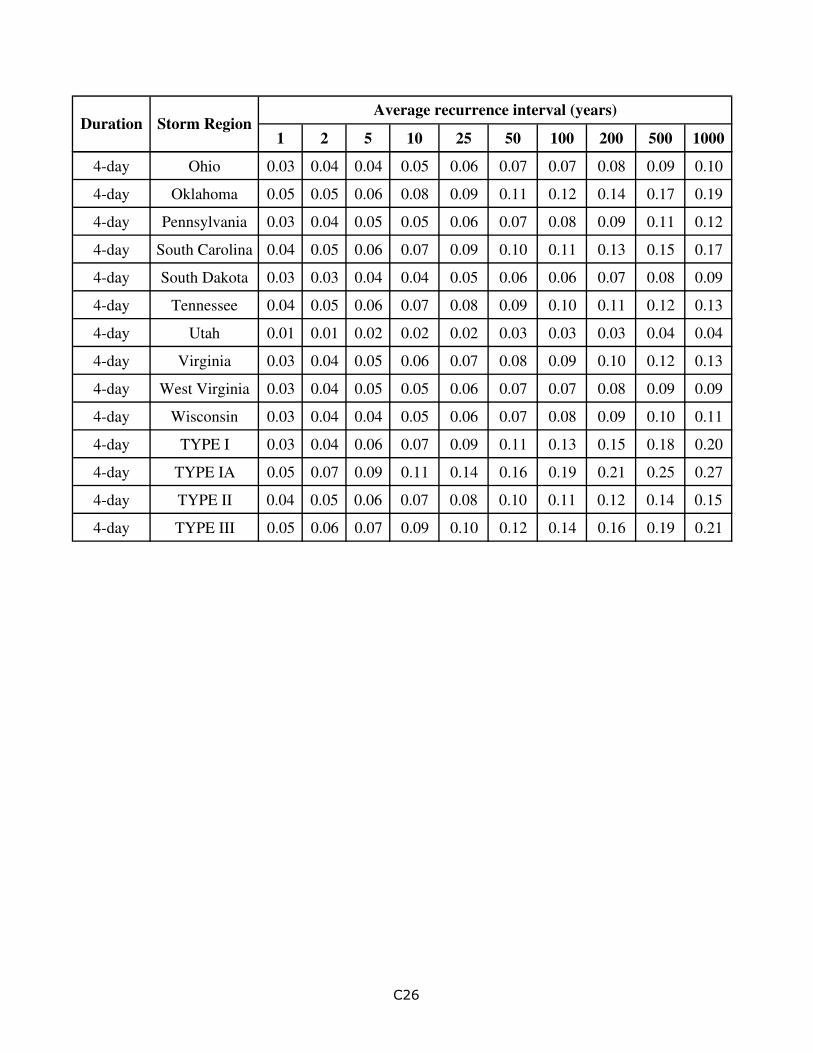
1 2 5 10 25 50 100 200 500 1000Duration Storm Region
Average recurrence interval (years)
4-day Ohio 0.03 0.04 0.04 0.05 0.06 0.07 0.07 0.08 0.09 0.10
4-day Oklahoma 0.05 0.05 0.06 0.08 0.09 0.11 0.12 0.14 0.17 0.19
4-day Pennsylvania 0.03 0.04 0.05 0.05 0.06 0.07 0.08 0.09 0.11 0.12
4-day South Carolina 0.04 0.05 0.06 0.07 0.09 0.10 0.11 0.13 0.15 0.17
4-day South Dakota 0.03 0.03 0.04 0.04 0.05 0.06 0.06 0.07 0.08 0.09
4-day Tennessee 0.04 0.05 0.06 0.07 0.08 0.09 0.10 0.11 0.12 0.13
4-day Utah 0.01 0.01 0.02 0.02 0.02 0.03 0.03 0.03 0.04 0.04
4-day Virginia 0.03 0.04 0.05 0.06 0.07 0.08 0.09 0.10 0.12 0.13
4-day West Virginia 0.03 0.04 0.05 0.05 0.06 0.07 0.07 0.08 0.09 0.09
4-day Wisconsin 0.03 0.04 0.04 0.05 0.06 0.07 0.08 0.09 0.10 0.11
4-day TYPE I 0.03 0.04 0.06 0.07 0.09 0.11 0.13 0.15 0.18 0.20
4-day TYPE IA 0.05 0.07 0.09 0.11 0.14 0.16 0.19 0.21 0.25 0.27
4-day TYPE II 0.04 0.05 0.06 0.07 0.08 0.10 0.11 0.12 0.14 0.15
4-day TYPE III 0.05 0.06 0.07 0.09 0.10 0.12 0.14 0.16 0.19 0.21
C26
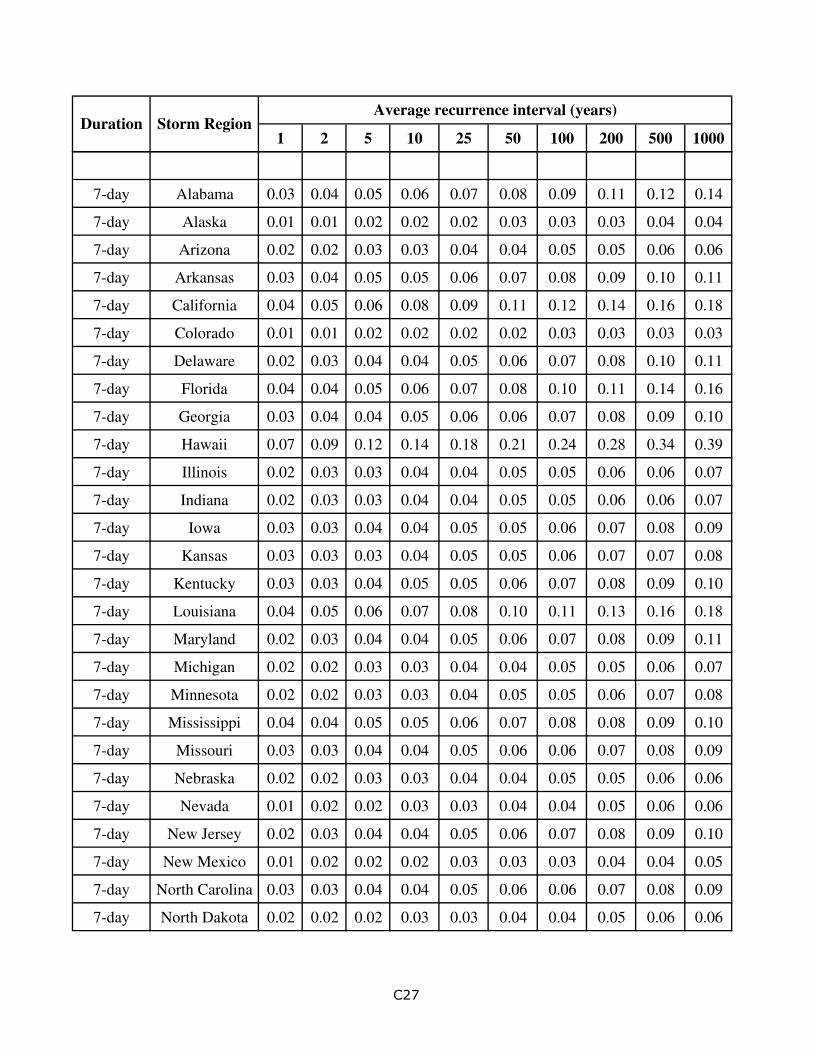
1 2 5 10 25 50 100 200 500 1000Duration Storm Region
Average recurrence interval (years)
7-day Alabama 0.03 0.04 0.05 0.06 0.07 0.08 0.09 0.11 0.12 0.14
7-day Alaska 0.01 0.01 0.02 0.02 0.02 0.03 0.03 0.03 0.04 0.04
7-day Arizona 0.02 0.02 0.03 0.03 0.04 0.04 0.05 0.05 0.06 0.06
7-day Arkansas 0.03 0.04 0.05 0.05 0.06 0.07 0.08 0.09 0.10 0.11
7-day California 0.04 0.05 0.06 0.08 0.09 0.11 0.12 0.14 0.16 0.18
7-day Colorado 0.01 0.01 0.02 0.02 0.02 0.02 0.03 0.03 0.03 0.03
7-day Delaware 0.02 0.03 0.04 0.04 0.05 0.06 0.07 0.08 0.10 0.11
7-day Florida 0.04 0.04 0.05 0.06 0.07 0.08 0.10 0.11 0.14 0.16
7-day Georgia 0.03 0.04 0.04 0.05 0.06 0.06 0.07 0.08 0.09 0.10
7-day Hawaii 0.07 0.09 0.12 0.14 0.18 0.21 0.24 0.28 0.34 0.39
7-day Illinois 0.02 0.03 0.03 0.04 0.04 0.05 0.05 0.06 0.06 0.07
7-day Indiana 0.02 0.03 0.03 0.04 0.04 0.05 0.05 0.06 0.06 0.07
7-day Iowa 0.03 0.03 0.04 0.04 0.05 0.05 0.06 0.07 0.08 0.09
7-day Kansas 0.03 0.03 0.03 0.04 0.05 0.05 0.06 0.07 0.07 0.08
7-day Kentucky 0.03 0.03 0.04 0.05 0.05 0.06 0.07 0.08 0.09 0.10
7-day Louisiana 0.04 0.05 0.06 0.07 0.08 0.10 0.11 0.13 0.16 0.18
7-day Maryland 0.02 0.03 0.04 0.04 0.05 0.06 0.07 0.08 0.09 0.11
7-day Michigan 0.02 0.02 0.03 0.03 0.04 0.04 0.05 0.05 0.06 0.07
7-day Minnesota 0.02 0.02 0.03 0.03 0.04 0.05 0.05 0.06 0.07 0.08
7-day Mississippi 0.04 0.04 0.05 0.05 0.06 0.07 0.08 0.08 0.09 0.10
7-day Missouri 0.03 0.03 0.04 0.04 0.05 0.06 0.06 0.07 0.08 0.09
7-day Nebraska 0.02 0.02 0.03 0.03 0.04 0.04 0.05 0.05 0.06 0.06
7-day Nevada 0.01 0.02 0.02 0.03 0.03 0.04 0.04 0.05 0.06 0.06
7-day New Jersey 0.02 0.03 0.04 0.04 0.05 0.06 0.07 0.08 0.09 0.10
7-day New Mexico 0.01 0.02 0.02 0.02 0.03 0.03 0.03 0.04 0.04 0.05
7-day North Carolina 0.03 0.03 0.04 0.04 0.05 0.06 0.06 0.07 0.08 0.09
7-day North Dakota 0.02 0.02 0.02 0.03 0.03 0.04 0.04 0.05 0.06 0.06
C27
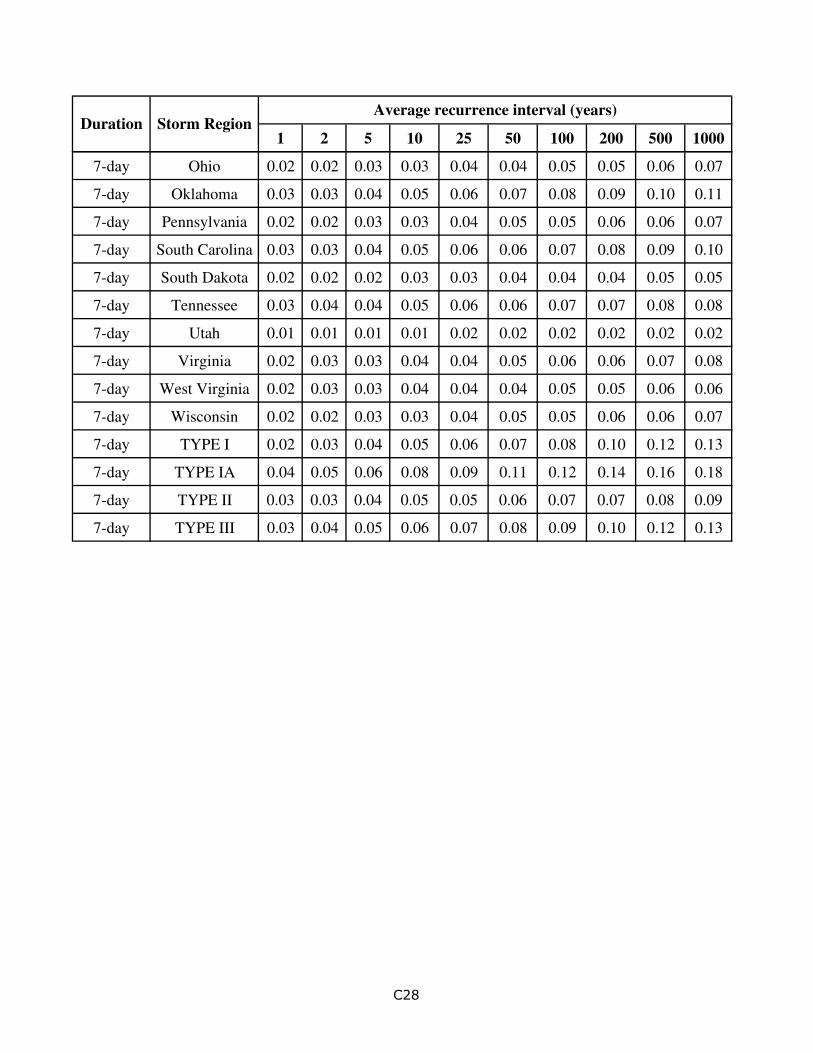
1 2 5 10 25 50 100 200 500 1000Duration Storm Region
Average recurrence interval (years)
7-day Ohio 0.02 0.02 0.03 0.03 0.04 0.04 0.05 0.05 0.06 0.07
7-day Oklahoma 0.03 0.03 0.04 0.05 0.06 0.07 0.08 0.09 0.10 0.11
7-day Pennsylvania 0.02 0.02 0.03 0.03 0.04 0.05 0.05 0.06 0.06 0.07
7-day South Carolina 0.03 0.03 0.04 0.05 0.06 0.06 0.07 0.08 0.09 0.10
7-day South Dakota 0.02 0.02 0.02 0.03 0.03 0.04 0.04 0.04 0.05 0.05
7-day Tennessee 0.03 0.04 0.04 0.05 0.06 0.06 0.07 0.07 0.08 0.08
7-day Utah 0.01 0.01 0.01 0.01 0.02 0.02 0.02 0.02 0.02 0.02
7-day Virginia 0.02 0.03 0.03 0.04 0.04 0.05 0.06 0.06 0.07 0.08
7-day West Virginia 0.02 0.03 0.03 0.04 0.04 0.04 0.05 0.05 0.06 0.06
7-day Wisconsin 0.02 0.02 0.03 0.03 0.04 0.05 0.05 0.06 0.06 0.07
7-day TYPE I 0.02 0.03 0.04 0.05 0.06 0.07 0.08 0.10 0.12 0.13
7-day TYPE IA 0.04 0.05 0.06 0.08 0.09 0.11 0.12 0.14 0.16 0.18
7-day TYPE II 0.03 0.03 0.04 0.05 0.05 0.06 0.07 0.07 0.08 0.09
7-day TYPE III 0.03 0.04 0.05 0.06 0.07 0.08 0.09 0.10 0.12 0.13
C28
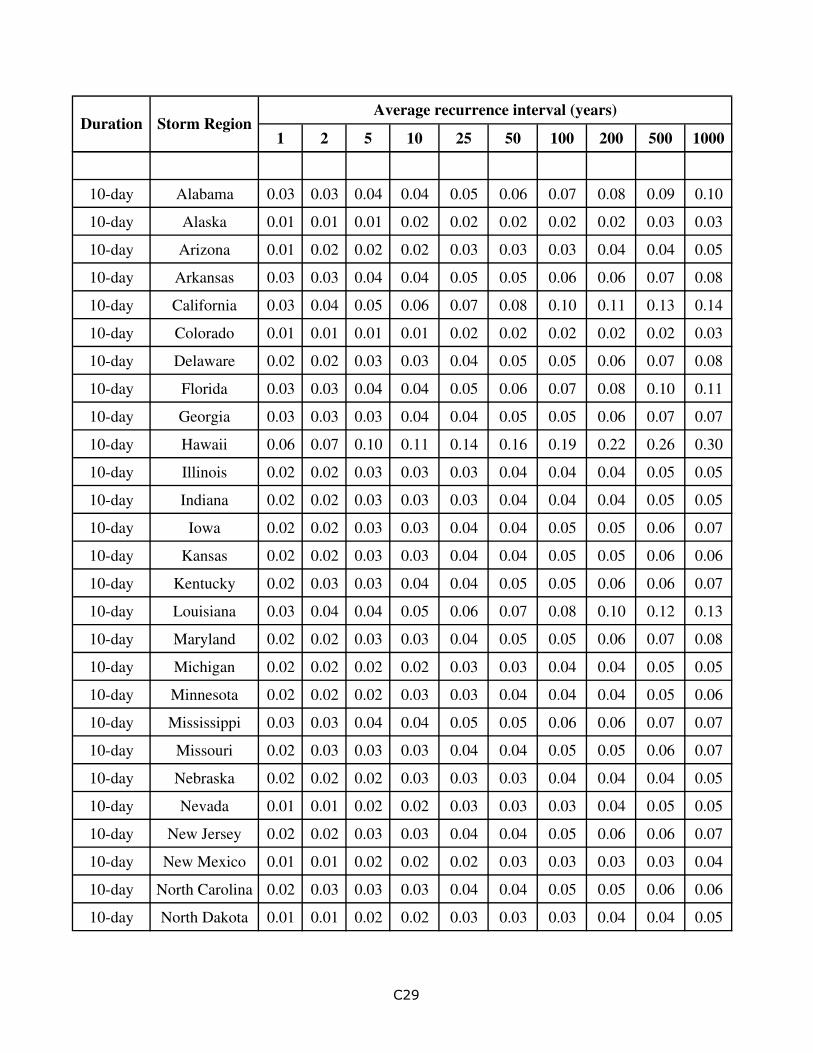
1 2 5 10 25 50 100 200 500 1000Duration Storm Region
Average recurrence interval (years)
10-day Alabama 0.03 0.03 0.04 0.04 0.05 0.06 0.07 0.08 0.09 0.10
10-day Alaska 0.01 0.01 0.01 0.02 0.02 0.02 0.02 0.02 0.03 0.03
10-day Arizona 0.01 0.02 0.02 0.02 0.03 0.03 0.03 0.04 0.04 0.05
10-day Arkansas 0.03 0.03 0.04 0.04 0.05 0.05 0.06 0.06 0.07 0.08
10-day California 0.03 0.04 0.05 0.06 0.07 0.08 0.10 0.11 0.13 0.14
10-day Colorado 0.01 0.01 0.01 0.01 0.02 0.02 0.02 0.02 0.02 0.03
10-day Delaware 0.02 0.02 0.03 0.03 0.04 0.05 0.05 0.06 0.07 0.08
10-day Florida 0.03 0.03 0.04 0.04 0.05 0.06 0.07 0.08 0.10 0.11
10-day Georgia 0.03 0.03 0.03 0.04 0.04 0.05 0.05 0.06 0.07 0.07
10-day Hawaii 0.06 0.07 0.10 0.11 0.14 0.16 0.19 0.22 0.26 0.30
10-day Illinois 0.02 0.02 0.03 0.03 0.03 0.04 0.04 0.04 0.05 0.05
10-day Indiana 0.02 0.02 0.03 0.03 0.03 0.04 0.04 0.04 0.05 0.05
10-day Iowa 0.02 0.02 0.03 0.03 0.04 0.04 0.05 0.05 0.06 0.07
10-day Kansas 0.02 0.02 0.03 0.03 0.04 0.04 0.05 0.05 0.06 0.06
10-day Kentucky 0.02 0.03 0.03 0.04 0.04 0.05 0.05 0.06 0.06 0.07
10-day Louisiana 0.03 0.04 0.04 0.05 0.06 0.07 0.08 0.10 0.12 0.13
10-day Maryland 0.02 0.02 0.03 0.03 0.04 0.05 0.05 0.06 0.07 0.08
10-day Michigan 0.02 0.02 0.02 0.02 0.03 0.03 0.04 0.04 0.05 0.05
10-day Minnesota 0.02 0.02 0.02 0.03 0.03 0.04 0.04 0.04 0.05 0.06
10-day Mississippi 0.03 0.03 0.04 0.04 0.05 0.05 0.06 0.06 0.07 0.07
10-day Missouri 0.02 0.03 0.03 0.03 0.04 0.04 0.05 0.05 0.06 0.07
10-day Nebraska 0.02 0.02 0.02 0.03 0.03 0.03 0.04 0.04 0.04 0.05
10-day Nevada 0.01 0.01 0.02 0.02 0.03 0.03 0.03 0.04 0.05 0.05
10-day New Jersey 0.02 0.02 0.03 0.03 0.04 0.04 0.05 0.06 0.06 0.07
10-day New Mexico 0.01 0.01 0.02 0.02 0.02 0.03 0.03 0.03 0.03 0.04
10-day North Carolina 0.02 0.03 0.03 0.03 0.04 0.04 0.05 0.05 0.06 0.06
10-day North Dakota 0.01 0.01 0.02 0.02 0.03 0.03 0.03 0.04 0.04 0.05
C29
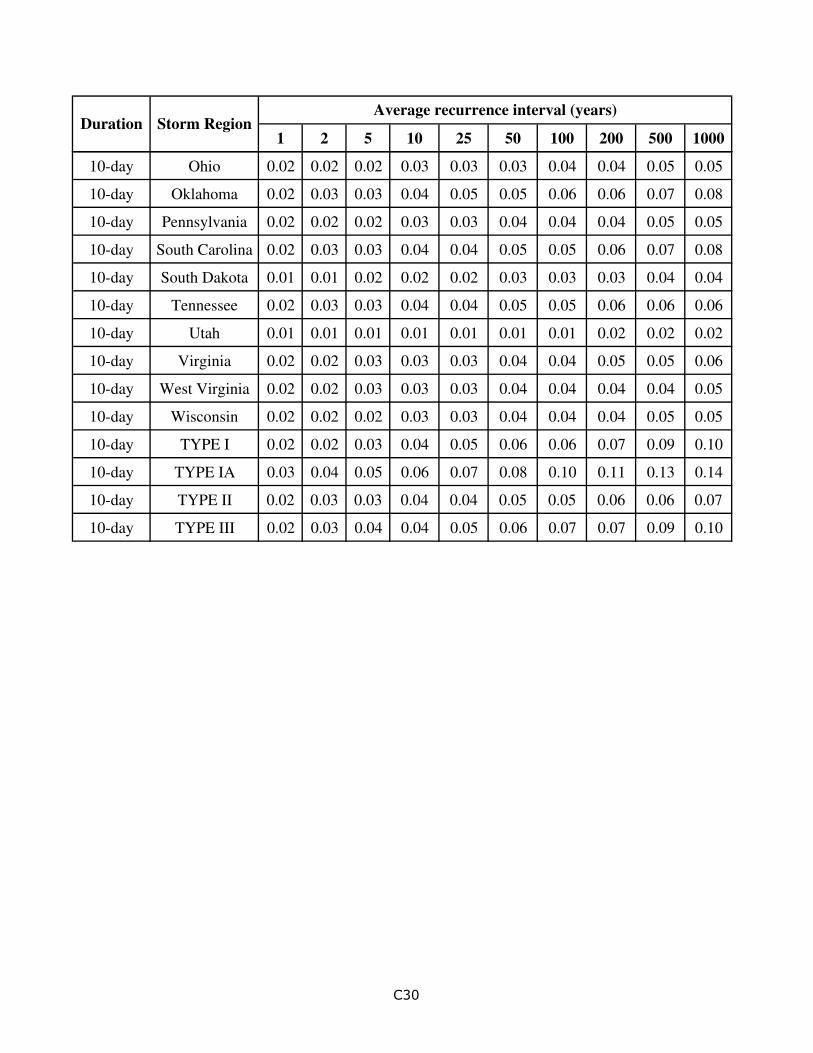
1 2 5 10 25 50 100 200 500 1000Duration Storm Region
Average recurrence interval (years)
10-day Ohio 0.02 0.02 0.02 0.03 0.03 0.03 0.04 0.04 0.05 0.05
10-day Oklahoma 0.02 0.03 0.03 0.04 0.05 0.05 0.06 0.06 0.07 0.08
10-day Pennsylvania 0.02 0.02 0.02 0.03 0.03 0.04 0.04 0.04 0.05 0.05
10-day South Carolina 0.02 0.03 0.03 0.04 0.04 0.05 0.05 0.06 0.07 0.08
10-day South Dakota 0.01 0.01 0.02 0.02 0.02 0.03 0.03 0.03 0.04 0.04
10-day Tennessee 0.02 0.03 0.03 0.04 0.04 0.05 0.05 0.06 0.06 0.06
10-day Utah 0.01 0.01 0.01 0.01 0.01 0.01 0.01 0.02 0.02 0.02
10-day Virginia 0.02 0.02 0.03 0.03 0.03 0.04 0.04 0.05 0.05 0.06
10-day West Virginia 0.02 0.02 0.03 0.03 0.03 0.04 0.04 0.04 0.04 0.05
10-day Wisconsin 0.02 0.02 0.02 0.03 0.03 0.04 0.04 0.04 0.05 0.05
10-day TYPE I 0.02 0.02 0.03 0.04 0.05 0.06 0.06 0.07 0.09 0.10
10-day TYPE IA 0.03 0.04 0.05 0.06 0.07 0.08 0.10 0.11 0.13 0.14
10-day TYPE II 0.02 0.03 0.03 0.04 0.04 0.05 0.05 0.06 0.06 0.07
10-day TYPE III 0.02 0.03 0.04 0.04 0.05 0.06 0.07 0.07 0.09 0.10
C30

1 2 5 10 25 50 100 200 500 1000Duration Storm Region
Average recurrence interval (years)
20-day Alabama 0.02 0.02 0.02 0.03 0.03 0.04 0.04 0.05 0.05 0.06
20-day Alaska 0.01 0.01 0.01 0.01 0.01 0.01 0.01 0.02 0.02 0.02
20-day Arizona 0.01 0.01 0.01 0.01 0.02 0.02 0.02 0.02 0.02 0.03
20-day Arkansas 0.02 0.02 0.02 0.03 0.03 0.03 0.03 0.04 0.04 0.04
20-day California 0.02 0.02 0.03 0.04 0.05 0.05 0.06 0.07 0.08 0.08
20-day Colorado 0.01 0.01 0.01 0.01 0.01 0.01 0.01 0.01 0.02 0.02
20-day Delaware 0.01 0.02 0.02 0.02 0.02 0.03 0.03 0.03 0.04 0.04
20-day Florida 0.02 0.02 0.03 0.03 0.03 0.04 0.04 0.05 0.05 0.06
20-day Georgia 0.02 0.02 0.02 0.02 0.03 0.03 0.03 0.04 0.04 0.04
20-day Hawaii 0.04 0.05 0.06 0.07 0.09 0.11 0.12 0.14 0.16 0.19
20-day Illinois 0.01 0.01 0.02 0.02 0.02 0.02 0.03 0.03 0.03 0.03
20-day Indiana 0.01 0.01 0.02 0.02 0.02 0.02 0.03 0.03 0.03 0.03
20-day Iowa 0.01 0.02 0.02 0.02 0.02 0.03 0.03 0.03 0.04 0.04
20-day Kansas 0.01 0.01 0.02 0.02 0.02 0.03 0.03 0.03 0.04 0.04
20-day Kentucky 0.02 0.02 0.02 0.02 0.03 0.03 0.03 0.03 0.04 0.04
20-day Louisiana 0.02 0.02 0.03 0.03 0.04 0.04 0.05 0.06 0.07 0.07
20-day Maryland 0.01 0.02 0.02 0.02 0.02 0.03 0.03 0.03 0.04 0.04
20-day Michigan 0.01 0.01 0.01 0.02 0.02 0.02 0.02 0.03 0.03 0.03
20-day Minnesota 0.01 0.01 0.02 0.02 0.02 0.02 0.02 0.03 0.03 0.03
20-day Mississippi 0.02 0.02 0.02 0.03 0.03 0.03 0.04 0.04 0.04 0.05
20-day Missouri 0.02 0.02 0.02 0.02 0.03 0.03 0.03 0.03 0.04 0.04
20-day Nebraska 0.01 0.01 0.01 0.02 0.02 0.02 0.02 0.02 0.03 0.03
20-day Nevada 0.01 0.01 0.01 0.01 0.02 0.02 0.02 0.02 0.03 0.03
20-day New Jersey 0.01 0.02 0.02 0.02 0.02 0.03 0.03 0.03 0.04 0.04
20-day New Mexico 0.01 0.01 0.01 0.01 0.01 0.02 0.02 0.02 0.02 0.02
20-day North Carolina 0.01 0.02 0.02 0.02 0.03 0.03 0.03 0.03 0.04 0.04
20-day North Dakota 0.01 0.01 0.01 0.01 0.02 0.02 0.02 0.02 0.03 0.03
C31

1 2 5 10 25 50 100 200 500 1000Duration Storm Region
Average recurrence interval (years)
20-day Ohio 0.01 0.01 0.02 0.02 0.02 0.02 0.02 0.03 0.03 0.03
20-day Oklahoma 0.02 0.02 0.02 0.02 0.03 0.03 0.03 0.04 0.04 0.05
20-day Pennsylvania 0.01 0.01 0.02 0.02 0.02 0.02 0.02 0.03 0.03 0.03
20-day South Carolina 0.01 0.02 0.02 0.02 0.03 0.03 0.03 0.04 0.04 0.04
20-day South Dakota 0.01 0.01 0.01 0.01 0.02 0.02 0.02 0.02 0.02 0.02
20-day Tennessee 0.02 0.02 0.02 0.03 0.03 0.03 0.03 0.03 0.04 0.04
20-day Utah 0.00 0.00 0.01 0.01 0.01 0.01 0.01 0.01 0.01 0.01
20-day Virginia 0.01 0.01 0.02 0.02 0.02 0.02 0.03 0.03 0.03 0.03
20-day West Virginia 0.01 0.02 0.02 0.02 0.02 0.02 0.03 0.03 0.03 0.03
20-day Wisconsin 0.01 0.01 0.02 0.02 0.02 0.02 0.02 0.03 0.03 0.03
20-day TYPE I 0.01 0.01 0.02 0.02 0.03 0.03 0.04 0.05 0.05 0.06
20-day TYPE IA 0.02 0.02 0.03 0.04 0.05 0.05 0.06 0.07 0.08 0.08
20-day TYPE II 0.02 0.02 0.02 0.02 0.03 0.03 0.03 0.04 0.04 0.04
20-day TYPE III 0.02 0.02 0.02 0.03 0.03 0.04 0.04 0.05 0.05 0.06
C32
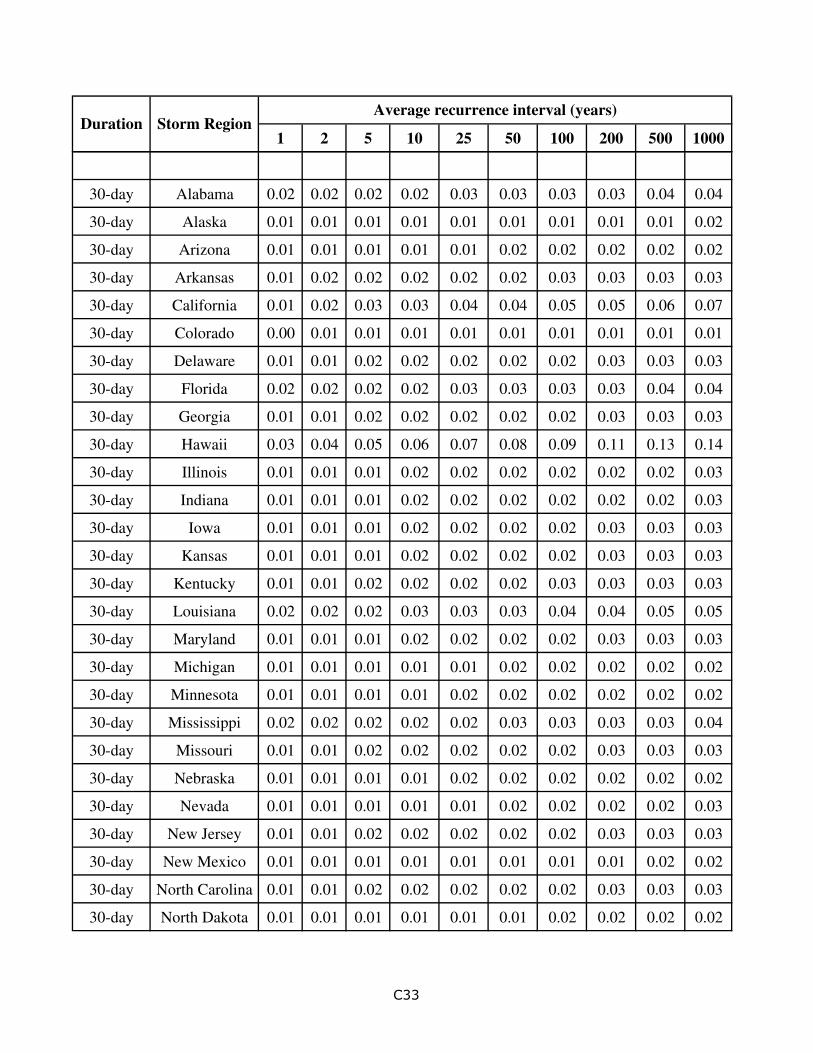
1 2 5 10 25 50 100 200 500 1000Duration Storm Region
Average recurrence interval (years)
30-day Alabama 0.02 0.02 0.02 0.02 0.03 0.03 0.03 0.03 0.04 0.04
30-day Alaska 0.01 0.01 0.01 0.01 0.01 0.01 0.01 0.01 0.01 0.02
30-day Arizona 0.01 0.01 0.01 0.01 0.01 0.02 0.02 0.02 0.02 0.02
30-day Arkansas 0.01 0.02 0.02 0.02 0.02 0.02 0.03 0.03 0.03 0.03
30-day California 0.01 0.02 0.03 0.03 0.04 0.04 0.05 0.05 0.06 0.07
30-day Colorado 0.00 0.01 0.01 0.01 0.01 0.01 0.01 0.01 0.01 0.01
30-day Delaware 0.01 0.01 0.02 0.02 0.02 0.02 0.02 0.03 0.03 0.03
30-day Florida 0.02 0.02 0.02 0.02 0.03 0.03 0.03 0.03 0.04 0.04
30-day Georgia 0.01 0.01 0.02 0.02 0.02 0.02 0.02 0.03 0.03 0.03
30-day Hawaii 0.03 0.04 0.05 0.06 0.07 0.08 0.09 0.11 0.13 0.14
30-day Illinois 0.01 0.01 0.01 0.02 0.02 0.02 0.02 0.02 0.02 0.03
30-day Indiana 0.01 0.01 0.01 0.02 0.02 0.02 0.02 0.02 0.02 0.03
30-day Iowa 0.01 0.01 0.01 0.02 0.02 0.02 0.02 0.03 0.03 0.03
30-day Kansas 0.01 0.01 0.01 0.02 0.02 0.02 0.02 0.03 0.03 0.03
30-day Kentucky 0.01 0.01 0.02 0.02 0.02 0.02 0.03 0.03 0.03 0.03
30-day Louisiana 0.02 0.02 0.02 0.03 0.03 0.03 0.04 0.04 0.05 0.05
30-day Maryland 0.01 0.01 0.01 0.02 0.02 0.02 0.02 0.03 0.03 0.03
30-day Michigan 0.01 0.01 0.01 0.01 0.01 0.02 0.02 0.02 0.02 0.02
30-day Minnesota 0.01 0.01 0.01 0.01 0.02 0.02 0.02 0.02 0.02 0.02
30-day Mississippi 0.02 0.02 0.02 0.02 0.02 0.03 0.03 0.03 0.03 0.04
30-day Missouri 0.01 0.01 0.02 0.02 0.02 0.02 0.02 0.03 0.03 0.03
30-day Nebraska 0.01 0.01 0.01 0.01 0.02 0.02 0.02 0.02 0.02 0.02
30-day Nevada 0.01 0.01 0.01 0.01 0.01 0.02 0.02 0.02 0.02 0.03
30-day New Jersey 0.01 0.01 0.02 0.02 0.02 0.02 0.02 0.03 0.03 0.03
30-day New Mexico 0.01 0.01 0.01 0.01 0.01 0.01 0.01 0.01 0.02 0.02
30-day North Carolina 0.01 0.01 0.02 0.02 0.02 0.02 0.02 0.03 0.03 0.03
30-day North Dakota 0.01 0.01 0.01 0.01 0.01 0.01 0.02 0.02 0.02 0.02
C33
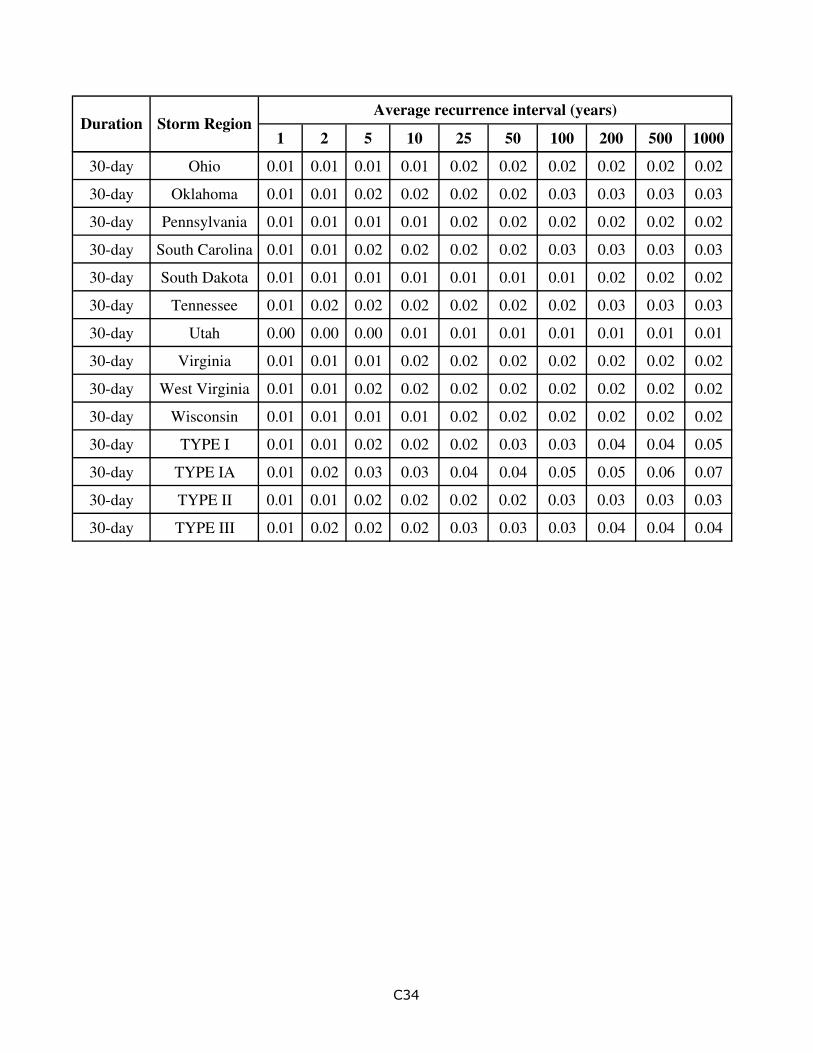
1 2 5 10 25 50 100 200 500 1000Duration Storm Region
Average recurrence interval (years)
30-day Ohio 0.01 0.01 0.01 0.01 0.02 0.02 0.02 0.02 0.02 0.02
30-day Oklahoma 0.01 0.01 0.02 0.02 0.02 0.02 0.03 0.03 0.03 0.03
30-day Pennsylvania 0.01 0.01 0.01 0.01 0.02 0.02 0.02 0.02 0.02 0.02
30-day South Carolina 0.01 0.01 0.02 0.02 0.02 0.02 0.03 0.03 0.03 0.03
30-day South Dakota 0.01 0.01 0.01 0.01 0.01 0.01 0.01 0.02 0.02 0.02
30-day Tennessee 0.01 0.02 0.02 0.02 0.02 0.02 0.02 0.03 0.03 0.03
30-day Utah 0.00 0.00 0.00 0.01 0.01 0.01 0.01 0.01 0.01 0.01
30-day Virginia 0.01 0.01 0.01 0.02 0.02 0.02 0.02 0.02 0.02 0.02
30-day West Virginia 0.01 0.01 0.02 0.02 0.02 0.02 0.02 0.02 0.02 0.02
30-day Wisconsin 0.01 0.01 0.01 0.01 0.02 0.02 0.02 0.02 0.02 0.02
30-day TYPE I 0.01 0.01 0.02 0.02 0.02 0.03 0.03 0.04 0.04 0.05
30-day TYPE IA 0.01 0.02 0.03 0.03 0.04 0.04 0.05 0.05 0.06 0.07
30-day TYPE II 0.01 0.01 0.02 0.02 0.02 0.02 0.03 0.03 0.03 0.03
30-day TYPE III 0.01 0.02 0.02 0.02 0.03 0.03 0.03 0.04 0.04 0.04
C34
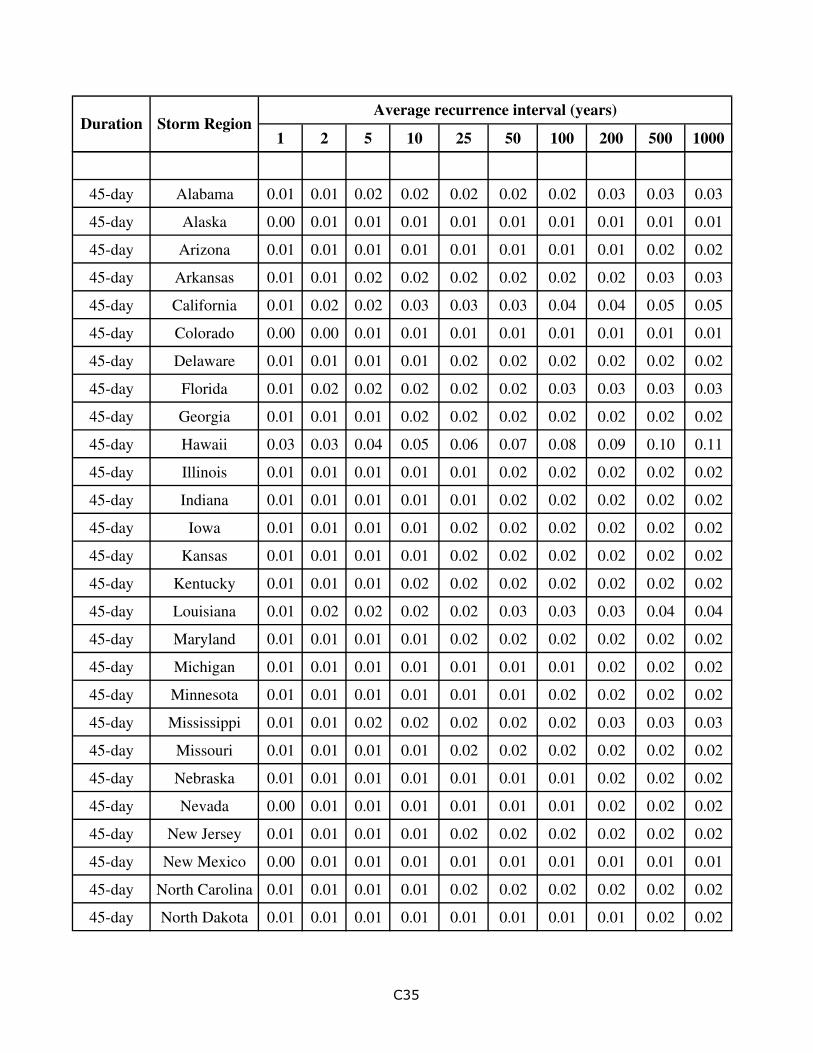
1 2 5 10 25 50 100 200 500 1000Duration Storm Region
Average recurrence interval (years)
45-day Alabama 0.01 0.01 0.02 0.02 0.02 0.02 0.02 0.03 0.03 0.03
45-day Alaska 0.00 0.01 0.01 0.01 0.01 0.01 0.01 0.01 0.01 0.01
45-day Arizona 0.01 0.01 0.01 0.01 0.01 0.01 0.01 0.01 0.02 0.02
45-day Arkansas 0.01 0.01 0.02 0.02 0.02 0.02 0.02 0.02 0.03 0.03
45-day California 0.01 0.02 0.02 0.03 0.03 0.03 0.04 0.04 0.05 0.05
45-day Colorado 0.00 0.00 0.01 0.01 0.01 0.01 0.01 0.01 0.01 0.01
45-day Delaware 0.01 0.01 0.01 0.01 0.02 0.02 0.02 0.02 0.02 0.02
45-day Florida 0.01 0.02 0.02 0.02 0.02 0.02 0.03 0.03 0.03 0.03
45-day Georgia 0.01 0.01 0.01 0.02 0.02 0.02 0.02 0.02 0.02 0.02
45-day Hawaii 0.03 0.03 0.04 0.05 0.06 0.07 0.08 0.09 0.10 0.11
45-day Illinois 0.01 0.01 0.01 0.01 0.01 0.02 0.02 0.02 0.02 0.02
45-day Indiana 0.01 0.01 0.01 0.01 0.01 0.02 0.02 0.02 0.02 0.02
45-day Iowa 0.01 0.01 0.01 0.01 0.02 0.02 0.02 0.02 0.02 0.02
45-day Kansas 0.01 0.01 0.01 0.01 0.02 0.02 0.02 0.02 0.02 0.02
45-day Kentucky 0.01 0.01 0.01 0.02 0.02 0.02 0.02 0.02 0.02 0.02
45-day Louisiana 0.01 0.02 0.02 0.02 0.02 0.03 0.03 0.03 0.04 0.04
45-day Maryland 0.01 0.01 0.01 0.01 0.02 0.02 0.02 0.02 0.02 0.02
45-day Michigan 0.01 0.01 0.01 0.01 0.01 0.01 0.01 0.02 0.02 0.02
45-day Minnesota 0.01 0.01 0.01 0.01 0.01 0.01 0.02 0.02 0.02 0.02
45-day Mississippi 0.01 0.01 0.02 0.02 0.02 0.02 0.02 0.03 0.03 0.03
45-day Missouri 0.01 0.01 0.01 0.01 0.02 0.02 0.02 0.02 0.02 0.02
45-day Nebraska 0.01 0.01 0.01 0.01 0.01 0.01 0.01 0.02 0.02 0.02
45-day Nevada 0.00 0.01 0.01 0.01 0.01 0.01 0.01 0.02 0.02 0.02
45-day New Jersey 0.01 0.01 0.01 0.01 0.02 0.02 0.02 0.02 0.02 0.02
45-day New Mexico 0.00 0.01 0.01 0.01 0.01 0.01 0.01 0.01 0.01 0.01
45-day North Carolina 0.01 0.01 0.01 0.01 0.02 0.02 0.02 0.02 0.02 0.02
45-day North Dakota 0.01 0.01 0.01 0.01 0.01 0.01 0.01 0.01 0.02 0.02
C35
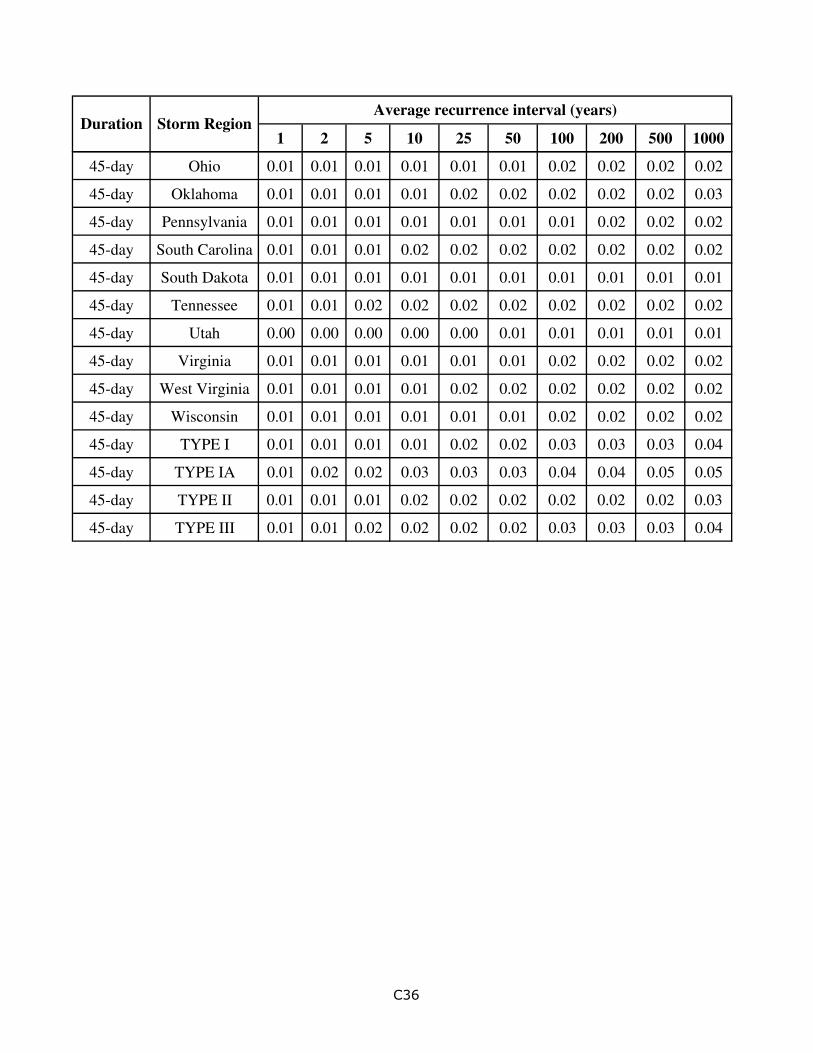
1 2 5 10 25 50 100 200 500 1000Duration Storm Region
Average recurrence interval (years)
45-day Ohio 0.01 0.01 0.01 0.01 0.01 0.01 0.02 0.02 0.02 0.02
45-day Oklahoma 0.01 0.01 0.01 0.01 0.02 0.02 0.02 0.02 0.02 0.03
45-day Pennsylvania 0.01 0.01 0.01 0.01 0.01 0.01 0.01 0.02 0.02 0.02
45-day South Carolina 0.01 0.01 0.01 0.02 0.02 0.02 0.02 0.02 0.02 0.02
45-day South Dakota 0.01 0.01 0.01 0.01 0.01 0.01 0.01 0.01 0.01 0.01
45-day Tennessee 0.01 0.01 0.02 0.02 0.02 0.02 0.02 0.02 0.02 0.02
45-day Utah 0.00 0.00 0.00 0.00 0.00 0.01 0.01 0.01 0.01 0.01
45-day Virginia 0.01 0.01 0.01 0.01 0.01 0.01 0.02 0.02 0.02 0.02
45-day West Virginia 0.01 0.01 0.01 0.01 0.02 0.02 0.02 0.02 0.02 0.02
45-day Wisconsin 0.01 0.01 0.01 0.01 0.01 0.01 0.02 0.02 0.02 0.02
45-day TYPE I 0.01 0.01 0.01 0.01 0.02 0.02 0.03 0.03 0.03 0.04
45-day TYPE IA 0.01 0.02 0.02 0.03 0.03 0.03 0.04 0.04 0.05 0.05
45-day TYPE II 0.01 0.01 0.01 0.02 0.02 0.02 0.02 0.02 0.02 0.03
45-day TYPE III 0.01 0.01 0.02 0.02 0.02 0.02 0.03 0.03 0.03 0.04
C36
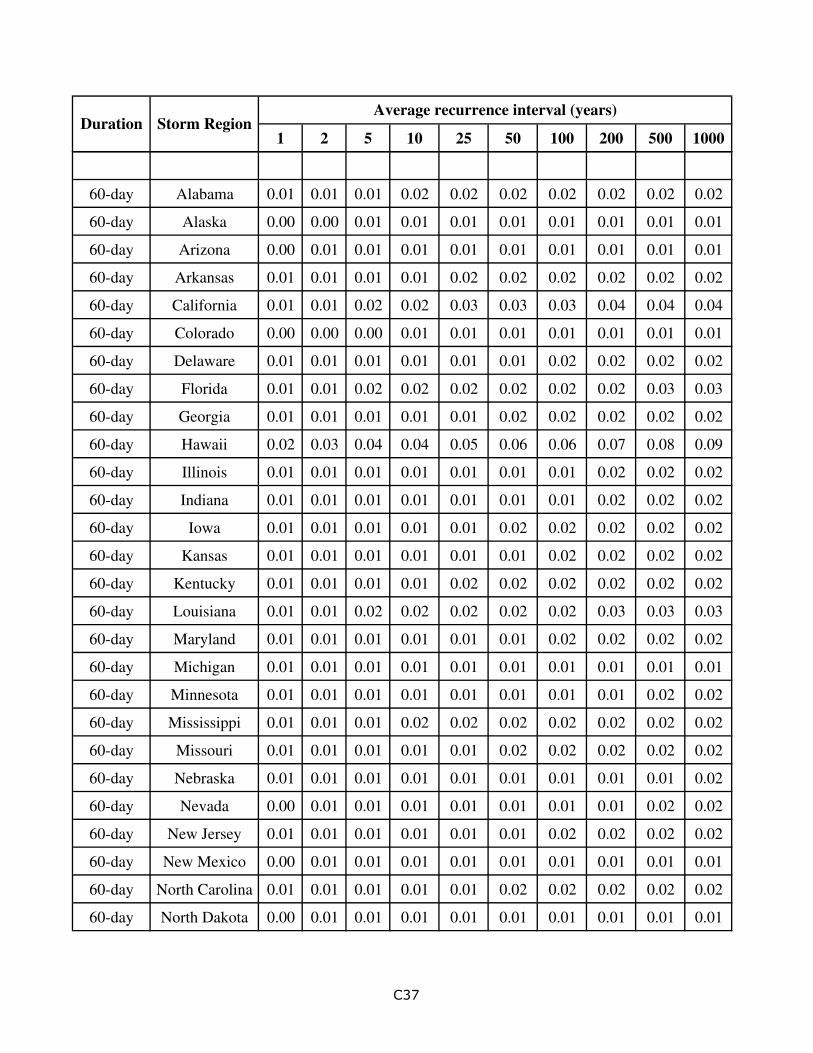
1 2 5 10 25 50 100 200 500 1000Duration Storm Region
Average recurrence interval (years)
60-day Alabama 0.01 0.01 0.01 0.02 0.02 0.02 0.02 0.02 0.02 0.02
60-day Alaska 0.00 0.00 0.01 0.01 0.01 0.01 0.01 0.01 0.01 0.01
60-day Arizona 0.00 0.01 0.01 0.01 0.01 0.01 0.01 0.01 0.01 0.01
60-day Arkansas 0.01 0.01 0.01 0.01 0.02 0.02 0.02 0.02 0.02 0.02
60-day California 0.01 0.01 0.02 0.02 0.03 0.03 0.03 0.04 0.04 0.04
60-day Colorado 0.00 0.00 0.00 0.01 0.01 0.01 0.01 0.01 0.01 0.01
60-day Delaware 0.01 0.01 0.01 0.01 0.01 0.01 0.02 0.02 0.02 0.02
60-day Florida 0.01 0.01 0.02 0.02 0.02 0.02 0.02 0.02 0.03 0.03
60-day Georgia 0.01 0.01 0.01 0.01 0.01 0.02 0.02 0.02 0.02 0.02
60-day Hawaii 0.02 0.03 0.04 0.04 0.05 0.06 0.06 0.07 0.08 0.09
60-day Illinois 0.01 0.01 0.01 0.01 0.01 0.01 0.01 0.02 0.02 0.02
60-day Indiana 0.01 0.01 0.01 0.01 0.01 0.01 0.01 0.02 0.02 0.02
60-day Iowa 0.01 0.01 0.01 0.01 0.01 0.02 0.02 0.02 0.02 0.02
60-day Kansas 0.01 0.01 0.01 0.01 0.01 0.01 0.02 0.02 0.02 0.02
60-day Kentucky 0.01 0.01 0.01 0.01 0.02 0.02 0.02 0.02 0.02 0.02
60-day Louisiana 0.01 0.01 0.02 0.02 0.02 0.02 0.02 0.03 0.03 0.03
60-day Maryland 0.01 0.01 0.01 0.01 0.01 0.01 0.02 0.02 0.02 0.02
60-day Michigan 0.01 0.01 0.01 0.01 0.01 0.01 0.01 0.01 0.01 0.01
60-day Minnesota 0.01 0.01 0.01 0.01 0.01 0.01 0.01 0.01 0.02 0.02
60-day Mississippi 0.01 0.01 0.01 0.02 0.02 0.02 0.02 0.02 0.02 0.02
60-day Missouri 0.01 0.01 0.01 0.01 0.01 0.02 0.02 0.02 0.02 0.02
60-day Nebraska 0.01 0.01 0.01 0.01 0.01 0.01 0.01 0.01 0.01 0.02
60-day Nevada 0.00 0.01 0.01 0.01 0.01 0.01 0.01 0.01 0.02 0.02
60-day New Jersey 0.01 0.01 0.01 0.01 0.01 0.01 0.02 0.02 0.02 0.02
60-day New Mexico 0.00 0.01 0.01 0.01 0.01 0.01 0.01 0.01 0.01 0.01
60-day North Carolina 0.01 0.01 0.01 0.01 0.01 0.02 0.02 0.02 0.02 0.02
60-day North Dakota 0.00 0.01 0.01 0.01 0.01 0.01 0.01 0.01 0.01 0.01
C37

1 2 5 10 25 50 100 200 500 1000Duration Storm Region
Average recurrence interval (years)
60-day Ohio 0.01 0.01 0.01 0.01 0.01 0.01 0.01 0.01 0.02 0.02
60-day Oklahoma 0.01 0.01 0.01 0.01 0.01 0.02 0.02 0.02 0.02 0.02
60-day Pennsylvania 0.01 0.01 0.01 0.01 0.01 0.01 0.01 0.01 0.01 0.01
60-day South Carolina 0.01 0.01 0.01 0.01 0.01 0.02 0.02 0.02 0.02 0.02
60-day South Dakota 0.01 0.01 0.01 0.01 0.01 0.01 0.01 0.01 0.01 0.01
60-day Tennessee 0.01 0.01 0.01 0.01 0.02 0.02 0.02 0.02 0.02 0.02
60-day Utah 0.00 0.00 0.00 0.00 0.00 0.00 0.01 0.01 0.01 0.01
60-day Virginia 0.01 0.01 0.01 0.01 0.01 0.01 0.01 0.01 0.01 0.02
60-day West Virginia 0.01 0.01 0.01 0.01 0.01 0.01 0.02 0.02 0.02 0.02
60-day Wisconsin 0.01 0.01 0.01 0.01 0.01 0.01 0.01 0.01 0.02 0.02
60-day TYPE I 0.01 0.01 0.01 0.01 0.02 0.02 0.02 0.02 0.03 0.03
60-day TYPE IA 0.01 0.01 0.02 0.02 0.03 0.03 0.03 0.04 0.04 0.04
60-day TYPE II 0.01 0.01 0.01 0.01 0.02 0.02 0.02 0.02 0.02 0.02
60-day TYPE III 0.01 0.01 0.01 0.02 0.02 0.02 0.02 0.02 0.03 0.03
C38
97
REFERENCES
American Society for Testing and Materials (ASTM). (2007). “Standard Test Method for
Infiltration Rate of In Place Concrete.” C1701/C1701M-09, West Conshohocken, Pa.
American Society for Testing and Materials (ASTM). (2013). “Standard Test Method for
Infiltration Rate of Permeable Unit Pavement.” C1781-13, West Conshohocken, Pa, 1-3.
American Public Works Association. (2011). The Clean Water Team Guidance Compendium for
Watershed Monitoring and Assessment State Water Resources Control Board 5.1.3 FS-
(RC)
Barnard, T. (May 2002). “Compliance with Phase II Stormwater Regulations.” Pollution
Engineering. 34,5. 20.
Cass County Government. (2014). “6 Minimum Control Measures.” Stormwater
Management.
https://www.casscountynd.gov/county/depts/planning/Pages/StormwaterManagement.asp
x
Collins, K., Hunt, W., and Hathaway, J. (2008). ”Hydrologic Comparison of Four Types
of Permeable Pavement and Standard Asphalt in Eastern North Carolina.” Journal of
Hydrologic Engineering. 13,12. 1146–1157.
District Department of the Environment. (2012) “Chapter 3.4. Permeable Pavement
Systems.” Draft District of Columbia Stormwater Management Guidebook. 74-95.
District of Columbia
Environmental Protection Agency. (August 1999). “Preliminary Data Summary of Urban
Stormwater Best Management Practices.” EPA-821-R-99-012.
United States Protection Agency: EPA-Office of Water. Washington D.C.

98
Environmental Protection Agency. (September 2004). “Stormwater Best Management
Practice Design Guide: Volume 1 General Considerations.” EPA/600/R-04/12. Office of
Research and Development. Washington D.C.
Environmental Protection Agency. (2005). “National Management Measures to Control
Nonpoint Source Pollution from Urban Areas.” EPA-841-B-05-004.
United States Protection Agency: EPA-Office of Water. Washington D.C.
Environmental Protection Agency. (2011). “Point Source.” EPA 40 CFR 122.2.
United States Protection Agency: EPA-Office of Water. Washington D.C.
Environmental Protection Agency. (2014). “Best Management Practices.”
United States Protection Agency: EPA-Office of Water. Washington D.C.
Environmental Protection Agency. (2014). “Water: Polluted Runoff.”
United States Protection Agency: EPA-Office of Water. Washington D.C.
Environmental Protection Agency. (2015). “Water: Stormwater.”
United States Protection Agency: EPA-Office of Water. Washington D.C.
Fassman, E.A. and Blackbourn, S. (2010). “Permeable Pavement Performance over 3
Years of Monitoring.” American Society of Civil Engineers Low Impact Development
2010: Redefining Water in the City. 152-165.
Hunt, III, W. (2010). “Working with Regulators to Change Permeable Pavements
Acceptance.” American Society of Civil Engineers Low Impact Development 2010:
Redefining Water in the City. 1270-1280.
Interlocking Concrete Pavement Institute. (2014). “Design.” Chantilly, VA.
http://www.icpi.org/
Interlocking Concrete Pavement Institute. (2014). “Permeable Pavement Cross Section.”
99
Chantilly, VA. http://www.icpi.org/node/2960
Interlocking Concrete Pavement Institute. (2014). “Tech Spec 18: Construction of
Permeable Interlocking Concrete Pavement Systems.” Chantilly, VA.
Kinnas. (2000). “Application of Bernoulli Equation to Venturi Meter.” University of
Texas at Austin. Austin, TX.
Kim, J. Y. et al.. “Investigation of Hydraulic Capacity and Water Quality Modification of
Stormwater by Permeable Interlocking Concrete Pavement (PICP) System,” Florida Gulf
Coast University.
McCall III, D.K., (2014). “Clean Water Act”. Environmental Law Handbook. 22nd
Edition, 329-394.
Mullaney, J. and Lucke, T. (December 2013). “Practical Review of Pervious Pavement
Designs.” CLEAN- Soil, Air, and Water. 42,2. 111—124.
National Oceanic and Atmospheric Association’s National Weather Service. (2014).
“Hydrometerological Design Studies Center Precipitation Frequency Data Server
(PFDAS)” Silver Spring, MD. http://hdsc.nws.noaa.gov/hdsc/pfds/
United States Department of Agriculture’s Natural Resource Conservations, (1986). Urban
Hydrology for Small Watershed Technical Release-55. Washington, DC.
Richardson, J. (1989). "The Effects of Moving Precipitation Fields on Overland Flow Using
One-Dimensional Finite Elements.” Colorado State University. Rutgers, the State
University of New Jersey. (2015). “Rain Barrels.”
http://water.rutgers.edu/Stormwater_Management/rainbarrels.html
Smith, D.R. and Hunt, III, W. (2010). “Structural/Hydrologic Design and Maintenance of

100
Permeable Interlocking Concrete Pavers.” American Society of Civil Engineers Low
Impact Development 2010: Redefining Water in the City. 360-377.
State University of New York College of Environmental Science and Forestry. (SUNY-
ESF). (2015). “Rain Gardens.”
http://www.esf.edu/ere/endreny/GICalculator/RainGardenIntro.html
Virginia DCR Stormwater Design Specification No. 7: Permeable Pavement Version
1.7. 2010.
White, S. S., and Boswell, M. R. (2007.) “Stormwater Quality and Local Government
Innovation.” Journal of the American Planning Association 73, 2: 185-193.
Urban Hydrology for Small Watersheds (TR-55), US Department of
Agriculture,
ftp://ftp.wcc.nrcs.usda.gov/downloads/hydrology_hydraulics/tr55/tr55.pdf (1986).

101
VITA
Monica Rene Stochl was born on November 29th 1990 in Iquitos, Peru. She attended
Nerinx Hall High School in Saint Louis, Missouri. She then received her Bachelor of Science in
Civil Engineering in 2013 from Saint Louis University in Saint Louis Missouri. While receiving
her undergraduate degree, Monica interned for the Metropolitan Saint Louis Sewer District and
Frontenac Engineering in Saint Louis Missouri. She was part of the capstone design team, which
created the BMPs currently set on the Saint Louis University campus. She is currently working
at a Water Engineer at CH2M in the Kansas City office. She intends to pursue her career in
water resource management and green infrastructure design.