Hydraulic Conductivity of Near-Surface Alluvium in the … in cooperation with the EL DORADO COUNTY...
18
Prepared in cooperation with the EL DORADO COUNTY DEPARTMENT OF TRANSPORTATION, TAHOE ENGINEERING UNIT and CALIFORNIA TAHOE CONSERVANCY Hydraulic Conductivity of Near-Surface Alluvium in the Vicinity of Cattlemans Detention Basin, South Lake Tahoe, California U.S. Department of the Interior U.S. Geological Survey Open-File Report 2004-1201
Transcript of Hydraulic Conductivity of Near-Surface Alluvium in the … in cooperation with the EL DORADO COUNTY...

Hydraulic Conductivity of Near-Surface Alluvium in the Vicinity of Cattlemans Detention Basin, South Lake Tahoe, California
Open-File Report 2004-1201
Prepared in cooperation with the EL DORADO COUNTY DEPARTMENT OF TRANSPORTATION, TAHOE ENGINEERING UNIT and CALIFORNIA TAHOE CONSERVANCY
U.S. Department of the Interior U.S. Geological Survey

(Back of Cover)
U.S. Department of the Interior U.S. Geological Survey
Hydraulic Conductivity of Near-Surface Alluvium in the Vicinity of Cattlemans Detention Basin, South Lake Tahoe, California
By Jena M. Green, Katherine K. Henkelman, and Rachel M. Caskey
Open-File Report 2004-1201
Prepared in cooperation with the EL DORADO COUNTY DEPARTMENT OF TRANSPORTATION, TAHOE ENGINEERING UNIT and CALIFORNIA TAHOE CONSERVANCY
Carson City, Nevada
2004

U.S. DEPARTMENT OF THE INTERIORGALE A. NORTON, Secretary
U.S. GEOLOGICAL SURVEYCHARLES G. GROAT, Director
Any use of trade, product, or firm names in this publication is for descriptive purposes only and does not imply endorsement by the U.S. Government
For additional information Copies of this report can be contact: purchased from: District Chief U.S. Geological Survey U.S. Geological Survey Information Services 333 West Nye Lane, Room 203 Building 810 Carson City, NV 89706–0866 Box 25286, Federal Center
Denver, CO 80225–0286
email: [email protected]
http://nevada.usgs.gov

CONTENTS iii
CONTENTS
Abstract.................................................................................................................................................................................. 1Introduction............................................................................................................................................................................ 1
Purpose and Scope ..................................................................................................................................................... 1Acknowledgments...................................................................................................................................................... 3
Description of Cattlemans Detention Basin .......................................................................................................................... 3Geology of Lake Tahoe and the Detention Basin .................................................................................................................. 3Estimate of Hydraulic Conductivity ...................................................................................................................................... 3
Well Construction....................................................................................................................................................... 3Method ....................................................................................................................................................................... 5Results ........................................................................................................................................................................ 7Discussion .................................................................................................................................................................. 9
Summary and Conclusions .................................................................................................................................................... 10References Cited.................................................................................................................................................................... 11Appendix—Summary of slug-test analyses for wells in vicinity of Cattlemans detention basin, South Lake Tahoe,
California ......................................................................................................................................................................... 13
FIGURES
1. Map showing location of Cattlemans detention basin with respect to Lake Tahoe and California, USA ............. 22. Map showing location of Cattlemans detention basin in relation to Cold Creek, Pioneer Trail, and
Cattlemans Court, South Lake Tahoe, California .................................................................................................. 43. Vertical cross-section showing distribution of alluvial deposits and fill materials between well 3 and well 14
at Cattlemans detention basin, South Lake Tahoe, California ............................................................................... 54. Schematic showing construction of wells near Cattlemans detention basin, South Lake Tahoe, California......... 75. Map showing the distribution of hydraulic conductivity near Cattlemans detention basin, South Lake
Tahoe, California.................................................................................................................................................... 96. Bar graph showing the range of hydraulic conductivity in all tested wells near Cattlemans detention
basin, South Lake Tahoe, California ...................................................................................................................... 10
TABLES
1. Well name, land-surface elevation, and construction data for wells in vicinity of Cattlemans detention basin, South Lake Tahoe, California ...................................................................................................................... 6
2. Results of slug tests in wells near Cattlemans detention basin, South Lake Tahoe, California............................. 8
iv
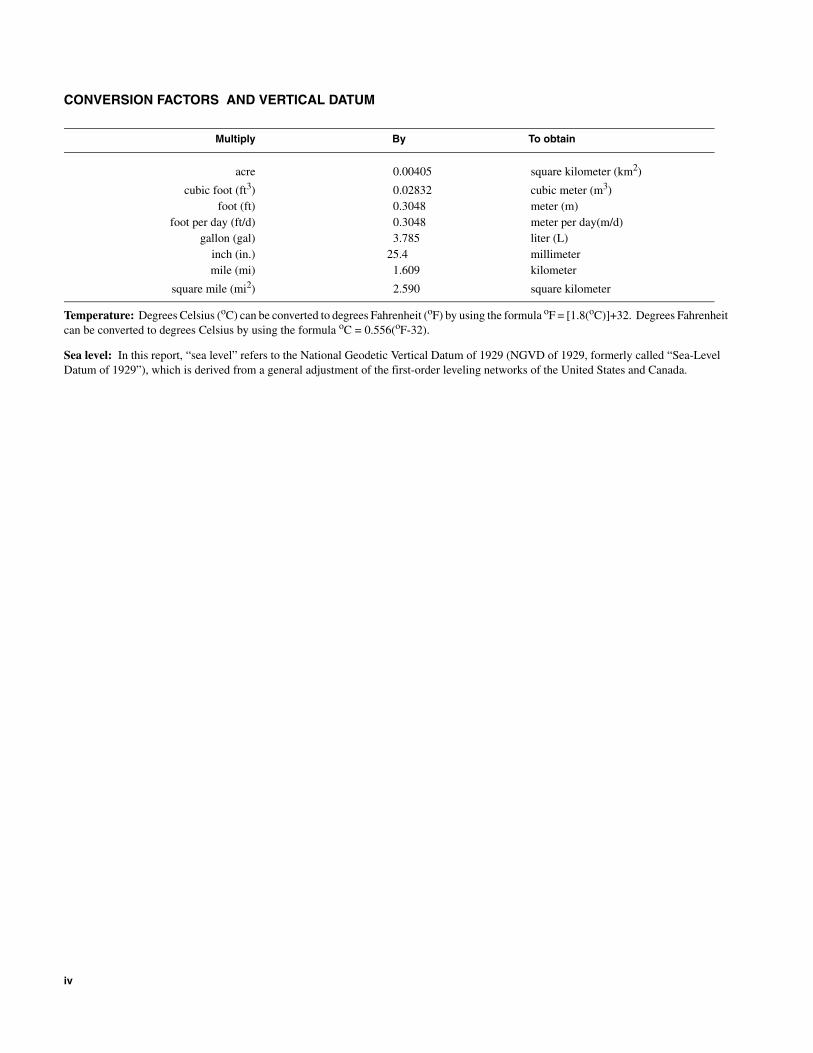
CONVERSION FACTORS AND VERTICAL DATUM
Multiply By To obtain
acre 0.00405 square kilometer (km2)
cubic foot (ft3) 0.02832 cubic meter (m3)foot (ft) 0.3048 meter (m)
foot per day (ft/d) 0.3048 meter per day(m/d)gallon (gal) 3.785 liter (L)
inch (in.) 25.4 millimetermile (mi) 1.609 kilometer
square mile (mi2) 2.590 square kilometer
Temperature: Degrees Celsius (oC) can be converted to degrees Fahrenheit (oF) by using the formula oF = [1.8(oC)]+32. Degrees Fahrenheit can be converted to degrees Celsius by using the formula oC = 0.556(oF-32).
Sea level: In this report, “sea level” refers to the National Geodetic Vertical Datum of 1929 (NGVD of 1929, formerly called “Sea-Level Datum of 1929”), which is derived from a general adjustment of the first-order leveling networks of the United States and Canada.
Hydraulic Conductivity of Near-Surface Alluvium in the Vicinity of Cattlemans Detention Basin, South Lake Tahoe, California
By Jena M. Green, Katherine K. Henkelman, and Rachel M. Caskey
Abstract
Cattlemans detention basin, South Lake Tahoe, California is designed to capture and reduce urban runoff and pollutants originating from developed areas before entering Cold Creek, which is tributary to Trout Creek and to Lake Tahoe. The effectiveness of the basin in reducing sediment and nutrient loads currently is being assessed with a five-year study. Hydraulic conduc-tivity of the alluvium near the detention basin is needed to estimate ground-water flow and subsur-face nutrient transport. Hydraulic conductivity was estimated using slug tests in 27 monitoring wells that surround the detention basin. For each test, water was poured rapidly into a well, changes in water-level were monitored, and the observed changes were analyzed using the Bouwer and Rice method. Each well was tested one to four times. A total of 24 wells were tested more than once. Of the 24 wells, the differences among the tests were within 10 percent of the average. Estimated hydraulic conductivities of basin alluvium range from 0.5 to 70 feet per day with an average of 17.8 feet per day. This range is consistent with the sandy alluvial deposits observed in the area of Cattlemans detention basin.
Introduction
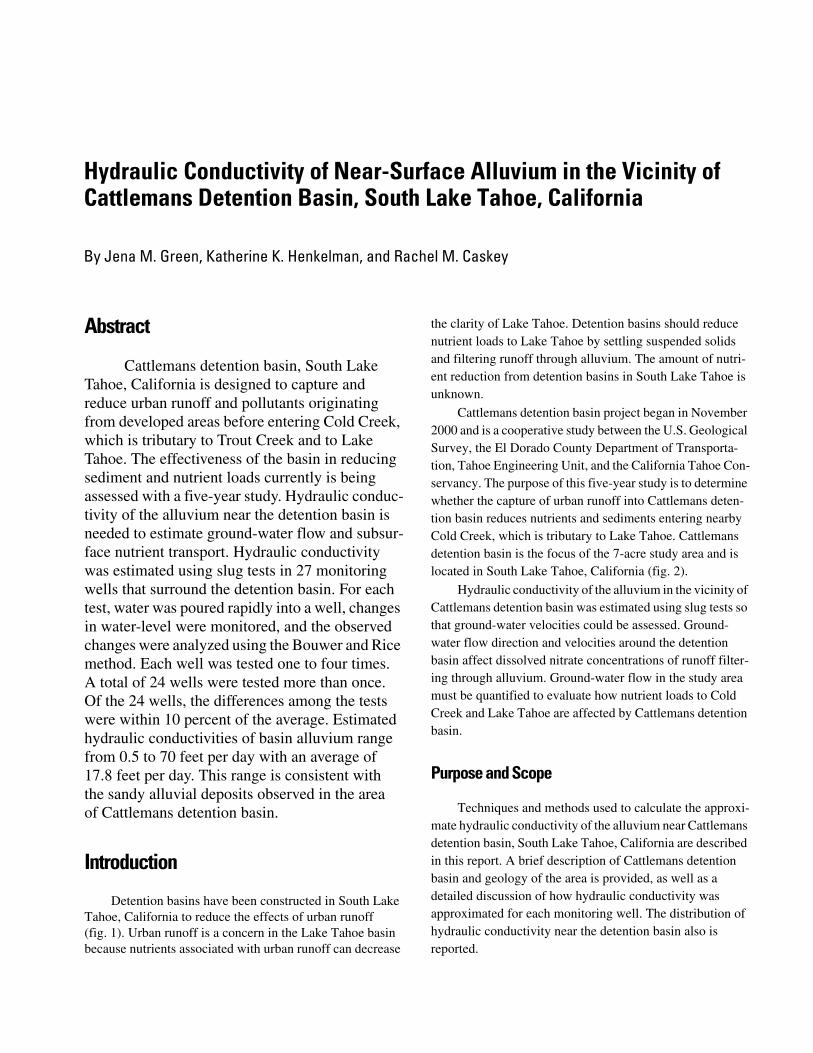
Detention basins have been constructed in South Lake Tahoe, California to reduce the effects of urban runoff (fig. 1). Urban runoff is a concern in the Lake Tahoe basin because nutrients associated with urban runoff can decrease
the clarity of Lake Tahoe. Detention basins should reduce nutrient loads to Lake Tahoe by settling suspended solids and filtering runoff through alluvium. The amount of nutri-ent reduction from detention basins in South Lake Tahoe is unknown.
Cattlemans detention basin project began in November 2000 and is a cooperative study between the U.S. Geological Survey, the El Dorado County Department of Transporta-tion, Tahoe Engineering Unit, and the California Tahoe Con-servancy. The purpose of this five-year study is to determine whether the capture of urban runoff into Cattlemans deten-tion basin reduces nutrients and sediments entering nearby Cold Creek, which is tributary to Lake Tahoe. Cattlemans detention basin is the focus of the 7-acre study area and is located in South Lake Tahoe, California (fig. 2).
Hydraulic conductivity of the alluvium in the vicinity of Cattlemans detention basin was estimated using slug tests so that ground-water velocities could be assessed. Ground-water flow direction and velocities around the detention basin affect dissolved nitrate concentrations of runoff filter-ing through alluvium. Ground-water flow in the study area must be quantified to evaluate how nutrient loads to Cold Creek and Lake Tahoe are affected by Cattlemans detention basin.
Purpose and Scope
Techniques and methods used to calculate the approxi-mate hydraulic conductivity of the alluvium near Cattlemans detention basin, South Lake Tahoe, California are described in this report. A brief description of Cattlemans detention basin and geology of the area is provided, as well as a detailed discussion of how hydraulic conductivity was approximated for each monitoring well. The distribution of hydraulic conductivity near the detention basin also is reported.
2 Hydraulic Conductivity of Near-Surface Sediments in the Vicinity of Cattlemans Detention Basin, South Lake Tahoe, Calif.
89
50
50
50
89
0
0 1 2 3 KILOMETERS
3 MILES21
Nevada
NevadaCalifornia
California
LakeLakeTahoeTahoe
South LakeSouth LakeTahoeTahoe
Tahoe KeysTahoe Keys
MeyersMeyers
StatelineStateline
Trout
C
reek
Upp
erU
pper
Truc
kee
Truc
kee
Riv
erR
iver
NevadaCalifornia
LakeTahoe
South LakeTahoe
Tahoe Keys
Meyers
Stateline
Trout
C
reek
Upp
er
Truc
kee
Riv
erP
ione
erP
ione
er
Trail
Trail
Pio
neer
Trail
Cold C reekCold C reek
120˚00' 119˚55'
38˚55'
38˚50'
Base from U.S. Geological Survey digital data, 1:24,000 and 1:100,000, 1969–85 Universal Transverse Mercator projection, Zone 10
Basin-fill deposits Study area
Bedrock
Boundary of Lake Tahoe BasinBoundary of Trout Creek watershed
EXPLANATION
Areaof map
LakeTahoe
FallenLeaf Lake
CALIFORNIA
NEVADA
SanSanFranciscoFrancisco
RenoReno
SanFrancisco
Reno
Sie
rra
Nevada
Sie
rra
Nevada
Car
son
Ran
geC
arso
nR
ange
Figure 1. Location of Cattlemans detention basin with respect to Lake Tahoe and California.
Description of Cattlemans Detention Basin 3
Acknowledgments
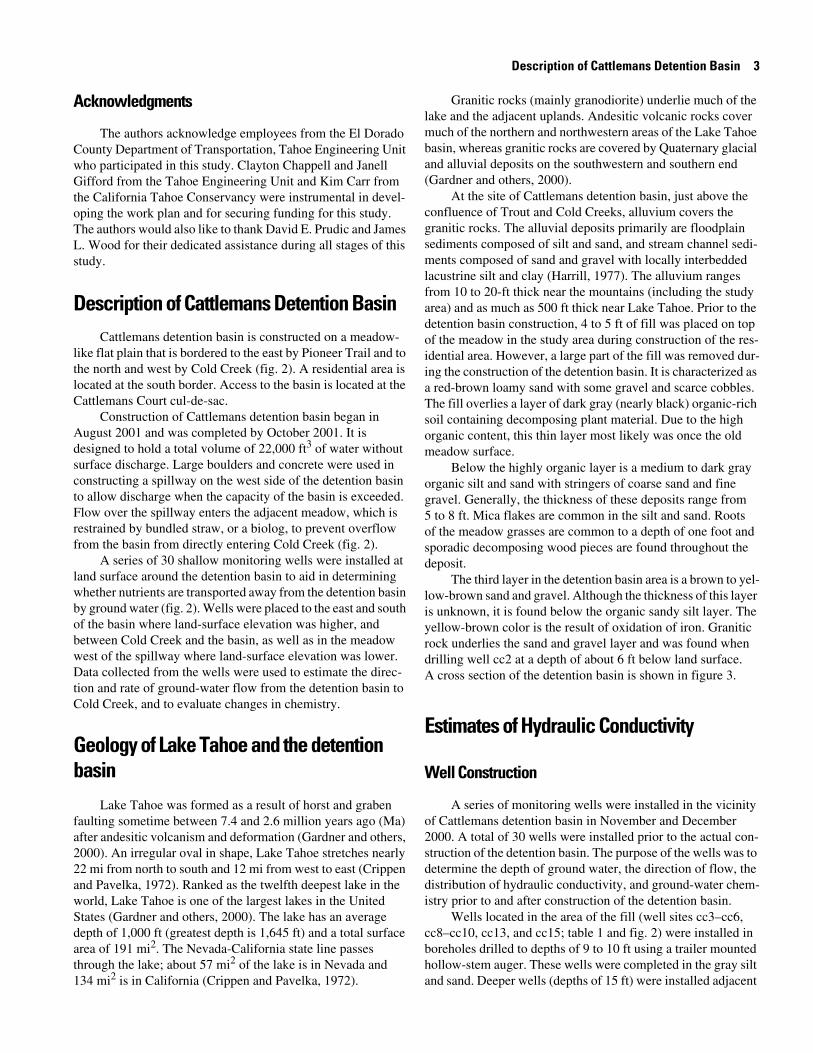
The authors acknowledge employees from the El Dorado County Department of Transportation, Tahoe Engineering Unit who participated in this study. Clayton Chappell and Janell Gifford from the Tahoe Engineering Unit and Kim Carr from the California Tahoe Conservancy were instrumental in devel-oping the work plan and for securing funding for this study. The authors would also like to thank David E. Prudic and James L. Wood for their dedicated assistance during all stages of this study.
Description of Cattlemans Detention BasinCattlemans detention basin is constructed on a meadow-
like flat plain that is bordered to the east by Pioneer Trail and to the north and west by Cold Creek (fig. 2). A residential area is located at the south border. Access to the basin is located at the Cattlemans Court cul-de-sac.
Construction of Cattlemans detention basin began in August 2001 and was completed by October 2001. It is designed to hold a total volume of 22,000 ft3 of water without surface discharge. Large boulders and concrete were used in constructing a spillway on the west side of the detention basin to allow discharge when the capacity of the basin is exceeded. Flow over the spillway enters the adjacent meadow, which is restrained by bundled straw, or a biolog, to prevent overflow from the basin from directly entering Cold Creek (fig. 2).
A series of 30 shallow monitoring wells were installed at land surface around the detention basin to aid in determining whether nutrients are transported away from the detention basin by ground water (fig. 2). Wells were placed to the east and south of the basin where land-surface elevation was higher, and between Cold Creek and the basin, as well as in the meadow west of the spillway where land-surface elevation was lower. Data collected from the wells were used to estimate the direc-tion and rate of ground-water flow from the detention basin to Cold Creek, and to evaluate changes in chemistry.
Geology of Lake Tahoe and the detention basin
Lake Tahoe was formed as a result of horst and graben faulting sometime between 7.4 and 2.6 million years ago (Ma) after andesitic volcanism and deformation (Gardner and others, 2000). An irregular oval in shape, Lake Tahoe stretches nearly 22 mi from north to south and 12 mi from west to east (Crippen and Pavelka, 1972). Ranked as the twelfth deepest lake in the world, Lake Tahoe is one of the largest lakes in the United States (Gardner and others, 2000). The lake has an average depth of 1,000 ft (greatest depth is 1,645 ft) and a total surface area of 191 mi2. The Nevada-California state line passes through the lake; about 57 mi2 of the lake is in Nevada and 134 mi2 is in California (Crippen and Pavelka, 1972).
Granitic rocks (mainly granodiorite) underlie much of the lake and the adjacent uplands. Andesitic volcanic rocks cover much of the northern and northwestern areas of the Lake Tahoe basin, whereas granitic rocks are covered by Quaternary glacial and alluvial deposits on the southwestern and southern end (Gardner and others, 2000).
At the site of Cattlemans detention basin, just above the confluence of Trout and Cold Creeks, alluvium covers the granitic rocks. The alluvial deposits primarily are floodplain sediments composed of silt and sand, and stream channel sedi-ments composed of sand and gravel with locally interbedded lacustrine silt and clay (Harrill, 1977). The alluvium ranges from 10 to 20-ft thick near the mountains (including the study area) and as much as 500 ft thick near Lake Tahoe. Prior to the detention basin construction, 4 to 5 ft of fill was placed on top of the meadow in the study area during construction of the res-idential area. However, a large part of the fill was removed dur-ing the construction of the detention basin. It is characterized as a red-brown loamy sand with some gravel and scarce cobbles. The fill overlies a layer of dark gray (nearly black) organic-rich soil containing decomposing plant material. Due to the high organic content, this thin layer most likely was once the old meadow surface.
Below the highly organic layer is a medium to dark gray organic silt and sand with stringers of coarse sand and fine gravel. Generally, the thickness of these deposits range from 5 to 8 ft. Mica flakes are common in the silt and sand. Roots of the meadow grasses are common to a depth of one foot and sporadic decomposing wood pieces are found throughout the deposit.
The third layer in the detention basin area is a brown to yel-low-brown sand and gravel. Although the thickness of this layer is unknown, it is found below the organic sandy silt layer. The yellow-brown color is the result of oxidation of iron. Granitic rock underlies the sand and gravel layer and was found when drilling well cc2 at a depth of about 6 ft below land surface. A cross section of the detention basin is shown in figure 3.
Estimates of Hydraulic Conductivity
Well Construction
A series of monitoring wells were installed in the vicinity of Cattlemans detention basin in November and December 2000. A total of 30 wells were installed prior to the actual con-struction of the detention basin. The purpose of the wells was to determine the depth of ground water, the direction of flow, the distribution of hydraulic conductivity, and ground-water chem-istry prior to and after construction of the detention basin.
Wells located in the area of the fill (well sites cc3–cc6, cc8–cc10, cc13, and cc15; table 1 and fig. 2) were installed in boreholes drilled to depths of 9 to 10 ft using a trailer mounted hollow-stem auger. These wells were completed in the gray silt and sand. Deeper wells (depths of 15 ft) were installed adjacent

4 Hydraulic Conductivity of Near-Surface Sediments in the Vicinity of Cattlemans Detention Basin, South Lake Tahoe, Calif.
0 50 METERS
0 200 FEET
Detention basin
...............................
.................Cold C
reek
Biolog Diversio
nD
D
D
D
1
2
4
D
3
5
6
7
8
9
1011
12
1314
15
D
1617
18
19
20
21
222324
9
Cat
tlem
ans
Cou
rt
Gate
Roadslope
Pio
neer
Tra
il
NORTH
Shallow monitoring well (D includes an adjacent deep well) Number is abbreviated well identification
Surfacewater level recorder
Surfacewater flow direction
Ground-water level recorder
Stormwater drain
EXPLANATION
Base from Tahoe Engineering Unit, El Dorado County Department of Transportation, Nov 2000
Spillway
Figure 2. Cattlemans detention basin in relation to Cold Creek, Pioneer Trail, and Cattlemans Court, South Lake Tahoe, California. Well identification numbers are abbreviated by omitting the “cc” designation preceding each number.
to the shallow wells at well sites cc3, cc6, cc8, and cc13 (table 1 and fig. 2). Wells located in areas not covered by fill (in the meadow and next to stream) were installed in boreholes augered by hand (cc1–cc2, cc7, cc11–cc12, cc14, and cc16–cc24; table 1 and fig. 2). Most of the wells were instated in boreholes augered to depths of 5 to 7 ft and a diameter of 4.5 in. Depth to ground water during installation ranged from 2 to 5 ft. Deeper wells (depths of 10 to 11 ft) were installed adjacent to the shal-low wells at well sites cc17 and cc19. In this report, a shallow well adjacent to the deeper well at a well site is designated by an S following the well site number (for example; well cc3S,
table 1) and the deeper well is designated by a D following the well site number (for example; well cc3D, table 1). The purpose of the deeper wells was to determine whether ground-water flow or chemistry changed with depth.
All wells, except well cc2 and cc19D, consisted of nominal 2-in. schedule 40 PVC (polyvinyl chloride) pipe. Openings were cut into the pipe from 0.5 and 1.5 ft from the bottom at a width of 0.020 in. to form a screened interval in the well. Stain-less steel rivets were used to secure a cap to the bottom of the pipe. A 5-ft section of flush threaded PVC was added to wells that were deeper than 10 ft. The joint was sealed with a Teflon
Estimates of Hydraulic Conductivity 5
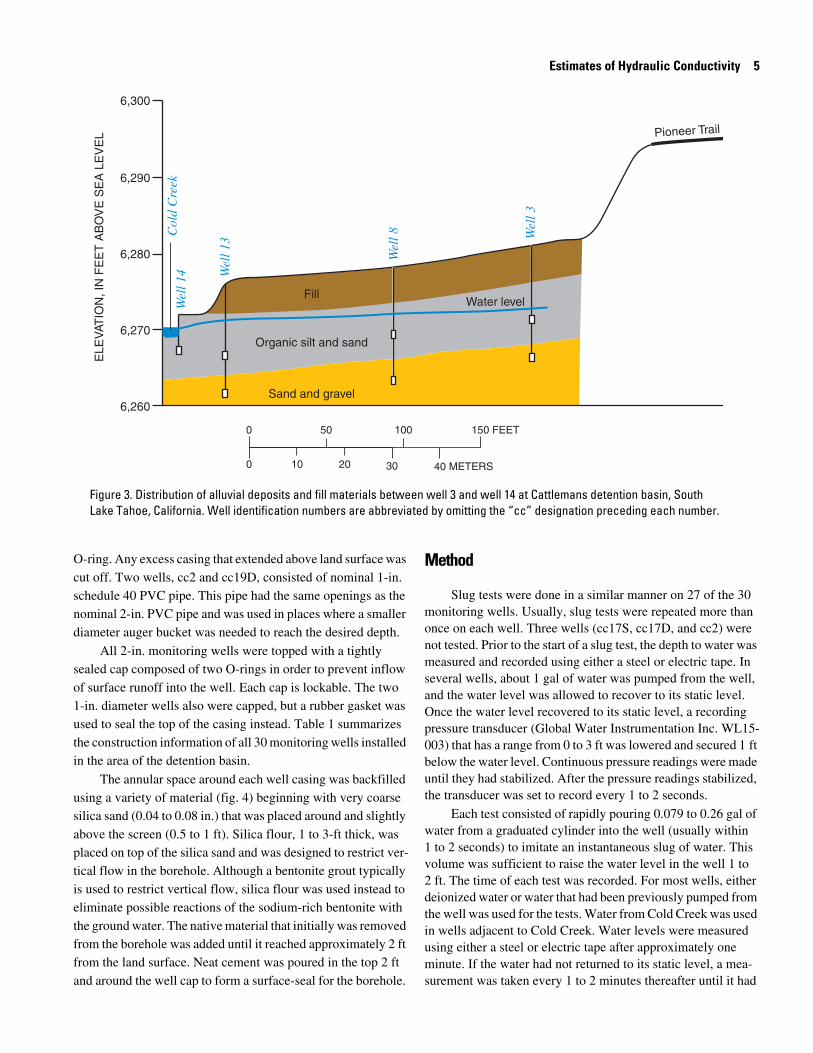
Pioneer Trail
Sand and gravel
Organic silt and sand
Fill
6,290
6,300
6,280
6,270
6,260
Col
d C
reek
Wel
l 13
Wel
l 14
Wel
l 8 Wel
l 3
ELE
VAT
ION
, IN
FE
ET
AB
OV
E S
EA
LE
VE
L
Water level
0 50 100 150 FEET
0 10 20 40 METERS30
Figure 3. Distribution of alluvial deposits and fill materials between well 3 and well 14 at Cattlemans detention basin, South Lake Tahoe, California. Well identification numbers are abbreviated by omitting the “cc” designation preceding each number.
O-ring. Any excess casing that extended above land surface was cut off. Two wells, cc2 and cc19D, consisted of nominal 1-in. schedule 40 PVC pipe. This pipe had the same openings as the nominal 2-in. PVC pipe and was used in places where a smaller diameter auger bucket was needed to reach the desired depth.
All 2-in. monitoring wells were topped with a tightly sealed cap composed of two O-rings in order to prevent inflow of surface runoff into the well. Each cap is lockable. The two 1-in. diameter wells also were capped, but a rubber gasket was used to seal the top of the casing instead. Table 1 summarizes the construction information of all 30 monitoring wells installed in the area of the detention basin.
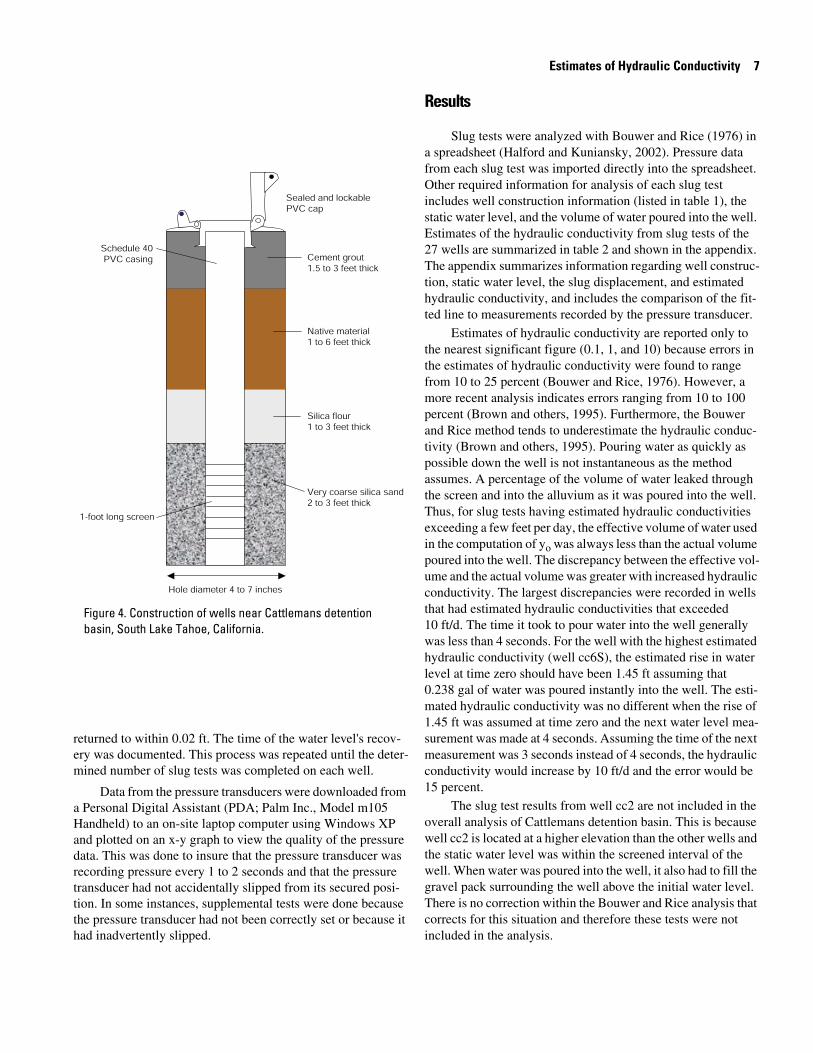
The annular space around each well casing was backfilled using a variety of material (fig. 4) beginning with very coarse silica sand (0.04 to 0.08 in.) that was placed around and slightly above the screen (0.5 to 1 ft). Silica flour, 1 to 3-ft thick, was placed on top of the silica sand and was designed to restrict ver-tical flow in the borehole. Although a bentonite grout typically is used to restrict vertical flow, silica flour was used instead to eliminate possible reactions of the sodium-rich bentonite with the ground water. The native material that initially was removed from the borehole was added until it reached approximately 2 ft from the land surface. Neat cement was poured in the top 2 ft and around the well cap to form a surface-seal for the borehole.
Method
Slug tests were done in a similar manner on 27 of the 30 monitoring wells. Usually, slug tests were repeated more than once on each well. Three wells (cc17S, cc17D, and cc2) were not tested. Prior to the start of a slug test, the depth to water was measured and recorded using either a steel or electric tape. In several wells, about 1 gal of water was pumped from the well, and the water level was allowed to recover to its static level. Once the water level recovered to its static level, a recording pressure transducer (Global Water Instrumentation Inc. WL15-003) that has a range from 0 to 3 ft was lowered and secured 1 ft below the water level. Continuous pressure readings were made until they had stabilized. After the pressure readings stabilized, the transducer was set to record every 1 to 2 seconds.
Each test consisted of rapidly pouring 0.079 to 0.26 gal of water from a graduated cylinder into the well (usually within 1 to 2 seconds) to imitate an instantaneous slug of water. This volume was sufficient to raise the water level in the well 1 to 2 ft. The time of each test was recorded. For most wells, either deionized water or water that had been previously pumped from the well was used for the tests. Water from Cold Creek was used in wells adjacent to Cold Creek. Water levels were measured using either a steel or electric tape after approximately one minute. If the water had not returned to its static level, a mea-surement was taken every 1 to 2 minutes thereafter until it had

Table 1. Well name, land-surface elevation, and construction data for 30 monitor-ing wells in vicinity of Cattlemans detention basin, South Lake Tahoe, California
Well name
Standardidentification
number
Land- surfaceelevation
1Land-surface elevation referenced to pin set by El Dorado County Department of Transportation at end of Cattlemans Court cul-de-sac. Elevation referenced to NAVD of 1988.
1
(feet)
cc1cc2cc3Scc3Dcc4
385432119574001385432119574002385432119574301385432119574302385433119574201
6278.846281.576281.236281.216279.12
5.66.8
10.215.110.2
4.15.38.7
13.68.7
5.16.39.7
14.69.7
cc5cc6Scc6Dcc7cc8S
385433119574202385433119574301385433119574302385433119574203385432119574303
6278.036277.376277.406273.296278.13
10.29.0
15.05.09.2
8.77.5
13.53.57.7
9.78.5
14.54.58.7
cc8Dcc9cc10cc11cc12
385432119574304385432119574305385433119574303385434119574401385434119574402
6278.156279.306276.396272.836272.64
15.09.9
10.25.65.1
13.58.48.74.13.6
14.59.49.74.64.6
cc13Scc13Dcc14cc15cc16
385433119574401385433119574402385433119574403385432119574401385433119574404
6275.146275.696272.606278.336273.47
10.215.25.5
10.27.2
8.713.74.08.75.7
9.714.75.09.76.7
cc17Scc17Dcc18cc19Scc19D
385433119574501385433119574502385433119574503385433119574504385433119574505
6272.716272.826271.936272.196272.11
6.710.65.15.6
10.0
5.29.13.64.18.5
6.210.14.65.19.5
cc20cc21cc22cc23cc24
385432119574501385432119574601385433119574701385433119574702385432119574701
6272.776272.196271.946271.086271.97
7.25.05.65.45.5
5.73.54.13.94.0
6.74.55.14.95.0
6 Hydraulic Conductivity of Near-Surface Sediments in the Vicinity of Cattlemans Detention Basin, South Lake Tahoe, Calif.
Depth(feet below land surface)
Bottom of well
Screened interval
Top Bottom
Estimates of Hydraulic Conductivity 7
returned to within 0.02 ft. The time of the water level's recov-ery was documented. This process was repeated until the deter-mined number of slug tests was completed on each well.
Data from the pressure transducers were downloaded from a Personal Digital Assistant (PDA; Palm Inc., Model m105 Handheld) to an on-site laptop computer using Windows XP and plotted on an x-y graph to view the quality of the pressure data. This was done to insure that the pressure transducer was recording pressure every 1 to 2 seconds and that the pressure transducer had not accidentally slipped from its secured posi-tion. In some instances, supplemental tests were done because the pressure transducer had not been correctly set or because it had inadvertently slipped.
Results
Slug tests were analyzed with Bouwer and Rice (1976) in a spreadsheet (Halford and Kuniansky, 2002). Pressure data from each slug test was imported directly into the spreadsheet. Other required information for analysis of each slug test includes well construction information (listed in table 1), the static water level, and the volume of water poured into the well. Estimates of the hydraulic conductivity from slug tests of the 27 wells are summarized in table 2 and shown in the appendix. The appendix summarizes information regarding well construc-tion, static water level, the slug displacement, and estimated hydraulic conductivity, and includes the comparison of the fit-ted line to measurements recorded by the pressure transducer.
Estimates of hydraulic conductivity are reported only to the nearest significant figure (0.1, 1, and 10) because errors in the estimates of hydraulic conductivity were found to range from 10 to 25 percent (Bouwer and Rice, 1976). However, a more recent analysis indicates errors ranging from 10 to 100 percent (Brown and others, 1995). Furthermore, the Bouwer and Rice method tends to underestimate the hydraulic conduc-tivity (Brown and others, 1995). Pouring water as quickly as possible down the well is not instantaneous as the method assumes. A percentage of the volume of water leaked through the screen and into the alluvium as it was poured into the well. Thus, for slug tests having estimated hydraulic conductivities exceeding a few feet per day, the effective volume of water used in the computation of yo was always less than the actual volume poured into the well. The discrepancy between the effective vol-ume and the actual volume was greater with increased hydraulic conductivity. The largest discrepancies were recorded in wells that had estimated hydraulic conductivities that exceeded 10 ft/d. The time it took to pour water into the well generally was less than 4 seconds. For the well with the highest estimated hydraulic conductivity (well cc6S), the estimated rise in water level at time zero should have been 1.45 ft assuming that 0.238 gal of water was poured instantly into the well. The esti-mated hydraulic conductivity was no different when the rise of 1.45 ft was assumed at time zero and the next water level mea-surement was made at 4 seconds. Assuming the time of the next measurement was 3 seconds instead of 4 seconds, the hydraulic conductivity would increase by 10 ft/d and the error would be 15 percent.
The slug test results from well cc2 are not included in the overall analysis of Cattlemans detention basin. This is because well cc2 is located at a higher elevation than the other wells and the static water level was within the screened interval of the well. When water was poured into the well, it also had to fill the gravel pack surrounding the well above the initial water level. There is no correction within the Bouwer and Rice analysis that corrects for this situation and therefore these tests were not included in the analysis.
Figure 4. Construction of wells near Cattlemans detention basin, South Lake Tahoe, California.
Sealed and lockablePVC cap
1-foot long screen
Schedule 40PVC casing
Hole diameter 4 to 7 inches
Cement grout1.5 to 3 feet thick
Native material1 to 6 feet thick
Silica flour1 to 3 feet thick
Very coarse silica sand2 to 3 feet thick

Table 2. Results of slug tests in wells near Cattlemans detention basin, South Lake Tahoe, California
Well name
Dateof
test
Initial water levelelevation
1 Land-surface elevation referenced to pin set by El Dorado County Department of Transportation at end of Cattlemans Court cul-de-sac. Elevation referenced to NAVD of 1988.
1
(feet)
cc1cc3Scc3Dcc4cc5
11/06/0311/06/0311/06/0311/06/0311/06/03
6275.856272.436272.456273.476272.33
1.571.451.221.211.19
12
101020
23333
cc6Scc6Dcc7cc8Scc8D
11/06/0311/06/0311/06/0305/27/0305/27/03
6271.56271.536271.686274.446274.32
1.021.051.131.281.02
7030101020
43323
cc9 06/10/03 10/30/03
6272.95 6271.68
0.89 40 3
cc10cc11cc12cc13Scc13D
06/09/0310/30/0306/10/0305/27/0305/27/03
6272.056270.466271.726272.346271.81
0.951.080.960.931.11
302
202010
36353
cc14cc15cc16cc18
05/27/0310/30/0306/10/0311/06/03
6270.916271.126271.826269.52
0.881.041.081.29
20105
40
3533
cc19S 11/06/03 06/24/03
6269.54 6270.26
1.2 1 1 1
cc19Dcc20cc21cc22cc23cc24
06/24/0306/10/0306/10/0306/10/0311/06/0306/10/03
6270.196271.116270.536269.996268.696269.58
1.640.930.931.131.410.93
0.52010402010
211431
8 Hydraulic Conductivity of Near-Surface Sediments in the Vicinity of Cattlemans Detention Basin, South Lake Tahoe, Calif.
Averagedisplacement2
(feet)
2 Wells tested only once include exact displacement.
Estimatedhydraulic
conductivity(feet per day)
Number of
slug tests

Estimates of Hydraulic Conductivity 9
DiscussionThe estimated hydraulic conductivities of the alluvium
near Cattlemans detention basin range from 0.5 to 70 ft/d (fig. 5). The distribution is slightly skewed with the majority of estimated hydraulic conductivities ranging from 1 to 20 ft/d (fig. 6). There were six estimates that exceeded 20 ft/d and only one estimate that was less than 1 ft/d. The mean (average) value of hydraulic conductivity is 17.8 ft/d, whereas the median value is 10 ft/d. The 25th percentile is at 10 ft/d and the 75th percentile is at 20 ft/d indicating that at least half of all estimates range from 10 to 20 ft/d. The estimates of hydraulic conductivity from
these slug tests are consistent for alluvial deposits that are a silty to clean sand (Freeze and Cherry, 1979) and are thus consistent with the texture of the alluvial deposits that were found when the monitoring wells were augered.
No significant conclusions can be drawn between esti-mated hydraulic conductivities between the shallow and deeper wells due to a lack of sufficient estimates in the deeper wells. With only five estimates of hydraulic conductivity of the deeper sand and gravel, there is not enough evidence to support differ-ences in the hydraulic conductivities between the shallow meadow deposits and the deeper sand and gravel.
0 50 METERS
0 200 FEET
...............................
.................
Cold C
reek
Biolog Diversio
nD
D
D
D
1
2
4
D
3
5
6
7
8
9
1011
12
1314
15
D
1617
18
19
20
21
222324
23
Cat
tlem
ans
Cou
rtGate
Roadslope
Pio
neer
Tra
il
NORTH
Shallow monitoring well (D includes an adjacent deep well)— Black number is abbreviated well identification; Red number is hydraulic conductivity in feet per day
Surfacewater level recorder
Surfacewater flow direction
Ground-water level recorder
Stormwater drain
EXPLANATION
Base from Tahoe Engineering Unit, El Dorado County Department of Transportation, Nov 2000
20
1
2
1020
70
7
10
40
30
202
2020
10
5
40
1
2010
4020
10
Detention basin
Spillway
Figure 5. Distribution of hydraulic conductivity near Cattlemans detention basin, South Lake Tahoe, California. Well identification numbers are abbreviated by omitting the “cc” designation preceding each number.

10 Hydraulic Conductivity of Near-Surface Sediments in the Vicinity of Cattlemans Detention Basin, South Lake Tahoe, Calif.
3
2
9 9
4
0
1
2
3
4
5
6
7
8
9
10
0.3 - 1 >1 - 3 >3 - 10 >10 - 30 >30 - 100
OC
CU
RR
EN
CE
S
HYDRAULIC CONDUCTIVITY, IN FEET PER DAY
Average = 18 feet per dayMedian = 10 feet per dayStandard deviation = 16 feet per day1-percecentile = 0.63 feet per day25-percecentile = 10 feet per day75-percecentile = 20 feet per day99-percecentile = 62 feet per day
Figure 6. Range of hydraulic conductivity in all tested wells near Cattlemans detention basin, South Lake Tahoe, California.
Summary and Conclusions
Cattlemans detention basin project is a five-year study that began in November 2000 in cooperation with the El Dorado County Department of Transportation, Tahoe Engineering Unit and the California Tahoe Conservancy. The purpose of this study is to determine if the installation of Cattlemans detention basin reduces nutrients and sediments in surface flow before entering Lake Tahoe. Estimating hydraulic conductivity of the alluvium near Cattlemans detention basin is important in evalu-ating the subsurface transport of nutrients from the detention basin to nearby Cold Creek. The purpose of this report is to describe the techniques and methods used to estimate the hydraulic conductivity of the alluvium and to present the results of the analysis.
A total of 30 shallow monitoring wells were installed in the vicinity of the detention basin, ranging in depth from 5 to 15 ft, to assess the direction and rate of ground-water flow. Hydraulic conductivity was estimated by testing 27 wells (22 in the shal-low meadow deposits and 5 in the deeper sand and gravel). Esti-mates of hydraulic conductivity were determined using the Bouwer and Rice analysis of slug tests. The response of the slug
test was recorded every 1 to 2 seconds using a recording pres-sure transducer, which had a range from 0 to 3 ft, after 0.079 to 0.26 gal of water was rapidly poured down each well.
Hydraulic conductivities of the alluvium ranged from 0.5 to 70 ft/d, with more than half between 10 and 20 ft/d. The range in hydraulic conductivity is consistent with the sandy tex-ture of the alluvial deposits. Estimates of hydraulic conductivity were reported only to the nearest significant figure because a percentage of the water poured into the well leaked through the screen and into the alluvium as it was poured into the well. This caused a discrepancy between measured water-level displace-ment and that which was estimated from the volume of water poured into the well. For the well with the highest estimated hydraulic conductivity (well cc6S), the estimated rise in water level at time zero should have been 1.45 ft assuming that 0.238 gal of water was poured instantly into the well. The estimated hydraulic conductivity was no different when the rise of 1.45 ft was assumed at time zero and the next water level measurement was in 4 seconds. Assuming the time of the next measurement was 3 seconds instead of 4 seconds, the hydraulic conductivity increased by 10 ft/d and the error would be 15 percent.
References Cited 11
References Cited
Bouwer, Herman, and Rice, R.C., 1976, A slug test for deter-mining hydraulic conductivity of unconfined aquifers with completely or partially penetrating wells: Water Resources Research, v. 12, no. 3, p. 423-428.
Brown, D.L., Narasimhan, T.N., and Demir, Z., 1995, An eval-uation of the Bouwer and Rice method of slug test analy-sis: Water Resources Research, v. 31, no. 5, p. 1239-1246.
Crippen, J.R. and Pavelka, B.R., 1970, The Lake Tahoe Basin, California-Nevada: U.S. Geological Survey Water-Supply Paper 1972, 56 p.
Freeze, R.A., and Cherry, J.A., 1979, Groundwater: Englewood Cliffs, N.J., Prentice-Hall, 604 p.
Gardner, J.V., Mayer, L.A., and Hughs Clarke, J.E., 2000, Mor-phology and process in Lake Tahoe, California-Nevada: Geological Society of America Bulletin, v. 112, no. 5, p. 736-746.
Halford, K.J., and Kuniansky, E.L., 2002, Spreadsheets for the analysis of aquifer-test and slug-test data, version 1.1: U.S. Geological Survey Open-File Report 02-197, 51 p. (avail-able on the World Wide Web at http://water.usgs.gov/pubs/of/ofr02197).
Harrill, J.R., 1977, Hydrologic Map, South Lake Tahoe Folio: Reno, Nevada, Nevada Bureau of Mines and Geology Environmental Series, Lake Tahoe Area, map no. 2Af, 1 sheet.

12 Hydraulic Conductivity of Near-Surface Sediments in the Vicinity of Cattlemans Detention Basin, South Lake Tahoe, Calif.