Hydraulic and structural considerations of dam’s spillway ...
17
Structural Monitoring and Maintenance, Vol. 6, No. 1 (2019) 1-17 DOI: https:// doi.org/10.12989/smm.2019.6.1.001 1 Copyright © 2019 Techno-Press, Ltd. http://www.techno-press.org/?journal=smm&subpage=7 ISSN: 2288-6605 (Print), 2288-6613 (Online) Hydraulic and structural considerations of dam’s spillway - a case study of Karkheh Dam, Andimeshk, Iran Iman Faridmehr 1 , Mohammad Javadi Jokar 2 , Mohammadreza Yazdanipour 2 and Ali Kolahchi 2 1 South Ural State University, 454080 Chelyabinsk, Lenin Prospect 76, Russian Federation, Russia 2 Production Operation Company of Karkheh Dam Hydropower Plant, Andimeshk, Khuzestan, Iran (Received December 15, 2018, Revised February 20, 2019, Accepted February 22, 2019) Abstract. Preserving reservoir safety has recognized to be important for the public where a vast majority of dams are located upstream of greatly populated cities and industrialized areas. Buckling, floatation and cavitation have caused failure in the spillway gates and conveyance features during past catastrophic events; showed their vulnerability and need for regular inspection along with reviewing design calculations to ensure the spillway meet current design standards. This paper investigates the hydraulic and structural consideration of dam's spillway by evaluating the data of Karkheh Dam's. Discharge capacity, flood routings and cavitation damage risk were main features for hydraulic considerations where hydrostatic and hydrodynamic forces and stability conditions were considered in structural considerations. Keywords: spillway radial gate; hydrodynamic forces; hydrostatic forces; westergaard's theory 1. Introduction Karkheh Reservoir Dam is located in Iran, 25 km west of Andimeshk city, Fig 1. Karkheh River is the third largest river in Iran after Karun and Dez rivers. It is located in middle and southwestern Zagros mountain and after 900 km, with a mean width of 120 m, leads to the boundary marshes in Khuzestan province (Hawizeh Marshes). The river basin has an area of 50,000 km 2 (3% of the country's total area). The annual rainfall in this area is between 200 to 800 mm. The significance of a reliable and safe spillway cannot be ignored; many casualties of dams have been caused by poor designed and/or constructed spillways or insufficient discharge capacity of spillways (Bieri et al. 2010, Huynh et al. 2017, Li et al. 2010, Yu et al. 2018). Sufficient discharge capacity is of supreme importance for embankment dams, which are likely to collapse if overtopped (considering erosion resistant capacity of the foundation), whereas concrete dams can resist overtopping in some extent (Chen and Chen 2015, Hanson et al. 2005, Heydari et al. 2014, Nagarajaiah and Erazo 2016). Karkheh dam spillway has six outlet openings, 15 m width, and a height of 209 m above sea level constructed mainly for flood control with an output of maximum discharge 18700 m 3 / s, Fig. 2. In order to control the flow of each spillway, a radial gate (18250 Corresponding author, Dr., E-mail: [email protected]
Transcript of Hydraulic and structural considerations of dam’s spillway ...

Structural Monitoring and Maintenance, Vol. 6, No. 1 (2019) 1-17
DOI: https:// doi.org/10.12989/smm.2019.6.1.001 1
Copyright © 2019 Techno-Press, Ltd. http://www.techno-press.org/?journal=smm&subpage=7 ISSN: 2288-6605 (Print), 2288-6613 (Online)
Hydraulic and structural considerations of dam’s spillway - a case study of Karkheh Dam, Andimeshk, Iran
Iman Faridmehr1, Mohammad Javadi Jokar2,
Mohammadreza Yazdanipour2 and Ali Kolahchi2
1South Ural State University, 454080 Chelyabinsk, Lenin Prospect 76, Russian Federation, Russia
2Production Operation Company of Karkheh Dam Hydropower Plant, Andimeshk, Khuzestan, Iran
(Received December 15, 2018, Revised February 20, 2019, Accepted February 22, 2019)
Abstract. Preserving reservoir safety has recognized to be important for the public where a vast majority of dams are located upstream of greatly populated cities and industrialized areas. Buckling, floatation and cavitation have caused failure in the spillway gates and conveyance features during past catastrophic events; showed their vulnerability and need for regular inspection along with reviewing design calculations to ensure the spillway meet current design standards. This paper investigates the hydraulic and structural consideration of dam's spillway by evaluating the data of Karkheh Dam's. Discharge capacity, flood routings and cavitation damage risk were main features for hydraulic considerations where hydrostatic and hydrodynamic forces and stability conditions were considered in structural considerations.
Keywords: spillway radial gate; hydrodynamic forces; hydrostatic forces; westergaard's theory
1. Introduction
Karkheh Reservoir Dam is located in Iran, 25 km west of Andimeshk city, Fig 1. Karkheh
River is the third largest river in Iran after Karun and Dez rivers. It is located in middle and
southwestern Zagros mountain and after 900 km, with a mean width of 120 m, leads to the
boundary marshes in Khuzestan province (Hawizeh Marshes). The river basin has an area of
50,000 km2 (3% of the country's total area). The annual rainfall in this area is between 200 to 800
mm.
The significance of a reliable and safe spillway cannot be ignored; many casualties of dams
have been caused by poor designed and/or constructed spillways or insufficient discharge capacity
of spillways (Bieri et al. 2010, Huynh et al. 2017, Li et al. 2010, Yu et al. 2018). Sufficient
discharge capacity is of supreme importance for embankment dams, which are likely to collapse if
overtopped (considering erosion resistant capacity of the foundation), whereas concrete dams can
resist overtopping in some extent (Chen and Chen 2015, Hanson et al. 2005, Heydari et al. 2014,
Nagarajaiah and Erazo 2016). Karkheh dam spillway has six outlet openings, 15 m width, and a
height of 209 m above sea level constructed mainly for flood control with an output of maximum
discharge 18700 m3 / s, Fig. 2. In order to control the flow of each spillway, a radial gate (18250
Corresponding author, Dr., E-mail: [email protected]

Iman Faridmehr, Mohammad Javadi Jokar, Mohammadreza Yazdanipour and Ali Kolahchi
mm × 14900 mm) is considered which is driven by a hydraulic lift system consisting of a pair of
hydraulic jacks with a total capacity of 272 tons (capacity of 136 tons each).
A spillway radial gate is composed of a skin plate connected by trusses to a trunnion or pinned
joint that can be rotated about the trunnion to adjust water flow through hydraulic structures as
shown in Fig. 3. In general, the main components of Karkheh Dam's radial gate are divided into
the following sections:
A) Skin Plate: The shell of the spillway, which consider to be the main structure of the
spillway, consisting in a total of nine units and each piece is reinforced horizontally
and vertically by horizontal girders and stiffeners.
B) Rubber Seal: The rubber seals fitted to the valve shaft (J) (for sealing the valve) and
Flat (for sealing the bottom of the valve) on the valve shell.
C) Side Wheel: The lateral wheel of the radial gates, eight number for each radial gates
(four on each side of the gate), maintaining and protecting the side of the radial gate
from excessive compression during maneuvering and operation.
D) Trunnion Beam: is a fixed support unit that has the task of transferring forces on the
radial gates and arms to the side walls. Its containment system consists of pre-stressed
cable which are generally designed to curb the trunnion beam.
E) Strut: The column or arm of the radial gate that has the shell's supporting function.
Servomotor: A lift system that is mounted on the sides of the gate and connected to the bottom of
the unit by the respective arm (Link rod) and simultaneously working up and down the gate during
operation, service or possible repair of the gates.
Fig. 1 Karkheh Dam, Andimeshk, Iran
2

Hydraulic and structural considerations of dam’s spillway - a case study of Karkheh Dam…
Fig. 2 Spillway’s radial gates, Karkheh Dam
Fig. 3 Primary radial gate components, Karkheh Dam
This article investigates hydraulic and structural considerations of dam’s spillway by evaluating
the data of Karkheh Dam in Iran. To this end, at first general design aspect of spillway explained
briefly through providing design flowchart. Afterward, discharge capacity, flood routings and
cavitation damage risk were discussed and analyzed as main parameters in hydraulic consideration.
Applied loading and stability conditions also investigated in structural consideration part.
3
Iman Faridmehr, Mohammad Javadi Jokar, Mohammadreza Yazdanipour and Ali Kolahchi
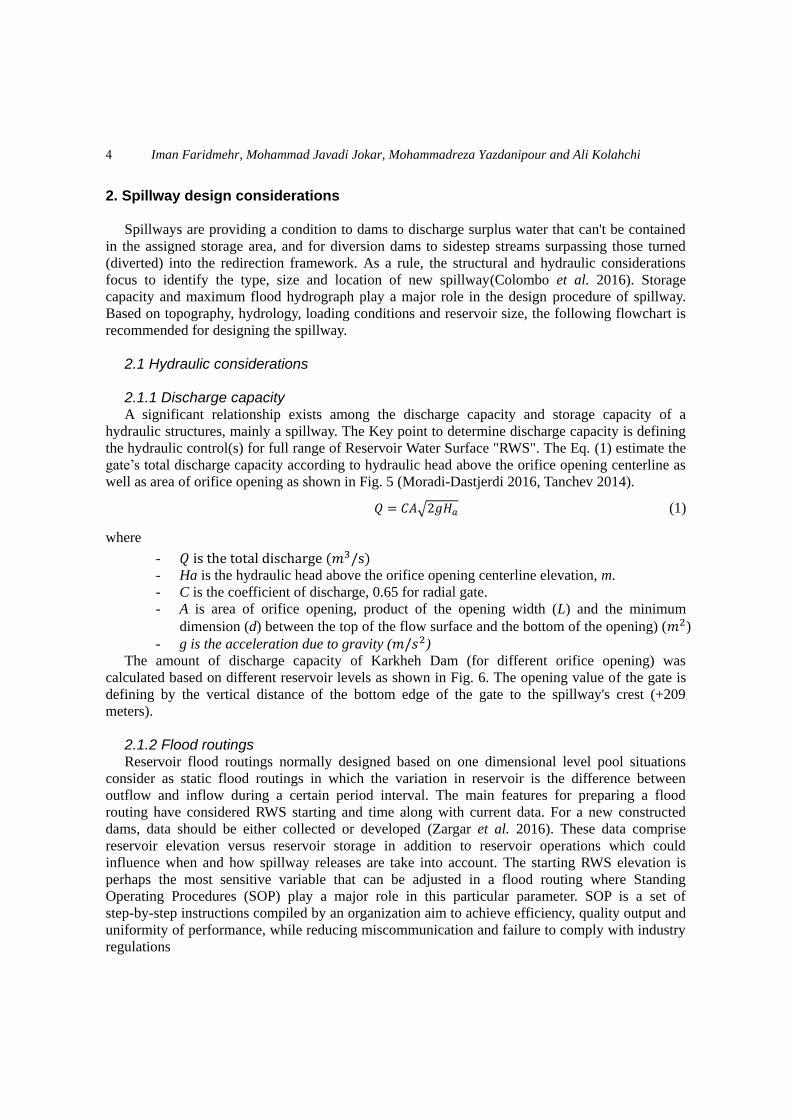
2. Spillway design considerations
Spillways are providing a condition to dams to discharge surplus water that can't be contained
in the assigned storage area, and for diversion dams to sidestep streams surpassing those turned
(diverted) into the redirection framework. As a rule, the structural and hydraulic considerations
focus to identify the type, size and location of new spillway(Colombo et al. 2016). Storage
capacity and maximum flood hydrograph play a major role in the design procedure of spillway.
Based on topography, hydrology, loading conditions and reservoir size, the following flowchart is
recommended for designing the spillway.
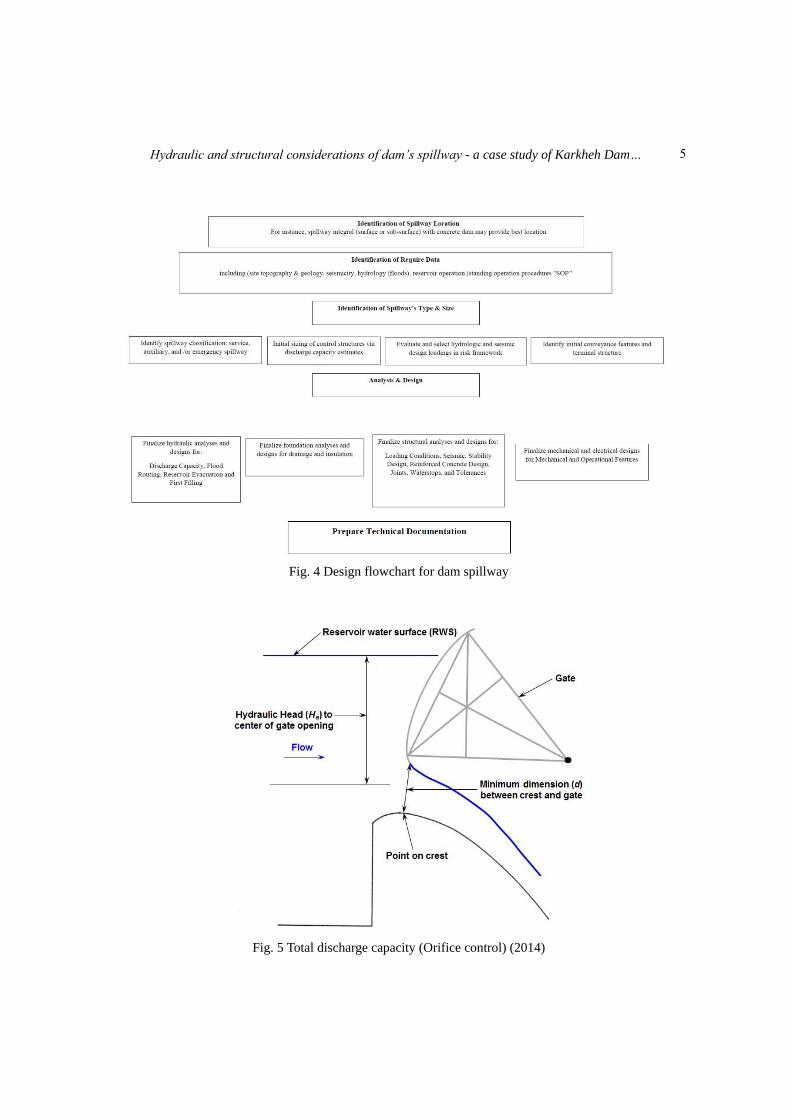
2.1 Hydraulic considerations 2.1.1 Discharge capacity A significant relationship exists among the discharge capacity and storage capacity of a
hydraulic structures, mainly a spillway. The Key point to determine discharge capacity is defining
the hydraulic control(s) for full range of Reservoir Water Surface "RWS". The Eq. (1) estimate the
gate’s total discharge capacity according to hydraulic head above the orifice opening centerline as
well as area of orifice opening as shown in Fig. 5 (Moradi-Dastjerdi 2016, Tanchev 2014).
𝑄 = 𝐶𝐴√2𝑔𝐻𝑎 (1)
where
- 𝑄 is the total discharge (𝑚3/s) - Ha is the hydraulic head above the orifice opening centerline elevation, m.
- C is the coefficient of discharge, 0.65 for radial gate.
- A is area of orifice opening, product of the opening width (L) and the minimum
dimension (d) between the top of the flow surface and the bottom of the opening) (𝑚2)
- g is the acceleration due to gravity (𝑚/𝑠2) The amount of discharge capacity of Karkheh Dam (for different orifice opening) was
calculated based on different reservoir levels as shown in Fig. 6. The opening value of the gate is
defining by the vertical distance of the bottom edge of the gate to the spillway's crest (+209
meters).
2.1.2 Flood routings Reservoir flood routings normally designed based on one dimensional level pool situations
consider as static flood routings in which the variation in reservoir is the difference between
outflow and inflow during a certain period interval. The main features for preparing a flood
routing have considered RWS starting and time along with current data. For a new constructed
dams, data should be either collected or developed (Zargar et al. 2016). These data comprise
reservoir elevation versus reservoir storage in addition to reservoir operations which could
influence when and how spillway releases are take into account. The starting RWS elevation is
perhaps the most sensitive variable that can be adjusted in a flood routing where Standing
Operating Procedures (SOP) play a major role in this particular parameter. SOP is a set of
step-by-step instructions compiled by an organization aim to achieve efficiency, quality output and
uniformity of performance, while reducing miscommunication and failure to comply with industry
regulations
4
Hydraulic and structural considerations of dam’s spillway - a case study of Karkheh Dam…
Fig. 4 Design flowchart for dam spillway
Fig. 5 Total discharge capacity (Orifice control) (2014)
5

Iman Faridmehr, Mohammad Javadi Jokar, Mohammadreza Yazdanipour and Ali Kolahchi
Fig. 6 Karkheh dam’s spillway total discharge capacity
Fig. 7 Karkheh Dam’s flood hydrograph
6

Hydraulic and structural considerations of dam’s spillway - a case study of Karkheh Dam…
Karkheh dam spillway is designed for safe discharge at Probable Maximum Flood (P.M.F) and
with proper hydraulic head. Based on the results of hydrological surveys and flood analysis, the
maximum instantaneous flood discharge with a return period of 10,000 years is estimated to be
18,600 𝑚3/𝑠. The water level at the start of the flood is equal to the normal level in the reservoir
(220 meters). Up to reaching the maximum level of flood control (226 meters), the output from the
dam is limited to 1000 𝑚3/𝑠. The 226-meter level is sufficient to control the floods up to the
25-year return period, and thus the flood control volume in the reservoir between level of 220 to
226m would be equivalent to 1057 million 𝑚3. The design flood hydrograph of Karkheh Dam
with different return periods considering the effect of upstream dams is presented in Fig. 7.
2.1.3 Conveyance feature The conveyance structures (such as a conduit, chute, or tunnel) generally situated directly
downstream of the dams is more likely to be subject to severe loading conditions (such as huge
flows with high velocities) that might possibly result to failure of these hydraulic structures that
eventually lead to uncontrolled release of the reservoir. Cavitation potential is among main
hydraulic considerations that should be evaluated carefully to avoid such drawbacks.
In a hydraulic structure, the cavitation phenomenon will occur whenever the local pressure in
flowing water drops below the vapour pressure and bubbles or cavities form locally in the body of
flow. Once the cavitation bubbles go with stream to a location with greater local pressure, they get
collapse. Once the cavitation bubbles collapse adjacent to a solid boundary, an enormously high
pressure is produced that acts on a tiny surface at very short period of time [9]. Accordingly, a hole
will appear in the surface so called a cavitation pitting. Examples of cavitation damage in dam
spillways have been well documented (Falvey 1990, Kumcu 2017, Xu et al. 2015). Evaluation of
cavitation potential is based on estimating the cavitation index (σ), which is a function of pressure
and velocity (Falvey 1990, Song et al. 2015).
𝜎 =𝑝−𝑝𝑣𝛾𝜔𝑉2
2
(2)
p is the pressure at the flow surface (atmospheric pressure plus hydrostatic pressure (𝑁
𝑚𝑚2) )
pv is the vapour pressure of water, which is temperature function
𝛾𝜔 is the density of water (1000𝑘𝑔
𝑚3)
V is the average flow velocity (m/sec)
Generally, five different levels have been considered for cavitation damage risk to a spillway
surface. These levels are presented based on the flow velocity and flow cavitation index as shown
in Table 1.
In Karkheh Dam, considering the flow velocities in the spillway's chute along with calculation
of the cavitation index at different discharges, the design of the aeration system was considered for
spillway's chute as the most appropriate solution. A spillway aeration scheme comprises of two
key components; bottom device with a surface discontinuity at which the air is entrained by the
water flow and an air supply system as shown in Fig. 8.
7

Iman Faridmehr, Mohammad Javadi Jokar, Mohammadreza Yazdanipour and Ali Kolahchi
Table 1 Cavitation damage index (Sreedhar et al. 2017)
Level Cavitation Damage Risk Flow Velocity (m/s) Cavitation Index
1 No cavitation damage 5 𝜎
2 Possible cavitation
damage
5 6 45 𝜎
3 Cavitation damage 6 25 25 𝜎 45
4 Serious damage 25 4 7 𝜎 25
5 Major damage 4 7 𝜎
Fig. 8 A typical spillway aerator (Volkart and Rutschmann 2018)
The dimension of the inlet duct defines the head loss in the flow. Generally, the required design
parameters for spillway aeration system are including: the air demand from the aerator; the air
concentration on the floor downstream of the aerator; the difference between the atmosphere and
air pressure beneath the nappe; and the water jet length (De Michele et al. 2005, Rutschmann and
Hager 1990)
8
Hydraulic and structural considerations of dam’s spillway - a case study of Karkheh Dam…
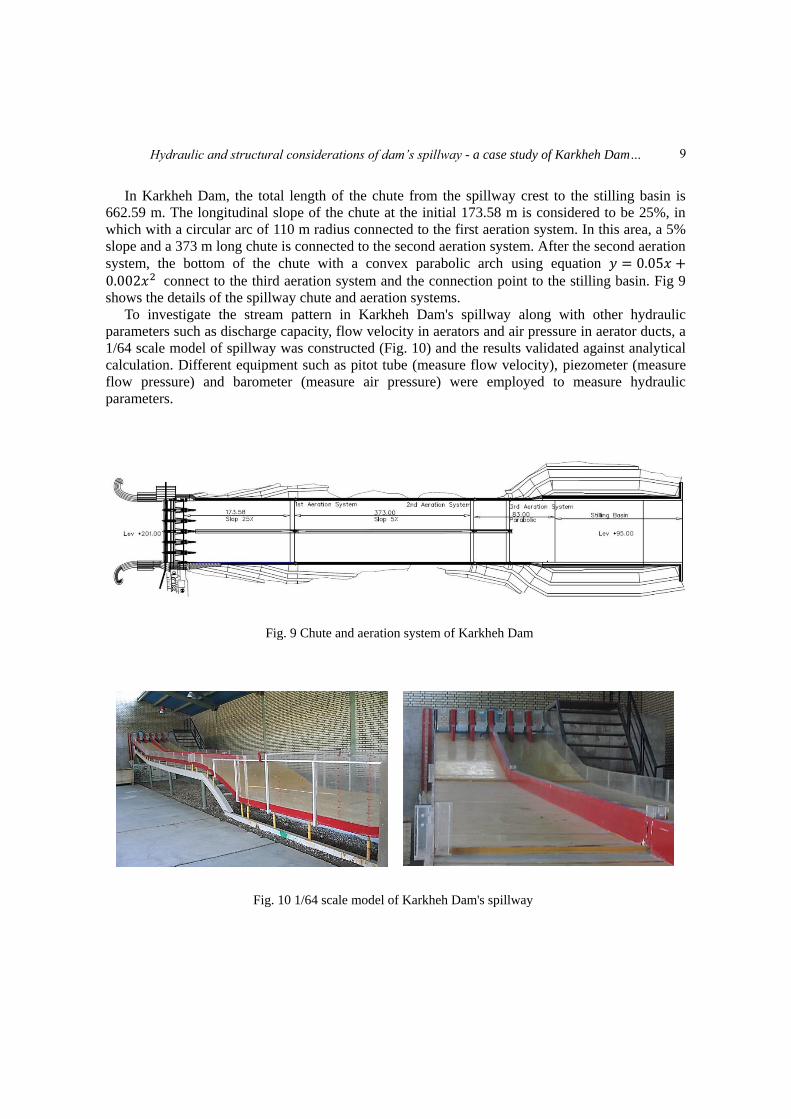
In Karkheh Dam, the total length of the chute from the spillway crest to the stilling basin is
662.59 m. The longitudinal slope of the chute at the initial 173.58 m is considered to be 25%, in
which with a circular arc of 110 m radius connected to the first aeration system. In this area, a 5%
slope and a 373 m long chute is connected to the second aeration system. After the second aeration
system, the bottom of the chute with a convex parabolic arch using equation 𝑦 = 5𝑥 + 2𝑥2 connect to the third aeration system and the connection point to the stilling basin. Fig 9
shows the details of the spillway chute and aeration systems.
To investigate the stream pattern in Karkheh Dam's spillway along with other hydraulic
parameters such as discharge capacity, flow velocity in aerators and air pressure in aerator ducts, a
1/64 scale model of spillway was constructed (Fig. 10) and the results validated against analytical
calculation. Different equipment such as pitot tube (measure flow velocity), piezometer (measure
flow pressure) and barometer (measure air pressure) were employed to measure hydraulic
parameters.
Fig. 9 Chute and aeration system of Karkheh Dam
Fig. 10 1/64 scale model of Karkheh Dam's spillway
9
Iman Faridmehr, Mohammad Javadi Jokar, Mohammadreza Yazdanipour and Ali Kolahchi
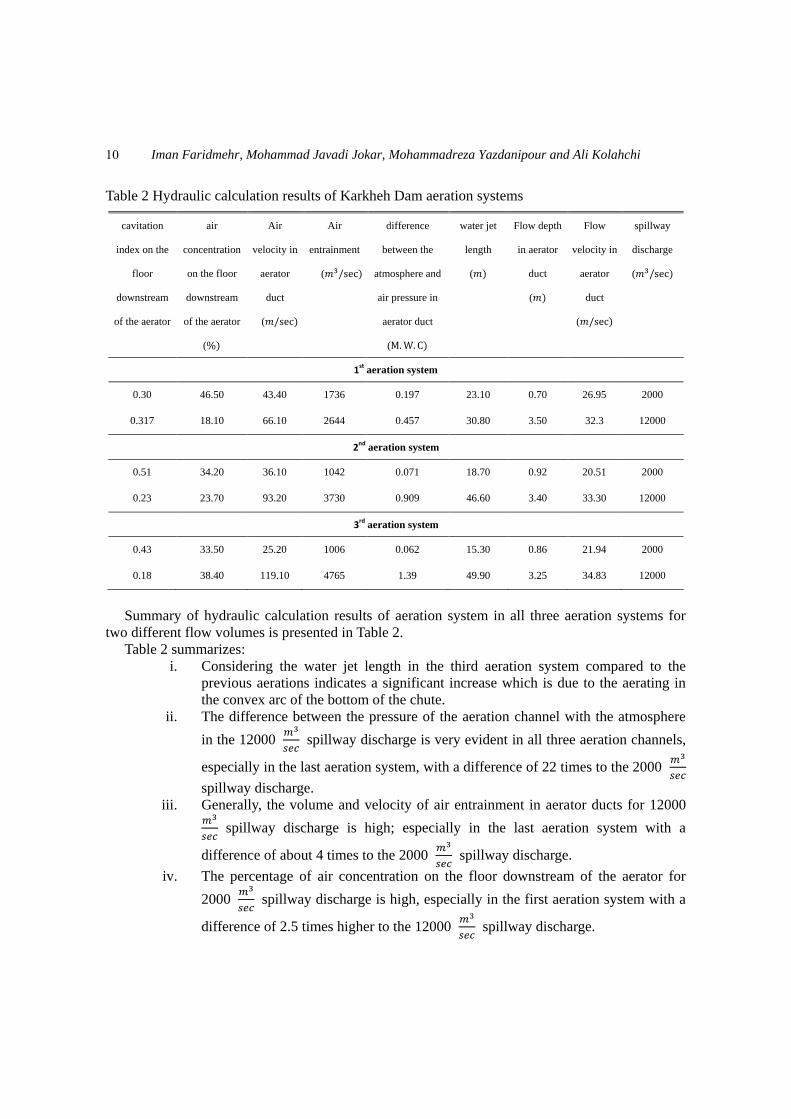
Table 2 Hydraulic calculation results of Karkheh Dam aeration systems
Summary of hydraulic calculation results of aeration system in all three aeration systems for
two different flow volumes is presented in Table 2.
Table 2 summarizes:
i. Considering the water jet length in the third aeration system compared to the
previous aerations indicates a significant increase which is due to the aerating in
the convex arc of the bottom of the chute.
ii. The difference between the pressure of the aeration channel with the atmosphere
in the 12000 𝑚3
𝑠𝑒𝑐 spillway discharge is very evident in all three aeration channels,
especially in the last aeration system, with a difference of 22 times to the 2000 𝑚3
𝑠𝑒𝑐
spillway discharge.
iii. Generally, the volume and velocity of air entrainment in aerator ducts for 12000 𝑚3
𝑠𝑒𝑐 spillway discharge is high; especially in the last aeration system with a
difference of about 4 times to the 2000 𝑚3
𝑠𝑒𝑐 spillway discharge.
iv. The percentage of air concentration on the floor downstream of the aerator for
2000 𝑚3
𝑠𝑒𝑐 spillway discharge is high, especially in the first aeration system with a
difference of 2.5 times higher to the 12000 𝑚3
𝑠𝑒𝑐 spillway discharge.
cavitation
index on the
floor
downstream
of the aerator
air
concentration
on the floor
downstream
of the aerator
( )
Air
velocity in
aerator
duct
(𝑚/sec )
Air
entrainment
(𝑚3/sec )
difference
between the
atmosphere and
air pressure in
aerator duct
( )
water jet
length
(𝑚)
Flow depth
in aerator
duct
(𝑚)
Flow
velocity in
aerator
duct
(𝑚/sec )
spillway
discharge
(𝑚3/sec )
1st
aeration system
0.30 46.50 43.40 1736 0.197 23.10 0.70 26.95 2000
0.317 18.10 66.10 2644 0.457 30.80 3.50 32.3 12000
2nd
aeration system
0.51 34.20 36.10 1042 0.071 18.70 0.92 20.51 2000
0.23 23.70 93.20 3730 0.909 46.60 3.40 33.30 12000
3rd
aeration system
0.43 33.50 25.20 1006 0.062 15.30 0.86 21.94 2000
0.18 38.40 119.10 4765 1.39 49.90 3.25 34.83 12000
10
Hydraulic and structural considerations of dam’s spillway - a case study of Karkheh Dam…
v. The cavitation index for 12000 𝑚3
𝑠𝑒𝑐 spillway discharge is critical, especially in the
last aeration system.
2.2 Structural consideration 2.2.1 Applied load on spillway's radial gate The value and conditions of applied forces on the radial gate is an important issue which plays
a major role in the design and evaluation of these structures. Unfortunately, it is difficult to
determine their value and location precisely due to their specific nature. Therefore, designers
should make an engineering judgment to predict accurately based on recognized resources and
engineering experiences. Generally, the following forces apply to spillway's radial gates
i. Gravity forces (the structural dead load) and hydrostatic force
ii. The hydrodynamic forces applied on radial gates as result of earthquake, wind, severe
flood etc.
Dead load is calculated based on the weight of the materials used in the construction of the gate
and its related components. In cases in which gates have been smeared in sludge or sediment
during operation, the weight of this sediment is added to the weight of the gate. Hydrostatic forces
are static forces as result of upstream water applied to radial gate. The quantity of hydrostatic loads
applied on radial gate can be varied due to the rise or fall of the upstream during flood or low
rainfall months. The radial gate is constructed with a curve shape; therefore, hydrostatic forces are
divided in two vertical and horizontal components. The horizontal component can be calculated as
follows (Chadwick et al. 2013)
𝑇𝐻 =1
2 𝛾𝜔𝐻𝑢
2𝑊 (3)
where,
𝐻𝑢 = 𝑖𝑔𝑡 𝑜𝑓 𝑟𝑎𝑑𝑖𝑎𝑙 𝑔𝑎𝑡𝑒
𝑊 = 𝑤𝑖𝑑𝑡 𝑜𝑓 𝑟𝑎𝑑𝑖𝑎𝑙 𝑔𝑎𝑡𝑒
The vertical component includes the water mass weight which is located under or above the
gate’s body. It produces either upward or downward forces that pass through the gravity centre of
the radial gate although is generally as small as 20 percent of vertical component. The result of the
applied forces due to horizontal and vertical loading is calculated through the following formula
𝑇𝑅 = √𝑇𝐻2 + 𝑇𝑉
2 (𝐾𝑁) (4)
Also, the angle of the resultant force with the horizontal is calculated from the following formula
𝛼 = 𝑡𝑎𝑛−1(𝑇𝑉
𝑇𝐻) (5)
Hydrodynamic forces are generally formed as result of strong wave hits to radial gates during
extreme loading conditions i.e., a severe flood or earthquake. During an earthquake, if the gate is
fully sunk, the distribution of the hydrodynamic forces is calculated by Westergaard’s Theory.
These hydrodynamic forces are added to hydrostatic forces. By Westergaard’s Theory it is possible
to estimate the hydrodynamic forces in every section’s radial gate’s height (Davey and Ho 2007).
𝐹ℎ𝑑 = 583 𝛾𝜔𝑎𝑐𝐻𝑢√𝐻𝐻𝑢 (6)
11
Iman Faridmehr, Mohammad Javadi Jokar, Mohammadreza Yazdanipour and Ali Kolahchi
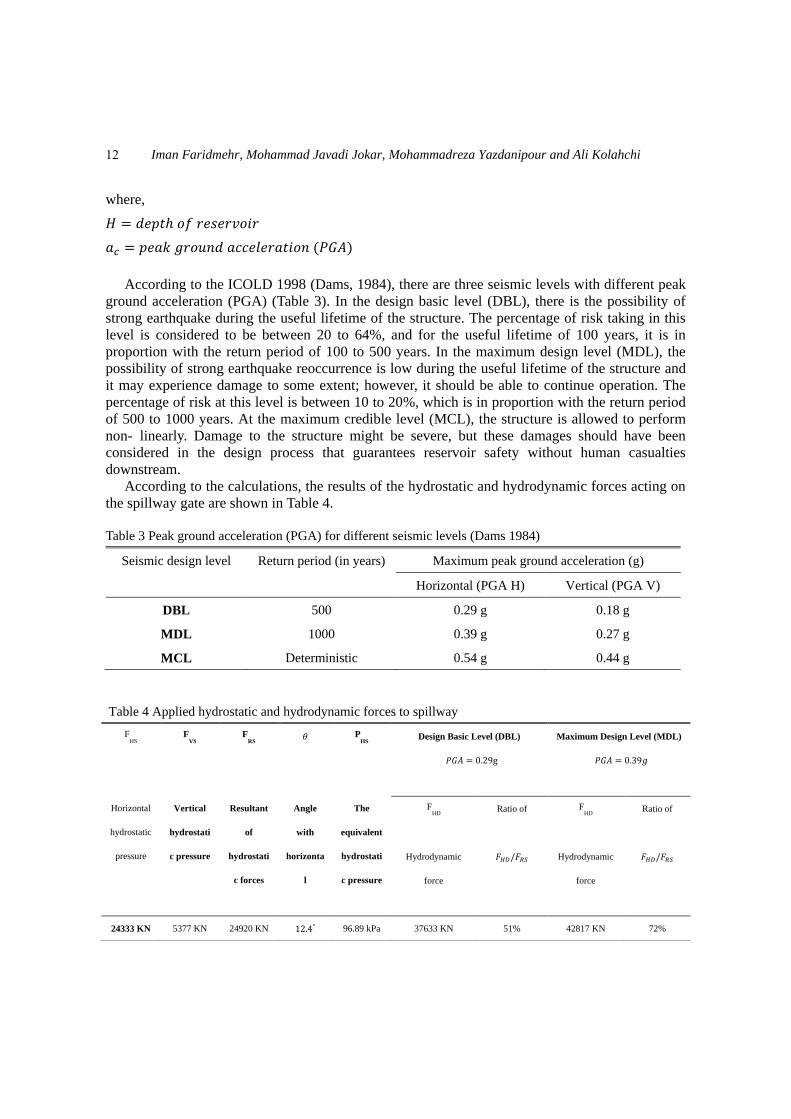
where,
𝐻 = 𝑑𝑒𝑝𝑡 𝑜𝑓 𝑟𝑒𝑠𝑒𝑟𝑣𝑜𝑖𝑟
𝑎𝑐 = 𝑝𝑒𝑎𝑘 𝑔𝑟𝑜𝑢𝑛𝑑 𝑎𝑐𝑐𝑒𝑙𝑒𝑟𝑎𝑡𝑖𝑜𝑛 (𝑃𝐺𝐴)
According to the ICOLD 1998 (Dams, 1984), there are three seismic levels with different peak
ground acceleration (PGA) (Table 3). In the design basic level (DBL), there is the possibility of
strong earthquake during the useful lifetime of the structure. The percentage of risk taking in this
level is considered to be between 20 to 64%, and for the useful lifetime of 100 years, it is in
proportion with the return period of 100 to 500 years. In the maximum design level (MDL), the
possibility of strong earthquake reoccurrence is low during the useful lifetime of the structure and
it may experience damage to some extent; however, it should be able to continue operation. The
percentage of risk at this level is between 10 to 20%, which is in proportion with the return period
of 500 to 1000 years. At the maximum credible level (MCL), the structure is allowed to perform
non- linearly. Damage to the structure might be severe, but these damages should have been
considered in the design process that guarantees reservoir safety without human casualties
downstream.
According to the calculations, the results of the hydrostatic and hydrodynamic forces acting on
the spillway gate are shown in Table 4.
Table 3 Peak ground acceleration (PGA) for different seismic levels (Dams 1984)
Seismic design level Return period (in years) Maximum peak ground acceleration (g)
Horizontal (PGA H) Vertical (PGA V)
DBL 500 0.29 g 0.18 g
MDL 1000 0.39 g 0.27 g
MCL Deterministic 0.54 g 0.44 g
Table 4 Applied hydrostatic and hydrodynamic forces to spillway
FHS
Horizontal
hydrostatic
pressure
FVS
Vertical
hydrostati
c pressure
FRS
Resultant
of
hydrostati
c forces
Angle
with
horizonta
l
PHS
The
equivalent
hydrostati
c pressure
Design Basic Level (DBL)
𝑃𝐺𝐴 = 29g
Maximum Design Level (MDL)
𝑃𝐺𝐴 = 39𝑔
FHD
Hydrodynamic
force
𝐹𝐻 /𝐹𝑅
Ratio of
FHD
Hydrodynamic
force
𝐹𝐻 /𝐹𝑅
Ratio of
24333 KN 5377 KN 24920 KN 2 4 96.89 kPa 37633 KN 51% 42817 KN 72%
12

Hydraulic and structural considerations of dam’s spillway - a case study of Karkheh Dam…
2.2.2 Stability conditions The following foundation and structural stability conditions must be evaluated during the
analysis and/or design of a spillway.
Overturning displacement (failure): happens when a structural component (such as piers)
experience rotation. Spillway features usually consider for overturning displacement including
piers, chutes structures with cantilever and inlets. In case the resultant of all applied forces acting
on the structures falls inside the 1/3 of the base of the structures, satisfactory safety against
overturning occurs. The overturning safety factor calculated from the following equation.
𝑆𝐹overturning =∑𝑀𝑟𝑒𝑠𝑖𝑠𝑡𝑖𝑛𝑔
∑𝑀𝑜𝑣𝑒𝑟𝑡𝑢𝑟𝑛𝑖𝑛𝑔 (7)
Bearing capacity displacement (failure): happens when the bearing pressure of the spillway
components (specifically terminal structures and chutes) surpasses the ultimate bearing capacity
(shear strength) associated with its foundation (rock or soil). The bearing safety factor calculated
from the following equation.
𝑆𝐹bearing =𝑃𝑎𝑙𝑙𝑜𝑤𝑎𝑏𝑙𝑒
𝑃𝑐𝑎𝑙𝑐𝑢𝑙𝑎𝑡𝑒𝑑 (8)
Considering Karkheh’s spillway geometry, the overturning displacement mainly related to the
piers and side walls. The piers that separate the spans of the spillway threshold have an elliptic
shape, 4.00 m thick, which extend approximately 6.25 m upstream. The width and length of the
Karkheh’s spillway piers are 4 and 59 meters, respectively which are circular with a circular arc of
10 meters in order to reduce the flow of scour and local drop in the upstream section. The road
bridge makes the connection between the spillway and the road along the full extent of the dam.
The design of the intermediate piers of the Karkheh Dam spillway was based on the "Allowable
Stress Design" recommended by American Concrete Institute "ACI" where SAP90 computer
program was used for analysis purpose at the time of construction.
The Karkheh’s spillway was constructed in the area where the soil mainly made up of weak to
moderate conglomerates, with an overall permeability of about 2 ~6 × −2 𝑐𝑚 / 𝑠. Load bearing capacities of Conglomera and Lignang are considered to be 8 ~ 2 𝑡 / 𝑚2
depending on the structure of the spillway. Investigations and analyzes of the Karkheh Dam
stilling basin at the time of construction showed that the pressure level at the normal state of
reservoir is 150 meters above the sea level. Therefore, an Uplift around 6 𝑡
𝑚2 could applied to
the stilling basin. This amount of uplift was not allowed and the stability of the stilling basin's slab
was in serious problem. Therefore, for the stability analysis of the stilling basin's slab various
options were considered, which ultimately the weighted system + subterranean drainage network
was considered. Generally, when the spillway does not work, the normal reservoir water surface is
between the approximate size of at least 111m and a maximum of 115m. Accordingly, the stability
of the stilling basin is satisfying through its weight and controlled. The stability of the bottom slab
of the stilling basin is not a serious problem for overturning and slipping, and only floatation
requires stability control. Considering the thickness of the slab of the stilling basin, which is
estimated at 7m, the weight of the water on the slab and the level of uplift below the slab; the
safety factors in different scenarios of downstream levels is around 2. Table 5 present the
minimum safety factors along with the relevant design equations for two different loading
combinations.
13

Iman Faridmehr, Mohammad Javadi Jokar, Mohammadreza Yazdanipour and Ali Kolahchi
Table 5 Safety factors of Hydraulic features of Karkheh Dam spillway
Note that the extreme loading scenario stand for DBL earthquake.
2.2.3 Joints Waterstops Classifying and putting joints for concrete spillways are highly important design considerations.
An appropriate detailing of stream surface would mitigate the growth of adverse hydraulic features
including cavitation or stagnation pressure. Joints related to the spillway comprise: contraction
joints (CrJ), construction joints (CJ) and control joints (CtJ). With some exceptions, above
mentioned joints are parallel and oriented perpendicular to the spillway centerline vertical (wall
joints) and (floor or slab joints).
There are similarities among the control and contraction joints in which both are un-bonded
surfaces separating adjacent concrete placements. Separation of nearby structures or concrete
placements is used to release tensile stresses along with cracking crated by shrinkage.
Reinforcement is not continuous through contraction joints to preclude moment transformation
although water stops are considered for flow surface. The spacing and location of CJ define by the
physical characteristics of the spillway, concrete placement methods, temperature study results,
and the maximum concrete placing volume. Generally, for longitudinal joints, CtJs are vertical and
distributed from the top of the concrete placement to the foundation. Conduit, transverse floor, and
tunnel CtJs are normal (90 degrees) to the slope of the flow surface and to the centerline of the
spillway. The slabs are also separated by construction joints. The Construction Joints are
chemically bonded surfaces or planes produced by placing fresh concrete against surfaces of clean
hardened concrete. Reinforcement is continuous throughout CJs, and keys and water stops are
rarely used. The spacing and location of the CJs are define by the concrete forming requirements,
anticipated concrete placement capacity, and necessities for next stage concrete construction. The
chute's slab of the Karkheh Dam is designed to prevent the wear of the floor given the high
velocity of water. It has 1-meter thickness; reinforced with upper 20x20 slab using 25 mm bars.
This slab directly sits on a drilled stone where it connects to the stone using anchorage system
along with 32 mm bars in each 2-meter direction. The slab is constructed in the form of panels
using 8-meters in size, which are separated by contraction joints, as shown in Fig. 11.
Stability
conditions
Spillway
feature
Load combinations
and equivalent
safety factors
Computed
safety factors
Concrete & soil design feature
Overturning piers Usual =1.5 3.15 𝑎𝑙𝑙𝑜𝑤𝑎 𝑙𝑒 𝑓𝑙𝑒𝑥𝑢𝑟𝑎𝑙 𝑐𝑜𝑚𝑝𝑟𝑒𝑠𝑠𝑖𝑣𝑒 𝑠𝑡𝑟𝑒𝑠𝑠
= 45 𝑓 𝑐
𝑎𝑙𝑙𝑜𝑤𝑎 𝑙𝑒 fle ural 𝑡𝑒𝑛𝑠𝑖𝑙𝑒 𝑠𝑡𝑟𝑒𝑠𝑠 = 42 √𝑓 𝑐
𝑎𝑙𝑙𝑜𝑤𝑎 𝑙𝑒 shear 𝑠𝑡𝑟𝑒𝑠𝑠 = 33 √𝑓 𝑐
Extreme =1.15 2.47
Side walls Usual =1.5 3.02
Extreme =1.15 2.35
Bearing capacity Stilling basin Usual =2 2.75 𝑠𝑒𝑎𝑟 𝑠𝑡𝑟𝑒𝑛𝑔𝑡 𝑜𝑓 𝑠𝑜𝑖𝑙 = 𝑐 + 𝜎 ta
Extreme =1.5 2.05
14

Hydraulic and structural considerations of dam’s spillway - a case study of Karkheh Dam…
(a)
(b)
Fig. 11 Construction of Karkheh spillway's chute using anchorage system (a), considering contraction joints
to separating adjacent reinforcement concrete placements (b)
3. Conclusions
This paper reviewed the most important hydraulic and structural features of dam's spillway by
considering Karkheh Dam's spillway. The following conclusions were drawn:
1- A significant relationship exists among the spillway's discharge capacity and Reservoir
Water Surface "RWS";
2- The design flood hydrograph calculated based on RWS at the start of the flood and
hydrological surveys of flood routings;
3- To avoid cavitation phenomenon in spillway chutes the aeration system would be an
alternative option for high velocity flows. The air demand from the aerator, the air
15

Iman Faridmehr, Mohammad Javadi Jokar, Mohammadreza Yazdanipour and Ali Kolahchi
concentration on the floor downstream of the aerator, the difference between the
atmosphere and air pressure beneath the nappe, and the water jet length should be consider
during design process of aeration system;
4- Spillway's radial gates are subjected to the structural dead loads, hydrostatic forces and
hydrodynamic forces. Hydrodynamic forces are generally formed as result of strong wave
hits to radial gates during extreme loading conditions i.e., a severe flood or earthquake.
During an earthquake, if the gate is fully sunk, the distribution of the hydrodynamic forces
is calculated by Westergaard’s Theory;
5- Overturning displacement and bearing capacity displacement must be evaluated during the
analysis and/or design process of spillway features such as piers, side walls and terminal
structures (stilling basin);
6- There are three main joints used in spillway features introduced as: contraction joints,
construction joints and control joints. These joints are parallel and oriented perpendicular
to the spillway centerline vertical (wall joints) and (floor or slab joints).
References
Appurtenant Structures for Dams (Spillways and Outlet Works) Design Standard. B. o. R. U.S. Department
of the Interior. (2014).
Bieri, M. et al. (2010), "“Spillway discharge capacity upgrade at Gloriettes dam”, Int. J. Hydropower Dams,
17, 88-93.
Chadwick, A. et al. (2013), Hydraulics in civil and environmental engineering, Crc Press.
Chen, S.H. et al. (2015), Hydraulic structures, Springer.
Colombo, M. et al. (2016), “Existing concrete dams: loads definition and finite element models validation”,
Struct.Monit.Maint., 3(2), 129-144.
Dams, I.C.O. L. (1984), World register of dams, International Commission on Large Dams.
Davey, R. and Ho, K.V. (2007), “Seismic assessment and remediation of the aviemore dam spillway and
sluice gates”.
De Michele, C. et al. (2005), “Bivariate statistical approach to check adequacy of dam spillway”, J. Hydrol.
Eng., 10(1), 50-57.
Falvey, H.T. (1990), Cavitation in chutes and spillways, US Department of the Interior, Bureau of
Reclamation.
Hanson, G. et al. (2005), “Physical modeling of overtopping erosion and breach formation of cohesive
embankments”, Transactions of the ASAE, 48(5), 1783-1794.
Heydari, M.M. et al. (2014), “Exact solution for transverse bending analysis of embedded laminated Mindlin
plate”, Struct. Eng. Mech., 49(5), 661-672.
Huynh, T.C. et al. (2017), “Advances and challenges in impedance-based structural health monitoring”,
Struct. Monit. Maint., 4(4), 301-329.
Kumcu, S.Y. (2017), “Investigation of flow over spillway modeling and comparison between experimental
data and CFD analysis”, KSCE J. Civil Eng., 21(3), 994-1003.
Li, S. et al. (2010), “Numerical modeling of probable maximum flood flowing through a system of
spillways”, KSCE, J. Hydraul. Eng., 137(1), 66-74.
Moradi-Dastjerdi, R. (2016), “Wave propagation in functionally graded composite cylinders reinforced by
aggregated carbon nanotube”, Struct. Eng. Mech., 57(3), 441-456.
Nagarajaiah, S, et al. (2016), “Structural monitoring and identification of civil infrastructure in the United
States”, Struct.Monit. Maint., 3(1), 51-69.
Rutschmann, P. et al. (1990), “Air entrainment by spillway aerators”, J, Hydraulic Eng,, 116(6), 765-782.
16

Hydraulic and structural considerations of dam’s spillway - a case study of Karkheh Dam…
Song, D. et al. (2015), “Numerical simulation of pressure relief in hard coal seam by water jet cutting”,
Geomech. Eng., 8(4), 495-510.
Sreedhar, B. et al. (2017), “Cavitation damage: Theory and measurements–A review”, Wear, 372, 177-196.
Tanchev, L. (2014), Dams and appurtenant hydraulic structures, CRC Press.
Volkart, P. et al. (2018), Aerators on spillways. Air Entrainment in Free-surface Flow, Routledge: 85-113.
Xu, W. et al. (2015), “Experimental study on pressure and aeration characteristics in stepped chute flows”,
Science China Technological Sciences, 58(4), 720-726.
Yu, H. et al. (2018), “Damage detection of subway tunnel lining through statistical pattern recognition”,
Struct.Monit. Maint., 5(2), 231-242.
Zargar, M. et al. (2016), “Optimization of gated spillways operation for flood risk management in
multi-reservoir systems”, Nat. Hazards, 82(1), 299-320.
JK
17